university of pretoria etd –kitching, j (2005)
TRANSCRIPT
THE MEASUREMENT OUTCOME EQUIVALENCE OF THE CAREER PATH
APPRECIATION (CPA) FOR EMPLOYEES FROM DIVERSE CULTURAL
BACKGROUNDS
by
JOLANDA KITCHING
Article submitted as partial fulfillment of the requirements
for the degree
MAGISTER COMMERCII
in the
FACULTY OF ECONOMIC AND BUSINESS SCIENCE
(DEPARTMENT HUMAN RESOURCE MANAGEMENT)
at the
UNIVERSITY OF PRETORIA
PRETORIA OCTOBER 2004
Supervisor: Prof J.S. Basson
UUnniivveerrssiittyy ooff PPrreettoorriiaa eettdd ––KKiittcchhiinngg,, JJ ((22000055))

ii
I, Jolanda Kitching, declare that “The measurement outcome equivalence of
the career path appreciation (CPA) for employees from diverse cultural
backgrounds” is my own work. All the resources I used for this study are cited
and referred to in the reference list by means of a comprehensive referencing
system.
I declare that the content of this thesis/article has never before been used for any
qualification at any tertiary institute.
-------------------------- -----------------------
Jolanda Kitching Date
UUnniivveerrssiittyy ooff PPrreettoorriiaa eettdd ––KKiittcchhiinngg,, JJ ((22000055))

iii
ABSTRACT
The aim of this study is to determine whether or not the Career Path Appreciation
(CPA) is cultural unbiased. The use of assessment instruments in South Africa
has been criticised, because it is said that they are largely based on the values
and knowledge of overseas instruments, which are considered to be less valid for
South Africa’s various cultural groups. In this study, an Asian, black, coloured
and white group were included to determine the cultural equivalence of the CPAs
measurement outcomes. The results indicate that the CPA measurement
outcomes are not biased and are, therefore, equivalent for groups of diverse
cultural backgrounds.
OPSOMMING
Die doel van die studie was om te bepaal of the Career Path Appreciation (CPA)
sydig is ten opsigte van versillende kulture. Die mees algemene kritiek teen die
gebruik van psigometriese instrumente in Suid-Afrika is dat dit grootliks gebaseer
is op en aangepas is uit Westerse instrumente wat tot gevolg het dat hierdie
instrumente minder geldig meet vir ander kultuurgroepe in Suid Afrika. In hierdie
studie is asiër, kleurling, afrika en blanke groepe gebruik in die bepaling van die
kulturele gelykwaardigheid van die CPA uitkomste. Die resultate toon dat die
CPA nie diskrimineer ten opsigte van Afrika kulture nie.
UUnniivveerrssiittyy ooff PPrreettoorriiaa eettdd ––KKiittcchhiinngg,, JJ ((22000055))

iv
Acknowledgements
In completion of this study, I would like to express my gratitude to the following
individuals:
• Prof JS Basson for his help and patience.
• Jackie Grimbeek for his help with the statistics.
• Lisa Ashton for providing the data and insight into the CPA.
• My husband for believing in me.
UUnniivveerrssiittyy ooff PPrreettoorriiaa eettdd ––KKiittcchhiinngg,, JJ ((22000055))

v
Table of contents Page
Chapter 1 Justification of the study
1.1 Introduction 1
1.2 Problem statement 4
1.3 Study objective 4
Chapter 2 Theoretical background
2.1 Introduction 6
2.2 Description of the Career Path Appreciation (CPA) 11
2.3 The rationale of the Career Path Appreciation (CPA) 12
2.3.1 The Stratified Systems Theory (SST) 13
2.3.2 The Matrix of Working Relationships
Model (MOW) 15
2.4 The uses of the Career Path Appreciation (CPA) 17
2.5 Research conducted on the Career Path
Appreciation (CPA) 19
2.5.1 Reliability 19
2.5.2 Construct reliability 20
2.5.3 Concurrent validity 20
2.5.4 Predictive validity 21
2.5.5 Lack of bias 21
2.6 Bias-free instruments within the South African
context 22
2.6.1 Bias 22
2.6.2 Specifications for bias-free measuring
Instruments 24
2.7 Conclusion 28
UUnniivveerrssiittyy ooff PPrreettoorriiaa eettdd ––KKiittcchhiinngg,, JJ ((22000055))
vi
Chapter 3 Method of investigation
3.1 Sample 30
3.2 Measuring instrument 30
3.3 Procedures 32
3.4 Statistical analysis 32
Chapter 4 The article
Abstract 33
Introduction 34
Background 34
Method 39
Sample 39
Measuring instrument 41
Procedures 44
Statistical analysis 44
Results 45
Conclusion 50
References 52
List of Tables
Table 2.1: Levels of work 16
Table 1: Biographical information of respondents 40
Table 2: Decision making styles 43
Table 3a: ANOVA results of assessment scores
compared between age categories 45
Table 3b: ANOVA results of assessment scores
compared between population groups 45
UUnniivveerrssiittyy ooff PPrreettoorriiaa eettdd ––KKiittcchhiinngg,, JJ ((22000055))

vii
Table 3c: ANOVA results of assessment scores
compared between gender categories 46
Table 3d: ANOVA results of assessment scores
compared between occupation level 46
Table 3e: ANOVA results of assessment scores
compared between education level 47
Table 3f: ANOVA results of assessment scores
compared between population groups
and gender 47
Table 4: Results of ANOVA comparing occupation
level, gender, population groups and
interactions thereof by using current level of
capability, mode and style 48
Table 5a: Correlation matrix of variables 49
Table 5b: Correlation matrix of variables 49
List of figures
Figure 1: The growth curve 42
Bibliography 57
UUnniivveerrssiittyy ooff PPrreettoorriiaa eettdd ––KKiittcchhiinngg,, JJ ((22000055))

1
CHAPTER 1
JUSTIFICATION OF THE STUDY
1.1 Introduction
Given the situation in South Africa, where many people have no or limited
education, a lack of skills and insufficient working experience, it is important to
determine an individual's performance capability. It is also important to evaluate
an individual’s potential. Setting career paths, and knowing an individual's current
and future potential and capabilities is thus extremely important in today’s
challenging work environment.
People represent a significant short-term and long-term investment for
organisations around the world. The accurate evaluation and selection of
employees is thus imperative, because it leads to considerable financial savings
on the part of the organisation, dignity for the individuals concerned and overall
organisational effectiveness (Stamp, 1988). If an organisation is to meet these
new challenges, it needs an accurate picture of the current state of its human
resources and the rate at which these human resources are likely to grow.
In the mid-1970s, Gillian Stamp embarked on the development of an approach
that could be used in the assessment of judgment in action. The outcome of this
research was an assessment tool called Career Path Appreciation (hereinafter
referred to as CPA) (Jaques, 1978). CPA offers the individual the opportunity to
review his or her working life, and the organisation the opportunity to review the
effectiveness of its human resources and appropriate time frames for the
development of these human resources.
Organisations resort to assessment tools and techniques to assist them in
matching people to existing jobs and to identify people with potential who can be
UUnniivveerrssiittyy ooff PPrreettoorriiaa eettdd ––KKiittcchhiinngg,, JJ ((22000055))
2
developed. Professor Robert Lindley said that as the human capital intensity of
products and services increases, so the importance of human resource
assessments should become a greater part of the evaluation of corporate
strengths and weaknesses (in Critten, 1993). Organisations need to ensure that
they have the right people in the right jobs, that is, employees who are able to
perform in the dynamic and changing work environments that will inevitably form
part of their future.
As a person grows within a level of capability, he or she sees the environment of
the organisation in a particular way (Stamp, 1988). With career planning, it is
important to measure an individual’s level of capability and his or her potential in
order to see if the individual could actually perform in a given work environment.
Career planning is about choices and the power to shape work experiences and
life. Career planning helps to clarify what employees and employers want from
work, and helps to develop effective strategies to meet these goals (Career Path
Counseling Service, 1999).
Career paths are also flexible lines of progression through which an individual
typically moves. Such paths can serve as a guide when selecting from amongst
alternative professions and alternative employment offers. Although the concepts
of career development, career path and career planning have prevailed in human
resources management literature for a long time (Kao, Lee & Kuo, 1997), they
have not received the appropriate attention they deserve.
Managers use assessment devices to create career paths and to evaluate
employees’ capabilities and future potential. The Employment Equity Act (Act 55
of 1998) states that tests and assessment devices may be used solely if they can
be shown to be scientifically reliable, valid, unbiased and fair.
The problem is, however, that some recruitment and selection devices are unfair
and culturally biased. It is extremely important to use assessment devices that
UUnniivveerrssiittyy ooff PPrreettoorriiaa eettdd ––KKiittcchhiinngg,, JJ ((22000055))

3
are legally sound. There is increasing pressure on test developers and users to
ensure bias-free practices (eg The Employment Equity Act [Act 55 of 1998], the
draft policy of the Professional Board of Psychology on the Classification of
Psychometric Measuring Devices, instruments, methods and techniques) (Bedell,
Van Eeden & Van Staden, Not dated).
Cultural bias is a concept that implies that selection techniques are differentially
valid for members of different ethnic groups (Gregory, 1996). Some selection and
assessment techniques are regarded as having an unfavourable impact on
people of different population groups (Anastasi & Urbina, 1997; Martocchio &
Whitener, 1992; Robertson, Iles, Gratton & Sharpley, 1991). Utilising such
techniques should be a serious concern for all employers (Bauer, Maertz, Dolen
& Campion, 1998).
The need for change has gradually devolved throughout the history of
assessments in South Africa. Tests were imported from overseas and applied
without change on all sectors of South African society. This caused enormous
problems for employers and employees as variables such as education,
language, culture and socioeconomic background were not re-evaluated. These
variables are important moderators of test performance and the outcomes may
be seen as being culturally biased and unfair to certain population groups. Thus,
the accuracy and outcomes of some psychological tests and assessments are
not necessarily equal and successful for all sectors of South Africa’s diverse
population (Bedell et al., Not dated).
Ensuring the use of bias-free assessment techniques should be the priority of
any selection strategy, particularly in South Africa, where attempts are being
made to rectify past practices that have had a discriminatory effect on certain
sectors of the population (Snelgar & Potgieter, 2003). The Employment Equity
Act (Act 55 of 1998) stipulates that assessment techniques should respect
cultural diversity and make accurate predictions for members of different
UUnniivveerrssiittyy ooff PPrreettoorriiaa eettdd ––KKiittcchhiinngg,, JJ ((22000055))

4
population groups (De Jong & Visser, 2000). It is therefore necessary to test the
CPA in order to prove that it is, in fact, free of cultural bias. The question that
must be asked is, therefore, whether the CPA allows for equal treatment and
measurement outcomes of all candidates from diverse backgrounds.
1.2 Problem statement
Career pathing is the design, development and implementation of processes and
resources that assist employees to make significant and satisfying contributions
to an organisation throughout their working careers (Davis, 2000). It aims to
address the implications of current changes in the organisation of work and
labour markets. Managers and counsellors need appropriate concepts, theories
and methodologies (Collin, 1998) to evaluate and help their employees with
future career development.
The CPA is an instrument that can be used to identify an individual’s current
capability as well as extrapolate future potential. Although previous research was
based on the reliability, validity and bias of the CPA, no empirical evidence exists
to establish the cultural bias of this measuring instrument. Cultural bias is one of
the more problematic and thorny issues that must be attended to in terms of local
labour legislation (Mauer, 2000). Culturally unbiased measuring instruments are
essential in rapidly changing work environments where affirmative action and
employment equity is at a premium.
In light of the challenges posed by multicultural assessment, it is important for the
CPA not to be culturally biased.
1.3 Study objective
The Employment Equity Act (Act 55 of 1998) requires that tests and assessment
devices may only be used if they can be shown to be scientifically reliable, valid,
UUnniivveerrssiittyy ooff PPrreettoorriiaa eettdd ––KKiittcchhiinngg,, JJ ((22000055))

5
unbiased and fair. The aim of this study is thus to prove that the measurement
outcome of the CPA is equivalent and unbiased for employees from diverse
cultural backgrounds.
A comprehensive theoretical background of the CPA is presented in chapter 2.
Chapter 2 gives a thorough description of the CPA and the correct application of
this assessment device. The theory utilised in developing the CPA is included to
portray the rationale of the CPA. Insight into careers and career paths is added
to highlight the importance of the CPA in our fast-changing work environment.
Further literature pertaining to assessment standards and cultural bias is also
presented in chapter 2.
The methodology used to conduct the research is described in chapter 3. The
methodology includes insights into the sample and the measuring instrument.
The research article is the end product of the study and can be viewed in the last
chapter (chapter 4). In this section, a clear indication of the research procedures
can be viewed. Various statistical analyses were conducted in order to support
the formulated nil-hypotheses. The research findings, shortcomings and
recommendations also form part of chapter 4.
UUnniivveerrssiittyy ooff PPrreettoorriiaa eettdd ––KKiittcchhiinngg,, JJ ((22000055))

6
CHAPTER 2
THEORETICAL BACKGROUND
2.1 Introduction
The concept “career” implies much more than a specific job or a type of work that
a person performs. A career spans an individual’s entire working life and includes
behaviours and attitudes toward work. A career develops in accordance with
these attitudes and behaviours (Stair, 1980).
We work in unsettling times. At times, the labour market is strong, unemployment
is low and organisations compete for talent. At other times, a soft economy,
mergers, consolidations and cost containment efforts raise the possibility of lay
offs in the workplace. In this kind of business environment, individuals should
take charge of their working lives and one way to achieve this is for individuals to
make themselves more valuable to their organisation. Individuals can improve
their skills, knowledge and attitudes. In other words, employees can develop their
competencies (Cripe & Mansfield, 2002).
Today’s successful employees must have many basic core skills and be
adaptable to change. The job market requires that employees continually learn
new skills, because technology is constantly changing and information is being
made available at ever increasing rates (Pathways, Not dated). Constant change
is also taking place in the work environment.
Peter Drucker (in Kao et al., 1997) stated that the probability that the first job
choice you make is the right one for you is roughly one in a million. A Chinese
proverb reflects a similar vein: men fear selecting the wrong occupation and
women fear marrying the wrong man. The implication of these statements is that
a career path must be carefully selected. It must be psychologically and
UUnniivveerrssiittyy ooff PPrreettoorriiaa eettdd ––KKiittcchhiinngg,, JJ ((22000055))

7
financially satisfying for the person. Robbins (in Kao et al., 1997) points out that
appropriate job selection and career planning largely determine successful
career development and job satisfaction.
Information regarding career options and opportunities must be available before
individuals can begin setting realistic career goals. In carrying out CPAs, CPA
practitioners, test users and organisations attempt to identify career paths for
individuals intending to enter a certain profession and those who are already in a
profession.
The CPA is a procedure that is used worldwide to evaluate individual decision-
making capability. It is a procedure that is used to give each person a deeper
understanding of his or her own capability and is deployed in organisations to
enable organisations to make the most of uncertainty. In the CPA, they are able
to form a view, with the participant, about his or her potential to handle
complexity and to make judgments that add value to a particular level of
complexity. Stamp (in Nobel, 2002) indicated that it is clear from the research
that this capability can develop with age and can be forecasted with encouraging
levels of accuracy.
Briefly, the CPA is a guided conversation in which the person is encouraged to
talk about his or her approach to his or her current work, the history of his or her
working life and his or her aspirations for the future. What a person says is
interpreted by a highly experienced practitioner in the light of the model of
different levels of work, the capabilities needed and the likely growth of those
capabilities. Working through a CPA is a significant step in personal
development. It creates a setting in which the person can put into words some of
the implicit knowledge on which he or she has been drawing; he or she may thus
become more aware of his or her inner resources and ways to access these
inner resources (Stamp, 1989).
UUnniivveerrssiittyy ooff PPrreettoorriiaa eettdd ––KKiittcchhiinngg,, JJ ((22000055))
8
Individuals change constantly and, thus, view their careers differently at different
stages of their lives. In general, there are four stages in career development (Kao
et al., 1997): exploration, establishment, mid career and late career. The
exploration stage generally occurs during the transition period between school
and first employment. The major task for this stage is self-exploration and to
evaluate career alternatives. In the establishment stage, employees start learning
how to do a better job and some can enjoy their work and get a sense of
achievement. In the mid-career stage, employees are expected to take full
responsibility for every act and their work performance continues to improve in
most cases. Finally, in the late-career stage, most employees enjoy the glory of
accomplishment and pass down their experiences and wisdom. Certainly, there
is no general consensus as to when one stage ends and the next stage begins.
Some individuals may experience a longer period in one stage and a shorter
period in another, while the converse may be true of others.
A CPA comes to a view about how capacity is likely to grow in the future and
about how the person prefers to reach out, gather and interpret information as a
prelude to making a decision (Mauer, 2000).
In many fields and organisations, the career path is well defined. A person
migrates from one position to the next, transferring knowledge and building
experience. Personal value and compensation accumulate in the process. Some
professions do not offer a clear picture of a career path. No clear guidelines can
help one reach the desired level (Kao et al., 1997).
During the 1990s, the literature on careers grew exponentially. And while some
researchers believe the end is in sight as far as careers are concerned (due to
higher levels of turnover in organisations), it is still a highly contentious issue
(Cappelli, 1999). Much of this literature reflects the growing debate on the nature
of work and the career in an unprecedented fast-changing environment,
embracing new information, manufacturing and processing technologies in the
UUnniivveerrssiittyy ooff PPrreettoorriiaa eettdd ––KKiittcchhiinngg,, JJ ((22000055))

9
context of the increasing globalisation of product and service markets. A central
theme in this field has focused on whether the concept of the career is really
undergoing fundamental change as a result of this environmental turbulence, or
indeed, if in practice very little is really changing. Some argue that changes have
occurred and that the demise of the traditional career is inevitable; they see
organisations and individuals abandoning the traditional organisational
framework within which stable, long-term career planning was feasible (Cappelli,
2000).
Others, however, assert that the career is merely adapting to changing economic
conditions and that no fundamental change is evident (Jacoby in Kelly, Brannick,
Hulpke, Levine & To, 2003). Yet others argue that the changes taking place may
be random, rather than indicative of a new patterned stability, or, indeed, that the
orderly form of career that has existed for the past 50 years or so has itself been
the aberration (Collin & Young, 1986).
Clearly, there is ample evidence to show that economic constraints, more intense
competition, increasing globalisation and other factors have brought dramatic
changes to organisational structures (Brousseau et al., in Kelly et al., 2003).
Brousseau et al. argue that development, brought about by a rapidly changing
business environment, highlight concerns of the nature of careers. Our traditional
understanding of the career as being a series of upward moves, with increasing
income, status, power and security within a single organisation, is being
challenged.
Traditionally, individuals followed a career path that stayed within one function
and the recognised route was primarily vertical. It was not common to deviate
from this norm. Items relating to movement across functions, and from technical
to specialist roles or positions, and also through or across hierarchical levels,
may also be seen as indicators of the existence of alternative types of career
paths or those that deviate from traditional norms.
UUnniivveerrssiittyy ooff PPrreettoorriiaa eettdd ––KKiittcchhiinngg,, JJ ((22000055))

10
Undoubtedly, changing economic and organisational structural circumstances
have a strong impact on human resource management, particularly on career
planning and management (CPM) systems (Baruch, 1999). Human resource
managers face the challenge of managing people in an increasingly volatile
business environment. CPM practices need to incorporate the changing reality of
careers and reflect emerging organisational structures and changing
environmental situations. This new environment will demand a re-thinking of
training and development practices. There is a need for a new type of human
resource (HR) function in this emerging economic era.
A more collaborative, symbiotic relationship between workers and organisations
may be necessary (Von Hippel et al., in Kelly et al., 2003). The human resource
function is simultaneously attempting to position organisations and employees to
respond flexibly to market changes, while seeking stability by recruiting,
developing and retaining people whose talents are critical to the organisation.
Thus, we see an emerging paradox in career management structures, as
Rousseau and Arthur put it (in Kelly et al., 2003), to cope with the twin pressures
for flexibility and stability. An example of the above may be observed when
organisations dedicate their resources to the development of specific individuals
rather than to their workforce as a whole. It has also been argued that these new
career structures place more emphasis on individuals managing their own
training and development. It also places a strong emphasis on personal
development. Training in organisations may, therefore, be more informal than it
would be in more traditional organisations.
The importance for every organisation of predicting individual potential and
current capabilities in a rapidly changing world cannot be emphasised enough.
People represent a major investment, and the accurate evaluation of the
potential rate of appreciation of that investment ensures a sound and sensitive
strategy for the management of human resources (Baker & Stamp, 1990).
Although some of the literature regarding CPA and career paths is relatively old,
UUnniivveerrssiittyy ooff PPrreettoorriiaa eettdd ––KKiittcchhiinngg,, JJ ((22000055))

11
it is still relevant in today’s fast changing work environment and diverse
population.
The detailed description of the CPA emphasises the relevance of this instrument
in South Africa’s current work environment.
2.2 Description of the Career Path Appreciation (CPA)
Gillian Stamp developed the CPA from Elliotte Jaques’ theoretical model. It
consists of a one-on-one interview between a trained CPA practitioner and an
individual, where the focus is on the relationship between the capabilities and
challenges that exist both for the individual and the organisation. Its distinctive
theoretical framework is based on a definition of work, a model of how work is
structured and an explicit hypothesis about individual differences in adult
development.
A CPA involves the following:
• The use of phrase cards designed to guide conversation in terms of the
individual’s approach to the work with which he or she is currently busy.
• The sorting of symbol cards of different shape, colour, size, and so on ---
according to the predetermined rule unknown to the respondent --- which
offers insight into an individual’s capability to create order out of disorder.
• A discussion with the individual about his or her current work, the history
of his or her current work, the history of his or her career and his or her
aspirations for the future. In the course of this discussion, emphasis is
placed on times when the individual has felt at ease, overstretched or
underused with regard to his or her responsibilities (Ashton, 2000).
UUnniivveerrssiittyy ooff PPrreettoorriiaa eettdd ––KKiittcchhiinngg,, JJ ((22000055))
12
The CPA allows a trained practitioner to arrive, in two to three hours, at a view
about a person's current and likely future capability to make effective decisions.
This information is first shared with the respondent and then only with the
organisation (Stamp & Stamp, 1993). The CPA is an individually administrated,
multifaceted procedure for understanding the frames of reference a person uses
to construct her or his world. It is possible to view the CPA as a sample of work in
the sense that it is possible to observe how discretion is exercised or, stated
differently, how the person copes with complexity.
The rationale of the CPA portrays a thorough theoretical background to this
assessment device.
2.3 The rationale of the Career Path Appreciation (CPA)
More than thirty years ago, Elliot Jaques investigated the issues of discretion,
judgment and complexity, and alerted people to the changing roles of knowledge
and judgment (Jaques, 1978).
In the mid 1970s, Jaques’ colleague, Stamp, undertook to develop a way to
measure discretion in action. The outcome was a procedure for locating an
individual’s current position in a scheme of levels of work with coordinates
representing current age and current level of capability. The outcome of this
procedure is then evaluated against a set of growth curves derived by Jaques
from extensive study of earnings and management progression (Ashton, 2000).
Stamp’s findings strongly confirm key elements of the key theory. In addition,
they confirm the existence of a grow process – reliability predicted by Jaques’
growth curves --- which is anchored by initially assessed capability and age. In
the levels of work scheme, “each layer" is more complex than the one below it; it
thus poses unique new conceptual requirements for decision makers and
leaders. The capability to deal with these requirements is based on the
UUnniivveerrssiittyy ooff PPrreettoorriiaa eettdd ––KKiittcchhiinngg,, JJ ((22000055))

13
development of a frame of reference, which is capable of patterning the
ambiguity, uncertainty and encountered complexity of an organisation’s
environment through the use of an appropriately complex frame of reference.
The rationale of the CPA is based on the Stratified Systems Theory (SST) and
the Matrix of Working Relationships Model (MOW). This will now be explained in
depth.
2.3.1 The Stratified Systems Theory (SST)
The Stratified Systems Theory (hereinafter referred to as SST), as expressed by
Elliot Jaques (1970, 1976, 1978), forms the basis for the Matrix of Work (MOW)
Theory upon which the CPA is based.
John Isaac and Roland Gibson (Jaques, 1978) had already begun to identify
inconsistencies in levels of abstraction. They had identified six discrete levels
ranging from primitive behaviour to the development of highly abstract geometries.
Jaques was interested in their research, because of their idea of levels of
managerial organisation. All organisations have some form of a managerial
hierarchy and it is essential that the relationships between this hierarchy and
complexity of work be understood to ensure effective use of talent and energy
(Jaques, 1990). Not only does work become more complex, but it also separates
into distinct categories or types of complexity; the individual’s capability on a job
also separates into distinct categories or types of complexity as the work grows in
complexity (Jaques, 1978).
Jaques’ (1992) view of work revolved around the relationship between discretion,
judgment and experience. He defined work as the exercise of discretion and
judgment in decision making in carrying out tasks; it is driven by values and brings
skilled knowledge into play (Jaques & Cason, 1994). According to Jaques and
Cason (1994), knowledge and experience play an essential role in the decision-
UUnniivveerrssiittyy ooff PPrreettoorriiaa eettdd ––KKiittcchhiinngg,, JJ ((22000055))

14
making process when the individual operates in a stable environment. Should
uncertainty and ambiguity be introduced, however, an individual’s ability to exercise
discretion and rely on his or her judgment to make decisions becomes vital. The
amount of discretion required is an indication of the level of complexity of that
particular job, that is, the more discretion required, the higher the level of
complexity. They also looked at the differences in capability of the various
individuals, specifically how this capability may be developed over time.
Jaques (1986, 1990, 1992) believed that an individual’s contribution to work could
be measured in terms of the completion time of the longest task assigned to that
role. He was confident that this maximum time was a direct indication of the level of
work; he referred to this as the time span of discretion (Jaques, 1996).
The model identifies seven levels of work, differentiated on the basis of complexity
and time span of decision making. The longer the time span, the higher the level of
work and the greater the responsibility associated with that role (Jaques, 1986). No
level is more important than another and no reference is made to command
structures. Each level has a specific value-adding theme, which provides a unique
contribution to the flow of work within organisations (Oliver, 1999). As the time
needed for making an effective decision increases, so the responsibility of the job
increases as well. The level of complexity of the work thus increases, resulting in a
higher level of capability required for effective decision making (Jaques, 1970).
Richardson asserts that time of discretion also measures levels of work (EDAC,
2000). In order to support the relationship between time span and level of work,
good correlations were obtained between time spans and perceived fair pay
(Jaques, 1986).
UUnniivveerrssiittyy ooff PPrreettoorriiaa eettdd ––KKiittcchhiinngg,, JJ ((22000055))

15
2.3.2 The Matrix of Working Relationships Model (MOW)
The Matrix of Working Relationships Model (hereinafter referred to as MOW)
explores the relationship between an individual at work, the organisation and the
environment within which the organisation needs to function. It is based on the
SST (Jaques 1970, 1978, 1986, 1990, 1992). This model developed by Gillian
Stamp, defines the levels of work as referred to in the CPA, together with the
required levels of capability required to cope with work at the various levels
(Jaques, 1978; Stamp, 1978).
Stamp worked under the assumption that as an individual’s responsibilities
increase, so too does the complexity of the job. Stamp identified various themes of
work, where each theme requires a higher level of complexity than the one below; it
therefore requires a higher level of individual capability to be able to manage
uncertainty and ambiguity, (Stamp, 1978, 1981, 1986, 1988, 1989).
Each level makes a unique contribution to the organisation; missing levels of work
will have a negative impact on the organisation (Oliver, 1999). While the lower
levels contribute to the more concrete outputs concerned with the operational
functioning of the organisation, the higher levels contribute to the strategic future
positioning of the organisation and ensure its future viability (Stamp, 1978, 1981,
1986, 1988). An area highlighted by her, was the absence of any link between the
various levels of work and job grades or pay scales, thereby emphasising the
importance of each theme and eliminating the misconception that one theme is
superior to another (Stamp, 1981, 1988).
There are three basic categories of human working capability: current potential
capability, which gives an indication of the maximum level of work that an individual
can do at any given point in time, if the individual is doing something that he or she
values; current applied capability refers to the level of capability that the individual is
currently applying in his or her work; and future potential capability, which refers to
UUnniivveerrssiittyy ooff PPrreettoorriiaa eettdd ––KKiittcchhiinngg,, JJ ((22000055))

16
the predicted level of potential capability that an individual will be able to handle at a
specific point in the future (Jaques & Cason, 1994). Jaques (1986) highlighted that
time span was an indication of capability - the longer the time span a person could
achieve, the higher that person’s capability.
A person’s capability refers to the level of work that an individual is capable of. The
word ”capability” is used to describe the way in which people pattern and order their
experiences through time as a basis for making sense of their world and acting on it
(Stamp, 1981). Capability defines the scope and complexity of the world which
people construct and in which they operate. Capability is the combination of
competencies that enable an individual to work and achieve goals (Stamp, 1988). In
the context of the CPA, it essentially explores the decision making complexity with
which an individual is comfortable.
The following table gives a brief summary of the various levels of work, together
with the level of capability required to effectively manage tasks at a particular level.
TABLE 2.1: LEVELS OF WORK
Level Theme Summary Capability Typical roles
Level 1 Quality Outputs and standards are
concrete and specified before-
hand, a predetermined goal
Touch-and-feel First line workers
responsible for
operating tasks
(semi-skilled)
Level 2 Service Provide a service to both internal
and external customers by
analysing problems and
providing a framework for
explaining how and why work
had to be done, and developing
customised solutions that meet
the needs of each specific
situation
Accumulation of
information
Supervisor
UUnniivveerrssiittyy ooff PPrreettoorriiaa eettdd ––KKiittcchhiinngg,, JJ ((22000055))

17
Level 3 Practice Individuals are able to juggle a
variety of resources, including
budgets, people, plants
and equipment, culture and
technologies
Connecting Personnel
manager
Level 4 Strategic
development
Translate long-term strategic
objectives into short-term
operational goals that can
be implemented
Modelling General manager
Level 5 Strategic
intent
Ensure the financial, social
direction and viability of an
organisation over a 5 to 10-year
period
Weaving (creating
links between issues
and events)
Managing directors
Level 6 Corporate
citizenship
Understand, local, national,
regional and worldwide context
in which their organisation exists
Revealing (extending
curiosity)
Executive Vice
President
2.4 The uses of the Career Path Appreciation (CPA)
The CPA may be used by an organisation in the form of an initial assessment of
capability, for individual and organisational development, or by an individual at a
point of uncertainty about his or her working life.
In this role, the CPA provides a valuable adjunct to individual and/or managerial
judgment about performance and potential for carrying greater responsibilities.
Used in this way, the CPA contributes progressively to articulation within the
organisation of issues surrounding the optimal structuring of work, such as the
delegation of tasks, patterns of accountability, training, succession planning and
statements of corporate philosophy. Over a period of time, a new, shared
language emerges within the organisation, allowing reflection about the way in
which the purpose of work is stated, the way in which the work itself is organised
and how people’s skills are positioned (Ashton, 2000).
UUnniivveerrssiittyy ooff PPrreettoorriiaa eettdd ––KKiittcchhiinngg,, JJ ((22000055))
18
The following is a broad overview of the various uses of the CPA:
• The CPA is a powerful technology for executive recruitment, mentoring
and development.
• To select an organisation’s future executives at an early stage.
• Minimise the risk of high calibre people turnover by pacing them at a
tempo equal to their capability to ensure current as well as future
challenges.
• Educate employees and managers into a framework that empowers with
accountability resulting in improved productivity and organisational
effectiveness due to maximisation of capabilities and creativities.
Appropriately used, the CPA is a unique and powerful technology for individual
and organisational wellbeing. It is an internationally accepted process used by
blue chip companies in South Africa, Namibia, Botswana, Zimbabwe, Swaziland,
Australia, the United Kingdom, India, the United States, Canada, Brazil, Poland,
Sweden and other European countries (Ashton, 2000).
The CPA provides an indication of an individual’s capability to generate,
understand and act in contexts where prior knowledge and experience may no
longer be applicable. This provides an understanding of the nature of freedom
the person requires to act appropriately, as well as value and the type of work
contribution one is likely to predict. Individuals are allowed the freedom to take
charge and become part of the process of optimally sharing and creating the
future success of the organisation. The process thus initiates the best fit between
capability and the demands of the organisation.
The opportunity to personally explore career choices made in the past and those
that may have to be made in the future is also provided. Feedback to the
individual is an integral part of the process as he or she explores and
understands the past and designs the future. In this way, individuals are
UUnniivveerrssiittyy ooff PPrreettoorriiaa eettdd ––KKiittcchhiinngg,, JJ ((22000055))

19
empowered to take charge of their own work and personal life. Mutual benefit is
thus created for the individual and the organisation as it touches on the core of
work, that is, the capability to generate contextually-appropriate solutions and
decisions even in the absence of previously acquired knowledge, skills and
experience. This provides a powerful framework for the development of
organisations, as well as individuals and their career paths within or outside the
organisations (Ashton, 2000).
The CPA can also assist in
• executive identification and development
• recruitment, selection and placement at senior levels in the organisation
• affirming action strategies
• developing platforms for mentoring
• developing platforms for current and future career path management
• developing platforms for current and future competency
development/training and development
• broader-based succession planning
• organisational interventions
Because of the increasing pressure that is being placed on assessment
developers and users in that all devices must be aligned with legislation and that
it can only be used if the device is shown to be scientifically reliable, valid,
unbiased and fair, a lot of research has been conducted on the CPA.
2.5 Research conducted on the Career Path Appreciation (CPA)
2.5.1 Reliability
Given the nature of the CPA, the most appropriate approach is that of inter-rater
reliability. Several studies conducted in the US Army Research Institute for the
Behavioural and Social Sciences (ARI) yielded coefficients ranging between 0.79
UUnniivveerrssiittyy ooff PPrreettoorriiaa eettdd ––KKiittcchhiinngg,, JJ ((22000055))

20
and 0.81, which are excellent in view of the complexity of the scoring procedure
that is used (Lewis, 1993). In other studies, the percentage of agreement
between judges was used as an indication of reliability. The mean absolute
agreements for current levels of work were 95 percent, 90 percent for current
level of capability and 94 percent for likely growth capability (Rossan & Topham,
1996). In an investigation of 74 CPA protocols for workers in Botswana, a 100
percent agreement in mode placement was found between two raters. Taking the
intermode placements into account, the percentage agreement was 91 percent
(Mushayandebvu, 1991).
2.5.2 Construct validity
This approach to validity is used to assess the theoretical underpinnings of a test
or assessment technique. In 1993, the following relationships were shown to
exist between the CPA and various instruments; creativity, 0.69; intelligence,
0.35; problem-solving ability, 0.26; neuroticism, -0.35; openness, 0.22; MBTI
intuiting, 0.27; MBTI perceiving, 0.29. Other researchers have found validity
coefficients of 0.57 and 0.51 between CPA ratings and two different thinking skill
measures, and a coefficient of 0.58 between CPA assessment and a measure of
breadth of perspective (McIntyre, Yanusefski & Hamil, 1994).
2.5.3 Concurrent validity
This form of validity is used to assess the extent to which a device reflects the
current level of work performance. In two in-company studies, validity
coefficients of 0.71 and 0.79 were found. In a British Army Staff College study,
coefficients of 0.71 to 0.77 were reported (Stamp in Mauer, 2000).
UUnniivveerrssiittyy ooff PPrreettoorriiaa eettdd ––KKiittcchhiinngg,, JJ ((22000055))

21
2.5.4 Predictive validity
A study of two British companies and one in South Africa, in which results were
followed up 4 to 15 years later, yielded a coefficient of 0.89 between predicted
level and level of attainment (Stamp, 1989). Subsequent studies have shown
correlations of between 0.79 and 0.92. The CPA, combined with a personality
assessment technique, yielded a validity coefficient of 0.93 after five years in a
Southern African context (Bluen, 1995). In a South African study, the validity
coefficients for the three CPA variables ranged between 0.23 and 0.57 when
using salary and job grade as criteria (Mauer, 1997). While this information is
useful, it would be preferable if the studies could be replicated in other types of
industries so that the utility of the approach can be defended from a broader
base.
2.5.5 Lack of bias
Studies conducted abroad show that there are no differences between genders,
races and people with different levels of educational attainment. A South Africa
study of 8054 workers showed no differences between gender or race groups on
the CPA modes. Another South African study of 486 managers indicated no
differences between race groups and gender on CPA scores (Mauer, 1997).
Although a lot of comprehensive research has been conducted on the CPA, there
is, nevertheless, room for performing research on the cultural component of this
assessment device. The concept of culture looms large in the world these days.
Although the term is difficult to define, the essence of culture is a reminder to
institutions and individuals that there are other ethnic groups in the world (Austin,
1999). Culturally unbiased measuring instruments are essential in a diverse
country such as South Africa where affirmative action and employment equity is
at a peak. It is therefore important to prove scientifically that the CPA is, in fact,
UUnniivveerrssiittyy ooff PPrreettoorriiaa eettdd ––KKiittcchhiinngg,, JJ ((22000055))

22
an objective measuring instrument that can be used on people from diverse
backgrounds.
In order to prove that the CPA is, in fact, an objective measurement, it is
necessary to look at the term “cultural bias” and the specifications for bias-free
measuring instruments within the South African context.
2.6 Bias-free instruments within the South African context
2.6.1 Bias
Bias exists in many instruments. When reviewing existing instruments, it is
important to look for any forms of bias that might exist. Three types that are
common are cultural bias, linguistic bias and socioeconomic bias (FairTest, in
Wilde & West, 1996). The first is based on the fact that results reflect white,
South African, middle class experiences and culture. Tests measuring language
proficiency tend to emphasise discrete components of language rather than
assessing how well someone actually communicates in English. Another
component of linguistic bias is the need for many language minority participants
to translate items before they can answer them; it is a very time-consuming
process, which also disadvantages them under test conditions. Finally,
socioeconomic bias is the assumption by many test developers that all test-
takers will be familiar with middle class experiences, activities and language.
National Evaluation Systems (in Wild & West, 1996) highlighted the following
types of bias in test items that may cause concern: stereotyping, representational
fairness and content inclusiveness. Stereotyping is based on a custom or
practice that it isolates and exaggerates. Bias also may occur through the under-
representation or over-representation of particular groups such as women, older
people, people with disabilities, and so on. National Evaluation Systems suggest
specific methods for identifying bias due to representational fairness. Content
UUnniivveerrssiittyy ooff PPrreettoorriiaa eettdd ––KKiittcchhiinngg,, JJ ((22000055))

23
inclusiveness refers not only to the common concern that the test matches the
curriculum, but also to a concern that the test materials include the contributions,
issues and concerns of a variety of groups from our society, not just the dominant
one or two (Wilde & West, 1996).
Cultural bias is determined by means of objective, statistical indices that indicate
if the test scores have the same or different meanings and implications for
different subgroups. Fairness, in contrast, reflects social values and philosophies
of test use. Regardless of the statistical properties of the test, test results will be
used differently depending on the ethical position taken by the selector; various
factors, including the social consequences, will determine if the decision can be
regarded as fair or not.
The issue of cultural bias in testing can be related to the need to secure equal
opportunities for all. Thus, cultural bias can be viewed as the acceptance of the
candidate identified as most unlikely to succeed in a given position. It can also
refer to the extent to which selection procedures succeed in meeting certain
socio-political goals, especially those related to decreasing inequality and
increasing the representation of disadvantaged demographic groups (Reynolds,
in Huysamen, 1996). Taylor and Radford (1986) argue that any interpretation of
psychometric data in South Africa that does not take into account possible
differences between ethnic groups is likely to ignore a significant moderator
variable, given the history of ethnically-based discriminatory practices in this
country.
Simply stated, cross-cultural research identifies the similarities and differences
between different cultures. This understanding allows companies to capitalise on
commonalities or respond to differences appropriately (Rutter & Donelson, 2000).
A measurement process is biased if it systematically overstates or understates
the true value of the measurement (Annenberg, 2003).
UUnniivveerrssiittyy ooff PPrreettoorriiaa eettdd ––KKiittcchhiinngg,, JJ ((22000055))

24
2.6.2 Specifications for bias-free measuring instruments
Ensuring that all selection strategies are culturally unbiased should be a priority,
particularly in South Africa, where attempts are being made to rectify past
practices that have had a discriminatory effect on certain sections of the
population (Snelgar & Potgieter, 2003). The South African Employment Equity
Act (Act 55 of 1998) awards priority to the issue of group representivity in
employment outcomes and ensures equal representation in all occupational
categories and levels in the workplace (Mdladlana, 2001). Because of the vital
importance of culturally unbiased assessment techniques, the issue of bias-free
devices should be based on the end-to-end process of the entire recruitment and
selection strategy, and not be isolated to one aspect of measurement. Any
recruitment and selection decision is based on one or another selection model of
decision making. The question that must, therefore, be asked is: Is the model
“fair” and do the instruments of evaluation and assessment allow for equal
treatment of all candidates? Ensuring culturally unbiased outcomes is, therefore,
very important.
Psychological tests are not necessarily equally accurate or successful for all
subgroups in a heterogeneous population. However, testing provides a means of
gaining information about people in a fairly quick, economic and objective way.
There is an increasing pressure on test developers and test users to ensure fair
testing practices (eg the Employment Equity Act [Act 55 of 1998], the draft policy
of the professional Board of Psychology on the classification of psychometric
measuring devices, instruments, methods and techniques). In terms of South
African legislation, only psychometric tests and similar instruments, of which the
validity and reliability has been scientifically proved and which are not biased
against any employee or group, may be used (Employment Equity Act [Act 55 of
1998]).
UUnniivveerrssiittyy ooff PPrreettoorriiaa eettdd ––KKiittcchhiinngg,, JJ ((22000055))

25
The main issue in the analysis of test score comparability is whether the same
construct or dimension is measured across different groups (Van der Flier &
Drenth, in Taylor & Radford, 1986). This means that the researcher or test user
must establish whether intergroup differences on a test reflect real differences in
the object of the testing situation or other factors pertaining to the test. In other
words, the researcher must establish whether the test is biased. The following
have been identified as important questions in this regard:
• What traits or abilities are valid across cultures?
• Does a certain construct play an equally important role in the organisation
of individuals from different cultures?
• Does a test for assessing a particular construct reflect that ability on a
scale with the same origin and with equal units of measurement in the
different groups (Poortinga & Van der Flier, 1988)?
Score compatibility relates to items bias. If items are biased against members of
a group, it means that they have the ability to respond to the item correctly, but
for reasons such as item format or phrasing of the item, they do not have the
same opportunity as others to do so.
Bias concerns systematic errors associated with group membership. The sources
of bias may lie within test items, within the test as a whole, within subjects, with
the tester and in the testing context (Taylor & Radford, 1986). Taylor and Radford
(1986) argue that bias can never be eliminated entirely, but steps can be taken to
minimise the effects of bias associated with known or potential sources.
Variables commonly identified as moderating test performance include language
proficiency; cultural, socioeconomic and educational background; and test-
wiseness (Nell, 1997).
To date in South Africa, research on multicultural testing in personology and
abnormal or clinical psychology has received relatively little attention compared
UUnniivveerrssiittyy ooff PPrreettoorriiaa eettdd ––KKiittcchhiinngg,, JJ ((22000055))

26
to cognitive testing. Most cognitive tests used in South Africa assess verbal
ability, numerical ability, deductive reasoning, and the like. These can, to a large
extent, be viewed as indicators of crystallised intelligence and often require
specialised skills or knowledge promoted by a given culture (Taylor, 1994). This
structural approach attempts to measure performance along dimensions
assumed to constitute the fundamental structure of domains such as cognition.
Fair practices in South Africa might require a greater emphasis on work-related
variables. Given the difficulties experienced in cross-cultural testing, it is
recommended that only information which is systematically related to work
success should be considered for decision making (Abrahams, 1994).
The Employment Equity Act (Act 55 of 1998) states that all employers should
take steps to promote equal opportunities in the workplace and to eliminate unfair
discrimination. Selection represents a fundamental activity and business
consideration within an organisation, because correct placement can add a
dynamic, productive member to the existing work team, who can then contribute
to the growth and prosperity of the organisation (Booysen & Theron, 1996; Rynes
& Connerley, 1993; Sunter, 1997). Furthermore, selection can function as a
powerful mechanism to ensure that positive steps are taken to promote equal
representation of previously disadvantaged groups at all occupational categories
and levels (Employment Equity Act [Act 55 of 1998]). Disadvantaged groups in
this context are blacks (including coloureds and Asians), women and people with
disabilities.
Certain selection techniques are, however, often regarded as having an adverse
impact on candidates of different population groups (Anastasi & Urbina, 1997;
Martocchio & Whitener, 1992; Robertson et al., 1991). The South African law
leaves the evaluation of assessment practices, such as selection techniques,
primarily in the hands of industrial psychologists who develop and use the
assessment instruments (Jacobson, 1996). However, clear guidelines are
UUnniivveerrssiittyy ooff PPrreettoorriiaa eettdd ––KKiittcchhiinngg,, JJ ((22000055))

27
provided. These guidelines mean that an employer should be able to prove
scientifically that
• the information gathered during the selection process is valid and job
related
• the utility of the selection techniques makes it a business necessity
• the information is combined in a fair manner
• the selection efficiency justifies the use of the technique (Booysen &
Theron, 1996)
In the Employment Equity Act (Act 55 of 1998), the advice is given to rather avoid
techniques that cannot legally be proved to be valid and fair. The requirement is
that all techniques used during a selection process should respect cultural
diversity and make accurate predictions for members of different population
groups.
A valid selection technique is defined as a measure that accurately discriminates
between individuals with high and low probability of job success. Unfair
discrimination occurs when individuals from one specific population group
perform less well than a comparison group on a specific selection technique, but
perform as well as the comparison group on the job for which the selection
technique is a predictor (Cascio, 1997). An individual from that specific
population group does not have an equal opportunity to be selected for the
vacant post, although the person has an equal probability of job success. Such a
technique is biased.
Test bias is a concept that implies that selection techniques are differentially valid
for members of different population groups (Gregory, 1996). It involves
systematic or constant errors (Graham & Lilly, 1984), because of faulty test
construction and/or incomplete test analysis. The question of test bias can be
corrected through empirical techniques and test bias need not exist on any
UUnniivveerrssiittyy ooff PPrreettoorriiaa eettdd ––KKiittcchhiinngg,, JJ ((22000055))

28
terrain of intelligence or competency testing. By taking the correct precautions,
selection techniques should predict future performance equally well for
candidates from different population groups (Gregory, 1996).
Section 8 of the Employment Equity Act (Act 55 of 1998) prohibits "psychological
testing and other similar assessments of an employee" unless "the test or
assessment being used has been scientifically shown to be valid and reliable;
can be applied fairly to all employees; and is not biased against any employee or
group" (Government Gazette, 1998).
Psychometric concepts such as validity, reliability, bias and fairness are not cast
in stone; rather, they evolve as test theory and testing practices develop.
Assessments are viewed as “a comprehensive evaluation of an individual
through a process that integrates test information with information from other
sources (eg from the individual’s social, educational, employment or
psychological history)” (American Educational Research Association, 1999:3). It
is clear that South African assessment practitioners, especially those in
employment testing, may benefit immensely by familiarising themselves with the
developments and standards of such devices.
2.7 Conclusion
It is important both nationally and internationally to emphasise the need for
setting career paths and planning for them accordingly. Organisations and
people are changing rapidly. Success and front line leadership skills in the
industry are fast becoming the norm in South Africa. If employers do not track
and improve their human capital’s potential and capabilities, they will be left
behind.
Organisations are using various assessment techniques to follow employee
potential and capabilities. These techniques are frequently used inappropriately
UUnniivveerrssiittyy ooff PPrreettoorriiaa eettdd ––KKiittcchhiinngg,, JJ ((22000055))

29
and reflect biased outcomes against certain population groups. Language,
culture, socioeconomic background and education are all important moderators
of test performance. Test users and developers should focus on these variables
or run the risk of the assessment device being seen as biased.
The CPA is being used worldwide to assess individual capability and to
extrapolate future potential. Taking the above-mentioned problems with regard to
assessment devices into account, research should be conducted in order to
scientifically prove that the CPA is culturally unbiased.
UUnniivveerrssiittyy ooff PPrreettoorriiaa eettdd ––KKiittcchhiinngg,, JJ ((22000055))

30
CHAPTER 3
METHOD OF INVESTIGATION
3.1 Sample
Bioss Southern Africa, the test distributors of the CPA, maintained a database of
all assessments that have been conducted over the years. From this database
non-probability convenience sampling was used in selecting individuals who had
been assessed by means of the CPA in the past 5 years. The sample consists of
4 606 respondents. The sample included employees of various banking,
insurance and motor industries. Although the population groups were unequally
distributed in the data, the possibility to perform meaningful analysis still exists.
3.2 Measuring instrument
Career Path Appreciation (CPA) is a one-on-one interview that allows a trained
practitioner to arrive, in two to three hours, at a view about a person's current and
likely future capability to make effective decisions.
An appreciation consists of three parts, namely
• nine sets of phrase cards
• a symbol card task
• a career history interview
While there is no prescribed order in which these tasks are presented, it is
customary to begin with the phrase cards, follow with the symbol cards and end
with the career history interview.
UUnniivveerrssiittyy ooff PPrreettoorriiaa eettdd ––KKiittcchhiinngg,, JJ ((22000055))

31
Phrase cards
There are nine sets of six phrase cards that are used as triggers to elicit the way
the respondents approach their work. The respondents is then asked to choose
the cards he or she feels reflects most the way he or she would approach work,
discuss his or her choices and provide examples to illustrate his or her choices.
This section enables the practitioner to gain information about the current level of
capability in relation to the current level of work expected of that person, as well
as the likely rate of growth of their capability (Stamp, 1981).
Symbol cards
The symbol card task requires that an individual be given the task to work out a
predetermined rule for sorting a pack of cards of different colours, shapes,
numbers and sizes with minimal instruction. The purpose of this exercise is to
observe the process of defining the task, the generation of alternative courses of
action, the handling of uncertainty and the reaching of a solution, thereby gaining
more insight into the candidate’s current level of capability and preferred
approach to work. The focus here is on the process of organising and acting
rather than on the actual solution itself (Stamp, 1988).
Interview
The final component is a detailed conversation pertaining to the individual's
working life. The candidate is encouraged to reflect upon his or her entire career,
emphasising the times when he or she felt his or her capability was well matched
to the challenges being provided to him or her, and the times when he or she felt
they were being given challenges that he or she was not ready to handle (Stamp,
1988).
Throughout the interview, the interviewer is required to continuously gather
evidence during the various phases of the process. The practitioner then
analyses and interprets the responses using the Matrix of Work Model, and in a
single overall score, ranging from level I to level VII, makes a judgement about
UUnniivveerrssiittyy ooff PPrreettoorriiaa eettdd ––KKiittcchhiinngg,, JJ ((22000055))

32
the individual’s current level of capability (Stamp, 1986, 1989). Using the current
level of capability, together with the individual’s current age and Jaques growth
curves (1971, 1976, 1986, 1992), the practitioner is able to predict any likely
additions of these capabilities (Lewis, 1993).
3.3 Procedures
A database of approximately 29 000 respondents were provided by Bioss
Southern Africa. Only data with CPA scores were used in this study. All duplicate
entries and missing values were removed by means of excel formulas. The excel
spreadsheet was imported into SPSS (Statistical Programme for Social Science)
and analyses were performed to identify outliers. The necessary outliers were
removed. A total of 4 606 entries were used for further analysis. All scales used
in variance analysis were standardised to a six-point scale by means of SAS
software (SAS Institute, 1996) in order to perform meaningful comparisons.
3.4 Statistical analysis
The data was analysed in collaboration with the Statistical Consultation Services
of the University of Pretoria, STATOMET, using the SAS-package (SAS Institute,
1996) and SPSS.
Analysis of variance (ANOVA) was used to compare CPA outcomes (mode,
current level of capability and style) between race, gender and population
groups. All variables used during ANOVA analyses were transformed to a six-
point scale for making comparisons and to comply with homogeneity of variance
and normality of ANOVAs. To indicate which variables differ significantly, the
post hoc test of Scheffé was applied. Pearson correlations were used to specify
the relationship between variables. SPSS software package were used for
calculating the correlations. Due to the type of data used, limited forms of
statistical analysis were performed. The findings are indicated in the last chapter.
UUnniivveerrssiittyy ooff PPrreettoorriiaa eettdd ––KKiittcchhiinngg,, JJ ((22000055))

33
CHAPTER 4
THE MEASUREMENT OUTCOME EQUIVALENCE OF THE CAREER PATH
APPRECIATION (CPA) FOR EMPLOYEES FROM DIVERSE CULTURAL
BACKGROUNDS
J KITCHING
Programme in Industrial Psychology
Department of Human Resources Management
University of Pretoria
ABSTRACT
The aim of this study is to determine whether or not the Career Path Appreciation
(CPA) is cultural unbiased. The use of assessment instruments in South Africa
has been criticised, because it is said that they are largely based on the values
and knowledge of overseas instruments, which are considered to be less valid for
South Africa’s various cultural groups. In this study, an Asian, black, coloured
and white group were included to determine the cultural equivalence of the CPAs
measurement outcomes. The results indicate that the CPA measurement
outcomes are not biased and are, therefore, equivalent for groups of diverse
cultural backgrounds.
OPSOMMING
Die doel van die studie was om te bepaal of the Career Path Appreciation (CPA)
sydig is ten opsigte van versillende kulture. Die mees algemene kritiek teen die
gebruik van psigometriese instrumente in Suid-Afrika is dat dit grootliks gebaseer
is op en aangepas is uit Westerse instrumente wat tot gevolg het dat hierdie
instrumente minder geldig meet vir ander kultuurgroepe in Suid Afrika. In hierdie
studie is asiër, kleurling, afrika en blanke groepe gebruik in die bepaling van die
kulturele gelykwaardigheid van die CPA uitkomste. Die resultate toon dat die
CPA nie diskrimineer ten opsigte van Afrika kulture nie.
UUnniivveerrssiittyy ooff PPrreettoorriiaa eettdd ––KKiittcchhiinngg,, JJ ((22000055))

34
Introduction
The Career Path Appreciation (hereinafter referred to as the CPA) can identify an
individual’s current capability and extrapolate future potential. The CPA is also a
unique and powerful technology for individual and organisational wellbeing. It is
an internationally accepted process used by various blue chip companies in
South Africa (Ashton, 2000).
Although previous research was based on the reliability, validity and bias of the
CPA, no empirical evidence exists to establish the cultural bias of this
assessment device. In light of the challenges posed by multicultural assessment,
it is important for the CPA to be culturally unbiased.
Culturally unbiased measuring instruments are essential in rapidly changing
environments where affirmative action and employment equity is at a premium,
particularly in South Africa. The Employment Equity Act (Act 55 of 1998) requires
that tests and assessment devices be used solely if they can be shown to be
scientifically reliable, valid, unbiased and fair. This study will thus broaden our
knowledge of the CPA, the relevance of using the CPA to assess individual
capability, and whether the outcomes of this assessment are consistent and
equivalent for candidates from diverse backgrounds.
Background
A career spans an individual’s entire working life and includes behaviour and
attitudes toward work. A career develops in accordance with these attitudes and
behaviours (Stair, 1980). The work environment changes continuously and
employees thus need to have the ability to adapt to these changes.
Peter Drucker (in Kao, Lee & Kuo, 1997) once stated that the probability of
making the right job choice in the beginning is roughly one in a million. The
implication of this statement is that a career path must be carefully selected. It
must be psychologically and financially satisfying for the person in order to
UUnniivveerrssiittyy ooff PPrreettoorriiaa eettdd ––KKiittcchhiinngg,, JJ ((22000055))

35
provide work satisfaction. Appropriate job selection and career planning thus
largely determine successful career development. Robbins (in Kao et al., 1996)
asserts that information regarding career options and opportunities must be
available before individuals can begin setting realistic career goals. In carrying
out a CPA, CPA practitioners, test users and organisations attempt to identify the
career path for individuals intending to enter a certain profession and those who
are already in a profession. Individuals also change constantly and, thus, view
their careers differently at different stages of their lives.
Undoubtedly, changing economic and organisational structural conditions have a
strong impact on human resource management, particularly on career planning
and management (CPM) systems (Baruch, 1999). Human resource managers
face the challenge of managing people in an increasingly volatile business
environment. CPM practices need to incorporate the changing reality of careers
and reflect emerging organisational structures and changing environmental
conditions. This new environment will demand a re-thinking of training and
development practices. There is a need for a new type of human resource
function in this emerging economic era. A more collaborative, symbiotic
relationship between workers and organisations may be necessary (Von Hippel
et al., in Kelly, Brannick, Hulpke, Levine & To, 2003). Human resources is
simultaneously attempting to position organisations and employees so that they
are able to respond flexibly to market changes, while seeking stability by
recruiting, developing and retaining people whose talents are critical to the firm
(Rousseau & Arthur, in Kelly et al., 2003).
It is clear from the literature that organisations place high value on measurement
outcomes, which are based on selection, recruitment, promotions, career paths,
employee development, and so on. It is therefore imperative for assessment
devices to be fair and culturally unbiased, as these factors impact on a
candidate’s predicted potential and capabilities.
UUnniivveerrssiittyy ooff PPrreettoorriiaa eettdd ––KKiittcchhiinngg,, JJ ((22000055))

36
This study focuses on the CPA, which measures current capability, decision-
making style and the potential capability of a candidate. It also comes to a view
about how capacity is likely to grow in the future, and about how the person
prefers to reach out, gather and interpret information as a prelude to making a
decision (Mauer, 2000).
The Stratified Systems Theory (SST), as expressed by Elliot Jaques (1970, 1976,
1978), forms the basis for the Matrix of Work Theory (MOW), upon which the CPA
is based. Jaques’ (1992) work looked at the relationship between discretion,
judgment and experience. He defined work as the exercise of discretion and
judgment in decision making in carrying out tasks; it is driven by values and brings
skilled knowledge into play (Jaques & Cason,1994). They also looked at the
differences in capability of the various individuals, specifically how this capability
may be developed over time.
Jaques (1986, 1990, 1992) believed that an individual’s contribution to work
could be measured in terms of the completion time of the longest task assigned
to that role. He was confident that this maximum time was a direct indication of
the level of work; he referred to this as the time span of discretion (Jaques,
1996). The model identifies seven levels of work, differentiated on the basis of
complexity and time span of decision making. The longer the time span, the
higher the level of work and the greater the responsibility associated with that
role (Jaques, 1986). Each level has a specific value-adding theme, which
provides a unique contribution to the flow of work within organisations (Oliver,
1999).
The Matrix of Working Relationships Model (hereinafter referred to as MOW)
explores the relationship between an individual at work, the organisation and the
environment within which the organisation needs to function; it is based on the
SST (Jaques 1970, 1978, 1986, 1990, 1992). This model, developed by Gillian
Stamp, defines the levels of work as referred to in the CPA, together with the
UUnniivveerrssiittyy ooff PPrreettoorriiaa eettdd ––KKiittcchhiinngg,, JJ ((22000055))

37
required levels of capability required to cope with work at the various levels
(Jaques, 1978; Stamp, 1978).
Stamp worked under the assumption that as an individual’s responsibilities
increase, so too does the complexity of the job (Jaques, 1978). In the context of
the CPA, it essentially explores the decision-making complexity with which an
individual is comfortable.
The CPA is used by companies worldwide, including blue chip companies in
South Africa (Ashton, 2000). According to the Employment Equity Act (Act 55 of
1998), assessment devices may only be used if they can be shown to be
scientifically reliable, valid, unbiased and fair. Previous research on the CPA was
based on the reliability, validity and bias, but no empirical evidence exists to
establish whether or not it is a cultural unbiased measuring instrument. Culturally
unbiased measuring instruments are essential in a diverse country such as South
Africa. The concept of culture looms large in the world these days. Although the
term is difficult to define, the essence of culture is a reminder to institutions and
individuals that there are other ethnic groups in the world (Austin, 1999).
Cultural bias is one of the more problematic and thorny issues that must be
attended to in terms of local labour legislation (Mauer, 2000). Bias exists in many
instruments and it is therefore important to look for any forms of bias that might
exist. Three types that are common are cultural bias, linguistic bias and
socioeconomic bias (Fair Test, in Wilde & West, 1996). This study focuses on
cultural bias, as corporate South Africa is becoming more diverse and inclusive
of all race groups, which challenges the dominant management paradigm
(Booysen, 2001).
Ensuring unbiased outcomes should be a priority of any selection strategy where
attempts are being made to rectify past practices that have had a discriminatory
effect on certain sectors of the population. The South African Employment Equity
UUnniivveerrssiittyy ooff PPrreettoorriiaa eettdd ––KKiittcchhiinngg,, JJ ((22000055))

38
Act (Act 55 of 1998) awards priority to the issue of group representivity in
employment outcomes and ensures equal representation in all occupational
categories and levels in the workplace (Mdladlana, 2001).
There is an increasing pressure on test developers and test users to ensure fair
and unbiased testing practices. In terms of South African legislation, only
psychometric tests and similar instruments, of which the validity and reliability
have been proved scientifically and which are not biased against any employee
or group, may be used (Employment Equity Act [Act 55 of 1998]).
The Employment Equity Act (Act 55 of 1998) states that all employers should
take steps to promote equal opportunities in the workplace and to eliminate unfair
discrimination. Selection represents a fundamental activity and business
consideration within an organisation, because correct placement can add a
dynamic, productive member to the existing work team, who can then contribute
to the growth and prosperity of the organisation (Booysen & Theron, 1996; Rynes
& Connerley, 1993; Sunter, 1997). The requirement is that all the techniques
used during a selection and assessment process should respect cultural diversity
and make accurate predictions for members of different population groups.
In light of the challenges posed by multicultural assessment, it is important for the
CPA not to be culturally biased. It is also important to remember that
psychometric concepts such as validity, reliability, bias and fairness are not cast
in stone; rather, they evolve as test theory and testing practices develop
(Huysamen, 2002).
It is necessary for the CPA to be an objective measuring instrument that can be
applied on all people from different races and genders. The aim of this study is to
scientifically prove that the measurement outcome of the CPA is equivalent and
unbiased for employees from diverse cultural backgrounds.
UUnniivveerrssiittyy ooff PPrreettoorriiaa eettdd ––KKiittcchhiinngg,, JJ ((22000055))

39
The following nil-hypotheses were formulated:
Nil-hypothesis 1:
There are no significant differences between gender, population group and
occupation level on current level of capability measurements (assessments)
using the Career Path Appreciation.
Nil-hypothesis 2:
There are no significant differences between gender, population group and
occupation level on mode measurements (assessments) using the Career Path
Appreciation.
Nil-hypothesis 3:
There are no significant differences between gender, population group and
occupation level on decision-making style measurements (assessments)
using the Career Path Appreciation.
METHOD
Sample
Bioss Southern Africa, the test distributors of the CPA, maintain a database of all
assessments that have been conducted over the years. From this database non-
probability convenience sampling was used to select individuals who had been
assessed by means of the CPA in the previous five years. The sample consisted
of 4 606 respondents. The sample included employees from the banking,
insurance and motor industries. The sample’s biographical information is given in
table 1.
UUnniivveerrssiittyy ooff PPrreettoorriiaa eettdd ––KKiittcchhiinngg,, JJ ((22000055))

40
Frequency Percent Valid Percent Cumulative Percent
POPULATION GROUPS Asian 295 6.4 6.4 6.4 Afican / Black 1284 27.9 27.9 34.3 Coloured 159 3.5 3.5 37.7 W hite 2868 62.3 62.3 100.0 Total 4606 100.0 100.0
GENDER Male 3615 78.5 78.5 78.5 Female 991 21.5 21.5 100.0 Total 4606 100.0 100.0
AGE GROUPS 20-25 290 6.3 6.3 6.3 26-34 2013 43.7 43.7 50.0 35-45 1672 36.3 36.3 86.3 46+ 631 13.7 13.7 100.0 Total 4606 100.0 100.0
EDUCATION Primary 8 0.2 0.2 0.2 Secondary 1326 28.8 28.8 29.0 Tertiary 1830 39.7 39.7 68.7 Postgraduate 1442 31.3 31.3 100.0 Total 4606 100.0 100.0
OCCUPATION Unskilled 10 0.2 0.2 0.2 Semi skilled 23 0.5 0.5 0.7 Skilled 1675 36.4 36.4 37.1 Jnr management 446 9.7 9.7 46.8 Middle management 1304 28.3 28.3 75.1 Snr management 1148 24.9 24.9 100.0 Total 4606 100.0 100.0
BIOGRAPHICAL INFORMATION OF RESPONDENTSTABLE 1
The sample comprised the following respondents: 1% unskilled, 1% semi-skilled,
36% skilled, 10% junior management, 28% middle management and 25% senior
management. The sample included 78% males and 22% females. Most
participants (44%) were between the ages of 26 and 34 and had tertiary
qualifications. Although the population groups were unequally distributed in the
data, the possibility of carrying out a meaningful analysis still exists.
UUnniivveerrssiittyy ooff PPrreettoorriiaa eettdd ––KKiittcchhiinngg,, JJ ((22000055))

41
Measuring instrument
Career Path Appreciation (CPA) is a one-on-one interview that allows a trained
practitioner to arrive, in two to three hours, at a view about a person's current and
likely future capability to make effective decisions.
An appreciation consists of three parts, namely
• nine sets of phrase cards
• a symbol card task
• a career history interview
While there is no prescribed order in which these tasks are presented, it is
customary to begin with the phrase cards, followed by the symbol cards and the
career history interview.
Phrase cards
There are nine sets of six phrase cards that are used as triggers to elicit the way
the respondents approach their work. The respondent is then asked to choose
the cards he or she feels best reflects the way he or she would approach his or
her work. He or she then discusses his or her choices and gives examples to
illustrate his or her choices. This enables the practitioner to gain information
about the individual’s current level of capability in relation to the current level of
work expected of that person, as well as the likely rate of growth of the
individual’s capability (Stamp, 1981).
Symbol cards
The symbol card task requires that an individual be given the task to work out a
predetermined rule for sorting a pack of cards of different colours, shapes,
numbers and sizes with minimal instructions. The purpose of this exercise is to
observe the individual’s process of defining the task, generating alternative
courses of action, handling uncertainty and reaching a solution. This task will
enable the CPA practitioner to gain more insight into the candidate’s current level
UUnniivveerrssiittyy ooff PPrreettoorriiaa eettdd ––KKiittcchhiinngg,, JJ ((22000055))
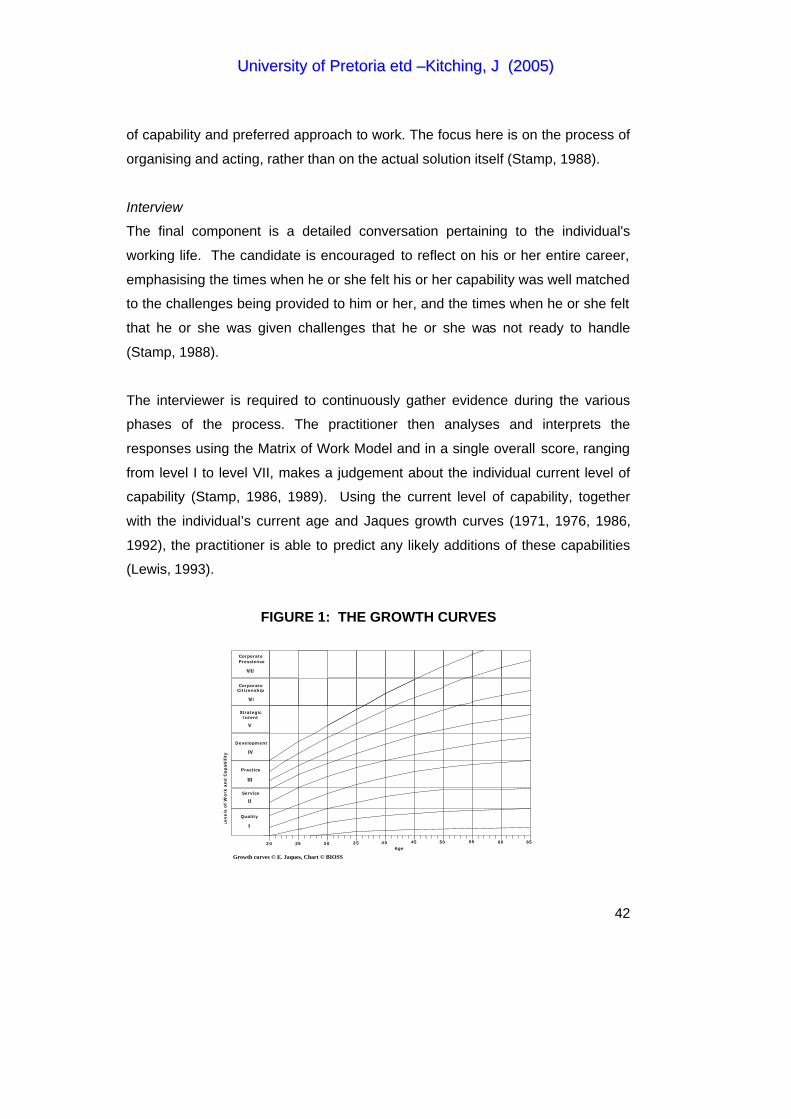
42
of capability and preferred approach to work. The focus here is on the process of
organising and acting, rather than on the actual solution itself (Stamp, 1988).
Interview
The final component is a detailed conversation pertaining to the individual's
working life. The candidate is encouraged to reflect on his or her entire career,
emphasising the times when he or she felt his or her capability was well matched
to the challenges being provided to him or her, and the times when he or she felt
that he or she was given challenges that he or she was not ready to handle
(Stamp, 1988).
The interviewer is required to continuously gather evidence during the various
phases of the process. The practitioner then analyses and interprets the
responses using the Matrix of Work Model and in a single overall score, ranging
from level I to level VII, makes a judgement about the individual current level of
capability (Stamp, 1986, 1989). Using the current level of capability, together
with the individual’s current age and Jaques growth curves (1971, 1976, 1986,
1992), the practitioner is able to predict any likely additions of these capabilities
(Lewis, 1993).
FIGURE 1: THE GROWTH CURVES
VII
VI
V
IV
III
II
I
Growth curves © E. Jaques, Chart © BIOSS
20 25 30 35 40 45 50 55 60 65 Age
Corporate
Corporate
Strategic
Development
Practice
Service
Quality
Prescience
Citizenship
Intent
VII
VI
V
IV
III
II
I
Levels
of
Wo
rk a
nd
Cap
ab
ilit
y
UUnniivveerrssiittyy ooff PPrreettoorriiaa eettdd ––KKiittcchhiinngg,, JJ ((22000055))

43
The growth curves as illustrated in figure 1 are used to calculate the predicted
growth of individuals. Band termed modes represent these growth trends. The
mode gives an indication of the maximum point of development in that current
work level, that is, where the individual will offer his or her best contribution. By
using mode, organisations are able to track the movement of individuals as they
develop and grow through the various levels of complexity.
The style gives an indication of the individual's preferred approach to gathering
and arranging information in preparation for making a decision. Five different
styles, as demonstrated in table 2, have been identified.
TYPE DEFFINITION
A Constantly in touch with the work, paying close attention to the details and beingthoroughly engrossed in finishing one thing at a time. Here people prefer to useknowledge in action that does not need to be put into words.
B Like to move towards completing a task by getting a “view” for what is happeningand not being tied down until they have a chance to analyse the data they havecollected.
C Very good at harnessing the ideas and strengths of those reporting to them, as wellas creating a context for their work.
D Use ideas and concepts to filter experiences. They are likely to emphasise detail,abstract analysis in coming to a decision and may be viewed as someone who takesa conceptual approach to work.
E Tend to rely on as little immediate experience as possible, to look for what is unusual in any situation and to create knowledge in reflection that touches lightly on directexperience. Some of their reasoning may be difficult for them to verbalise.
TABLE 2DECISION-MAKING STYLES
The CPA, in a study conducted in the US Army, yielded an acceptable inter-rater
reliability coefficient ranging between 0.79 and 0.81 (Lewis, 1993). Other
researchers have found construct validity coefficients of 0.57 and 0.51 between
CPA ratings and two different thinking skill measures (Mauer, 2000). In two in-
company studies, concurrent validity coefficients of 0.71 and 0.79 were found
(Stamp, in Mauer, 2000). A coefficient of 0.89 was found between predicted level
UUnniivveerrssiittyy ooff PPrreettoorriiaa eettdd ––KKiittcchhiinngg,, JJ ((22000055))

44
and level of attainment (Stamp, 1989). No differences were found between race
and gender on CPA scores in a South African study of 486 managers (Mauer,
1997). Cultural bias is one of the more problematic issues that needs attention.
Procedures
A database of approximately 29 000 respondents was provided by Bioss
Southern Africa. Only data with CPA scores was used in this study. All duplicate
entries and missing values were removed by means of excel formulas. The excel
spreadsheet was imported onto the SPSS (Statistical Programme for Social
Science) and analyses were performed to identify outliers. The necessary
outliers were removed. A total of 4 606 entries were used for further analysis. All
scales used in variance analysis were standardised to a six-point scale by means
of SAS software (SAS Institute, 1996) in order to perform meaningful
comparisons.
Statistical analysis
The data was analysed in collaboration with the Statistical Consultation Services
of the University of Pretoria, STATOMET, using the SAS-package (SAS Institute,
1996) and SPSS.
Analysis of variance (ANOVA) was used to compare CPA outcomes (mode,
current level of capability and style) between race, gender and population
groups. All scales used during ANOVA analyses were transformed to a six-point
scale for making comparisons and to comply with homogeneity of variance and
normality of ANOVAs. To indicate which variables differ significantly, the post hoc
test of Scheffé was applied. Pearson correlations were used to specify the
relationship between variables. The SPSS software package was used for
calculating the correlations. Due to the type of data used, limited forms of
statistical analysis were used.
UUnniivveerrssiittyy ooff PPrreettoorriiaa eettdd ––KKiittcchhiinngg,, JJ ((22000055))

45
RESULTS
ANOVAs were performed on the standardised six-point scales using age,
occupation level, gender and population group as the dependent variables.
P-ValueAGE (Years) N Mean Std Dev Mean Std Dev Mean Std Dev20-25 290 1.07 a 0.44 2.88 a 0.66 1.19 a 1.1826-35 2013 1.58 b 0.52 2.82 ab 0.77 1.21 a 1.1436-45 1672 1.93 c 0.6 2.56 b 0.88 1.17 a 1.0446+ 631 2.07 c 0.68 2.34 b 0.89 1.23 a 1.17
** = Significant at the 1% level* = Significant at the 5% levela,b,c = Multiple comparisons: Means with common characteristics do not differ significantly Interpret colomn wise
AGE CATEGORIES
Capability
TABLE 3AANOVA RESULTS OF ASSESSMENT SCORES COMPARED BETWEEN
<.0001** <.0001** 0.2425
DIMENSIONSMode Style
Significant differences were found between the various age categories for current
level of capability (p<0.0001) and mode (predicted level of capability) (p<0.0001).
From the research, it is evident that capability can grow with age. This finding
thus confirms the existence of a grow process. No significant differences were
found for decision making style (p=0.2425). Table 3A reflects the noted
differences. Table 3B reflects the significant differences of all the assessment
scores between the various population groups.
P-ValueETHNICITY N Mean Std Dev Mean Std Dev Mean Std DevAsian 295 1.70 ab 0.58 2.75 a 0.90 1.16 ab 1.10Black 1284 1.58 a 0.59 2.66 b 0.79 1.11 a 1.07Coloured 158 1.57 b 0.68 2.54 a 0.92 1.19 b 1.16White 2862 1.83 b 0.62 2.71 a 0.85 1.24 b 1.12
** = Significant at the 1% level* = Significant at the 5% levela,b = Multiple comparisons: Means with common characteristics do not differ significantly Interpret colomn wise
ANOVA RESULTS OF ASSESSMENT SCORES COMPARED BETWEEN
DIMENSIONS
<.0001** 0.0006** 0.0106*
Capability Mode Style
TABLE 3B
POPULATION GROUPS
UUnniivveerrssiittyy ooff PPrreettoorriiaa eettdd ––KKiittcchhiinngg,, JJ ((22000055))
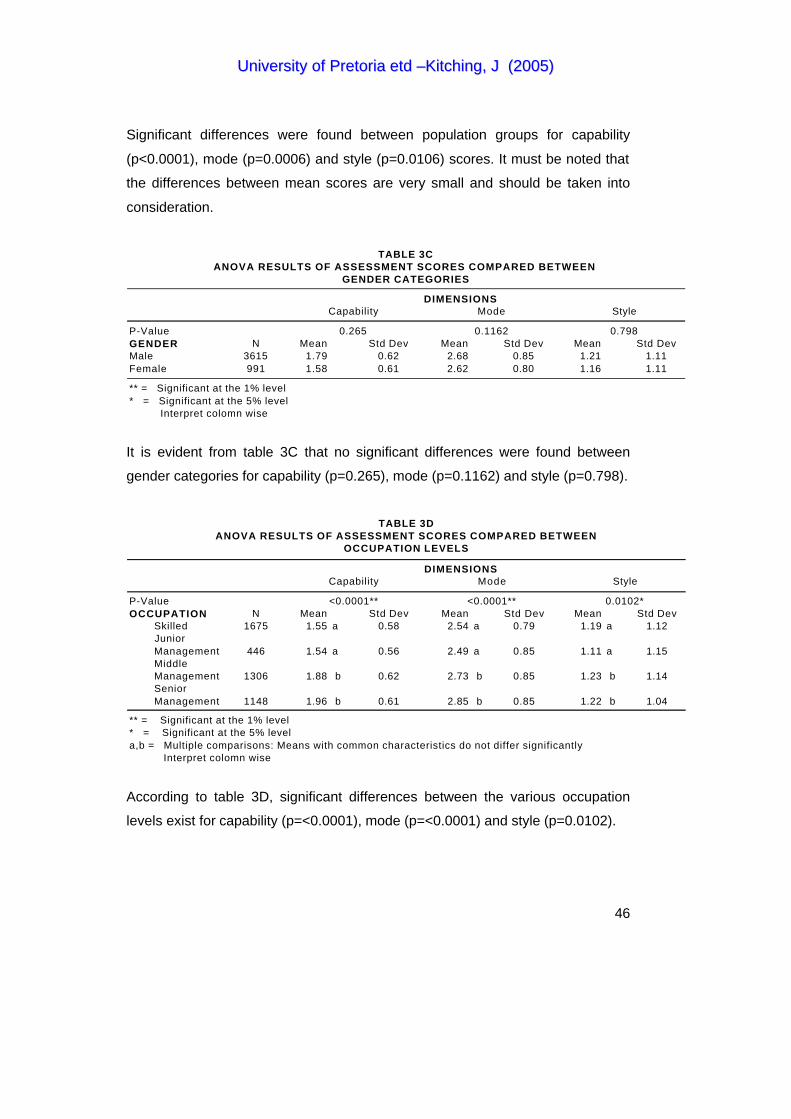
46
Significant differences were found between population groups for capability
(p<0.0001), mode (p=0.0006) and style (p=0.0106) scores. It must be noted that
the differences between mean scores are very small and should be taken into
consideration.
P-ValueGENDER N Mean Std Dev Mean Std Dev Mean Std DevMale 3615 1.79 0.62 2.68 0.85 1.21 1.11Female 991 1.58 0.61 2.62 0.80 1.16 1.11
** = Significant at the 1% level* = Significant at the 5% level Interpret colomn wise
ANOVA RESULTS OF ASSESSMENT SCORES COMPARED BETWEEN TABLE 3C
GENDER CATEGORIES
DIMENSIONSCapability Mode Style
0.265 0.1162 0.798
It is evident from table 3C that no significant differences were found between
gender categories for capability (p=0.265), mode (p=0.1162) and style (p=0.798).
P-ValueOCCUPATION N Mean Std Dev Mean Std Dev Mean Std Dev Skilled 1675 1.55 a 0.58 2.54 a 0.79 1.19 a 1.12 Junior Management 446 1.54 a 0.56 2.49 a 0.85 1.11 a 1.15 Middle Management 1306 1.88 b 0.62 2.73 b 0.85 1.23 b 1.14 Senior Management 1148 1.96 b 0.61 2.85 b 0.85 1.22 b 1.04
** = Significant at the 1% level* = Significant at the 5% levela,b = Multiple comparisons: Means with common characteristics do not differ significantly Interpret colomn wise
ANOVA RESULTS OF ASSESSMENT SCORES COMPARED BETWEENTABLE 3D
OCCUPATION LEVELS
DIMENSIONSCapability Mode Style
<0.0001** <0.0001** 0.0102*
According to table 3D, significant differences between the various occupation
levels exist for capability (p=<0.0001), mode (p=<0.0001) and style (p=0.0102).
UUnniivveerrssiittyy ooff PPrreettoorriiaa eettdd ––KKiittcchhiinngg,, JJ ((22000055))

47
P-ValueEDUCATION N Mean Std Dev Mean Std Dev Mean Std Dev Secondary 1318 1.55 a 0.57 2.36 a 0.82 1.12 a 1.09 Tertiary 1815 1.72 b 0.61 2.63 b 0.81 1.16 a 1.08 Postgraduate 1434 1.97 c 0.62 2.99 c 0.78 1.33 b 1.16
** = Significant at the 1% level* = Significant at the 5% levela,b.c = Multiple comparisons: Means with common characteristics do not differ significantly Interpret colomn wise
<0.0001** <0.0001** <0.0001**
DIMENSIONSCapability Mode Style
TABLE 3E
EDUCATION LEVELSANOVA RESULTS OF ASSESSMENT SCORES COMPARED BETWEEN
It is all so evident in table 3E that significant differences exist for CPA scores
compared between education levels.
P-ValueETHNICITY GENDER N Mean Std Dev Mean Std Dev Mean Std Dev
Male 233 1.71 ab 0.58 2.73 ab 0.92 1.12 a 1.07Female 62 1.66 ab 0.58 2.83 b 0.79 1.28 a 1.19
Male 996 1.60 a 0.59 2.57 a 0.80 1.11 a 1.06Female 288 1.49 a 0.59 2.54 a 0.76 1.11 a 1.10
Male 119 1.57 ab 0.62 2.47 ab 0.87 1.20 a 1.17Female 40 1.59 b 0.85 2.75 b 1.05 1.15 a 1.14
Male 2267 1.89 b 0.61 2.73 b 0.86 1.27 a 1.12Female 601 1.61 ab 0.60 2.63 a 0.79 1.17 a 1.11
** = Significant at the 1% level* = Significant at the 5% levela,b = Multiple comparisons: Means with common characteristics do not differ significantly Interpret colomn wise
DIMENSIONSCapability Mode Style
ANOVA RESULTS OF ASSESSMENT SCORES COMPARED BETWEEN
Coloured
White
TABLE 3F
POPULATION GROUPS AND GENDER
Asian
Black
0.0048* 0.007** 0.4888
When looking at the CPA scores compared between population groups and
gender (table 3F), significant differences are once again evident for capability
(p=0.0048) and mode (p=0.007). The small differences between mean scores
and sample size must once again be taken into consideration when interpreting
these results. The difference is so small that it has little practical significance.
UUnniivveerrssiittyy ooff PPrreettoorriiaa eettdd ––KKiittcchhiinngg,, JJ ((22000055))

48
Further analysis of variance (ANOVA) was conducted on the CPA dataset to
address the formulated nil-hypothesises. Data with less than 50 entries was
discarded during this analysis. Current level of capability, mode (predicted level
of capability) and decision making style were standardised to a six-point scale
and used as the dependent variables. Occupation level, population group and
gender were used as the independent variables.
From table 4, it is evident that there are significant differences between
population groups for capability, mode and style; the same counts for differences
between occupation levels. Gender reflects only significant differences for
capability.
Capability Mode Style
FACTORPopulation group <0.0001** 0.0023* 0.0001**Gender <0.0001** 0.1405 0.1900Occupation level <0.0001** <0.0001** 0.0055*Population group x Gender 0.0091 0.3695 0.2881Population group x Occupation level 0.5507 0.4130 0.5415Gender x Occupation level 0.8454 0.4476 0.2153Population group x Gender x Occupation level 0.7827 0.4828 0.5639
* = Significant on the 5% level** = Significant on the 1% level
DIMENSIONS (P-values)
TABLE 4RESULTS OF ANOVA COMPARING OCCUPATION LEVEL, GENDER, POPULATION GROUPS AND INTERACTIONS THEREOF BY USING
CURRENT LEVEL OF CAPABILITY, MODE AND STYLE
When looking at the interactions of population group, gender and occupation
levels, no significant differences are found. Thus, all three formulated nil-
hypothesises are supported. There are no significant differences between
gender, population group and occupation level on current level of capability,
mode and decision making style measurements using the CPA (table 4).
Pearson correlations were used to specify the relationship between the various
variables. Tables 5A and 5B reflect these relationships.
UUnniivveerrssiittyy ooff PPrreettoorriiaa eettdd ––KKiittcchhiinngg,, JJ ((22000055))

49
VARIABLES Capability Mode Style AgeCapability 1 0.604** 0.228** 0.364**Mode 0.604** 1 0.240** -0.211**Style 0.228** 0.240** 1 0.004Age 0.364** -0.211** 0.004 1Gender -0.127** -0.014 -0.021 -0.166**Population group 0.151** 0.037* 0.050** 0.175**Education level 0.231** 0.281** 0.073** -0.043**Occupation level 0.269** 0.138** 0.018 0.188**
* Correlation is significant at the 5% level (2-tailed)** Correlation is significant at the 1% level (2-tailed)
VARIABLES Population group Education level Occupation level Gender
Capability 0.151** 0.231** 0.269** -0.127**Mode 0.037* 0.281** 0.138** -0.014Style 0.050** 0.073** 0.018 -0.021Age .0175** -0.043** 0.188** -0.166**Gender -0.012 0.122** -0.011 1Population group 1 -0.081** 0.071** -0.012Education level -0.081** 1 0.151** 0.122**Occupation level 0.071** 0.151** 1 -0.011
* Correlation is significant at the 5% level (2-tailed)** Correlation is significant at the 1% level (2-tailed)
TABLE 5ACORRELATION MATRIX OF VARIABLES
TABLE 5BCORRELATION MATRIX OF VARIABLES
Correlations from 0 – 0.25 indicate little or no relationship, those from 0.25 to
0.50 (or –0.25 to –0.50) indicate a fair degree of relationship, those from 0.50 to
0.75 (or –0.50 to –0.75) a moderate to good relationship, and those greater than
0.75 (or –0.75) a very good to excellent relationship (Dawson & Trapo, 2001). It
is evident that there is a good relationship between current level of capability
(capability) and predicted level of capability (mode) (r=0.604). There is a fair
degree of relationship between capability and style (r=0.228), as well as mode
and style (r=0.240). Gender and population groups seem to reflect no/low
relationships between the CPA measurement scores. Occupation level also
imitates a low to fair relationship between capability (r=0.269) and a little to no
relationship between mode (r=0.138). There is no relationship between style and
occupation level (r=0.018).
UUnniivveerrssiittyy ooff PPrreettoorriiaa eettdd ––KKiittcchhiinngg,, JJ ((22000055))

50
DISCUSSION
The aim of this study was to confirm whether the CPA respects cultural diversity
and to make accurate predictions for members of different population groups and
genders. From the research it is evident that the CPA is used for assessing
capabilities of individuals in organisations and it is, therefore, important for the
instrument to be culturally unbiased.
Capability and mode are related and these variables correlate significantly with
each other. Thus, there is a relationship between the complexities of a person’s
current level of work and the future potential in terms of levels into which one
may grow and make the most contribution to work. Although some significant
correlations were found for gender, population group and occupation level
between all the measurement scores, none of the correlations are strong enough
to state with any certainty that these variables will have an effect on the outcome
of the CPA scores.
There were no statistically significant differences between males and females in
respect of the CPA measurement scores. However, statistically significant
differences were evident in respect of occupational levels, educational levels and
population groups. This evidence may be ambiguous if sample sizes and means
are not considered when interpreting the results. Statistically significant
differences and moderate correlations were evident between age and the CPA
outcomes. These results support previous research findings with regard to the
growth curves. It also implies that as age increases, so too will current and
potential levels of capability.
With such an immense database one is likely to find statistically significant
differences between variables. The differences regarding occupational levels,
educational levels and population groups is of such a limited extent that they
cannot be regarded by any reasonable person as representing a threat to the
integrity of this instrument. The differences are so small that they have no
UUnniivveerrssiittyy ooff PPrreettoorriiaa eettdd ––KKiittcchhiinngg,, JJ ((22000055))

51
practical significance. It is also advised that CPA practitioners study the
interaction effects and not the main effects between variables (Mauer, 2000).
The core subject of this investigation is to ascertain the extent to which the CPA
can be said to be inherently culturally unbiased. The interactions of population
group, gender and occupation level on the CPA measurement scores reflected
no significant differences. There was thus evidence to support all three the
formulated nil-hypothesises. The CPA can be applied to any gender, population
group and occupation level without any effect on the outcome. There is no
reason to believe that this instrument disrespects cultural diversity and that it is in
conflict with assessment standards.
A number of limitations of this study have been identified. First, there was a
disproportionate number of gender, population group, education level and
occupation level respondents in the sample, primarily because non-probability
convenience sampling was used to select individuals who had been assessed by
means of the CPA in the previous five years by Bioss Southern Africa. Future
research should be performed on pre-determined sample groups. Second, the
use of only four organisations as the research sample is a potential limitation on
the generalisability of these results. Attempts should be made to replicate these
analyses in a number of different industries. Third, the results were attained from
a five-year old database and no knowledge of these organisations’ situations and
reasons for administrating the CPA on candidates was obtained. Future studies
may confirm the current findings by replicating the research with a sample known
to the researcher.
In summary, this study makes a contribution to our knowledge of the CPA and
assessment standards used in South Africa. The study evaluates the credibility of
this instrument in terms of legislation and it proves to be a culturally bias-free
instrument.
UUnniivveerrssiittyy ooff PPrreettoorriiaa eettdd ––KKiittcchhiinngg,, JJ ((22000055))

52
REFERENCES
Ashton, L. 2000. Custodian workshop guide using Bioss related technologies.
Version 3. Bioss Southern Africa (Pty) Ltd: Not known
Aston, L. 2000. The CPA (Career Path Appreciation) Training manual. Bioss
Southern Africa (Pty) Ltd: Not known
Austin, J.T. 1999. Culturally Sensitive Career Assessment: A Quandary. [Online]
Available from: http://www.stats.gla.ac.uk/steps/glossary/sampling.html
[Downloaded: 2003-11-10]
Baruch, Y. 1999. Integrated career systems for the 2000s. International Journal
of Manpower, 20(7):432-57.
Booysen, L. 2001. The duality in South African leadership: Afrocentric or
Eurocentric. South African Journal of Labour Relations, 25(3):36-64. Available
from: Emerald: http://www.emeraldinsight.com/ [Accessed: 2003-10-25]
Booysen, M., & Theron, C.C. 1996. Kennisbasisse, gebruikspatrone en
gebruikshindernisse ten opsigte van die riglyne vir die ontwikkeling en validering
van personeelkeuringsprosedures. Tydskrif vir Bedryfsielkunde, 22(2):7-14.
Available from: Emerald: http://www.emeraldinsight.com/ [Accessed: 2003-10-25]
Employment Equity Act 1998. Government Gazette, 55(19370).
Huysamen, G.K. 2002. The relevance of the new APA standards for educational
and psychological testing for employment testing in South Africa. South African
Journal of Industrial Psychology. 32(2). Available from: Emerald:
http://www.emeraldinsight.com/ [Accessed: 2003-10-25]
UUnniivveerrssiittyy ooff PPrreettoorriiaa eettdd ––KKiittcchhiinngg,, JJ ((22000055))

53
Jaques, E. 1970. Learning for Uncertainty in Work Creativity and Social Justice.
London: Heinemann Educational Books Ltd.
Jaques, E. 1976. A General theory of Bureaucracy. Heinemann: London.
Jaques, E. 1978. Levels of Abstraction in Human Action. Heinemann: London.
Jaques, E. 1986. The development of intellectual capability: a Discussion of
Stratified Systems Theory. Journal of Applied Behavioural Science. 85(2):237-
249.
Jaques, E. 1990. In praise of Hierarchy. Harvard Business Review. (Jan-
Feb):127-133.
Jaques, E. 1992. Requisite Organisation. Cason Hall: Arlington.
Jaques, E. 1996. The requisite organization: a total system for effective
managerial organizational and managerial leadership for the 21st century. 2nd ed.
Arlington, VA: Cason Hall.
Jaques, E., & Cason, K. 1994. Human Capability. Cason Hall: Falls Church, VA.
Kao, C., Lee, T., & Kuo, S. 1997. Career paths in industrial management: a
survey of Taiwan's manufacturing industries. Career Development International,
2(4):189-194. Available from: Emerald: http://www.emeraldinsight.com/
[Accessed: 2003-10-25]
Kelly A., Brannick, T., Hulpke,J., Levine,J., & To, M. 2003. Linking organisational
training and development practices with new forms of career structure: a cross-
national exploration. Journal of European Industrial Training 27(2/3/4):160-168.
Available from: Emerald: http://www.emeraldinsight.com/ [Accessed: 2003-10-25]
UUnniivveerrssiittyy ooff PPrreettoorriiaa eettdd ––KKiittcchhiinngg,, JJ ((22000055))

54
Lewis, P. 1993. Career Path Appreciation (CPA) data reduction and analysis: US
Army Research Institute for the Behavioural and Social Sciences.
Mauer, K.F. 1997. Defence of the selection procedure used by the South African
Breweries for executives and Grade G, H, and I Managers. Pretoria: University of
South Africa.
Mauer, K.F. 2000. Degree of compliance of the Career Path Appreciation (CPA)
and the Initial Recruitment Interview Schedule (IRIS) with South African Labour
Legislation. Unpublished paper. Pretoria: Department Industrial Psychology,
University of South Africa.
Mauer, K.F. 2000. Some perspectives on CPA and IRIS research in South Africa.
Paper presented at the Spring School Conference, Maccauvlei, South Africa, 5-6
October 2000.
Mdladlana, M.M.S. 2001. Code of good practice on key aspects of disability in
the workplace. Employment Equity Act No 55 of 1998. [Online] Available from
http://www.labour.gov.za [Downloaded: 2003-10-25]
Oliver, A. 1999. Reflections of work capacity and individual capacity: a
practitioners guide to work theme audits and organizational mapping.
Johannesburg: Brunel Institute for Organizational and Social Sciences.
Republic of South Africa. (1998). Employment Equity Act. No. 55 of 1998.
Government Gazette, No 19370: Pretoria.
Rynes, S.L. & Connerley, M.L. 1993. Applicant reaction to alternative selection
procedures. Journal of business and Psychology, 7(3):261-277.
UUnniivveerrssiittyy ooff PPrreettoorriiaa eettdd ––KKiittcchhiinngg,, JJ ((22000055))

55
Stair, L.B. 1980. Careers in business: selecting and planning your career path:
Richard D. Irwin, Inc: Not known
Stamp, G & Stamp, C. 1993. Well-being at work: aligning purpose, people,
strategies and structures. International Journal of Career Management. 5(3):1-
36.
Stamp, G. 1978 Assessment of Individual Capability. In: E. Jaques. (eds.), Levels
of Abstraction in logic and Human Action. Heinemann: London.
Stamp, G. 1981. Levels and Types of Managerial Capability. Journal of
Management Studies, 18:3.
Stamp, G. 1986. Some Observations on the Career Paths of Women. The
Journal of Applied Behavioural Science. 22(4):385-396.
Stamp, G. 1988. Longitudinal research into methods of assessing managerial
potential. Technical report 819 for US Army: Research Institute for the
Behavioural and Social Sciences.
Stamp, G. 1989. Judgment, discernment, wisdom, imagination: the engines that
drive competence. Unpublished paper.
Stamp, G. 1989. The assessment of managerial potential2: Follow-up of Career
Path Appreciation in practice. Submitted to Administrative Science Quarterly.
Sunter, C. 1997. What it really takes to be world class. Tafelberg: Human &
Rousseau.
Wilde, J., & West, E.A.C., 1996. Assessment Strategies For Professional
Development Activities. [Online] Available from
UUnniivveerrssiittyy ooff PPrreettoorriiaa eettdd ––KKiittcchhiinngg,, JJ ((22000055))

56
http://www.ncela.gwu.edu/miscpubs/eacwest/profdev/part3.htm [Downloaded:
2003-10-25]
UUnniivveerrssiittyy ooff PPrreettoorriiaa eettdd ––KKiittcchhiinngg,, JJ ((22000055))

57
BIBLIOGRAPHY
Abrahams, F. 1994. The cross-cultural comparability of personality tests in South
Africa: Is it possible? Paper presented at the Congress of Psychometrics,
Johannesburg
American Educational Research Association. 1999. Standards for educational
and psychological tests. Washington, D.C.: Not known
Anastasi, A. & Urbina, S. 1997. Psychological testing. 7th ed. Upper Saddle
River, NJ: Prentice-Hall.
Annenberg, Anon. 2003. Bias in measurement: testing your measurement bias.
[Online] Available from:
http://www.learner.org/channel/courses/learningmath/data/session1/part_c/testin
g.html [Downloaded: 2003-10-25].
Ashton, L. 2000. Custodian workshop guide using Bioss-related technologies.
Version 3. Bioss Southern Africa (Pty) Ltd: Not known
Ashton, L. 2000. The CPA (Career Path Appreciation) training manual. Bioss
Southern Africa (Pty) Ltd.: Not known
Austin, J.T. 1999. Culturally sensitive career assessment: a quandary. ERIC
Digest 210 [Online] Available from:
http://www.stats.gla.ac.uk/steps/glossary/sampling.html [Downloaded: 2003-11-
10].
Baker, J. & Stamp, G. 1990. Identifying individual potential: career path
appreciation as a cost effective alternative to assessment centres. Guidance and
Assessment Review, 6(3):3-6.
UUnniivveerrssiittyy ooff PPrreettoorriiaa eettdd ––KKiittcchhiinngg,, JJ ((22000055))

58
Baruch, Y. 1999. Integrated career systems for the 2000s. International Journal
of Manpower, 20(7):432-57.
Bauer, T.N., Maertz (Jr), C.P., Dolen, M.R. & Campion, M.A. 1998. Longitudinal
assessment of applicant reactions to employment testing and test outcome
feedback. Journal of Applied Psychology, 83(6):892-903. Available from:
http://www.emeraldinsight.com [Accessed: 2003-10-25].
Bedell, B., Van Eeden, R. & Van Staden, E. Not dated. Culture as moderator
variable in psychometrical test performance: issues and trends in South Africa.
Department of Psychology, University of South Africa. Available from:
http://www.emeraldinsight.com [Accessed: 2003-10-25].
Bluen, S. 1995. Psychological assessment validation study. Johannesburg:
South African Breweries.
Booysen, L. 2001. The duality in South African leadership: Afrocentric or
Eurocentric. South African Journal of Labour Relations, 25(3):36-64. Available
from: http://www.emeraldinsight.com [Accessed: 2003-10-25].
Booysen, M. & Theron, C.C. 1996. Kennisbasisse, gebruikspatrone en
gebruikshindernisse ten opsigte van die riglyne vir die ontwikkeling en validering
van personeelkeuringsprosedures. Tydskrif vir Bedryfsielkunde, 22(2):7-14.
Available from: http://www.emeraldinsight.com [Accessed: 2003-10-25].
Cappelli, P. 1999. Career jobs are dead. California Management Review,
42(1):146-67.
Cappelli, P. 2000. A market-driven approach to retaining talent. Harvard
Business Review , 78(1):103-11.
UUnniivveerrssiittyy ooff PPrreettoorriiaa eettdd ––KKiittcchhiinngg,, JJ ((22000055))

59
Career Path Counseling Service. 1999. [Online] Available from
http://www.islandnet.com/careerpathadventures/about/cp_description.html
[Downloaded: 2004-03-28].
Cascio, W. F. 1998 Applied Psychology in Human Resource Management. Fifth
Edition. Upper Saddle River, New Jersey: Prentice Hall.
Cascio, W.F. 1997. Applied psychology in human resource management.
Englewood Cliffs, NJ: Prentice Hall.
Coetzee, M., & Schreuder, A.M.G. 2002. The relationship between career
patterns and personality types. South African Journal of Industrial Psychology,
28(1):53-59.
Collin, A. & Young, R.A. 1986. New direction for theories of career. Human
Relations, 39:837-53. [Online] Available from: http://www.emeraldinsight.com
[Accessed: 2003-10-25].
Collin, A. 1998. New challenges in the study of career. Personnel Review,
27(5):412-425. [Online] Available from: http://www.emeraldinsight.com
[Accessed: 2003-10-25].
Cripe, E.J. & Mansfield, R.S. 2002. The value-added employee: 31 competencies
to make yourself irresistible to any company. 2nd ed. Not known: Butterworth-
Heinemann.
Critten, P. 1993. Investing in people: towards corporate capability. Oxford:
Butterworth-Heinemann.
UUnniivveerrssiittyy ooff PPrreettoorriiaa eettdd ––KKiittcchhiinngg,, JJ ((22000055))

60
Davis, B. 2000. Career pathing. [Online] Available from
http://www.lmasystems.com/Articles/LMACareerPathing.htm [Downloaded: 2003-
10-25].
De Jong, A. & Visser, D. 2000. Black and white employees’ fairness perception
of personnel selection techniques. South African Journal of Industrial
Psychology, 30(4). [Online] Available from: http://www.emeraldinsight.com
[Accessed: 2003-10-25].
EDAC (Executive Development Assessment Centre). 2000. The MCPA training
manual. [Online] Available from http://edacen.com [Accessed: 2003-11-10].
Gatherer, J., De Kock, F., Adams, M., & Theunissen, P. 1992. An investigative
study into the potential use of career path appreciation as a predictor of
university student success. Unpublished paper.
Graham, J.R. & Lilly, R.S. 1984. Psychological testing. Englewood Cliffs, NJ:
Prentice-Hall.
Gregory, R.J. 1996. Psychological testing: History, principles and applications.
2nd ed. Boston: Allyn & Bacon.
Huysamen, G.K. 1996. Fair and unbiased admission procedures for South
African institutions of higher education. South African Journal of Higher
Education, 10(2):199-207. [Online] Available from:
http://www.emeraldinsight.com [Accessed: 2003-10-25].
Huysamen, G.K. 2002. The relevance of the new APA standards for educational
and psychological testing for employment testing in South Africa. South African
Journal of Industrial Psychology. 32(2). [Online] Available from:
http://www.emeraldinsight.com [Accessed: 2003-10-25].
UUnniivveerrssiittyy ooff PPrreettoorriiaa eettdd ––KKiittcchhiinngg,, JJ ((22000055))

61
Isaac, D.J. & O’Conner, B.M. 1969. Experimental treatment of discontinuity
theory of human development. Human Relations, 22(5):427-455.
Jacobs, T.O. 2003. Attributes relating to senior officer effectiveness. Unpublished
paper.
Jacobson, J. 1996. Assessing employees. Human Resource Management,
12(3):28-31.
Jaques, E. & Cason, K. 1994. Human capability. Arlington, VA: Cason Hall.
Jaques, E. 1970. Learning for uncertainty in work creativity and social justice.
London: Heinemann.
Jaques, E. 1976. A general theory of bureaucracy. London: Heinemann.
Jaques, E. 1978. Levels of abstraction in human action. London: Heinemann.
Jaques, E. 1986. The development of intellectual capability: a discussion of
Stratified Systems Theory. Journal of Applied Behavioural Science, 85(2):237-
249.
Jaques, E. 1990. In praise of hierarchy. Harvard Business Review, (Jan-
Feb):127-133.
Jaques, E. 1992. Requisite organisation. Arlington, VA: Cason Hall.
Jaques, E. 1996. The requisite organization: a total system for effective
managerial organizational and managerial leadership for the 21st century. 2nd ed.
Arlington, VA: Cason Hall.
UUnniivveerrssiittyy ooff PPrreettoorriiaa eettdd ––KKiittcchhiinngg,, JJ ((22000055))

62
Kao, C., Lee, T. & Kuo, S. 1997. Career paths in industrial management: a
survey of Taiwan's manufacturing industries. Career Development International,
2(4):189-194. [Online] Available from: http://www.emeraldinsight.com [Accessed:
2003-10-25].
Kelly A., Brannick, T., Hulpke,J., Levine,J. & To, M. 2003. Linking organisational
training and development practices with new forms of career structure: a cross-
national exploration. Journal of European Industrial Training, 27(2/3/4):160-168.
[Online] Available from: http://www.emeraldinsight.com [Accessed: 2003-10-25].
Lewis, P. 1993. Career Path Appreciation (CPA) data reduction and analysis. US
Army Research Institute for the Behavioural and Social Sciences.
Martocchio, J.J. & Whitener, E.M. 1992. Fairness in personnel selection: a meta-
analysis and policy implications. Human Relations, 45(5):489-506.
Mauer, K.F. 1997. Defence of the selection procedure used by the South African
Breweries for executives and Grade G, H, and I Managers. Pretoria: University of
South Africa.
Mauer, K.F. 2000a. Degree of compliance of the Career Path Appreciation (CPA)
and the Initial Recruitment Interview Schedule (IRIS) with South African Labour
Legislation. Unpublished paper. Pretoria: Department Industrial Psychology,
University of South Africa.
Mauer, K.F. 2000b. Some perspectives on CPA and IRIS research in South
Africa. Paper presented at the Spring School Conference, Maccauvlei, South
Africa, 5-6 October 2000.
McIntyre, R.M., Yanusefski, A.M. & Hamil, L. 1994. Toward a theory of
leadership: the place of cognitive skills. Norfolk: Old Dominion University.
UUnniivveerrssiittyy ooff PPrreettoorriiaa eettdd ––KKiittcchhiinngg,, JJ ((22000055))

63
Mdladlana, M.M.S. 2001. Code of good practice on key aspects of disability in
the workplace. Employment Equity Act No 55 of 1998. [Online] Available from
http://www.labour.gov.za [Downloaded: 2003-10-25].
Meyer, J.C., & Braxton, W.T.F. 2002. ‘n vergelyking tussen die
prestasiemotiveringsvlakke van verskillende rasse en geslagsgroepe. Suid
Afrikaanse Tydskrif vir Bedryfsielkunde, 28(3):62-68.
Mushayandebvu, A. 1991. An inter-rater reliability investigation of Career Path
Appreciations done at Debswana Jwaneng Mine. Unpublished paper. Jwaneng,
Botswana.
Nell, V. 1997. Science and politics meet at last: The insurance industry and
neuropsychological norms. South African Journal of Psychology, 27:43-49.
Neuman, WL. 1997. Social research methods. Qualitative and quantitative
approaches. 3rd ed. Boston: Allyn and Bacon.
Noble, H. 2002. Relationship between the Career Path Appreciation (CPA) and
Initial Recruitment Interview Schedule (IRIS). Unpublished MCom dissertation.
Pretoria: University of Pretoria.
Oliver, A. 1999. Reflections of work capacity and individual capacity: a
practitioners guide to work theme audits and organizational mapping.
Johannesburg: Brunel Institute for Organizational and Social Sciences.
Pathways. Not dated. Career assessments. [Online] Available from
http://cougar.slvhs.slv.k12.ca.us/counseling/pathways.htm [Downloaded: 2003-
11-10].
UUnniivveerrssiittyy ooff PPrreettoorriiaa eettdd ––KKiittcchhiinngg,, JJ ((22000055))

64
Percival, G., Crous, F., & Schepers, J.M. 2003. Cognitive potential and job
complexity as predictors of flow. South African Journal of Industrial Psychology,
29(2):60-71
Poortinga, Y.H. & Van der Flier, H. 1988. The meaning of item bias in ability
tests. In: S.H. Irvine & J.W. Berry (eds.) Human abilities in cultural context.
Cambridge: Cambridge University Press.
Republic of South Africa. (1995). Labour Relations Act, No. 66 of 1995.
Government Gazette, No. 16861. Cape Town
Republic of South Africa. 1998. Employment Equity Act. No. 55 of 1998.
Government Gazette, No 19370: Pretoria.
Robertson, L.T., Iles, P.A., Gratton, L. & Sharpley, D. 1991. The impact of
personnel selection and assessment methods on candidates. Human Relations,
44(9):963-982. [Online] Available from: http://www.emeraldinsight.com
[Accessed: 2003-10-25].
Rossan, S. & Topham, D. 1996. The assessment of capability: The reliability and
validity of CPA as a means of assessment (4th draft). Unpublished paper.
Rutter, B.G. & Donelson, T.H. 2000. Measuring the impact of cultural variances
on product design. [Online] Available from
http://www.devicelink.com/mddi/archive/00/10/003.html [Downloaded: 2003-10-
25].
Rynes, S.L. & Connerley, M.L. 1993. Applicant reaction to alternative selection
procedures. Journal of Business and Psychology, 7(3):261-277.
UUnniivveerrssiittyy ooff PPrreettoorriiaa eettdd ––KKiittcchhiinngg,, JJ ((22000055))

65
Snelgar, RJ. & Potgieter, T. 2003. An exploratory study of group adverse impact
in a recruitment and selection strategy. SAJEMS NS, 6(1). Department of
Industrial and Organizational Psychology, University of Port Elizabeth. [Online]
Available from: http://www.emeraldinsight.com [Accessed: 2003-10-25].
Spangenberg, H.H., & Theron, C.C. 2003. Validation of the high performance
leadership competencies as measured by an assessment centre in-basket.
South African Journal of Industrial Psychology, 29(2):29-38
Stair, L.B. 1980. Careers in business: selecting and planning your career path.
Richard D. Irwin, Inc: Not known
Stamp, G. & Stamp, C. 1993. Well-being at work: aligning purpose, people,
strategies and structures. International Journal of Career Management. 5(3):1-
36.
Stamp, G. 1978. Assessment of individual capability. In: E. Jaques. (ed.) Levels
of abstraction in logic and human action. London: Heinemann.
Stamp, G. 1981. Levels and types of managerial capability. Journal of
Management Studies, 18:3.
Stamp, G. 1986. Some observations on the career paths of women. The Journal
of Applied Behavioural Science. 22(4):385-396.
Stamp, G. 1988. Longitudinal research into methods of assessing managerial
potential. Technical report 819 for US Army: Research Institute for the
Behavioural and Social Sciences.
Stamp, G. 1989. Judgment, discernment, wisdom, imagination: the engines that
drive competence. Unpublished paper.
UUnniivveerrssiittyy ooff PPrreettoorriiaa eettdd ––KKiittcchhiinngg,, JJ ((22000055))

66
Stamp, G. 1989. The assessment of managerial potential2: Follow-up of Career
Path Appreciation in practice. Submitted to Administrative Science Quarterly.
Stamp, G. 1993. Essence of levels of work. Unpublished paper.
Stamp, G. 1994. Management development. Entry for the International
Encyclopedia of Business and Management.
Stamp, G. 2001. Elliot Jaques: IEBM handbook of management thinking.
International Thomson Business Press: Not known
Stamp, G. 2001. The four journeys of the leader. Unpublished paper.
Stamp, G., & Baker, J. 1990. Identifying Individual potential: Career Path
Appreciation as a cost-effective alternative to assessment centres. Guidance and
Assessment Review, 6(3):3-6.
Sunter, C. 1997. What it really takes to be world class. Tafelberg: Human &
Rousseau
Taylor, J.M. & Radford, E.J. 1986. Psychometric testing as an unfair labour
practice. South African Journal of Psychology, 16:79-86. [Online] Available from:
http://www.emeraldinsight.com [Accessed: 2003-10-25].
Taylor, T.R. 1994. A review of three approaches to cognitive assessment, and a
proposed integrated approach based on a unifying theoretical framework. South
African Journal of Psychology, 24:184-191. [Online] Available from:
http://www.emeraldinsight.com [Accessed: 2003-10-25].
UUnniivveerrssiittyy ooff PPrreettoorriiaa eettdd ––KKiittcchhiinngg,, JJ ((22000055))

67
Van der Merwe, R.P. 2002. Psychometric testing and human resource
management. South African Journal of Industrial Psychology. 28(2):77-86.
[Online] Available from: http://www.emeraldinsight.com/ [Accessed: 2003-10-25].
Van Wyk, R., Boshoff, A.B., & Bester, C.L. 2003. Possible cognitive processes
underlying competency assessment. South African Journal of Industrial
Psychology, 29(3):45-52.
Wilde, J. & West, E.A.C. 1996. Assessment strategies for professional
development activities. [Online] Available from
http://www.ncela.gwu.edu/miscpubs/eacwest/profdev/part3.htm [Downloaded:
2003-10-25].
UUnniivveerrssiittyy ooff PPrreettoorriiaa eettdd ––KKiittcchhiinngg,, JJ ((22000055))