university of malayastudentsrepo.um.edu.my/7823/5/bardia_yousefi_kgl100003.pdf · research report...
TRANSCRIPT

AUTOMATED DETECTION OF BREAST CANCER IN
MAMMOGRAPHY IMAGES USING GABOR FILTER AND
BAYESIAN CLASSIFIER
BARDIA YOUSEFI
RESEARCH REPORT SUBMITTED IN PARTIAL FULFILLMENT
FOR THE DEGREE OF MASTER OF ENGINEERING
(BIOMEDICAL)
FACULTY OF ENGINEERING
UNIVERSITY OF MALAYA
KUALA LUMPUR
2012
Univers
ity of
Mala
ya

2
UNIVERSITY OF MALAY
ORIGINAL LITERARY WORK DECLARATION
Name of Candidate: BARDIA YOUSEFI
Registration/Matric. No: KGL100003
Name of Degree: MASTER OF ENGINEERING
Title of Project Paper/Research Report/Dissertation/Thesis (“this Work”):
AUTOMATED DETECTION OF BREAST CANCER IN MAMMOGRAPHY IMAGES
USING GABOR FILTER AND BAYESIAN CLASSIFIER
Field of study: BIOMEDICAL ENGINEERING
I do solemnly and sincerely declare that:
(1) I am the sole author/writer of this Work;
(2) This work is original;
(3) Any use of any work in which copyright exists was done by way of fair dealing and
for permitted purposes and any excerpt or extract from, or reference to or reproduction of any copyright work has been disclosed expressly and sufficiently
and the title of the work and its authorship have been acknowledged in this work;
(4) I do not have any actual knowledge nor do I ought reasonably to know that the making of this work constitutes an infringement of any copyright work;
(5) I hereby assign all and every rights in the copyright to this work to the University of
Malaya (“UM”),who henceforth shall be owner of the copyright in this work and that any reproduction or use in any form or by any means whatsoever is prohibited
without the written consent of UM having been first had and obtained;
(6) I am fully aware that if in the course of making this work I have infringed any
copyright whether intentionally or otherwise, I may be subject to legal action or any other action as may be determined by UM.
Candidate‟s Signature Date
Subscribed and solemnly declared before,
Witness„s Signature Date
Name:
Designation: Univers
ity of
Malaya

3
ABSTRACT
The cause of breast cancer is unknown, also there are some prescriptions from
doctors regarding less of stress and having good life habit, so early detection can reduce
the death rate of patients. The earlier and accurate detection of symptom helps to
provide re-liable diagnosis and better treatment. Some of researches in the area of
detection of cancer in breast images have been done. The results which obtain within
researches are significantly considerable whereas working on the area is one of the
imperative researches in the area of biomedical engineering and researchers are still
looking for the better feature extraction method for this problem. The problem of
research in the area of diagnosis breast cancer via pattern recognition and image
processing techniques introduced when the existed methods are have some limitations
in detecting and classifying the breast lesions have not been accurate. The objective of
this research is developing a technique for feature extraction in breast lesions by
applying Gabor filter and using Bayesian classifier for classification of the breast
lesions. The extraction of features using Gabor filter is a new technique for feature
extraction regarding breast lesions in mammographic images. Moreover, the aim this
application having an efficient features extraction technique and better classifying of
lesions. This method focuses on developing a technique for feature extraction in breast
lesions by applying Gabor filter and Bayesian classifier. First the Gabor filter will be
applied to the breast image as feature extractor and then the extracted features will be
used for Bayesian classifier. The results will represent breast lesions which indicate the
breast cancer. The proposed method will be applied to 40 mammographic images out of
which 10 cases are normal patients with no sign of breast cancer while 30 are breast
cancer patients. We expect that the extracted features by using the proposed approach
represent reliable results and significant improvement about 97.5 percent of accuracy in
detection of breast lesions.
Univers
ity of
Mala
ya

4
ABSTRAK
Penyebab daripada kanser payudara sehingga kini tidak diketahui. Beberapa
doktor mencadangkan kurang tekanan dan kebiasaan hidup sehat, sehingga pengesanan
awal dapat menurunkan kadar kematian pesakit. Pengesanan lebih awal dan tepat
terhadap gejala-gejala kanser membantu untuk menghasilkan diagnosis yang pasti dan
rawatan yang lebih baik. Beberapa penyelidikan dalam bidang pengesanan imej kanser
payudara telah dilakukan dan menunjukan hasil yang signifikan. Kajian ke atas bidang
ini penting, terutamanya di dibidang Kejuruteraan Bioperubatan, kerana sehingga kini
para penyelidik belum menemukan kaedah penyarian sifat yang tepat. Diagnosis kanser
payudara melalui teknik pengesanan corak dan pengolahan imej membawa
pembaharuan kepada kajian di bidang ini kerana kaedah-kaedah yang ada mempunyai
beberapa kekurangan dalam mengesankan dan mengelaskan lesi payudara. Matlamat
daripada kajian ini adalah untuk mengembangkan kaedah penyarian sifat daripada lesi
payudara dengan menggunakan penapis Garbor dan pengelas Bayesian untuk
mengelaskan lesi payudara. Pengestrakan corak menggunakan penapis Garbor adalah
teknik baru dalam penyarian sifat lesi payudara di imej mamografi. Selain daripada itu,
kajian ini bertujuan untuk menghasilkan teknik penyarian sifat yang efisien dan teknik
pengelasan lesi yang lebih pasti. Penapis Garbor akan digunakan ke atas imej payudara
sebagai pengesan corak. Corak-corak yang telah dikesan kemudian dikelaskan dengan
menggunakan pengelas Bayesian. Hasil daripada teknik ini menerangkan lesi payudara
yang menunjukkan adanya kanser. Kaedah ini akan digunakan ke atas 40 imej
mamografi dimana 10 diantaranya adalah pesakit biasa tanpa isyarat kanser manakala
30 lainnya adalah pesakit kanser payudara. Corak-corak yang telah dikesan dengan
menggunakan teknik ini menunjukan hasil yang pasti dan menghasilkan peningkatan
signifikan kejituan deteksi lesi payudara sebanyak 97.5 peratus.
Univers
ity of
Mala
ya

5
ACKNOWLEDGEMENT
I would like to express my sincere gratitude to Dr. Ting Hua Nong. Thanks for his
guidance and support and thanks for his patience and tolerance.
I would like to say my sincere thanks to Dr. Farzanah Amer, Dr. Alireza AhmadyFard,
Professor Seyed Ebrahim Hosseini, and Dr. Alireza Bayesteh Tashk for their friendship
and support.
Deepest and warmest thanks to my parents and my fiancé for their love, patience and
continuous encouragements
Univers
ity of
Mala
ya

6
TABLE OF CONTENTS
ABSTRACT ....................................................................................................................................... 3
ABSTRAK.................................................................................................................................................................. 4
ACKNOWLEDGEMENT ......................................................................................................................................... 5
TABLE OF CONTENTS ........................................................................................................................................... 6
LIST OF FIGURES ................................................................................................................................................... 8
LIST OF TABLES ..................................................................................................................................................... 9
LIST OF ABBREVIATIONS .................................................................................................................................. 10
CHAPTER ONE: INTRODUCTION ...................................................................................................................... 13
1.1 OVERVIEW ...................................................................................................................................................... 13
1.2 PROBLEM STATEMENT ..................................................................................................................................... 14
1.3 OBJECTIVES OF THE STUDY ............................................................................................................................. 15
1.4 HYPOTHESIS .................................................................................................................................................... 15
1.5 SCOPE OF THE STUDY ..................................................................................................................................... 16
1.6 SIGNIFICANCE OF THE STUDY .......................................................................................................................... 16
1.7 OUTLINE OF THE REPORT ................................................................................................................................ 16
CHAPTER TWO: LITERATURE REVIEW ........................................................................................................ 18
2.1 INTRODUCTION ................................................................................................................................................. 18
2.2 FEATURE EXTRACTION AND SELECTION............................................................................................................. 18
2.2.1 FEATURES OF DIFFERENT TEXTURE ............................................................................................. 18
2.2.2 CHARACTERISTIC OF MORPHOLOGIC FEATURE ............................................................................... 22
2.2.3 FEATURES OF MODELLING .......................................................................................................... 26
2.2.4 FEATURES OF DESCRIPTION......................................................................................................... 26
2.2.5 ADDITIONAL FEATURES .............................................................................................................. 28
2.2.6 DIMENSION REDUCTION ............................................................................................................. 28
2.2.7 FEATURE SELECTION ................................................................................................................. 29
2.3 CLASSIFIERS .................................................................................................................................... 30
2.3.1 LINEAR CLASSIFIERS ................................................................................................................. 30
2.3.2 ARTIFICIAL NEURAL NETWORKS ................................................................................................. 32
2.3.3 DECISION TREE ......................................................................................................................... 33
2.3.4 SUPPORT VECTOR MACHINE ....................................................................................................... 33
2.3.5 TEMPLATE MATCHING ............................................................................................................... 34
2.3.6 Fuzzy C-Means ........................................................................................................................ 35
Univers
ity of
Mala
ya

7
2.3.4 SUPPORT VECTOR MACHINE ....................................................................................................... 35
2.3.5 TEMPLATE MATCHING ............................................................................................................... 36
2.3.6 Fuzzy C-Means ........................................................................................................................ 37
CHAPTER THREE: METHODOLOGY ................................................................................................................ 38
3.1 INTRODUCTION ................................................................................................................................. 38
3.2 GABOR FILTER ................................................................................................................................. 38
3.2.1 THE SEQUENTIAL (1-D) GABOR FILTER ........................................................................................ 38
3.2.2 FILTERS REGARDING GABOR ENERGY .......................................................................................... 39
3.2.3 REMOVING THE DC RESPONSE .................................................................................................... 40
3.2.4 THE (2D) GABOR FILTER ............................................................................................................ 41
3.2.5 THE GAUSSIAN ENVELOPE .......................................................................................................... 42
3.3 BAYESIAN CLASSIFIER ...................................................................................................................... 45
3.4 IMPLEMENTATION AND PARAMETERS SETTING ................................................................................. 46
CHAPTER FOUR: SIMULATION RESULTS AND DISCUSSIONS ................................................................... 47
4.1 INTRODUCTION .............................................................................................................................................. 47
4.1.1 PROPERTY OF IMAGE DATABASE IN TESTING EXPERIMENT ..................................................................... 48
4.2 THE RESULT OF APPLYING THE GABOR FILTER ON OUR DATABASE ......................................................... 51
4.3 APPLYING OF THE BAYESIAN CLASSIFIER ................................................................................................... 52
4.4 THE ACCURACY OF OUR PROPOSED APPROACH ................................................................................ 53
4.5 COMPUTATIONAL EFFICIENCY ........................................................................................................... 56
CHAPTER FIVE: CONCLUSIONS........................................................................................................................ 58
5.1 CONCLUSION ................................................................................................................................................ 58
5.2 FURTHER WORK............................................................................................................................................. 58
CHAPTER SIX: REFERENCES............................................................................................................................ 60
APPENDIX A: THE BRIEF METHODS IN CLASSIFICATION OF BREAST LESIONS .......................... 65
APPENDIX B: MATLAB SOURCE CODE ............................................................................................................... 73
Univers
ity of
Mala
ya

8
LIST OF FIGURES
Figure 1.1: CAD system for detecting and classifying of breast cancer. Adapted from
(Cheng, Shan, Ju, Guo, & Zhang, 2010). 14
Figure 1.2: The figure represents the steps of this method. 15
Figure 2.1: Equivalent ellipse of a lesion (FM10 and FM11) (Chen, et al., 2003). 25
Figure 3.1: Top: A signal as input. Second: cosine carrier as output of Gabor filter.
Third: sine carrier as output of Gabor Filter in quadrature; Fourth: Output of Gabor
Energy Filter (Movellan, 2005). 40
Figure 3.2: A Gaussian envelope. Adapted from (Movellan, 2005). 43
Figure 3.3: one example of the Fourier transform of the Gabor filter. Picture taken from
(Movellan, 2005). 44
Figure 3.4:The results of Gabor filter in 1 direction. Adapted from (Movellan, 2005). 45
Figure 4.1: The graph represents the way of applying the Gabor filter and also flowchart
of our approach for getting the results. 50
Figure 4.2: The result of performing proposed approach on sample image of our
mammography image database. Row (a) refers to the original images, row (b) shows the
results of applying Gabor filter in 45 degree direction, columns (i) ,(ii), (iii), and (iv) are
represent the LFET_CC, LEFT_MLO, RIGHT_CC, and RIGHT_MLO breast
mammography images , respectively. 51
Figure 4.3: Without considering the constant parts of the mammography images which
based on calibration of system will be removed by per-defined, the result of performing
our approach have been shown in this figure, columns (i) ,(ii), (iii), and (iv) are
represent the LFET_CC, LEFT_MLO, RIGHT_CC, and RIGHT_MLO breast
mammography images , respectively. 53
Figure 4.4: The picture shows one sample of good classification for cancerous (left) and
non-cancer (middle), and noisy classification (right) images. 54
Univers
ity of
Mala
ya

9
LIST OF TABLES
Table 2.1: Showing the Features which extracted from breast images. Adapted (Cheng,
et al., 2010) 23
Table 2.2: Classifiers Adapted from (Cheng, Shan, Ju, Guo, & Zhang, 2010). 34
Table 2.3: Different Classification Targets: Lesion/Non-Lesion. Adapted from (Cheng,
et al., 2010) 35
Table 4.1: Represents the accuracy of the proposed method as compare with the other
techniques. 55
Table 4.2: Represents the accuracy of the proposed method in different discrimination
ratio. 56
7
Univers
ity of
Mala
ya

10
LIST OF ABBREVIATIONS
ANN: Artificial Neural Network.
BDIP: Block Difference of Inverse Probabilities.
BI-RADS: Breast Imaging Reporting and Data System.
BNN: Bayesian Neural Network.
BUS: Breast Ultrasound.
BVLC: Block Variation of Local Correlation Coefficients.
COR: Auto-correlation in depth of R.
DCE-MRI: Dynamic Contrast-Enhanced Magnetic Resonance Imaging.
DPWT: Discrete Periodized Wavelet Transform.
ENC: Elliptic-Normalized Circumference.
ENS: Elliptic-Normalized Skeleton.
FA: Factor Analysis.
FN: False Negative.
FP: False Positive.
FSVM: Fuzzy Support Vector Machine.
GLD: Gold Matrix.
GS: Generalized Spectrum.
ICA: Independent Component Analysis.
L:S : Long axis to short axis ratio.
Univers
ity of
Mala
ya

11
LAP-MTANN: Laplacian Eigen-functions and Massive-Training Artificial Neural
Networks.
LAPs: Laplacian Eigen-Functions.
LDA: Linear Discriminate Analysis.
LI: Lobulation Index.
LOGREG: Logistic Regression.
LS-FS: Linear Stepwise Feature Selection.
MRI: Magnetic Resonance Imaging System.
MSD: Minimum Side Difference.
MTANN: Massive-Training Artificial Neural Networks.
NRDPWT: Nonrecursive DPWT.
NRG: Normalized Radial Gradient.
NSPD: Number of substantial protuberances and depressions.
PCA: Principle Component Analysis.
PLSN: Power-Law Shot Noise.
ROIs: Regions Of Interest.
SGLD: Space Gray-Level Dependence.
SOM: Self-Organizing Map.
SVM: Support Vector Machine.
US: Ultra-Sound.
Univers
ity of
Mala
ya

12
WEKA: Waikato Environment for Knowledge Analysis.
Univers
ity of
Mala
ya

13
CHAPTER ONE: INTRODUCTION
1.1 Overview
Breast cancer will suffer 8% of women during their lifetime and second cause
of death of them. In the United States, 182,460 recently diagnosed cases and 40,480
deaths reported in 2008 (Jemal, et al., 2008). The cause of breast cancer is unknown, so
early detection can reduce the death rate (more than 40%) of patients. The earlier
detection of symptom helps to provide better treatment. But it needs accurate, re-liable
diagnosis, distinguish benign, malignant tumours, and produce both low false positive
(FP) rate and false negative (FN) rate. Though, reading Ultra-Sound (US) image needs
well-trained and skilled radiologists. Nowadays, the interest in using US image as
imperative alternative for mammography for breast cancer detection is increased [6-8].
Even in well-trained human experts, there is a high inter-observer disparity rate, thus,
computer-aided diagnosis (CAD) is required for detecting and classifying breast cancer
(Huang, Chen, & Liu, 2004; Bhooshan, 2010). In recent times ,for minimizing the
influence of the operator-dependent nature inherent in US imaging several CAD
methods have been proposed (Hwang, et al., 2005), and increasing the rate of sensitivity
and specificity in diagnosis cancer (Huang, Chen, & Liu, 2004; Bhooshan, 2010; Huang
& Chen, 2005). Around 65–90% of the biopsies be revealed as benign, so, distinguish
benign and malignant lesions to reduce FPs is one of the important goal of breast cancer
CAD systems. For large amount of unspecified size detection and classification, several
technical skills like support vector machine (SVM), linear discriminate analysis (LDA)
and artificial neural network (ANN) have been deliberated. Usually, the CAD systems
requires many samples for construction of models and rules, however other papers
suggested a new diagnosis system needs very few samples. The image improvement by
pixel compounding of compression sequence in breast ultrasound has been considered.
Normally, the ultrasound CAD systems for breast cancer detection include four phases
as revealed in Figure 1.1.
Univers
ity of
Mala
ya

14
Figure 1.1 CAD system for detecting and classifying of breast cancer. Adapted from
(Cheng, Shan, Ju, Guo, & Zhang, 2010).
(1) Image pre-processing: The pre-processing techniques have been used when
enhancement and reduction of speckle without destroying of the imperative features of
images for diagnosis is required. The main restrictions of Breast ultrasound (BUS)
imaging are the low contrast and interference with speckle.
(2) Image segmentation: dividing the image into separate regions, and objects. The
Region of interest (ROIs) located for feature extraction.
(3) Feature extraction and selection: for finding and extraction of lesion/non-lesion or
benign/malignant features from BUS images.
(4) Classification: for classifying lesion/non-lesion or benign/malignant in separate
regions based on the selected features.
1.2 Research Problem and Problem Statement
Some of researches in the area of detection of breast lesions have been done and very
complex and hybrid techniques introduced yet. The obtained results are considerable
and the rate of accuracy in the detection of the breast lesions is high and finding the
breast lesions have significant rate of accuracy whereas working on the area is one of
the imperative researches in the area of biomedical engineering and finding accurate
breast lesions detector is one problem in this area. The researcher tried to increase the
accuracy rate as much as they can. So conducting this area of research follows this aim
and tries to solve this problem by achieving more accuracy in detection rate. Following
Univers
ity of
Mala
ya

15
this aim this research is defined and focused on the detection and classification of the
breast lesions in the breast mammography images.
1.3 Objectives
The objective of this research is consideration of the method for classification cancer part in the
breast images using Gabor filter and Bayesian rule. As it will be present in the literature review
part regarding the extraction of features, Gabor filter will be the new technique for feature
extraction in breast images. Moreover, this research proposal aims to use Gabor filter as
efficient feature extraction technique. The other feature extraction methods are present in the
literature review.
Figure 1.2: The figure represents the steps of this method.
1.4 Hypothesis
The research proposal focuses on improvement of detection and diagnosis of breast
cancer by using a method such as Gabor filter for obtaining the edges of lesions
considering amplitude as well as phase. As finding the lesions should be in the high
accuracy and by considering the imperative and sensitive position which the
diagnostician of breast cancer has for saving the lives, using Gabor filter can
dramatically help to detection of breast cancer earlier. The Bayesian classifier which
Univers
ity of
Mala
ya

16
used several time regarding classification of lesions can be good classifier. The
possibility of this hypothesis will analyze in other sections.
1.5 Scope of Study
The scope of study has defined by earlier diagnosis of breast cancer and prevention of women
death because of late diagnostician of this disease. As it mentioned before earlier detection of
lesions in the breast image can help to diagnosis breast cancer in earlier stages and treatment can
be more effective as compare with late diagnostician. This research focuses on detection of the
lesions in the ultrasound image. These ultrasonic images are in very high resolution and big size
images in different directions of breast of each cases.
1.6 Significance of The Study
The mentioned field of research study is able to contribute in the medical area such as tumour
and other lesions detection in aspect of finding and diagnosis the diseases and cancers. The rest
of this research is significantly focuses on applied science and doesn‟t considered pure science.
As these applications mentioned before as importance of this research field; detection of lesions
in breast images, its classification, categorization of lesion/non-lesion, and discrimination of
lesions in benign/malignant classes. As it will be declared in literature review, there are a
number of researches which considered some of the common techniques that separately utilized
in this research proposal but this proposed approach is novel technique till now.
1.7 Outline of the report
This report contains five chapters each of which illustrates one aspect of the
project. Chapter one presents an introduction over the dissertation containing an overall
overview on the subject and statement of the problem and relevant objectives and the
scope of the study. This chapter describes the significance of the study as well. Chapter
two starts by giving an overview on the breast cancer and breast lesions classification.
The chapter ends by a literature review on the breast cancer classification. The subject is
pursued by discussing on methodology in chapter three where the shortcomings of
Univers
ity of
Mala
ya

17
Gabor filtering and Bayesian classifier are presented. Chapter four gives the quantitative
and qualitative results in accuracy of mammography classifications. The conclusion of
the work and further work and research is proposed in chapter five.
Univers
ity of
Mala
ya

18
CHAPTER TWO: LITERATURE REVIEW
2.1 Introduction
Finding of features are significant stages in diagnosis of breast cancer.
Reduction of the feature space redundancy can help for keeping away from related
difficulty which happened in aspect of dimension. Also the mentioned problem will
happened more when the system need to have learning and totally using of the machine
learning in the extraction of features, selection of features, and classifying them.
2.2 Extracting and Selecting of the Feature
Extracting and selecting of the features are significant stages in finding and diagnosis of
breast cancer. Reduction of the feature space redundancy can help for keeping away
from dimensional difficulties problem. The related difficulty regarding dimensionality
proposes the bulk sampling in the step of learning the system is excessively small for
guarantee a significant evaluation in the categorization which has high dimensional with
the available limited data training number (Cherkassky & Mulier, 1998). The mentioned
problem in the cases of advanced classification methods determines the training time of
algorithm and influences the classification. So, the way that the features extract and
select the features is a highly imperative task for CAD systems (Bhooshan, 2010;
Drukker, Sennett, & Giger, 2008). In Table 2.1, the list of effectiveness-proved and
typical features has been presented.
On the other hand, basically joining the very good achieved features in the system will
not certainly construct the performance of methods efficiently. Finding the feature and
selecting them aim is to take full advantage of the selective feature groups.
2.2.1 Features of Different Texture
The majority of these types of features are measured of the whole ROIs(or the whole
image) via the level of gray intensity. t)coefficien covariance-(auto FT1 is an essential
and conventional feature contained the texture information that is able to reproduce the
Univers
ity of
Mala
ya

19
correlation inside input image and inner pixel. (BVLC) FT3-(BDIP) FT2 determine the
difference of amount of light emitted from a image or a pixel, consistency, and softness,
correspondingly. The more importance of BDIP represents the statistical variance in
emitting the light of images. The BVLC as bigger significance shows the components
are irregular (Huang, Wang, & Chen, 2006). In cooperation the primary and secondary
shape of FT2 and FT3 are able to utilize as features. The variance,
tscoefficienn correlatio-auto or intensity of average are relative amount of lesion and
its outer surface which are represented by FT4 . The big relative amount is the inferior
of likelihood in tumour. FT5 is identified like the summing up of dissimilarities in
middle of the actual division of tscoefficienwavelet in all subbandncy highfreque and
division of the amount of the Laplacian. The mentioned feature is able to imitate the
softness in the borders. FT6is feature vector an order of based-statistics took out as of
wavelet disintegration bands-sub . The wavelet in third stage disintegration, by using
Carlo Monte and Akaike's last calculation decisive factor length of statistical filter
selected. The order of factors in filter Statistic intend from t coefficienwavelet were
designed and produced by feature vectors (Mogatadakala, et al., 2006). There was as
feature reduction by using some analysis on the obtained features. Also some techniques
as selecting the feature by steps and principle component analysis can be used for
decreasing the feature size and dimension. FT7 and FT8 are identified as
ij
jipjiCON ),()( 2 and 22
),(
yx
yx
SS
mmjipijCOR
(1)
j) (i, p represents the likelihood of a couple pixels by level of intensity i and gray
value j are separately in a permanent distance, and
j i
yi j
x jipjmjipim ),(,),(
(2)
Univers
ity of
Mala
ya

20
2222 ),(,),( yj i
yxi j
x mjipjSmjipiS (3)
An additional technique to identify FT7 is ),().,( jjiiIjiIECON , where
j) (i, I is level of intensity at place j) (i, and j) (i, is the space among the pixels.
Through the similar details, FT9 is distinct as ),(),( jjiiIjiIEDiss . FT10
is defined as Nnon-zero, where N non-zero represents the non-zero pixels and Nall is
entire amount of pixels in the part. FT7, FT8 and FT10were features labelled by
means of strong distinguishing capability in (Garra, Krasner, Horii, Ascher, & Mun,
1993). FT11is designed of the minimum in the rectangular of ROI including the
tumour:
(4)
Where
(5)
MR shows the pixels in conducting of sideways in ROIwhich numerically represented.
Also, N and I show the amount of deepness of the ROI and the matrix of ROI that
shows the intensity level, respectively. For the reason that COR is an addition and it
comprises of size and consistency characteristic.
Derived from perception of the subsequent audio conductor subsequent shade,
modifying in numerical appearances is planned for estimate FT12. In (Horsch, et al.,
2002), 3 ROIs were indentified in size similar with ROI includes the tumour. The thin
blank boundaries are utilized to keep away from the border shades. Finally,
(MSD) Difference Side Minimum is introduced as:
Aright)-Apost Aleft,-min(Apost=MSD , everywhere Apost, Aright and Aleft are the
Univers
ity of
Mala
ya

21
middling of amount the light intensity in ROIs. In (Quinlan, 1993), an additional
technique to compute following shade was anticipated. initially a non-symmetrical
structure in the image is constructed by
(6)
where A presents a particular region centred at y) (x, , )y' ,(x' I is the amount of
intensity in the image, N is whole amount of information in region A and A is the
deviation standard of the light intensity in region A. The non-symmetric property is
eliminated by a threshold which can be attained form one property of the set like light
intensity. In (Chen, et al., 2002), the following shade was identified for the
differentiation among the intensity level which shown by histograms within the tumour
and following to the tumour. The similar feature of breast tumours, we are able to apply
different methods to describe the appearances which have numerical property. To obtain
additional correct plus well-organized appearances must belong to expectations.
FT13 shows the entropy which represented as Boltzmann/Gibbs greater than the gray
scale histogram relation to greatest measure of the level of disorder in a system.
FT16-FT15 is famous feature of consistency that contain previously identified.
Though, these features are irregularly utilized within topical image description. Perhaps
it is appropriate in aspect of time consumption. The fractional size meaning ( FT17) is
alike Hausdorff measurement (Chen, et al., 1989). Unofficially, the dimension d can be
designed by N = sd, where N is the number of alike pieces, s is the magnification
feature, as well as d presents the “dimension” in extent rule, identified as Hausdorff
measurement plus imperative features based on fractional size (Shi, et al., 2006).
Univers
ity of
Mala
ya

22
2.2.2 Characteristic of Morphologic Features
In contrast of the previous features which are obtained of undefined ROIs, the
mentioned feature centred in several neighbourhood properties in tumour, for instance
the form as well as boundary. All boundary pixel is signified as )(r in the polar
coordinates and ation)FM1(spicul shows the elements which have low frequency
(area in the graph )(R of 0 to 4/ ) the elements which have high-frequency (region
of below the diagram )(R from 4/ to ), anywhere )(R shows Fourier convert
of )(r plus cut-off frequency 4/ was experimentally chosen (Segyeong, et al., 2004).
The big rate is, lesser likelihood of the tumor organism malignant is. FM2 is one of the
most efficient discriminator features stated in numerous papers. Malignant lesions are
likely to contain the ratio bigger than 1 as benign lesions typically have the ratio smaller
than 1. FM3 shows number of extremes in graph of low-pass-filtered radial distance
also FM4 is the fitted curve on that. Some tumours have a tendency to have upper
amount of FM3 or FM4. For FM5–FM7, the lesion is separated to N sectors, and in all
part, the median amount of intensity in the pixels are evaluated. With thresholding, a
number of the segments are selected specifically.
Univers
ity of
Mala
ya
23
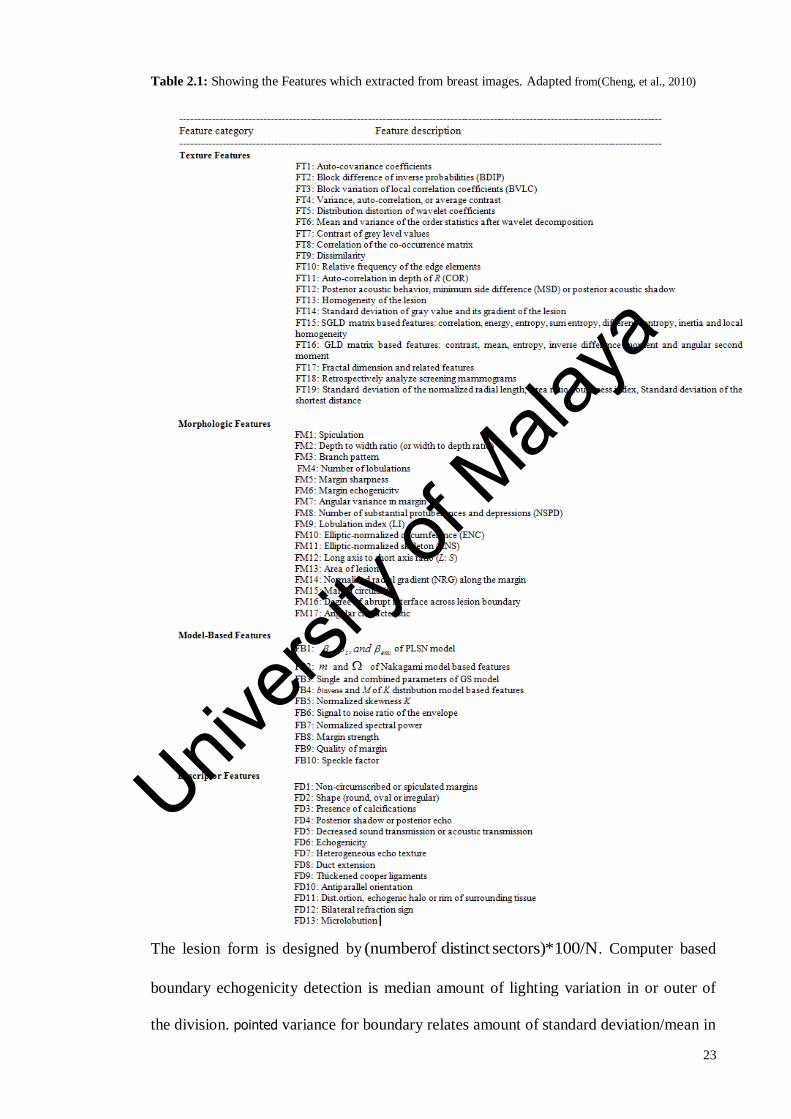
Table 2.1: Showing the Features which extracted from breast images. Adapted from(Cheng, et al., 2010)
The lesion form is designed by 100/N*sectors)distinct of(number . Computer based
boundary echogenicity detection is median amount of lighting variation in or outer of
the division. pointed variance for boundary relates amount of standard deviation/mean in
Univers
ity of
Mala
ya

24
variation of mean of light intensity level for in or out of every segment. The entire of
mentioned features are established for considerably unlike with t examination while
they are used for finding lesions (Shankar, et al., 2003). FM8–FM12 are recently
planned morphologic features (Chen, et al., 2003). A curved outer covering and concave
polygon help to identify a breast lesion. Specified a threshold angle of ( ∈{20,
50◦,60◦}), p ,...,,, 321 , and p ,...,,, 321 signify the set of
representative convex and concave points of a lesion boundary, correspondingly, where
p and d are the numbers of points in every set. Therefore, the NSPD is identified as p+d.
In an ideal case, a breast lesion contains a large NSPD.
(LI) FM9 is introduced like i
ANAA /*)( minmaxwhere maxA and minA are the sizes
of utmost and smallest amount lobes and N is the whole amount in lobes. LI is an
efficient balance of NSPD, as well as is able to accurately differentiate lesions from
other parts by several big lobes which have comparable amount without difficulty of
miss-classification with NSPD (Chen, et al., 2003). The boundary relative amount in
tumour for ellipse which has approximated size and defined as FM10 (ENC) (Figure
2.1). It signifies the windiness in the lesion which has feature of breast tumour features.
(ENS) FM11 distinct for amount of skeleton faces return to normal values via the
boundary of the equal ellipse that fitted on lesion. This feature is not suitable as
computation rate. Similar with FM10, lesions are likely to have more value of FM11. Univers
ity of
Mala
ya

25
Figure 2.1:Corresponding ellipse which fitted on the lesion ( FM10 and FM11) (Chen, et al.,
2003).
The contour form can get these mentioned features around the lesion. S) :(L FM12
shows relative amount in two long and short axes the place which they have strong-
minded in corresponding ellipse. Consequently, S) :(L relative amount has some
different character unlike deepness/thickness relation that shown by FM2 as checking
angle self-determining. Between 5 recently targeted NSPD 12),-(FM8 has established
for very important features and ENC and ENS LI, NSPD, have improved size as
compare with, S) :(L ratio plus deepness/thickness relation. FM14is utilized to
calculate the regular direction in amount of intensity with the boundary. The
mathematical relation regarding FM14 is
(7)
Where the gradient image represents by ∇I and calculated by Sobel function, amount of
pixels on boundary shows J and ),(ˆ ji yxr shows the radial way of geometrical centre in
),( ji yx which shows unit vector. FM15 is identified by STD or space of standard
deviation around the margin to sROI' geometric centres which is normalized
(Rodrigues, 2006).High amount of FM15 shows that there is a Tumour. FM16, FM17
Univers
ity of
Mala
ya

26
illustrate a significant features in (Shen, et al., 2007). To identify FM16, FM17 a
space plan will be considered firstly. For every point of image the amount shows space
plan and different and the lowest space is belong to tumour margin. FM16 considers
for evaluating of amount in immediate boundary from corner to corner of tumor margin.
MassTissueB avgavgLD
shows the formula.
(8)
Where I(n) illustrates the amount of light intensity of pixel n , dis(n) demonstrates
space plan plus Nand T issue MassN show the pixels of close to tissue and external mass,
respectively.
All neighbouring whereas target and external regions are self-possessed that shows the
space from edge is not further than k in the distance map. Width k was set to 3 in (Shen,
et al., 2007). The probability to be tumour reduced because of growing of FM16.
FM17illustrates for summation in the maxima in localization in every lobe shaped
region (Shen, et al., 2007). Using the maximum in circle, various lobulate regions are
divided from the mass. a number of little lobe shaped regions by highest 4 < distance
are unwanted. Regarding previous regions of lobe shaped which remained; the local
maximum in every lobulate region is gathered in follows: while a original maxima in
localization is revealed, 4 < distance of centre in the set is considered. But space has
bigger size as compare with previous threshold; the maximum in localization is
considered for new set. Finally, the entire amount of extremes in lobe shaped signified
the angular kind. In (Shen, et al., 2007), the threshold was set to 10. The bigger rate can
be representative as tumour.
Univers
ity of
Mala
ya

27
2.2.3 Features of Modelling
feature of Modelling illustrates a particular kind of features that concentrates as
echo redbackscatte of breast. Dissimilar reproductions are expanded for reproducing
mentioned echo redbackscatte cover. While form selects the echo can formed,
modelling factors are able to utilize for differentiate tumor from other parts. This form
can be utilized in finding the cancer comprising (PLSN) noiseshot law-power form
model Nakagami echo , K shows distribution as well as model of
(GS) spectrum dgeneralize . Contrast by morphologic characteristic along with texture,
the compensation in the features of modelling are which are not effected with
knowledge in radiology experts, and not effected from the techniques in that the images
are collected. They are operator- and machine self-governing (Shankar, et al., 2003).
The difficulty of of the features of modelling is in the cases that the background of the
forms is very compound and factors evaluation is extremely difficult.
2.2.4 Features of Description
features of Description ease the realization of experiential classification standards in
medical images. The majority have expressive amount as compare with others and no
numerical property. Because of our categorization as helpful features in aspect of
numerical characteristic in CAD. The feature of description are practically will not been
converted to numerical terms so using them in the CAD has very less contingency. But
FD12, and FD2 which are in the descriptive features categorization are tumour types.
FD2, FD1and belong to the features which are very influential for differentiating
tumors. In FD2, elongated or curved form in symbol intended other forms of tumors
which previous unequal form and symbol shown it. FD3 explains calcificating plus
micro-calcifications for finding tumor. FD4 names following echo or subsequent shad
Univers
ity of
Mala
ya

28
also centres continuously the area in the next of tumors on ROI that has less amount of
light intensity around portions. FD5 is known for shade result in neighbouring. FD6
planted fine regarding discriminating big lesions other than not little lesions. FD7
shows a confrontational property. Perhaps, it is reason of naturally biased the mentioned
property consequently a correct numerical description for FD7 seemingly essential.
FD8 shows representation of the node which makes bigger centrifugally in or nearby
the canal plus near nipples (Stavros, et al., 1995). FD9 shows congealed holding
tendons which incline to create extended by terminating time. FD11 describes the
neighbouring echogenicity in the tumor and tissue. FD12 illustrates the auditory fact
which typically happens in some tumors. FD13 identifies through the existence of a lot
of little lobe shapes arranged the superficial in tumors. On the whole features of
description involve in RADS)-(BI System Data and Reporting ImagingBreast .
2.2.5 Additional Features
Occasionally, contained previous data incorporated for the finding assistantship. Patient
categories are established as efficient characteristic of tumors (Costantini, et al., 2006;
Song, et al., 2005; Gefen, et al., 2003; Sehgal, et al., 2004). In addition, relative illness
past is additional helpful property which helps to finding the disease.
2.2.6 Dimension Reduction
Through numerous properties accessible, the critical undertaking for obtaining a best
category for features which are qualified short length. Extracting of the features
conversion on direct method for getting better a strong-minded aim; but feature
collection barely decreases the size, for instance, has no modification on organizing
structure in the information (Uncu & Turksen, 2007).finding the features in both cases
of linear or non-linear, converts coor-dinate structure for novel variables (Uncu &
Turksen, 2007). The most famous extractor method is
(PCA) analysiscomponent principal . PCA carries out the
Univers
ity of
Mala
ya

29
matrixn correlatio symmetricor matrix covariance symmetric also calculates Eigen
values and vectors in the form of matrix (Lee et al., 2009). PCA is excellent at
diminishing the feature set size. The vector of tscoefficien covariance-auto is able to
enhanced by this technique efficiently (Huang, et al., 2004; Huang, et al., 2005). Last
feature extraction methods for instance factor analysis (FA) (Gorsuch, 19983),
independent component analysis (ICA) (Fayyad & Irani, 1993), and discriminant
analysis (DA) (Holte, 1993) can alsobv be utilized to decrease the feature length.
2.2.7 Feature Selection
In general, systems regarding feature assortment is able to characterized keen on 2
classes: covering and filtering. The technique of filtering (like Relief and FOCUS
(Kohavi & John, 1997)) feature selection by one pre-processing stage plus does not
count as the preference for specific techniques. Continuously, the opposing in looking
for an excellent division in the properties, covering method utilizes the initiation
technique for division of the estimate purpose. In (Kohavi & John, 1997) offered
detailed descriptions and outlines of 2 feature modules collection systems. While the
covering techniques clear benefits more than method of filter, particularly regarding
complicated the set of properties information, covering method has supplementary
application for diagnosis of cancer such as breast cancer (Chen, et al., 2003; Shi, et al.,
2006; Drukker, et al., 2007; Horsch, et al., 2002). For instance, (Horsch, et al., 2002)
used a covering method FS))-LSselection( feature stepwise(linear for a set of feature
collected for 15 cases of sonography of breast and established which two important
characteristic properties was the normal direction in level of gradient intensity beside
the boundary and topology relation.
Univers
ity of
Mala
ya

30
2.3 CLASSIFIERS
Classification and categorization of lesion/non-lesion performed after features extracted
and selected. Most of the publications concentrate on categorization malignant and
benign lesions, and a number of the articles concentrate on classifying lesions and non-
lesions, and just a small number of them concentrate on together. Lesion finding is
essential earlier than classifying the tumor. We abridge the dissimilar classifying
methods which normally utilized in diagnosis cancer in breast and other classifying in
Table 2.2.
2.3.1 Linear Classifiers
Regularly for diagnosis of cancer in breast by utilizing the linear classification applying
logistic (LOGREG) regression is well-known(Rice, 1994). The major believed for
LDA searching the grouping of the features in linear form that greatest divide several
information classes. Conditionally, there are n classes, and LDAcategorizes for
information using the next linear meanings:
(9)
Where
(10)
in represents amount of samples in the class of ith , N is amount of entire examples, i
is the mean of class i,and iC is the matrix covariance of class i. The overhead factors are
able to be attained after preparation of information. While one novel information kx is
in, it is given to category i via maximum if regress ion Logis t ic is a reproduction
Univers
ity of
Mala
ya

31
intended regarding expect the possibility for an result happening such as a function in
previous aspects. The likelihood of nxxxX ,..., 21 is formulated as:
(11)
Everywhere nbb ,...,0 are representation factors that might be evaluated after the
preparation of information. While LOGREG is utilized for categorization of 2 class
difficult, in place of every feature vector ix , 0.5 = threshold is utilized for choosing
that class X fits in to.
In (Horsch, et al., 2002), LDA used for the information set in 400 cases through 4
feature extraction. The average A below ROCgraph was 0.87 more than 11 self-
determining trials. (Sehgal, et al., 2004) Sehgal et al. is shown that LOGREGwas
utilized to make a decision the likelihood of tumor in a dataset of 58 cases. 3 features
regarding boundaries were estimate on the part below the ROC diagram by the top
grouping of feature like age, echogenicity boundary and dissimilarity in the angels was
0.05 ±0.87 . At this time, we are able to observe which the act of LOGREG andLDA
are not appropriate as the classifications are linear, and for nonlinear distinguishable
information, the way has inherent limits.
Univers
ity of
Mala
ya

32
2.3.2 Artificial Neural Networks
ANN are the group of mathematical and analytical representations which reproduce
characterise of natural nervous structure and the purposes of knowledge which obtained
from biological systems(Cheng, et al., 2006). It is a structure of learning which
transforms the factors established by outside or inside data which runs over the network
through the training phase. ANN is collected of an contribution level, an amount
produced level and also has several layers which are hidden. Diagnosis breast tumor and
cancer plus its classifying, 3 forms of ANN are normally utilized:
ANN alhierarchic and (SOM) map organizing-self network, neuraln propagatio-Back
(Drukker, et al., 2002; Song, et al., 2005; Segyeong, et al., 2004; Chen D. R., et al.,
2002; Chen, et al., 1999; Chen, et al., 2000; Chen D. , Chang, et al., 2000). (Suzuki, et
al., 2010) suggest a dimension decrease technique for a massive-training ANN
(MTANN) by Laplacian Eigen functions (LAPs), denoted as MTANN-LAP . Instead
of input voxels, the MTANN-LAP uses the dependence structures of input voxels to
compute the selected (LAPs) of the input voxels from each input sub-volume and thus
diminishes the dimensions of the input vector to the MTANN.
Bayesian neural network BNN is a type of neural network utilizing Bayesian
techniquefor normalization of learning procedure (Kupinski, et al., 2001).The thought
after BNN is to performers the duty of learning a network as a difficulty for
implication that is described with Bayes theory(Bhat & Prosper, 2006). BNNis
additional optimum and vigorous than straight neural networks, particularly while the
learning information collect is little.
A BNN by means of one hidden level which contain five neurons was selected for
notice tumors (Drukker, et al., 2002). This research determined on individual proper
lesions (tumors) from non-lesions. The act was 0.84 =A on the set of 757 images. By
the similar set, in (Drukker, et al., 2004), two BNNs were trained and tested individually
Univers
ity of
Mala
ya

33
among dissimilar duties. It was utilized to categorize accurate tumors as of non-lesions,
and the previous was utilized to categorize tumors as of other finds. Presentation of
mentioned BNNs were Az= 0.91 and 0.81, correspondingly.
Drukker et al. (Drukker, et al., 2004) presents a 3-method BNN was used to classify
the data to different classes (tumor and non-lesion). Estimation of the act, the
production is able to proposed to 2-way classifications. Thus, on set of 858 cases (1832
images), the act of categorizing lesions from non-lesions was A= 0.92, and the act of
categorizing tumor of previous findings was A= 0.83. The BNNarrangement is simple
to combine previous data, although for evaluation of them statistical constraints needs a
comparatively massive set.
2.3.3 Decision Tree
Decision tree is an uncomplicated tree arrangement anywhere non-terminal points
characterize examinations for several characteristics and station nodes return choice
results. Every non-terminal point takes an associated starting point by several properties
and features for separating the information keen on its descendants plus procedure of
discontinues at the time every port of node merely includes each class. Therefore choice
tree is able to utilize by way of categorization devices following the thresholds are put
in the learning course. For comparison of neural networks, the choice of tree technique
is more quick simpler and faster (Cheng, et al., 2006). Though, it extremely depends on
plan of classifying rules on every nodes which are non-terminal and the dataset of
threshold amounts.
Univers
ity of
Mala
ya

34
Table 2.2: Classifiers Adapted from (Cheng, et al., 2010)
A famous system regarding making decision trees is C4.5 (Quinlan, 1993). The
technique has been integrated to a classifier namely WEKA and broadly utilized in AI.
A restructured kind of C5.0 gives an amount of developments taking place C4.5 . Kuo
et al. shows(Kuo, et al., 2001), method C5.0 was utilized for constructing the decision
tree using samples that 153 used for training and 90 samples for testing.
tscoefficien Covariance for ROIs were considered as input of decision tree. The act of
examining information collection was accuracy = 96% (86/90),
(58/60) 96.67% =y specificit and (28/30) 93.33% =y sensitivit , correspondingly.
Univers
ity of
Mala
ya

35
Action was Comparison of the physician experience for the equivalent analysis
information dataset and experimentation result demonstrated which the planned CAD
did a superior task. The bootstrap method to learn the decision tree through minor extent
of learning sets which were divisions of set presented in (Chen, et al., 2002) and (Kuo,
et al., 2001). Bootstrap method was established to be efficient and helpful, particularly,
smaller database was available. In (Lee, et al., 2009), the local variances characterized
using a few high octave energies in 1-D discrete periodized wavelet transform (DPWT).
To decrease computation cost, high octave decomposition is carrying out by a reversible
round-off 1-D nonrecursive DPWT (1-D RRO-NRDPWT).
Table 2.3: Different Classification Targets: Lesion/Non-Lesion. Adapted from (Cheng,
et al., 2010)
2.3.4 Support Vector Machine(SVM)
SVM is a supervised learning method pursues an optimum hyper-plane for division of
several classes in the pattern recognition task. Kernel functions are made use of diagram
of the input information profound to the domain which has higher dimension and our
information are made-up for having a enhanced spreading of the features in the feature
space afterward an optimum sorting out of hyper-planes will be selected for
discriminating the classes.
SVM was classified malignant and benign lesions in (Chang, et al., 2003; Huang, et al.,
2006; Shi, et al., 2006; Huang & Chen, 2005). Two the presentation and time cost of
Univers
ity of
Mala
ya

36
SVMand its comparison with ANNfor the similar set (Huang & Chen, 2005).
Experimentation result illustrated which 0.970) =SVM(A not just outclassed the
ANN (Azz= 0.956), however it was practically 700 times more rapidly as compare with
ANN .
In (Levman, et al., 2008), classifying the dynamic contrast-enhanced magnetic
resonance imaging (DCE-MRI) of breast lesions using support vector machines
considered. The DCE-MRI helps so much regarding diagnosis of breast lesions because
it has been shown to be the most sensitive modality for screening high-risk women. The
SVM classifier trained by a multiclass AdaBoost learning algorithm (AdaBoost.M2),
combined with a sequential feature-selection Process has been presented in (Takemura,
et al., 2010).
(FSVM) machinector support veFuzzy applying a regression model shown by(Shi,
et al., 2006). The action of FSVMoutcome for both the ANN and SVM using
classifying accuracy = 94.25% (Cheng, et al., 2010). The drawback of SVM is that the
compromise between allowing learning errors and constraining rigid boundaries, and
the kernel needs to be adjusted. Moreover, the mapping to plus point dimension is
complex and training time enlarged by the form of exponential by data contribution.
2.3.5 Template Matching
Retrieval method for image is able to utilize to categorize tumors. Mentioned techniques
apply to vectors of features for showing the enquiry image and database. Following the
correspondence relationship, the space among the enquiry image and each image for the
mentioned set was planned. The last category of the enquiry image was determined
using merging the first K got back images by the K maximum similarity scores.
In (Kuo, et al., 2002), features of texture were utilized straight as the vector of feature
for computing the likelihood and difficulty score among technique is which needs as
Univers
ity of
Mala
ya

37
set obtained from the equivalent stage. Huang et al. presents (Huang, et al., 2004) the
PCAwhich used for the whole set to shape like an elementary set and every image was
characterized through a weighted linear mixture of the images in the fundamental set.
Vector of weight was feature vector which is new utilized for computing the likeness
mark. It is noticeable that the technique was robust by the unlike images from different
sources.
Benefit of applying image retrieval method for finding of breast tumors is that it is
unsupervised and no need for training. And any external images can be simply entered
as input to the system. The difficulties for using this system is a number of systems the
images in the database have to move towards from the equal stage to assurance that the
correspondence amount is reasonable, for the large dataset the system is time consumer.
Though, for obtaining an improved act, the technique needs the set is sufficiently large
for containing different lesion categories. There is a trade-off among set's dimension
and method's competence.
2.3.6 Fuzzy C-Means
In (Tsui, et al., 2010), the receiver operating characteristic curve and fuzzy c-means
clustering were used to evaluate the performances of combining the parameters in
classifying tumors. In this method feature FT20 has been used.
Univers
ity of
Mala
ya

38
CHAPTER THREE: METHODOLOGY
3.1 Introduction
In this research the method which presented is new technique for detection of breast
cancer in the image and it can be an improvement of the known categories of the aspects
of analysis. Firstly, the Gabor filter will obtain the edge regarding the amplitude as well
as phase. There are several methods which were introduced before this, and they used
for edge detection in image but Gabor filter can obtain better results. The mentioned
method has been always used for finding the edges of medical and non-medical objects
in the images and also it can be very good technique for feature extraction of the
image‟s objects. Then, the classification of lesion parts will be done by Bayesian
classifier.
3.2 Gabor Filter
3.2.1 The Sequential (1-D) Gabor Filter
The Gabor filters are able to use like superior band pass filters for uni-dimensional
signals (e.g., image, speech).A complex Gabor filter is distinct as the produce of a
Gaussian kernel times a composite sinusoid, i.e.
(12)
Where
(13)
)2( 0)( tfjets (14)
)2cos(),2sin()( 00
)2( 0 fjfetse tfjj
(15)
Univers
ity of
Mala
ya

39
At this point k,θ,fo are sort factors. We can consider of the composite Gabor filter the
same as two out of point filters continently distributed in the real and complex
component of a compound function, the real element includes the sort
)2sin()()( 0 fttgr (16)
And the imaginary part holds the filter
)2cos()()( 0 fttgi (17)
For the frequency response Fourier transform will be
dtateekdttsateekfg tffjjftjj )()()()(ˆ )(22 0
)(ˆ 0
a
ffe
a
k j
(18)
Where
2
)()(ˆ feff (19)
3.2.2 Filters regarding Gabor Energy
The both components of a complex Gabor filter including real and imaginary
components there is sensitive phase, like for example a sinusoid consequence has a
sinusoid response. With accomplishment the output magnitude we are able to obtain a
response that part indifferent and therefore positive response not regulated to a objective
sinusoid input (see the figure below). In a number of cases it is helpful to calculate the
general production of the two out of phase filters. One general method of achievement
consequently is to insert the squared output (the energy) of every filter, consistently we
are able to obtain the magnitude. In the frequency area, the magnitude response to a
special frequency is basically the complex Fourier transform magnitude,
Univers
ity of
Mala
ya

40
)(ˆ)( 0
a
ff
a
kfg
(20)
The Gaussian function which centred at f0 by having relative width
Figure 3.1. Top: A signal as input. Second: cosine carrier as output of Gabor filter. Third: sine
carrier as output of Gabor Filter in quadrature; Fourth: Output of Gabor Energy Filter
(Movellan, 2005)
Therefore f0 is the peak of filter. To obtain the half magnitude of bandwidth f we will
have:
5.0)(ˆ 20
0
e a
ff
a
ff
(21)
aaaff 5.04697.02log20
(22)
Consequently the half magnitude of the bandwidth is about equivalent to a . So a is able
to be taking like the half of the magnitude in bandwidth.
3.2.3 Removing the DC response
According to the amount of f0 and a the filter might comprise a big response as DC.
There is a common technique to have zero DC response is subtracting outcome of low
pass Gaussian filter,
Univers
ity of
Mala
ya

41
)()()()()()( btctsatkebtctgth j (23)
Thus
)(ˆ)(ˆ)(ˆb
f
b
cfgfh
(24)
To have zero response for DC we must
)0(ˆ)0(ˆ gb
c
(25)
)(ˆ)0(ˆ 0
b
fe
a
kbgbc j
(26)
Where we applied the statement which )(ˆ)(ˆ00 ff as a result,
)()(ˆ)()()0(ˆ)()( 0 bt
a
f
a
btsatkegbtgth j
(27)
)(ˆ)(ˆ)(ˆ)(ˆ 00
b
f
a
f
a
ffe
a
kfh j
(28)
It is suitable to put b = a, in this case
)(ˆ)()()( 0
a
ftsatketh j
(29)
)(ˆ)(ˆ)(ˆ)(ˆ 00
a
f
a
f
a
ffe
a
kfh j
(30)
3.2.4 The (2D) Gabor Filter
At this point is the formula of a compound Gabor function in space area
),(),(),( yxyxsyxg r (31)
Everywhere s(x, y) is a compound sinusoid, called the carrier, ),( yxr is for a 2D
Gaussian formed function called by envelope. The complex sinusoid is known as below,
))(2(exp(),( 00 Pyvxujyxs (32)
Univers
ity of
Mala
ya

42
Where P and (u0, v0) introduce the phase and the spatial frequency of the sinusoid
correspondingly. We are able to consider of this sinusoid as two divide real functions,
opportunely distributed in the real and imaginary component of a complex function. The
real component and the imaginary element of this sinusoid are
))(2sin()),(Im(
))(2cos()),(Re(
00
00
Pyvxuyxs
Pyvxuyxs
(33)
The factors u0 and v0 introduce the frequency of the sinusoid in Cartesian coordinates.
Also there is some definition in polar coordinates by direction and magnitude represents
by ω0 and F0, respectively:
20
200 vuF
(34)
0
010 tan
v
u
(35)
000
000
sin
cos
Fv
Fu
(36)
By applying this presentation we will have complex sinusoid as
))sincos(2(exp(),( 000 PyxFjyxs (37)
3.2.5 The Gaussian envelope
The Gaussian envelope appears as below:
)))()((exp(),( 20
220
2rrr yybxxaKyx
(38)
Everywhere (x0, y0) is the peak, a and b are extending factors represents Gaussian, and r
shows the operation of rotation:
cos)(sin)()(
sin)(cos)()(
000
000
yyxxyy
yyxxxx
r
r
(39)
Univers
ity of
Mala
ya

43
Figure 3.2: A Gaussian envelope. Adapted form (Movellan, 2005)
There are 9 parameters for defining the complex Gabor filter:
K : In the Gaussian envelope, Scales the magnitude represented.
),( ba : The Gaussian envelope can be shown scale the two axis.
: The Gaussian envelope is presented by rotation angle.
),( 00 yx : Location of the peak of the Gaussian envelope.
),( 00 vu : Spatial frequencies of the sinusoid carrier in Cartesian coordinates.
Moreover, it is able to be shown by (F0, ω0) in polar coordinates.
P : is phase of the sinusoid carrier.
Every compound Gabor includes of two parts in quadrature, opportunely
positioned in the imaginary and real elements of a compound function. Here we
have the compound Gabor function in area
)))(2(exp()))()((exp(),( 002
022
02 PyvxujyybxxaKyxg rr
(40)
Or in polar coordinates,
Univers
ity of
Mala
ya

44
(41)
Figure 3.3: one example of the Fourier transform of the Gabor filter. Picture adapted from
(Movellan, 2005).
This Gabor 5 is the 2D Fourier transform as follows:
2
20
2
20
0000
)()(exp)))()((2(exp(),(ˆ
b
vv
a
uuPvvyuuxj
ab
Kvug rr
(42)
Also in polar coordinates,
2
20
2
20 )()(
exp)),(ˆ(b
vv
a
uu
ab
KvugMagnitude rr
(43)
PvvyuuxvugPhase ))()((2)),(ˆ( 0000 (44)
The Gabor filter is used as pre-processing method. It defines the edges of image components, in
the same way as Gabor filter performed. Various directions for Gabor filter were used in order
to achieve more significant and immaculate image components. To Gabor filter complex
function formula in spatial domain is given as follows; In general there are many uses of
morphological operations (opening and closing) in different parts of this method. ),( yxIg
)))sincos(2(exp()))()((exp(),( 0002
022
02 PyxFjyybxxaKyxg rr
Univers
ity of
Mala
ya

45
represents the image which is achieved by applying Gabor filter. Morphological operations have
been used to elicit some component of breast image.
Figure 3.4: the results of Gabor filter in 1 direction. Adapted from (Movellan, 2005)
After applying Gabor filter bank to an output image and after considering the series of filter
images, opening operator with some structural elements is applied to binary image. Different
shapes of structural element were used to extract distinctive classes of images.
3.3 Bayesian Classifier
In previous sections some techniques applied to Gabor filter in one direction and the use of
morphological operation along with structure element in order to extract of features in the
medical image. Described operations and techniques can help to feature extraction. Moreover, it
has an essential role for extracting image‟s features and will prepare image for classification.
The features have obtained from the previous technique are used in the Bayesian classification
function to classify the lesions in breast image. is the feature obtained for classifying lesions
which represents by the obtained edges and was extracted from Gabor filter and morphological
technique. is the discrimination rate for classifying between two general classes as Lesions
and non-lesions. The information gathered from above, now we put into an equation for lesions
and non-lesions. Following description regard above, we will have:
WO
CPCPif
C
C
CS
CS
C
C nll
lesionsnon
lesions
lesionsnon
lesions
nl
l
.
)|()|(
)(
)(
(45)
)|()|()( nlllesions CPCPCS , )|()|()( nlllesionsnon CPCPCS (46)
Univers
ity of
Mala
ya

46
If )|()|( nll CPCP ,it is possible that lC or lesionsC belong to lesions class and S shows
sets of classes. It means that we detect lesions from input images, and we collect two classes of
lesions and non-lesions.
3.4 Implementation and Parameters Setting
The proposed approach was implemented to obtain the results. The
frequency of the Gabor filter was 0 and initial values of X and Y can be 10 or 0.
The equations 45 and 46 are using in classifying the two classes. The code is
developed in MATLAB R2009b. The source code is presented in Appendix B:
MATLAB source code.
Univers
ity of
Mala
ya

47
CHAPTER FOUR: SIMULATION RESULTS AND DISCUSSIONS
4.1 Introduction
In this chapter, the simulation results are presented. The simulations are
conducted in two aspects one of them is regarding the contingency of applying the
Gabor filter for this specific application and finding the lesions in the breast area
and another aspect of concentration is the accuracy of the proposed method and this
comparison with the state-of-the-art which can be a representation and the proof for
the efficiency of the method in order to perform in the mammography images. It
must be mentioned that sometime having the poor results in outcome can because
of absence of proper adjustment in Gabor filter and Bayesian classifier. Superiority
and novelty compared with other state-of-the-art because it is the first time that the
Gabor filter has been used for extraction of features in the case of finding breast
lesions. Each image consists of components including breast and lesion part along
with very simple background. The first step is the feature extraction by Gabor filter
and morphological operation functions. The second step is classification, using
Bayesian classification function. As it will be shown in the below the results have
improvement in the extracted features by using the proposed approach and
representing reliable results. It is noticeable that the rate of false positive (applying
our method for non-cancerous cases) for our proposed approach is zero and there is
no false positive for detection of lesions. But there are some images which we
called them noisy images considered instead of false positive.
4.1.1 Property of Image Database in Testing Experiment
We demonstrate the application of proposed method for developing the
method for classification and detection of the breast lesions in the mammography
images. Also the proposed method will be applied to 40 cases (Including four
Univers
ity of
Mala
ya

48
images for each case) out of which 10 cases are normal patients with no sign of
breast cancer while 30 are breast cancer patients. Furthermore, 3 cancerous cases
and 2 cases of non-cancer have been used for training map in Bayesian classifier.
Mammography images are in the range of 5500× 2600 pixels to3960 × 1800 pixels
monochromic and unit 16. For having reliable result and less computational load,
the images scaled to constant size 3500 × 1750 pixels.
For each case in our dataset we have four images. It means that for every
breast cancer suspected cases, there are four view mammography images. The
names of these images are LEFT_CC, RIGHT_MLO, RIGHT_CC, and
RIGHT_MLO. These images are in the LJPG format which has very high quality
and has big size around 11MB for each one and belong to Wisconsin Breast
Cancer Database (WBCD). The sizes of images are large because of increasing the
accuracy for detection the lesions in breast. Most of these images have specific
software for opening them by MATLAB we could open, read, and represent them.
4.2 The Result of Applying the Gabor Filter on Our Database
The proposed approach individually presented in aspect of the utilized
techniques. The recent part is going to consider the novel way for using mentioned
techniques on the recent approach. The Gabor filter bank that has been used in
mono-direction can be presents the several shapes and techniques. The way of using
the multi-directional Gabor filter bank makes different effects and different results.
Also using the two steps fusion for obtaining the reliable and accurate answers
shows the need of having trustworthy design for the proposed approach.
As it presented in figure 4.1, directed graph shows the way of applied Gabor
filter bank. The Gabor filter has been applied by different directions. The different
directions considered because of the probable effects of the Gabor filter. Where
Univers
ity of
Mala
ya

49
represents θthe angle of rotation angle of the Gaussian envelope on the Gabor filter.
As it is previously mentioned, the technique of the applying the Gabor filter is
important. This approach can be a method for using the mentioned filter and it can
be developed more in future. The topology of connected graphs which has been
used in one group of applying Gabor filters was not very crucial but for having a
better results we used Gabor filter in mono-direction. The layer 1 on the directed
graph represents the inputs layer. In this layer Gabor filter bank using the presented
topology has been made and applied to the input mammography images. Applying
the Gabor filter can be in mono-direction, in large range of changes on the
frequency of Gabor filter, and various Location of the peak of the Gaussian
envelope but it is considerable that these variety of the parameters in Gabor filter
can be consider as constant value like for instance frequency of the Gabor filter
must be zero and the x0, y0 can be constant values because of independency on
Gabor filter in this application. Moreover the system must not be time consumer
and there is always trade of between the mentioned items. After layer first, the
second layer is regarding the first step of combination and using the output of the
Gabor filter obtained by earlier layer. It is noticeable that for each variation of the
changed parameters for Gabor filter one image has been generated. These images
will be combined by each other to make one image which carries up our
information and features. These features handle maximum information of breast
lesions in the mammography images. This part of image combination will have
better effect if the different data from different groups of the Gabor filter bank be
combined. The way of entering these groups are presented in the directed graph in
figure 4.1. As it is shown in directed graph, the expectation of having better feature
condition in the Gabor filter application groups by having more grades from the
first group will increase. The cause of increasing the mentioned expectation is
Univers
ity of
Mala
ya

50
Layer 1
Layer 2
increasing the inputs from Gabor filter bank to the combination part.
Figure 4.1: The graph represents the way of applying the Gabor filter and also flowchart of our
approach for getting the results.
The figure 4.2 shows the application of Gabor filter in one direction of one
of the cases which has breast cancer lesions. As it is mentioned before, our breast
dataset for each case has four different views images. The Gabor filter has been
applied to these four images and after that the Bayesian classifier will be applied to
the outcome image of Gabor filter and makes the final results.
Bayesian Classifier
Univers
ity of
Mala
ya

51
Figure 4.2: The result of performing proposed approach on sample image of our mammography image
database. Row (a) refers to the original images, row (b) shows the results of applying Gabor filter in 45
degree direction, columns (i) ,(ii), (iii), and (iv) are represent the LFET_CC, LEFT_MLO, RIGHT_CC,
and RIGHT_MLO breast mammography images , respectively. Univers
ity of
Mala
ya

52
4.3 Applying of the Bayesian Classifier
Bayesian classifier method has been used for classification of the lesion
portion out of the all breast part. Even it can be utilized as the image restoration
for the taking out the breast part from the background parts. But the background
part of the mammography images has very different texture as compare with the
other texture of the images. Moreover, the image intensity of the lesions in the
breast area is significantly different from the intensity in the background. Totally,
the extracted features in the breast can be chosen such a way that the
discrimination will be occurred.
For classification of the lesions in breast using the Bayesian classifier, the
classification point, in the discrimination algorithm essentially required. It
obtained from the training map or marked images. For attaining training map 5
cases (3 cancerous cases and 2 cases of non-cancer with total of 20 mammography
images in the range of 5500× 2600 pixels to3960 × 1800 pixels monochromic and
unit 16 scaled to constant size 3500 × 1750 pixels. The images are in the LJPG
format which has very high quality and has big size around 11MB) have been used
which are completely separate from testing image set. In the training map amounts
of outcome of the Gabor filter as the input of classification part is amount of Gabor
intensity for each class was considered for evaluations. Appropriate levels of
discriminated, corresponding amounts of outcome of Gabor filtering of the
mammography images, according to higher value of Gabor outcome for the lesions
part and lower level of the Gabor intensity are belong to the other components and
classes which obtained using the training map. in our dataset chosen by 0.08. It
is considerable that, the breast lesions have higher intensity components on their
Gabor filter edges. Furthermore, the lesion parts have un-smooth texture in
mammography images as compare with other classes. Particularly, by
Univers
ity of
Mala
ya

53
classification using the Bayesian rule the objective of this research satisfied and
the lesions classification system has been completed.
4.4 The Accuracy of Our Proposed Approach
Detecting the breast lesion and totally, as it is mentioned in the sections
before, the breast cancer area is one of the very imperative and active area of
research which there are a lot of research have been done in this area and
especially by using the image processing techniques and pattern recognition there
are valuable research have been achieved and the researcher tried and trying to
improve their knowledge and their achievement in this field to have better results.
The state-of-the-art in this area is belonging to the several teams whom they
worked independently on this area. The table represents the accuracy of detection
of the breast cancer by finding the mass or lesions in the breast images.
Figure 4.3: Without considering the constant parts of the mammography images which based on calibration of system will be removed by per-defined, the result of performing our approach have been
shown in this figure, columns (i) ,(ii), (iii), and (iv) are represent the LFET_CC, LEFT_MLO,
RIGHT_CC, and RIGHT_MLO breast mammography images , respectively.
Univers
ity of
Mala
ya

54
Muhammad Asad et al. (Asad, et al., 2011) in the their paper which published in
31 May 2011, worked on the finding the breast cancer in the mammography
images. They achieved the percentage of 80 for classification of the lesions in the
33 breast mammography images by using Kohnan neural networks for training of
their features. Naghibi S. et al. from KNT university of Technology (Naghibi, et
al., 2010) presented detection of breast cancer using hierarchical fuzzy neural
system with procedure of extended Kalman filter (EKF) trainer. This team got the
98.5% for FNN and 99.04 for HFNN technique for their tests. Moreover, Alireza
Mashal et al. toward Carbon-Nanotube-based Theranostic agents for microwave
detection of breast cancer and got the 81 percent but this research has separate
category and also it has been used for treatment as well (Mashal, et al., 2010).
The mentioned papers have excellent work and good achievement in the
area of detection of the lesions and breast cancer. Especially two research works
(Asad, et al., 2011; Naghibi, et al., 2010) are very familiar with our research
project. The accuracy of our work is significantly high like the paper (Naghibi, et
Figure 4.4: The picture shows one sample of good classification for cancerous (left) and non-
cancer (middle), and noisy classification (right) images.
Univers
ity of
Mala
ya

55
al., 2010) and more than 99.3 percent for our dataset. This percentage obtained by
applying the proposed approach to the images of our dataset. The formula (47)
presents how the rate of accuracy attained. The rate of false positive (applying our
method for non-cancerous cases) is zero and there is no false positive for detection
of lesions in the dataset which includes of mammography from non cancerous
cases.
More accurate percentage will be considered when we extend our dataset
for testing our approach. But our data set is more than (Asad, et al., 2011) as
number of mammographic images. Table 4.1 represents the accuracy in
comparison with other methods as state-of-the-art.
Table 4.1 Represents the accuracy of the proposed method as compare with the other
techniques.
Methods
Accuracy for Detection of Breast Lesions(in percent)
FNN
98.5
HFNN
99.04
Kohnan NN
80
Our Proposed Approach
97.5
As it is mentioned before and is presented in table 4.1 the accuracy of the
proposed approach very high and comparable with (Naghibi, et al., 2010) as best
example of the state-of-art methods. The accuracy of our approach is
conservatively found because of few cases which did not detected well.
The table 4.2 represents the accuracy of the proposed approach by using
Univers
ity of
Mala
ya

56
different parameters and discrimination rate. This parameter is a boundary for
Bayesian classification function and very imperative item for classifying these two
classes from each other. As the results of changing the parameter indicate by
changing amount of this parameter the accuracy dramatically changed.
Table 4.2 Represents the accuracy of the proposed method in different discrimination
ratio.
(Discriminating ratio in Bayesian
Classifier)
Number of the
Results have
Noise
Number of the Results
have Miss-classification
Accuracy
Total
Images
0.01 3 1 97.5 160
0.03 3 1 97.5 160
0.05 2 3 96.8 160
0.08 0 4 97.5 160
0.10 0 8 95 160
The formula which used for calculating the accuracy is as follow:
DatasetofNumberTotal
ficationMissclassiofNumberNoisehavingresultsofNumberDetectionofNumberAccuracy
)(
(47)
The noise in the image is defined by non-suitable classification ratio instead
of false positive. The noise in the image results by adding so spot pixels which can
disturb the system to find and detect the lesions properly.
4.5 Computational Efficiency
The time and computational load of applying the proposed approach is not
a critical issue while the classification by having the good speed and less
computational cost are more desired specially in the medical image processing this
matter is more desirable and seemingly essential. Using the medical image
Univers
ity of
Mala
ya

57
processing algorithm which have heavy computational load are popular in the
areas having less emergency and do not need immediate demand. But usually the
diagnosis and finding the symptom and detection of the tumors or other defects in
the human body are rely on the medical imaging and for diminishing the miss-
diagnosis the medical images have more quality and very heavy as compare with
other applications of image processing. So the other way to reducing the
computational cost by having the heavy input images is using the fast algorithm.
Moreover, it is considerable that having the fast and less computational loading
algorithm sometime makes the miss-classification and miss-diagnosis which are
very unacceptable in the medical applications.
In this specific subject and finding the breast lesions, there is very less
computational loading because of the heavy input images. As it is mentioned in the
previous section, the input images were more than 11 MB and applying the Gabor
filter on these images needs sometime which is not very much(almost six minutes
by computer 2.5GHZ,2GB External RAM and 6MB Internal RAM). Also, using
the Gabor filter in different directions makes the algorithm time consumer which is
not considerable because of having less emergency and do not need immediate
demand. Perhaps, because of mentioned reason this matter did not consider in the
same work in the state-of-art.
Totally, by paying attention to the finding the breast lesions in the
mammography images has no immediate demand, the proposed approach has
reasonable computational load which we can categorize this method as rapid
algorithm.
Univers
ity of
Mala
ya

58
CHAPTER FIVE: CONCLUSIONS
5.1 Conclusion
A modified Gabor filter and Bayesian classifier was developed in order to
detect breast lesions in mammography images. The Gabor filter had a significant
role on the extraction of features on breast images. First the Gabor filter applied to
the mammographic images as feature extractor. At the end Bayesian classification
function classified the lesion parts from non-lesion parts. Using proposed approach
the breast lesions have been detected. Although the study in this are has good
results and significant percentage of detection of the breast lesions but the
proposed algorithm has very good and reliable percentage of the finding lesions
which compared with the state-of-art and the quantitative result showed superiority
of the presented method in terms of accuracy comparing with recent researches in
the field. Moreover, the proposed approach has no false positive in the set of
normal mammography images.
The proposed method has been applied to our dataset including 160 breast
mammography images of which comprise of 30 cases of breast cancer and 10
cases of normal mammography images. The results indicate the accuracy more
than 97.5 percent of accuracy of diagnosis of breast cancer.
5.2 Further work
In the area of the breast cancer and finding the breast lesions there are lots
of researches and works have been done. While, there are still a number of
suggestions that can be investigated following the presented method. In this study
Univers
ity of
Mala
ya

59
the computational cost was not investigated because of less emergency and having
no immediate demands. One can conduct a research to measure the computation
expenses of the method.
Univers
ity of
Mala
ya