university of southampton research repository eprints soton · i university of southampton abstract...
TRANSCRIPT

University of Southampton Research Repository
ePrints Soton
Copyright © and Moral Rights for this thesis are retained by the author and/or other copyright owners. A copy can be downloaded for personal non-commercial research or study, without prior permission or charge. This thesis cannot be reproduced or quoted extensively from without first obtaining permission in writing from the copyright holder/s. The content must not be changed in any way or sold commercially in any format or medium without the formal permission of the copyright holders.
When referring to this work, full bibliographic details including the author, title, awarding institution and date of the thesis must be given e.g.
AUTHOR (year of submission) "Full thesis title", University of Southampton, name of the University School or Department, PhD Thesis, pagination
http://eprints.soton.ac.uk
UNIVERSITY OF SOUTHAMPTON
FACULTY OF PHYSICAL AND APPLIED SCIENCES
OPTOELECTRONICS RESEARCH CENTRE
High Performance Pulsed Fiber Laser Systems for Scientific & Industrial Applications.
by
Peh Siong TEH
Thesis for the degree of Doctor of Philosophy
March 2015

i
UNIVERSITY OF SOUTHAMPTON
ABSTRACT
FACULTY OF ENGINEERING AND APPLIED SCIENCE
OPTOELECTRONICS RESEARCH CENTRE
Doctor of Philosophy
HIGH PERFORMANCE PULSED FIBER LASER SYSTEMS FOR SCIENTIFIC &
INDUSTRIAL APPLICATIONS
By Peh Siong TEH
This thesis reports an investigation of the power scaling of pulsed fiber laser systems towards
the hundreds of Watts regime whilst keeping the impact of fiber nonlinearities such as
Stimulated Raman Scattering (SRS) at a manageable level. Two regimes of pulsed operation are
investigated: the nanosecond pulse regime and the picosecond pulse regime. Some of the work
reported in this thesis was carried out in collaboration with SPI Lasers and Institute for
Manufacturing, University of Cambridge under the TSB funded SMART LASER programme.
In the nanosecond regime, two kinds of MOPA configurations are investigated. In the
first instance a high accuracy active pulse shaping technique is implemented. Using the
combination of a fast electrical Arbitrary Waveform Generator (AWG) and an Electro-Optic
Modulator (EOM), optical pulses can be shaped into various custom defined pulse shapes with
high temporal resolution feature definition, allowing faster pulse rise and fall times than
previously possible. This MOPA has the capability to generate a maximum average output
power of ~70 W, pulse energy close to 1 mJ, all within a diffraction limited output beam. The
second instance a fully-fiberized system capable of producing up to 45 W of average output
power with a pulse energy of ~1 mJ was developed in collaboration with SPI Lasers Ltd. Unlike
the first system, which uses an EOM for optical pulse shaping, an Acousto-Optic Modulator
(AOM) is instead used to pre-shape the leading edge of the optical seed pulse in order to reduce
the impact of nonlinear effects caused by the high peak powers otherwise associated with gain-
saturation assisted reshaping of long nanosecond square input pulses, providing a cost-effective
solution for the SMART Laser system. The successful development of the SMART Laser
system allowed SPI Lasers Ltd to introduce a new product line, namely the G4 pulsed fiber laser
system. Both types of fiber laser system were used in material processing experiments to
investigate their performance and capabilities.
Using a nanosecond fiber MOPA as a pump source, a synchronously pumped, tuneable,
Raman fiber laser is demonstrated both in the near infrared (NIR) and visible regions. A
continuous tuning range of 28nm in the NIR and 2.8nm in the visible region are achieved with
efficiencies in the range of 12% to 18% respectively. The conversion efficiency can be
increased further with the use of a feedback signal. Furthermore, with the presence of a
feedback signal, the linewidth of the Raman Stokes lines in both visible and NIR regions shows
a significant narrowing effect. This technique will allow the generation of wavelengths which
are not easily generated with rare-earth doped fiber lasers and will be useful in the fields of
spectroscopy, archaeology, biomedical and many more.
ii
Next, optical pulses in the picosecond regime are investigated. A gain-switching
technique is used to generate a stable train of picosecond optical pulses from a semiconductor
laser diode (SLD). Gain switching of different types of commercially available SLDs shows
different temporal and spectral characteristics which are primarily influenced by the design of
the specific chip used. The shortest pulse durations achieved through direct gain switching
resulted in ~50 ps pulses; however these were far from transform-limited. However, an external
FBG seeded gain switched SLDs was shown to be capable of producing transform-limited
optical pulses. I show that a mode-locking mechanism is responsible for the short, transform
limited optical pulses observed. This is the first demonstration of a mode locked SLD at the
1.06 μm waveband. With this technique, 18 ps optical pulses with pulse energy of 7.2 pJ and
peak power of 400 mW were obtained.
The single polarization, stable, picosecond optical pulses were fed into a chain of
polarization maintaining fiber amplifiers to investigate the power scaling capability of this
system. A maximum average output power of 513 W is demonstrated in a diffraction-limited
output beam. The system operated at a repetition frequency of 215 MHz, corresponding to an
estimated pulse energy of 2.4 µJ and a peak power of ~ 69 kW. At the maximum operating
output power, the OSNR is measured to be well above 26 dB with a polarization extinction ratio
(PER) of 17 dB. A pulse energy of 3.23 μJ is achieved from a similar system at a reduced
operating frequency of 53 MHz and an average optical power of 200 W, corresponding to a
pulse peak power of 107 kW. In both cases, further power scaling is limited by the SRS.. These
results represent the highest optical power demonstrated from a fiber MOPA producing tens of
picosecond optical pulses.
TABLE OF CONTENTS
iii
Contents
ABSTRACT ................................................................................................................................ i
List of Tables ..............................................................................................................................2
List of Figures ............................................................................................................................3
DECLARATION OF AUTHORSHIP ...............................................................................11
Acknowledgements .................................................................................................................12
List Of Abbreaviations ...........................................................................................................13
Chapter 1. Introduction ....................................................................................................15
1.1 Motivations ........................................................................................................15
1.2 Historical Overview ...........................................................................................18
1.3 Thesis Outline ....................................................................................................20
1.4 References ..........................................................................................................21
Chapter 2. Background .....................................................................................................23
2.1 Semiconductor Laser Diodes .............................................................................23
2.2 Ytterbium Doped Fiber Technology ..................................................................27
2.2.1 Spectroscopy ......................................................................................................27
2.2.2 Principles of Optical Fibers ................................................................................30
2.2.3 Birefringence in fibers ........................................................................................31
2.2.4 Amplification through Pumping Process ...........................................................32
2.2.5 LMA Double-clad Fibers ...................................................................................38
2.2.6 Master-Oscillator-Power-Amplifier Configuration ............................................39
2.3 Pulse Propagation and Non-linear Effects in Optical Fibers ..............................41
2.3.1 Dispersion in Pulse Propagation ........................................................................41
2.3.2 Non-linear Effects in Pulse Propagation: Self Phase Modulation ......................42
2.3.3 Cross Phase Modulation .....................................................................................46
2.3.4 Stimulated Raman Scattering .............................................................................46
2.3.5 Stimulated Brillouin Scattering ..........................................................................48
2.4 References ..........................................................................................................50
Chapter 3. Nanosecond Fiber Laser System ................................................................53
3.1 Introduction ........................................................................................................53
3.1.1 Pulse amplification and gain saturation..............................................................54
3.2 Nanosecond Fiber MOPA with Active Pulse Shaping .......................................59
3.2.1 System Setup ......................................................................................................61
3.2.2 Custom Optical Pulse Shapes Demonstration with EOM ..................................63
3.3 SMART Fiber Laser System ..............................................................................65

TABLE OF CONTENTS
iv
3.3.1 Seed Laser .......................................................................................................... 67
3.3.2 Pre-amplifier Stage ............................................................................................ 69
Long pulse amplification ...................................................................................................... 69
Short pulse amplification ..................................................................................................... 71
3.3.3 Power Amplifier Stage ....................................................................................... 73
3.3.4 Active Pulse Shaping with AOM ....................................................................... 76
3.3.5 Characterization of Beam Delivery Fiber .......................................................... 78
3.3.6 Overall Performance of SMART fiber laser ...................................................... 80
3.4 Pulse Tailoring Application on Material Processing ......................................... 81
3.5 Conclusion ......................................................................................................... 85
3.6 References .......................................................................................................... 87
Chapter 4. Raman Fiber Laser in Visible and Near Infrared Regions ................. 89
4.1 Introduction ........................................................................................................ 89
4.2 Selective excitation of multiple Raman stokes wavelengths (green – yellow –
red) using shaped multi-step pulses. .................................................................. 93
4.3 Experimental setup for tunable Raman fiber laser ............................................. 98
4.4 Tunable Raman fiber laser in the visible ......................................................... 100
4.4.1 Synchronous Pumped Visible Raman Generation ........................................... 101
4.4.2 Tunability of Synchronously pumped visible Raman laser ............................. 103
4.5 Synchronous pumped NIR Raman generation ................................................. 104
4.6 Discussion ........................................................................................................ 105
4.7 Conclusion ....................................................................................................... 107
4.8 References ........................................................................................................ 108
Chapter 5. Picosecond Pulse Generation Using SLD .............................................. 111
5.1 Introduction ...................................................................................................... 111
5.2 Gain switching ................................................................................................. 111
5.3 Demonstration of gain switching technique .................................................... 113
5.3.1 Gain switched SLD .......................................................................................... 113
5.3.2 Injection seeding .............................................................................................. 118
5.4 Active Mode-locking via an inline FBG as external cavity ............................. 122
5.4.1 Configuration for Active Mode-locked SLD ................................................... 123
5.4.2 Performance of mode-locking at various repetition frequencies ..................... 124
5.5 Stability of picosecond pulses between direct gain- switching and mode-locking
......................................................................................................................... 128
5.6 Chirp measurement with Frequency Resolved Optical Gating (FROG) ......... 133
5.7 Conclusion ....................................................................................................... 137
5.8 References ........................................................................................................ 138
Chapter 6. High Power and High Energy Picosecond Fiber Sources .................. 141
6.1 Introduction ...................................................................................................... 141

TABLE OF CONTENTS
v
6.2 Challenges ........................................................................................................143
6.3 Picosecond MOPA configurations ...................................................................144
6.3.1 Seed Source ......................................................................................................145
6.3.2 Amplifier Characterization ...............................................................................146
6.4 Demonstration of High Power Picosecond Fiber MOPA.................................158
6.4.1 High Average Power Picosecond MOPA ........................................................158
6.4.2 Picosecond MOPA with Tunable Repetition Frequency and Diffraction Limited
Output ..........................................................................................................................164
6.5 Conclusion ........................................................................................................171
6.6 References ........................................................................................................173
Chapter 7. Summary and Future Works ....................................................................177
7.1 Summary ..........................................................................................................177
7.2 Future works .....................................................................................................179
Appendix: List of Publications ......................................................................................181

LIST OF TABLES
2
List of Tables
Table 3.1: Optical pulse width generated from the ns seed diode with various electrical inputs
from the Stanford pulse generator at 450 kHz…………………………………………………..67
Table 4.1. Effects of synchronous pumped generation of 3rd Raman Stokes and 5th Raman
Stokes in term of linewidth and output peak power…………………………………………...102
Table 6.1. Measured input and output powers for preamplifier 2 at various repetition
frequencies..................................................................................................................................151
LIST OF FIGURES
3
List of Figures
Figure 2.1. Physical mechanism of gain in a semiconductor laser involving pumping and
stimulated emission………………………………………………………………………….…24
Figure 2.2 Far field patterns for (a) broad area laser and (b) ridge waveguide single mode laser.
The illustrations show the influence of optical spatial mode on the far field patterns................26
Figure 2.3. Typical L-I curve for a semiconductor laser.............................................................26
Figure 2.4. Energy level diagram of Yb3+ consisting of 2 manifolds, the 2F7/2 ground manifold
(with 4 Stark levels labeled a, b, c and d) and the 2F5/2 excited manifold (with 3 Stark levels
labeled e, f and g)........................................................................................................................28
Figure 2.5. Absorption and emission cross section for Yb3+ ions in an germanosilicate
glass.............................................................................................................................................29
Figure 2.6. Light propagation in an optical fiber…………………………………………….…30
Figure 2.7. Cross section of a high birefringence PM (Panda) fiber with core doped with rare-
earth.............................................................................................................................................32
Figure 2.8. Energy levels diagram involving emission and absorption of photon in a quasi-three-
level-Yb-system…………………………………………………………………………...........33
Figure 2.9. Double-clad fiber consists of a rare-earth-doped core surrounded by a much larger
and higher-NA inner cladding [16]……………………………………………………………..36
.Figure 2.10. Various designs of double-clad fibers. The fiber core is shown in blue, the inner
cladding in light gray, and the outer cladding in dark gray. The skew modes are shown in
red.[17]…………………………………………………………………………………...…….36
Figure 2.11. Free space end pumping configuration for converting low-beam-quality pump light
into high beam quality laser output.............................................................................................37
Figure 2.12. GT Wave multimode fiber coupler schematic with signal port (s) and pump port (p)
[19]..............................................................................................................................................37
Figure 2.13. A typical design of double clad LMA fiber with its core doped with rare-earth
ions..............................................................................................................................................39
Figure 2.14. Master oscillator power amplifier (MOPA) configuration. The seed is driven by
electronic drivers and the power amplifier consists of a cascaded preamplifier and power
amplifier. Delivery fiber and BDO are used for ease of handling and transferring power to the
point of application……………………………………………………………………….....….39
.Figure 2.15. Numerical calculation on Gaussian pulse and square pulse and their corresponding
spectra due to SPM. The maximum phase shift was set at 4.5 π.................................................44
Figure 2.16. Numerical calculation showing the effect of temporal pulse shape on spectral
broadening due to SPM...............................................................................................................45
LIST OF FIGURES
4
Figure 2.17. Raman gain coefficient curve of a silica core single mode fiber. The curve is
normalized to 1.0 at 440cm-1. The peak gain for a pump wavelength of 1060nm is 1 x 10-13
m/W and varies with pump wavelength as 1/λp [39]................................................................46
Figure 2.18. Numerical calculation using the coupled equations to illustrate the growth of
Raman stokes (1st and 2nd Stokes) as well as the depletion of pump power...........................47
Figure 3.1. Optical intensity passing through a short segment of a saturable pulse
amplifier....................................................................................................................................55
Figure 3.2. The calculated saturation energy for different fiber core radius and 1060 nm
operation wavelength. Calculation made with the assumption that Γ_s=1 ..............................57
Figure 3.3. The calculated intensity profiles for rectangular shape input pulse (blue) and the
output pulses at 10 dB (green) and 30 dB (red) gain respectively.............................................58
Figure 3.4. Effects of temporal distortion as a result of the gain saturation effect in a fiber
amplifier and the mitigation of gain saturation through pre-compensated optical shape...........59
Figure 3.5. Configuration for PM ytterbium-doped fiber MOPA system................................. 61
Figure 3.6. Spectrum of PM MOPA with the total output power of 72 W (0.72 mJ)................63
Figure 3.7. Various shapes of the optical pulse at the output of the MOPA measured with a fast
photodetector. Insets show the respective electrical pulse shapes generated by the AWG.......64
Figure 3.8. (Top) Schematic of SMART ytterbium-doped fiber laser system and (bottom) the
photo of the actual setup……………………………………………………...…………….…66
Figure 3.9: Spectrum of the seed diode for different electrical pulse width……………….…67
Figure 3.10: (a) Division of optical pulse into sections for spectrogram measurement.
Spectrogram obtained for (b) 20ns, (c) 40ns and (d) 60ns electrical pulse width………….…68
Figure 3.11: Pulse shape (100 ns) and spectrum at the input of the pre-amplifier………….…69
Figure 3.12: Pulse shape and spectrum at the output of the pre-amplifier. The pulse energy was
calculated to be 7.3µJ................................................................................................................70
Figure 3.13: Output power and gain extracted from the pre-amplifier with 100 ns pulse.........70
Figure 3.14: Gain evolution across the output pulse. Fitting was done by using Equation (3.
11)..............................................................................................................................................71
Figure 3.15: Pulse shape (30ns) and spectrum at the output of the seed diode..........................71
Figure 3.16: Pulse shape and spectrum at the output of the pre-amplifier. Pulse energy was
calculated to be 10 µJ.................................................................................................................72
Figure 3.17: Output power and gain extracted from the pre-amplifier for 30ns pulse……..….72
Figure 3.18: Gain evolution across the output pulse. ………………………………….…..…73
LIST OF FIGURES
5
Figure 3.19: Average output power as a function of pump power. Up to 45W of average power
was obtained with a pulse energy of 0.45mJ................................................................................73
Figure 3.20: The evolution of pulse shape and spectra as a function of pump power coupled into
the power amplifier.......................................................................................................................74
Figure 3.21: Gain evolution G(t) across the output pulse at a pump power of 45W. The
estimated saturation energy was 0.1mJ........................................................................................74
Figure 3.22: Spectra of backward travelling ASE before and after propagating across the AOM
when operating at pump power of 45W.......................................................................................75
Figure 3.23: Illustration of the function of the AOM in shaping the top of the input signal
pulse..............................................................................................................................................76
Figure 3.24: The input pulse shape into the power amplifier without (left) and with (right) pre-
shaping using an AOM.................................................................................................................77
Figure 3.25: Temporal and spectral evolution of the of the optical pulses as a function of pulse
energy...........................................................................................................................................77
Figure 3.26: The output pulse shape (left) measured at an average output power of 15W and the
corresponding reflected pulse shape (right) travelling in the backward direction.......................78
Figure 3.27: (a) The setup for measuring the SRS threshold at the output of the system and (b)
transmission curve of the dichroic mirrors used at AOI of 45˚ and AOI of 60˚..........................79
Figure 3.28: The peak power of the signal at 1060nm correspond to the first order Raman
threshold for different lengths of beam delivery fiber. The blue squares are the measured values
while the red solid line is the best fit calculated from Equation (2.33) with gR = 0.8 x 10⁻¹³
m/W..............................................................................................................................................80
Figure 3.29: The pulse shape of signal and 1st order Raman Stokes as well as the output
spectrum obtained for a delivery fiber length of 1m....................................................................80
Figure 3.30. (Top) Unfilled pulse envelopes for (a)50 ns,(b) 60 ns, (c)100 ns and (d)150 ns.
(Bottom) The Si material response on unfilled pulses.................................................................82
Figure 3.31. (Top) Energy filled pulse envelopes for (a)50 ns,(b) 60 ns, (c)100 ns and (d)150 ns.
(Bottom) The Si material response on energy filled pulses.........................................................83
Figure 3.32. Si material response with tailored pulses having different peaks and tails power
levels.............................................................................................................................................84
Figure 4.1. Simulation result of the cascaded Raman generation of a Gaussian pump pulse…..90
Figure 4.2. Simulation results on the evolution of pump and Raman Stokes components for a
perfectly rectangular shape pump pulse.......................................................................................91
Figure 4.3. Simulation results on the evolution of pump and Raman Stokes components when a
rectangular shaped pulse with finite rise and fall time was used..................................................92
Figure 4.4. Experimental setup of the fiber Raman laser…………………………….…………93
LIST OF FIGURES
6
Figure 4.5. (a) 3-step output pulses of MOPA, SHG and Raman lines (inset: initial pulse shape
from the EOM); (b) Spectrum of MOPA output; (c) Spectrum of SHG output...........................95
Figure 4.6. (a) Spectrum of Raman pulses with simultaneous excitation of green, yellow and red
light (inset: picture of the Raman output diffracted by a grating); (b) Overall and separated 3-
step output pulses of Raman output..............................................................................................96
Figure 4.7. (Above) 2-step output pulses of Raman conversion with different pulse energy and
separation; (Below) Spectra of the Raman pulses: exciting green and yellow colours
simultaneously (inset: picture of the Raman output diffracted by a grating)...............................97
Figure 4.8. Spectra of the 1st and 4th Raman Stokes with 2-step output pulses in different
lengths of Raman gain fiber........................................................................................................98
Figure 4.9. Experimental setup of the fiber Raman laser synchronously pumped by SHG from a
PM MOPA..................................................................................................................................99
Figure 4.10. Photo of SPFRL when in operation.......................................................................100
Figure 4.11. Spectra of single-pass Raman generation in visible region with a flat-topped
rectangular pump pulse and different pump power. Up to 6 orders of Stokes were
generated.....................................................................................................................................100
Figure 4.12. Spectra of 1st Raman Stokes generation with and without feedback. The feedback
signal was at 543.1nm. The output peak power obtained was 2.3W..........................................101
Figure 4.13. Pulse shapes consisting of different components of Raman Stokes orders and
residual pump which was spectrally resolved using a bulk grating...........................................103
Figure 4.14. Spectra of visible tunable Raman laser for (a) 1st Raman Stokes, (b) 3rd Raman
Stokes and (c) 5th Raman Stokes...............................................................................................103
Figure 4.15. Spectra of single-pass Raman generation with a flat-topped rectangular pump pulse
and different pump power. Distinct Raman Stokes were generated in a controllable fashion
before continuum started to build up as zero dispersion wavelength was within the
proximity....................................................................................................................................104
Figure 4.16. Spectra of the 4th Raman Stokes with and without feedback signal. The feedback
signal was at 1303nm.................................................................................................................105
Figure 4.17. The spectra of wavelength tunability by tuning the feedback signal of 4th Raman
Stokes. Up to 28nm of continuous tuning range was achieved..................................................105
Figure 4.18. Generation of synchronous pumped Raman Stokes when Raman gain medium
length was reduced to 25m. The peak power obtained was 400W (1st Raman Stokes) and 590W
(2nd Raman Stokes)...................................................................................................................106
Figure 5.1. Typical evolution of the photon and carrier density during gain switching cycle in a
semiconductor laser diode..........................................................................................................112
Figure 5.2. Experimental configuration for direct gain switching.............................................113
LIST OF FIGURES
7
Figure 5.3. RF amplifier (ZHL-5W) output power at different input signal power for operating
frequencies of 1 GHz and 2 GHz. The output power begins to saturate when the input power
exceeds -3 dBm.......................................................................................................................114
Figure 5.4. Output pulse and spectrum obtained from gain switching an Oclaro SLD...........115
Figure 5.5. Output pulse and spectrum obtained from gain switching of a 3SPhotonics
SLD.........................................................................................................................................115
Figure 5.6. Output pulse and spectrum obtained from gain switching a Qphotonics SLD. The
black line spectrum corresponds to a peak-to-peak drive current of 600 mA while the red line
corresponds to a peak-to-peak drive current of 300 mA………………………………….....116
Figure 5.7. Numerical calculation for the generation of gain switched optical pulse from SLD
with different photon lifetime values......................................................................................117
Figure 5.8. Numerical calculation of gain spectra when the carrier density is varied from 1.25 x
1024 m-3 to 1.6 x 1024 m-3....................................................................................................118
Figure 5.9. Experimental configuration for gain switching with external seeding.................119
Figure 5.10. Output pulses and spectra obtained from external injection seeded gain switched
Oclaro SLD at different seeding power……………………………………………………..120
Figure 5.11. Output pulses and spectra obtained from external injection seeded gain switched
Qphotonics SLD at different seeding power...........................................................................120
Figure 5.12. Output pulses and spectra obtained from a 3SPhotonics SLD when external seeding
is applied at different power levels………………………………………….…………...….121
Figure 5.13. Picosecond pulse generation through active mode-locking with FBG as external
cavity……………………………………………………………………….………………..123
Figure 5.14. Spectral profiles of the gain-switched laser diode with (black line) and without (red
line) FBG. (Inset) Temporal profiles for the seeded (black line) and unseeded (red line)
cases.........................................................................................................................................124
Figure 5.15. Optical pulse width measured at different repetition frequencies and (color) the
corresponding optical pulse shapes………………………………………………………..…125
Figure 5.16. Optical spectra measured for a range of injection current modulation frequencies
showing the observed wavelength shift with respect to the central wavelength of the FBG...126
Figure 5.17. Snap shot of the pulse stability with infinite persistence mode when (left) stable
mode-locking was achieved while (right) a jittery pulse is observed and locking is no longer
stable........................................................................................................................................127
Figure 5.18. Interference patterns between the 1st and the 10th optical pulses for two different
operating frequencies corresponding to different operating regimes. The separation between
peaks corresponds to the temporal separation between the two interfering optical pulses.......128
Figure 5.19. Power spectra of the optical pulse in the frequency domain for (a) direct gain
switching and (b) mode locked operations...............................................................................129
LIST OF FIGURES
8
Figure 5.20. Power ratio plots in frequency domain as a function of frequency harmonics for
mode locked and gain switched optical pulses...........................................................................132
Figure 5.21. High resolution power spectra measurement for the mode locked optical pulses at
(a) fundamental frequency, (b) 3rd harmonics, (c) 7th harmonics and (d) 15th
harmonics..................................................................................................................................133
Figure 5.22. Experimental setup for FROG measurement via the use of
EOM………………..................................................................................................................134
Figure 5.23. (Above) Spectrogram measured directly with FROG measurement setup and
(below) spectrogram retrieved via deconvolution process.........................................................135
Figure 5.24. (a) The scanned and retrieved spectrogram of the optical pulses from Qphotonics
diode and (b) the reconstructed intensity, spectrum and phase profiles.....................................136
Figure 5.25. (a) The scanned and retrieved spectrogram of the optical output from Oclaro diode
and (b) the reconstructed intensity profile and frequency chirp across the optical
pulse............................................................................................................................................136
Figure 6.1. (Top) Fully fiberized picosecond seed laser based YDFA MOPA system
incorporating 4 amplifier stages. (Bottom) Actual photo of the MOPA
setup………........................................................................................................…….........…..145
Figure 6.2. Impulse response of the photodetector measured through the injection of a short 7ps
optical pulses…………………………………………………………………………………..146
Figure 6.3. Temporal pulse shape and spectrum measured at a repetition frequency of (a-b) 858
MHz and (c-d) 859 MHz...........................................................................................................146
Figure 6.4. Schematic of a forward core-pumped fiber amplifier……………..........................147
Figure 6.5. The characterization result of a 975/1040 nm WDM using a white light source....148
Figure 6.6. Output signal spectrum from the core-pumping preamplifier measured with different
Yb doped fiber length………………………………………………………………………….149
Figure 6.7. Output signal spectrum measured with forward pumping and backward pumping
configurations at 53 MHz repetition frequency..........................................................................150
Figure 6.8. Ratio of signal to ASE power and the amount of backward travelling ASE measured
at different output signal power………………………………………………………………..150
Figure 6.9. The configuration of a forward cladding-pumping fiber amplifier..........................152
Figure 6.10. Isolation curve measured at different wavelength for the high power inline isolator.
Red dash line shows the operating wavelength with approximately 33 dB isolation................153
Figure 6.11. Output spectra measured after the 3rd preamplifier with different lengths of doped
fiber.............................................................................................................................................154
Figure 6.12. Spectrum measured at different repetition frequencies, showing the effect of
spectral broadening due to SPM. (OSA resolution: 0.1nm)……………………………..….....155
LIST OF FIGURES
9
Figure 6.13. Spectral bandwidth measured at -10dB level at different repetition frequencies and
output powers............................................................................................................................156
Figure 6.14. (a) Total pump power measured at different injected current and (b) the
corresponding pump spectra......................................................................................................157
Figure 6.15. Output spectrum measured with different input pulse duration (28 ps and 35
ps)..............................................................................................................................................159
Figure 6.16. Average signal output power vs. launched pump power of the power stage
amplifier………………………………………………………………………………….........160
Figure 6.17.(a) Spectra measured at various output powers at a resolution setting of 1.0 nm and
(b) optical pulse width measured directly with a fast photodetector........................................161
Figure 6.18. (a) Measured spectral linewidth as a function of output signal power and (b)
broadening in signal linewidth as a result of SPM. In all cases, OSA resolution was set at 0.1
nm………………………………………………………………………………………...…...162
Figure 6.19. (Top) Output beams captured with a CCD camera at various output power levels
and (Bottom) M2 measurement curve at 200W output power..................................................163
Figure 6.20. Fully fiberized picosecond seed laser based MOPA with tunable repetition
frequency....................................................................................................................................164
Figure 6.21. Pulse shape of the seed (black line) and output (red dash line) of the third
preamplifier, when operating at a repetition frequency of 214 MHz.........................................165
Figure 6.22. Output spectra after various amplification stages..................................................165
Figure 6.23. Average signal output power vs. launched pump power of the power stage
amplifier.....................................................................................................................................167
Figure 6.24. Spectra measured at various repetition frequencies at an average output power of
200 W and an input signal power of 2.6 W. Note that the average output power at 53 MHz was
108 W……………………………………………………………………………………..…...167
Figure 6.25. The spectral profiles after the third preamplifier stage (solid lines) as well as the
output of the MOPA at 113 W and 171 W of average powers for 1.4 W of input signal
power…………………………………………………………………………………………..169
Figure 6.26. Evidence of pulse width broadening at the highest operating peak power…....…169
Figure 6.27. Signal linewidth measured at different signal output powers across all repetition
frequencies.................................................................................................................................170
Figure 6.28. SPM effect on signal linewidth at various output average powers with repetition
frequency of 53 MHz ................................................................................................................171

LIST OF FIGURES
10

DECLARATION OF AUTHORSHIP
11
DECLARATION OF AUTHORSHIP
I, PEH SIONG TEH declare that the thesis entitled
HIGH PERFORMANCE PULSED FIBER LASER SYSTEMS FOR SCIENTIFIC &
INDUSTRIAL APPLICATIONS
and the work presented in it are my own. I confirm that:
this work was done wholly or mainly while in candidature for a research degree at this
University;
where any part of this thesis has previously been submitted for a degree or any other
qualification at this University or any other institution, this has been clearly stated;
where I have consulted the published work of others, this is always clearly attributed;
where I have quoted from the work of others, the source is always given. With the
exception of such quotations, this thesis is entirely my own work;
I have acknowledged all main sources of help;
where the thesis is based on work done by myself jointly with others, I have made clear
exactly what was done by others and what I have contributed myself;
Parts of this work have been published (see list of publications).
Signed: PEH SIONG TEH
Date: March 2015

ACKNOWLEDGEMENTS
12
Acknowledgements
I would like to express my upmost gratitude to my supervisor, Prof. David Richardson, for
taking me onboard his dynamic research group, Short Pulse Fiber Laser group. I am thankful to
him for his endless guidance and support throughout this dissertation.
I am particularly thankful to my co-supervisor, Dr Shaif-ul Alam for his advice and
assistance in keeping my progress on track. I am grateful that he helps me to adapt to the new
research environment and always be there to provide valuable suggestions which help me to
achieve the research goal.
I am fortunate to work among the dedicated group members that are always helpful and
supportive. Hereby, I extend my thanks in particularly to Dr Jonathan Price, Dr Martin Bennedt,
and Dr Alexander Heidt for their useful advices and contributions. I wish to acknowledge Dr
Richard Lewis for his efforts of helping me to setup the high power pulsed laser system. I would
like to offer my thanks to Dr Ee Leong Lim for being a supportive senior and his generosity in
sharing the optical equipments.
My special thanks are extended to Dr Yongmin Jung and Dr Zhihong Li, for being such
good companions and good friends. I really enjoyed our daily discussions on almost everything
and of course our regular breaks.
In addition, a thank you to Dr Dejiao Lin for his directly and indirectly help throughout
these 4 years. I would like to thank Dr Christophe Codemard and Dr Philip Gorman for their
generous insights and sharing. I have to thank Dr Morten Ibsen for his valuable opinions about
the fiber Bragg grating.
I am thankful to the Government of Malaysia and Public Service Department for
providing me with scholarship for my PhD study.
Most importantly, not of this could have happen without my wife, Tze Wern Yeap who
offered her unconditional support and I will forever indebted to her for the sacrifices she made
for the past 4 years.
Last but not least, I would like to thank all my family members for providing moral and
financial supports during my PhD journey.
LIST OF ABBREAVIATIONS
13
List Of Abbreaviations
AOM Acousto Optic Modulator
ASE Amplified Spontaneous Emission
AWG Arbitrary Waveform Generator
BDO Beam Delivery Optic
CCD Charge-Coupled Device
CFBG Chirped Fiber Bragg Grating
CW Continuous Wave
DC Direct Current
DCA Digital Communication Analyzer
DCF Double Clad Fiber
DFB Distributed Feedback
DPSS Diode Pumped Solid State
EOM Electro Optic Modulator
FBG Fiber Bragg Grating
FROG Frequency Resolved Optical Gating
FSR Free Spectral Range
FWHM Full Width at Half Maximum
FWM Four Wave Mixing
GS Gain Switching
GVM Group Velocity Mismatch
HWP Half Wave Plate
ICMF Injection Current Modulation Frequency
LBO Lithium Triborate
LIBS Laser Induced Breakdown Spectroscopy
LIFT Laser Induced Forward Transfer
LMA Large Mode Area
MBE Molecular Beam Epitaxy
MFD Mode Field Diameter
MOCVD Metal Organic Chemical Vapour Deposition

LIST OF ABBREAVIATIONS
14
MOPA Master Oscillator Power Amplifier
NA Numerical Aperture
NIR Near Infrared
OPO Optical Parametric Oscillator
OSA Optical Spectrum Analyzer
OSNR Optical Signal to Noise Ratio
PBS Polarization Beam Splitter
PCB Printed Circuit Board
PCF Photonic Crystal Fiber
PER Polarization Extinction Ratio
PM Polarization Maintaining
RE Rare Earth
RF Radio Frequency
RMS Root Mean Square
SC
SBS
Supercontinuum
Stimulated Brillouin Scattering
SHG Second Harmonic Generation
SLD Semiconductor Laser Diode
SMSR Side Mode Suppression Ratio
SPFRL Synchronous Pumped Fiber Raman Laser
SPM Self Phase Modulation
SRS Stimulated Raman Scattering
TBP Time Bandwidth Product
TFB Tapered Fiber Bundle
VBG Volume Bragg Grating
VECSEL Vertical External Cavity Surface Emitting Laser
WDM Wavelength Division Multiplexer
XPM Cross Phase Modulation
YDF Ytterbium Doped Fiber
CHAPTER 1: Introduction
15
Chapter 1. Introduction
The development of advanced high power pulsed fiber laser systems has come a long way since
the first working laser was demonstrated [1]. In terms of performance, there is still much room
for improvement especially in power scaling and the suppression of nonlinear effects. This
thesis reports the development of short optical pulse fiber lasers giving relatively high energy,
high average powers and high peak powers. The attractive features of the pulsed fiber laser
systems will be explored in the context of material processing and frequency conversion.
1.1 Motivations
When the laser was first demonstrated in 1960 scientists had no idea of the potential and
benefits that lasers could bring. However, the high brightness of lasers made them attractive for
many scientific and industrial applications. Just 25 years later, engineers started to incorporate
optical fiber amplifiers in telecommunication systems. This was truly the first step towards the
development of high power fiber lasers. It did not take long before the first commercial fiber
lasers were launched with average power levels in the range of a few Watts to few tens of Watts
and they started to penetrate into the industrial and defence applications, which were so far
dominated by solid state, and gas based lasers.
The high power pulsed lasers used in industrial applications are based on solid state laser
systems. Ti:Sapphire based mode locked laser system is capable of producing ultrafast pulses
and is thus a popular system for most high end applications. However, many of these systems
are bulky, expensive and require constant maintenance due to the presence of free space optics.
Furthermore, thermal effects are a major issue in all solid state based laser systems that need to
be addressed as well. Fiber laser system with superior heat management capabilities, a wide
gain bandwidth and above all the ability to maintain beam quality irrespective of the output
power provides a solution to many of the problems faced by bulk lasers. Ytterbium-doped fiber
lasers can operate both in continuous-wave and pulsed modes. It has an excellent optical-to-
optical efficiency which helps in reducing the heat load. Furthermore, high power operation is
also made possible as the heat generated within the fiber can be dissipated effectively due to the
large surface area to volume ratio of the fiber. Moreover, the system can be housed in a small
form factor and thus allows a compact system with comparable performance to that of a bulk
solid state system. The total cost of manufacturing and the running costs are far lower than for
bulk lasers, making this laser system an attractive alternative for a lot of applications such as
welding, marking and cutting of metals and other materials. Further development of fiber based
laser systems is still underway to explore the potential for even higher average power, peak
CHAPTER 1: Introduction
16
power and pulse energy than have been demonstrated thus far with a diffraction-limited output
beam.
The ever increasing demands for high average power, peak power and pulse energy from fiber
lasers have brought up a number of practical issues those need to be resolved. In the fiber based
pulsed Master-Oscillator-Power-Amplifier (MOPA) system, the leading edge of tens of
nanosecond optical pulses are preferentially amplified over the trailing edge due to the gain
saturation effect, resulting in distortion of the optical pulse. This often manifests itself as a sharp
peak at the leading edge whose peak power is many times higher than that of the trailing edge
and the width of the optical pulse becomes narrower than the input one. However, when the
output pulse energy is less than or comparable with the saturation energy of the active fiber,
then the pulse can be amplified without observing any significant distortion.
Pulses with a high instantaneous power at the leading edge will suffer nonlinear phenomena
such as Self Phase Modulation (SPM), Stimulated Raman scattering (SRS) and stimulated
Brilliouin scattering (SBS). SPM will broaden the output spectrum due to the induced nonlinear
phase shifts but this does not affect the system performance adversely unless the associated
spectral broadening is limiting (for frequency conversion). The most important nonlinear effect
that adversely affects the performance of a fiber laser is the inelastic scattering due to both SRS
and SBS. Both nonlinear effects can reduce the total energy contained in the output pulse. SBS
travels in the backward direction and has a relatively lower threshold. This can jeopardize the
entire system if a high peak power Stokes due to SBS propagates back towards the seed. In
order to suppress the SBS effect, the seed diode needs to operate with a broader linewidth
(ideally tens of GHz). In the case of SRS, a high peak power exceeding the Raman threshold
will cause energy in signal wavelength to become depleted and the generation of Stokes
wavelengths. Thus, for a signal with a broad linewidth, the maximum peak power that the
system can sustain solely depends on the Raman threshold. This threshold is proportional to the
mode area and inversely proportional to the length of the fiber.
I was principally involved in a Technology Strategy Board (TSB) project known as the SMART
laser manufacturing project. This was a joint project with two partners; SPI Lasers (UK) Ltd.
and the Institute for Manufacturing (IfM) of the University of Cambridge. The aims of this
project were to develop an all-fiber, high power pulse source at 1060 nm capable of generating a
pulse energy greater than 1mJ, an average power of more than 60W, a pulse duration from a few
nanoseconds to tens of nanosecond and a peak power of up to 20kW. For maximum flexibility,
a Master-Oscillator-Power-Amplifier (MOPA) approach was adopted. An acousto-optic
modulator (AOM) was used to shape the square input pulse in order to reduce the gain
saturation effects in the amplifiers. This provided the control needed for tailoring the required
CHAPTER 1: Introduction
17
output pulse without triggering too much of a nonlinear effect. However, as the response of the
AOM (10 – 100 ns) is slower as compared to Electro-Optic Modulator (EOM), the pulse
shaping was limited to a certain extent and may not be ideal for user defined output pulses (i.e.
square) in a relatively high gain system. However, due to the higher power handling capability
and lower insertion loss characteristics, an AOM has the potential to reduce the number of
amplification stages. The SMART laser system was then used for material processing trials and
the performance of the system will be discussed in the thesis.
Another nanosecond fiber MOPA system was also built which was a modification from the
previously available nanosecond system in our group. In this system, an EOM was primarily
used as the pulse shaping element and offered great flexibility in terms of tailoring the arbitrary
waveform, i.e. from a single rectangular pulse to a double or triple step optical pulse. This
modification involved replacement of the existing Arbitrary Waveform Generator (AWG)
(maximum clock speed of 250 MHz) with a faster AWG with a clock speed of up to ~3 GHz.
This gave more control and more accurate optical temporal profiles. Furthermore, the power
amplifier stage was redesigned with the use of a shorter but higher doping concentration Yb
doped fiber. The existing pump source, which was based on a diode stack, was also replaced
with a number of fiber coupled pump diodes with improved pump coupling efficiency. This
versatile system was used for not only material processing trials, but also for frequency
conversion applications including the selective excitation of individual and multiple Raman
Stokes lines.
The other work that will be presented here in this thesis is the generation of picosecond optical
pulses using a gain switched semiconductor laser diode. A similar technique was demonstrated
by one of our group members in the past. However, the output pulses were found to be highly
chirped and pulse compression had to be done using a CFBG in order to compress the optical
pulses down from ~100 ps to ~21 ps to achieve transform limited optical pulses. The additional
components required for compression not only increased the complexity of this setup, but also
added additional optical loss. I was involved in developing a new configuration, which required
fewer components, and which was able to generate short, transform limited, picosecond optical
pulses directly from the gain switched laser diode. Finally the gain switched laser diode
operating at 1040 nm was used to seed a cascaded fiber amplifier system. I achieved ~500 W of
output power with maximum a peak power of over 100 kW in a single mode, single polarization
beam. This is by far the highest optical power demonstrated for a picosecond fiber laser system
to date.
CHAPTER 1: Introduction
18
1.2 Historical Overview
The theoretical concept of the laser was first proposed by Albert Einstein in the year 1917 [2],
however it took almost 40 years before the first working laser could be realized. In 1960,
Theodore Maiman constructed and demonstrated the first working laser using a ruby crystal rod
as the gain medium [3]. The laser was pumped with a high power flash lamp, creating sufficient
inversion for stimulated lasing to occur, with the laser signal wavelength demonstrated at 694
nm. Not long after that, came the first fiber laser demonstrated by Elias Snitzer in the year 1963
[4]. The fibers were fabricated with a neodymium glass core and lower index glass cladding and
were pumped with a flash lamp. The efficiency of these fiber lasers was low due to the
limitation in pump power and the quality of the doped fiber rod, however, improvements in the
Rare Earth doping technique in the 1980's, sped up fiber laser research [5]. The first Ytterbium
doped fiber laser was reported in 1997 [6] and soon after a new pumping technique was
introduced to scale up the output power [7].
Ytterbium provides several unique features especially a broad absorption band that stretches
from 850nm to beyond 1150nm with a peak at 975nm which is useful for amplification
purposes[8]. The efficiency obtained from 975nm cladding pumped ytterbium doped fiber can
be better than 80% [9]. The low quantum defect and high efficiency also helps in minimizing
the heat load and the realization of very high (kW and beyond) average output power. The main
limitation is optical nonlinearity due to the long interaction length and tight confinement of laser
light in a fiber [10].
The advancement of fiber laser technology came in tandem with the development of
semiconductor laser diodes. When the semiconductor laser was first introduced in 1962, the
efficiencies were low and the threshold was relatively high [11]. Moreover, the laser only
operated at cryogenic temperatures. The slow progress in semiconductor laser development was
mainly limited by the fabrication technology that was still immature. The key technology for
the realization of high power lasers was the introduction of semiconductor growth technologies
namely metallorganic chemical vapour deposition (MOCVD) and molecular beam epitaxy
(MBE) [12]. With these techniques combined with continuous refinement on the material and
process technology, semiconductor diodes capable of generating optical output powers in excess
of 1 W at room temperature were realised.
With the introduction of the double clad fiber concept and the availability of high power
semiconductor diodes as pump lasers, the output power from fiber laser systems has grown
exponentially[13]. In the CW regime, up to 10kW of output power has been demonstrated with
diffraction limited output [14]. The capability of the kW class fiber laser system allows direct
replacement of gas lasers in applications such as metal welding, cutting and drilling.
CHAPTER 1: Introduction
19
In the pulsed regime, the demands for laser systems operating from long to ultrashort optical
pulses are increasing as a result of increasing applications in the medical, material processing
and spectroscopy arenas. Significant developments have been reported recently about the
performance of pulsed fiber based laser systems. In the femtosecond regime, close to kilowatt
level average output power was demonstrated exploiting the chirped pulse amplification
technique [15]. On the other hand, in the picosecond regime, over 300 W of average output
power was demonstrated by Dupriez et al with pump power as the only limitation to further
power scaling [16]. Furthermore, using spectral combination, up to 1.1kW of average power has
been demonstrated for nanosecond pulsed fiber lasers [17]. In the case of pulse energies, up to
27mJ has been demonstrated with a peak power up to 2.7MW in a highly multimode Yb-doped
fiber amplifier [18]. For diffraction limited output, up to 2mJ of pulse energy has been achieved
from a Q-switched fiber laser [19].
In order to reduce the nonlinear effects in high power fiber lasers, Large-Mode-Area (LMA)
fibers are used [20]. The large core diameters associated with these fibers allow the mitigation
of the detrimental nonlinear effects; raising the Raman threshold up to the hundreds of kilowatts
range [21]. However, the downside of the LMA fibers is that they are inherently multi-moded.
Various techniques have been introduced to produce clean single mode output from these LMA
fibers including fiber coiling technique [22] and tapered fibers [23] that induce higher losses for
higher order modes.
Apart from nonlinear effects, the evolution in pulse shape is a significant limiting factor in high
energy pulsed laser systems due to the modest saturation energies associated with the confined
optical mode within the fiber. This results in pulse distortion within the amplifier chain.
Adaptive pulse shaping techniques were introduced to mitigate this limitation with the use of an
EOM [24]. This also provides the flexibility to generate arbitrary shaped output pulses as well
as controlling the peak power to lie below the Raman threshold.
The ability to scale up the output power from fiber lasers along with the control of the pulse
shape, pulse energy, pulse repetition frequency and the operating wavelengths leading to rapid
penetration of fiber systems into applications such as drilling, cutting and welding, all of which
were previously dominated by other lasers.
CHAPTER 1: Introduction
20
1.3 Thesis Outline
The thesis is structured as follows.
Chapter 2 introduces semiconductor and ytterbium doped fiber technologies. The fundamental
laser physics is discussed extensively. This includes fiber amplifier design and the constraints
imparted due to various nonlinearities.
Chapter 3 discusses the development of a flexible nanosecond fiber MOPA for the SMART
project as well as results on the Si processing trials.
Chapter 4 demonstrates the wavelength conversion technique based on controllable Raman
Stokes generation. Using a nanosecond fiber MOPA with an EOM as a pulse shaping element
and LBO as a frequency doubler, a tunable Raman fiber laser in the visible region is
demonstrated.
Chapter 5 describes picosecond pulse generation by means of gain switching and mode locking
techniques of semiconductor laser diodes. The physical aspects of SLD and the characteristics
of the generated pulses are discussed here.
Chapter 6 demonstrates both high average power and high peak power picosecond MOPA
systems using the seed laser discussed in the previous chapter. The results include the highest
average power demonstrated to date from an all fiber picosecond MOPA system.
Chapter 7 concludes with a summary of the work in this thesis and discusses possible future
research.
CHAPTER 1: Introduction
21
1.4 References
1. T. H. Maiman, "Optical and Microwave-Optical Experiments in Ruby," Physical Review
Letters 4, 564-566 (1960).
2. A. Einstein, "On the quantum theory of radiation," Phys. Z (1917).
3. T. H. Mainman, "Stimulated optical radiation in ruby," Nature 187 (1960).
4. E. Snitzer, "Optical maser action in Nd3+ in a Barium crown glass," Phys. Rev. Lett. 7
(12), 444 (1961).
5. L. R. R.J. Mears, I.M. Juancey, D.N.Payne, "Low noise Erbium doped fiber amplifier
operating at 1.54um," Electronics Letters, Vol.23, No.19, 1026-1028 (1987).
6. J. N. R.Paschotta, A.C.Tropper, D.C.Hanna, "Ytterbium doped fiber amplifiers," IEEE
Journal of Quantum Electronics, 33(7), pp. 1049 - 1056 (1997).
7. R. J. C. H.M.Pask, D.C.Hanna, A.C.Tropper, C.J.Mackechnie, P.R.Barber, J.M.Dawes,
"Ytterbium doped silica fiber lasers: Versatile sources for 1 - 1.2um region," IEEE
Journal of Selected Topics in Quantum Electronics, Vol.1 No.1 (1995).
8. R. J. C. H.M. Pask, D.C. Hanna, A.C. Tropper, C.J.Mackechnie, P.R. Barber and J.D.
Dawes, "Ytterbium doped silica fibers: Versatile sources for the 1 - 1.2 um region," IEEE
Journal of selected topics in Quantum Electronics Vol.1 No.1 (1995).
9. A. M. K.T.Vu, D.J.Richardson, L.M.B.Hickey, M.N.Zervas, "Adaptive pulse shape
control in a diode seeded nanosecond fiber MOPA system," Opt. Express, Vol.14, pp.
10996-11001 (2006).
10. G. Agrawal, Nonlinear Fiber Optics (3rd Edition) (Academic Press, 2001).
11. D. F. Welch, "A brief history of high-power semiconductor lasers," Selected Topics in
Quantum Electronics, IEEE Journal of 6, 1470-1477 (2000).
12. C. R. Abernathy, "Growth of III–V materials by metalorganic molecular‐beam epitaxy,"
Journal of Vacuum Science & Technology A 11, 869-875 (1993).
13. L. Zenteno, "High-power double-clad fiber lasers," Lightwave Technology, Journal of 11,
1435-1446 (1993).
14. E.Stiles, "New development in IPG fiber laser technology," (2009).
15. S. H. T.Eidam, E.Seise, T.V.Andersen, T.Gabler, C.Wirth, T.Schreiber, J.Limpert and
A.Tunnermann, "Femtosecond fiber CPA system emitting 830W average output power,"
(2010).
16. P. Dupriez, A. Piper, A. Malinowski, J. K. Sahu, M. Ibsen, B. C. Thomsen, Y. Jeong, L.
M. B. Hickey, M. N. Zervas, J. Nilsson, and D. J. Richardson, "High average power, high
repetition rate, picosecond pulsed fiber master oscillator power amplifier source seeded
by a gain-switched laser diode at 1060 nm," Photonics Technology Letters, IEEE 18,
1013-1015 (2006).
CHAPTER 1: Introduction
22
17. C. W. O. Schmidt, I. Tsybin, T. Schreiber, R. Eberhardt, J. Limpert, and A. Tünnermann,
"Average power of 1.1kW from spectrally combined, fiber amplified, nanosecond pulsed
source," Vol.34 (2009).
18. Y.-C. C. Ming-Yuan Cheng, Almantas Galvanauskas, Pri Mamidipudi, Rupak
Changkakoti, and Peter Gatchell, "High-energy and high-peak-power nanosecond pulse
generation with beam quality control in 200-um core highly multimode Yb-doped fiber
amplifiers," Vol.30 (2005).
19. J. R. O. Schmidt, F. Röser, S. Linke, T. Schreiber, K. Rademaker, J. Limpert, S.
Ermeneux, P. Yvernault, F. Salin, and A. Tünnermann, "Millijoule pulse energy Q-
switched short-length fiber laser," Vol.32 (2007).
20. N. D.-R. J. Limpert, I. Manek-Hönninger, F. Salin, F. Röser, A. Liem, T. Schreiber, S.
Nolte, H.Zellmer, A. Tünnermann, J. Broeng, A. Petersson, and C. Jakobsen, "High-
power rod-type photonic crystal fiber laser," 13 (2005).
21. J. L. C. Jauregui, and A. Tünnermann, "Derivation of Raman treshold formulas for CW
double-clad fiber amplifiers," 17 (2009).
22. L. G. P.Koplow, R.P.Moeller, D.A.V.Kliner, "Single mode operation of a coiled
multimode fiber amplifier," Optics Letter, Vol.25, pp.442 (2000).
23. A. B. G. J.A.Alvarez-Chavez, J.Nilsson, P.W.Turner, W.A.Clarkson, "Mode selection in
high power cladding pumped fiber lasers with tapered sections," in Conference of Lasers
and Electro-Optics (CLEO) (Washington D.C USA, 1999).
24. K. T. Vu. Andrew Malinowski, Kang Kang Chen, Johan Nilsson, Yoonchan Jeong,
Shaiful Alam, Dejiao Lin and David J. Richardson, "High power pulsed fiber MOPA
system incorporating electro-optic modulator based adaptive pulse shaping," 17 (2009).
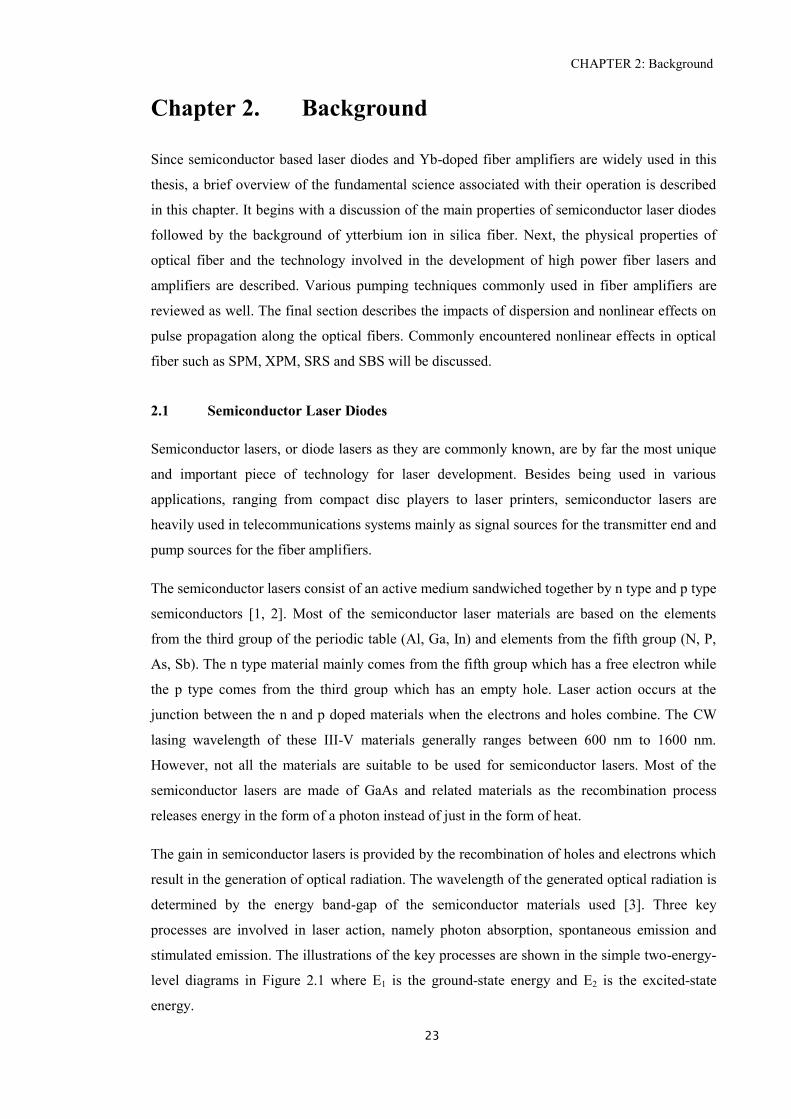
CHAPTER 2: Background
23
Chapter 2. Background
Since semiconductor based laser diodes and Yb-doped fiber amplifiers are widely used in this
thesis, a brief overview of the fundamental science associated with their operation is described
in this chapter. It begins with a discussion of the main properties of semiconductor laser diodes
followed by the background of ytterbium ion in silica fiber. Next, the physical properties of
optical fiber and the technology involved in the development of high power fiber lasers and
amplifiers are described. Various pumping techniques commonly used in fiber amplifiers are
reviewed as well. The final section describes the impacts of dispersion and nonlinear effects on
pulse propagation along the optical fibers. Commonly encountered nonlinear effects in optical
fiber such as SPM, XPM, SRS and SBS will be discussed.
2.1 Semiconductor Laser Diodes
Semiconductor lasers, or diode lasers as they are commonly known, are by far the most unique
and important piece of technology for laser development. Besides being used in various
applications, ranging from compact disc players to laser printers, semiconductor lasers are
heavily used in telecommunications systems mainly as signal sources for the transmitter end and
pump sources for the fiber amplifiers.
The semiconductor lasers consist of an active medium sandwiched together by n type and p type
semiconductors [1, 2]. Most of the semiconductor laser materials are based on the elements
from the third group of the periodic table (Al, Ga, In) and elements from the fifth group (N, P,
As, Sb). The n type material mainly comes from the fifth group which has a free electron while
the p type comes from the third group which has an empty hole. Laser action occurs at the
junction between the n and p doped materials when the electrons and holes combine. The CW
lasing wavelength of these III-V materials generally ranges between 600 nm to 1600 nm.
However, not all the materials are suitable to be used for semiconductor lasers. Most of the
semiconductor lasers are made of GaAs and related materials as the recombination process
releases energy in the form of a photon instead of just in the form of heat.
The gain in semiconductor lasers is provided by the recombination of holes and electrons which
result in the generation of optical radiation. The wavelength of the generated optical radiation is
determined by the energy band-gap of the semiconductor materials used [3]. Three key
processes are involved in laser action, namely photon absorption, spontaneous emission and
stimulated emission. The illustrations of the key processes are shown in the simple two-energy-
level diagrams in Figure 2.1 where E1 is the ground-state energy and E2 is the excited-state
energy.
CHAPTER 2: Background
24
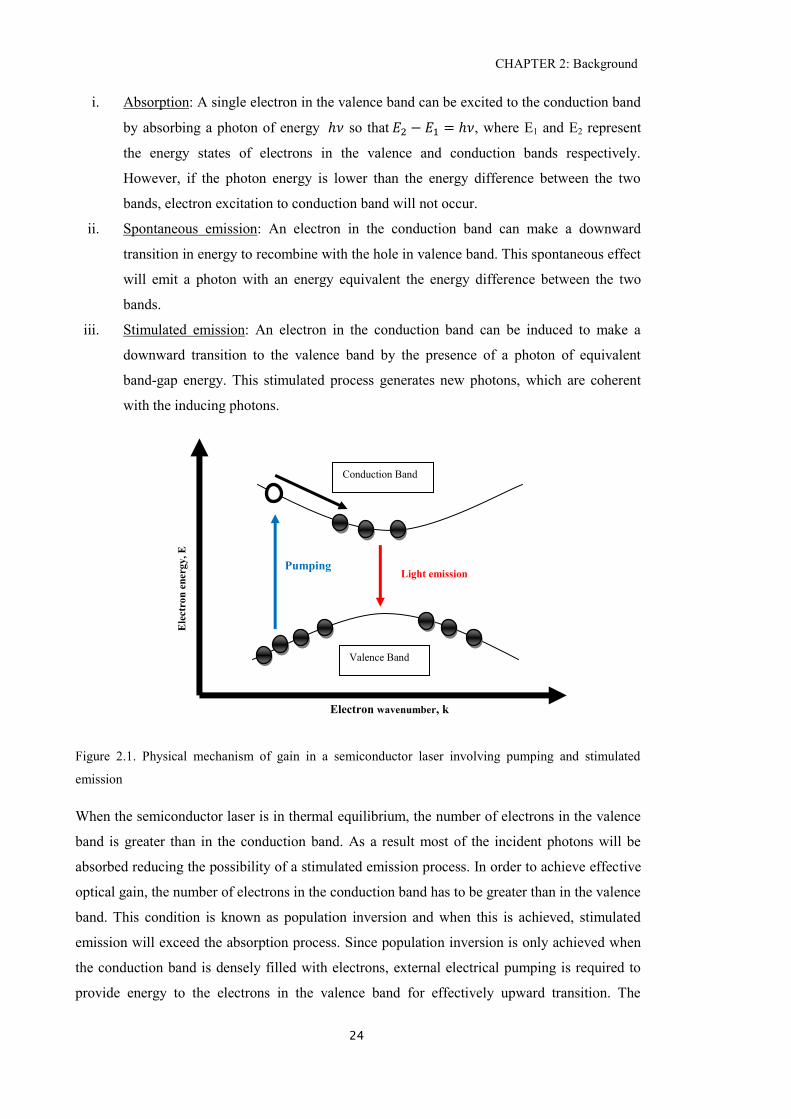
i. Absorption: A single electron in the valence band can be excited to the conduction band
by absorbing a photon of energy so that , where E1 and E2 represent
the energy states of electrons in the valence and conduction bands respectively.
However, if the photon energy is lower than the energy difference between the two
bands, electron excitation to conduction band will not occur.
ii. Spontaneous emission: An electron in the conduction band can make a downward
transition in energy to recombine with the hole in valence band. This spontaneous effect
will emit a photon with an energy equivalent the energy difference between the two
bands.
iii. Stimulated emission: An electron in the conduction band can be induced to make a
downward transition to the valence band by the presence of a photon of equivalent
band-gap energy. This stimulated process generates new photons, which are coherent
with the inducing photons.
Figure 2.1. Physical mechanism of gain in a semiconductor laser involving pumping and stimulated
emission
When the semiconductor laser is in thermal equilibrium, the number of electrons in the valence
band is greater than in the conduction band. As a result most of the incident photons will be
absorbed reducing the possibility of a stimulated emission process. In order to achieve effective
optical gain, the number of electrons in the conduction band has to be greater than in the valence
band. This condition is known as population inversion and when this is achieved, stimulated
emission will exceed the absorption process. Since population inversion is only achieved when
the conduction band is densely filled with electrons, external electrical pumping is required to
provide energy to the electrons in the valence band for effectively upward transition. The
Light emission Pumping
Conduction Band
Valence Band
(Ei)
Electron wavenumber, k
Ele
ctr
on
en
erg
y, E
CHAPTER 2: Background
25
pumping process in semiconductor laser is usually done electrically, i.e. forward biasing the p-n
junction.
Optical gain via a pumping process alone is not enough for lasing. Optical feedback is required
for laser action and this can be achieved by the polished end facets at both ends of the active
medium. This effectively creates a Fabry-Perot cavity which has two main roles. First, it
dictates the preferred direction for stimulated emission and second, it defines the longitudinal
cavity modes [4]. This cavity will create standing waves for a discrete number of frequencies
which defines the longitudinal cavity modes. The frequency mode spacing can be
determined by the following relationship,
2. 1
where c is the speed of light in vacuum, L is the length of active medium and n is the refractive
index of the active medium.
The active medium length L will affect the distance between the two modes. For a longer cavity,
the longitudinal modes will become very close to each other and a large number of modes will
present within the emission band. This is not preferred in data transmission applications because
of the potential for enhanced pulse dispersion during propagation along the fiber. Shorter cavity
lengths enable an increase in the mode spacing and a fewer number of longitudinal modes
within the emission band as long as the total cavity loss can be made low.
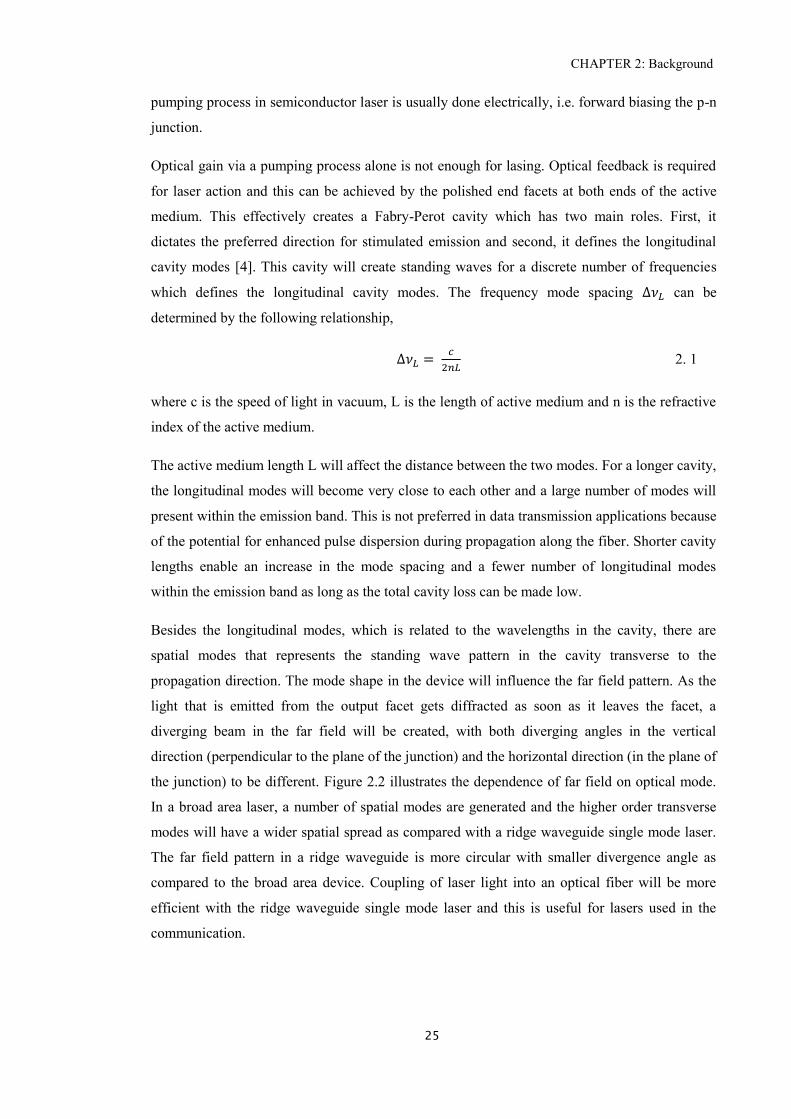
Besides the longitudinal modes, which is related to the wavelengths in the cavity, there are
spatial modes that represents the standing wave pattern in the cavity transverse to the
propagation direction. The mode shape in the device will influence the far field pattern. As the
light that is emitted from the output facet gets diffracted as soon as it leaves the facet, a
diverging beam in the far field will be created, with both diverging angles in the vertical
direction (perpendicular to the plane of the junction) and the horizontal direction (in the plane of
the junction) to be different. Figure 2.2 illustrates the dependence of far field on optical mode.
In a broad area laser, a number of spatial modes are generated and the higher order transverse
modes will have a wider spatial spread as compared with a ridge waveguide single mode laser.
The far field pattern in a ridge waveguide is more circular with smaller divergence angle as
compared to the broad area device. Coupling of laser light into an optical fiber will be more
efficient with the ridge waveguide single mode laser and this is useful for lasers used in the
communication.
CHAPTER 2: Background
26
Figure 2.2 Far field patterns for (a) broad area laser and (b) ridge waveguide single mode laser. The
illustrations show the influence of optical spatial mode on the far field patterns.
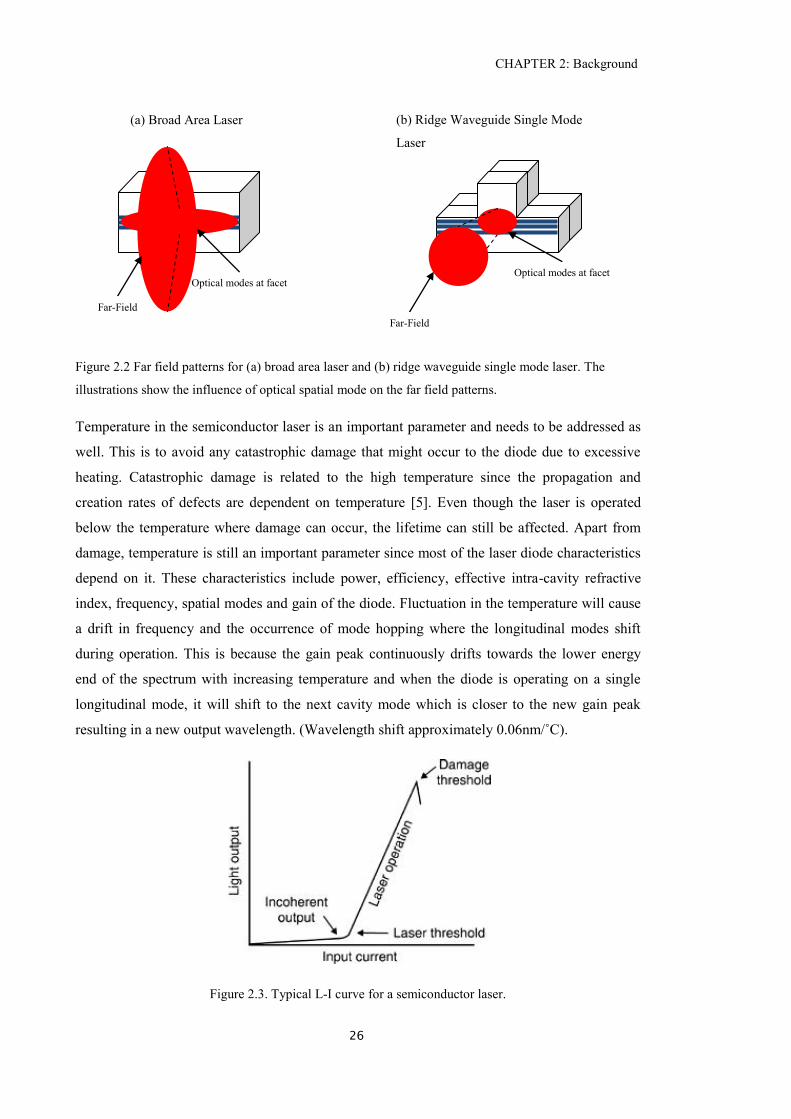
Temperature in the semiconductor laser is an important parameter and needs to be addressed as
well. This is to avoid any catastrophic damage that might occur to the diode due to excessive
heating. Catastrophic damage is related to the high temperature since the propagation and
creation rates of defects are dependent on temperature [5]. Even though the laser is operated
below the temperature where damage can occur, the lifetime can still be affected. Apart from
damage, temperature is still an important parameter since most of the laser diode characteristics
depend on it. These characteristics include power, efficiency, effective intra-cavity refractive
index, frequency, spatial modes and gain of the diode. Fluctuation in the temperature will cause
a drift in frequency and the occurrence of mode hopping where the longitudinal modes shift
during operation. This is because the gain peak continuously drifts towards the lower energy
end of the spectrum with increasing temperature and when the diode is operating on a single
longitudinal mode, it will shift to the next cavity mode which is closer to the new gain peak
resulting in a new output wavelength. (Wavelength shift approximately 0.06nm/˚C).
Figure 2.3. Typical L-I curve for a semiconductor laser.
Far-Field
Optical modes at facet
(a) Broad Area Laser (b) Ridge Waveguide Single Mode
Laser
Optical modes at facet
Far-Field
CHAPTER 2: Background
27
The laser diode output power depends on the injected current. Before reaching threshold, most
of the radiation will be from spontaneous emission and the output power is typically very low.
Above threshold, the output power increases rapidly and a typical L-I curve (Light-Current) is
shown in Figure 2.3. An increase in current will also lead to heating causing a change in the
effective cavity refractive index and a corresponding shift in the lasing wavelength.
Another limitation of the semiconductor laser is that it is sensitive to external perturbations due
to the low reflectivity of the facets. Although a low reflectivity (~30%) at the cleaved facet is
sufficient for maintaining lasing operation, any optical feedback can influence the laser diode
characteristics. However, this limitation can be useful when wavelength locking is required.
Injection locking with an external laser or from a FBG has been demonstrated and can
successfully lock this diode output at a desired lasing wavelength [6]. Furthermore, the locking
can be made to just a single longitudinal mode or several modes, depending entirely on the
bandwidth of the injected spectrum and the frequency of the mode spacing. Injection locking
can enhance the side-mode suppression ratio of the laser diode i.e. the ratio of the power in non-
lasing modes adjacent to the main laser mode and the power in the main laser mode.
2.2 Ytterbium Doped Fiber Technology
Rare Earth (RE) ions have been widely used in laser applications due to their superior
characteristics over other optically active ions; emission and absorption spectra have narrow
wavelength ranges and the transitions are insensitive to the host material. Furthermore, they
have long lifetimes for metastable states, and high quantum efficiencies. The rare earths are
divided into two groups of 14 elements in the periodic table, namely lanthanides and actinides.
Elements in the lanthanide series are primarily used for dopants in silica glass host because
many of the actinides are lack of stable isotopes. The lanthanides are characterized by filling of
the 4f shell and laser transitions occur between various energy levels of the 4f electrons. The
trivalent ions provide the most stable oxidation state amongst the lanthanide ions. Ytterbium is
an element belonging to the lanthanides group and is by far the most versatile yet important
laser ion in a silica based host.
2.2.1 Spectroscopy
Ytterbium is a member of the rare earth group of elements in the periodic table. Yb3+
is useful
for having a broad absorption band that stretches from ~850nm up to ~1064nm, an emission
band extending from ~950nm up to ~1200nm, and the simplicity of the transition levels involve.
The broad absorption band allows the choice of a wide range of pump wavelengths. The Yb3+
energy level structure consists of 2 manifolds as indicated in Figure 2.1, the 2F7/2 ground
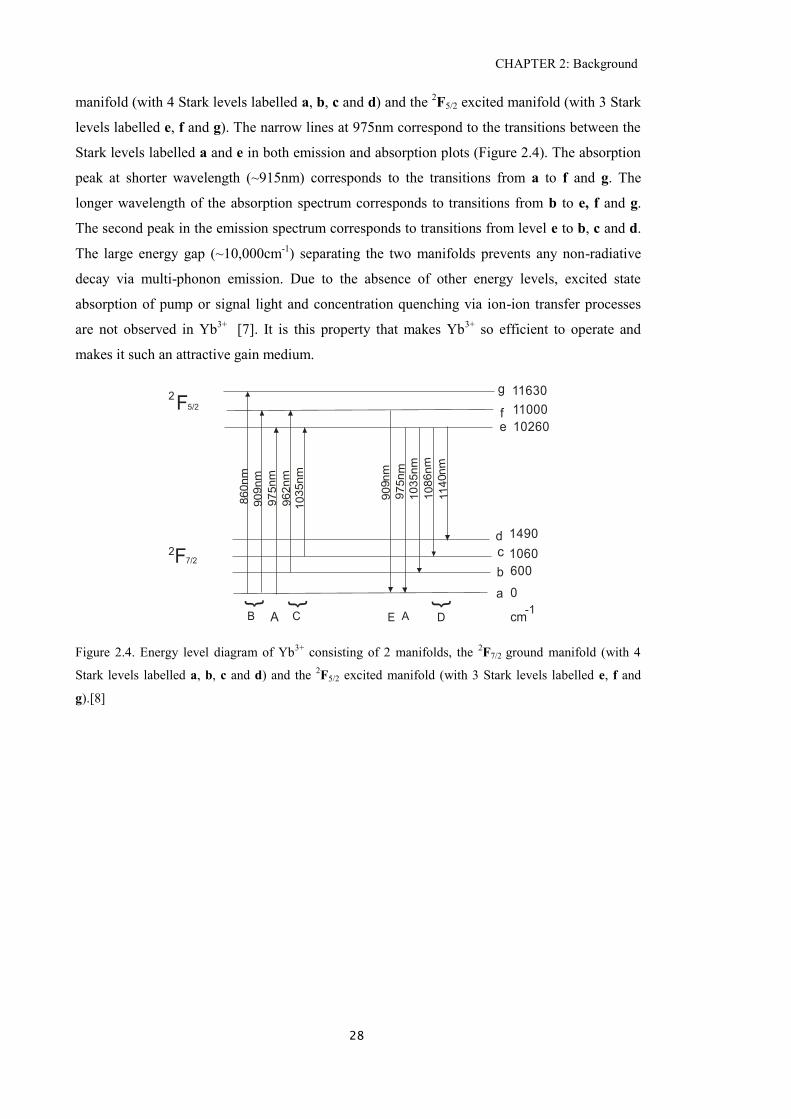
CHAPTER 2: Background
28
manifold (with 4 Stark levels labelled a, b, c and d) and the 2F5/2 excited manifold (with 3 Stark
levels labelled e, f and g). The narrow lines at 975nm correspond to the transitions between the
Stark levels labelled a and e in both emission and absorption plots (Figure 2.4). The absorption
peak at shorter wavelength (~915nm) corresponds to the transitions from a to f and g. The
longer wavelength of the absorption spectrum corresponds to transitions from b to e, f and g.
The second peak in the emission spectrum corresponds to transitions from level e to b, c and d.
The large energy gap (~10,000cm-1
) separating the two manifolds prevents any non-radiative
decay via multi-phonon emission. Due to the absence of other energy levels, excited state
absorption of pump or signal light and concentration quenching via ion-ion transfer processes
are not observed in Yb3+
[7]. It is this property that makes Yb3+
so efficient to operate and
makes it such an attractive gain medium.
F7/22
F5/2
2
a
b
c
d
ef
g
0
600
1060
1490
10260
11000
11630
-1cmA
860nm
909nm
975nm
962nm
1035nm
{ { {
B C
909nm
975nm
1035nm
1086nm
1140nm
E A D
Figure 2.4. Energy level diagram of Yb3+
consisting of 2 manifolds, the 2F7/2 ground manifold (with 4
Stark levels labelled a, b, c and d) and the 2F5/2 excited manifold (with 3 Stark levels labelled e, f and
g).[8]
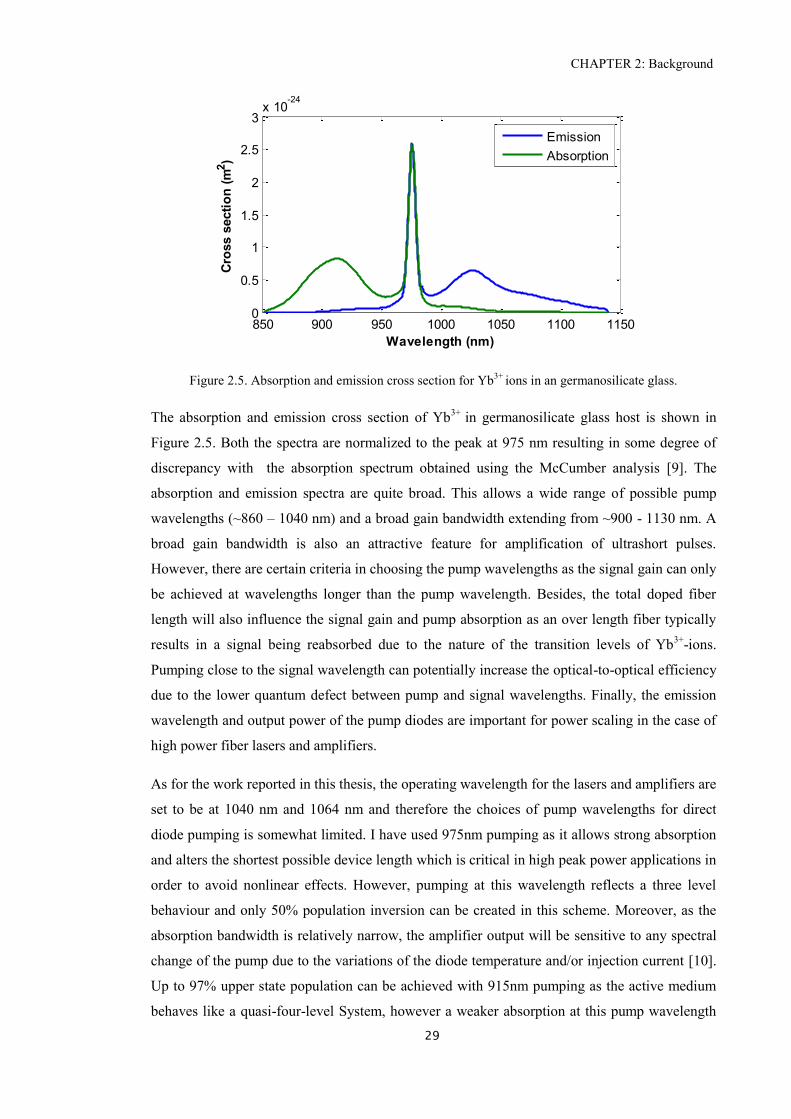
CHAPTER 2: Background
29
Figure 2.5. Absorption and emission cross section for Yb3+
ions in an germanosilicate glass.
The absorption and emission cross section of Yb3+
in germanosilicate glass host is shown in
Figure 2.5. Both the spectra are normalized to the peak at 975 nm resulting in some degree of
discrepancy with the absorption spectrum obtained using the McCumber analysis [9]. The
absorption and emission spectra are quite broad. This allows a wide range of possible pump
wavelengths (~860 – 1040 nm) and a broad gain bandwidth extending from ~900 - 1130 nm. A
broad gain bandwidth is also an attractive feature for amplification of ultrashort pulses.
However, there are certain criteria in choosing the pump wavelengths as the signal gain can only
be achieved at wavelengths longer than the pump wavelength. Besides, the total doped fiber
length will also influence the signal gain and pump absorption as an over length fiber typically
results in a signal being reabsorbed due to the nature of the transition levels of Yb3+
-ions.
Pumping close to the signal wavelength can potentially increase the optical-to-optical efficiency
due to the lower quantum defect between pump and signal wavelengths. Finally, the emission
wavelength and output power of the pump diodes are important for power scaling in the case of
high power fiber lasers and amplifiers.
As for the work reported in this thesis, the operating wavelength for the lasers and amplifiers are
set to be at 1040 nm and 1064 nm and therefore the choices of pump wavelengths for direct
diode pumping is somewhat limited. I have used 975nm pumping as it allows strong absorption
and alters the shortest possible device length which is critical in high peak power applications in
order to avoid nonlinear effects. However, pumping at this wavelength reflects a three level
behaviour and only 50% population inversion can be created in this scheme. Moreover, as the
absorption bandwidth is relatively narrow, the amplifier output will be sensitive to any spectral
change of the pump due to the variations of the diode temperature and/or injection current [10].
Up to 97% upper state population can be achieved with 915nm pumping as the active medium
behaves like a quasi-four-level System, however a weaker absorption at this pump wavelength
850 900 950 1000 1050 1100 11500
0.5
1
1.5
2
2.5
3x 10
-24
Wavelength (nm)
Cro
ss s
ecti
on
(m
2)
Emission
Absorption
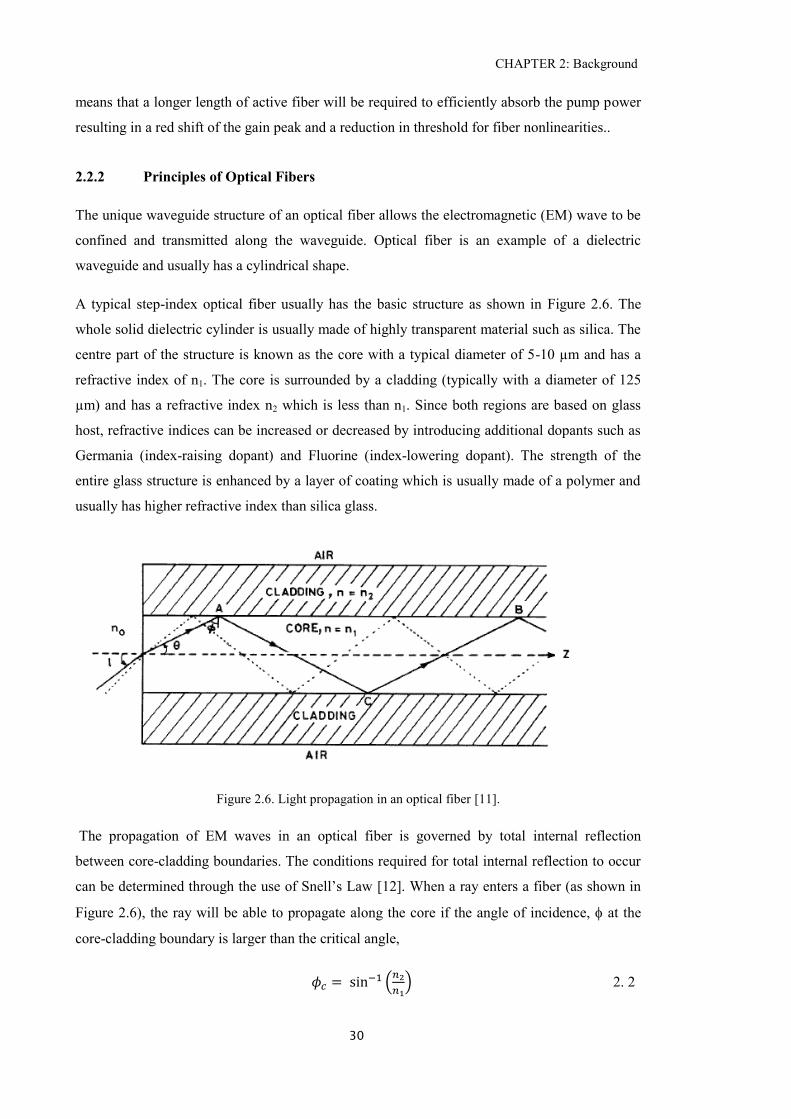
CHAPTER 2: Background
30
means that a longer length of active fiber will be required to efficiently absorb the pump power
resulting in a red shift of the gain peak and a reduction in threshold for fiber nonlinearities..
2.2.2 Principles of Optical Fibers
The unique waveguide structure of an optical fiber allows the electromagnetic (EM) wave to be
confined and transmitted along the waveguide. Optical fiber is an example of a dielectric
waveguide and usually has a cylindrical shape.
A typical step-index optical fiber usually has the basic structure as shown in Figure 2.6. The
whole solid dielectric cylinder is usually made of highly transparent material such as silica. The
centre part of the structure is known as the core with a typical diameter of 5-10 µm and has a
refractive index of n1. The core is surrounded by a cladding (typically with a diameter of 125
µm) and has a refractive index n2 which is less than n1. Since both regions are based on glass
host, refractive indices can be increased or decreased by introducing additional dopants such as
Germania (index-raising dopant) and Fluorine (index-lowering dopant). The strength of the
entire glass structure is enhanced by a layer of coating which is usually made of a polymer and
usually has higher refractive index than silica glass.
Figure 2.6. Light propagation in an optical fiber [11].
The propagation of EM waves in an optical fiber is governed by total internal reflection
between core-cladding boundaries. The conditions required for total internal reflection to occur
can be determined through the use of Snell’s Law [12]. When a ray enters a fiber (as shown in
Figure 2.6), the ray will be able to propagate along the core if the angle of incidence, at the
core-cladding boundary is larger than the critical angle,
2. 2
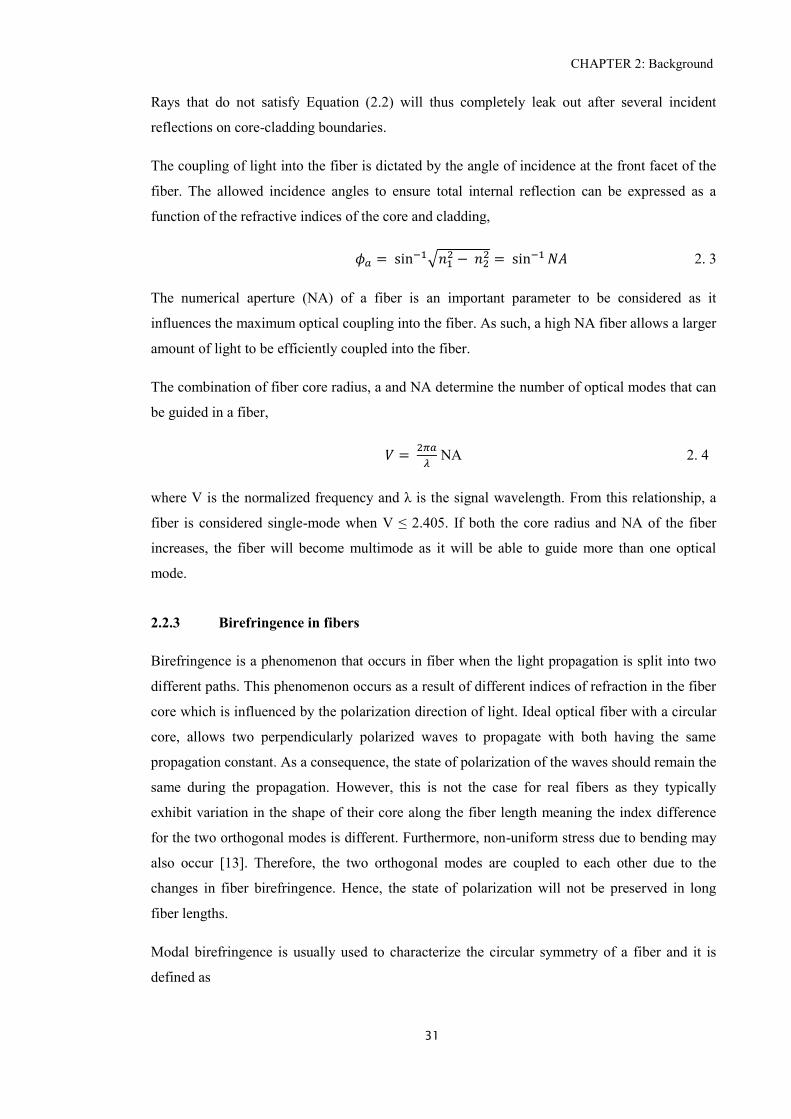
CHAPTER 2: Background
31
Rays that do not satisfy Equation (2.2) will thus completely leak out after several incident
reflections on core-cladding boundaries.
The coupling of light into the fiber is dictated by the angle of incidence at the front facet of the
fiber. The allowed incidence angles to ensure total internal reflection can be expressed as a
function of the refractive indices of the core and cladding,
2. 3
The numerical aperture (NA) of a fiber is an important parameter to be considered as it
influences the maximum optical coupling into the fiber. As such, a high NA fiber allows a larger
amount of light to be efficiently coupled into the fiber.
The combination of fiber core radius, a and NA determine the number of optical modes that can
be guided in a fiber,
NA 2. 4
where V is the normalized frequency and λ is the signal wavelength. From this relationship, a
fiber is considered single-mode when V ≤ 2.405. If both the core radius and NA of the fiber
increases, the fiber will become multimode as it will be able to guide more than one optical
mode.
2.2.3 Birefringence in fibers
Birefringence is a phenomenon that occurs in fiber when the light propagation is split into two
different paths. This phenomenon occurs as a result of different indices of refraction in the fiber
core which is influenced by the polarization direction of light. Ideal optical fiber with a circular
core, allows two perpendicularly polarized waves to propagate with both having the same
propagation constant. As a consequence, the state of polarization of the waves should remain the
same during the propagation. However, this is not the case for real fibers as they typically
exhibit variation in the shape of their core along the fiber length meaning the index difference
for the two orthogonal modes is different. Furthermore, non-uniform stress due to bending may
also occur [13]. Therefore, the two orthogonal modes are coupled to each other due to the
changes in fiber birefringence. Hence, the state of polarization will not be preserved in long
fiber lengths.
Modal birefringence is usually used to characterize the circular symmetry of a fiber and it is
defined as
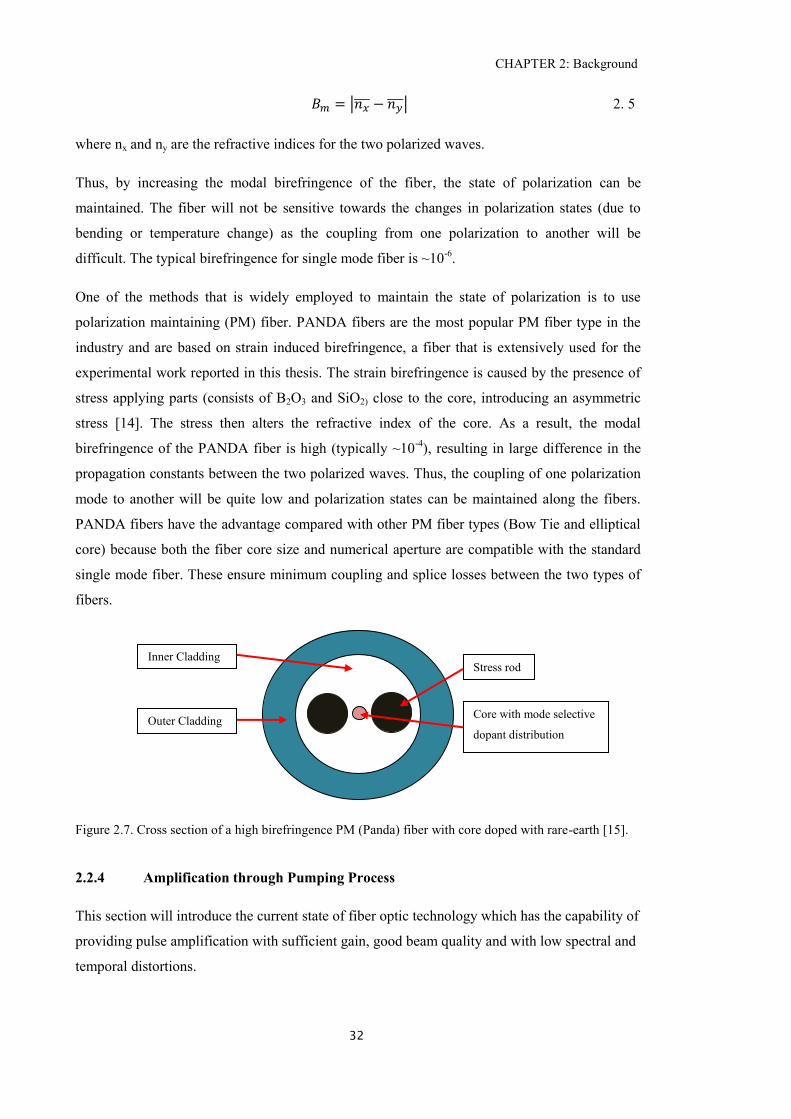
CHAPTER 2: Background
32
2. 5
where nx and ny are the refractive indices for the two polarized waves.
Thus, by increasing the modal birefringence of the fiber, the state of polarization can be
maintained. The fiber will not be sensitive towards the changes in polarization states (due to
bending or temperature change) as the coupling from one polarization to another will be
difficult. The typical birefringence for single mode fiber is ~10-6
.
One of the methods that is widely employed to maintain the state of polarization is to use
polarization maintaining (PM) fiber. PANDA fibers are the most popular PM fiber type in the
industry and are based on strain induced birefringence, a fiber that is extensively used for the
experimental work reported in this thesis. The strain birefringence is caused by the presence of
stress applying parts (consists of B2O3 and SiO2) close to the core, introducing an asymmetric
stress [14]. The stress then alters the refractive index of the core. As a result, the modal
birefringence of the PANDA fiber is high (typically ~10-4
), resulting in large difference in the
propagation constants between the two polarized waves. Thus, the coupling of one polarization
mode to another will be quite low and polarization states can be maintained along the fibers.
PANDA fibers have the advantage compared with other PM fiber types (Bow Tie and elliptical
core) because both the fiber core size and numerical aperture are compatible with the standard
single mode fiber. These ensure minimum coupling and splice losses between the two types of
fibers.
Figure 2.7. Cross section of a high birefringence PM (Panda) fiber with core doped with rare-earth [15].
2.2.4 Amplification through Pumping Process
This section will introduce the current state of fiber optic technology which has the capability of
providing pulse amplification with sufficient gain, good beam quality and with low spectral and
temporal distortions.
Stress rod
Core with mode selective
dopant distribution
Inner Cladding
Outer Cladding
CHAPTER 2: Background
33
2.2.4.1 Three Level Pumping Scheme
The representation of a quasi-three-level laser is shown in Figure 2.8. In a quasi-three-level Yb
system, the lower laser level is a sublevel of the ground state, E1 and in the upper laser level, E2,
there exist a number of upper state sublevels. Both are separated by a large energy gaps. The
total population for the ground state and upper state sub-levels can be represented by N1 and N2.
In thermal equilibrium, most of the atoms reside in the ground level. Assume that the atoms at
the pump level undergo rapid decay to the upper state sub-levels and therefore the population is
zero (i.e. N3 = 0).
The interaction between atom and photon can happen in three ways; firstly, a photon can be
absorbed when the atom is at the ground level, secondly, when the atom is at the upper level, a
photon can be emitted in the presence of another photon and thirdly, an atom emits a photon
independently irrespective of the presence of other photons. Absorption process is responsible
for the first interaction while stimulated emission governs the second interaction. The third
interaction is due to spontaneous emission. All these processes are critical in attenuation and
amplification of a signal.
Figure 2.8. Energy levels diagram involving emission and absorption of photon in a quasi-three-level-Yb-
system
The absorption and stimulated emission processes are characterized by the probability density
2. 6
N3
E3
Rapid decay
Pump
R
Laser
N2
E0
E1
N1
E2
CHAPTER 2: Background
34
where is the photon flux density and is the transition cross section at frequency . The
transition cross section is given by
where is known as the line shape function and λ is the wavelength. The parameter is the
spontaneous emission life time between two energy levels (E1 and E2)
The general rate equations are used to represent the quasi-three-level system [16].
2. 8
2. 9
2. 10
Where Nt is the total atomic population in the system; t2 is the lifetime of the atoms in the upper
energy level E2; t1 is the lifetime of the atoms in the lower energy level E1; R is the pumping
rate.
Equation (2.9) and (2.10) can be reduced further with t1 = ∞ and t2 = tsp. At steady state, both
equations provide similar result:
2. 11
Rearranging Equation (2.8) into
2. 12
Substituting Equation (2.12) into Equation (2.11) will result in the following equations:
2. 13
2. 7
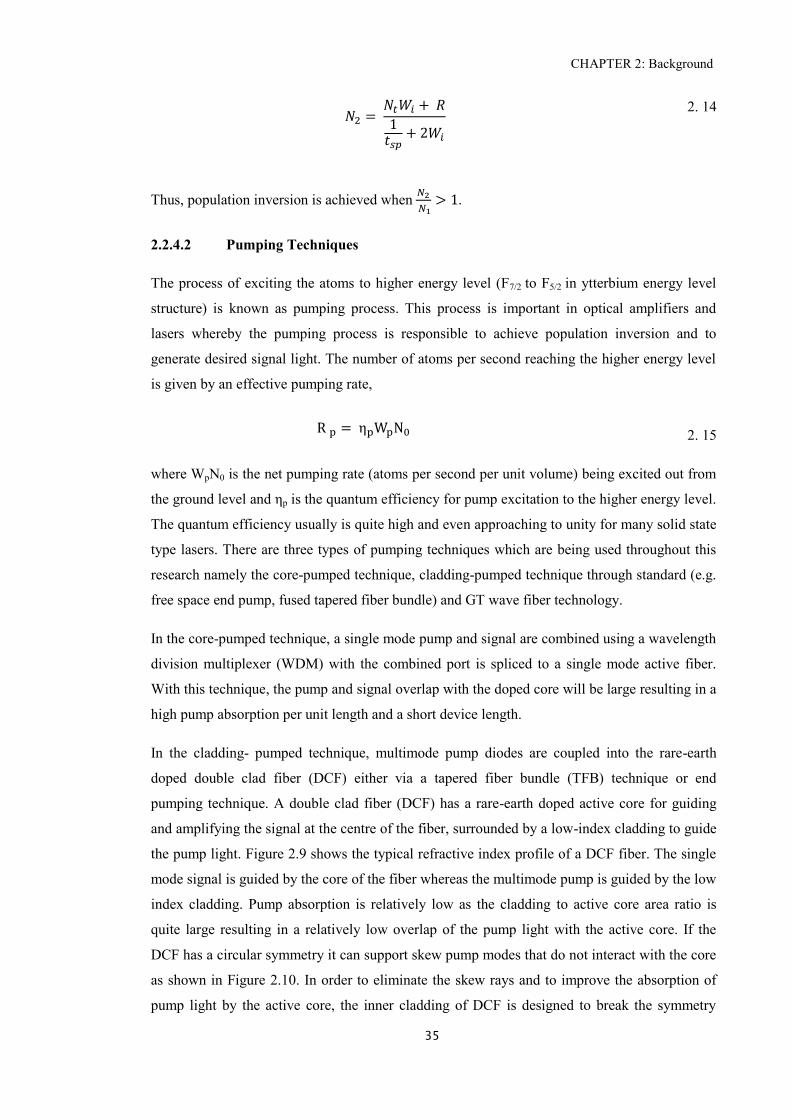
CHAPTER 2: Background
35
2. 14
Thus, population inversion is achieved when
.
2.2.4.2 Pumping Techniques
The process of exciting the atoms to higher energy level (F7/2 to F5/2 in ytterbium energy level
structure) is known as pumping process. This process is important in optical amplifiers and
lasers whereby the pumping process is responsible to achieve population inversion and to
generate desired signal light. The number of atoms per second reaching the higher energy level
is given by an effective pumping rate,
where WpN0 is the net pumping rate (atoms per second per unit volume) being excited out from
the ground level and ηp is the quantum efficiency for pump excitation to the higher energy level.
The quantum efficiency usually is quite high and even approaching to unity for many solid state
type lasers. There are three types of pumping techniques which are being used throughout this
research namely the core-pumped technique, cladding-pumped technique through standard (e.g.
free space end pump, fused tapered fiber bundle) and GT wave fiber technology.
In the core-pumped technique, a single mode pump and signal are combined using a wavelength
division multiplexer (WDM) with the combined port is spliced to a single mode active fiber.
With this technique, the pump and signal overlap with the doped core will be large resulting in a
high pump absorption per unit length and a short device length.
In the cladding- pumped technique, multimode pump diodes are coupled into the rare-earth
doped double clad fiber (DCF) either via a tapered fiber bundle (TFB) technique or end
pumping technique. A double clad fiber (DCF) has a rare-earth doped active core for guiding
and amplifying the signal at the centre of the fiber, surrounded by a low-index cladding to guide
the pump light. Figure 2.9 shows the typical refractive index profile of a DCF fiber. The single
mode signal is guided by the core of the fiber whereas the multimode pump is guided by the low
index cladding. Pump absorption is relatively low as the cladding to active core area ratio is
quite large resulting in a relatively low overlap of the pump light with the active core. If the
DCF has a circular symmetry it can support skew pump modes that do not interact with the core
as shown in Figure 2.10. In order to eliminate the skew rays and to improve the absorption of
pump light by the active core, the inner cladding of DCF is designed to break the symmetry
2. 15
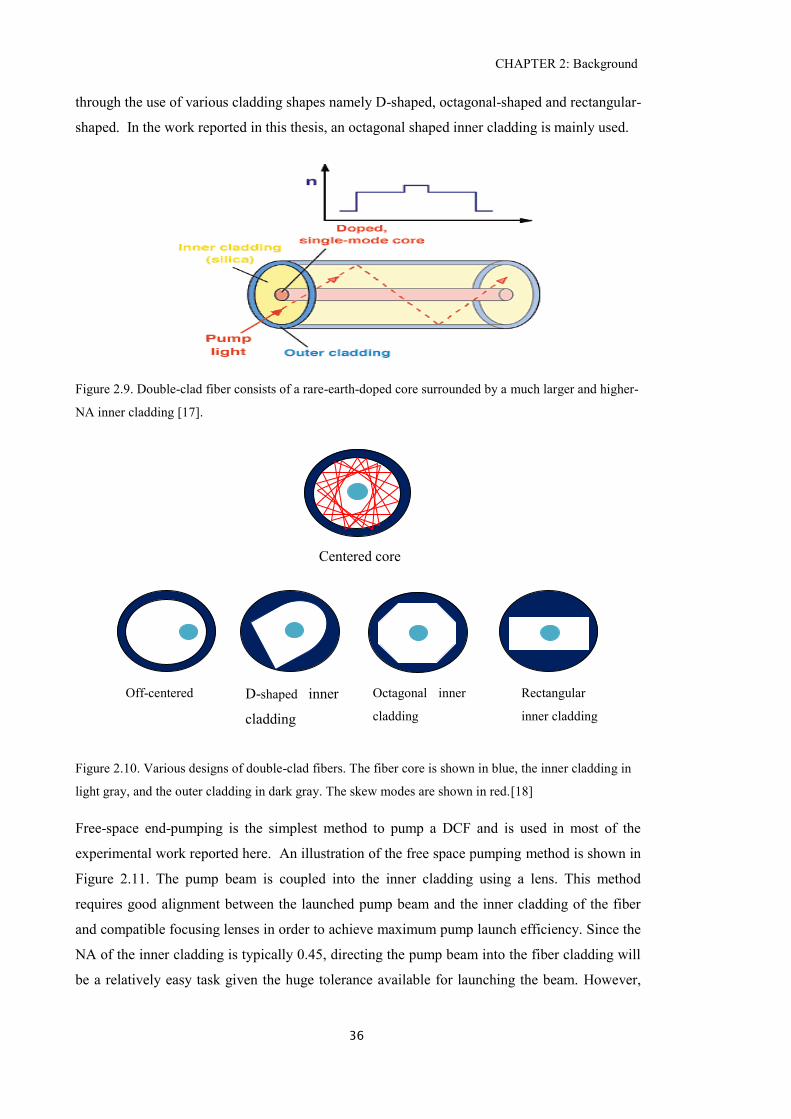
CHAPTER 2: Background
36
through the use of various cladding shapes namely D-shaped, octagonal-shaped and rectangular-
shaped. In the work reported in this thesis, an octagonal shaped inner cladding is mainly used.
Figure 2.9. Double-clad fiber consists of a rare-earth-doped core surrounded by a much larger and higher-
NA inner cladding [17].
Figure 2.10. Various designs of double-clad fibers. The fiber core is shown in blue, the inner cladding in
light gray, and the outer cladding in dark gray. The skew modes are shown in red.[18]
Free-space end-pumping is the simplest method to pump a DCF and is used in most of the
experimental work reported here. An illustration of the free space pumping method is shown in
Figure 2.11. The pump beam is coupled into the inner cladding using a lens. This method
requires good alignment between the launched pump beam and the inner cladding of the fiber
and compatible focusing lenses in order to achieve maximum pump launch efficiency. Since the
NA of the inner cladding is typically 0.45, directing the pump beam into the fiber cladding will
be a relatively easy task given the huge tolerance available for launching the beam. However,
Centered core
Off-centered
core
D-shaped inner
cladding
Octagonal inner
cladding
Rectangular
inner cladding
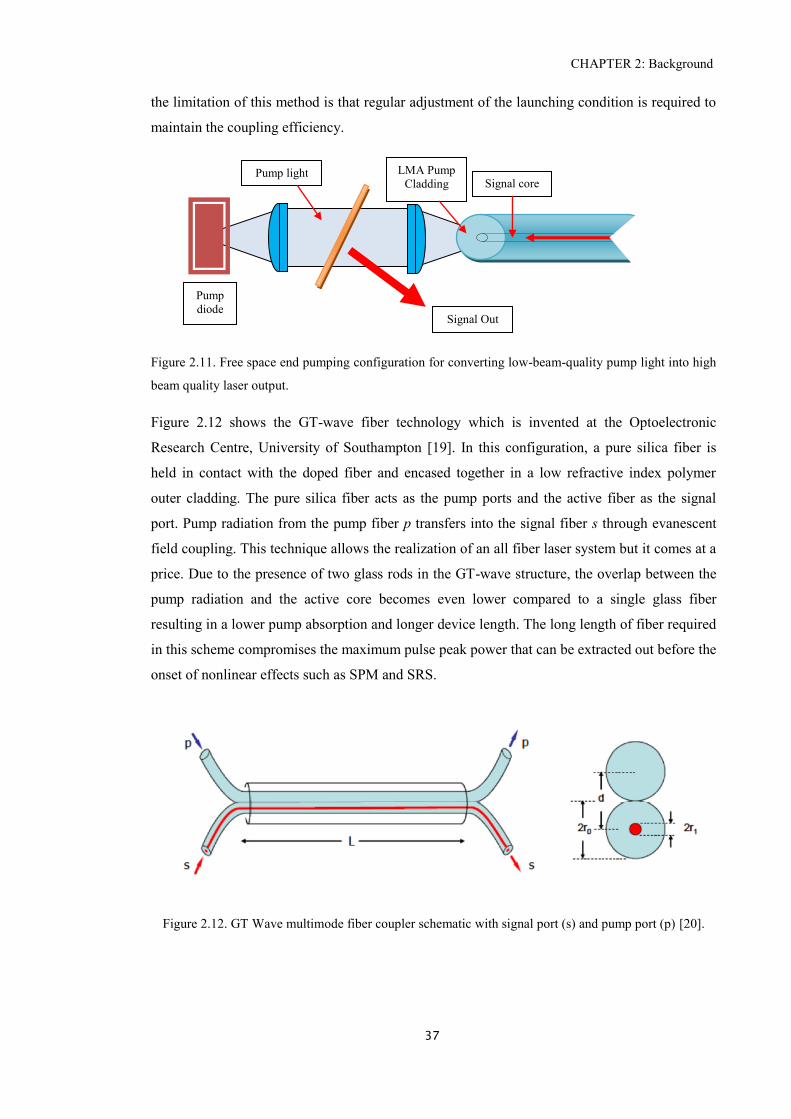
CHAPTER 2: Background
37
the limitation of this method is that regular adjustment of the launching condition is required to
maintain the coupling efficiency.
Figure 2.11. Free space end pumping configuration for converting low-beam-quality pump light into high
beam quality laser output.
Figure 2.12 shows the GT-wave fiber technology which is invented at the Optoelectronic
Research Centre, University of Southampton [19]. In this configuration, a pure silica fiber is
held in contact with the doped fiber and encased together in a low refractive index polymer
outer cladding. The pure silica fiber acts as the pump ports and the active fiber as the signal
port. Pump radiation from the pump fiber p transfers into the signal fiber s through evanescent
field coupling. This technique allows the realization of an all fiber laser system but it comes at a
price. Due to the presence of two glass rods in the GT-wave structure, the overlap between the
pump radiation and the active core becomes even lower compared to a single glass fiber
resulting in a lower pump absorption and longer device length. The long length of fiber required
in this scheme compromises the maximum pulse peak power that can be extracted out before the
onset of nonlinear effects such as SPM and SRS.
Figure 2.12. GT Wave multimode fiber coupler schematic with signal port (s) and pump port (p) [20].
Pump
diode
Pump light LMA Pump
Cladding Signal core
Signal Out
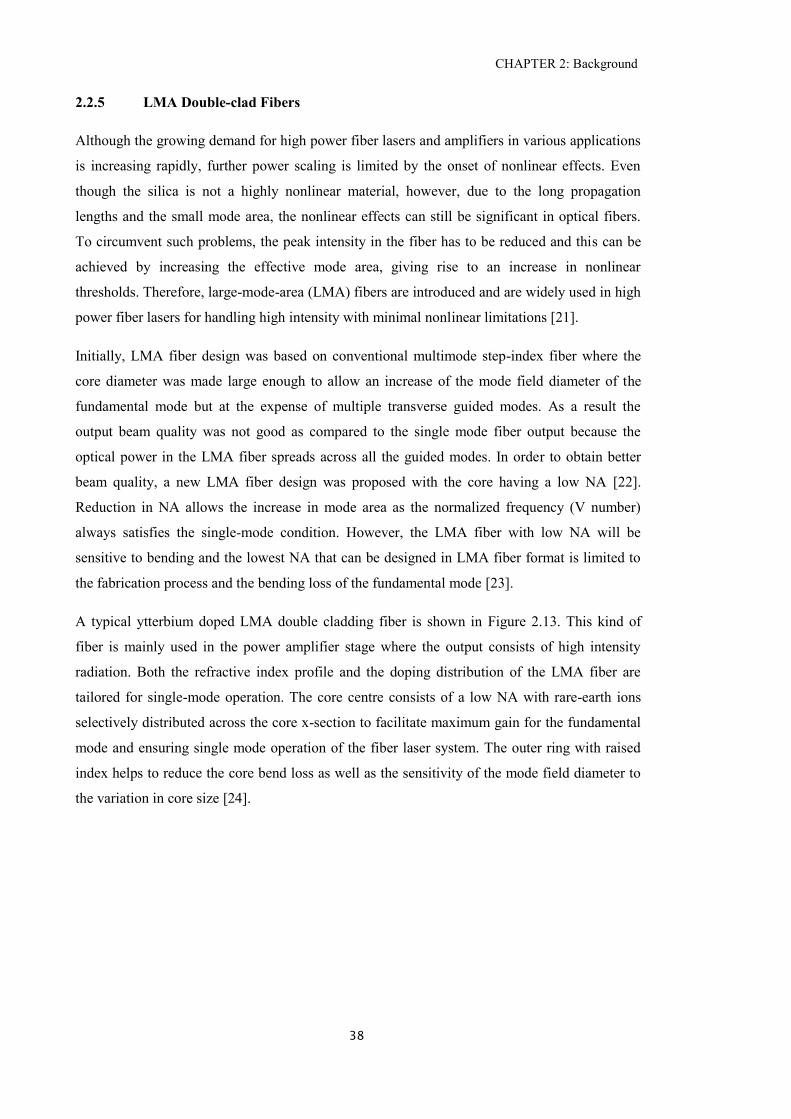
CHAPTER 2: Background
38
2.2.5 LMA Double-clad Fibers
Although the growing demand for high power fiber lasers and amplifiers in various applications
is increasing rapidly, further power scaling is limited by the onset of nonlinear effects. Even
though the silica is not a highly nonlinear material, however, due to the long propagation
lengths and the small mode area, the nonlinear effects can still be significant in optical fibers.
To circumvent such problems, the peak intensity in the fiber has to be reduced and this can be
achieved by increasing the effective mode area, giving rise to an increase in nonlinear
thresholds. Therefore, large-mode-area (LMA) fibers are introduced and are widely used in high
power fiber lasers for handling high intensity with minimal nonlinear limitations [21].
Initially, LMA fiber design was based on conventional multimode step-index fiber where the
core diameter was made large enough to allow an increase of the mode field diameter of the
fundamental mode but at the expense of multiple transverse guided modes. As a result the
output beam quality was not good as compared to the single mode fiber output because the
optical power in the LMA fiber spreads across all the guided modes. In order to obtain better
beam quality, a new LMA fiber design was proposed with the core having a low NA [22].
Reduction in NA allows the increase in mode area as the normalized frequency (V number)
always satisfies the single-mode condition. However, the LMA fiber with low NA will be
sensitive to bending and the lowest NA that can be designed in LMA fiber format is limited to
the fabrication process and the bending loss of the fundamental mode [23].
A typical ytterbium doped LMA double cladding fiber is shown in Figure 2.13. This kind of
fiber is mainly used in the power amplifier stage where the output consists of high intensity
radiation. Both the refractive index profile and the doping distribution of the LMA fiber are
tailored for single-mode operation. The core centre consists of a low NA with rare-earth ions
selectively distributed across the core x-section to facilitate maximum gain for the fundamental
mode and ensuring single mode operation of the fiber laser system. The outer ring with raised
index helps to reduce the core bend loss as well as the sensitivity of the mode field diameter to
the variation in core size [24].
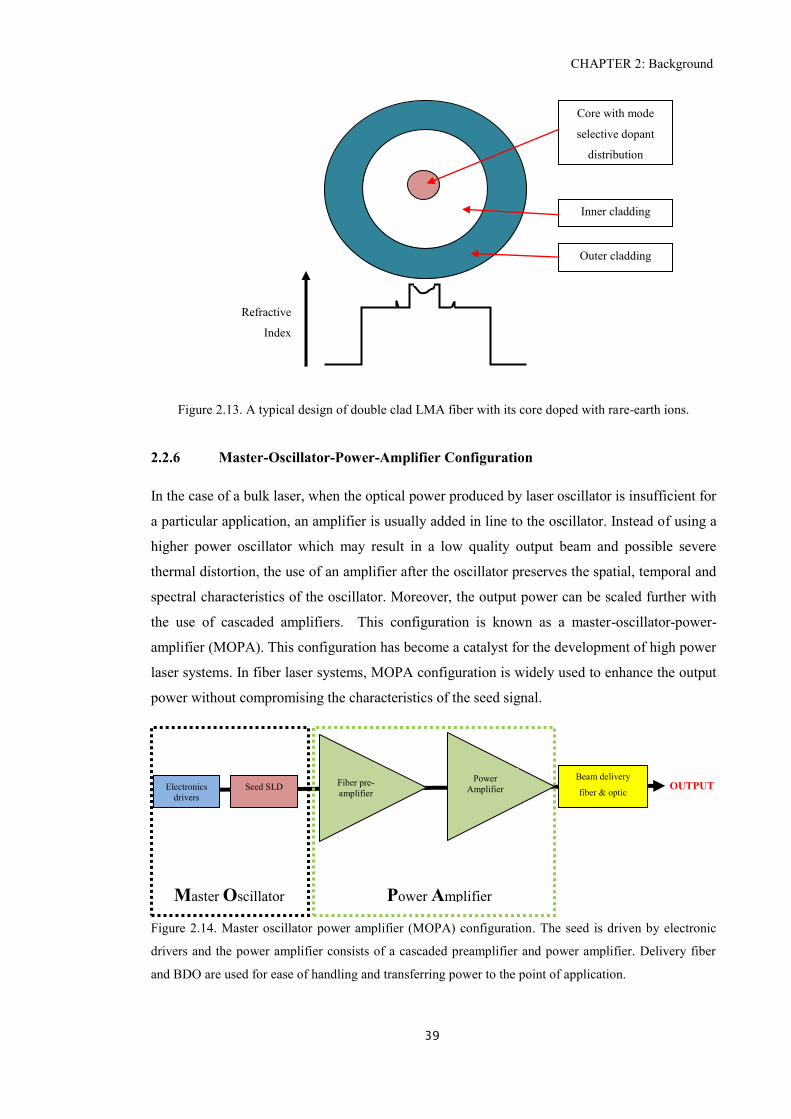
CHAPTER 2: Background
39
Figure 2.13. A typical design of double clad LMA fiber with its core doped with rare-earth ions.
2.2.6 Master-Oscillator-Power-Amplifier Configuration
In the case of a bulk laser, when the optical power produced by laser oscillator is insufficient for
a particular application, an amplifier is usually added in line to the oscillator. Instead of using a
higher power oscillator which may result in a low quality output beam and possible severe
thermal distortion, the use of an amplifier after the oscillator preserves the spatial, temporal and
spectral characteristics of the oscillator. Moreover, the output power can be scaled further with
the use of cascaded amplifiers. This configuration is known as a master-oscillator-power-
amplifier (MOPA). This configuration has become a catalyst for the development of high power
laser systems. In fiber laser systems, MOPA configuration is widely used to enhance the output
power without compromising the characteristics of the seed signal.
Figure 2.14. Master oscillator power amplifier (MOPA) configuration. The seed is driven by electronic
drivers and the power amplifier consists of a cascaded preamplifier and power amplifier. Delivery fiber
and BDO are used for ease of handling and transferring power to the point of application.
Electronics
drivers
Seed SLD
Fiber pre-
amplifier
Power
Amplifier
Beam delivery
fiber & optic OUTPUT
Master Oscillator Power Amplifier
Refractive
Index
Core with mode
selective dopant
distribution
Inner cladding
Outer cladding
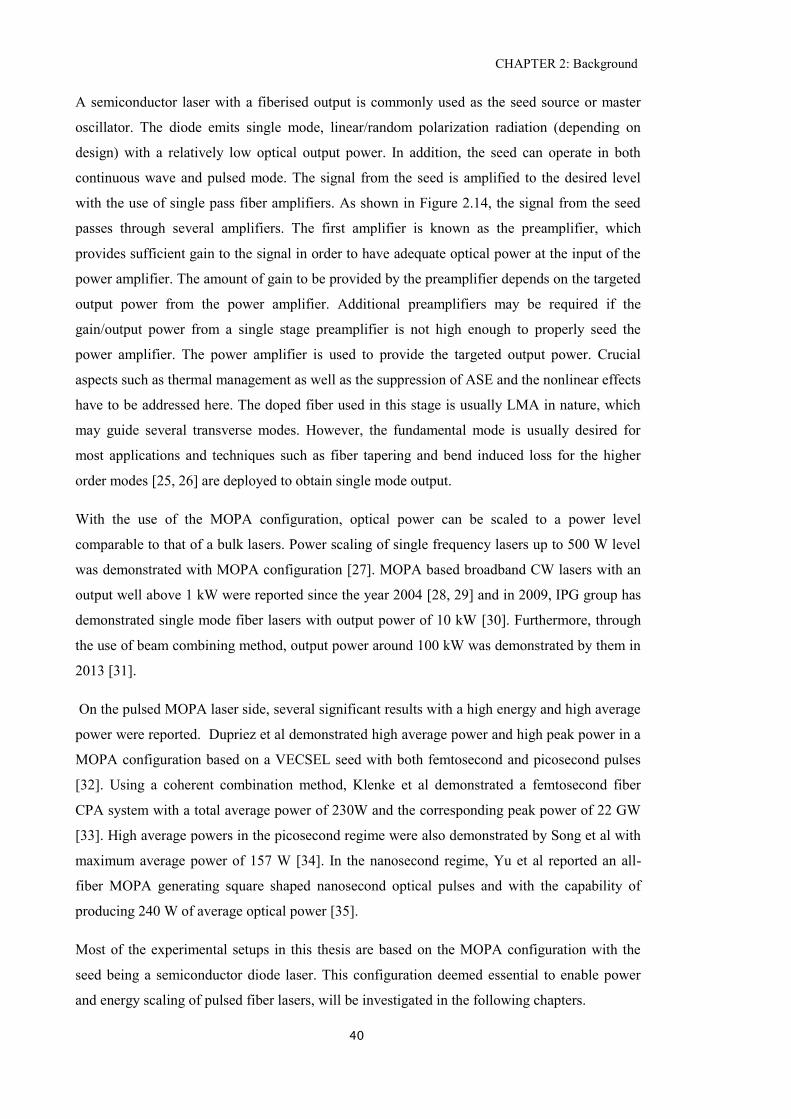
CHAPTER 2: Background
40
A semiconductor laser with a fiberised output is commonly used as the seed source or master
oscillator. The diode emits single mode, linear/random polarization radiation (depending on
design) with a relatively low optical output power. In addition, the seed can operate in both
continuous wave and pulsed mode. The signal from the seed is amplified to the desired level
with the use of single pass fiber amplifiers. As shown in Figure 2.14, the signal from the seed
passes through several amplifiers. The first amplifier is known as the preamplifier, which
provides sufficient gain to the signal in order to have adequate optical power at the input of the
power amplifier. The amount of gain to be provided by the preamplifier depends on the targeted
output power from the power amplifier. Additional preamplifiers may be required if the
gain/output power from a single stage preamplifier is not high enough to properly seed the
power amplifier. The power amplifier is used to provide the targeted output power. Crucial
aspects such as thermal management as well as the suppression of ASE and the nonlinear effects
have to be addressed here. The doped fiber used in this stage is usually LMA in nature, which
may guide several transverse modes. However, the fundamental mode is usually desired for
most applications and techniques such as fiber tapering and bend induced loss for the higher
order modes [25, 26] are deployed to obtain single mode output.
With the use of the MOPA configuration, optical power can be scaled to a power level
comparable to that of a bulk lasers. Power scaling of single frequency lasers up to 500 W level
was demonstrated with MOPA configuration [27]. MOPA based broadband CW lasers with an
output well above 1 kW were reported since the year 2004 [28, 29] and in 2009, IPG group has
demonstrated single mode fiber lasers with output power of 10 kW [30]. Furthermore, through
the use of beam combining method, output power around 100 kW was demonstrated by them in
2013 [31].
On the pulsed MOPA laser side, several significant results with a high energy and high average
power were reported. Dupriez et al demonstrated high average power and high peak power in a
MOPA configuration based on a VECSEL seed with both femtosecond and picosecond pulses
[32]. Using a coherent combination method, Klenke et al demonstrated a femtosecond fiber
CPA system with a total average power of 230W and the corresponding peak power of 22 GW
[33]. High average powers in the picosecond regime were also demonstrated by Song et al with
maximum average power of 157 W [34]. In the nanosecond regime, Yu et al reported an all-
fiber MOPA generating square shaped nanosecond optical pulses and with the capability of
producing 240 W of average optical power [35].
Most of the experimental setups in this thesis are based on the MOPA configuration with the
seed being a semiconductor diode laser. This configuration deemed essential to enable power
and energy scaling of pulsed fiber lasers, will be investigated in the following chapters.
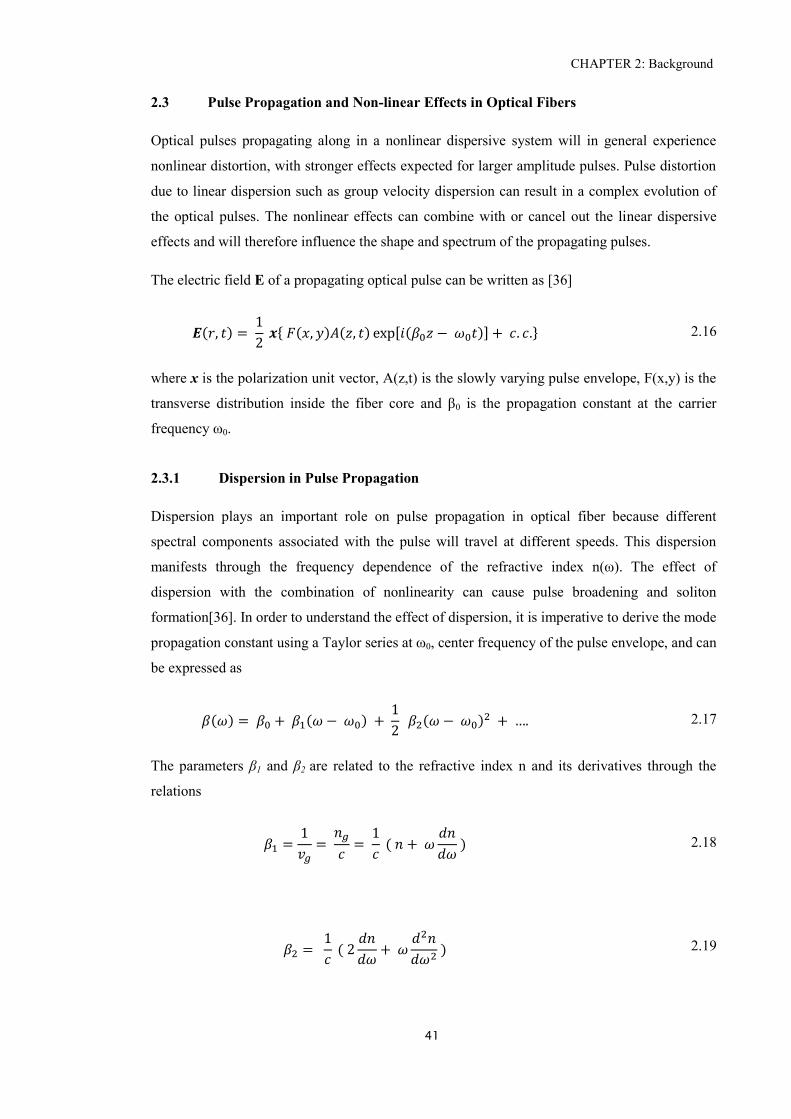
CHAPTER 2: Background
41
2.3 Pulse Propagation and Non-linear Effects in Optical Fibers
Optical pulses propagating along in a nonlinear dispersive system will in general experience
nonlinear distortion, with stronger effects expected for larger amplitude pulses. Pulse distortion
due to linear dispersion such as group velocity dispersion can result in a complex evolution of
the optical pulses. The nonlinear effects can combine with or cancel out the linear dispersive
effects and will therefore influence the shape and spectrum of the propagating pulses.
The electric field E of a propagating optical pulse can be written as [36]
where x is the polarization unit vector, A(z,t) is the slowly varying pulse envelope, F(x,y) is the
transverse distribution inside the fiber core and β0 is the propagation constant at the carrier
frequency ω0.
2.3.1 Dispersion in Pulse Propagation
Dispersion plays an important role on pulse propagation in optical fiber because different
spectral components associated with the pulse will travel at different speeds. This dispersion
manifests through the frequency dependence of the refractive index n(ω). The effect of
dispersion with the combination of nonlinearity can cause pulse broadening and soliton
formation[36]. In order to understand the effect of dispersion, it is imperative to derive the mode
propagation constant using a Taylor series at ω0, center frequency of the pulse envelope, and can
be expressed as
The parameters β1 and β2 are related to the refractive index n and its derivatives through the
relations
2.16
2.17
2.18
2.19
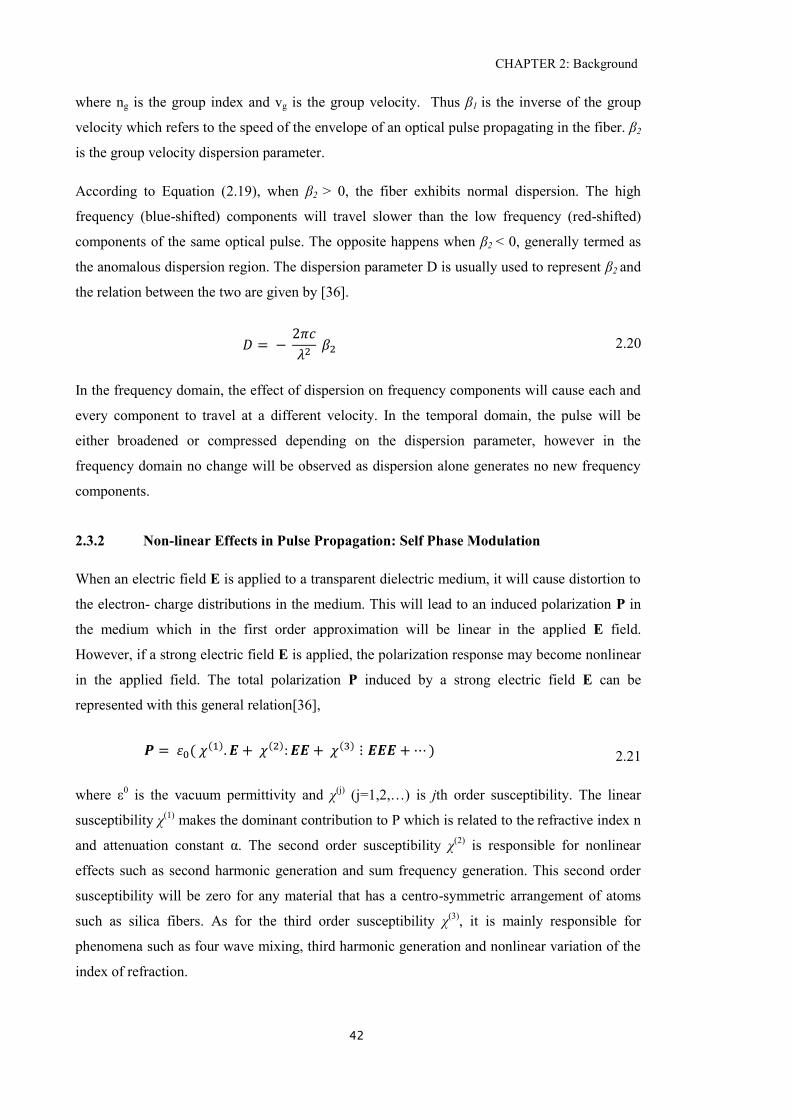
CHAPTER 2: Background
42
where ng is the group index and vg is the group velocity. Thus β1 is the inverse of the group
velocity which refers to the speed of the envelope of an optical pulse propagating in the fiber. β2
is the group velocity dispersion parameter.
According to Equation (2.19), when β2 > 0, the fiber exhibits normal dispersion. The high
frequency (blue-shifted) components will travel slower than the low frequency (red-shifted)
components of the same optical pulse. The opposite happens when β2 < 0, generally termed as
the anomalous dispersion region. The dispersion parameter D is usually used to represent β2 and
the relation between the two are given by [36].
In the frequency domain, the effect of dispersion on frequency components will cause each and
every component to travel at a different velocity. In the temporal domain, the pulse will be
either broadened or compressed depending on the dispersion parameter, however in the
frequency domain no change will be observed as dispersion alone generates no new frequency
components.
2.3.2 Non-linear Effects in Pulse Propagation: Self Phase Modulation
When an electric field E is applied to a transparent dielectric medium, it will cause distortion to
the electron- charge distributions in the medium. This will lead to an induced polarization P in
the medium which in the first order approximation will be linear in the applied E field.
However, if a strong electric field E is applied, the polarization response may become nonlinear
in the applied field. The total polarization P induced by a strong electric field E can be
represented with this general relation[36],
where ε0 is the vacuum permittivity and χ
(j) (j=1,2,…) is jth order susceptibility. The linear
susceptibility χ(1)
makes the dominant contribution to P which is related to the refractive index n
and attenuation constant α. The second order susceptibility χ(2)
is responsible for nonlinear
effects such as second harmonic generation and sum frequency generation. This second order
susceptibility will be zero for any material that has a centro-symmetric arrangement of atoms
such as silica fibers. As for the third order susceptibility χ(3)
, it is mainly responsible for
phenomena such as four wave mixing, third harmonic generation and nonlinear variation of the
index of refraction.
2.20
2.21
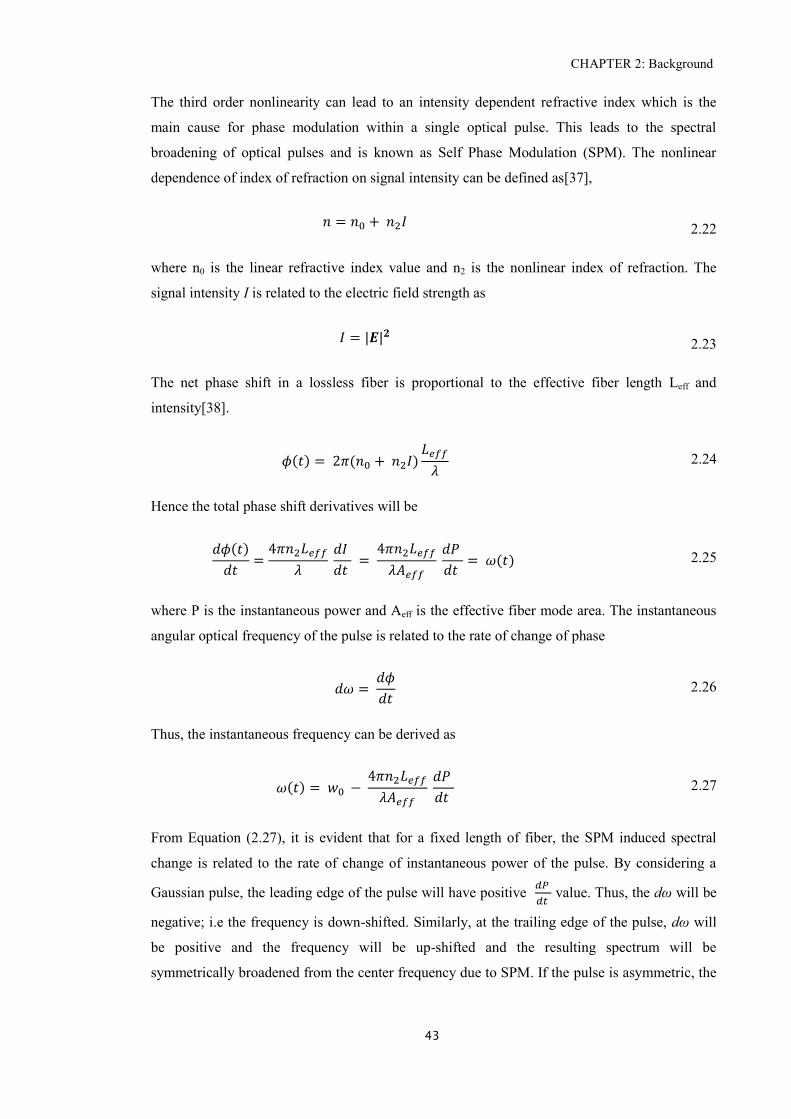
CHAPTER 2: Background
43
The third order nonlinearity can lead to an intensity dependent refractive index which is the
main cause for phase modulation within a single optical pulse. This leads to the spectral
broadening of optical pulses and is known as Self Phase Modulation (SPM). The nonlinear
dependence of index of refraction on signal intensity can be defined as[37],
where n0 is the linear refractive index value and n2 is the nonlinear index of refraction. The
signal intensity I is related to the electric field strength as
The net phase shift in a lossless fiber is proportional to the effective fiber length Leff and
intensity[38].
Hence the total phase shift derivatives will be
where P is the instantaneous power and Aeff is the effective fiber mode area. The instantaneous
angular optical frequency of the pulse is related to the rate of change of phase
Thus, the instantaneous frequency can be derived as
From Equation (2.27), it is evident that for a fixed length of fiber, the SPM induced spectral
change is related to the rate of change of instantaneous power of the pulse. By considering a
Gaussian pulse, the leading edge of the pulse will have positive
value. Thus, the dω will be
negative; i.e the frequency is down-shifted. Similarly, at the trailing edge of the pulse, dω will
be positive and the frequency will be up-shifted and the resulting spectrum will be
symmetrically broadened from the center frequency due to SPM. If the pulse is asymmetric, the
2.22
2.23
2.24
2.25
2.26
2.27
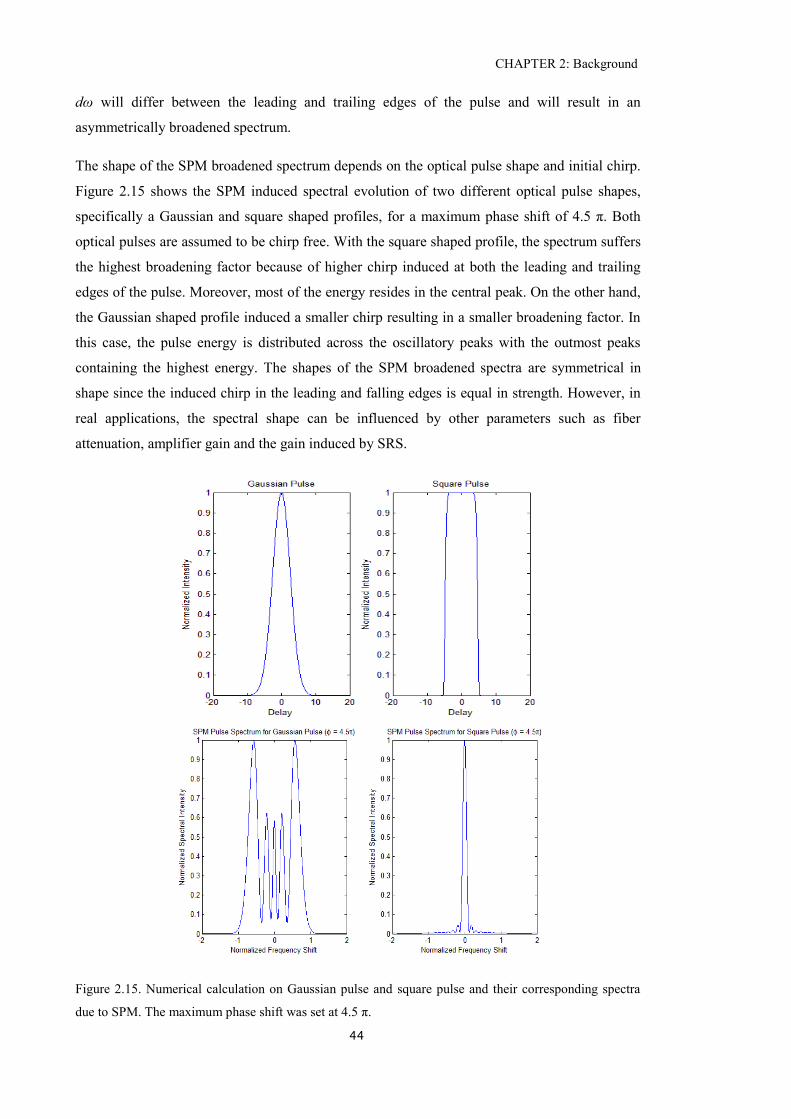
CHAPTER 2: Background
44
dω will differ between the leading and trailing edges of the pulse and will result in an
asymmetrically broadened spectrum.
The shape of the SPM broadened spectrum depends on the optical pulse shape and initial chirp.
Figure 2.15 shows the SPM induced spectral evolution of two different optical pulse shapes,
specifically a Gaussian and square shaped profiles, for a maximum phase shift of 4.5 π. Both
optical pulses are assumed to be chirp free. With the square shaped profile, the spectrum suffers
the highest broadening factor because of higher chirp induced at both the leading and trailing
edges of the pulse. Moreover, most of the energy resides in the central peak. On the other hand,
the Gaussian shaped profile induced a smaller chirp resulting in a smaller broadening factor. In
this case, the pulse energy is distributed across the oscillatory peaks with the outmost peaks
containing the highest energy. The shapes of the SPM broadened spectra are symmetrical in
shape since the induced chirp in the leading and falling edges is equal in strength. However, in
real applications, the spectral shape can be influenced by other parameters such as fiber
attenuation, amplifier gain and the gain induced by SRS.
Figure 2.15. Numerical calculation on Gaussian pulse and square pulse and their corresponding spectra
due to SPM. The maximum phase shift was set at 4.5 π.
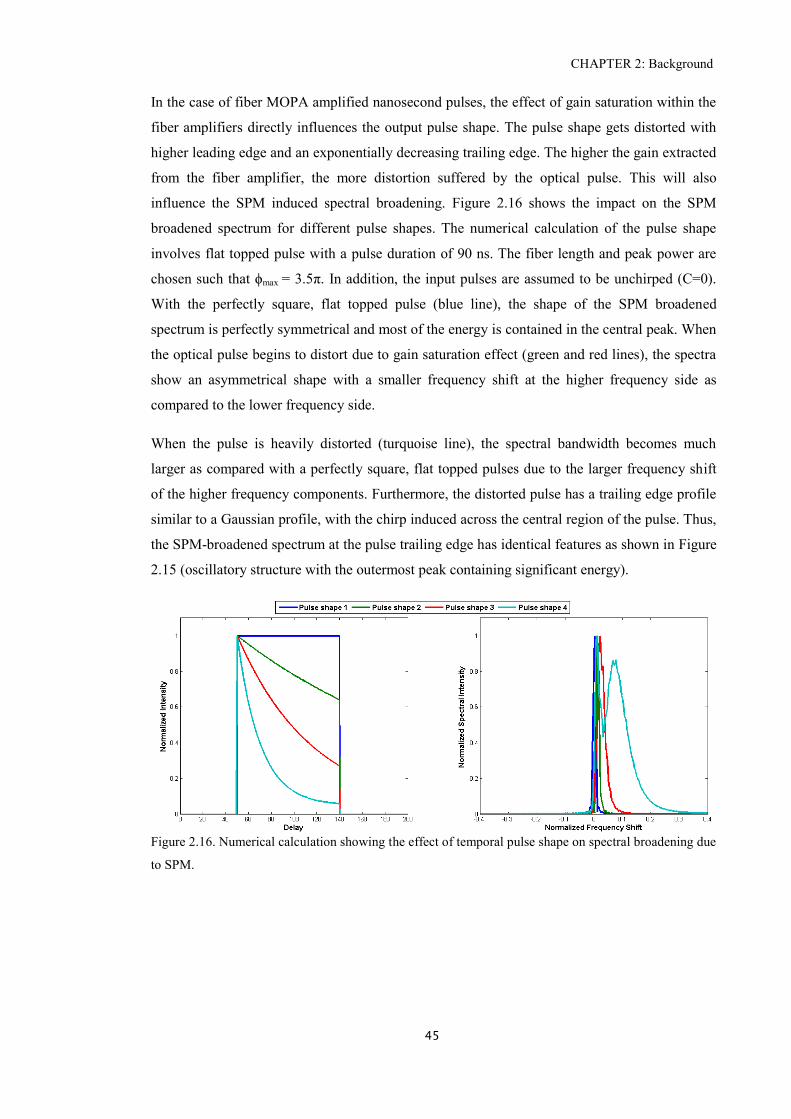
CHAPTER 2: Background
45
In the case of fiber MOPA amplified nanosecond pulses, the effect of gain saturation within the
fiber amplifiers directly influences the output pulse shape. The pulse shape gets distorted with
higher leading edge and an exponentially decreasing trailing edge. The higher the gain extracted
from the fiber amplifier, the more distortion suffered by the optical pulse. This will also
influence the SPM induced spectral broadening. Figure 2.16 shows the impact on the SPM
broadened spectrum for different pulse shapes. The numerical calculation of the pulse shape
involves flat topped pulse with a pulse duration of 90 ns. The fiber length and peak power are
chosen such that ϕmax = 3.5π. In addition, the input pulses are assumed to be unchirped (C=0).
With the perfectly square, flat topped pulse (blue line), the shape of the SPM broadened
spectrum is perfectly symmetrical and most of the energy is contained in the central peak. When
the optical pulse begins to distort due to gain saturation effect (green and red lines), the spectra
show an asymmetrical shape with a smaller frequency shift at the higher frequency side as
compared to the lower frequency side.
When the pulse is heavily distorted (turquoise line), the spectral bandwidth becomes much
larger as compared with a perfectly square, flat topped pulses due to the larger frequency shift
of the higher frequency components. Furthermore, the distorted pulse has a trailing edge profile
similar to a Gaussian profile, with the chirp induced across the central region of the pulse. Thus,
the SPM-broadened spectrum at the pulse trailing edge has identical features as shown in Figure
2.15 (oscillatory structure with the outermost peak containing significant energy).
Figure 2.16. Numerical calculation showing the effect of temporal pulse shape on spectral broadening due
to SPM.
CHAPTER 2: Background
46
2.3.3 Cross Phase Modulation
When several waves propagate in an optical fiber in the same direction, the waves can interact
with each other, due to the Kerr effect. The co-propagating waves can be coupled due to a
phenomenon known as cross phase modulation (XPM). XPM is linked to the change in
refractive index of the fiber as a result of the presence of other waves. XPM is always
accompanied by SPM and the nonlinear phase change induced by the co-propagating waves
depends on the intensity of each wave and the relationship can be expressed by the following
equation [39].
2.28
The first term in Equation (2.28) is related to the contribution from SPM. The second term
represents phase modulation of one wave due the co-propagating wave and is directly linked to
the XPM. Moreover, the effect of XPM is a factor of 2 higher as compared to the effect of SPM
for the same level of optical intensity. This analysis assumes that the waves are co polarized, if
the waves are orthogonally polarized, the interaction is reduced to a 1/3 of the polarized case.
2.3.4 Stimulated Raman Scattering
When a beam of light passes through a transparent material, a small amount of light may scatter
to new frequencies different from the incident light due to SRS. SRS is governed by the
imaginary part of the third order susceptibility χ(3)
. Scattered light to a lower frequency is known
as the Stokes wave and to a higher frequency is known as anti-Stokes wave. The amount of
frequency change is determined by the vibrational modes of the medium. If the incident light is
intense enough, a rapid growth of the Stokes wave will be observed and a significant fraction of
the incident light can be frequency shifted.
Figure 2.17. Raman gain coefficient curve of a silica core single mode fiber. The curve is normalized to
1.0 at 440cm-1
. The peak gain for a pump wavelength of 1060nm is 1 x 10-13
m/W and varies with pump
wavelength as 1/λp [40].
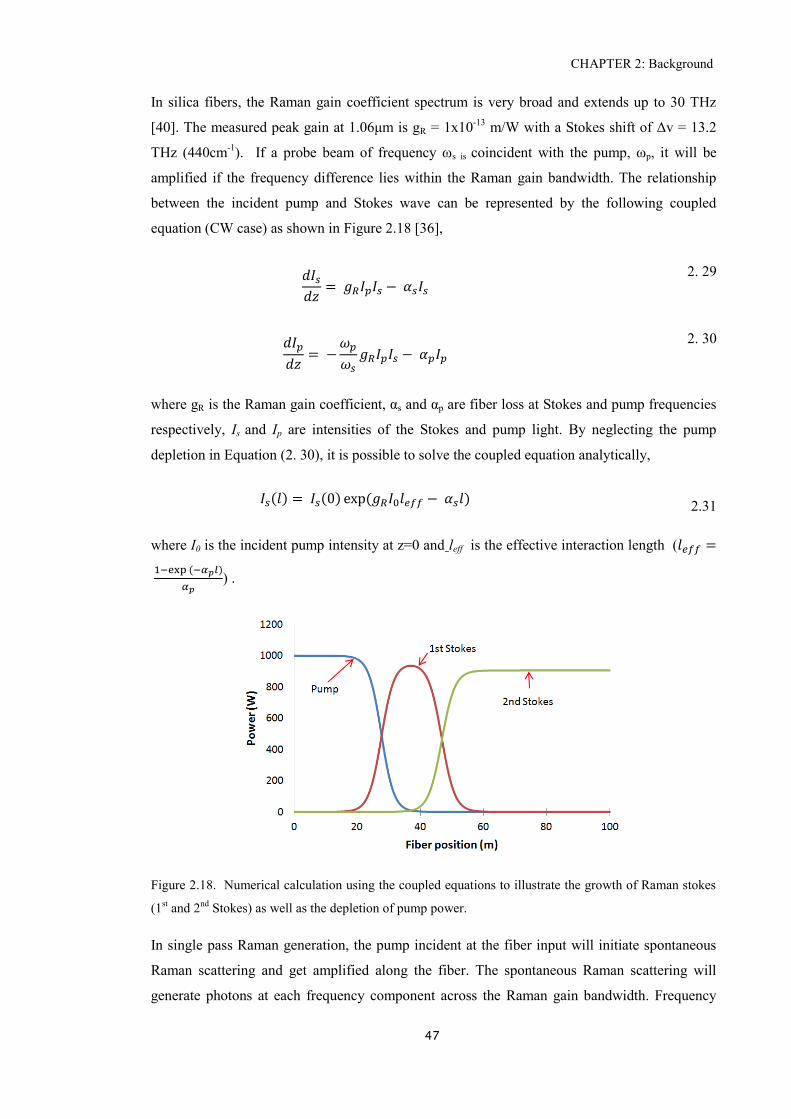
CHAPTER 2: Background
47
In silica fibers, the Raman gain coefficient spectrum is very broad and extends up to 30 THz
[40]. The measured peak gain at 1.06μm is gR = 1x10-13
m/W with a Stokes shift of Δv = 13.2
THz (440cm-1
). If a probe beam of frequency ωs is coincident with the pump, ωp, it will be
amplified if the frequency difference lies within the Raman gain bandwidth. The relationship
between the incident pump and Stokes wave can be represented by the following coupled
equation (CW case) as shown in Figure 2.18 [36],
2. 29
2. 30
where gR is the Raman gain coefficient, αs and αp are fiber loss at Stokes and pump frequencies
respectively, Is and Ip are intensities of the Stokes and pump light. By neglecting the pump
depletion in Equation (2. 30), it is possible to solve the coupled equation analytically,
where I0 is the incident pump intensity at z=0 and leff is the effective interaction length (
) .
Figure 2.18. Numerical calculation using the coupled equations to illustrate the growth of Raman stokes
(1st and 2
nd Stokes) as well as the depletion of pump power.
In single pass Raman generation, the pump incident at the fiber input will initiate spontaneous
Raman scattering and get amplified along the fiber. The spontaneous Raman scattering will
generate photons at each frequency component across the Raman gain bandwidth. Frequency
2.31
CHAPTER 2: Background
48
components lying at the Raman gain peak will build up most rapidly. The Raman threshold is
defined as the input pump power at which Stokes power becomes equal to the residual pump
power at the fiber output,
The critical pump power required to achieve the Raman threshold is given by [41]
where β is the ratio between Raman power and pump power at the output of the fiber when at
threshold. Equation (2.33) allows us to estimate the maximum power that can be launched into
the fiber without observing any significant growth of Raman Stokes. In order to increase the
Raman threshold power, the most effective way is to use a larger core diameter fiber and/or
shorter effective fiber length. If the power in the Stokes wave exceeds the Raman threshold, the
Stokes will act as a pump for a second order Stokes wave and the process is known as cascaded
SRS.
2.3.5 Stimulated Brillouin Scattering
Similar to SRS, stimulated Brillouin scattering (SBS) is a nonlinear process that can occur in
optical fiber. It can occur at input intensities much lower than the SRS threshold. SBS occurs
when a nonlinear interaction happens between the pump and Stokes fields through an acoustic
wave. The pump field will generate an acoustic wave via the electrostriction process [42]. This
acoustic wave periodically modulates the refractive index and acts as Bragg grating. Scattered
light is downshifted in frequency as a result of Doppler shift associated with grating movement
at the speed given by the optical frequency difference between the forward and scattered waves.
The Stokes wave will grow exponentially and propagates only in the backward direction for a
single mode optical fiber as compared to SRS that can occur in both directions. The frequency
shift is much smaller for SBS (~10 GHz) with relatively narrow gain bandwidth (~50 MHz) as it
is directly related to the phonon lifetime.
The power at which the Stokes wave at the input end becomes equal to the pump power at the
output, is defined as SBS critical power and can be expressed as
2. 34
2.32
2.33

CHAPTER 2: Background
49
where and are the effective mode area and interaction length as defined in the
previous section. K is the polarization factor of the pump with K=1 for polarized light and K = 2
for un-polarized light. The peak value of the Brillouin gain coefficient or gB = 5 x 10-11
m/W,
which is higher than the Raman gain by a factor of ~500. This makes the SBS threshold low for
a narrow linewidth pump source and becomes a dominant nonlinear process in optical fibers.
The phonon lifetime plays an important role in the process of SBS [43]. When the pulse
duration is shorter than phonon lifetime (< 10ns), the Brillouin gain decreases. This means that
operation in the picosecond and femtosecond regimes is free from any SBS.
CHAPTER 2: Background
50
2.4 References
1. J. J. Coleman, "The development of the semiconductor laser diode after the first
demonstration in 1962," Semiconductor Science and Technology 27, 090207 (2012).
2. M. Kondow, T. Kitatani, S. Nakatsuka, M. C. Larson, K. Nakahara, Y. Yazawa, M. Okai,
and K. Uomi, "GaInNAs: a novel material for long-wavelength semiconductor lasers,"
Selected Topics in Quantum Electronics, IEEE Journal of 3, 719-730 (1997).
3. E. Yablonovitch, and E. O. Kane, "Band structure engineering of semiconductor lasers
for optical communications," Lightwave Technology, Journal of 6, 1292-1299 (1988).
4. M. Yamada, "Transverse and longitudinal mode control in semiconductor injection
lasers," Quantum Electronics, IEEE Journal of 19, 1365-1380 (1983).
5. M. Bou Sanayeh, P. Brick, W. Schmid, B. Mayer, M. Müller, M. Reufer, K. Streubel, J.
W. Tomm, and G. Bacher, "Temperature-power dependence of catastrophic optical
damage in AlGaInP laser diodes," Applied Physics Letters 91, - (2007).
6. R. Lang, "Injection locking properties of a semiconductor laser," Quantum Electronics,
IEEE Journal of 18, 976-983 (1982).
7. J. N. R. Paschotta, A.C. Tropper and D.C. Hanna, "Ytterbium doped fiber amplifiers,"
IEEE Journal of Quantum Electronics Vol.33, pp.1049-1056 (1997).
8. R. J. C. H.M. Pask, D.C. Hanna, A.C. Tropper, C.J.Mackechnie, P.R. Barber and J.D.
Dawes, "Ytterbium doped silica fibers: Versatile sources for the 1 - 1.2 um region," IEEE
Journal of selected topics in Quantum Electronics Vol.1 No.1 (1995).
9. D. E. McCumber, "Theory of Phonon-Terminated Optical Masers," Physical Review 134,
A299-A306 (1964).
10. Y. Wang, "Optimization of pulse amplification in ytterbium doped double clad fiber
amplifiers," Journal of Lightwave Technology, Vol. 23, pp. 2139 - 2147 (2005).
11. A. Ghatak, and K. Thyagarajan., An Introduction to Fiber Optics (Cambridge University
Press, 1998).
12. J. D. Love, and A. W. Snyder, "Fresnel's and Snell's laws for the multimode optical
waveguide of circular cross section," J. Opt. Soc. Am. 65, 1241-1247 (1975).
13. R. Ulrich, S. C. Rashleigh, and W. Eickhoff, "Bending-induced birefringence in single-
mode fibers," Optics Letters 5, 273-275 (1980).
14. T. Hosaka, K. Okamoto, T. Miya, Y. Sasaki, and T. Edahiro, "Low-loss single
polarisation fibres with asymmetrical strain birefringence," Electronics Letters 17, 530-
531 (1981).
15. Y. Sasaki, T. Hosaka, M. Horiguchi, and J. Noda, "Design and fabrication of low-loss and
low-crosstalk polarization-maintaining optical fibers," Lightwave Technology, Journal of
4, 1097-1102 (1986).
CHAPTER 2: Background
51
16. M. C. T. Bahaa E. A. Saleh, Fundamental of Photonics (John Wiley & Sons, 1991).
17. J. K. Dahv Kliner, Fabio Di Teodoro, Sean Moore, "Fiber Laser Technology Reels into
High Power Result," (SPIE oemagazine, 2004).
18. R.Paschotta, "Encyclopedia for Photonics and Laser Technology."
19. J. N. A.B.Grudinin, P.W.Turner, C.C.Renaud, W.A.Clarkson and D.N.Payne, "Single
clad coiled optical fibre for high power lasers and amplifiers," in Conference of Laser and
Electro-Optic (CLEO)(Baltimore 23-28 May, 1999).
20. A. M. a. J. K. Michalis N. Zervas, "Effective absorption in cladding pumped fiber,"
Proceedings Vol. 7914, Fiber Lasers VIII: Technology, Systems, and Applications
(2011).
21. J. Limpert, A. Liem, T. Gabler, H. Zellmer, A. Tünnermann, S. Unger, S. Jetschke, and
H. R. Müller, "High-average-power picosecond Yb-doped fiber amplifier," Optics Letters
26, 1849-1851 (2001).
22. N. G. R. Broderick, H. L. Offerhaus, D. J. Richardson, R. A. Sammut, J. Caplen, and L.
Dong, "Large Mode Area Fibers for High Power Applications," Optical Fiber Technology
5, 185-196 (1999).
23. M.-J. Li, X. Chen, A. Liu, S. Gray, J. Wang, D. T. Walton, and L. A. Zenteno, "Effective
area limit for large mode area laser fibers," in Optical Fiber Communication
Conference(Optical Society of America, 2008), p. OTuJ2.
24. J. A. Alvarez-Chavez, H. L. Offerhaus, J. Nilsson, P. W. Turner, W. A. Clarkson, and D.
J. Richardson, "High-energy, high-power ytterbium-doped Q-switched fiber laser,"
Optics Letters 25, 37-39 (2000).
25. T. Alder, A. Stohr, R. Heinzelmann, and D. Jager, "High-efficiency fiber-to-chip
coupling using low-loss tapered single-mode fiber," Photonics Technology Letters, IEEE
12, 1016-1018 (2000).
26. J. P. Koplow, D. A. V. Kliner, and L. Goldberg, "Single-mode operation of a coiled
multimode fiber amplifier," Optics Letters 25, 442-444 (2000).
27. J. Yoonchan, J. Nilsson, J. K. Sahu, D. N. Payne, R. Horley, L. M. B. Hickey, and P. W.
Turner, "Power Scaling of Single-Frequency Ytterbium-Doped Fiber Master-Oscillator
Power-Amplifier Sources up to 500 W," Selected Topics in Quantum Electronics, IEEE
Journal of 13, 546-551 (2007).
28. V. Gapontsev, D. Gapontsev, N. Platonov, O. Shkurikhin, V. Fomin, A. Mashkin, M.
Abramov, and S. Ferin, "2 kW CW ytterbium fiber laser with record diffraction-limited
brightness," in Lasers and Electro-Optics Europe, 2005. CLEO/Europe. 2005 Conference
on(2005), p. 508.
29. Y. Jeong, J. Sahu, D. Payne, and J. Nilsson, "Ytterbium-doped large-core fiber laser with
1.36 kW continuous-wave output power," Opt. Express 12, 6088-6092 (2004).
CHAPTER 2: Background
52
30. M. O'Connor, V. Gapontsev, V. Fomin, M. Abramov, and A. Ferin, "Power scaling of
SM fiber lasers toward 10kW," in Conference on Lasers and Electro-Optics(Optical
Society of America, 2009), p. CThA3.
31. V. Fomin, V. Gapontsev, E. Shcherbakov, A. Abramov, A. Ferin, and D. Mochalov, "100
kW CW fiber laser for industrial applications," in Laser Optics, 2014 International
Conference(2014), pp. 1-1.
32. P. Dupriez, C. Finot, A. Malinowski, J. K. Sahu, J. Nilsson, D. J. Richardson, K. G.
Wilcox, H. D. Foreman, and A. C. Tropper, "High-power, high repetition rate picosecond
and femtosecond sources based on Yb-doped fiber amplification of VECSELs," Opt.
Express 14, 9611-9616 (2006).
33. A. Klenke, S. Hädrich, T. Eidam, J. Rothhardt, M. Kienel, S. Demmler, T. Gottschall, J.
Limpert, and A. Tünnermann, "22 GW peak-power fiber chirped-pulse-amplification
system," Optics Letters 39, 6875-6878 (2014).
34. R. Song, J. Hou, S. Chen, W. Yang, and Q. Lu, "157 W all-fiber high-power picosecond
laser," Appl. Opt. 51, 2497-2500 (2012).
35. H. Yu, R. Tao, X. Wang, P. Zhou, and J. Chen, "240W high-average-power square-
shaped nanosecond all-fiber-integrated laser with near diffraction-limited beam quality,"
Applied Optics 53, 6409-6413 (2014).
36. G. Agrawal, Nonlinear Fiber Optics (3rd Edition) (Academic Press, 2001).
37. A. E. Siegman, Lasers (Oxford University Press, 1986).
38. C. L. R.H. Stolen, "Self phase modulation in silica optical fibers," Phys. Rev. A 17,
pp.1448 - 1453 (1978).
39. G. P. Agrawal, Nonlinear Fiber Optics (Academic Press, NY, 1995).
40. C. L. a. R. K. J. R.H. Stolen, "Development of the stimulated Raman spectrum in single-
mode silica fibers," J. Opt. Soc. Am. B 1, 652-657 (1984).
41. J. L. C. Jauregui, A. Tünnermann, "On the Raman threshold of passive large mode area
fibers," 7914 (2011).
42. S. Mauger, L. Bergé, and S. Skupin, "Controlling the stimulated Brillouin scattering of
self-focusing nanosecond laser pulses in silica glasses," Physical Review A 83, 063829
(2011).
43. W. Chen, Z. Meng, and H.-J. Zhou, "Phonon Lifetime Measurement by Stimulated
Brillouin Scattering Slow Light Technique in Optical Fiber," Chinese Physics Letters 30,
074209 (2013).
CHAPTER 3: Nanosecond Fiber Laser System
53
Chapter 3. Nanosecond Fiber Laser System
Two different configurations of nanosecond fiber MOPA are presented in this chapter. The first
configuration is a directly modulated SLD seeded MOPA incorporating a pulse shaping
mechanism through the use of an Electro-optic modulator (EOM). The second configuration
was jointly developed with SPI Lasers under the Technology Strategy Board (TSB) project,
SMART. The SMART system was also seeded with a directly modulated SLD; however, in this
case GT-wave fiber based amplifiers were used while an Acousto-optic modulator (AOM) was
used as the optical pulse shaper. The advantages and limitations of these two configurations will
be discussed. Furthermore, various custom defined pulse shapes produced at the output of the
two systems and the impact made in actual material processing trials will be highlighted in this
chapter.
3.1 Introduction
The development of industrial based laser sources has been growing at a fast pace in recent
years. As of the year 2012, the global market for industrial material processing lasers sat at a
record high of € 7.9 billion with laser drilling, cutting, micro processing and marking in the area
of automobile manufacturing, semiconductor and aerospace industries [1]. Fiber based laser
sources accounted for 18% of the total market share and the fiber laser is ultimately expected to
replace gas laser sources and bulk solid state laser sources in the majority of material processing
applications.
Before the introduction of fiber laser systems for material processing, this area was mainly
dominated by Q-switched solid state lasers with an operational wavelength at 1064 nm or its
harmonics [2, 3]. The optical pulses generated from such sources typically have an
asymmetrical Gaussian shaped profile and typical repetition rates in few Hz to up to the kHz
range. Despite the Q-switched laser system being able to generate different pulse durations and
high peak power at low repetition rates, these properties alone are not sufficient for certain
material processing applications. For example, Q-switched laser systems are unable to generate
short nanosecond optical pulses and offer no control over the pulse profile. Furthermore, the
output spatial profile is usually Gaussian in nature which is not efficient for processing
applications and results in a spatially non-uniform ablation depth [4].
The introduction of fiber based MOPA systems incorporating directly modulated semiconductor
laser diode as the seed laser and rare-earth doped fiber amplifers are the perfect replacement in
many instances for the bulky Q-switched laser systems [5, 6]. Moreover laser systems based on
fibers are an attractive technology for compact and efficient high performance short pulse laser

CHAPTER 3: Nanosecond Fiber Laser System
54
systems. Compared with conventional bulk solid state lasers, fiber lasers are superior in terms of
beam confinement and heat dissipation. Furthermore, custom defined output pulse shapes
(square, step, ramp pulse) with a short (nanosecond) pulse width at mili-Joule pulse energy can
now be achieved with fiber based MOPA systems. With the availability of nanosecond fiber
sources, more real world applications have emerged demanding high repetition rates, high beam
quality and high average power that are simply just not possible with conventional solid state
laser system.
With the availability of pulsed laser systems operating between the femtosecond and
nanosecond ranges, studies on light matter interactions during material processing can be
carried out [7]. Studies on laser ablation threshold, laser induced plasma, ejection mechanisms,
heat transfer in material and material characteristics have been widely reported [8-10].
However, not many publications relate to the impact of different optical temporal profiles to
laser machining. Recently, the effects of the temporal pulse envelope on the machining of
silicon have generated interest and are gaining traction thanks to the availability of nanosecond
fiber laser with adaptive pulse shaping. O’Neill reported an improvement in the surface quality
in silicon machining that was not possible with conventional Q-switched laser systems [11]. The
use of nanosecond fiber MOPAs delivering optical pulse with a sharp leading edge resulted in
small heat-affected zones, less recast layers and less micro cracking on the wall of the
interaction zone. Hendow et al also demonstrated the use of nanosecond pulse bursts for silicon
scribing and showed that the material removal process could be sped up with minimized thermal
diffusion [12]. Thus, with the advancement in nanosecond fiber laser technology, a new
interesting area of research on controlling the material response on silicon material through the
use of designer pulses has now been made possible.
3.1.1 Pulse amplification and gain saturation
When an optical pulse propagates along a laser gain medium with an inverted population
inversion, it will experience gain due to the stimulated emission effect. However, the gain
distribution along the length of the pulse depends on the width of the optical pulse. If a short
optical pulse (sub-nanosecond and below) is launched into the laser medium, the entire length
of the pulse will experience uniform inversion and will be amplified uniformly. However, in the
case of a longer optical pulse, the leading and the trailing edges of the pulse will experience
different levels of population inversion due to gain saturation depletion, resulting in different
gains across the pulse profile. The non-uniform gain exerted on a long optical pulse usually
introduces distortions to the pulse shape.
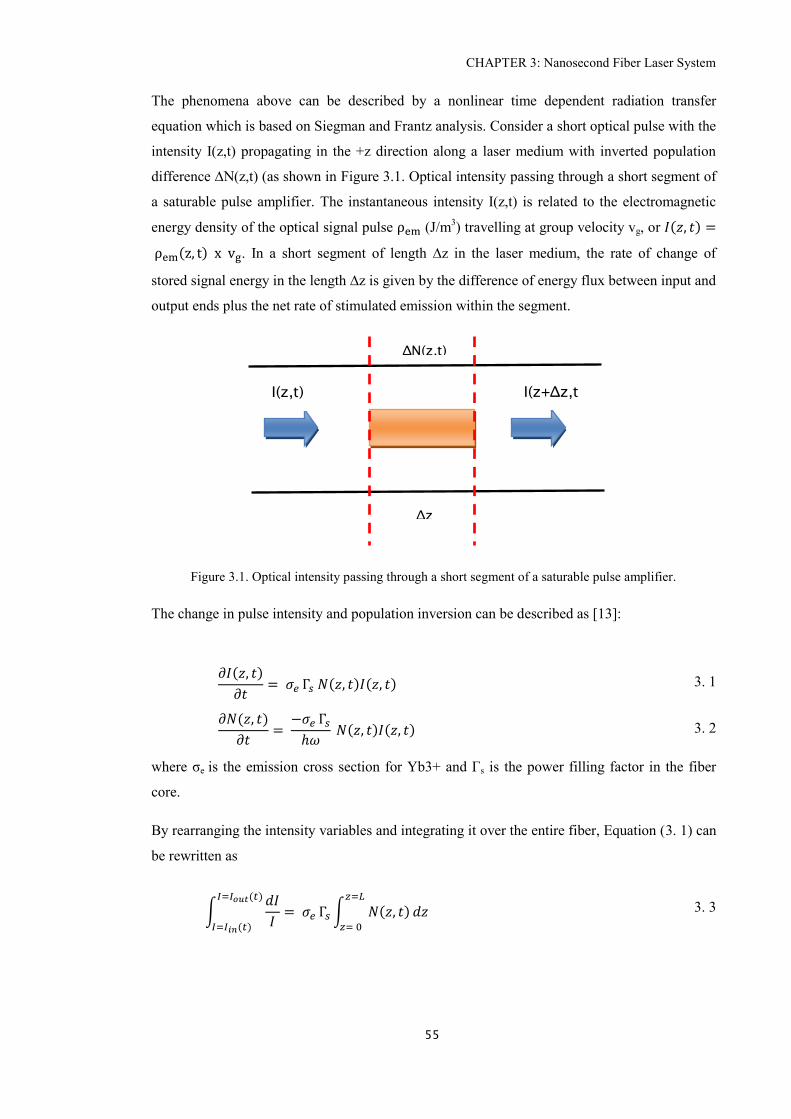
CHAPTER 3: Nanosecond Fiber Laser System
55
The phenomena above can be described by a nonlinear time dependent radiation transfer
equation which is based on Siegman and Frantz analysis. Consider a short optical pulse with the
intensity I(z,t) propagating in the +z direction along a laser medium with inverted population
difference ∆N(z,t) (as shown in Figure 3.1. Optical intensity passing through a short segment of
a saturable pulse amplifier. The instantaneous intensity I(z,t) is related to the electromagnetic
energy density of the optical signal pulse (J/m3) travelling at group velocity vg, or
. In a short segment of length ∆z in the laser medium, the rate of change of
stored signal energy in the length ∆z is given by the difference of energy flux between input and
output ends plus the net rate of stimulated emission within the segment.
Figure 3.1. Optical intensity passing through a short segment of a saturable pulse amplifier.
The change in pulse intensity and population inversion can be described as [13]:
where σe is the emission cross section for Yb3+ and Γs is the power filling factor in the fiber
core.
By rearranging the intensity variables and integrating it over the entire fiber, Equation (3. 1) can
be rewritten as
3. 1
3. 2
3. 3
∆N(z,t)
I(z,t) I(z+∆z,t
)
∆z
CHAPTER 3: Nanosecond Fiber Laser System
56
where and are the input pulse intensity at z = 0 and the output pulse intensity at
z=L respectively. The integral on the right hand side of Equation (3. 3) is defined as the total
number of atoms in the amplifier. The solution can be written in the form:
where is the time varying gain at any instant within the pulse. When t =0,
, where N0 is the population inversion at time t = 0 and G0 is the initial single
pass gain of the amplifier.
Equation (3. 2) can now be integrated over the amplifier length,
This can then be simplified as
The input and output energy per unit area can be calculated by the following equations:
An important parameter that related to the energy storage capability in the laser medium is the
saturation energy. The saturation energy per unit area Usat can be defined as[14]:
where is the energy of a signal photon, and are the emission and absorption cross
sections at the signal wavelength and is the signal overlap with the doped area.
By defining the parameters needed for input and output energies, Equation (3.6) can be further
integrated as follow:
3. 4
3. 5
3. 6
3. 7
3. 8
3. 9
3. 10
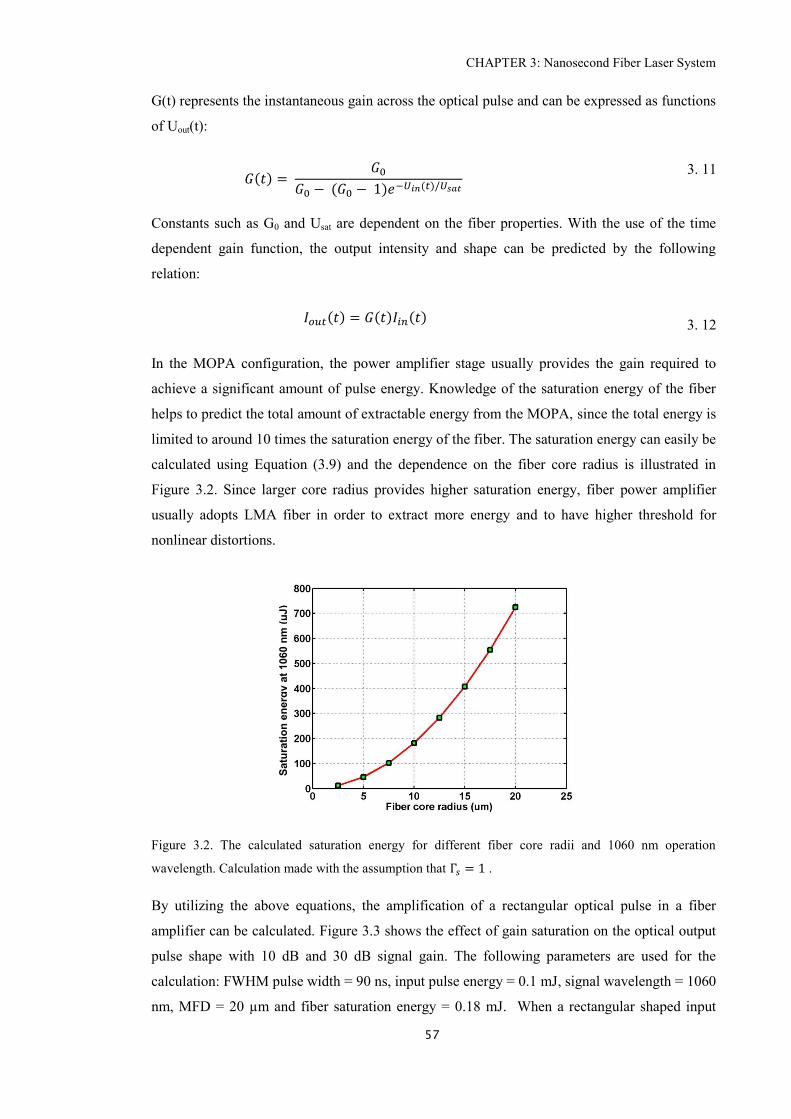
CHAPTER 3: Nanosecond Fiber Laser System
57
G(t) represents the instantaneous gain across the optical pulse and can be expressed as functions
of Uout(t):
Constants such as G0 and Usat are dependent on the fiber properties. With the use of the time
dependent gain function, the output intensity and shape can be predicted by the following
relation:
In the MOPA configuration, the power amplifier stage usually provides the gain required to
achieve a significant amount of pulse energy. Knowledge of the saturation energy of the fiber
helps to predict the total amount of extractable energy from the MOPA, since the total energy is
limited to around 10 times the saturation energy of the fiber. The saturation energy can easily be
calculated using Equation (3.9) and the dependence on the fiber core radius is illustrated in
Figure 3.2. Since larger core radius provides higher saturation energy, fiber power amplifier
usually adopts LMA fiber in order to extract more energy and to have higher threshold for
nonlinear distortions.
Figure 3.2. The calculated saturation energy for different fiber core radii and 1060 nm operation
wavelength. Calculation made with the assumption that .
By utilizing the above equations, the amplification of a rectangular optical pulse in a fiber
amplifier can be calculated. Figure 3.3 shows the effect of gain saturation on the optical output
pulse shape with 10 dB and 30 dB signal gain. The following parameters are used for the
calculation: FWHM pulse width = 90 ns, input pulse energy = 0.1 mJ, signal wavelength = 1060
nm, MFD = 20 µm and fiber saturation energy = 0.18 mJ. When a rectangular shaped input
3. 11
3. 12
Satu
rati
on
en
erg
y a
t 1060 n
m (
μJ)
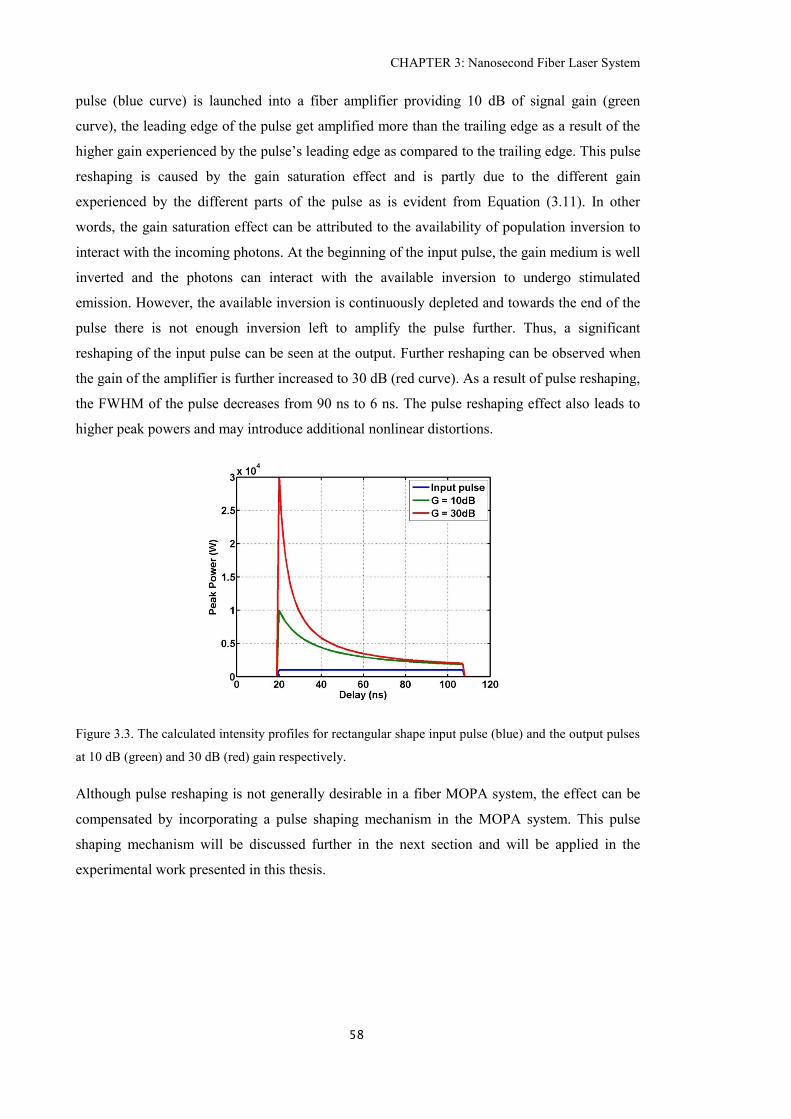
CHAPTER 3: Nanosecond Fiber Laser System
58
pulse (blue curve) is launched into a fiber amplifier providing 10 dB of signal gain (green
curve), the leading edge of the pulse get amplified more than the trailing edge as a result of the
higher gain experienced by the pulse’s leading edge as compared to the trailing edge. This pulse
reshaping is caused by the gain saturation effect and is partly due to the different gain
experienced by the different parts of the pulse as is evident from Equation (3.11). In other
words, the gain saturation effect can be attributed to the availability of population inversion to
interact with the incoming photons. At the beginning of the input pulse, the gain medium is well
inverted and the photons can interact with the available inversion to undergo stimulated
emission. However, the available inversion is continuously depleted and towards the end of the
pulse there is not enough inversion left to amplify the pulse further. Thus, a significant
reshaping of the input pulse can be seen at the output. Further reshaping can be observed when
the gain of the amplifier is further increased to 30 dB (red curve). As a result of pulse reshaping,
the FWHM of the pulse decreases from 90 ns to 6 ns. The pulse reshaping effect also leads to
higher peak powers and may introduce additional nonlinear distortions.
Figure 3.3. The calculated intensity profiles for rectangular shape input pulse (blue) and the output pulses
at 10 dB (green) and 30 dB (red) gain respectively.
Although pulse reshaping is not generally desirable in a fiber MOPA system, the effect can be
compensated by incorporating a pulse shaping mechanism in the MOPA system. This pulse
shaping mechanism will be discussed further in the next section and will be applied in the
experimental work presented in this thesis.
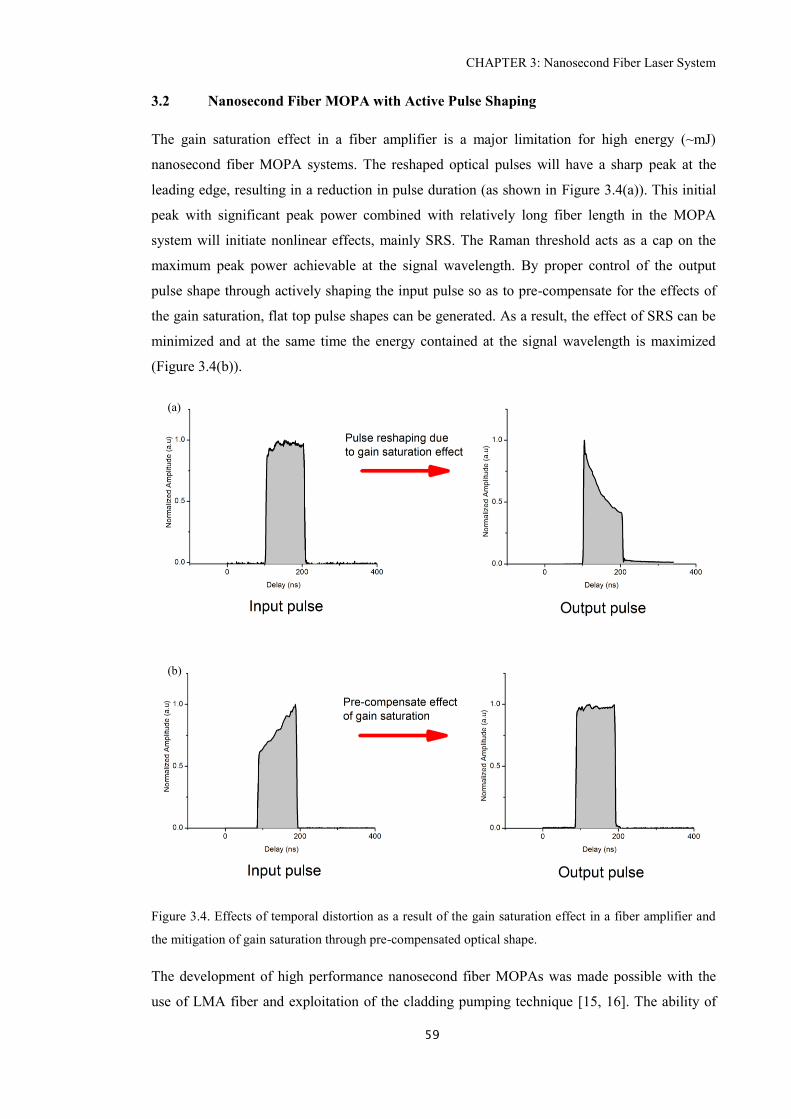
CHAPTER 3: Nanosecond Fiber Laser System
59
3.2 Nanosecond Fiber MOPA with Active Pulse Shaping
The gain saturation effect in a fiber amplifier is a major limitation for high energy (~mJ)
nanosecond fiber MOPA systems. The reshaped optical pulses will have a sharp peak at the
leading edge, resulting in a reduction in pulse duration (as shown in Figure 3.4(a)). This initial
peak with significant peak power combined with relatively long fiber length in the MOPA
system will initiate nonlinear effects, mainly SRS. The Raman threshold acts as a cap on the
maximum peak power achievable at the signal wavelength. By proper control of the output
pulse shape through actively shaping the input pulse so as to pre-compensate for the effects of
the gain saturation, flat top pulse shapes can be generated. As a result, the effect of SRS can be
minimized and at the same time the energy contained at the signal wavelength is maximized
(Figure 3.4(b)).
Figure 3.4. Effects of temporal distortion as a result of the gain saturation effect in a fiber amplifier and
the mitigation of gain saturation through pre-compensated optical shape.
The development of high performance nanosecond fiber MOPAs was made possible with the
use of LMA fiber and exploitation of the cladding pumping technique [15, 16]. The ability of
(a)
(b)
CHAPTER 3: Nanosecond Fiber Laser System
60
fiber based amplifiers generating high quality optical signals was demonstrated by Limpert et al
in 2002 with a maximum average power of 100 W and a pulse energy of 4 mJ with diffraction-
limited beam quality [17]. Two years later, Vu et al demonstrated a diode seeded nanosecond
fiber MOPA system and for the first time, demonstrated adaptive shaping of the optical pulses
by controlling electrical pulses to the laser diode [18]. The shaping technique not only allows
control of the pulse shape at the output of the system but also provides compensation of pulse
deformation due to the saturation effect in fiber amplifiers. The pulse shaping technique was
further refined with the demonstration of an EOM based shaping technique for use within a
MOPA system [6]. With this modification, the quality of the pulses was improved with fewer
features introduced by the operation of the diode or its drive electronics. This system not only
demonstrated the capability of generating tailored pulse shapes at the output, but significantly
improved the extracted pulse energy.
However, the previous laser system lacks the temporal resolution required to shape a shorter
optical pulse. The AWG used has a minimum temporal resolution of 4 ns per point. The shortest
rectangular shaped optical pulse that can be obtained is ~12 ns (at least 3 points are required for
shaping into a rectangular shaped pulse). Thus, optical pulses shorter than 12 ns cannot be
shaped in the previous laser system.
Modification of the laser system was carried out with the aim to upgrade the existing AWG
used in the nanosecond MOPA system with a higher speed AWG. The new AWG will provide a
higher temporal resolution (~ 350 ps) and will allow higher shaping quality. Hence, the
capabilities of the modified laser system in terms of pulse shaping and the machining quality
will be explored in this chapter.
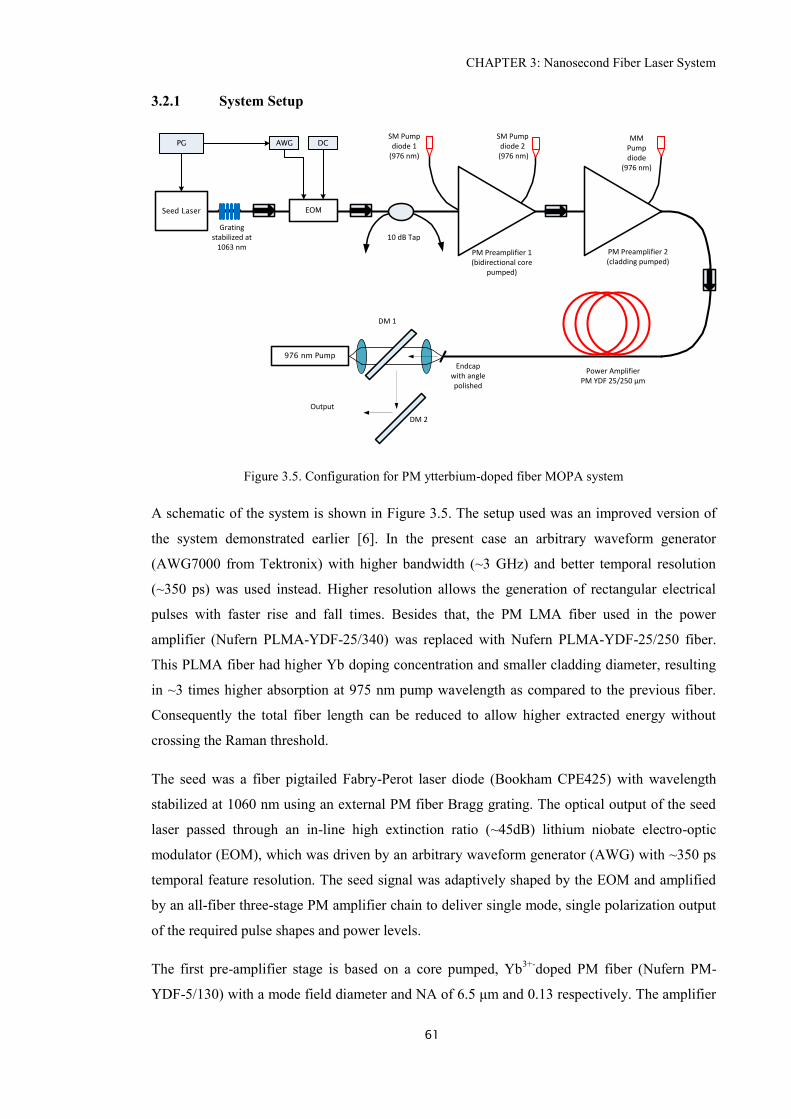
CHAPTER 3: Nanosecond Fiber Laser System
61
3.2.1 System Setup
Figure 3.5. Configuration for PM ytterbium-doped fiber MOPA system
A schematic of the system is shown in Figure 3.5. The setup used was an improved version of
the system demonstrated earlier [6]. In the present case an arbitrary waveform generator
(AWG7000 from Tektronix) with higher bandwidth (~3 GHz) and better temporal resolution
(~350 ps) was used instead. Higher resolution allows the generation of rectangular electrical
pulses with faster rise and fall times. Besides that, the PM LMA fiber used in the power
amplifier (Nufern PLMA-YDF-25/340) was replaced with Nufern PLMA-YDF-25/250 fiber.
This PLMA fiber had higher Yb doping concentration and smaller cladding diameter, resulting
in ~3 times higher absorption at 975 nm pump wavelength as compared to the previous fiber.
Consequently the total fiber length can be reduced to allow higher extracted energy without
crossing the Raman threshold.
The seed was a fiber pigtailed Fabry-Perot laser diode (Bookham CPE425) with wavelength
stabilized at 1060 nm using an external PM fiber Bragg grating. The optical output of the seed
laser passed through an in-line high extinction ratio (~45dB) lithium niobate electro-optic
modulator (EOM), which was driven by an arbitrary waveform generator (AWG) with ~350 ps
temporal feature resolution. The seed signal was adaptively shaped by the EOM and amplified
by an all-fiber three-stage PM amplifier chain to deliver single mode, single polarization output
of the required pulse shapes and power levels.
The first pre-amplifier stage is based on a core pumped, Yb3+-
doped PM fiber (Nufern PM-
YDF-5/130) with a mode field diameter and NA of 6.5 μm and 0.13 respectively. The amplifier
Seed Laser EOM
976 nm Pump
Output
Grating stabilized at
1063 nm10 dB Tap
PM Preamplifier 1 (bidirectional core
pumped)
PM Preamplifier 2 (cladding pumped)
Power AmplifierPM YDF 25/250 µm
DM 1
DM 2
Endcap with angle polished
AWG DCPG
SM Pump diode 1
(976 nm)
MM Pump diode
(976 nm)
SM Pump diode 2
(976 nm)
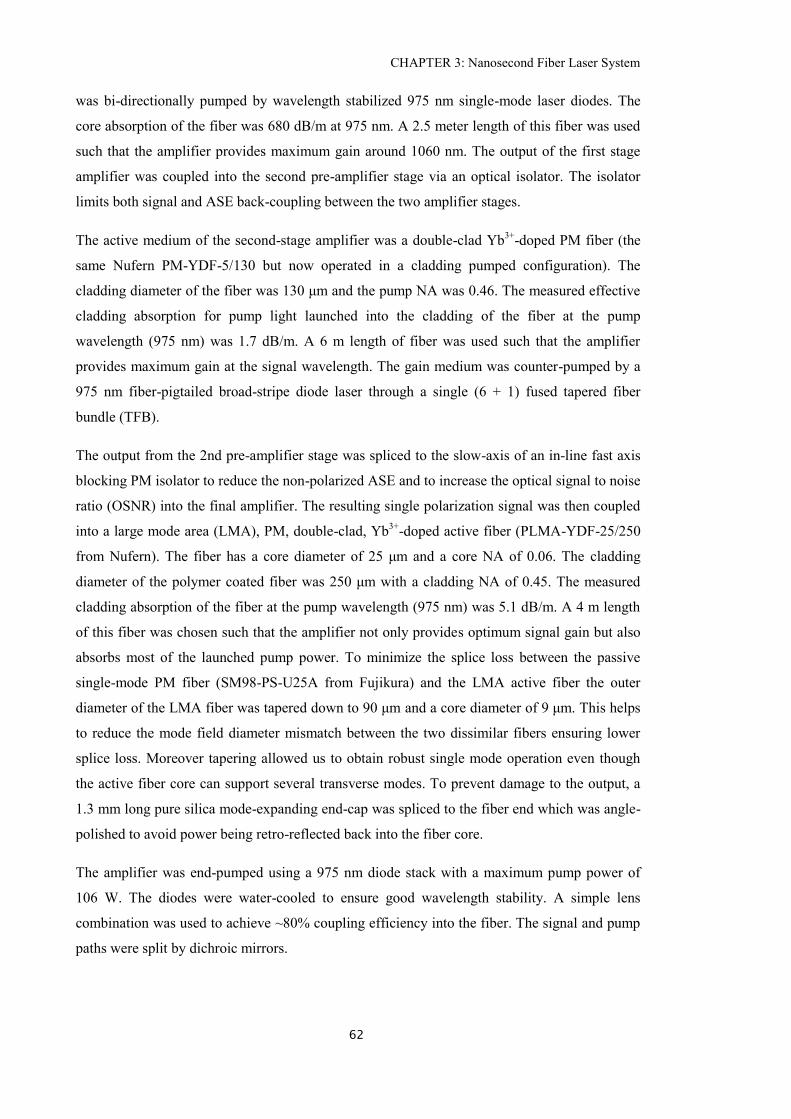
CHAPTER 3: Nanosecond Fiber Laser System
62
was bi-directionally pumped by wavelength stabilized 975 nm single-mode laser diodes. The
core absorption of the fiber was 680 dB/m at 975 nm. A 2.5 meter length of this fiber was used
such that the amplifier provides maximum gain around 1060 nm. The output of the first stage
amplifier was coupled into the second pre-amplifier stage via an optical isolator. The isolator
limits both signal and ASE back-coupling between the two amplifier stages.
The active medium of the second-stage amplifier was a double-clad Yb3+
-doped PM fiber (the
same Nufern PM-YDF-5/130 but now operated in a cladding pumped configuration). The
cladding diameter of the fiber was 130 μm and the pump NA was 0.46. The measured effective
cladding absorption for pump light launched into the cladding of the fiber at the pump
wavelength (975 nm) was 1.7 dB/m. A 6 m length of fiber was used such that the amplifier
provides maximum gain at the signal wavelength. The gain medium was counter-pumped by a
975 nm fiber-pigtailed broad-stripe diode laser through a single (6 + 1) fused tapered fiber
bundle (TFB).
The output from the 2nd pre-amplifier stage was spliced to the slow-axis of an in-line fast axis
blocking PM isolator to reduce the non-polarized ASE and to increase the optical signal to noise
ratio (OSNR) into the final amplifier. The resulting single polarization signal was then coupled
into a large mode area (LMA), PM, double-clad, Yb3+
-doped active fiber (PLMA-YDF-25/250
from Nufern). The fiber has a core diameter of 25 μm and a core NA of 0.06. The cladding
diameter of the polymer coated fiber was 250 μm with a cladding NA of 0.45. The measured
cladding absorption of the fiber at the pump wavelength (975 nm) was 5.1 dB/m. A 4 m length
of this fiber was chosen such that the amplifier not only provides optimum signal gain but also
absorbs most of the launched pump power. To minimize the splice loss between the passive
single-mode PM fiber (SM98-PS-U25A from Fujikura) and the LMA active fiber the outer
diameter of the LMA fiber was tapered down to 90 μm and a core diameter of 9 μm. This helps
to reduce the mode field diameter mismatch between the two dissimilar fibers ensuring lower
splice loss. Moreover tapering allowed us to obtain robust single mode operation even though
the active fiber core can support several transverse modes. To prevent damage to the output, a
1.3 mm long pure silica mode-expanding end-cap was spliced to the fiber end which was angle-
polished to avoid power being retro-reflected back into the fiber core.
The amplifier was end-pumped using a 975 nm diode stack with a maximum pump power of
106 W. The diodes were water-cooled to ensure good wavelength stability. A simple lens
combination was used to achieve ~80% coupling efficiency into the fiber. The signal and pump
paths were split by dichroic mirrors.
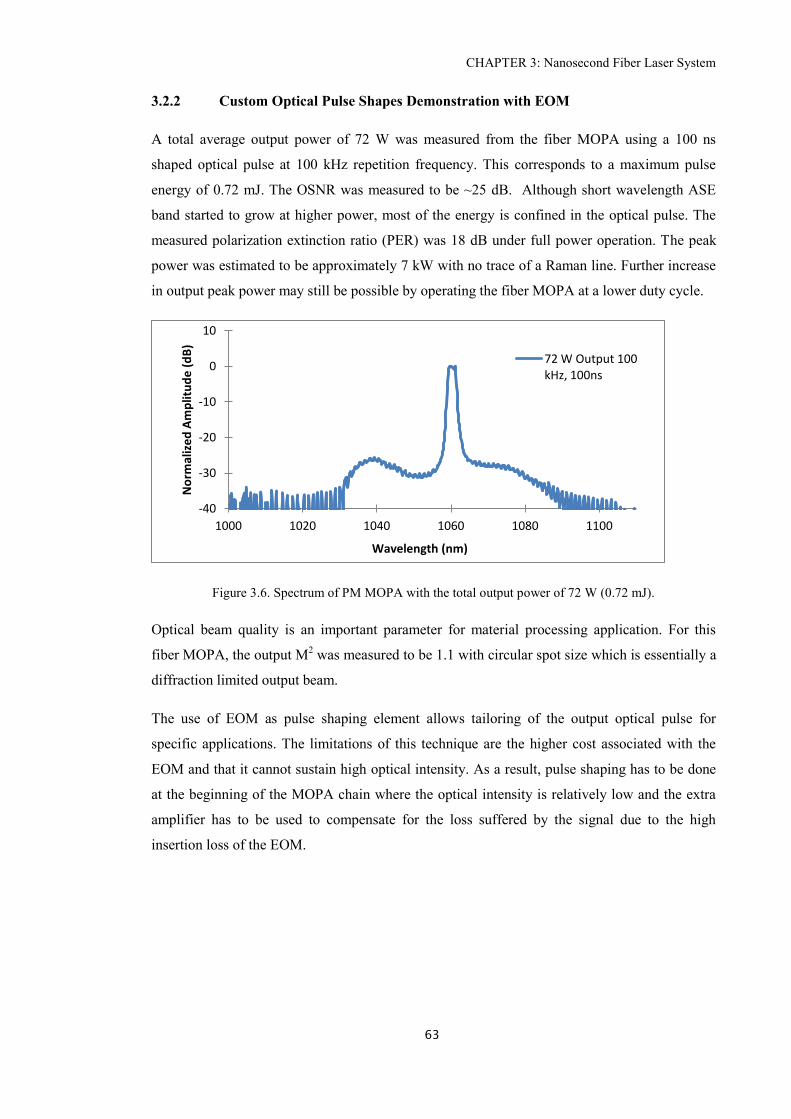
CHAPTER 3: Nanosecond Fiber Laser System
63
3.2.2 Custom Optical Pulse Shapes Demonstration with EOM
A total average output power of 72 W was measured from the fiber MOPA using a 100 ns
shaped optical pulse at 100 kHz repetition frequency. This corresponds to a maximum pulse
energy of 0.72 mJ. The OSNR was measured to be ~25 dB. Although short wavelength ASE
band started to grow at higher power, most of the energy is confined in the optical pulse. The
measured polarization extinction ratio (PER) was 18 dB under full power operation. The peak
power was estimated to be approximately 7 kW with no trace of a Raman line. Further increase
in output peak power may still be possible by operating the fiber MOPA at a lower duty cycle.
Figure 3.6. Spectrum of PM MOPA with the total output power of 72 W (0.72 mJ).
Optical beam quality is an important parameter for material processing application. For this
fiber MOPA, the output M2 was measured to be 1.1 with circular spot size which is essentially a
diffraction limited output beam.
The use of EOM as pulse shaping element allows tailoring of the output optical pulse for
specific applications. The limitations of this technique are the higher cost associated with the
EOM and that it cannot sustain high optical intensity. As a result, pulse shaping has to be done
at the beginning of the MOPA chain where the optical intensity is relatively low and the extra
amplifier has to be used to compensate for the loss suffered by the signal due to the high
insertion loss of the EOM.
-40
-30
-20
-10
0
10
1000 1020 1040 1060 1080 1100
No
rmal
ize
d A
mp
litu
de
(d
B)
Wavelength (nm)
72 W Output 100 kHz, 100ns
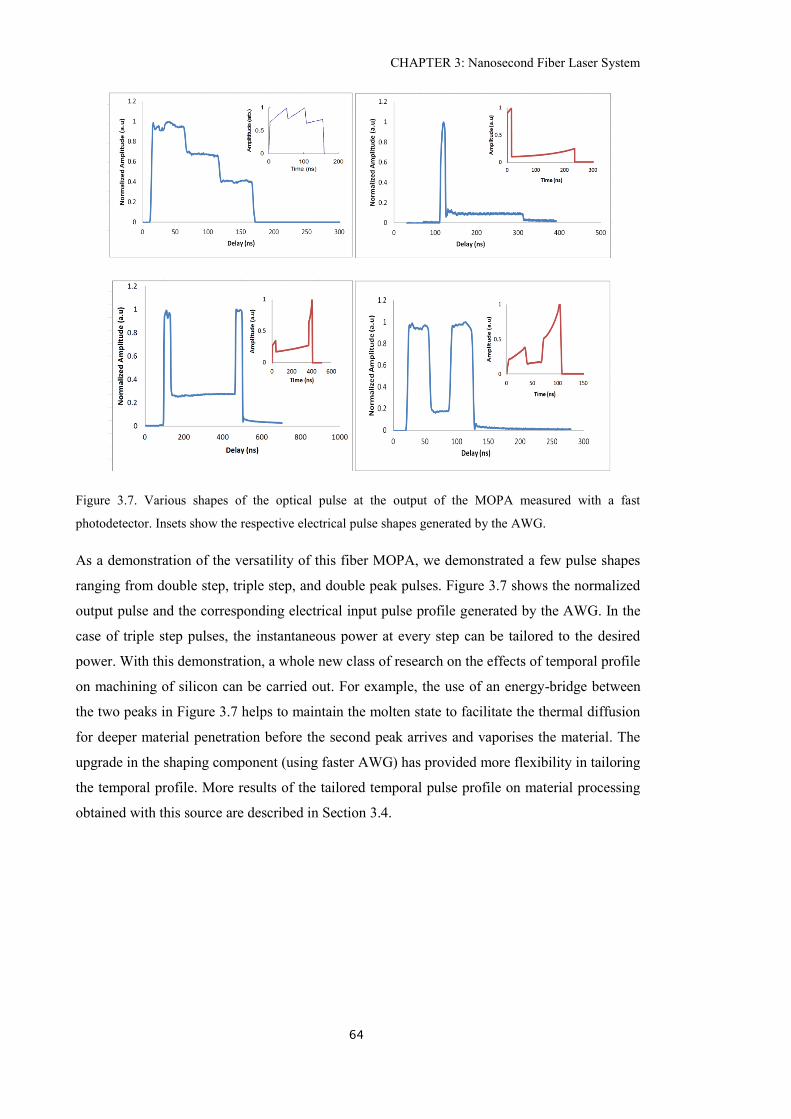
CHAPTER 3: Nanosecond Fiber Laser System
64
Figure 3.7. Various shapes of the optical pulse at the output of the MOPA measured with a fast
photodetector. Insets show the respective electrical pulse shapes generated by the AWG.
As a demonstration of the versatility of this fiber MOPA, we demonstrated a few pulse shapes
ranging from double step, triple step, and double peak pulses. Figure 3.7 shows the normalized
output pulse and the corresponding electrical input pulse profile generated by the AWG. In the
case of triple step pulses, the instantaneous power at every step can be tailored to the desired
power. With this demonstration, a whole new class of research on the effects of temporal profile
on machining of silicon can be carried out. For example, the use of an energy-bridge between
the two peaks in Figure 3.7 helps to maintain the molten state to facilitate the thermal diffusion
for deeper material penetration before the second peak arrives and vaporises the material. The
upgrade in the shaping component (using faster AWG) has provided more flexibility in tailoring
the temporal profile. More results of the tailored temporal pulse profile on material processing
obtained with this source are described in Section 3.4.
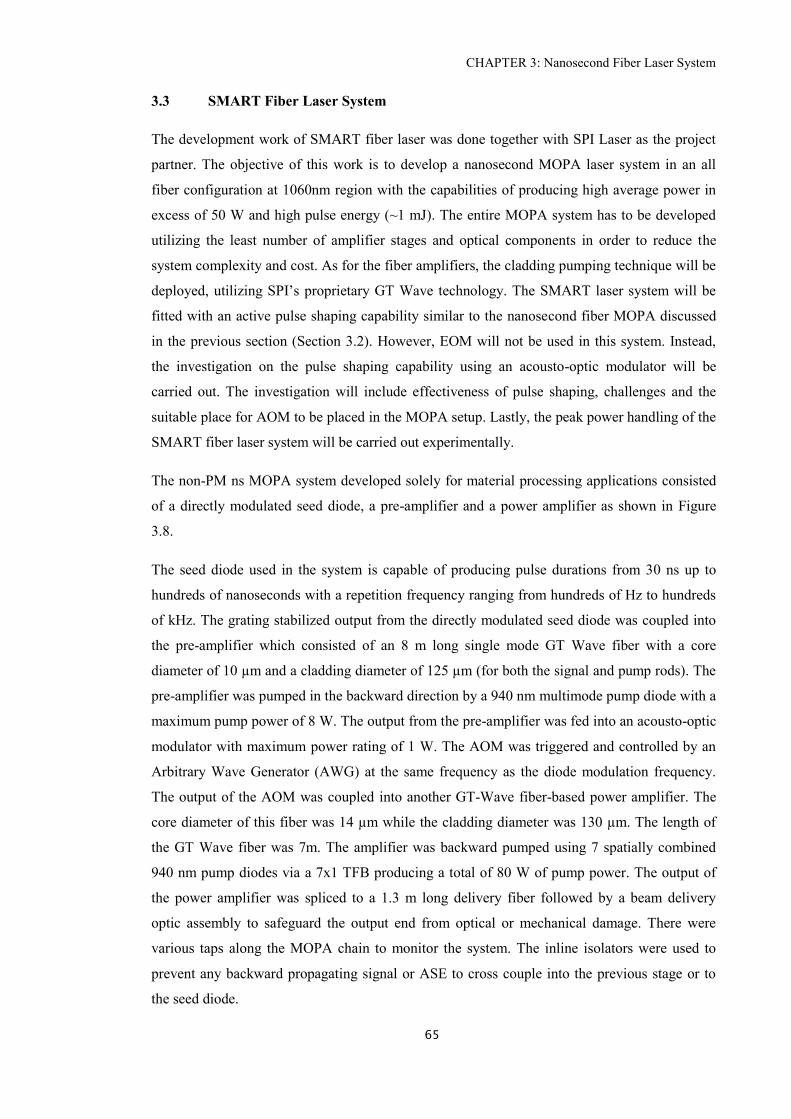
CHAPTER 3: Nanosecond Fiber Laser System
65
3.3 SMART Fiber Laser System
The development work of SMART fiber laser was done together with SPI Laser as the project
partner. The objective of this work is to develop a nanosecond MOPA laser system in an all
fiber configuration at 1060nm region with the capabilities of producing high average power in
excess of 50 W and high pulse energy (~1 mJ). The entire MOPA system has to be developed
utilizing the least number of amplifier stages and optical components in order to reduce the
system complexity and cost. As for the fiber amplifiers, the cladding pumping technique will be
deployed, utilizing SPI’s proprietary GT Wave technology. The SMART laser system will be
fitted with an active pulse shaping capability similar to the nanosecond fiber MOPA discussed
in the previous section (Section 3.2). However, EOM will not be used in this system. Instead,
the investigation on the pulse shaping capability using an acousto-optic modulator will be
carried out. The investigation will include effectiveness of pulse shaping, challenges and the
suitable place for AOM to be placed in the MOPA setup. Lastly, the peak power handling of the
SMART fiber laser system will be carried out experimentally.
The non-PM ns MOPA system developed solely for material processing applications consisted
of a directly modulated seed diode, a pre-amplifier and a power amplifier as shown in Figure
3.8.
The seed diode used in the system is capable of producing pulse durations from 30 ns up to
hundreds of nanoseconds with a repetition frequency ranging from hundreds of Hz to hundreds
of kHz. The grating stabilized output from the directly modulated seed diode was coupled into
the pre-amplifier which consisted of an 8 m long single mode GT Wave fiber with a core
diameter of 10 µm and a cladding diameter of 125 µm (for both the signal and pump rods). The
pre-amplifier was pumped in the backward direction by a 940 nm multimode pump diode with a
maximum pump power of 8 W. The output from the pre-amplifier was fed into an acousto-optic
modulator with maximum power rating of 1 W. The AOM was triggered and controlled by an
Arbitrary Wave Generator (AWG) at the same frequency as the diode modulation frequency.
The output of the AOM was coupled into another GT-Wave fiber-based power amplifier. The
core diameter of this fiber was 14 µm while the cladding diameter was 130 µm. The length of
the GT Wave fiber was 7m. The amplifier was backward pumped using 7 spatially combined
940 nm pump diodes via a 7x1 TFB producing a total of 80 W of pump power. The output of
the power amplifier was spliced to a 1.3 m long delivery fiber followed by a beam delivery
optic assembly to safeguard the output end from optical or mechanical damage. There were
various taps along the MOPA chain to monitor the system. The inline isolators were used to
prevent any backward propagating signal or ASE to cross couple into the previous stage or to
the seed diode.
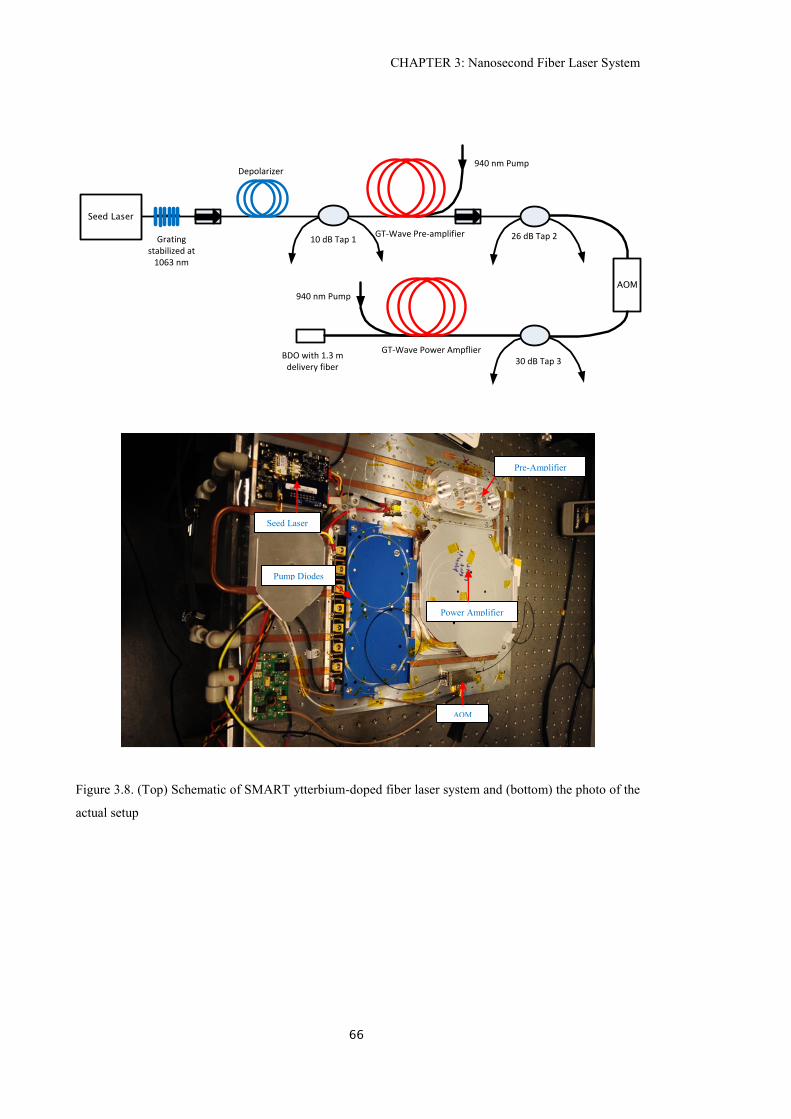
CHAPTER 3: Nanosecond Fiber Laser System
66
Figure 3.8. (Top) Schematic of SMART ytterbium-doped fiber laser system and (bottom) the photo of the
actual setup
Seed Laser
AOM
Grating stabilized at
1063 nm
Depolarizer
10 dB Tap 1GT-Wave Pre-amplifier 26 dB Tap 2
30 dB Tap 3GT-Wave Power Ampflier
BDO with 1.3 m delivery fiber
940 nm Pump
940 nm Pump
Power Amplifier
AOM
Pre-Amplifier
Seed Laser
Pump Diodes
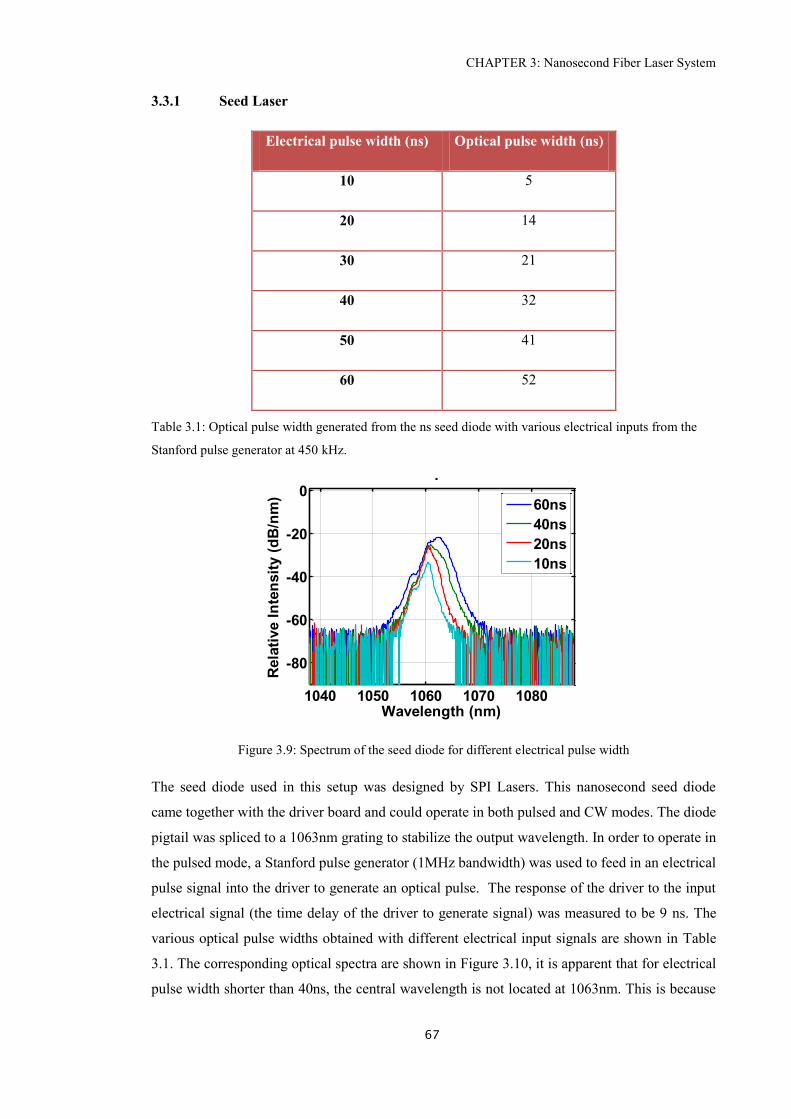
CHAPTER 3: Nanosecond Fiber Laser System
67
3.3.1 Seed Laser
Electrical pulse width (ns) Optical pulse width (ns)
10 5
20 14
30 21
40 32
50 41
60 52
Table 3.1: Optical pulse width generated from the ns seed diode with various electrical inputs from the
Stanford pulse generator at 450 kHz.
Figure 3.9: Spectrum of the seed diode for different electrical pulse width
The seed diode used in this setup was designed by SPI Lasers. This nanosecond seed diode
came together with the driver board and could operate in both pulsed and CW modes. The diode
pigtail was spliced to a 1063nm grating to stabilize the output wavelength. In order to operate in
the pulsed mode, a Stanford pulse generator (1MHz bandwidth) was used to feed in an electrical
pulse signal into the driver to generate an optical pulse. The response of the driver to the input
electrical signal (the time delay of the driver to generate signal) was measured to be 9 ns. The
various optical pulse widths obtained with different electrical input signals are shown in Table
3.1. The corresponding optical spectra are shown in Figure 3.10, it is apparent that for electrical
pulse width shorter than 40ns, the central wavelength is not located at 1063nm. This is because
1040 1050 1060 1070 1080
-80
-60
-40
-20
0
Wavelength (nm)
Rela
tive I
nte
nsit
y (
dB
/nm
)
Electrical pulse width
60ns
40ns
20ns
10ns
CHAPTER 3: Nanosecond Fiber Laser System
68
the feedback from the grating does not arrive back at the diode in time before the diode
threshold is achieved and the device begins to lase.
The interaction of optical feedback in the laser diode can be clearly observed by plotting a
spectrogram. In order to obtain the spectrogram, an optical pulse will be divided into ‘n’ section
with a fixed step size (as illustrated in Figure 3.10 (a)). The spectrum for each section will be
measured and the collected spectrums will be compiled to obtain the wavelength vs time delay
spectrogram. From Figure 3.10, it can be seen that the diode only sees the feedback coming
from the grating after 35ns. Thus, the shortest optical pulse width that can be generated by this
grating stabilized seed diode ensuring a stable output without wavelength and intensity
instabilities is around 30ns.
Figure 3.10: (a) Division of optical pulse into sections for spectrogram measurement. Spectrogram
obtained for (b) 20ns, (c) 40ns and (d) 60ns electrical pulse width
The maximum average output power of the seed diode in the CW mode was 500mW. However,
when operating in the pulsed mode, the output power varied as a function of the duty cycle of
the generated optical pulse stream. A depolarizer was so as to avoid Polarization Dependent
Gain within the amplifiers. A length of PM980 fiber (~30m) was used to build the depolarizer.
The fiber was broken at the midway point and spliced together with the principal polarization
(d) (c)
(b)
1 2 3 4 5 6 7 8 9 (a)
Time (ns)
Optical Pulse
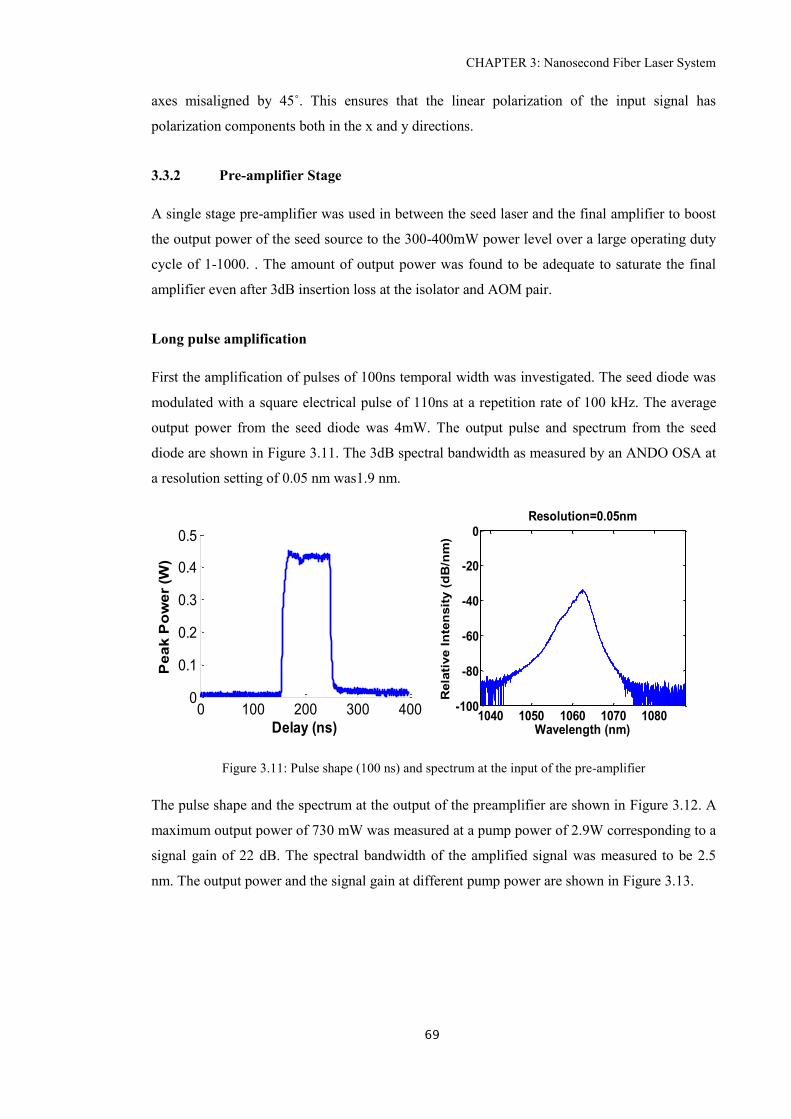
CHAPTER 3: Nanosecond Fiber Laser System
69
axes misaligned by 45˚. This ensures that the linear polarization of the input signal has
polarization components both in the x and y directions.
3.3.2 Pre-amplifier Stage
A single stage pre-amplifier was used in between the seed laser and the final amplifier to boost
the output power of the seed source to the 300-400mW power level over a large operating duty
cycle of 1-1000. . The amount of output power was found to be adequate to saturate the final
amplifier even after 3dB insertion loss at the isolator and AOM pair.
Long pulse amplification
First the amplification of pulses of 100ns temporal width was investigated. The seed diode was
modulated with a square electrical pulse of 110ns at a repetition rate of 100 kHz. The average
output power from the seed diode was 4mW. The output pulse and spectrum from the seed
diode are shown in Figure 3.11. The 3dB spectral bandwidth as measured by an ANDO OSA at
a resolution setting of 0.05 nm was1.9 nm.
Figure 3.11: Pulse shape (100 ns) and spectrum at the input of the pre-amplifier
The pulse shape and the spectrum at the output of the preamplifier are shown in Figure 3.12. A
maximum output power of 730 mW was measured at a pump power of 2.9W corresponding to a
signal gain of 22 dB. The spectral bandwidth of the amplified signal was measured to be 2.5
nm. The output power and the signal gain at different pump power are shown in Figure 3.13.
0 100 200 300 4000
0.1
0.2
0.3
0.4
0.5
Delay (ns)
Pe
ak
Po
we
r (W
)
1040 1050 1060 1070 1080-100
-80
-60
-40
-20
0
Wavelength (nm)
Rela
tive I
nte
nsit
y (
dB
/nm
)
Resolution=0.05nm
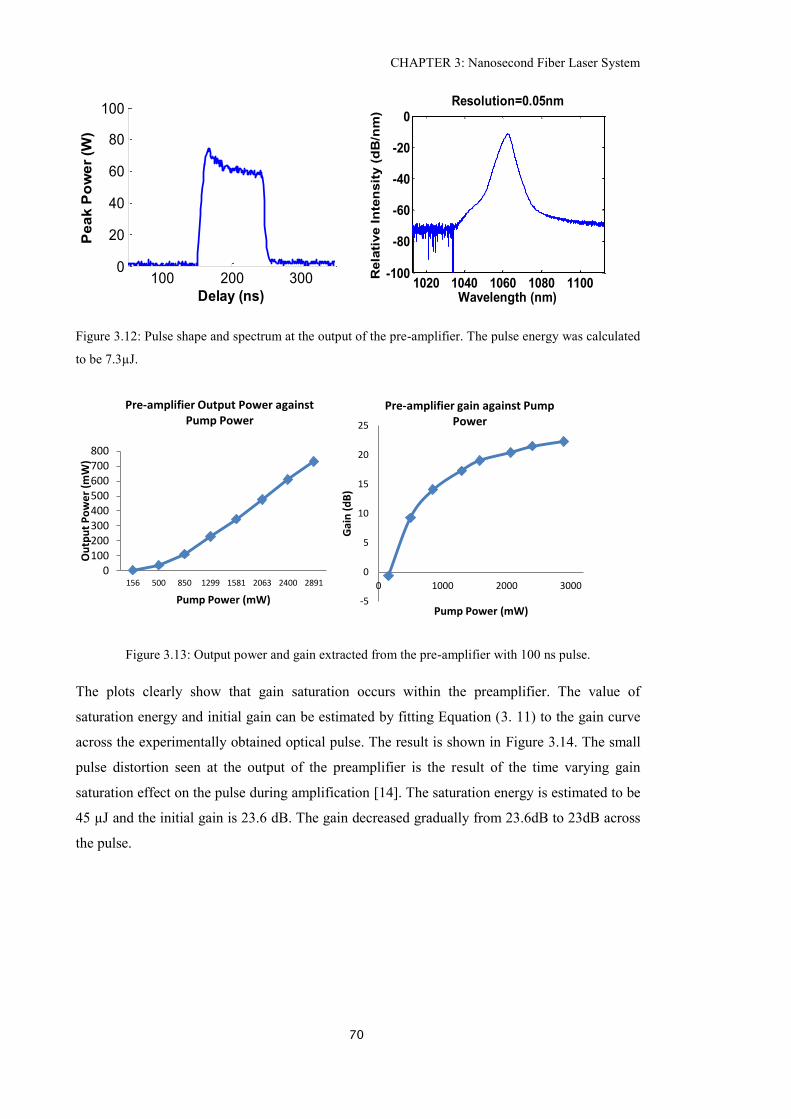
CHAPTER 3: Nanosecond Fiber Laser System
70
Figure 3.12: Pulse shape and spectrum at the output of the pre-amplifier. The pulse energy was calculated
to be 7.3µJ.
Figure 3.13: Output power and gain extracted from the pre-amplifier with 100 ns pulse.
The plots clearly show that gain saturation occurs within the preamplifier. The value of
saturation energy and initial gain can be estimated by fitting Equation (3. 11) to the gain curve
across the experimentally obtained optical pulse. The result is shown in Figure 3.14. The small
pulse distortion seen at the output of the preamplifier is the result of the time varying gain
saturation effect on the pulse during amplification [14]. The saturation energy is estimated to be
45 µJ and the initial gain is 23.6 dB. The gain decreased gradually from 23.6dB to 23dB across
the pulse.
100 200 3000
20
40
60
80
100
Delay (ns)
Pe
ak
Po
we
r (W
)
1020 1040 1060 1080 1100-100
-80
-60
-40
-20
0
Wavelength (nm)
Rela
tive I
nte
nsit
y (
dB
/nm
)
Resolution=0.05nm
0
100
200
300 400
500 600
700
800
156 500 850 1299 1581 2063 2400 2891
Ou
tpu
t P
ow
er
(mW
)
Pump Power (mW)
Pre-amplifier Output Power against Pump Power
-5
0
5
10
15
20
25
0 1000 2000 3000
Gai
n (
dB
)
Pump Power (mW)
Pre-amplifier gain against Pump Power
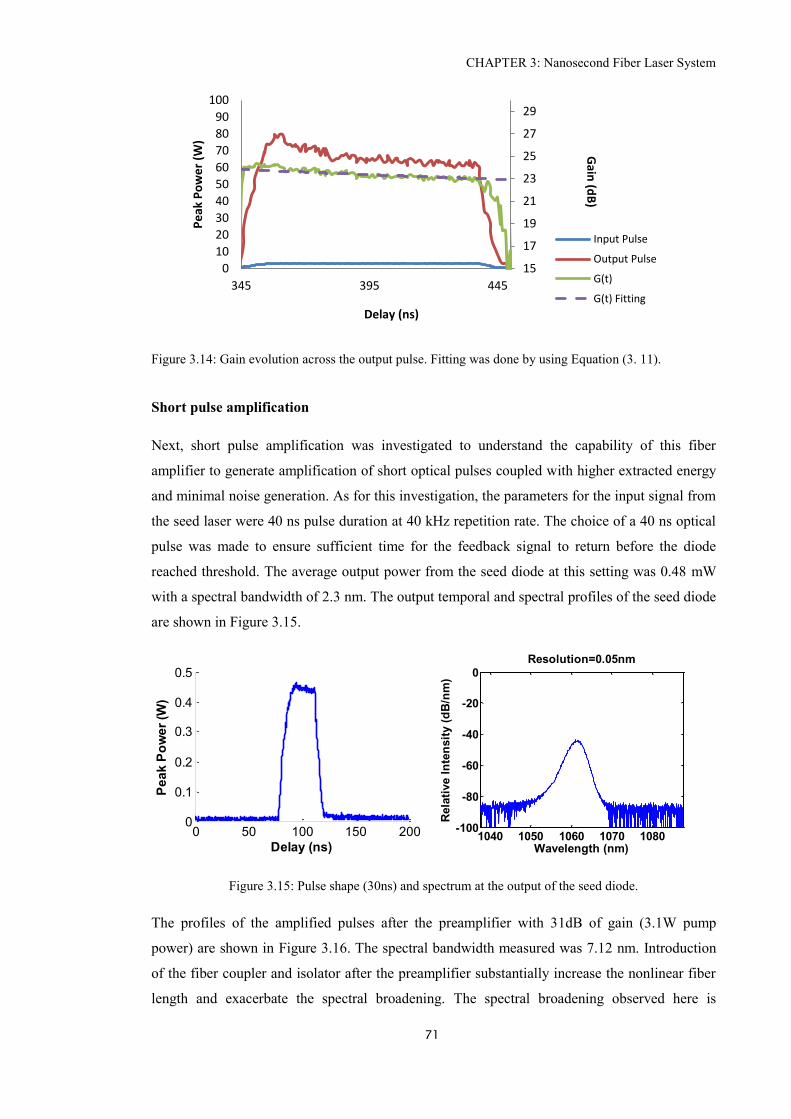
CHAPTER 3: Nanosecond Fiber Laser System
71
Figure 3.14: Gain evolution across the output pulse. Fitting was done by using Equation (3. 11).
Short pulse amplification
Next, short pulse amplification was investigated to understand the capability of this fiber
amplifier to generate amplification of short optical pulses coupled with higher extracted energy
and minimal noise generation. As for this investigation, the parameters for the input signal from
the seed laser were 40 ns pulse duration at 40 kHz repetition rate. The choice of a 40 ns optical
pulse was made to ensure sufficient time for the feedback signal to return before the diode
reached threshold. The average output power from the seed diode at this setting was 0.48 mW
with a spectral bandwidth of 2.3 nm. The output temporal and spectral profiles of the seed diode
are shown in Figure 3.15.
Figure 3.15: Pulse shape (30ns) and spectrum at the output of the seed diode.
The profiles of the amplified pulses after the preamplifier with 31dB of gain (3.1W pump
power) are shown in Figure 3.16. The spectral bandwidth measured was 7.12 nm. Introduction
of the fiber coupler and isolator after the preamplifier substantially increase the nonlinear fiber
length and exacerbate the spectral broadening. The spectral broadening observed here is
15
17
19
21
23
25
27
29
0
10
20
30
40
50
60
70
80
90
100
345 395 445
Pe
ak P
ow
er
(W)
Delay (ns)
Input Pulse
Output Pulse
G(t)
G(t) Fitting
Gain
(dB
)
0 50 100 150 2000
0.1
0.2
0.3
0.4
0.5
Delay (ns)
Pe
ak
Po
we
r (W
)
1040 1050 1060 1070 1080-100
-80
-60
-40
-20
0
Wavelength (nm)
Rela
tive I
nte
nsit
y (
dB
/nm
)
Resolution=0.05nm
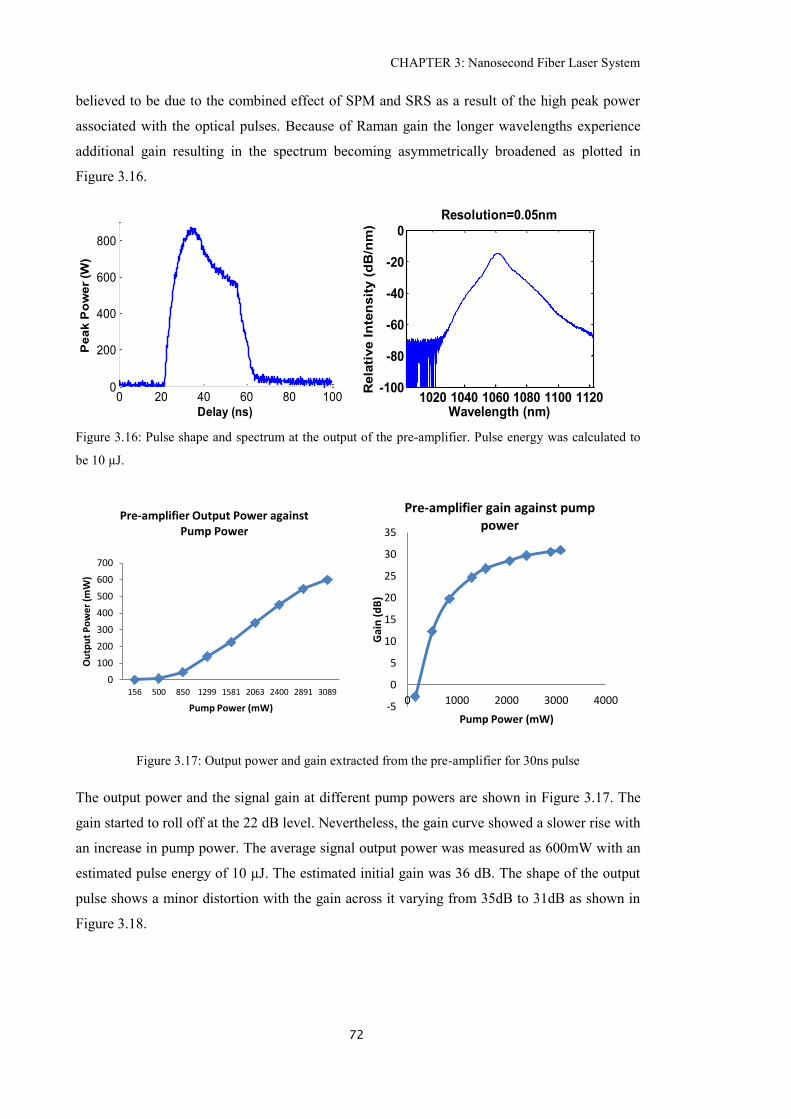
CHAPTER 3: Nanosecond Fiber Laser System
72
believed to be due to the combined effect of SPM and SRS as a result of the high peak power
associated with the optical pulses. Because of Raman gain the longer wavelengths experience
additional gain resulting in the spectrum becoming asymmetrically broadened as plotted in
Figure 3.16.
Figure 3.16: Pulse shape and spectrum at the output of the pre-amplifier. Pulse energy was calculated to
be 10 µJ.
Figure 3.17: Output power and gain extracted from the pre-amplifier for 30ns pulse
The output power and the signal gain at different pump powers are shown in Figure 3.17. The
gain started to roll off at the 22 dB level. Nevertheless, the gain curve showed a slower rise with
an increase in pump power. The average signal output power was measured as 600mW with an
estimated pulse energy of 10 µJ. The estimated initial gain was 36 dB. The shape of the output
pulse shows a minor distortion with the gain across it varying from 35dB to 31dB as shown in
Figure 3.18.
0 20 40 60 80 1000
200
400
600
800
Delay (ns)
Pe
ak
Po
we
r (W
)
1020 1040 1060 1080 1100 1120-100
-80
-60
-40
-20
0
Wavelength (nm)
Rela
tive I
nte
nsit
y (
dB
/nm
)
Resolution=0.05nm
0
100
200
300
400
500
600
700
156 500 850 1299 1581 2063 2400 2891 3089
Ou
tpu
t P
ow
er
(mW
)
Pump Power (mW)
Pre-amplifier Output Power against Pump Power
-5
0
5
10
15
20
25
30
35
0 1000 2000 3000 4000
Gai
n (
dB
)
Pump Power (mW)
Pre-amplifier gain against pump power
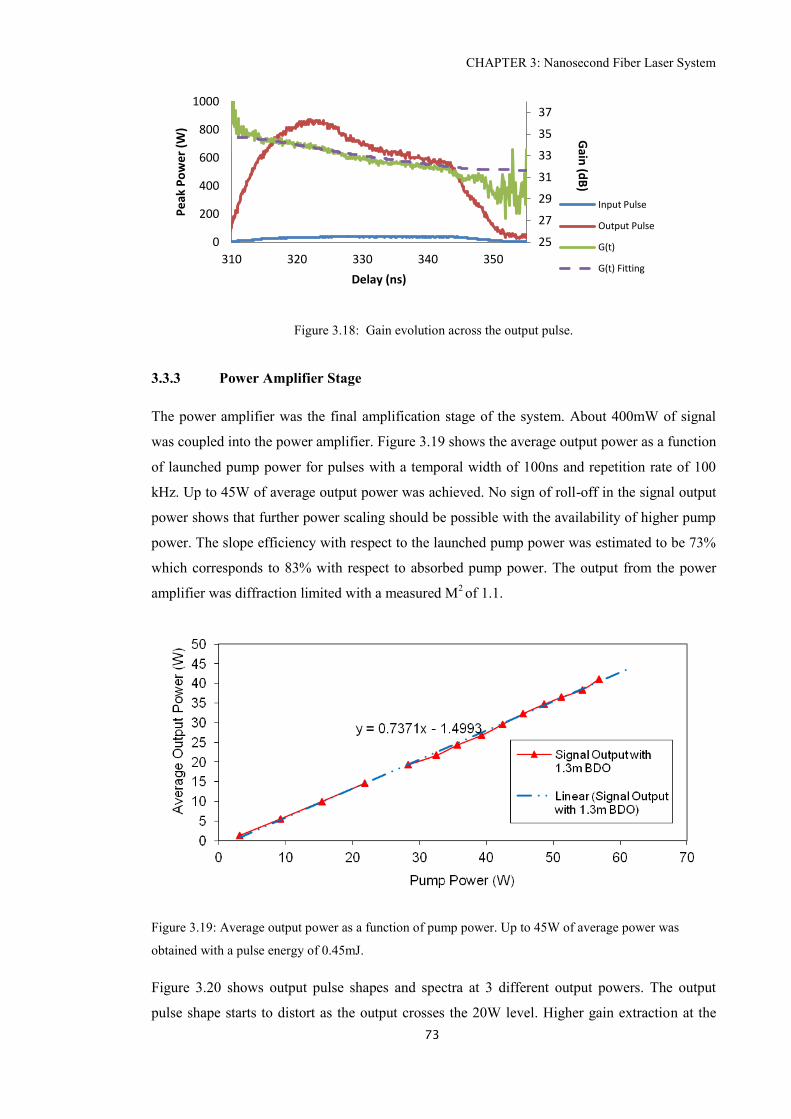
CHAPTER 3: Nanosecond Fiber Laser System
73
Figure 3.18: Gain evolution across the output pulse.
3.3.3 Power Amplifier Stage
The power amplifier was the final amplification stage of the system. About 400mW of signal
was coupled into the power amplifier. Figure 3.19 shows the average output power as a function
of launched pump power for pulses with a temporal width of 100ns and repetition rate of 100
kHz. Up to 45W of average output power was achieved. No sign of roll-off in the signal output
power shows that further power scaling should be possible with the availability of higher pump
power. The slope efficiency with respect to the launched pump power was estimated to be 73%
which corresponds to 83% with respect to absorbed pump power. The output from the power
amplifier was diffraction limited with a measured M2 of 1.1.
Figure 3.19: Average output power as a function of pump power. Up to 45W of average power was
obtained with a pulse energy of 0.45mJ.
Figure 3.20 shows output pulse shapes and spectra at 3 different output powers. The output
pulse shape starts to distort as the output crosses the 20W level. Higher gain extraction at the
25
27
29
31
33
35
37
0
200
400
600
800
1000
310 320 330 340 350
Pe
ak P
ow
er
(W)
Delay (ns)
Input Pulse
Output Pulse
G(t)
G(t) Fitting
Gain
(dB
)
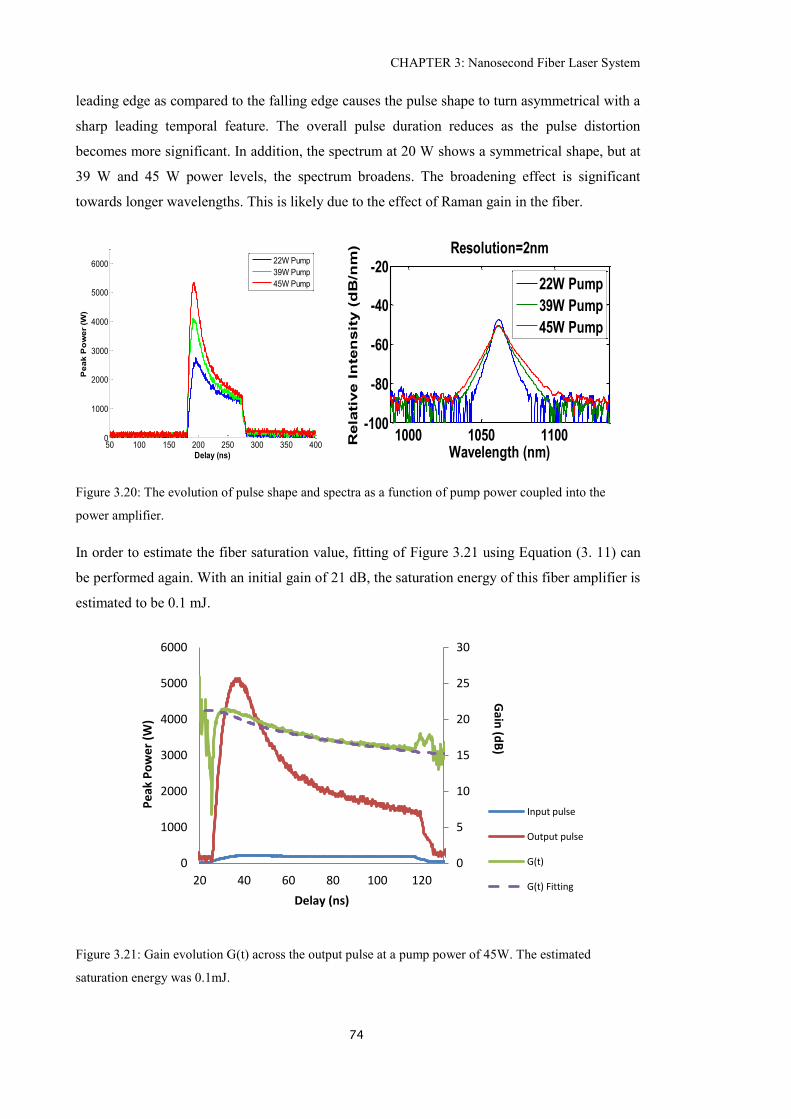
CHAPTER 3: Nanosecond Fiber Laser System
74
leading edge as compared to the falling edge causes the pulse shape to turn asymmetrical with a
sharp leading temporal feature. The overall pulse duration reduces as the pulse distortion
becomes more significant. In addition, the spectrum at 20 W shows a symmetrical shape, but at
39 W and 45 W power levels, the spectrum broadens. The broadening effect is significant
towards longer wavelengths. This is likely due to the effect of Raman gain in the fiber.
Figure 3.20: The evolution of pulse shape and spectra as a function of pump power coupled into the
power amplifier.
In order to estimate the fiber saturation value, fitting of Figure 3.21 using Equation (3. 11) can
be performed again. With an initial gain of 21 dB, the saturation energy of this fiber amplifier is
estimated to be 0.1 mJ.
Figure 3.21: Gain evolution G(t) across the output pulse at a pump power of 45W. The estimated
saturation energy was 0.1mJ.
50 100 150 200 250 300 350 4000
1000
2000
3000
4000
5000
6000
Delay (ns)
Pe
ak
Po
we
r (W
)
22W Pump
39W Pump
45W Pump
1000 1050 1100-100
-80
-60
-40
-20
Wavelength (nm)
Rela
tive I
nte
nsit
y (
dB
/nm
) Resolution=2nm
22W Pump
39W Pump
45W Pump
0
5
10
15
20
25
30
0
1000
2000
3000
4000
5000
6000
20 40 60 80 100 120
Pe
ak P
ow
er
(W)
Delay (ns)
Input pulse
Output pulse
G(t)
G(t) Fitting
Gain
(dB
)
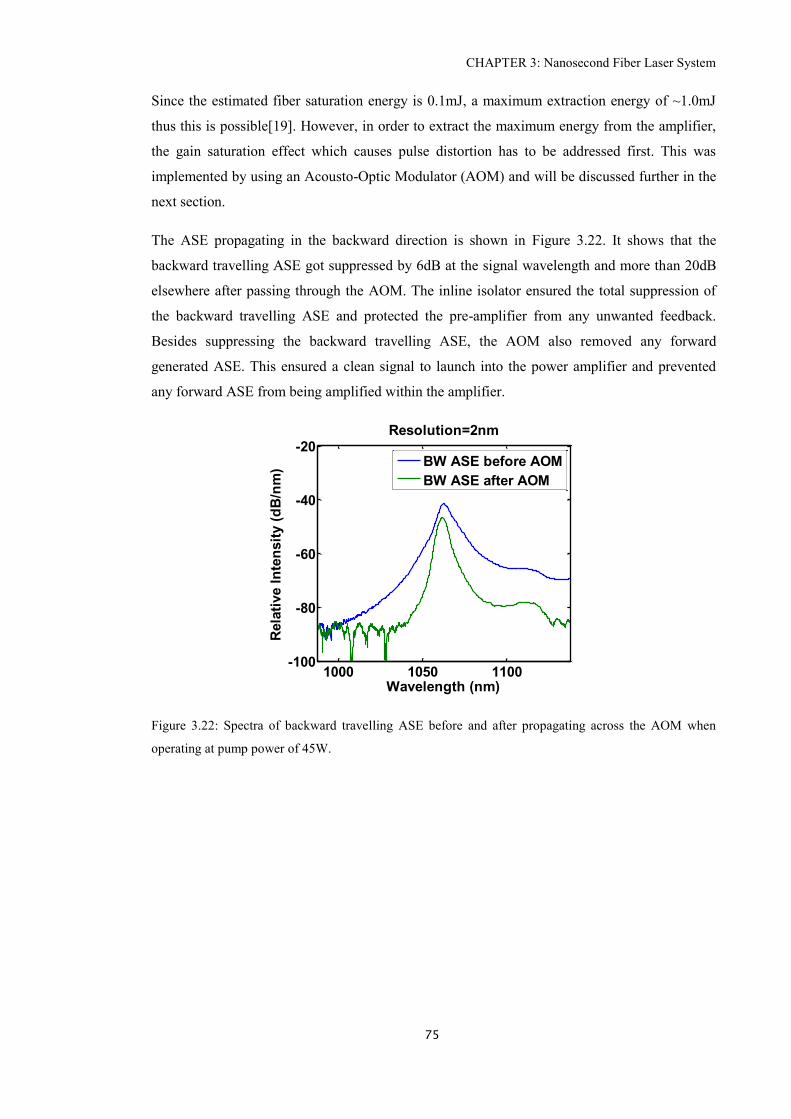
CHAPTER 3: Nanosecond Fiber Laser System
75
Since the estimated fiber saturation energy is 0.1mJ, a maximum extraction energy of ~1.0mJ
thus this is possible[19]. However, in order to extract the maximum energy from the amplifier,
the gain saturation effect which causes pulse distortion has to be addressed first. This was
implemented by using an Acousto-Optic Modulator (AOM) and will be discussed further in the
next section.
The ASE propagating in the backward direction is shown in Figure 3.22. It shows that the
backward travelling ASE got suppressed by 6dB at the signal wavelength and more than 20dB
elsewhere after passing through the AOM. The inline isolator ensured the total suppression of
the backward travelling ASE and protected the pre-amplifier from any unwanted feedback.
Besides suppressing the backward travelling ASE, the AOM also removed any forward
generated ASE. This ensured a clean signal to launch into the power amplifier and prevented
any forward ASE from being amplified within the amplifier.
Figure 3.22: Spectra of backward travelling ASE before and after propagating across the AOM when
operating at pump power of 45W.
1000 1050 1100-100
-80
-60
-40
-20
Wavelength (nm)
Rela
tive I
nte
nsit
y (
dB
/nm
)
Resolution=2nm
BW ASE before AOM
BW ASE after AOM
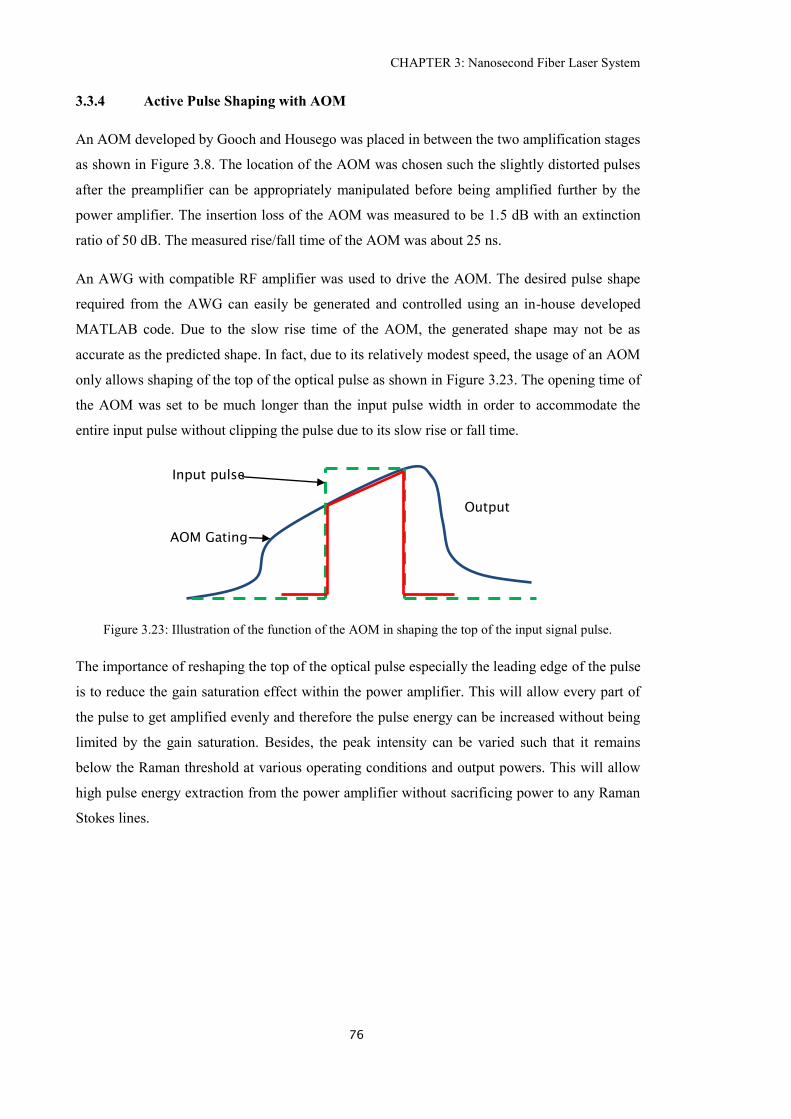
CHAPTER 3: Nanosecond Fiber Laser System
76
3.3.4 Active Pulse Shaping with AOM
An AOM developed by Gooch and Housego was placed in between the two amplification stages
as shown in Figure 3.8. The location of the AOM was chosen such the slightly distorted pulses
after the preamplifier can be appropriately manipulated before being amplified further by the
power amplifier. The insertion loss of the AOM was measured to be 1.5 dB with an extinction
ratio of 50 dB. The measured rise/fall time of the AOM was about 25 ns.
An AWG with compatible RF amplifier was used to drive the AOM. The desired pulse shape
required from the AWG can easily be generated and controlled using an in-house developed
MATLAB code. Due to the slow rise time of the AOM, the generated shape may not be as
accurate as the predicted shape. In fact, due to its relatively modest speed, the usage of an AOM
only allows shaping of the top of the optical pulse as shown in Figure 3.23. The opening time of
the AOM was set to be much longer than the input pulse width in order to accommodate the
entire input pulse without clipping the pulse due to its slow rise or fall time.
Figure 3.23: Illustration of the function of the AOM in shaping the top of the input signal pulse.
The importance of reshaping the top of the optical pulse especially the leading edge of the pulse
is to reduce the gain saturation effect within the power amplifier. This will allow every part of
the pulse to get amplified evenly and therefore the pulse energy can be increased without being
limited by the gain saturation. Besides, the peak intensity can be varied such that it remains
below the Raman threshold at various operating conditions and output powers. This will allow
high pulse energy extraction from the power amplifier without sacrificing power to any Raman
Stokes lines.
AOM Gating
Input pulse
Output
pulse
pppulsepuls
e
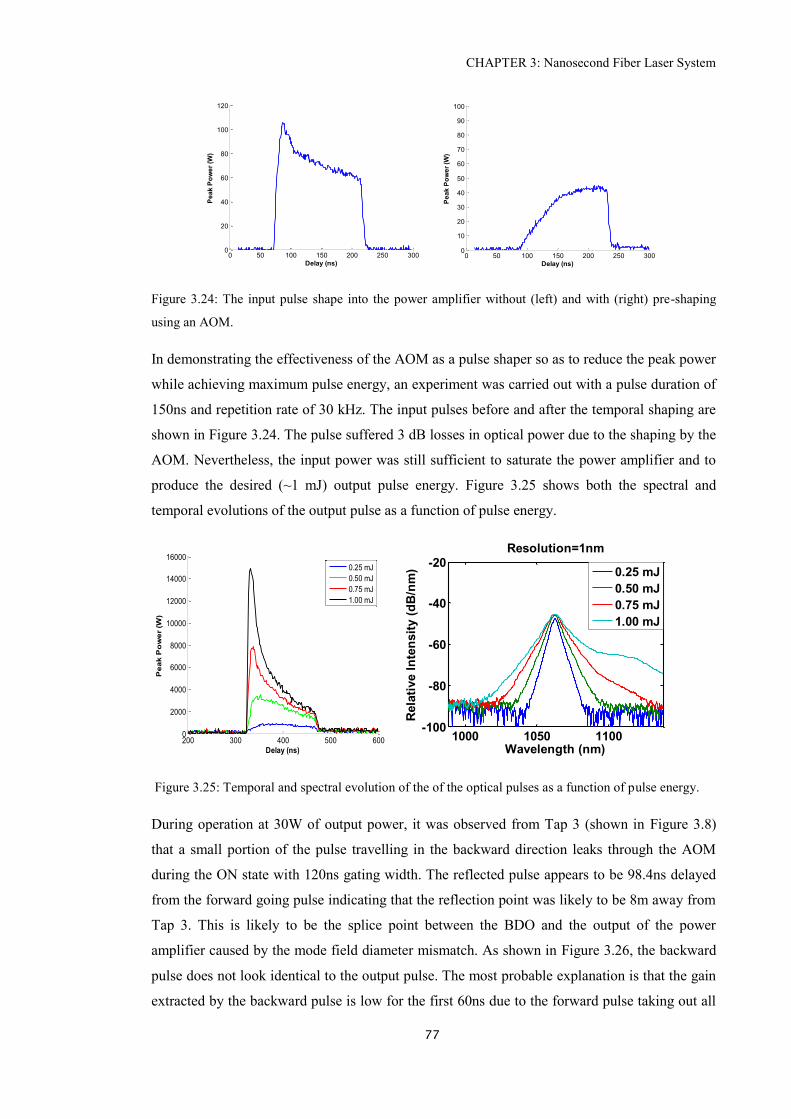
CHAPTER 3: Nanosecond Fiber Laser System
77
Figure 3.24: The input pulse shape into the power amplifier without (left) and with (right) pre-shaping
using an AOM.
In demonstrating the effectiveness of the AOM as a pulse shaper so as to reduce the peak power
while achieving maximum pulse energy, an experiment was carried out with a pulse duration of
150ns and repetition rate of 30 kHz. The input pulses before and after the temporal shaping are
shown in Figure 3.24. The pulse suffered 3 dB losses in optical power due to the shaping by the
AOM. Nevertheless, the input power was still sufficient to saturate the power amplifier and to
produce the desired (~1 mJ) output pulse energy. Figure 3.25 shows both the spectral and
temporal evolutions of the output pulse as a function of pulse energy.
Figure 3.25: Temporal and spectral evolution of the of the optical pulses as a function of pulse energy.
During operation at 30W of output power, it was observed from Tap 3 (shown in Figure 3.8)
that a small portion of the pulse travelling in the backward direction leaks through the AOM
during the ON state with 120ns gating width. The reflected pulse appears to be 98.4ns delayed
from the forward going pulse indicating that the reflection point was likely to be 8m away from
Tap 3. This is likely to be the splice point between the BDO and the output of the power
amplifier caused by the mode field diameter mismatch. As shown in Figure 3.26, the backward
pulse does not look identical to the output pulse. The most probable explanation is that the gain
extracted by the backward pulse is low for the first 60ns due to the forward pulse taking out all
0 50 100 150 200 250 3000
20
40
60
80
100
120
Delay (ns)
Pe
ak
Po
we
r (W
)
0 50 100 150 200 250 3000
10
20
30
40
50
60
70
80
90
100
Delay (ns)
Pe
ak
Po
we
r (W
)
200 300 400 500 6000
2000
4000
6000
8000
10000
12000
14000
16000
Delay (ns)
Pe
ak
Po
we
r (W
)
0.25 mJ
0.50 mJ
0.75 mJ
1.00 mJ
1000 1050 1100-100
-80
-60
-40
-20
Wavelength (nm)
Rela
tive I
nte
nsit
y (
dB
/nm
)
Resolution=1nm
0.25 mJ
0.50 mJ
0.75 mJ
1.00 mJ
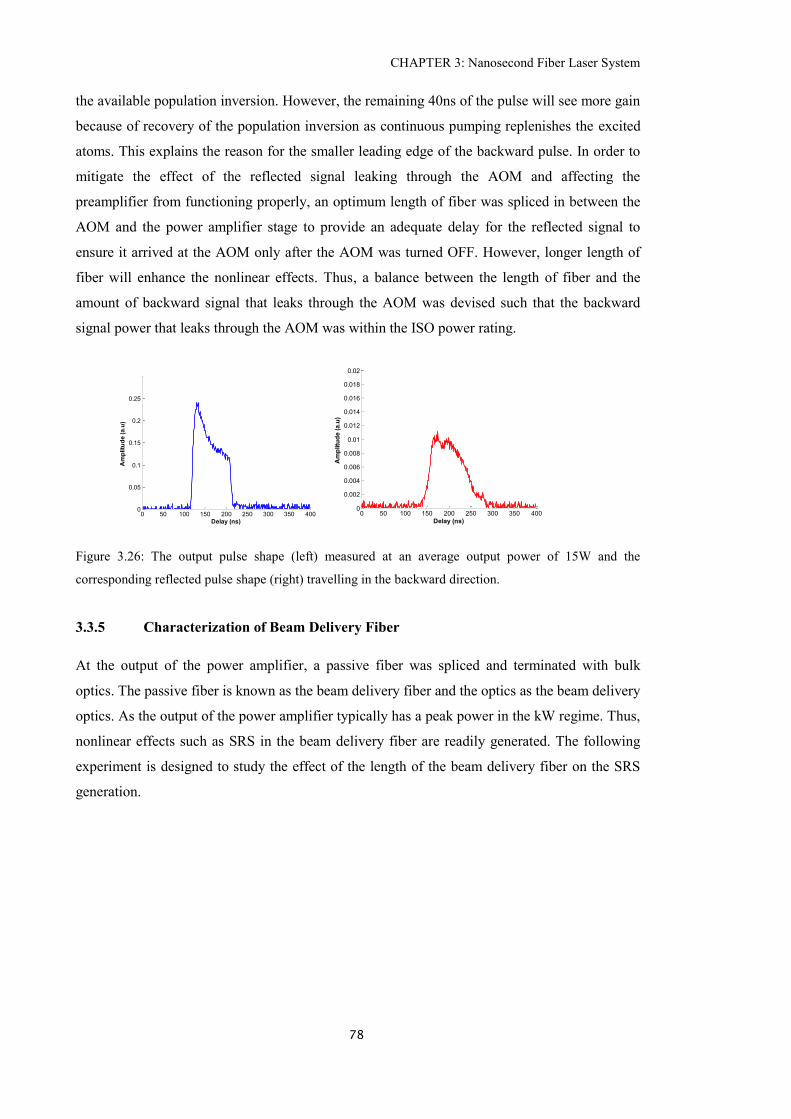
CHAPTER 3: Nanosecond Fiber Laser System
78
the available population inversion. However, the remaining 40ns of the pulse will see more gain
because of recovery of the population inversion as continuous pumping replenishes the excited
atoms. This explains the reason for the smaller leading edge of the backward pulse. In order to
mitigate the effect of the reflected signal leaking through the AOM and affecting the
preamplifier from functioning properly, an optimum length of fiber was spliced in between the
AOM and the power amplifier stage to provide an adequate delay for the reflected signal to
ensure it arrived at the AOM only after the AOM was turned OFF. However, longer length of
fiber will enhance the nonlinear effects. Thus, a balance between the length of fiber and the
amount of backward signal that leaks through the AOM was devised such that the backward
signal power that leaks through the AOM was within the ISO power rating.
Figure 3.26: The output pulse shape (left) measured at an average output power of 15W and the
corresponding reflected pulse shape (right) travelling in the backward direction.
3.3.5 Characterization of Beam Delivery Fiber
At the output of the power amplifier, a passive fiber was spliced and terminated with bulk
optics. The passive fiber is known as the beam delivery fiber and the optics as the beam delivery
optics. As the output of the power amplifier typically has a peak power in the kW regime. Thus,
nonlinear effects such as SRS in the beam delivery fiber are readily generated. The following
experiment is designed to study the effect of the length of the beam delivery fiber on the SRS
generation.
0 50 100 150 200 250 300 350 4000
0.05
0.1
0.15
0.2
0.25
Delay (ns)
Am
plitu
de
(a
.u)
0 50 100 150 200 250 300 350 4000
0.002
0.004
0.006
0.008
0.01
0.012
0.014
0.016
0.018
0.02
Delay (ns)
Am
plitu
de
(a
.u)
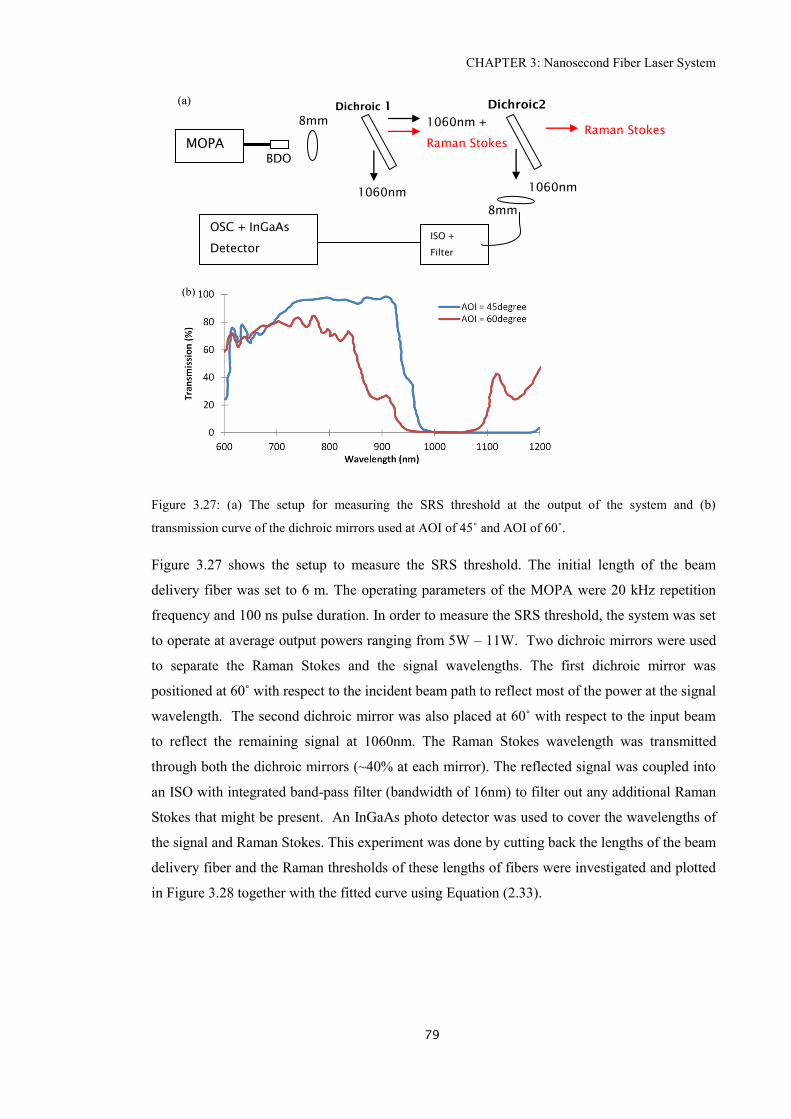
CHAPTER 3: Nanosecond Fiber Laser System
79
Figure 3.27: (a) The setup for measuring the SRS threshold at the output of the system and (b)
transmission curve of the dichroic mirrors used at AOI of 45˚ and AOI of 60˚.
Figure 3.27 shows the setup to measure the SRS threshold. The initial length of the beam
delivery fiber was set to 6 m. The operating parameters of the MOPA were 20 kHz repetition
frequency and 100 ns pulse duration. In order to measure the SRS threshold, the system was set
to operate at average output powers ranging from 5W – 11W. Two dichroic mirrors were used
to separate the Raman Stokes and the signal wavelengths. The first dichroic mirror was
positioned at 60˚ with respect to the incident beam path to reflect most of the power at the signal
wavelength. The second dichroic mirror was also placed at 60˚ with respect to the input beam
to reflect the remaining signal at 1060nm. The Raman Stokes wavelength was transmitted
through both the dichroic mirrors (~40% at each mirror). The reflected signal was coupled into
an ISO with integrated band-pass filter (bandwidth of 16nm) to filter out any additional Raman
Stokes that might be present. An InGaAs photo detector was used to cover the wavelengths of
the signal and Raman Stokes. This experiment was done by cutting back the lengths of the beam
delivery fiber and the Raman thresholds of these lengths of fibers were investigated and plotted
in Figure 3.28 together with the fitted curve using Equation (2.33).
MOPA
ISO +
Filter
OSC + InGaAs
Detector
1060nm +
Raman Stokes
Raman Stokes
1060nm 1060nm
8mm
8mm
Dichroic 1 Dichroic2
BDO
(a)
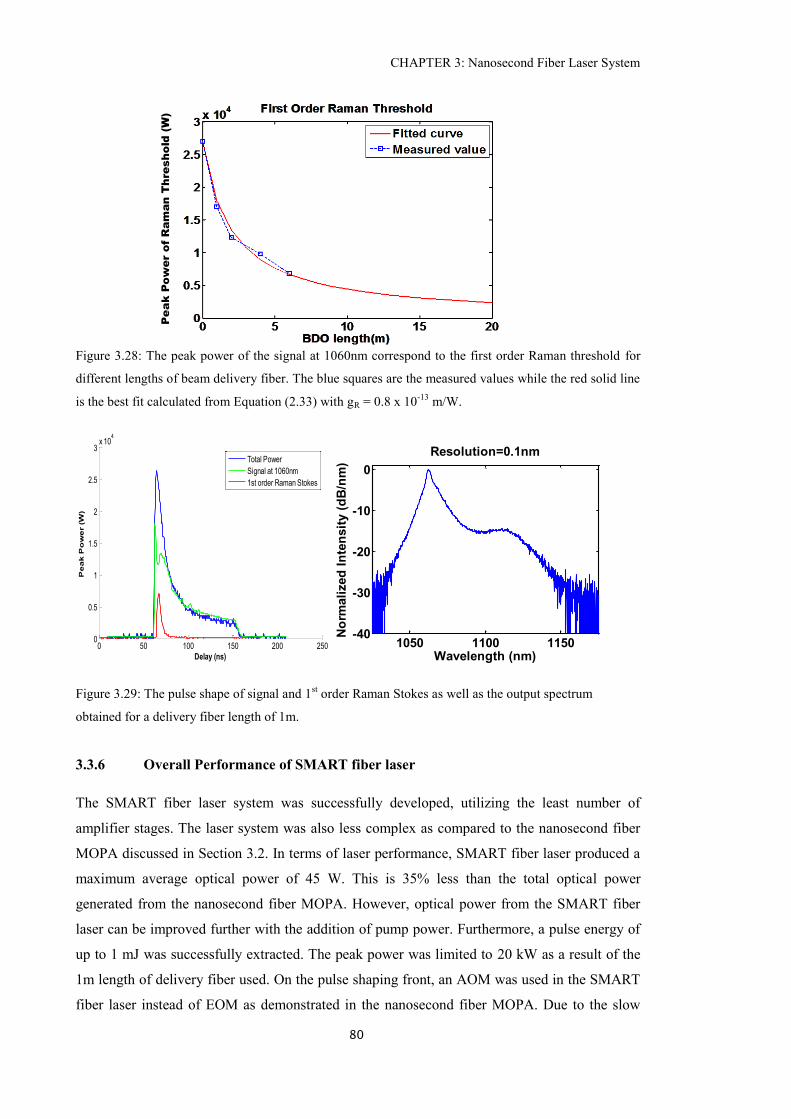
CHAPTER 3: Nanosecond Fiber Laser System
80
Figure 3.28: The peak power of the signal at 1060nm correspond to the first order Raman threshold for
different lengths of beam delivery fiber. The blue squares are the measured values while the red solid line
is the best fit calculated from Equation (2.33) with gR = 0.8 x 10⁻¹³
m/W.
Figure 3.29: The pulse shape of signal and 1st order Raman Stokes as well as the output spectrum
obtained for a delivery fiber length of 1m.
3.3.6 Overall Performance of SMART fiber laser
The SMART fiber laser system was successfully developed, utilizing the least number of
amplifier stages. The laser system was also less complex as compared to the nanosecond fiber
MOPA discussed in Section 3.2. In terms of laser performance, SMART fiber laser produced a
maximum average optical power of 45 W. This is 35% less than the total optical power
generated from the nanosecond fiber MOPA. However, optical power from the SMART fiber
laser can be improved further with the addition of pump power. Furthermore, a pulse energy of
up to 1 mJ was successfully extracted. The peak power was limited to 20 kW as a result of the
1m length of delivery fiber used. On the pulse shaping front, an AOM was used in the SMART
fiber laser instead of EOM as demonstrated in the nanosecond fiber MOPA. Due to the slow
0 50 100 150 200 2500
0.5
1
1.5
2
2.5
3x 10
4
Delay (ns)
Pe
ak
Po
we
r (
W)
Total Power
Signal at 1060nm
1st order Raman Stokes
1050 1100 1150-40
-30
-20
-10
0
Wavelength (nm)
No
rmali
zed
In
ten
sit
y (
dB
/nm
)
Resolution=0.1nm
Pe
ak
P
ow
er o
f R
am
an
T
hresh
old
(W
)
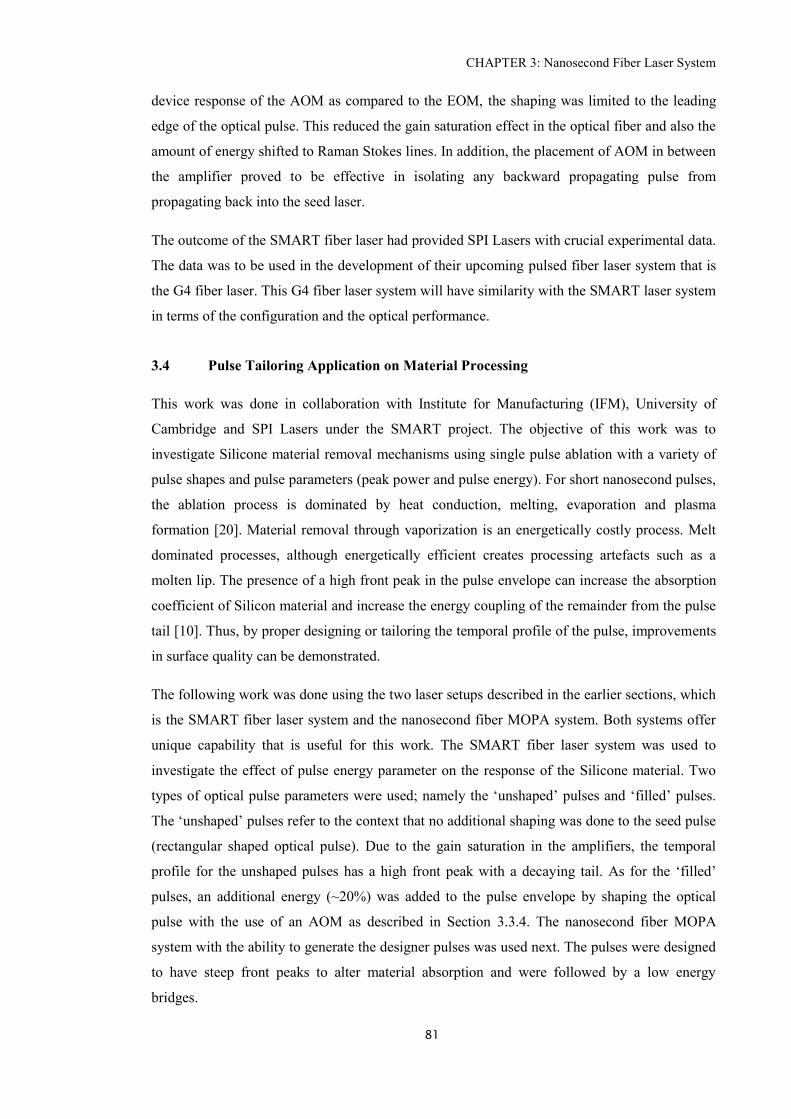
CHAPTER 3: Nanosecond Fiber Laser System
81
device response of the AOM as compared to the EOM, the shaping was limited to the leading
edge of the optical pulse. This reduced the gain saturation effect in the optical fiber and also the
amount of energy shifted to Raman Stokes lines. In addition, the placement of AOM in between
the amplifier proved to be effective in isolating any backward propagating pulse from
propagating back into the seed laser.
The outcome of the SMART fiber laser had provided SPI Lasers with crucial experimental data.
The data was to be used in the development of their upcoming pulsed fiber laser system that is
the G4 fiber laser. This G4 fiber laser system will have similarity with the SMART laser system
in terms of the configuration and the optical performance.
3.4 Pulse Tailoring Application on Material Processing
This work was done in collaboration with Institute for Manufacturing (IFM), University of
Cambridge and SPI Lasers under the SMART project. The objective of this work was to
investigate Silicone material removal mechanisms using single pulse ablation with a variety of
pulse shapes and pulse parameters (peak power and pulse energy). For short nanosecond pulses,
the ablation process is dominated by heat conduction, melting, evaporation and plasma
formation [20]. Material removal through vaporization is an energetically costly process. Melt
dominated processes, although energetically efficient creates processing artefacts such as a
molten lip. The presence of a high front peak in the pulse envelope can increase the absorption
coefficient of Silicon material and increase the energy coupling of the remainder from the pulse
tail [10]. Thus, by proper designing or tailoring the temporal profile of the pulse, improvements
in surface quality can be demonstrated.
The following work was done using the two laser setups described in the earlier sections, which
is the SMART fiber laser system and the nanosecond fiber MOPA system. Both systems offer
unique capability that is useful for this work. The SMART fiber laser system was used to
investigate the effect of pulse energy parameter on the response of the Silicone material. Two
types of optical pulse parameters were used; namely the ‘unshaped’ pulses and ‘filled’ pulses.
The ‘unshaped’ pulses refer to the context that no additional shaping was done to the seed pulse
(rectangular shaped optical pulse). Due to the gain saturation in the amplifiers, the temporal
profile for the unshaped pulses has a high front peak with a decaying tail. As for the ‘filled’
pulses, an additional energy (~20%) was added to the pulse envelope by shaping the optical
pulse with the use of an AOM as described in Section 3.3.4. The nanosecond fiber MOPA
system with the ability to generate the designer pulses was used next. The pulses were designed
to have steep front peaks to alter material absorption and were followed by a low energy
bridges.
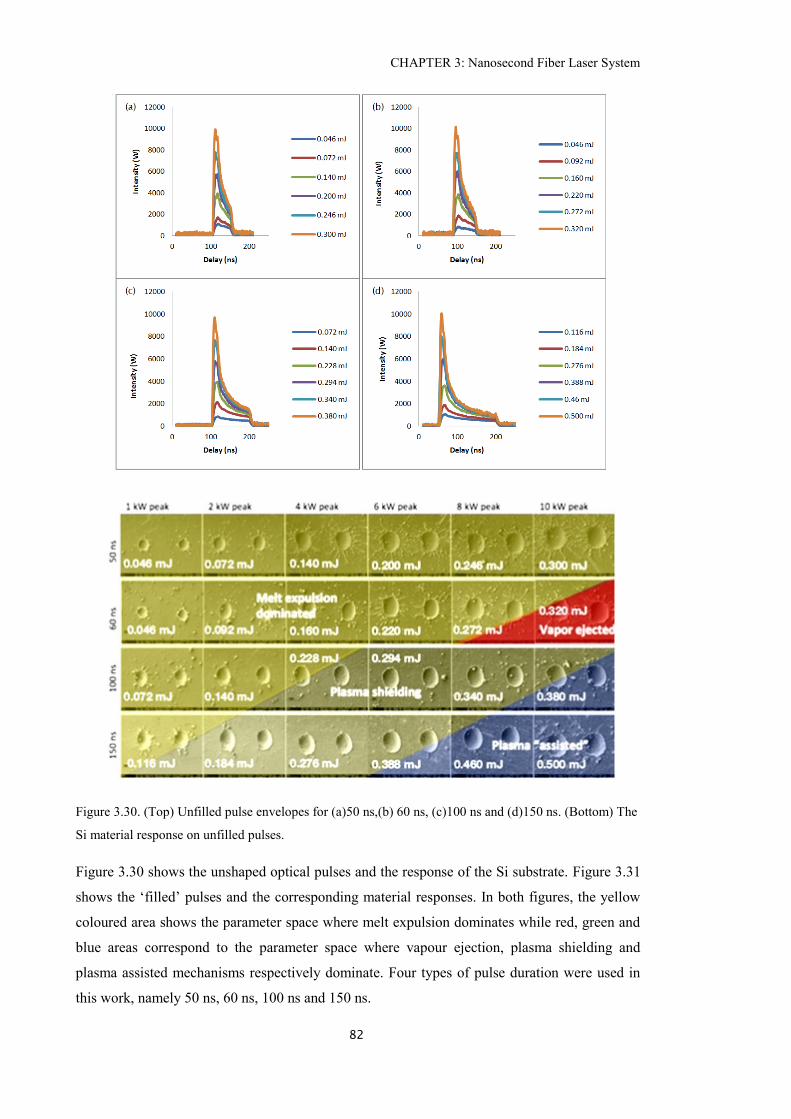
CHAPTER 3: Nanosecond Fiber Laser System
82
Figure 3.30. (Top) Unfilled pulse envelopes for (a)50 ns,(b) 60 ns, (c)100 ns and (d)150 ns. (Bottom) The
Si material response on unfilled pulses.
Figure 3.30 shows the unshaped optical pulses and the response of the Si substrate. Figure 3.31
shows the ‘filled’ pulses and the corresponding material responses. In both figures, the yellow
coloured area shows the parameter space where melt expulsion dominates while red, green and
blue areas correspond to the parameter space where vapour ejection, plasma shielding and
plasma assisted mechanisms respectively dominate. Four types of pulse duration were used in
this work, namely 50 ns, 60 ns, 100 ns and 150 ns.
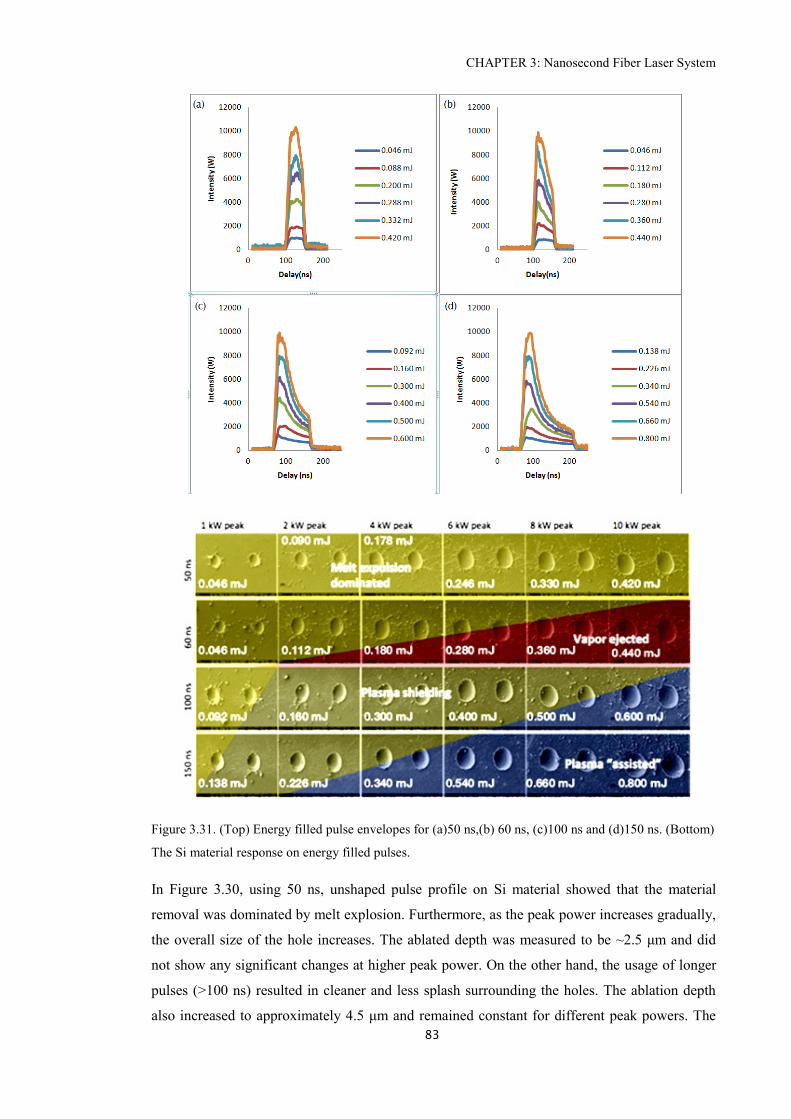
CHAPTER 3: Nanosecond Fiber Laser System
83
Figure 3.31. (Top) Energy filled pulse envelopes for (a)50 ns,(b) 60 ns, (c)100 ns and (d)150 ns. (Bottom)
The Si material response on energy filled pulses.
In Figure 3.30, using 50 ns, unshaped pulse profile on Si material showed that the material
removal was dominated by melt explosion. Furthermore, as the peak power increases gradually,
the overall size of the hole increases. The ablated depth was measured to be ~2.5 μm and did
not show any significant changes at higher peak power. On the other hand, the usage of longer
pulses (>100 ns) resulted in cleaner and less splash surrounding the holes. The ablation depth
also increased to approximately 4.5 μm and remained constant for different peak powers. The
CHAPTER 3: Nanosecond Fiber Laser System
84
extension of the pulse duration resulted in an increase in fluence on the material. The energy
contained in the tail of the long pulse helps further vaporisation and ejection of molten
materials. Furthermore, formation of plasma combined with a high peak power increased the
hole diameter instead of the hole depth.
Using the filled pulses, no significant depth advantage were obtained as no changes in ablated
depth with 50 ns and 100 ns filled pulses. The added energy purely contributes to replacing the
melting dominated regime with plasma/vapour assisted regime.
Figure 3.32. Si material response with tailored pulses having different peaks and tails power levels.
Figure 3.32 shows the design of the pulses and the material response. The tailored pulses have a
high front peak (~25ns) for affecting the material absorption and are followed by a long energy
tail of constant instantaneous power: 300 W, 600 W and 1 kW. The total pulse duration is 200
ns. A maximum hole depth of 8 μm was measured using tailored pulse with 10 kW peak power
and with a 600 W tail. However, with 300 W tail, pulse with a 2 kW peak achieved higher
penetration depth of 5.7 μm through a melt displacement mechanism with 70 μJ pulse energy.
Pulses with 6 kW and 10 kW front peaks achieved a depth of 5 μm and 3.9 μm for 106 μJ and
220 μJ energy respectively. In 6 kW case, the extra energy was used to melt subsequent layers
while for the10 kW case, the material was initially removed through a limited vaporization
process followed by the remainder of the pulse coupled to the already molten material and
created the crater depth through melt displacement.
CHAPTER 3: Nanosecond Fiber Laser System
85
Silicon responds better to optical pulses with steep front peaks and very low energy bridges as
compared to unshaped and filled optical pulses. The designer pulses show a more controlled
material response. Furthermore, by comparing the comparable pulse energies for traditional
pulse envelopes and designer pulses, it shows that with the use of correct temporal envelope, the
quality and material removal rates can be improved further.
3.5 Conclusion
In this chapter two nanosecond fiber MOPAs with slightly different configurations were
demonstrated. The first setup was an improved version of the nanosecond MOPA reported
earlier [6]. With a maximum average output power of over 70 W and close to 1 mJ of pulse
energy, this fiber MOPA system produces a diffraction limited output beam. The use of an
AWG with higher bandwidth allows a higher resolution step size and steeper rise/fall time of
the optical pulses. Tailored temporal profiles can be done with higher precision and the laser
represents an attractive system for investigating the dynamics of material processing.
The second system is SMART fiber laser system which was built in collaboration with SPI
Lasers. The system is capable of producing up to 45W of average output power. Pulse energy
up to 1.0mJ can be extracted by shaping optical pulse using an AOM before the power
amplifier. The output beam quality (M2) was measured to be 1.1, close to diffraction limited.
The SRS limited maximum pulse peak power was measured to be 18kW for 1.3 m of beam
delivery fiber. The minimum pulse width is limited to 30ns due to the slow response of the
diode driver. The output peak power may be improved further by increasing the Raman
threshold through the use of a suitable filter to suppress Raman Stokes generated in the
preamplifier seeding into the power amplifier and by reducing the length of the beam delivery
fiber.
For the first time I have shown the feasibility of using an AOM to pre-shape the optical pulse so
as to control the output peak power irrespective of pulse energy. Unlike an EOM which allows
the entire optical pulse to be manipulated as necessary, pulse shaping with an AOM only allows
shaping at the leading edge of the optical pulse due to its slow rise and fall times. Nevertheless,
it is effective in controlling the peak power and thus can help limit the nonlinear effects within
the fiber amplifier. The effectiveness of using an AOM as a pulse shaper in a fiber MOPA
system was recently reported by Malinowski et al [21].
The capabilities of both systems were demonstrated for Silicon processing. Using the SMART
system, the impact of additional energy contained in optical pulses on the ablation efficiency
and quality was investigated. No significant improvement in ablation depth with higher energy
pulse was observed and any added energy merely shifted the melting process to a vaporization

CHAPTER 3: Nanosecond Fiber Laser System
86
process. On the other hand, when the nanosecond fiber MOPA system was used to produce
tailored pulses with a sharp initial peak followed by a long tail, material removal rates were
shown to be substantially increased.
CHAPTER 3: Nanosecond Fiber Laser System
87
3.6 References
1. D. A. Belforte, "2012 Annual Economic Review and Forecast: Status-quo for 2013,"
(2013), http://www.industrial-lasers.com/articles/print/volume-28/issue-
1/features/2012-annual-economic-review-and-forecast.html.
2. S. Nikumb, Q. Chen, C. Li, H. Reshef, H. Y. Zheng, H. Qiu, and D. Low, "Precision
glass machining, drilling and profile cutting by short pulse lasers," Thin Solid Films
477, 216-221 (2005).
3. C. X. Wang, G. Y. Wang, A. V. Hicks, D. R. Dudley, H. Y. Pang, and N. Hodgson,
"High-power Q-switched TEM00 mode diode-pumped solid state lasers with >30W
output power at 355nm," (2006), pp. 610019-610019-610014.
4. J. Bovatsek, and R. S. Patel, "HIGH-POWER, NANOSECOND-PULSE Q-SWITCH
LASER TECHNOLOGY WITH FLATTOP BEAM-SHAPING TECHNIQUE FOR
EFFICIENT INDUSTRIAL LASER PROCESSING."
5. B. Morasse, S. Chatigny, É. Gagnon, J.-P. de Sandro, and C. Desrosiers, "Enhanced
pulseshaping capabilities and reduction of non-linear effects in all-fiber MOPA pulsed
system," (2009), pp. 71951D-71951D-71912.
6. A. Malinowski, K. T. Vu, K. K. Chen, J. Nilsson, Y. Jeong, S. Alam, D. Lin, and D. J.
Richardson, "High power pulsed fiber MOPA system incorporating electro-optic
modulator based adaptive pulse shaping," Opt. Express 17, 20927-20937 (2009).
7. B. N. Chichkov, C. Momma, S. Nolte, F. von Alvensleben, and A. Tünnermann,
"Femtosecond, picosecond and nanosecond laser ablation of solids," Appl. Phys. A 63,
109-115 (1996).
8. K. Sokolowski-Tinten, J. Bialkowski, A. Cavalleri, D. von der Linde, A. Oparin, J.
Meyer-ter-Vehn, and S. I. Anisimov, "Transient States of Matter during Short Pulse
Laser Ablation," Physical Review Letters 81, 224-227 (1998).
9. X. Zeng, X. L. Mao, R. Greif, and R. E. Russo, "Experimental investigation of ablation
efficiency and plasma expansion during femtosecond and nanosecond laser ablation of
silicon," Appl. Phys. A 80, 237-241 (2005).
10. Q. Lu, S. S. Mao, X. Mao, and R. E. Russo, "Delayed phase explosion during high-
power nanosecond laser ablation of silicon," Applied Physics Letters 80, 3072-3074
(2002).
11. W. O'Neill, and L. Kun, "High-Quality Micromachining of Silicon at 1064 nm Using a
High-Brightness MOPA-Based 20-W Yb Fiber Laser," Selected Topics in Quantum
Electronics, IEEE Journal of 15, 462-470 (2009).
12. S. Hendow, E. Rea, N. Kosa, M. Bengtsson, and S. Shakir, "Bursting for enhanced
ablation of materials," (2014), pp. 896110-896110-896111.
CHAPTER 3: Nanosecond Fiber Laser System
88
13. Y. Sintov, O. Katz, Y. Glick, S. Acco, Y. Nafcha, A. Englander, and R. Lavi,
"Extractable energy from ytterbium-doped high-energy pulsed fiber amplifiers and
lasers," J. Opt. Soc. Am. B 23, 218-230 (2006).
14. A. E. Siegman, Lasers (Oxford University Press, 1986).
15. Y. Wang, "Optimization of Pulse Amplification in Ytterbium-Doped Double-Clad Fiber
Amplifiers," J. Lightwave Technol. 23, 2139 (2005).
16. H. L. Offerhaus, N. G. Broderick, D. J. Richardson, R. Sammut, J. Caplen, and L.
Dong, "High-energy single-transverse-mode Q-switched fiber laser based on a
multimode large-mode-area erbium-doped fiber," Optics Letters 23, 1683-1685 (1998).
17. J. Limpert, S. Höfer, A. Liem, H. Zellmer, A. Tünnermann, S. Knoke, and H. Voelckel,
"100-W average-power, high-energy nanosecond fiber amplifier," Appl. Phys. B 75,
477-479 (2002).
18. K. T. Vu, A. Malinowski, D. J. Richardson, F. Ghiringhelli, L. M. B. Hickey, and M. N.
Zervas, "Adaptive pulse shape control in a diode-seeded nanosecond fiber MOPA
system," Opt. Express 14, 10996-11001 (2006).
19. H. L. O. C.C.Renaud, J.A.Alvarez-Chavez, J.Nilsson, W.A.Clarkson, P.W.Turner,
D.J.Richardson, A.B.Grudini, "Characteristics of Q-switched cladding pumped
ytterbium doped fiber lasers with different high energy fiber designs," IEEE Journal of
Quantum Electronics, Vol.37, pp. 199 - 206 (2001).
20. K.-H. Leitz, B. Redlingshöfer, Y. Reg, A. Otto, and M. Schmidt, "Metal Ablation with
Short and Ultrashort Laser Pulses," Physics Procedia 12, Part B, 230-238 (2011).
21. A. Malinowski, P. Gorman, C. A. Codemard, F. Ghiringhelli, A. J. Boyland, A.
Marshall, M. N. Zervas, and M. K. Durkin, "High-peak-power, high-energy, high-
average-power pulsed fiber laser system with versatile pulse duration and shape,"
Optics Letters 38, 4686-4689 (2013).
CHAPTER 4: Raman Fiber Laser in Visible and Near Infrared Regions
89
Chapter 4. Raman Fiber Laser in Visible and Near
Infrared Regions
This chapter explores the generation of tunable Raman fiber laser using nanosecond fiber
MOPA as a pump source. Generation of selective Raman Stokes will be demonstrated with the
use of rectangular shaped profile pump pulses. In addition, a multi-step pump pulse profile will
be used to demonstrate simultaneous excitation of multiple Raman Stokes. Further improvement
on the Raman fiber laser will be explored including wavelength tunability and conversion
efficiency.
4.1 Introduction
Light sources operating between 500 nm and 700 nm are useful for medical and spectroscopic
applications. For example in medical application, the conventional method is to use different
types of lasers to access different wavelength regions of interest namely the argon laser (400 nm
– 500 nm), HeNe laser (630 nm) and semiconductor based laser for various laser therapies and
treatments [1-3]. Besides that, laser based spectroscopy has becoming an important method for
chemical and biological analysis. Laser Induced Breakdown Spectroscopy (LIBS) for example
depends on the wavelength of the laser beam and its intensity [4].
Currently, there are a few methods to generate optical signals in the visible region, namely
supercontinuum (SC) generation, frequency conversion through parametric process and
frequency doubling. In the case of SC based sources which can span over two octaves, a major
portion of the output beam falls outside the visible region and will have to be filtered out.
Moreover, the spectral power density of a SC source is usually low and may not be sufficient for
some applications. Since the wavelength of the frequency doubled source is defined by the
pump wavelength, such sources are not very useful for many applications. In a parametric
process such as OPO, the output wavelength is tunable and has been demonstrated recently to
tune over the wavelength between 700 nm and 900 nm [5, 6]. However, the downside of this
technique is the complexity of the setup which consists of mainly free space optics and requires
regular, delicate adjustments.
Fiber Raman lasers on the other hand, have attracted huge interest in recent years because they
allow the generation of light across a wide range of wavelengths, which is not possible to
achieve with rare-earth doped fiber lasers [7]. SRS is the key mechanism that enables an optical
fiber to generate any wavelength subject to the pumping wavelength and the fiber transparency
range [8, 9]. The cascading nature of SRS also allows the first-Stokes wavelength to be shifted
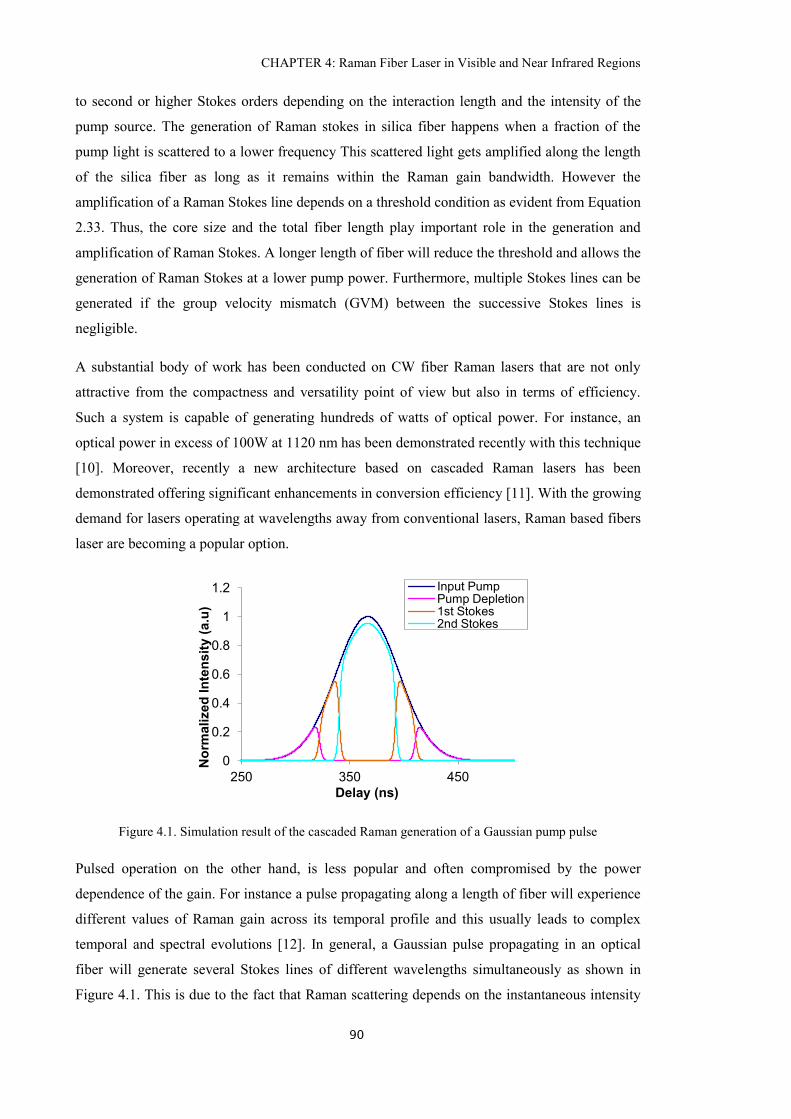
CHAPTER 4: Raman Fiber Laser in Visible and Near Infrared Regions
90
to second or higher Stokes orders depending on the interaction length and the intensity of the
pump source. The generation of Raman stokes in silica fiber happens when a fraction of the
pump light is scattered to a lower frequency This scattered light gets amplified along the length
of the silica fiber as long as it remains within the Raman gain bandwidth. However the
amplification of a Raman Stokes line depends on a threshold condition as evident from Equation
2.33. Thus, the core size and the total fiber length play important role in the generation and
amplification of Raman Stokes. A longer length of fiber will reduce the threshold and allows the
generation of Raman Stokes at a lower pump power. Furthermore, multiple Stokes lines can be
generated if the group velocity mismatch (GVM) between the successive Stokes lines is
negligible.
A substantial body of work has been conducted on CW fiber Raman lasers that are not only
attractive from the compactness and versatility point of view but also in terms of efficiency.
Such a system is capable of generating hundreds of watts of optical power. For instance, an
optical power in excess of 100W at 1120 nm has been demonstrated recently with this technique
[10]. Moreover, recently a new architecture based on cascaded Raman lasers has been
demonstrated offering significant enhancements in conversion efficiency [11]. With the growing
demand for lasers operating at wavelengths away from conventional lasers, Raman based fibers
laser are becoming a popular option.
Figure 4.1. Simulation result of the cascaded Raman generation of a Gaussian pump pulse
Pulsed operation on the other hand, is less popular and often compromised by the power
dependence of the gain. For instance a pulse propagating along a length of fiber will experience
different values of Raman gain across its temporal profile and this usually leads to complex
temporal and spectral evolutions [12]. In general, a Gaussian pulse propagating in an optical
fiber will generate several Stokes lines of different wavelengths simultaneously as shown in
Figure 4.1. This is due to the fact that Raman scattering depends on the instantaneous intensity
0
0.2
0.4
0.6
0.8
1
1.2
250 350 450
No
rmalized
In
ten
sit
y (
a.u
)
Delay (ns)
Input Pump Pump Depletion 1st Stokes 2nd Stokes
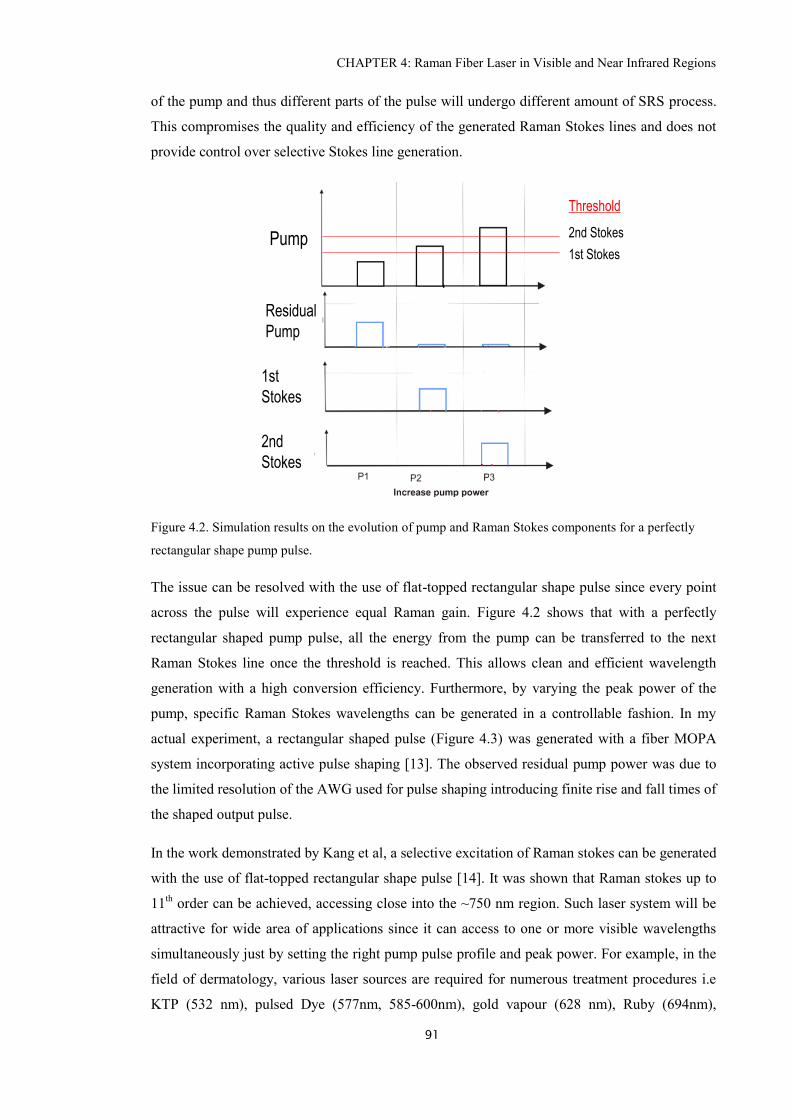
CHAPTER 4: Raman Fiber Laser in Visible and Near Infrared Regions
91
of the pump and thus different parts of the pulse will undergo different amount of SRS process.
This compromises the quality and efficiency of the generated Raman Stokes lines and does not
provide control over selective Stokes line generation.
Figure 4.2. Simulation results on the evolution of pump and Raman Stokes components for a perfectly
rectangular shape pump pulse.
The issue can be resolved with the use of flat-topped rectangular shape pulse since every point
across the pulse will experience equal Raman gain. Figure 4.2 shows that with a perfectly
rectangular shaped pump pulse, all the energy from the pump can be transferred to the next
Raman Stokes line once the threshold is reached. This allows clean and efficient wavelength
generation with a high conversion efficiency. Furthermore, by varying the peak power of the
pump, specific Raman Stokes wavelengths can be generated in a controllable fashion. In my
actual experiment, a rectangular shaped pulse (Figure 4.3) was generated with a fiber MOPA
system incorporating active pulse shaping [13]. The observed residual pump power was due to
the limited resolution of the AWG used for pulse shaping introducing finite rise and fall times of
the shaped output pulse.
In the work demonstrated by Kang et al, a selective excitation of Raman stokes can be generated
with the use of flat-topped rectangular shape pulse [14]. It was shown that Raman stokes up to
11th order can be achieved, accessing close into the ~750 nm region. Such laser system will be
attractive for wide area of applications since it can access to one or more visible wavelengths
simultaneously just by setting the right pump pulse profile and peak power. For example, in the
field of dermatology, various laser sources are required for numerous treatment procedures i.e
KTP (532 nm), pulsed Dye (577nm, 585-600nm), gold vapour (628 nm), Ruby (694nm),
2nd Stokes
1st Stokes
Threshold
Pump
Residual
Pump
1st
Stokes
2nd
Stokes
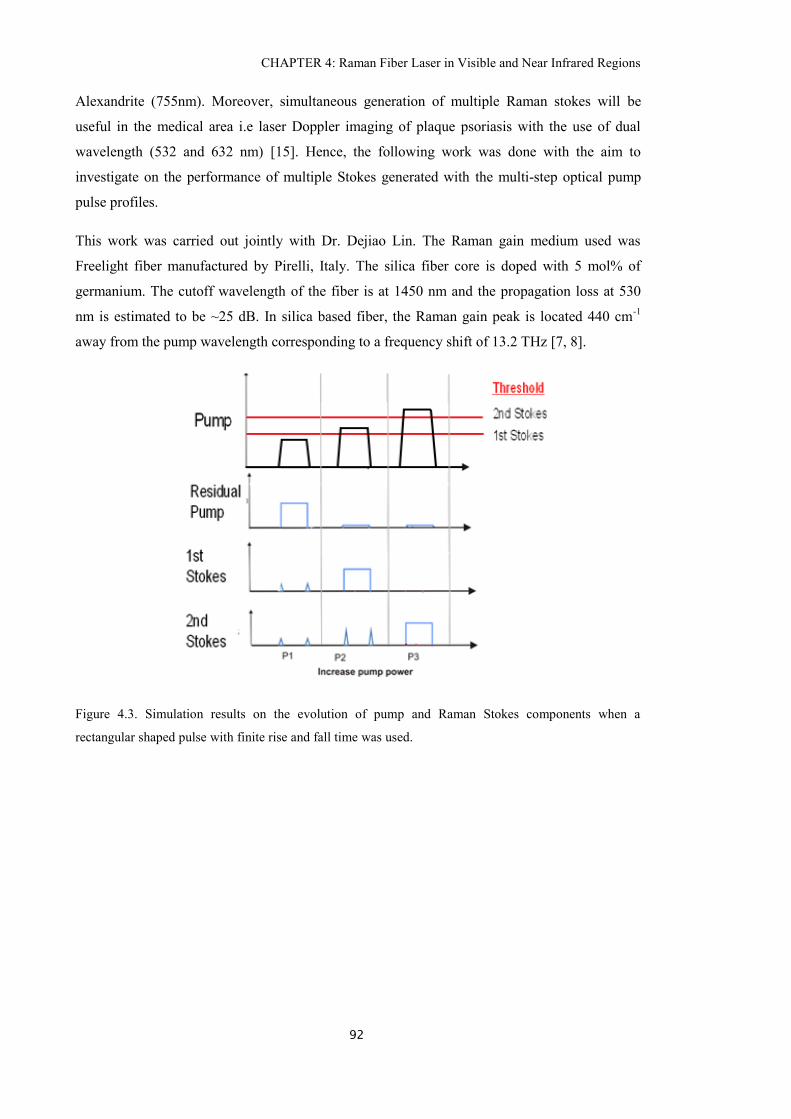
CHAPTER 4: Raman Fiber Laser in Visible and Near Infrared Regions
92
Alexandrite (755nm). Moreover, simultaneous generation of multiple Raman stokes will be
useful in the medical area i.e laser Doppler imaging of plaque psoriasis with the use of dual
wavelength (532 and 632 nm) [15]. Hence, the following work was done with the aim to
investigate on the performance of multiple Stokes generated with the multi-step optical pump
pulse profiles.
This work was carried out jointly with Dr. Dejiao Lin. The Raman gain medium used was
Freelight fiber manufactured by Pirelli, Italy. The silica fiber core is doped with 5 mol% of
germanium. The cutoff wavelength of the fiber is at 1450 nm and the propagation loss at 530
nm is estimated to be ~25 dB. In silica based fiber, the Raman gain peak is located 440 cm-1
away from the pump wavelength corresponding to a frequency shift of 13.2 THz [7, 8].
Figure 4.3. Simulation results on the evolution of pump and Raman Stokes components when a
rectangular shaped pulse with finite rise and fall time was used.
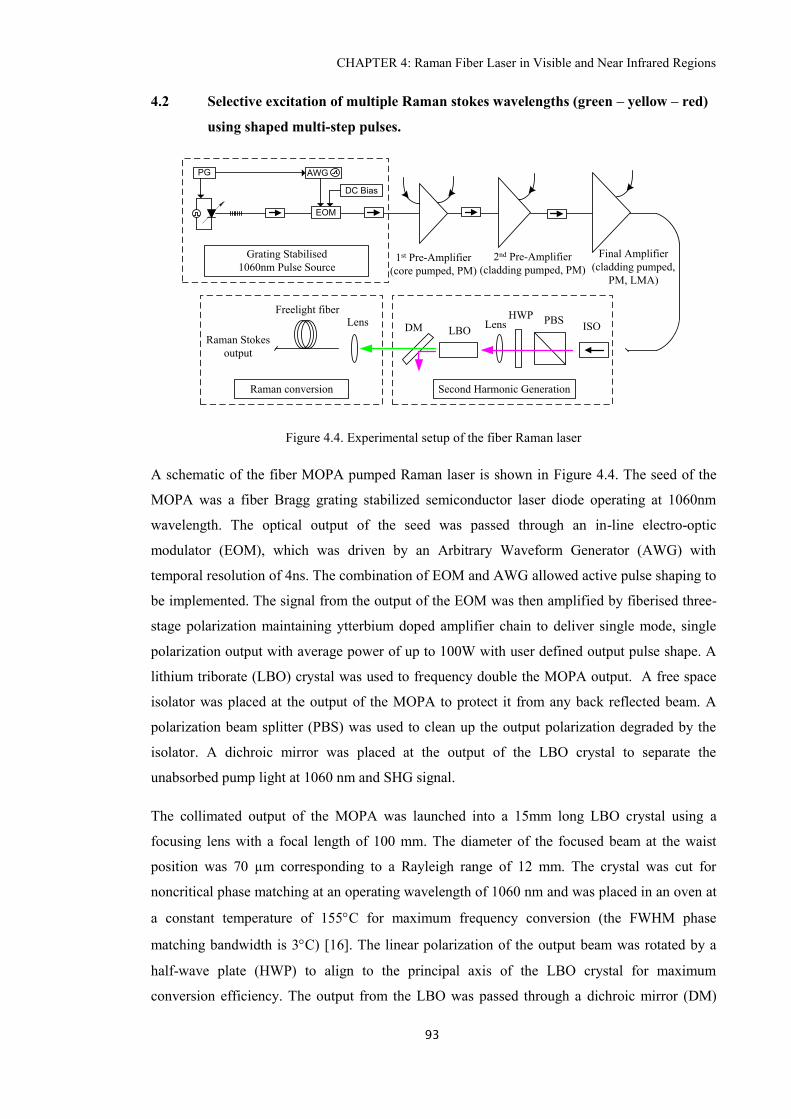
CHAPTER 4: Raman Fiber Laser in Visible and Near Infrared Regions
93
4.2 Selective excitation of multiple Raman stokes wavelengths (green – yellow – red)
using shaped multi-step pulses.
1st Pre-Amplifier
(core pumped, PM)
PG AWG
DC Bias
EOM
Grating Stabilised
1060nm Pulse Source2nd Pre-Amplifier
(cladding pumped, PM)
Final Amplifier
(cladding pumped,
PM, LMA)
ISOPBS
HWP
LBODM
Second Harmonic Generation
Lens
Raman conversion
Raman Stokes
output
Freelight fiberLens
Figure 4.4. Experimental setup of the fiber Raman laser
A schematic of the fiber MOPA pumped Raman laser is shown in Figure 4.4. The seed of the
MOPA was a fiber Bragg grating stabilized semiconductor laser diode operating at 1060nm
wavelength. The optical output of the seed was passed through an in-line electro-optic
modulator (EOM), which was driven by an Arbitrary Waveform Generator (AWG) with
temporal resolution of 4ns. The combination of EOM and AWG allowed active pulse shaping to
be implemented. The signal from the output of the EOM was then amplified by fiberised three-
stage polarization maintaining ytterbium doped amplifier chain to deliver single mode, single
polarization output with average power of up to 100W with user defined output pulse shape. A
lithium triborate (LBO) crystal was used to frequency double the MOPA output. A free space
isolator was placed at the output of the MOPA to protect it from any back reflected beam. A
polarization beam splitter (PBS) was used to clean up the output polarization degraded by the
isolator. A dichroic mirror was placed at the output of the LBO crystal to separate the
unabsorbed pump light at 1060 nm and SHG signal.
The collimated output of the MOPA was launched into a 15mm long LBO crystal using a
focusing lens with a focal length of 100 mm. The diameter of the focused beam at the waist
position was 70 µm corresponding to a Rayleigh range of 12 mm. The crystal was cut for
noncritical phase matching at an operating wavelength of 1060 nm and was placed in an oven at
a constant temperature of 155C for maximum frequency conversion (the FWHM phase
matching bandwidth is 3C) [16]. The linear polarization of the output beam was rotated by a
half-wave plate (HWP) to align to the principal axis of the LBO crystal for maximum
conversion efficiency. The output from the LBO was passed through a dichroic mirror (DM)
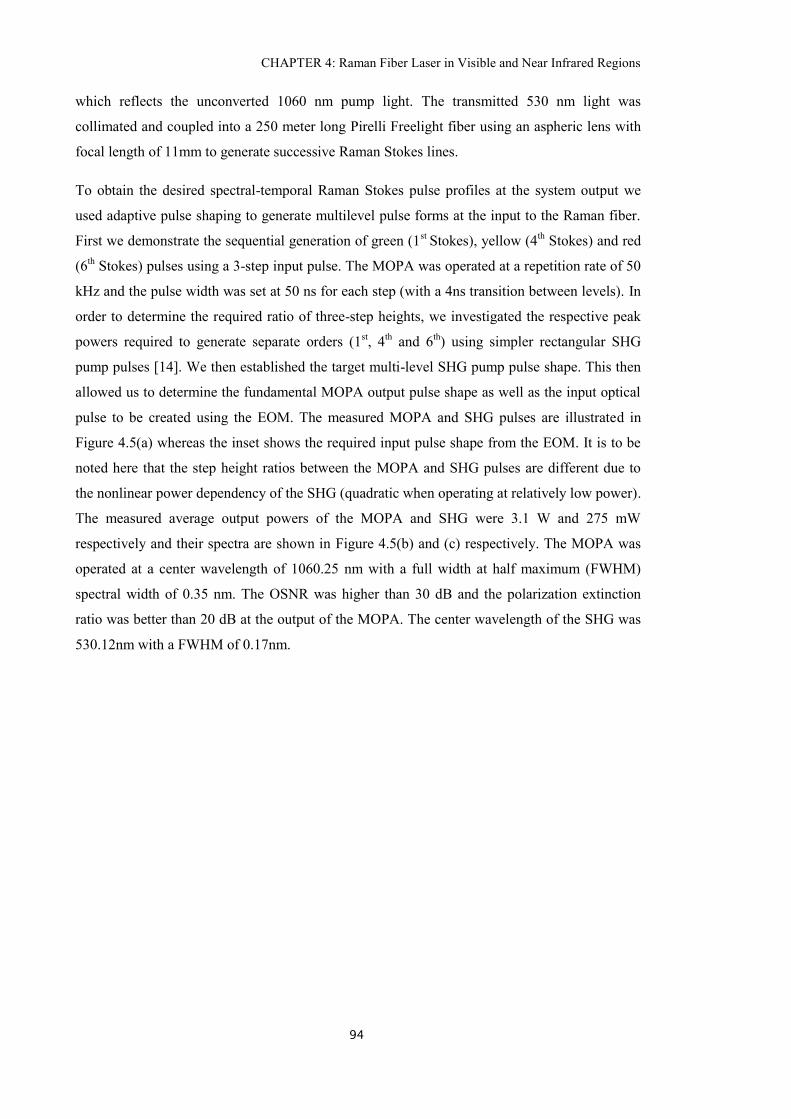
CHAPTER 4: Raman Fiber Laser in Visible and Near Infrared Regions
94
which reflects the unconverted 1060 nm pump light. The transmitted 530 nm light was
collimated and coupled into a 250 meter long Pirelli Freelight fiber using an aspheric lens with
focal length of 11mm to generate successive Raman Stokes lines.
To obtain the desired spectral-temporal Raman Stokes pulse profiles at the system output we
used adaptive pulse shaping to generate multilevel pulse forms at the input to the Raman fiber.
First we demonstrate the sequential generation of green (1st
Stokes), yellow (4th Stokes) and red
(6th Stokes) pulses using a 3-step input pulse. The MOPA was operated at a repetition rate of 50
kHz and the pulse width was set at 50 ns for each step (with a 4ns transition between levels). In
order to determine the required ratio of three-step heights, we investigated the respective peak
powers required to generate separate orders (1st, 4
th and 6
th) using simpler rectangular SHG
pump pulses [14]. We then established the target multi-level SHG pump pulse shape. This then
allowed us to determine the fundamental MOPA output pulse shape as well as the input optical
pulse to be created using the EOM. The measured MOPA and SHG pulses are illustrated in
Figure 4.5(a) whereas the inset shows the required input pulse shape from the EOM. It is to be
noted here that the step height ratios between the MOPA and SHG pulses are different due to
the nonlinear power dependency of the SHG (quadratic when operating at relatively low power).
The measured average output powers of the MOPA and SHG were 3.1 W and 275 mW
respectively and their spectra are shown in Figure 4.5(b) and (c) respectively. The MOPA was
operated at a center wavelength of 1060.25 nm with a full width at half maximum (FWHM)
spectral width of 0.35 nm. The OSNR was higher than 30 dB and the polarization extinction
ratio was better than 20 dB at the output of the MOPA. The center wavelength of the SHG was
530.12nm with a FWHM of 0.17nm.
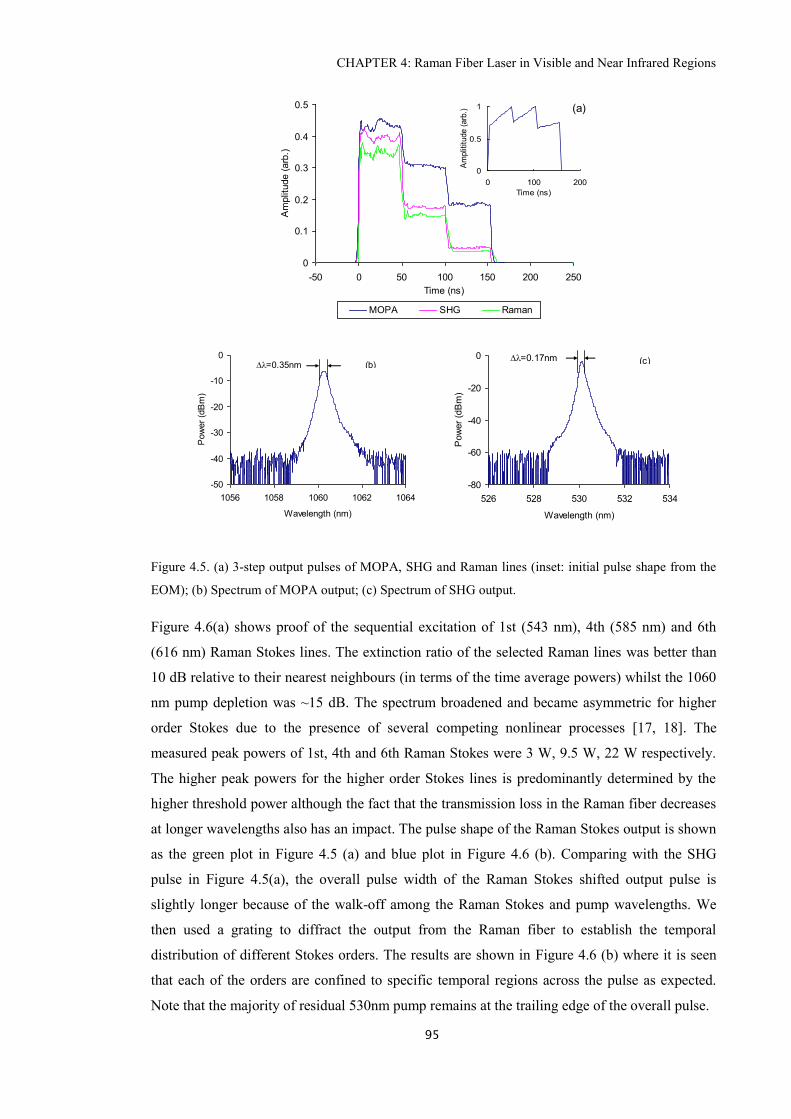
CHAPTER 4: Raman Fiber Laser in Visible and Near Infrared Regions
95
Figure 4.5. (a) 3-step output pulses of MOPA, SHG and Raman lines (inset: initial pulse shape from the
EOM); (b) Spectrum of MOPA output; (c) Spectrum of SHG output.
Figure 4.6(a) shows proof of the sequential excitation of 1st (543 nm), 4th (585 nm) and 6th
(616 nm) Raman Stokes lines. The extinction ratio of the selected Raman lines was better than
10 dB relative to their nearest neighbours (in terms of the time average powers) whilst the 1060
nm pump depletion was ~15 dB. The spectrum broadened and became asymmetric for higher
order Stokes due to the presence of several competing nonlinear processes [17, 18]. The
measured peak powers of 1st, 4th and 6th Raman Stokes were 3 W, 9.5 W, 22 W respectively.
The higher peak powers for the higher order Stokes lines is predominantly determined by the
higher threshold power although the fact that the transmission loss in the Raman fiber decreases
at longer wavelengths also has an impact. The pulse shape of the Raman Stokes output is shown
as the green plot in Figure 4.5 (a) and blue plot in Figure 4.6 (b). Comparing with the SHG
pulse in Figure 4.5(a), the overall pulse width of the Raman Stokes shifted output pulse is
slightly longer because of the walk-off among the Raman Stokes and pump wavelengths. We
then used a grating to diffract the output from the Raman fiber to establish the temporal
distribution of different Stokes orders. The results are shown in Figure 4.6 (b) where it is seen
that each of the orders are confined to specific temporal regions across the pulse as expected.
Note that the majority of residual 530nm pump remains at the trailing edge of the overall pulse.
0
0.1
0.2
0.3
0.4
0.5
-50 0 50 100 150 200 250
Time (ns)A
mplit
ude (
arb
.)
MOPA SHG Raman
0
0.5
1
0 100 200
Time (ns)
Am
plit
itude (
arb
.) (a)
-50
-40
-30
-20
-10
0
1056 1058 1060 1062 1064
Wavelength (nm)
Pow
er
(dB
m)
(b)Dl=0.35nm
-80
-60
-40
-20
0
526 528 530 532 534
Wavelength (nm)
Pow
er
(dB
m)
(c)Dl=0.17nm
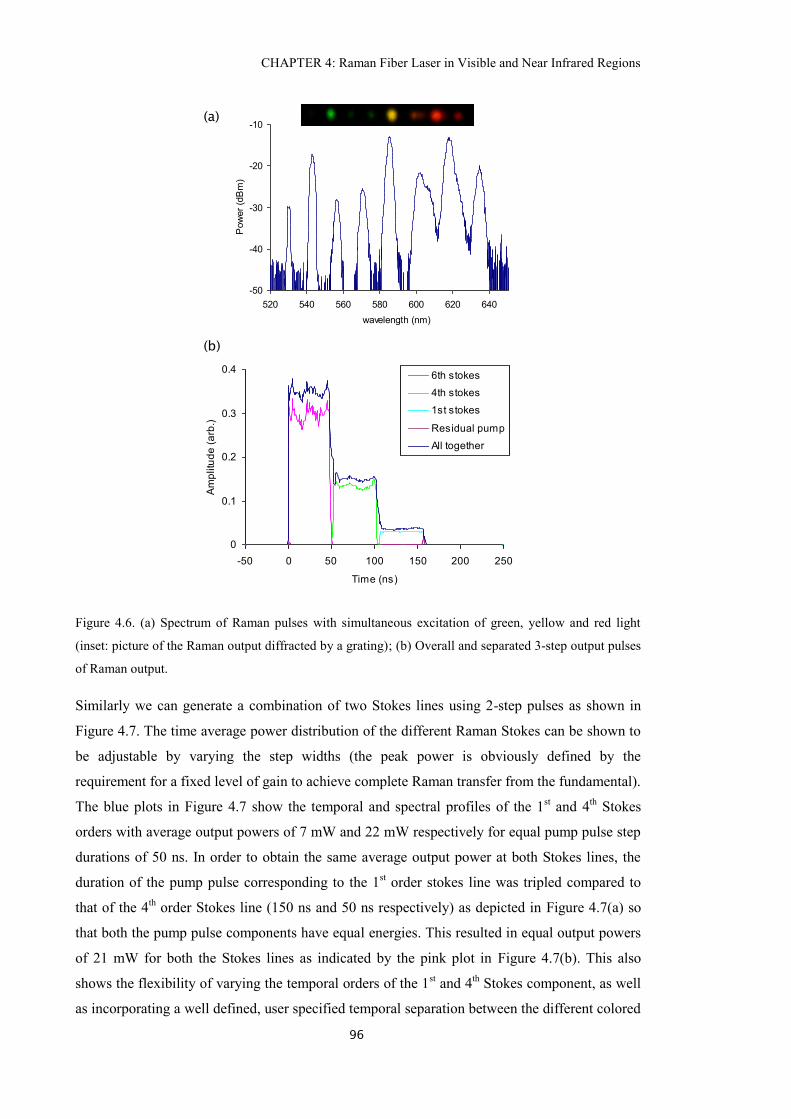
CHAPTER 4: Raman Fiber Laser in Visible and Near Infrared Regions
96
Figure 4.6. (a) Spectrum of Raman pulses with simultaneous excitation of green, yellow and red light
(inset: picture of the Raman output diffracted by a grating); (b) Overall and separated 3-step output pulses
of Raman output.
Similarly we can generate a combination of two Stokes lines using 2-step pulses as shown in
Figure 4.7. The time average power distribution of the different Raman Stokes can be shown to
be adjustable by varying the step widths (the peak power is obviously defined by the
requirement for a fixed level of gain to achieve complete Raman transfer from the fundamental).
The blue plots in Figure 4.7 show the temporal and spectral profiles of the 1st and 4
th Stokes
orders with average output powers of 7 mW and 22 mW respectively for equal pump pulse step
durations of 50 ns. In order to obtain the same average output power at both Stokes lines, the
duration of the pump pulse corresponding to the 1st order stokes line was tripled compared to
that of the 4th order Stokes line (150 ns and 50 ns respectively) as depicted in Figure 4.7(a) so
that both the pump pulse components have equal energies. This resulted in equal output powers
of 21 mW for both the Stokes lines as indicated by the pink plot in Figure 4.7(b). This also
shows the flexibility of varying the temporal orders of the 1st and 4
th Stokes component, as well
as incorporating a well defined, user specified temporal separation between the different colored
-50
-40
-30
-20
-10
520 540 560 580 600 620 640 660
wavelength (nm)
Pow
er
(dB
m)
0
0.1
0.2
0.3
0.4
-50 0 50 100 150 200 250
Time (ns)
Am
plitu
de
(a
rb.)
6th stokes
4th stokes
1st stokes
Residual pump
All together
(a)
(b)
CHAPTER 4: Raman Fiber Laser in Visible and Near Infrared Regions
97
pulses. Given a specified fiber length, changing the ratio of the peak powers (step height)
between the steps, and the order of the step-changes allows the generation of sequences of
colored pulses according to any desired combination of Raman Stokes Shift, providing dynamic
and agile frequency tuning between well-defined wavelengths.
Figure 4.7. (Above) 2-step output pulses of Raman conversion with different pulse energy and
separation; (Below) Spectra of the Raman pulses: exciting green and yellow colours simultaneously
(inset: picture of the Raman output diffracted by a grating).
We have also investigated potential routes for scaling up the Stokes shifted average output
powers. This can be done either by increasing the pulse duration (at fixed pulse repetition rate)
so as to increase the energy per pulse at a given Stokes line, or by shortening the Raman gain
medium at a fixed pulse duration and repetition rate to increase the peak power required to
achieve energy transfer to a given Raman order. Figure 4.8 illustrates an example of scaling
using the later approach where the 1st and 4th order Stokes lines were excited in a 100m length
of Freelight fiber (the output pulse shapes were kept the same as for the 250 m long fiber case).
To obtain the same sequential pattern of excitation of Raman Stokes orders, 284 mW of 532 nm
pump was required for the 100 m long fiber giving a total average Stokes shifted power of 115
mW. This is to be compared with values of 34 mW of output for 116 mW of input when the 250
0
2
4
6
8
10
12
-50 0 50 100 150 200 250
Time (ns)
Peak p
ow
er
(W)
4th Stokes (50ns) + 1st Stokes(50ns) _ no separation
1st Stokes (150ns) + 4th Stokes (50ns) _ separation 8ns
-50
-40
-30
-20
-10
520 540 560 580 600 620
wavelength (nm)
Pow
er
(dB
m)
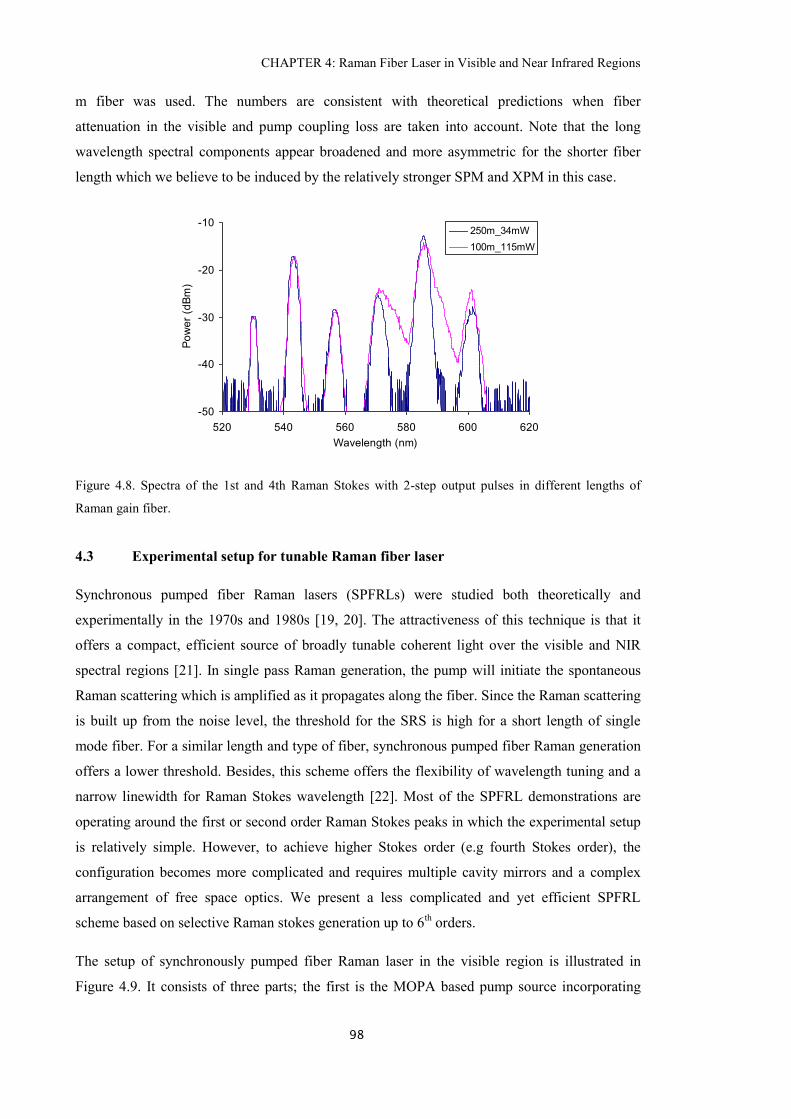
CHAPTER 4: Raman Fiber Laser in Visible and Near Infrared Regions
98
m fiber was used. The numbers are consistent with theoretical predictions when fiber
attenuation in the visible and pump coupling loss are taken into account. Note that the long
wavelength spectral components appear broadened and more asymmetric for the shorter fiber
length which we believe to be induced by the relatively stronger SPM and XPM in this case.
Figure 4.8. Spectra of the 1st and 4th Raman Stokes with 2-step output pulses in different lengths of
Raman gain fiber.
4.3 Experimental setup for tunable Raman fiber laser
Synchronous pumped fiber Raman lasers (SPFRLs) were studied both theoretically and
experimentally in the 1970s and 1980s [19, 20]. The attractiveness of this technique is that it
offers a compact, efficient source of broadly tunable coherent light over the visible and NIR
spectral regions [21]. In single pass Raman generation, the pump will initiate the spontaneous
Raman scattering which is amplified as it propagates along the fiber. Since the Raman scattering
is built up from the noise level, the threshold for the SRS is high for a short length of single
mode fiber. For a similar length and type of fiber, synchronous pumped fiber Raman generation
offers a lower threshold. Besides, this scheme offers the flexibility of wavelength tuning and a
narrow linewidth for Raman Stokes wavelength [22]. Most of the SPFRL demonstrations are
operating around the first or second order Raman Stokes peaks in which the experimental setup
is relatively simple. However, to achieve higher Stokes order (e.g fourth Stokes order), the
configuration becomes more complicated and requires multiple cavity mirrors and a complex
arrangement of free space optics. We present a less complicated and yet efficient SPFRL
scheme based on selective Raman stokes generation up to 6th orders.
The setup of synchronously pumped fiber Raman laser in the visible region is illustrated in
Figure 4.9. It consists of three parts; the first is the MOPA based pump source incorporating
-50
-40
-30
-20
-10
520 540 560 580 600 620
Wavelength (nm)
Po
we
r (d
Bm
)
250m_34mW
100m_115mW
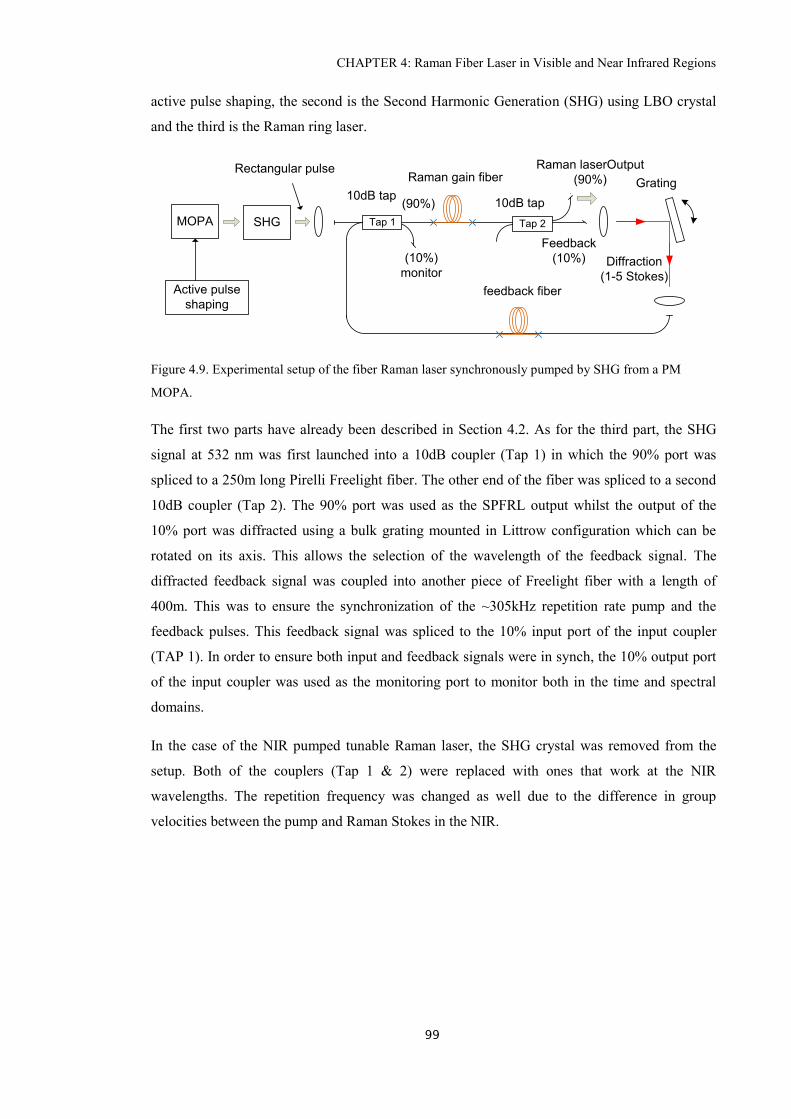
CHAPTER 4: Raman Fiber Laser in Visible and Near Infrared Regions
99
active pulse shaping, the second is the Second Harmonic Generation (SHG) using LBO crystal
and the third is the Raman ring laser.
Figure 4.9. Experimental setup of the fiber Raman laser synchronously pumped by SHG from a PM
MOPA.
The first two parts have already been described in Section 4.2. As for the third part, the SHG
signal at 532 nm was first launched into a 10dB coupler (Tap 1) in which the 90% port was
spliced to a 250m long Pirelli Freelight fiber. The other end of the fiber was spliced to a second
10dB coupler (Tap 2). The 90% port was used as the SPFRL output whilst the output of the
10% port was diffracted using a bulk grating mounted in Littrow configuration which can be
rotated on its axis. This allows the selection of the wavelength of the feedback signal. The
diffracted feedback signal was coupled into another piece of Freelight fiber with a length of
400m. This was to ensure the synchronization of the ~305kHz repetition rate pump and the
feedback pulses. This feedback signal was spliced to the 10% input port of the input coupler
(TAP 1). In order to ensure both input and feedback signals were in synch, the 10% output port
of the input coupler was used as the monitoring port to monitor both in the time and spectral
domains.
In the case of the NIR pumped tunable Raman laser, the SHG crystal was removed from the
setup. Both of the couplers (Tap 1 & 2) were replaced with ones that work at the NIR
wavelengths. The repetition frequency was changed as well due to the difference in group
velocities between the pump and Raman Stokes in the NIR.
SHG
Rectangular pulse
Tap 1
10dB tap
Raman gain fiberGrating
Diffraction
(1-5 Stokes)
feedback fiber
Tap 2
10dB tap
(10%)
monitor
(90%)
Raman laserOutput
(90%)
Feedback
(10%)
MOPA
Active pulse
shaping
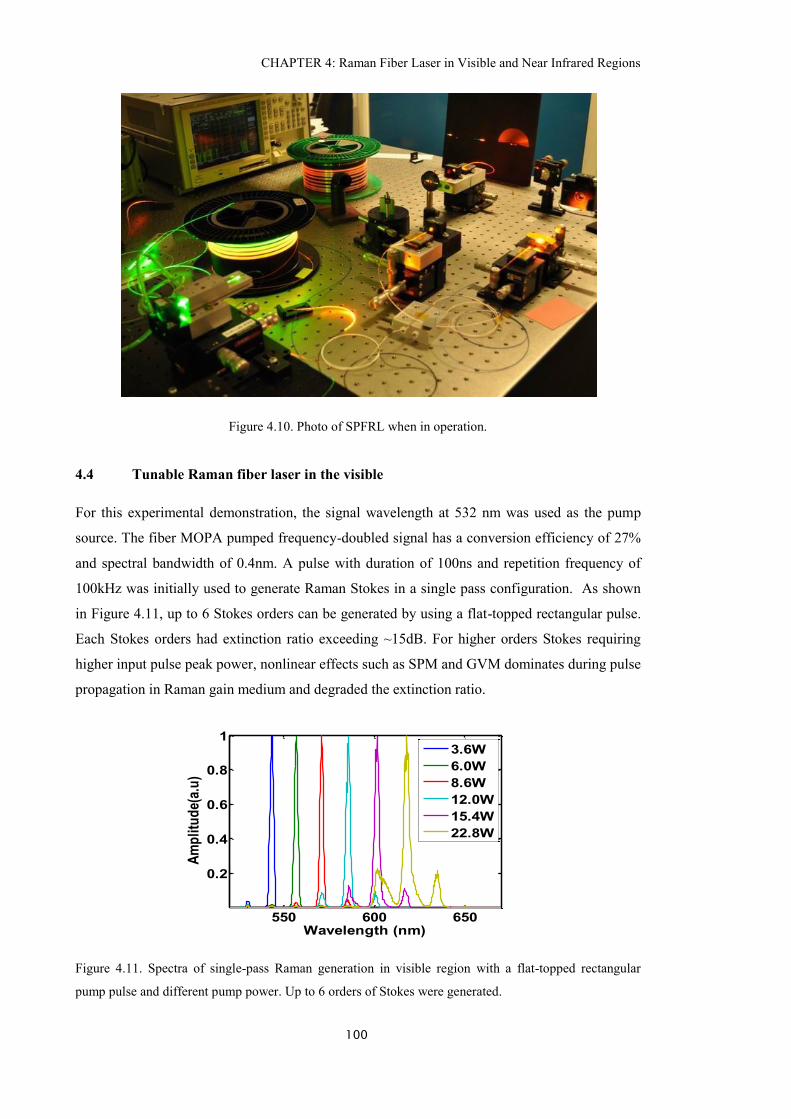
CHAPTER 4: Raman Fiber Laser in Visible and Near Infrared Regions
100
Figure 4.10. Photo of SPFRL when in operation.
4.4 Tunable Raman fiber laser in the visible
For this experimental demonstration, the signal wavelength at 532 nm was used as the pump
source. The fiber MOPA pumped frequency-doubled signal has a conversion efficiency of 27%
and spectral bandwidth of 0.4nm. A pulse with duration of 100ns and repetition frequency of
100kHz was initially used to generate Raman Stokes in a single pass configuration. As shown
in Figure 4.11, up to 6 Stokes orders can be generated by using a flat-topped rectangular pulse.
Each Stokes orders had extinction ratio exceeding ~15dB. For higher orders Stokes requiring
higher input pulse peak power, nonlinear effects such as SPM and GVM dominates during pulse
propagation in Raman gain medium and degraded the extinction ratio.
Figure 4.11. Spectra of single-pass Raman generation in visible region with a flat-topped rectangular
pump pulse and different pump power. Up to 6 orders of Stokes were generated.
550 600 650
0.2
0.4
0.6
0.8
1
Wavelength (nm)
Am
pli
tud
e(a.
u)
3.6W
6.0W
8.6W
12.0W
15.4W
22.8W
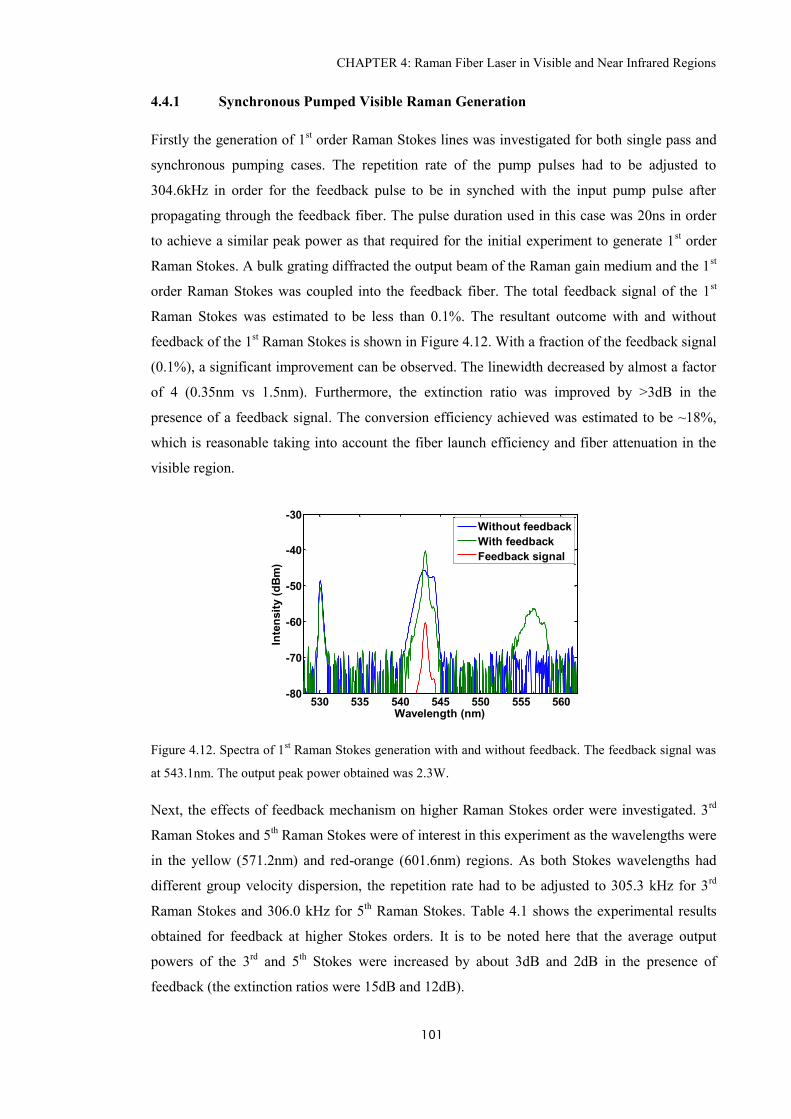
CHAPTER 4: Raman Fiber Laser in Visible and Near Infrared Regions
101
4.4.1 Synchronous Pumped Visible Raman Generation
Firstly the generation of 1st order Raman Stokes lines was investigated for both single pass and
synchronous pumping cases. The repetition rate of the pump pulses had to be adjusted to
304.6kHz in order for the feedback pulse to be in synched with the input pump pulse after
propagating through the feedback fiber. The pulse duration used in this case was 20ns in order
to achieve a similar peak power as that required for the initial experiment to generate 1st order
Raman Stokes. A bulk grating diffracted the output beam of the Raman gain medium and the 1st
order Raman Stokes was coupled into the feedback fiber. The total feedback signal of the 1st
Raman Stokes was estimated to be less than 0.1%. The resultant outcome with and without
feedback of the 1st Raman Stokes is shown in Figure 4.12. With a fraction of the feedback signal
(0.1%), a significant improvement can be observed. The linewidth decreased by almost a factor
of 4 (0.35nm vs 1.5nm). Furthermore, the extinction ratio was improved by >3dB in the
presence of a feedback signal. The conversion efficiency achieved was estimated to be ~18%,
which is reasonable taking into account the fiber launch efficiency and fiber attenuation in the
visible region.
Figure 4.12. Spectra of 1st Raman Stokes generation with and without feedback. The feedback signal was
at 543.1nm. The output peak power obtained was 2.3W.
Next, the effects of feedback mechanism on higher Raman Stokes order were investigated. 3rd
Raman Stokes and 5th Raman Stokes were of interest in this experiment as the wavelengths were
in the yellow (571.2nm) and red-orange (601.6nm) regions. As both Stokes wavelengths had
different group velocity dispersion, the repetition rate had to be adjusted to 305.3 kHz for 3rd
Raman Stokes and 306.0 kHz for 5th Raman Stokes. Table 4.1 shows the experimental results
obtained for feedback at higher Stokes orders. It is to be noted here that the average output
powers of the 3rd
and 5th Stokes were increased by about 3dB and 2dB in the presence of
feedback (the extinction ratios were 15dB and 12dB).
530 535 540 545 550 555 560-80
-70
-60
-50
-40
-30
Wavelength (nm)
Inte
nsit
y (
dB
m)
Without feedback
With feedback
Feedback signal
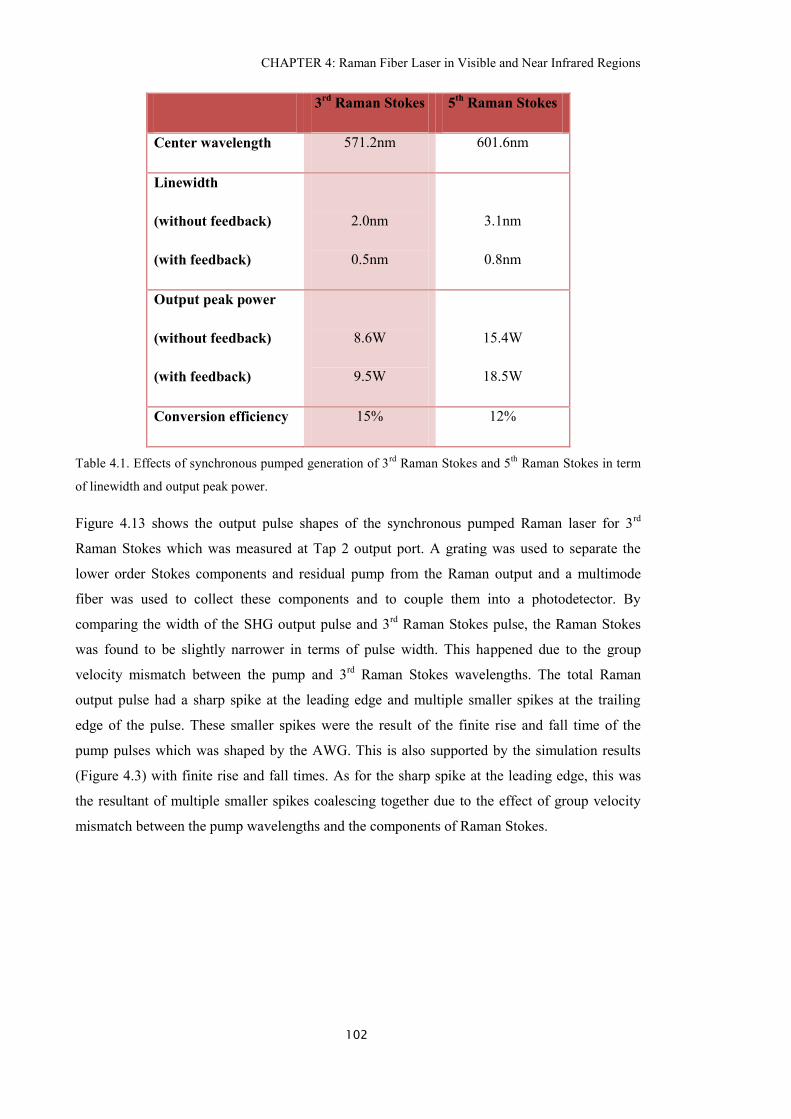
CHAPTER 4: Raman Fiber Laser in Visible and Near Infrared Regions
102
3rd
Raman Stokes 5th
Raman Stokes
Center wavelength 571.2nm 601.6nm
Linewidth
(without feedback)
(with feedback)
2.0nm
0.5nm
3.1nm
0.8nm
Output peak power
(without feedback)
(with feedback)
8.6W
9.5W
15.4W
18.5W
Conversion efficiency 15% 12%
Table 4.1. Effects of synchronous pumped generation of 3rd
Raman Stokes and 5th
Raman Stokes in term
of linewidth and output peak power.
Figure 4.13 shows the output pulse shapes of the synchronous pumped Raman laser for 3rd
Raman Stokes which was measured at Tap 2 output port. A grating was used to separate the
lower order Stokes components and residual pump from the Raman output and a multimode
fiber was used to collect these components and to couple them into a photodetector. By
comparing the width of the SHG output pulse and 3rd
Raman Stokes pulse, the Raman Stokes
was found to be slightly narrower in terms of pulse width. This happened due to the group
velocity mismatch between the pump and 3rd
Raman Stokes wavelengths. The total Raman
output pulse had a sharp spike at the leading edge and multiple smaller spikes at the trailing
edge of the pulse. These smaller spikes were the result of the finite rise and fall time of the
pump pulses which was shaped by the AWG. This is also supported by the simulation results
(Figure 4.3) with finite rise and fall times. As for the sharp spike at the leading edge, this was
the resultant of multiple smaller spikes coalescing together due to the effect of group velocity
mismatch between the pump wavelengths and the components of Raman Stokes.
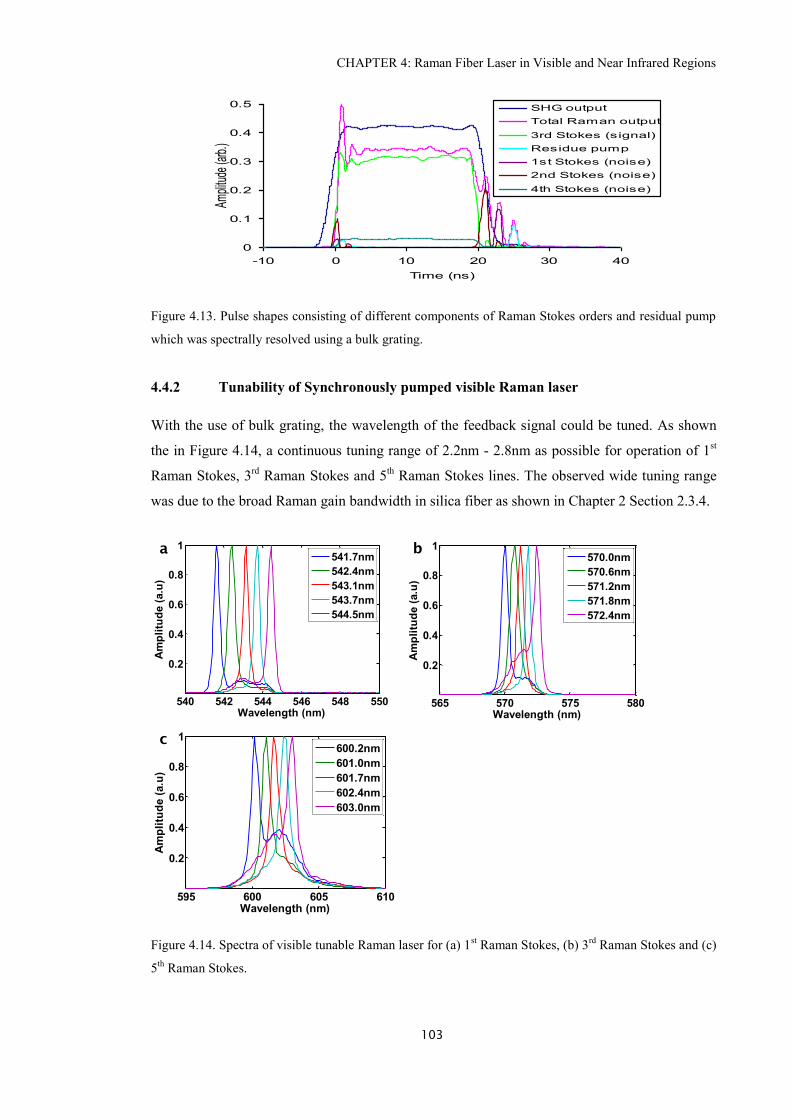
CHAPTER 4: Raman Fiber Laser in Visible and Near Infrared Regions
103
Figure 4.13. Pulse shapes consisting of different components of Raman Stokes orders and residual pump
which was spectrally resolved using a bulk grating.
4.4.2 Tunability of Synchronously pumped visible Raman laser
With the use of bulk grating, the wavelength of the feedback signal could be tuned. As shown
the in Figure 4.14, a continuous tuning range of 2.2nm - 2.8nm as possible for operation of 1st
Raman Stokes, 3rd
Raman Stokes and 5th Raman Stokes lines. The observed wide tuning range
was due to the broad Raman gain bandwidth in silica fiber as shown in Chapter 2 Section 2.3.4.
Figure 4.14. Spectra of visible tunable Raman laser for (a) 1st Raman Stokes, (b) 3
rd Raman Stokes and (c)
5th
Raman Stokes.
0
0.1
0.2
0.3
0.4
0.5
-10 0 10 20 30 40
Time (ns)
Ampli
tude
(arb
.)
SHG output
Total Raman output
3rd Stokes (signal)
Residue pump
1st Stokes (noise)
2nd Stokes (noise)
4th Stokes (noise)
540 542 544 546 548 550
0.2
0.4
0.6
0.8
1
Wavelength (nm)
Am
pli
tud
e (
a.u
)
541.7nm
542.4nm
543.1nm
543.7nm
544.5nm
565 570 575 580
0.2
0.4
0.6
0.8
1
Wavelength (nm)
Am
pli
tud
e (
a.u
)
570.0nm
570.6nm
571.2nm
571.8nm
572.4nm
595 600 605 610
0.2
0.4
0.6
0.8
1
Wavelength (nm)
Am
pli
tud
e (
a.u
)
600.2nm
601.0nm
601.7nm
602.4nm
603.0nm
a b
0
c
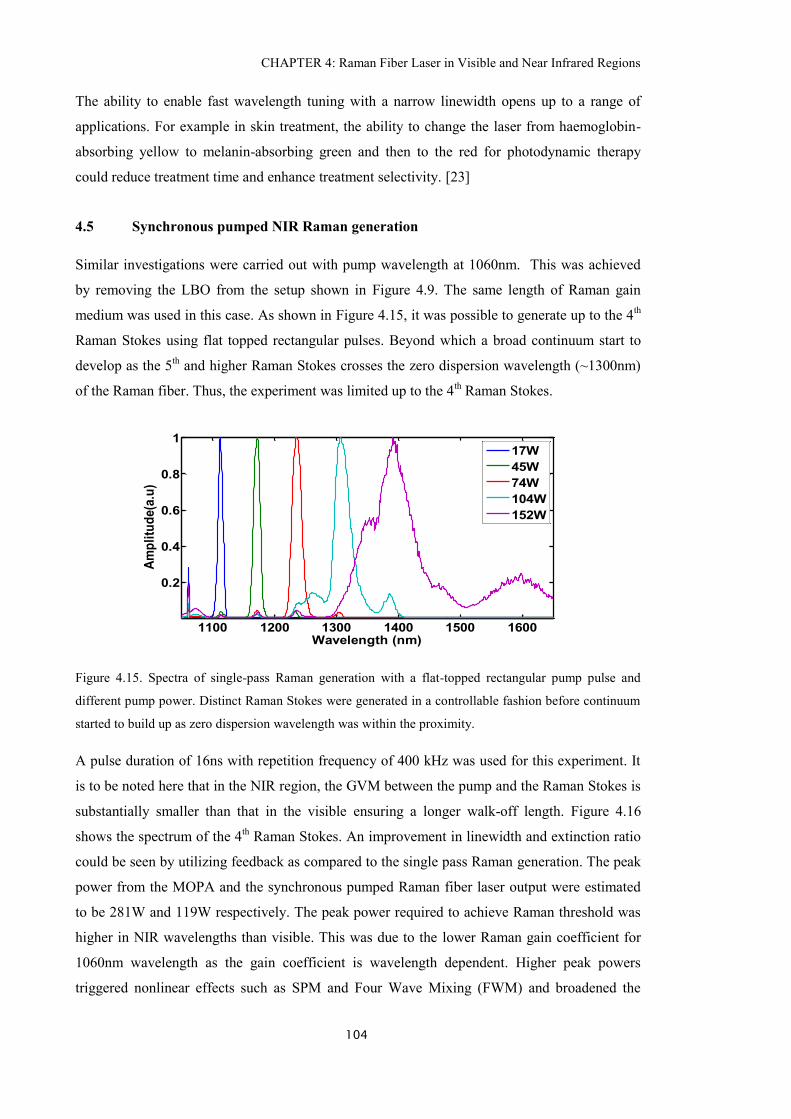
CHAPTER 4: Raman Fiber Laser in Visible and Near Infrared Regions
104
The ability to enable fast wavelength tuning with a narrow linewidth opens up to a range of
applications. For example in skin treatment, the ability to change the laser from haemoglobin-
absorbing yellow to melanin-absorbing green and then to the red for photodynamic therapy
could reduce treatment time and enhance treatment selectivity. [23]
4.5 Synchronous pumped NIR Raman generation
Similar investigations were carried out with pump wavelength at 1060nm. This was achieved
by removing the LBO from the setup shown in Figure 4.9. The same length of Raman gain
medium was used in this case. As shown in Figure 4.15, it was possible to generate up to the 4th
Raman Stokes using flat topped rectangular pulses. Beyond which a broad continuum start to
develop as the 5th and higher Raman Stokes crosses the zero dispersion wavelength (~1300nm)
of the Raman fiber. Thus, the experiment was limited up to the 4th Raman Stokes.
Figure 4.15. Spectra of single-pass Raman generation with a flat-topped rectangular pump pulse and
different pump power. Distinct Raman Stokes were generated in a controllable fashion before continuum
started to build up as zero dispersion wavelength was within the proximity.
A pulse duration of 16ns with repetition frequency of 400 kHz was used for this experiment. It
is to be noted here that in the NIR region, the GVM between the pump and the Raman Stokes is
substantially smaller than that in the visible ensuring a longer walk-off length. Figure 4.16
shows the spectrum of the 4th Raman Stokes. An improvement in linewidth and extinction ratio
could be seen by utilizing feedback as compared to the single pass Raman generation. The peak
power from the MOPA and the synchronous pumped Raman fiber laser output were estimated
to be 281W and 119W respectively. The peak power required to achieve Raman threshold was
higher in NIR wavelengths than visible. This was due to the lower Raman gain coefficient for
1060nm wavelength as the gain coefficient is wavelength dependent. Higher peak powers
triggered nonlinear effects such as SPM and Four Wave Mixing (FWM) and broadened the
1100 1200 1300 1400 1500 1600
0.2
0.4
0.6
0.8
1
Wavelength (nm)
Am
pli
tud
e(a
.u)
17W
45W
74W
104W
152W
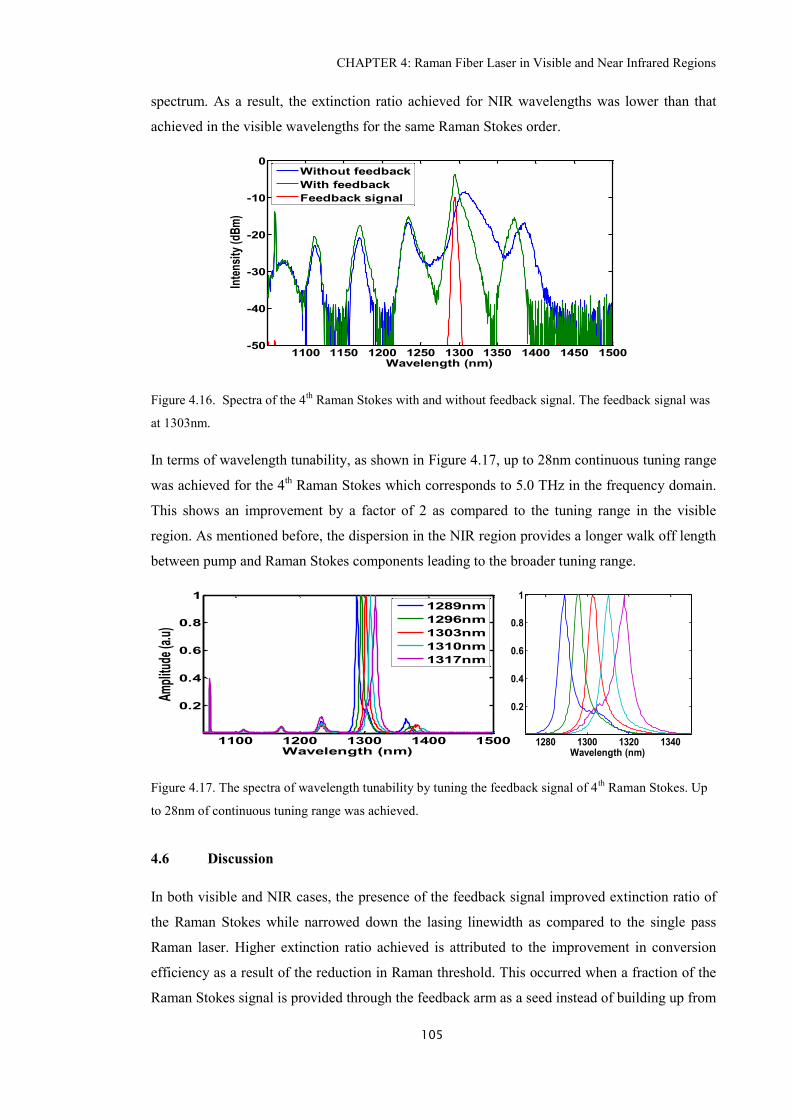
CHAPTER 4: Raman Fiber Laser in Visible and Near Infrared Regions
105
spectrum. As a result, the extinction ratio achieved for NIR wavelengths was lower than that
achieved in the visible wavelengths for the same Raman Stokes order.
Figure 4.16. Spectra of the 4th
Raman Stokes with and without feedback signal. The feedback signal was
at 1303nm.
In terms of wavelength tunability, as shown in Figure 4.17, up to 28nm continuous tuning range
was achieved for the 4th Raman Stokes which corresponds to 5.0 THz in the frequency domain.
This shows an improvement by a factor of 2 as compared to the tuning range in the visible
region. As mentioned before, the dispersion in the NIR region provides a longer walk off length
between pump and Raman Stokes components leading to the broader tuning range.
Figure 4.17. The spectra of wavelength tunability by tuning the feedback signal of 4th
Raman Stokes. Up
to 28nm of continuous tuning range was achieved.
4.6 Discussion
In both visible and NIR cases, the presence of the feedback signal improved extinction ratio of
the Raman Stokes while narrowed down the lasing linewidth as compared to the single pass
Raman laser. Higher extinction ratio achieved is attributed to the improvement in conversion
efficiency as a result of the reduction in Raman threshold. This occurred when a fraction of the
Raman Stokes signal is provided through the feedback arm as a seed instead of building up from
1100 1150 1200 1250 1300 1350 1400 1450 1500-50
-40
-30
-20
-10
0
Wavelength (nm)
Inte
nsi
ty (
dB
m)
Without feedback
With feedback
Feedback signal
1100 1200 1300 1400 1500
0.2
0.4
0.6
0.8
1
Wavelength (nm)
Ampl
itude
(a.u
)
1289nm
1296nm
1303nm
1310nm
1317nm
1280 1300 1320 1340
0.2
0.4
0.6
0.8
1
Wavelength (nm)
Am
pli
tud
e (
a.u
)
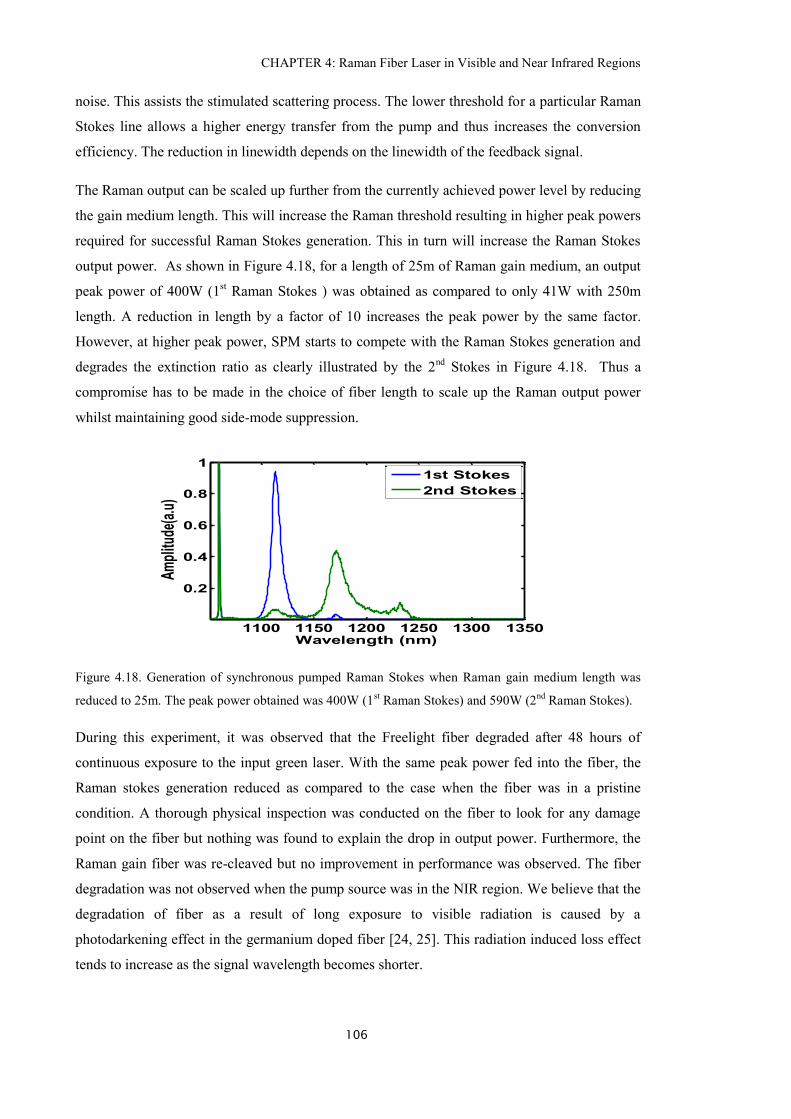
CHAPTER 4: Raman Fiber Laser in Visible and Near Infrared Regions
106
noise. This assists the stimulated scattering process. The lower threshold for a particular Raman
Stokes line allows a higher energy transfer from the pump and thus increases the conversion
efficiency. The reduction in linewidth depends on the linewidth of the feedback signal.
The Raman output can be scaled up further from the currently achieved power level by reducing
the gain medium length. This will increase the Raman threshold resulting in higher peak powers
required for successful Raman Stokes generation. This in turn will increase the Raman Stokes
output power. As shown in Figure 4.18, for a length of 25m of Raman gain medium, an output
peak power of 400W (1st Raman Stokes ) was obtained as compared to only 41W with 250m
length. A reduction in length by a factor of 10 increases the peak power by the same factor.
However, at higher peak power, SPM starts to compete with the Raman Stokes generation and
degrades the extinction ratio as clearly illustrated by the 2nd
Stokes in Figure 4.18. Thus a
compromise has to be made in the choice of fiber length to scale up the Raman output power
whilst maintaining good side-mode suppression.
Figure 4.18. Generation of synchronous pumped Raman Stokes when Raman gain medium length was
reduced to 25m. The peak power obtained was 400W (1st Raman Stokes) and 590W (2
nd Raman Stokes).
During this experiment, it was observed that the Freelight fiber degraded after 48 hours of
continuous exposure to the input green laser. With the same peak power fed into the fiber, the
Raman stokes generation reduced as compared to the case when the fiber was in a pristine
condition. A thorough physical inspection was conducted on the fiber to look for any damage
point on the fiber but nothing was found to explain the drop in output power. Furthermore, the
Raman gain fiber was re-cleaved but no improvement in performance was observed. The fiber
degradation was not observed when the pump source was in the NIR region. We believe that the
degradation of fiber as a result of long exposure to visible radiation is caused by a
photodarkening effect in the germanium doped fiber [24, 25]. This radiation induced loss effect
tends to increase as the signal wavelength becomes shorter.
1100 1150 1200 1250 1300 1350
0.2
0.4
0.6
0.8
1
Wavelength (nm)
Am
plitu
de(a
.u)
1st Stokes
2nd Stokes
CHAPTER 4: Raman Fiber Laser in Visible and Near Infrared Regions
107
4.7 Conclusion
We have demonstrated a new technique to realize Raman based pulsed fiber lasers. The use of a
pulse shaping technique based on EOM in an all fiber PM MOPA allows the generation of
shaped multistep pulses for selective excitation of the Raman stokes. The generation of pulses
of several tens to hundreds of nanoseconds in duration with this technique results in output
signal wavelengths that changes sequentially from green, to yellow to red (up to 7th stokes
orders) using 530 nm pump pulses with a 3 step profile or any other two using 2-step pulses by
exploiting the SRS in optical fiber. Operation in the NIR region however is limited to 4 stokes
orders before the zero dispersion wavelength of the fiber is reached beyond which a continuum
starts to build up.
A tunable, synchronous pumped Raman fiber laser was also demonstrated in the NIR and
visible regions. A continuous tuning range of 28nm in the NIR and 2.8nm in the visible region
are achieved. The conversion efficiency of pump to Raman signal increased with the use of a
feedback signal. The linewidth of the Raman Stokes in both visible and NIR regions shows a
significant narrowing effect. The total output power of the Raman fiber laser can still be
improved with the right type and length of Raman gain fiber.
The amount of optical power in the form of residual pump can be reduced further by using an
AWG with a higher resolution/ faster rise and fall times. By having optical pulses with steeper
rise and fall time, a higher conversion efficiency can be attained with better power extinction
between the required Raman stokes and the unwanted stokes.
This demonstration will allow the new generation of wavelength agile fiber based laser systems
operating across broad and interesting wavelength regimes to be made possible. Such light
sources could find great applications in the fields of spectroscopy, archaeology and biomedical
to name but a few.
CHAPTER 4: Raman Fiber Laser in Visible and Near Infrared Regions
108
4.8 References
1. D. Hawkins, N. Houreld, and H. Abrahamse, "Low level laser therapy (LLLT) as an
effective therapeutic modality for delayed wound healing," Annals of the New York
Academy of Sciences 1056, 486-493 (2005).
2. P. Papageorgiou, A. Katsambas, and A. Chu, "Phototherapy with blue (415 nm) and red
(660 nm) light in the treatment of acne vulgaris," British Journal of Dermatology 142,
973-978 (2000).
3. J. A. Brauer, E. A. Gordon Spratt, and R. G. Geronemus, "Laser Therapy in the
Treatment of Connective Tissue Diseases: A Review," Dermatologic Surgery 40, 1-13
(2014).
4. V. Spizzichino, and R. Fantoni, "Laser Induced Breakdown Spectroscopy in archeometry:
A review of its application and future perspectives," Spectrochimica Acta Part B: Atomic
Spectroscopy 99, 201-209 (2014).
5. S. Chaitanya Kumar, O. Kimmelma, and M. Ebrahim-Zadeh, "High-power, Yb-fiber-
laser-pumped, picosecond parametric source tunable across 752-860nm," Optics Letters
37, 1577-1579 (2012).
6. F. Kienle, P. S. Teh, D. Lin, S.-u. Alam, J. H. Price, D. Hanna, D. J. Richardson, and D.
P. Shepherd, "High-power, high repetition-rate, green-pumped, picosecond LBO optical
parametric oscillator," Opt. Express 20, 7008-7014 (2012).
7. R. H. Stolen, C. Lee, and R. K. Jain, "Development of the stimulated Raman spectrum in
single-mode silica fibers," Journal of the Optical Society of America B 1, 652-657
(1984).
8. R. H. Stolen, J. P. Gordon, W. J. Tomlinson, and H. A. Haus, "Raman response function
of silica-core fibers," Journal of the Optical Society of America B 6, 1159-1166 (1989).
9. N. Bloembergen, "The Stimulated Raman Effect," American Journal of Physics 35, 989-
1023 (1967).
10. J. Ji, C. A. Codemard, J. K. Sahu, and J. Nilsson, "Design, performance, and limitations
of fibers for cladding-pumped Raman lasers," Optical Fiber Technology 16, 428-441
(2010).
11. V. R. Supradeepa, J. W. Nichsolson, C. E. Headley, M. F. Yan, B. Palsdottir, and D.
Jakobsen, "A high efficiency architecture for cascaded Raman fiber lasers," Opt. Express
21, 7148-7155 (2013).
12. M. Melo, M. O. Berendt, and J. M. Sousa, "Signal Pulse Distortion Induced by
Stimulated Raman Scattering in High Power Double-Clad Fiber Amplifiers," Photonics
Technology Letters, IEEE 24, 252-254 (2012).
CHAPTER 4: Raman Fiber Laser in Visible and Near Infrared Regions
109
13. K. T. V. A. Malinowski, K.K. Chen, P.Horak, D.J. Richardson, "Selective Generation of
Individual Raman Stokes Wavelength using Shaped Optical Pulses," in Optical Fiber
Communication Conference (OFC)(San Diego, California, 2008).
14. K. K. Chen, S.-u. Alam, P. Horak, C. A. Codemard, A. Malinowski, and D. J.
Richardson, "Excitation of individual Raman Stokes lines in the visible regime using
rectangular-shaped nanosecond optical pulses at 530 nm," Optics Letters 35, 2433-2435
(2010).
15. A. K. Murray, A. L. Herrick, T. L. Moore, T. A. King, and C. E. M. Griffiths, "Dual
wavelength (532 and 633 nm) laser Doppler imaging of plaque psoriasis," British Journal
of Dermatology 152, 1182-1186 (2005).
16. C. Kang Kang, S. U. Alam, J. R. Hayes, H. J. Baker, D. Hall, R. McBride, J. Price, D.
Lin, A. Malinowski, and D. J. Richardson, "56-W Frequency-Doubled Source at 530 nm
Pumped by a Single-Mode, Single-Polarization, Picosecond, Yb3+ Doped Fiber MOPA,"
Photonics Technology Letters, IEEE 22, 893-895 (2010).
17. M. N. Islam, J. R. Simpson, H. T. Shang, L. F. Mollenauer, and R. H. Stolen, "Cross-
phase modulation in optical fibers," Optics Letters 12, 625-627 (1987).
18. M. Santagiustina, P. Balan, and C. De Angelis, "Combined effects of self-, cross-phase
modulation and stimulated Raman scattering in optical fibers," Optics Communications
100, 197-203 (1993).
19. M. Nakazawa, M. Kuznetsov, and E. P. Ippen, "Theory of the synchronously pumped
fiber Raman laser," Quantum Electronics, IEEE Journal of 22, 1953-1966 (1986).
20. C. Lin, and W. G. French, "A near‐infrared fiber Raman oscillator tunable from 1.07 to
1.32 μm," Applied Physics Letters 34, 666-668 (1979).
21. K. Smith, P. N. Kean, D. W. Crust, and W. Sibbett, "An Experimental Study of a
Synchronously Pumped Fibre Raman Oscillator," Journal of Modern Optics 34, 1227-
1233 (1987).
22. E. Desurvire, A. Imamoglu, and H. J. Shaw, "Low-threshold synchronously pumped all-
fiber ring Raman laser," Lightwave Technology, Journal of 5, 89-96 (1987).
23. H. M. P. a. J. A. P. Richard P. Mildren, "Raman lasers with intracavity nonlinear optics
are promising alternatives to multiline lasers and parametric oscillators," (2005).
24. E. J. Friebele, D. L. Griscom, and G. H. Sigel, "Defect centers in a germanium‐doped
silica‐core optical fiber," Journal of Applied Physics 45, 3424-3428 (1974).
25. L. J. Poyntz-Wright, and P. S. J. Russell, "Spontaneous relaxation processes in irradiated
germanosilicate optical fibres," Electronics Letters 25, 478-480 (1989).

CHAPTER 4: Raman Fiber Laser in Visible and Near Infrared Regions
110
CHAPTER 5: Picosecond Pulse Generation using SLD
111
Chapter 5. Picosecond Pulse Generation Using SLD
Apart from the work done on nanosecond regime (in the work of SMART laser discussed in
Chapter 3), our project partner, SPI Lasers is looking into developing fiber based laser systems
which operate in the picosecond regime as one of their future product line. Such laser system
requires a stable optical pulse source as a seed laser for effective amplification in the amplifier
chains. The setup complexity and the stability of the pulse generated will be the main
requirement for the seed laser. Hence, I was tasked to investigate the techniques for generating
picosecond pulses from semiconductor laser diode and with the goal of identifying the best
solution to be used as the seed laser.
This chapter investigates two techniques for picosecond pulse generation, namely gain
switching and mode-locking of a semiconductor laser diode with an external cavity. Both of
these techniques are attractive due to the simplicity of their configurations which make them
ideal for seeding fiber MOPAs. The characteristics of the optical pulses such as pulse width,
spectral width, frequency chirp and timing jitter will be discussed extensively in this chapter.
5.1 Introduction
The demand for high power fiber lasers producing picosecond optical pulses in the 1.0 µm
wavelength region is growing in recent years as they are widely used for laser machining,
frequency-doubling, and the pump sources for parametric oscillators and supercontinuum
generation [1-3]. Various operating parameters are sought for these types of applications such as
variable repetition rate, wavelength tunability, low timing jitter between pulses, pulse widths
that can be varied as well as generation of transform-limited optical pulses.
The SLD is well suited for the generation of short optical pulses in the picosecond regime and
becomes an important seed source in the MOPA architecture for the generation of high optical
power [4]. In order to produce short picosecond optical pulses from a SLD, two major
techniques are used, namely gain-switching and mode-locking.
5.2 Gain switching
The development of high speed photonic networks produced high demands for compact pulsed
laser sources. A few techniques for short pulse generation using semiconductor based lasers
have been introduced; among which the gain switching technique. Gain switching was first
demonstrated by Ito et al [5] who showed that by injecting short electrical pulses into the SLD,
optical pulses with pulse durations shorter than the injected electrical pulses could be generated.
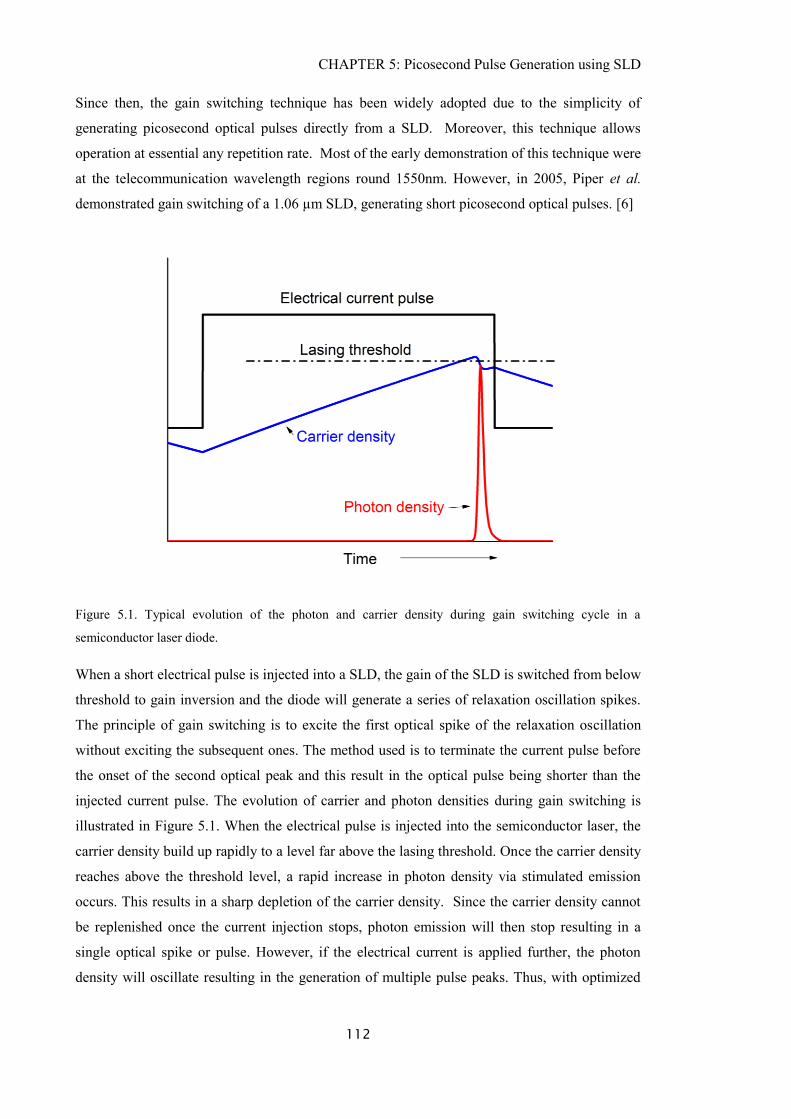
CHAPTER 5: Picosecond Pulse Generation using SLD
112
Since then, the gain switching technique has been widely adopted due to the simplicity of
generating picosecond optical pulses directly from a SLD. Moreover, this technique allows
operation at essential any repetition rate. Most of the early demonstration of this technique were
at the telecommunication wavelength regions round 1550nm. However, in 2005, Piper et al.
demonstrated gain switching of a 1.06 µm SLD, generating short picosecond optical pulses. [6]
Figure 5.1. Typical evolution of the photon and carrier density during gain switching cycle in a
semiconductor laser diode.
When a short electrical pulse is injected into a SLD, the gain of the SLD is switched from below
threshold to gain inversion and the diode will generate a series of relaxation oscillation spikes.
The principle of gain switching is to excite the first optical spike of the relaxation oscillation
without exciting the subsequent ones. The method used is to terminate the current pulse before
the onset of the second optical peak and this result in the optical pulse being shorter than the
injected current pulse. The evolution of carrier and photon densities during gain switching is
illustrated in Figure 5.1. When the electrical pulse is injected into the semiconductor laser, the
carrier density build up rapidly to a level far above the lasing threshold. Once the carrier density
reaches above the threshold level, a rapid increase in photon density via stimulated emission
occurs. This results in a sharp depletion of the carrier density. Since the carrier density cannot
be replenished once the current injection stops, photon emission will then stop resulting in a
single optical spike or pulse. However, if the electrical current is applied further, the photon
density will oscillate resulting in the generation of multiple pulse peaks. Thus, with optimized
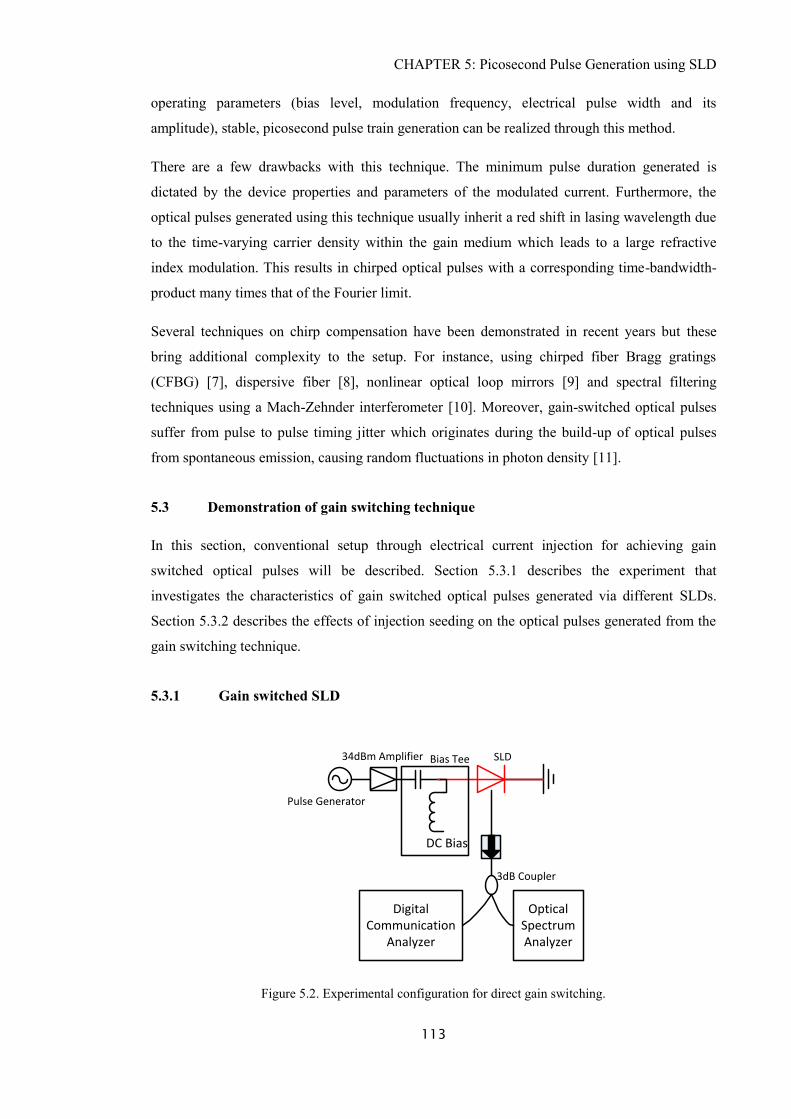
CHAPTER 5: Picosecond Pulse Generation using SLD
113
operating parameters (bias level, modulation frequency, electrical pulse width and its
amplitude), stable, picosecond pulse train generation can be realized through this method.
There are a few drawbacks with this technique. The minimum pulse duration generated is
dictated by the device properties and parameters of the modulated current. Furthermore, the
optical pulses generated using this technique usually inherit a red shift in lasing wavelength due
to the time-varying carrier density within the gain medium which leads to a large refractive
index modulation. This results in chirped optical pulses with a corresponding time-bandwidth-
product many times that of the Fourier limit.
Several techniques on chirp compensation have been demonstrated in recent years but these
bring additional complexity to the setup. For instance, using chirped fiber Bragg gratings
(CFBG) [7], dispersive fiber [8], nonlinear optical loop mirrors [9] and spectral filtering
techniques using a Mach-Zehnder interferometer [10]. Moreover, gain-switched optical pulses
suffer from pulse to pulse timing jitter which originates during the build-up of optical pulses
from spontaneous emission, causing random fluctuations in photon density [11].
5.3 Demonstration of gain switching technique
In this section, conventional setup through electrical current injection for achieving gain
switched optical pulses will be described. Section 5.3.1 describes the experiment that
investigates the characteristics of gain switched optical pulses generated via different SLDs.
Section 5.3.2 describes the effects of injection seeding on the optical pulses generated from the
gain switching technique.
5.3.1 Gain switched SLD
Pulse Generator
Optical Spectrum Analyzer
Digital Communication
Analyzer
34dBm Amplifier Bias Tee SLD
DC Bias
3dB Coupler
Figure 5.2. Experimental configuration for direct gain switching.
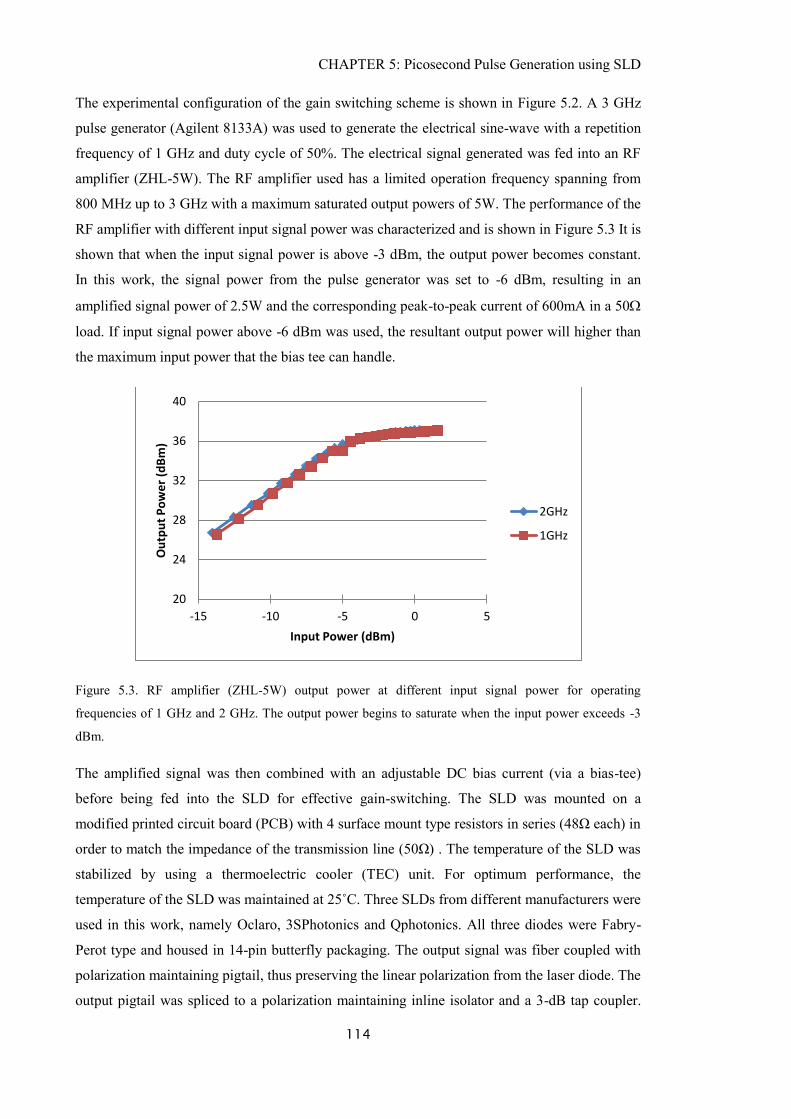
CHAPTER 5: Picosecond Pulse Generation using SLD
114
The experimental configuration of the gain switching scheme is shown in Figure 5.2. A 3 GHz
pulse generator (Agilent 8133A) was used to generate the electrical sine-wave with a repetition
frequency of 1 GHz and duty cycle of 50%. The electrical signal generated was fed into an RF
amplifier (ZHL-5W). The RF amplifier used has a limited operation frequency spanning from
800 MHz up to 3 GHz with a maximum saturated output powers of 5W. The performance of the
RF amplifier with different input signal power was characterized and is shown in Figure 5.3 It is
shown that when the input signal power is above -3 dBm, the output power becomes constant.
In this work, the signal power from the pulse generator was set to -6 dBm, resulting in an
amplified signal power of 2.5W and the corresponding peak-to-peak current of 600mA in a 50
load. If input signal power above -6 dBm was used, the resultant output power will higher than
the maximum input power that the bias tee can handle.
Figure 5.3. RF amplifier (ZHL-5W) output power at different input signal power for operating
frequencies of 1 GHz and 2 GHz. The output power begins to saturate when the input power exceeds -3
dBm.
The amplified signal was then combined with an adjustable DC bias current (via a bias-tee)
before being fed into the SLD for effective gain-switching. The SLD was mounted on a
modified printed circuit board (PCB) with 4 surface mount type resistors in series (48Ω each) in
order to match the impedance of the transmission line (50Ω) . The temperature of the SLD was
stabilized by using a thermoelectric cooler (TEC) unit. For optimum performance, the
temperature of the SLD was maintained at 25˚C. Three SLDs from different manufacturers were
used in this work, namely Oclaro, 3SPhotonics and Qphotonics. All three diodes were Fabry-
Perot type and housed in 14-pin butterfly packaging. The output signal was fiber coupled with
polarization maintaining pigtail, thus preserving the linear polarization from the laser diode. The
output pigtail was spliced to a polarization maintaining inline isolator and a 3-dB tap coupler.
20
24
28
32
36
40
-15 -10 -5 0 5
Ou
tpu
t P
ow
er
(dB
m)
Input Power (dBm)
2GHz
1GHz
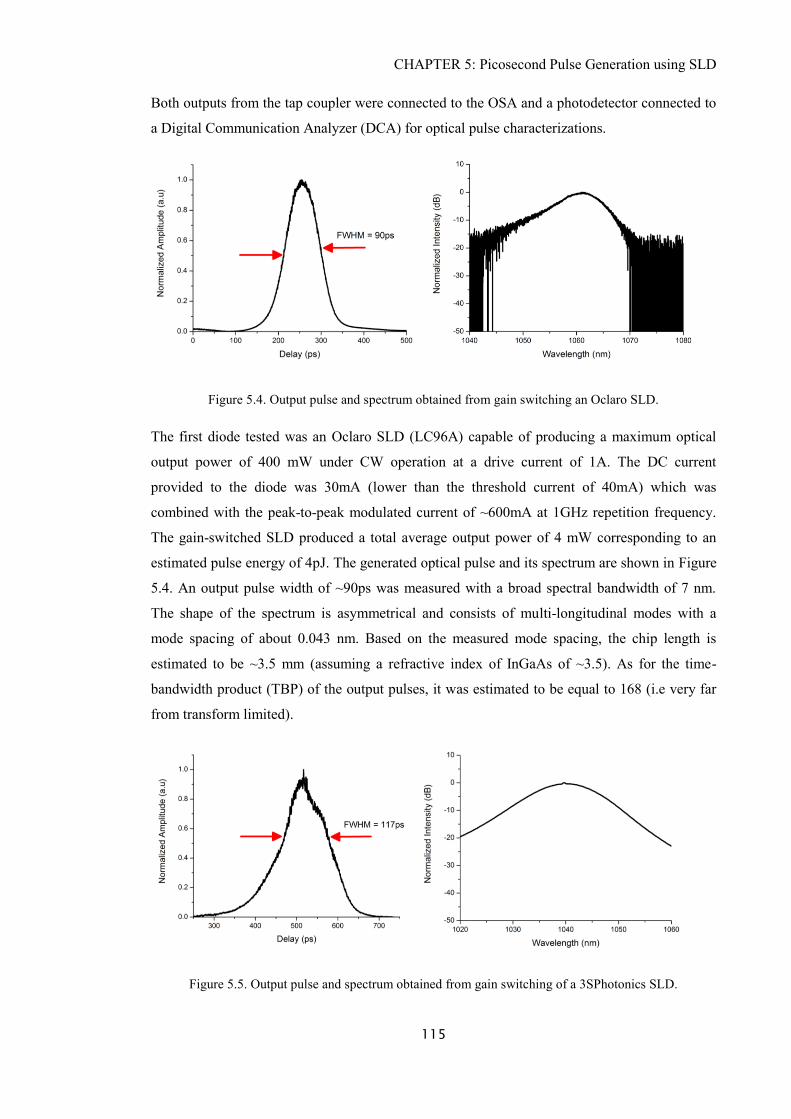
CHAPTER 5: Picosecond Pulse Generation using SLD
115
Both outputs from the tap coupler were connected to the OSA and a photodetector connected to
a Digital Communication Analyzer (DCA) for optical pulse characterizations.
Figure 5.4. Output pulse and spectrum obtained from gain switching an Oclaro SLD.
The first diode tested was an Oclaro SLD (LC96A) capable of producing a maximum optical
output power of 400 mW under CW operation at a drive current of 1A. The DC current
provided to the diode was 30mA (lower than the threshold current of 40mA) which was
combined with the peak-to-peak modulated current of ~600mA at 1GHz repetition frequency.
The gain-switched SLD produced a total average output power of 4 mW corresponding to an
estimated pulse energy of 4pJ. The generated optical pulse and its spectrum are shown in Figure
5.4. An output pulse width of ~90ps was measured with a broad spectral bandwidth of 7 nm.
The shape of the spectrum is asymmetrical and consists of multi-longitudinal modes with a
mode spacing of about 0.043 nm. Based on the measured mode spacing, the chip length is
estimated to be ~3.5 mm (assuming a refractive index of InGaAs of ~3.5). As for the time-
bandwidth product (TBP) of the output pulses, it was estimated to be equal to 168 (i.e very far
from transform limited).
Figure 5.5. Output pulse and spectrum obtained from gain switching of a 3SPhotonics SLD.
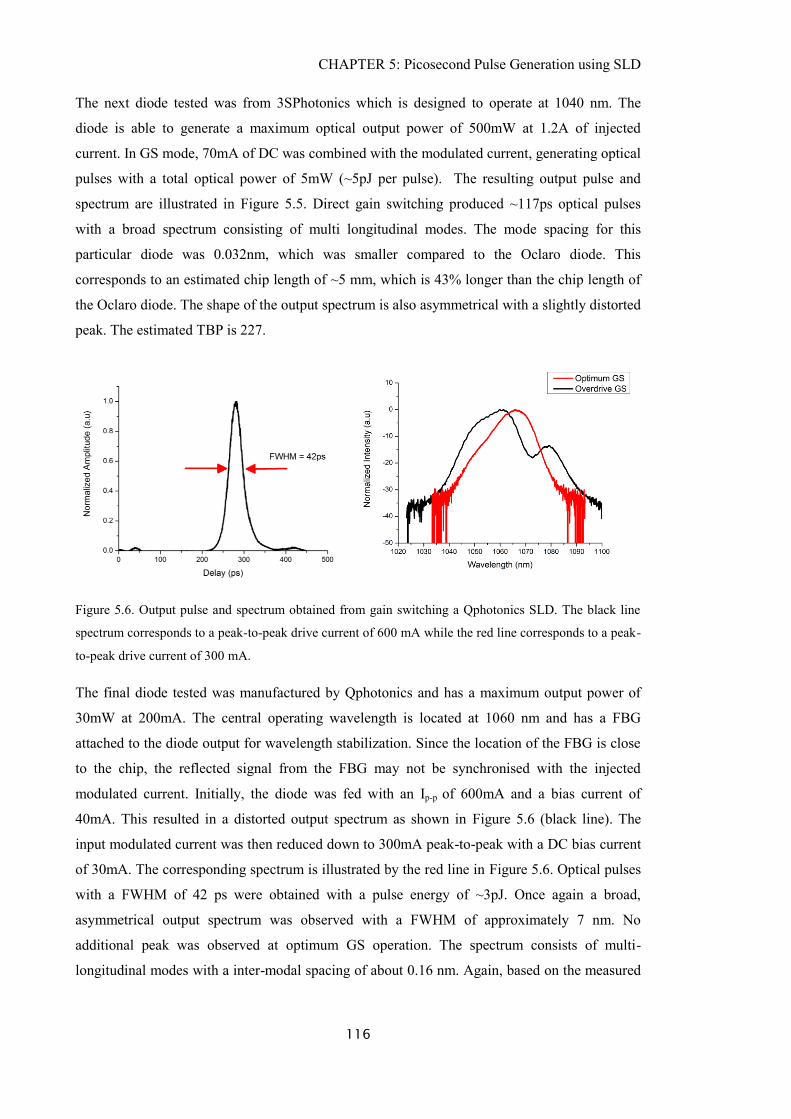
CHAPTER 5: Picosecond Pulse Generation using SLD
116
The next diode tested was from 3SPhotonics which is designed to operate at 1040 nm. The
diode is able to generate a maximum optical output power of 500mW at 1.2A of injected
current. In GS mode, 70mA of DC was combined with the modulated current, generating optical
pulses with a total optical power of 5mW (~5pJ per pulse). The resulting output pulse and
spectrum are illustrated in Figure 5.5. Direct gain switching produced ~117ps optical pulses
with a broad spectrum consisting of multi longitudinal modes. The mode spacing for this
particular diode was 0.032nm, which was smaller compared to the Oclaro diode. This
corresponds to an estimated chip length of ~5 mm, which is 43% longer than the chip length of
the Oclaro diode. The shape of the output spectrum is also asymmetrical with a slightly distorted
peak. The estimated TBP is 227.
Figure 5.6. Output pulse and spectrum obtained from gain switching a Qphotonics SLD. The black line
spectrum corresponds to a peak-to-peak drive current of 600 mA while the red line corresponds to a peak-
to-peak drive current of 300 mA.
The final diode tested was manufactured by Qphotonics and has a maximum output power of
30mW at 200mA. The central operating wavelength is located at 1060 nm and has a FBG
attached to the diode output for wavelength stabilization. Since the location of the FBG is close
to the chip, the reflected signal from the FBG may not be synchronised with the injected
modulated current. Initially, the diode was fed with an Ip-p of 600mA and a bias current of
40mA. This resulted in a distorted output spectrum as shown in Figure 5.6 (black line). The
input modulated current was then reduced down to 300mA peak-to-peak with a DC bias current
of 30mA. The corresponding spectrum is illustrated by the red line in Figure 5.6. Optical pulses
with a FWHM of 42 ps were obtained with a pulse energy of ~3pJ. Once again a broad,
asymmetrical output spectrum was observed with a FWHM of approximately 7 nm. No
additional peak was observed at optimum GS operation. The spectrum consists of multi-
longitudinal modes with a inter-modal spacing of about 0.16 nm. Again, based on the measured
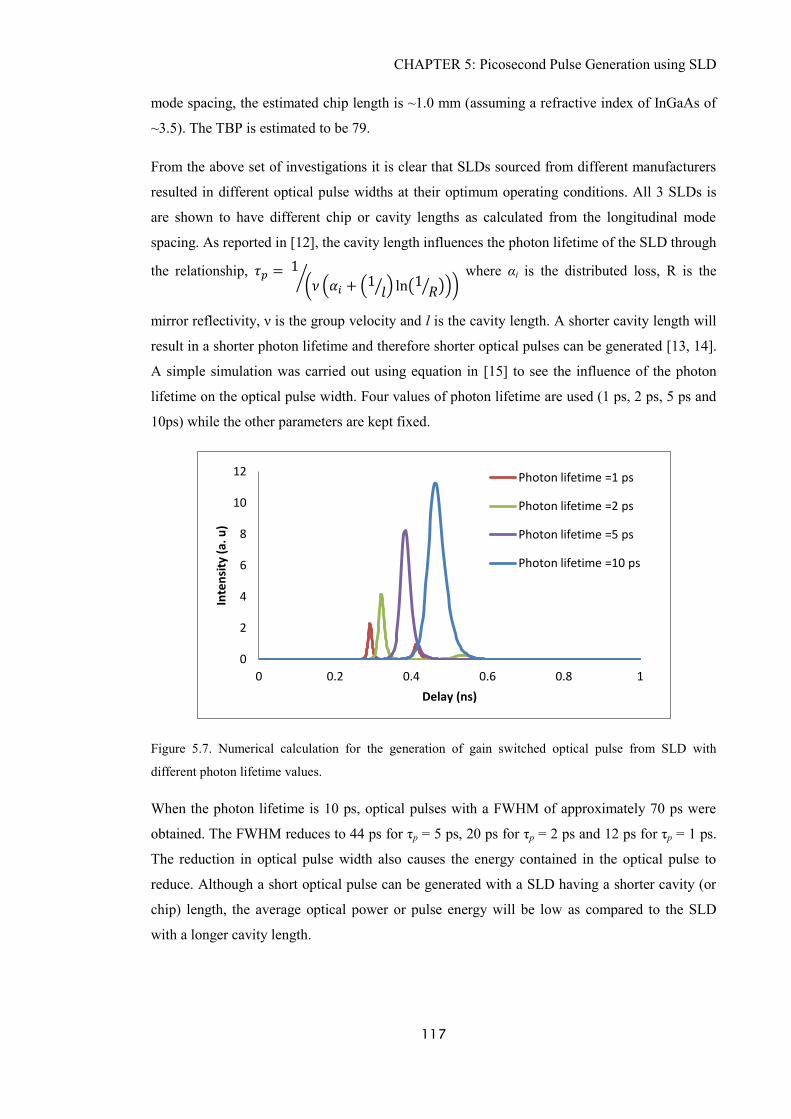
CHAPTER 5: Picosecond Pulse Generation using SLD
117
mode spacing, the estimated chip length is ~1.0 mm (assuming a refractive index of InGaAs of
~3.5). The TBP is estimated to be 79.
From the above set of investigations it is clear that SLDs sourced from different manufacturers
resulted in different optical pulse widths at their optimum operating conditions. All 3 SLDs is
are shown to have different chip or cavity lengths as calculated from the longitudinal mode
spacing. As reported in [12], the cavity length influences the photon lifetime of the SLD through
the relationship,
where αi is the distributed loss, R is the
mirror reflectivity, ν is the group velocity and l is the cavity length. A shorter cavity length will
result in a shorter photon lifetime and therefore shorter optical pulses can be generated [13, 14].
A simple simulation was carried out using equation in [15] to see the influence of the photon
lifetime on the optical pulse width. Four values of photon lifetime are used (1 ps, 2 ps, 5 ps and
10ps) while the other parameters are kept fixed.
Figure 5.7. Numerical calculation for the generation of gain switched optical pulse from SLD with
different photon lifetime values.
When the photon lifetime is 10 ps, optical pulses with a FWHM of approximately 70 ps were
obtained. The FWHM reduces to 44 ps for τp = 5 ps, 20 ps for τp = 2 ps and 12 ps for τp = 1 ps.
The reduction in optical pulse width also causes the energy contained in the optical pulse to
reduce. Although a short optical pulse can be generated with a SLD having a shorter cavity (or
chip) length, the average optical power or pulse energy will be low as compared to the SLD
with a longer cavity length.
0
2
4
6
8
10
12
0 0.2 0.4 0.6 0.8 1
Inte
nsi
ty (
a. u
)
Delay (ns)
Photon lifetime =1 ps
Photon lifetime =2 ps
Photon lifetime =5 ps
Photon lifetime =10 ps
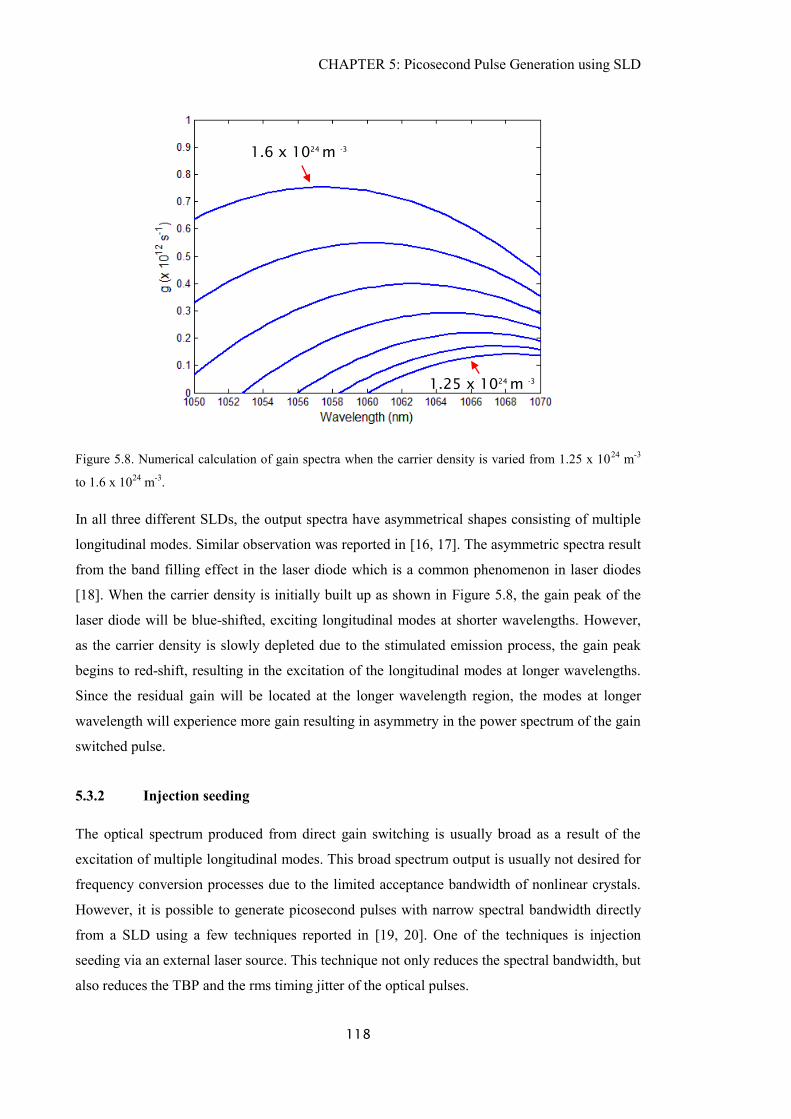
CHAPTER 5: Picosecond Pulse Generation using SLD
118
Figure 5.8. Numerical calculation of gain spectra when the carrier density is varied from 1.25 x 1024
m-3
to 1.6 x 1024
m-3
.
In all three different SLDs, the output spectra have asymmetrical shapes consisting of multiple
longitudinal modes. Similar observation was reported in [16, 17]. The asymmetric spectra result
from the band filling effect in the laser diode which is a common phenomenon in laser diodes
[18]. When the carrier density is initially built up as shown in Figure 5.8, the gain peak of the
laser diode will be blue-shifted, exciting longitudinal modes at shorter wavelengths. However,
as the carrier density is slowly depleted due to the stimulated emission process, the gain peak
begins to red-shift, resulting in the excitation of the longitudinal modes at longer wavelengths.
Since the residual gain will be located at the longer wavelength region, the modes at longer
wavelength will experience more gain resulting in asymmetry in the power spectrum of the gain
switched pulse.
5.3.2 Injection seeding
The optical spectrum produced from direct gain switching is usually broad as a result of the
excitation of multiple longitudinal modes. This broad spectrum output is usually not desired for
frequency conversion processes due to the limited acceptance bandwidth of nonlinear crystals.
However, it is possible to generate picosecond pulses with narrow spectral bandwidth directly
from a SLD using a few techniques reported in [19, 20]. One of the techniques is injection
seeding via an external laser source. This technique not only reduces the spectral bandwidth, but
also reduces the TBP and the rms timing jitter of the optical pulses.
1.6 x 1024
m -3
1.25 x 1024
m -3
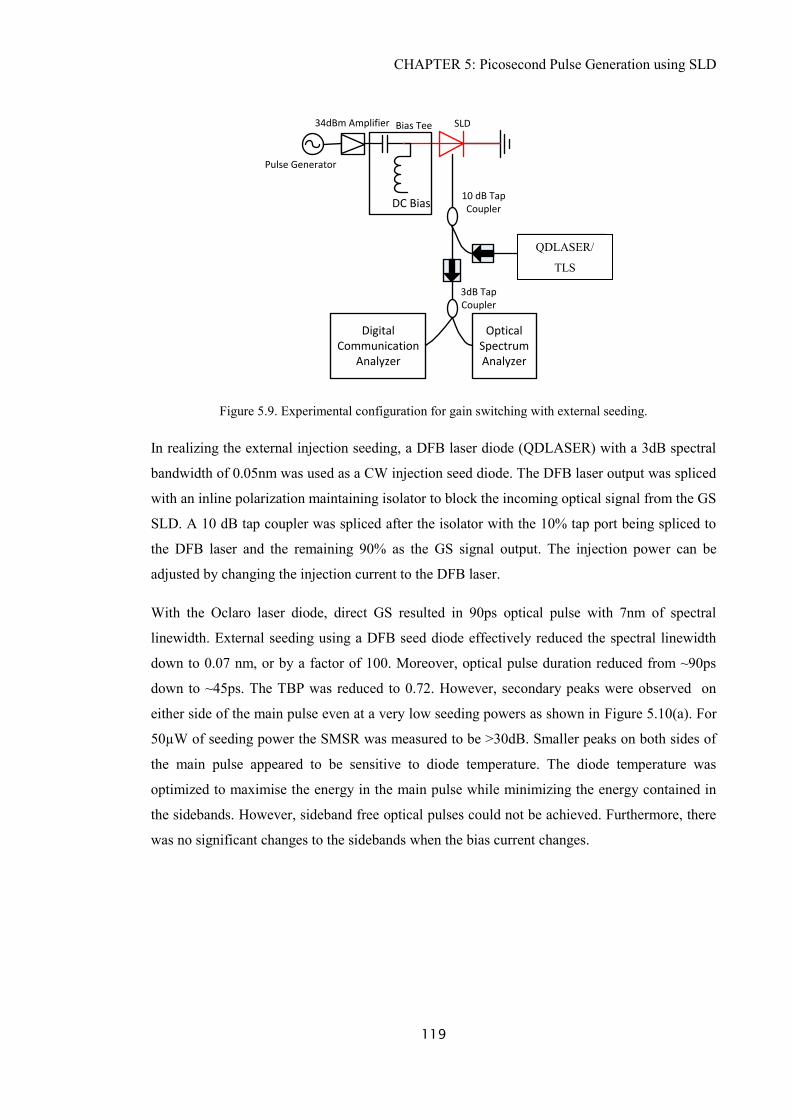
CHAPTER 5: Picosecond Pulse Generation using SLD
119
Pulse Generator
Optical Spectrum Analyzer
Digital Communication
Analyzer
34dBm Amplifier Bias Tee SLD
DC Bias
3dB Tap Coupler
Narrow linewidth TLS
10 dB Tap Coupler
Figure 5.9. Experimental configuration for gain switching with external seeding.
In realizing the external injection seeding, a DFB laser diode (QDLASER) with a 3dB spectral
bandwidth of 0.05nm was used as a CW injection seed diode. The DFB laser output was spliced
with an inline polarization maintaining isolator to block the incoming optical signal from the GS
SLD. A 10 dB tap coupler was spliced after the isolator with the 10% tap port being spliced to
the DFB laser and the remaining 90% as the GS signal output. The injection power can be
adjusted by changing the injection current to the DFB laser.
With the Oclaro laser diode, direct GS resulted in 90ps optical pulse with 7nm of spectral
linewidth. External seeding using a DFB seed diode effectively reduced the spectral linewidth
down to 0.07 nm, or by a factor of 100. Moreover, optical pulse duration reduced from ~90ps
down to ~45ps. The TBP was reduced to 0.72. However, secondary peaks were observed on
either side of the main pulse even at a very low seeding powers as shown in Figure 5.10(a). For
50µW of seeding power the SMSR was measured to be >30dB. Smaller peaks on both sides of
the main pulse appeared to be sensitive to diode temperature. The diode temperature was
optimized to maximise the energy in the main pulse while minimizing the energy contained in
the sidebands. However, sideband free optical pulses could not be achieved. Furthermore, there
was no significant changes to the sidebands when the bias current changes.
QDLASER/
TLS
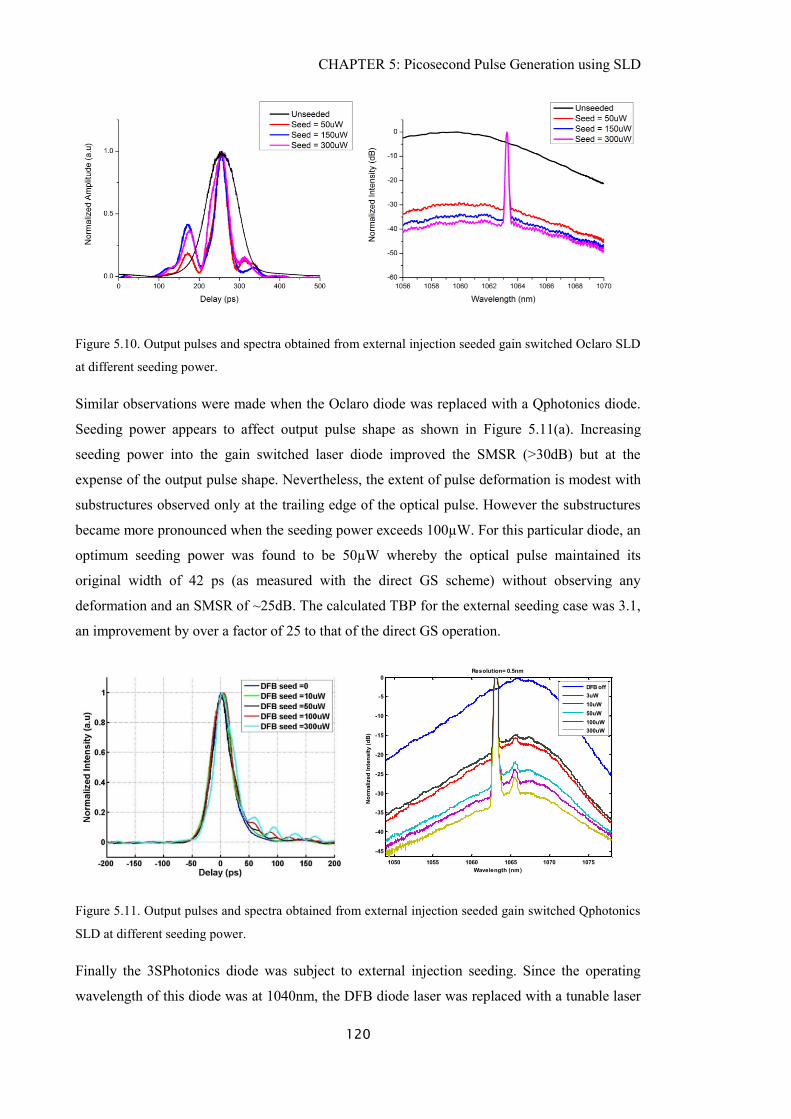
CHAPTER 5: Picosecond Pulse Generation using SLD
120
Figure 5.10. Output pulses and spectra obtained from external injection seeded gain switched Oclaro SLD
at different seeding power.
Similar observations were made when the Oclaro diode was replaced with a Qphotonics diode.
Seeding power appears to affect output pulse shape as shown in Figure 5.11(a). Increasing
seeding power into the gain switched laser diode improved the SMSR (>30dB) but at the
expense of the output pulse shape. Nevertheless, the extent of pulse deformation is modest with
substructures observed only at the trailing edge of the optical pulse. However the substructures
became more pronounced when the seeding power exceeds 100µW. For this particular diode, an
optimum seeding power was found to be 50µW whereby the optical pulse maintained its
original width of 42 ps (as measured with the direct GS scheme) without observing any
deformation and an SMSR of ~25dB. The calculated TBP for the external seeding case was 3.1,
an improvement by over a factor of 25 to that of the direct GS operation.
Figure 5.11. Output pulses and spectra obtained from external injection seeded gain switched Qphotonics
SLD at different seeding power.
Finally the 3SPhotonics diode was subject to external injection seeding. Since the operating
wavelength of this diode was at 1040nm, the DFB diode laser was replaced with a tunable laser
1050 1055 1060 1065 1070 1075
-45
-40
-35
-30
-25
-20
-15
-10
-5
0
Wavelength (nm)
No
rmalized
In
ten
sit
y (
dB
)
Resolution= 0.5nm
DFB off
3uW
10uW
50uW
100uW
300uW
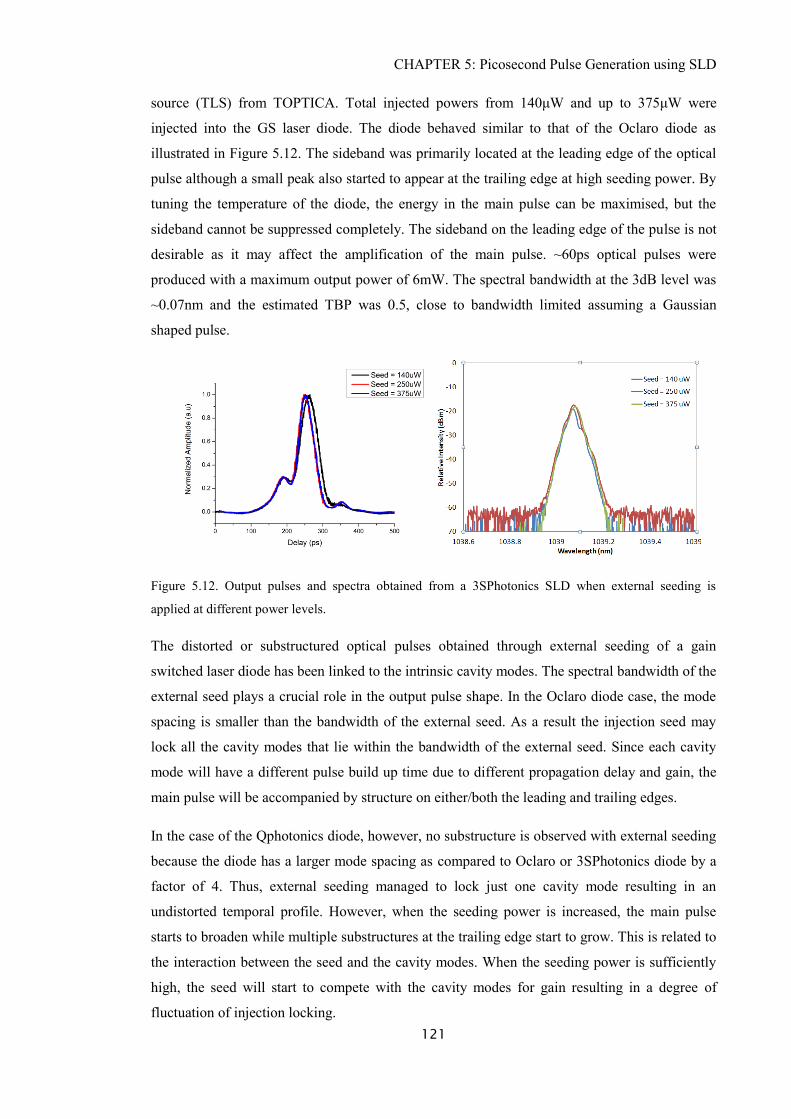
CHAPTER 5: Picosecond Pulse Generation using SLD
121
source (TLS) from TOPTICA. Total injected powers from 140μW and up to 375μW were
injected into the GS laser diode. The diode behaved similar to that of the Oclaro diode as
illustrated in Figure 5.12. The sideband was primarily located at the leading edge of the optical
pulse although a small peak also started to appear at the trailing edge at high seeding power. By
tuning the temperature of the diode, the energy in the main pulse can be maximised, but the
sideband cannot be suppressed completely. The sideband on the leading edge of the pulse is not
desirable as it may affect the amplification of the main pulse. ~60ps optical pulses were
produced with a maximum output power of 6mW. The spectral bandwidth at the 3dB level was
~0.07nm and the estimated TBP was 0.5, close to bandwidth limited assuming a Gaussian
shaped pulse.
Figure 5.12. Output pulses and spectra obtained from a 3SPhotonics SLD when external seeding is
applied at different power levels.
The distorted or substructured optical pulses obtained through external seeding of a gain
switched laser diode has been linked to the intrinsic cavity modes. The spectral bandwidth of the
external seed plays a crucial role in the output pulse shape. In the Oclaro diode case, the mode
spacing is smaller than the bandwidth of the external seed. As a result the injection seed may
lock all the cavity modes that lie within the bandwidth of the external seed. Since each cavity
mode will have a different pulse build up time due to different propagation delay and gain, the
main pulse will be accompanied by structure on either/both the leading and trailing edges.
In the case of the Qphotonics diode, however, no substructure is observed with external seeding
because the diode has a larger mode spacing as compared to Oclaro or 3SPhotonics diode by a
factor of 4. Thus, external seeding managed to lock just one cavity mode resulting in an
undistorted temporal profile. However, when the seeding power is increased, the main pulse
starts to broaden while multiple substructures at the trailing edge start to grow. This is related to
the interaction between the seed and the cavity modes. When the seeding power is sufficiently
high, the seed will start to compete with the cavity modes for gain resulting in a degree of
fluctuation of injection locking.
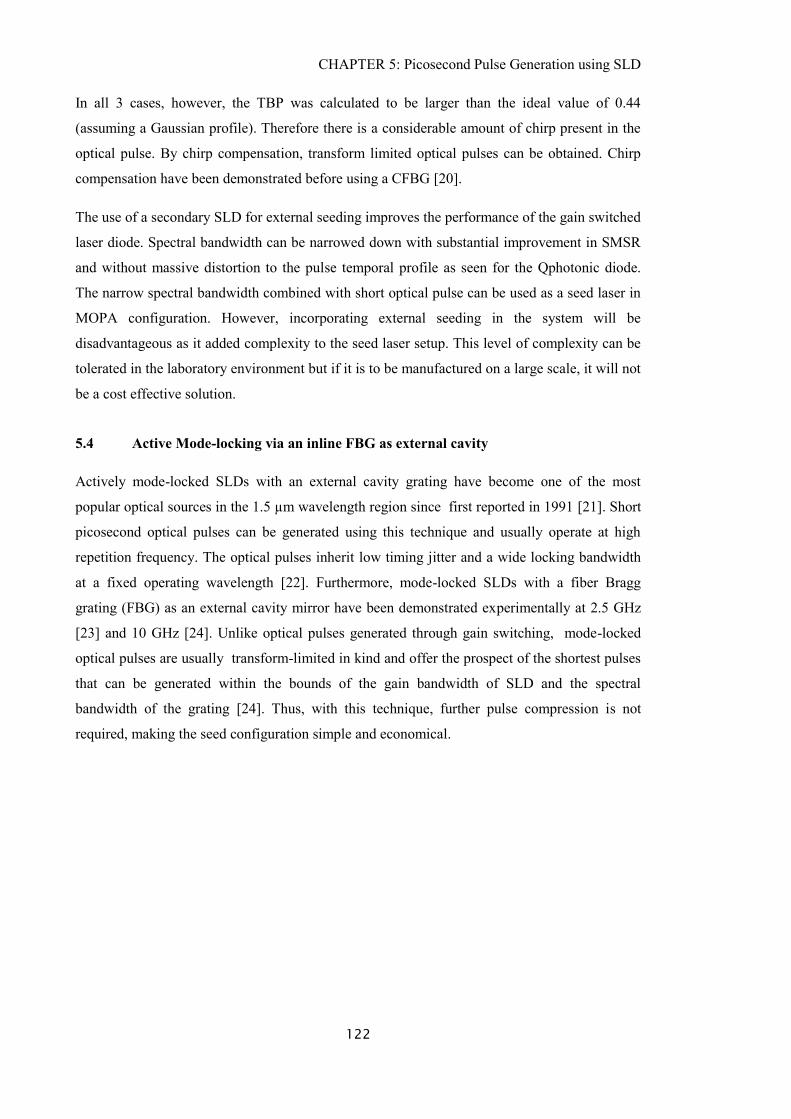
CHAPTER 5: Picosecond Pulse Generation using SLD
122
In all 3 cases, however, the TBP was calculated to be larger than the ideal value of 0.44
(assuming a Gaussian profile). Therefore there is a considerable amount of chirp present in the
optical pulse. By chirp compensation, transform limited optical pulses can be obtained. Chirp
compensation have been demonstrated before using a CFBG [20].
The use of a secondary SLD for external seeding improves the performance of the gain switched
laser diode. Spectral bandwidth can be narrowed down with substantial improvement in SMSR
and without massive distortion to the pulse temporal profile as seen for the Qphotonic diode.
The narrow spectral bandwidth combined with short optical pulse can be used as a seed laser in
MOPA configuration. However, incorporating external seeding in the system will be
disadvantageous as it added complexity to the seed laser setup. This level of complexity can be
tolerated in the laboratory environment but if it is to be manufactured on a large scale, it will not
be a cost effective solution.
5.4 Active Mode-locking via an inline FBG as external cavity
Actively mode-locked SLDs with an external cavity grating have become one of the most
popular optical sources in the 1.5 µm wavelength region since first reported in 1991 [21]. Short
picosecond optical pulses can be generated using this technique and usually operate at high
repetition frequency. The optical pulses inherit low timing jitter and a wide locking bandwidth
at a fixed operating wavelength [22]. Furthermore, mode-locked SLDs with a fiber Bragg
grating (FBG) as an external cavity mirror have been demonstrated experimentally at 2.5 GHz
[23] and 10 GHz [24]. Unlike optical pulses generated through gain switching, mode-locked
optical pulses are usually transform-limited in kind and offer the prospect of the shortest pulses
that can be generated within the bounds of the gain bandwidth of SLD and the spectral
bandwidth of the grating [24]. Thus, with this technique, further pulse compression is not
required, making the seed configuration simple and economical.
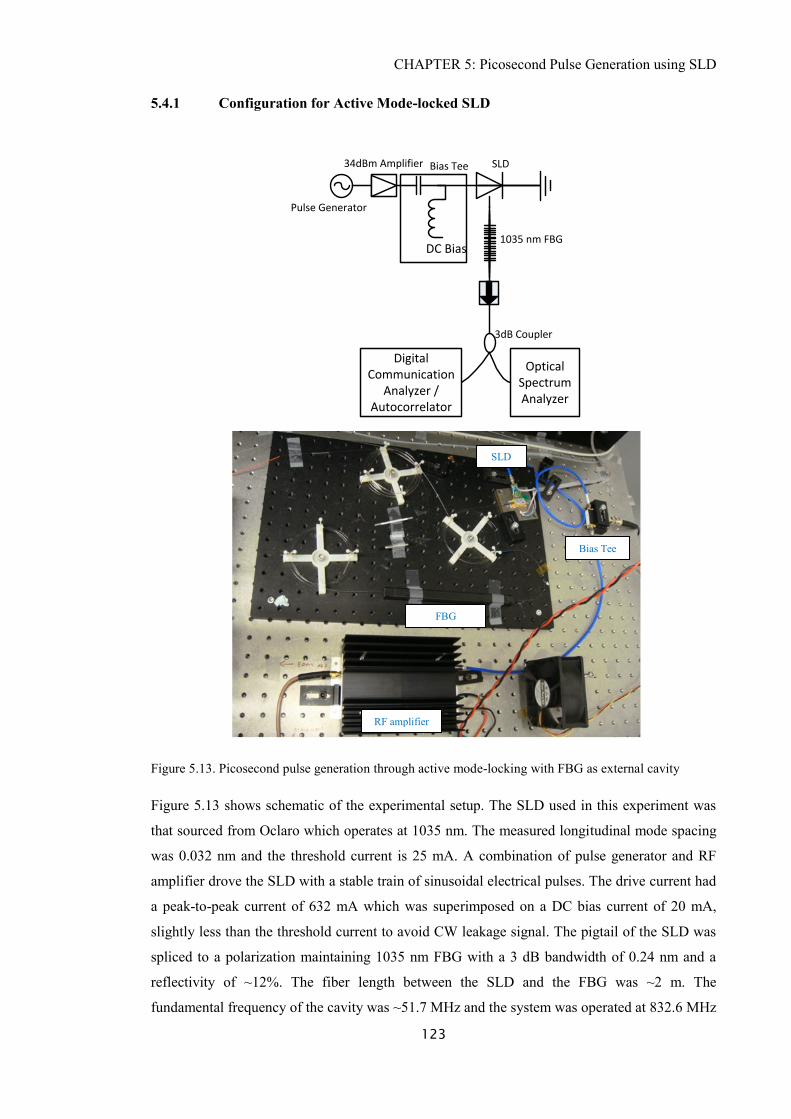
CHAPTER 5: Picosecond Pulse Generation using SLD
123
5.4.1 Configuration for Active Mode-locked SLD
Pulse Generator
Optical Spectrum Analyzer
Digital Communication
Analyzer / Autocorrelator
34dBm Amplifier Bias Tee SLD
DC Bias1035 nm FBG
3dB Coupler
Figure 5.13. Picosecond pulse generation through active mode-locking with FBG as external cavity
Figure 5.13 shows schematic of the experimental setup. The SLD used in this experiment was
that sourced from Oclaro which operates at 1035 nm. The measured longitudinal mode spacing
was 0.032 nm and the threshold current is 25 mA. A combination of pulse generator and RF
amplifier drove the SLD with a stable train of sinusoidal electrical pulses. The drive current had
a peak-to-peak current of 632 mA which was superimposed on a DC bias current of 20 mA,
slightly less than the threshold current to avoid CW leakage signal. The pigtail of the SLD was
spliced to a polarization maintaining 1035 nm FBG with a 3 dB bandwidth of 0.24 nm and a
reflectivity of ~12%. The fiber length between the SLD and the FBG was ~2 m. The
fundamental frequency of the cavity was ~51.7 MHz and the system was operated at 832.6 MHz
RF amplifier
FBG
SLD
Bias Tee
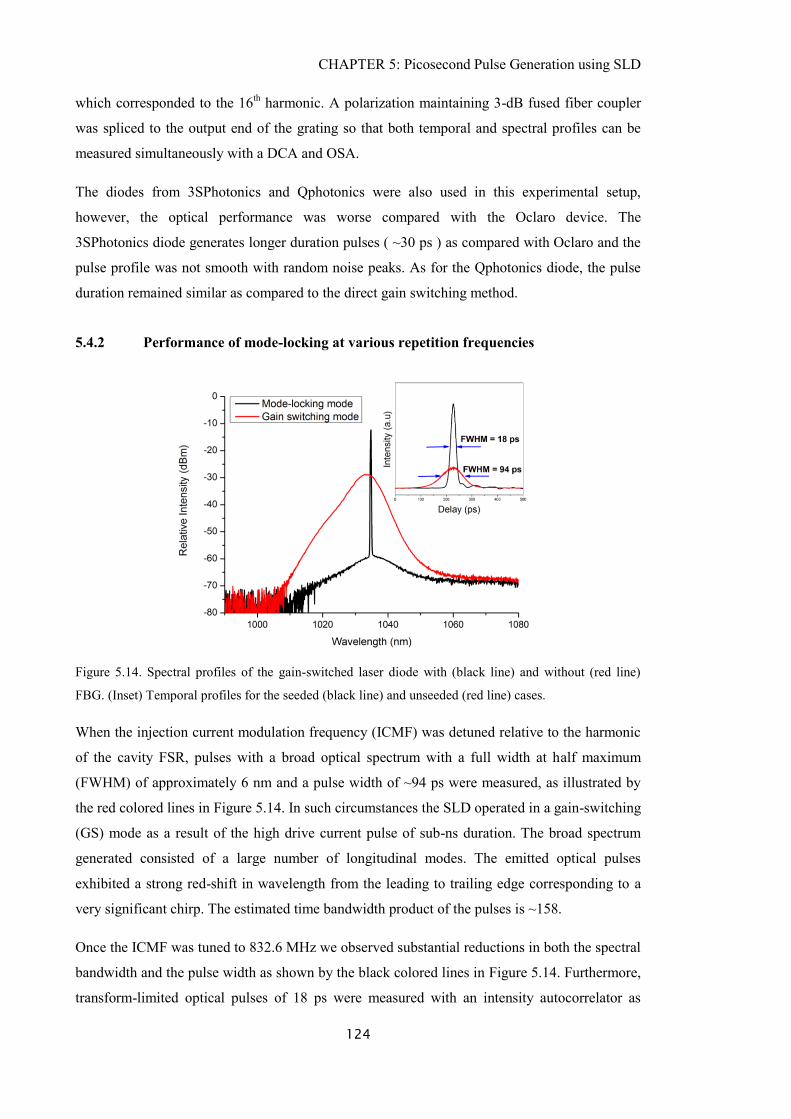
CHAPTER 5: Picosecond Pulse Generation using SLD
124
which corresponded to the 16th harmonic. A polarization maintaining 3-dB fused fiber coupler
was spliced to the output end of the grating so that both temporal and spectral profiles can be
measured simultaneously with a DCA and OSA.
The diodes from 3SPhotonics and Qphotonics were also used in this experimental setup,
however, the optical performance was worse compared with the Oclaro device. The
3SPhotonics diode generates longer duration pulses ( ~30 ps ) as compared with Oclaro and the
pulse profile was not smooth with random noise peaks. As for the Qphotonics diode, the pulse
duration remained similar as compared to the direct gain switching method.
5.4.2 Performance of mode-locking at various repetition frequencies
Figure 5.14. Spectral profiles of the gain-switched laser diode with (black line) and without (red line)
FBG. (Inset) Temporal profiles for the seeded (black line) and unseeded (red line) cases.
When the injection current modulation frequency (ICMF) was detuned relative to the harmonic
of the cavity FSR, pulses with a broad optical spectrum with a full width at half maximum
(FWHM) of approximately 6 nm and a pulse width of ~94 ps were measured, as illustrated by
the red colored lines in Figure 5.14. In such circumstances the SLD operated in a gain-switching
(GS) mode as a result of the high drive current pulse of sub-ns duration. The broad spectrum
generated consisted of a large number of longitudinal modes. The emitted optical pulses
exhibited a strong red-shift in wavelength from the leading to trailing edge corresponding to a
very significant chirp. The estimated time bandwidth product of the pulses is ~158.
Once the ICMF was tuned to 832.6 MHz we observed substantial reductions in both the spectral
bandwidth and the pulse width as shown by the black colored lines in Figure 5.14. Furthermore,
transform-limited optical pulses of 18 ps were measured with an intensity autocorrelator as
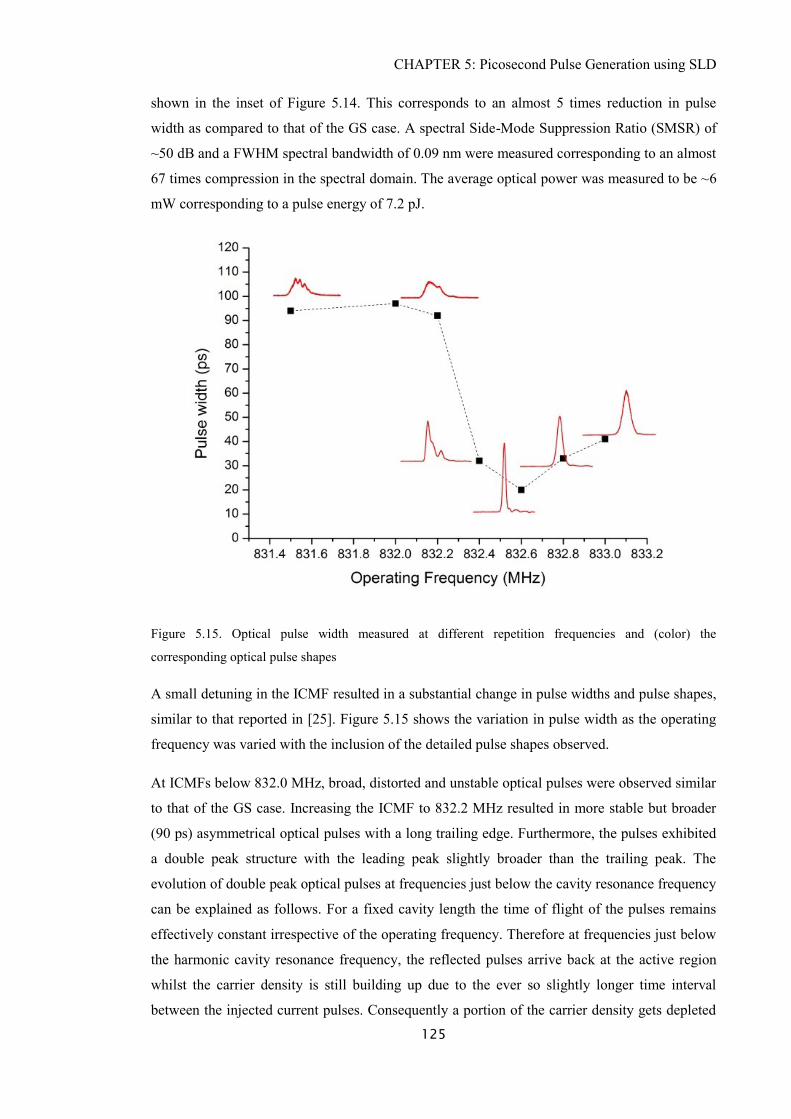
CHAPTER 5: Picosecond Pulse Generation using SLD
125
shown in the inset of Figure 5.14. This corresponds to an almost 5 times reduction in pulse
width as compared to that of the GS case. A spectral Side-Mode Suppression Ratio (SMSR) of
~50 dB and a FWHM spectral bandwidth of 0.09 nm were measured corresponding to an almost
67 times compression in the spectral domain. The average optical power was measured to be ~6
mW corresponding to a pulse energy of 7.2 pJ.
Figure 5.15. Optical pulse width measured at different repetition frequencies and (color) the
corresponding optical pulse shapes
A small detuning in the ICMF resulted in a substantial change in pulse widths and pulse shapes,
similar to that reported in [25]. Figure 5.15 shows the variation in pulse width as the operating
frequency was varied with the inclusion of the detailed pulse shapes observed.
At ICMFs below 832.0 MHz, broad, distorted and unstable optical pulses were observed similar
to that of the GS case. Increasing the ICMF to 832.2 MHz resulted in more stable but broader
(90 ps) asymmetrical optical pulses with a long trailing edge. Furthermore, the pulses exhibited
a double peak structure with the leading peak slightly broader than the trailing peak. The
evolution of double peak optical pulses at frequencies just below the cavity resonance frequency
can be explained as follows. For a fixed cavity length the time of flight of the pulses remains
effectively constant irrespective of the operating frequency. Therefore at frequencies just below
the harmonic cavity resonance frequency, the reflected pulses arrive back at the active region
whilst the carrier density is still building up due to the ever so slightly longer time interval
between the injected current pulses. Consequently a portion of the carrier density gets depleted
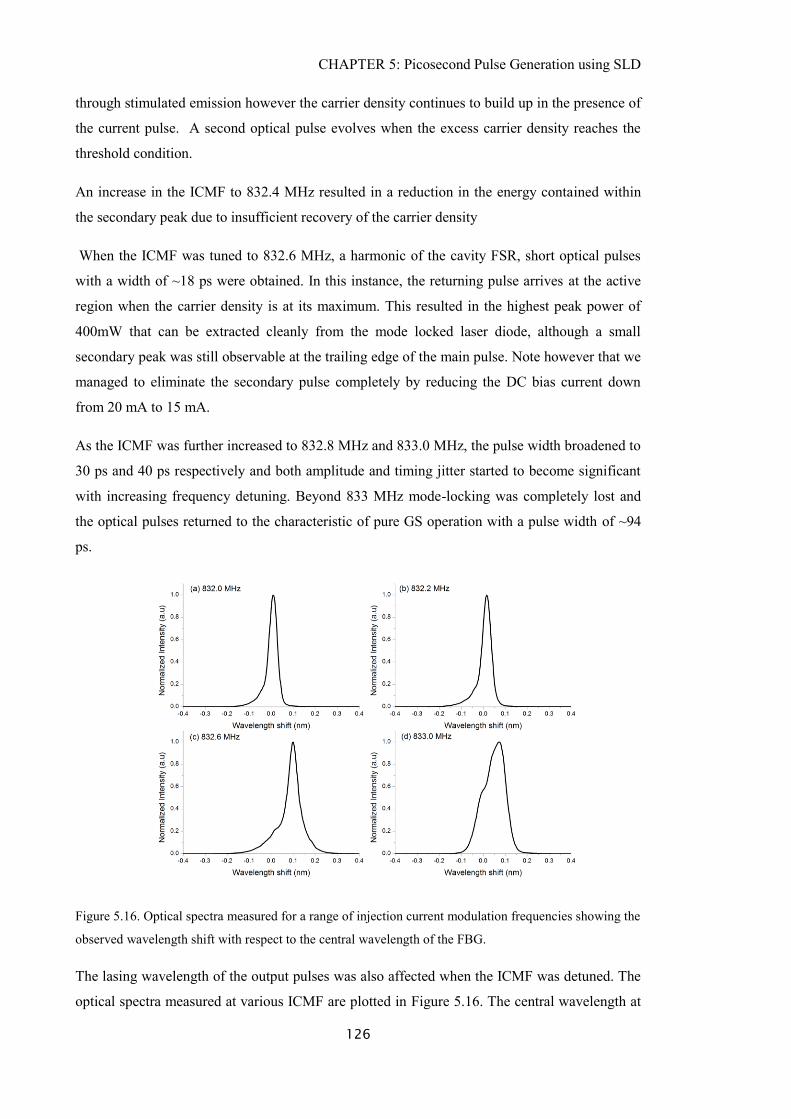
CHAPTER 5: Picosecond Pulse Generation using SLD
126
through stimulated emission however the carrier density continues to build up in the presence of
the current pulse. A second optical pulse evolves when the excess carrier density reaches the
threshold condition.
An increase in the ICMF to 832.4 MHz resulted in a reduction in the energy contained within
the secondary peak due to insufficient recovery of the carrier density
When the ICMF was tuned to 832.6 MHz, a harmonic of the cavity FSR, short optical pulses
with a width of ~18 ps were obtained. In this instance, the returning pulse arrives at the active
region when the carrier density is at its maximum. This resulted in the highest peak power of
400mW that can be extracted cleanly from the mode locked laser diode, although a small
secondary peak was still observable at the trailing edge of the main pulse. Note however that we
managed to eliminate the secondary pulse completely by reducing the DC bias current down
from 20 mA to 15 mA.
As the ICMF was further increased to 832.8 MHz and 833.0 MHz, the pulse width broadened to
30 ps and 40 ps respectively and both amplitude and timing jitter started to become significant
with increasing frequency detuning. Beyond 833 MHz mode-locking was completely lost and
the optical pulses returned to the characteristic of pure GS operation with a pulse width of ~94
ps.
Figure 5.16. Optical spectra measured for a range of injection current modulation frequencies showing the
observed wavelength shift with respect to the central wavelength of the FBG.
The lasing wavelength of the output pulses was also affected when the ICMF was detuned. The
optical spectra measured at various ICMF are plotted in Figure 5.16. The central wavelength at
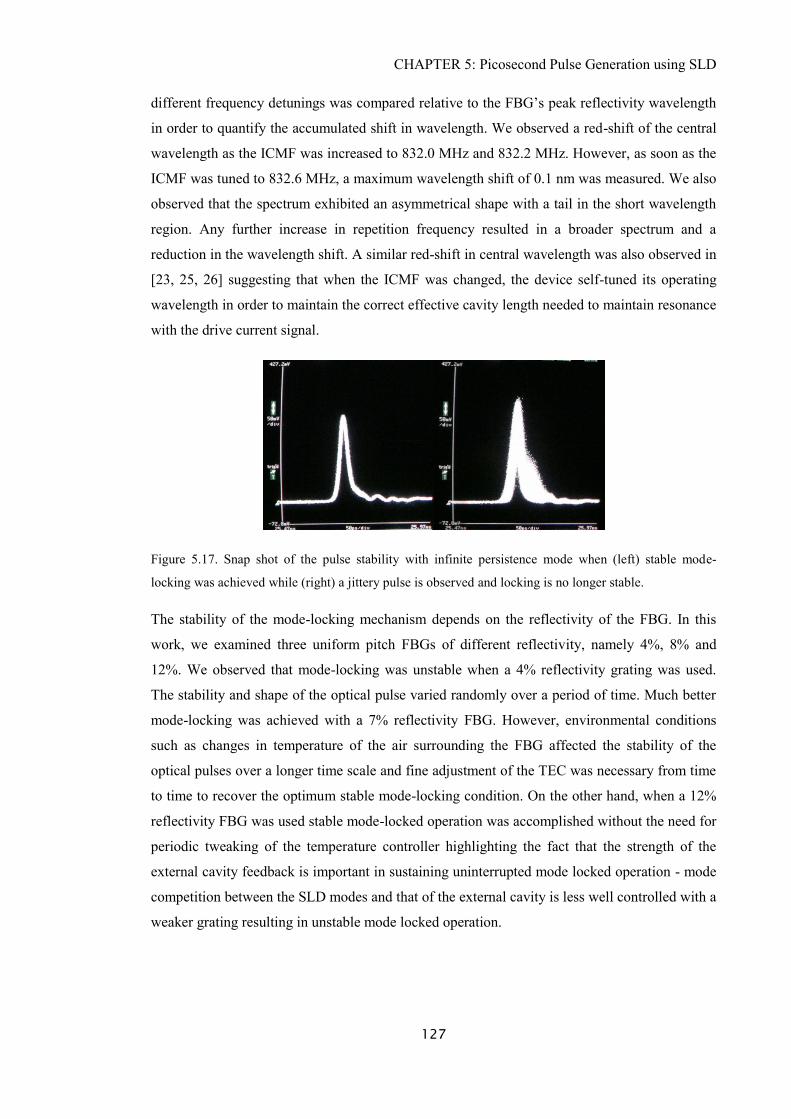
CHAPTER 5: Picosecond Pulse Generation using SLD
127
different frequency detunings was compared relative to the FBG’s peak reflectivity wavelength
in order to quantify the accumulated shift in wavelength. We observed a red-shift of the central
wavelength as the ICMF was increased to 832.0 MHz and 832.2 MHz. However, as soon as the
ICMF was tuned to 832.6 MHz, a maximum wavelength shift of 0.1 nm was measured. We also
observed that the spectrum exhibited an asymmetrical shape with a tail in the short wavelength
region. Any further increase in repetition frequency resulted in a broader spectrum and a
reduction in the wavelength shift. A similar red-shift in central wavelength was also observed in
[23, 25, 26] suggesting that when the ICMF was changed, the device self-tuned its operating
wavelength in order to maintain the correct effective cavity length needed to maintain resonance
with the drive current signal.
Figure 5.17. Snap shot of the pulse stability with infinite persistence mode when (left) stable mode-
locking was achieved while (right) a jittery pulse is observed and locking is no longer stable.
The stability of the mode-locking mechanism depends on the reflectivity of the FBG. In this
work, we examined three uniform pitch FBGs of different reflectivity, namely 4%, 8% and
12%. We observed that mode-locking was unstable when a 4% reflectivity grating was used.
The stability and shape of the optical pulse varied randomly over a period of time. Much better
mode-locking was achieved with a 7% reflectivity FBG. However, environmental conditions
such as changes in temperature of the air surrounding the FBG affected the stability of the
optical pulses over a longer time scale and fine adjustment of the TEC was necessary from time
to time to recover the optimum stable mode-locking condition. On the other hand, when a 12%
reflectivity FBG was used stable mode-locked operation was accomplished without the need for
periodic tweaking of the temperature controller highlighting the fact that the strength of the
external cavity feedback is important in sustaining uninterrupted mode locked operation - mode
competition between the SLD modes and that of the external cavity is less well controlled with a
weaker grating resulting in unstable mode locked operation.
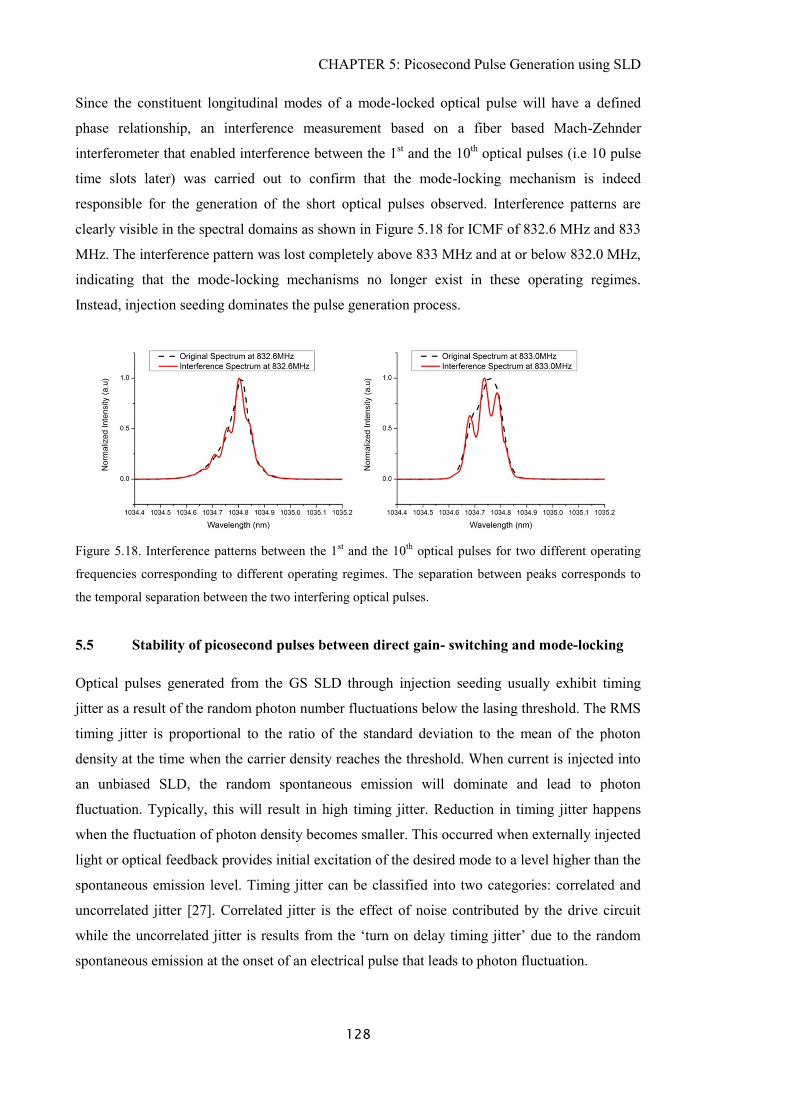
CHAPTER 5: Picosecond Pulse Generation using SLD
128
Since the constituent longitudinal modes of a mode-locked optical pulse will have a defined
phase relationship, an interference measurement based on a fiber based Mach-Zehnder
interferometer that enabled interference between the 1st and the 10
th optical pulses (i.e 10 pulse
time slots later) was carried out to confirm that the mode-locking mechanism is indeed
responsible for the generation of the short optical pulses observed. Interference patterns are
clearly visible in the spectral domains as shown in Figure 5.18 for ICMF of 832.6 MHz and 833
MHz. The interference pattern was lost completely above 833 MHz and at or below 832.0 MHz,
indicating that the mode-locking mechanisms no longer exist in these operating regimes.
Instead, injection seeding dominates the pulse generation process.
Figure 5.18. Interference patterns between the 1st and the 10
th optical pulses for two different operating
frequencies corresponding to different operating regimes. The separation between peaks corresponds to
the temporal separation between the two interfering optical pulses.
5.5 Stability of picosecond pulses between direct gain- switching and mode-locking
Optical pulses generated from the GS SLD through injection seeding usually exhibit timing
jitter as a result of the random photon number fluctuations below the lasing threshold. The RMS
timing jitter is proportional to the ratio of the standard deviation to the mean of the photon
density at the time when the carrier density reaches the threshold. When current is injected into
an unbiased SLD, the random spontaneous emission will dominate and lead to photon
fluctuation. Typically, this will result in high timing jitter. Reduction in timing jitter happens
when the fluctuation of photon density becomes smaller. This occurred when externally injected
light or optical feedback provides initial excitation of the desired mode to a level higher than the
spontaneous emission level. Timing jitter can be classified into two categories: correlated and
uncorrelated jitter [27]. Correlated jitter is the effect of noise contributed by the drive circuit
while the uncorrelated jitter is results from the ‘turn on delay timing jitter’ due to the random
spontaneous emission at the onset of an electrical pulse that leads to photon fluctuation.
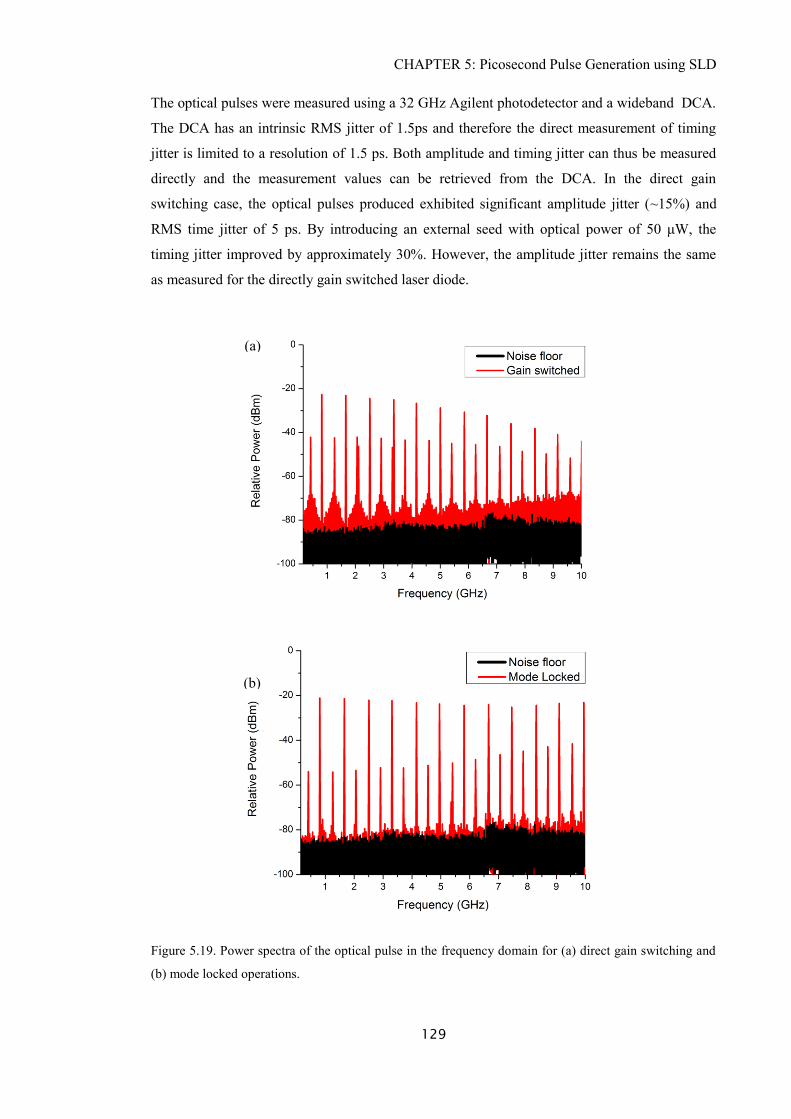
CHAPTER 5: Picosecond Pulse Generation using SLD
129
The optical pulses were measured using a 32 GHz Agilent photodetector and a wideband DCA.
The DCA has an intrinsic RMS jitter of 1.5ps and therefore the direct measurement of timing
jitter is limited to a resolution of 1.5 ps. Both amplitude and timing jitter can thus be measured
directly and the measurement values can be retrieved from the DCA. In the direct gain
switching case, the optical pulses produced exhibited significant amplitude jitter (~15%) and
RMS time jitter of 5 ps. By introducing an external seed with optical power of 50 μW, the
timing jitter improved by approximately 30%. However, the amplitude jitter remains the same
as measured for the directly gain switched laser diode.
Figure 5.19. Power spectra of the optical pulse in the frequency domain for (a) direct gain switching and
(b) mode locked operations.
(a)
(b)
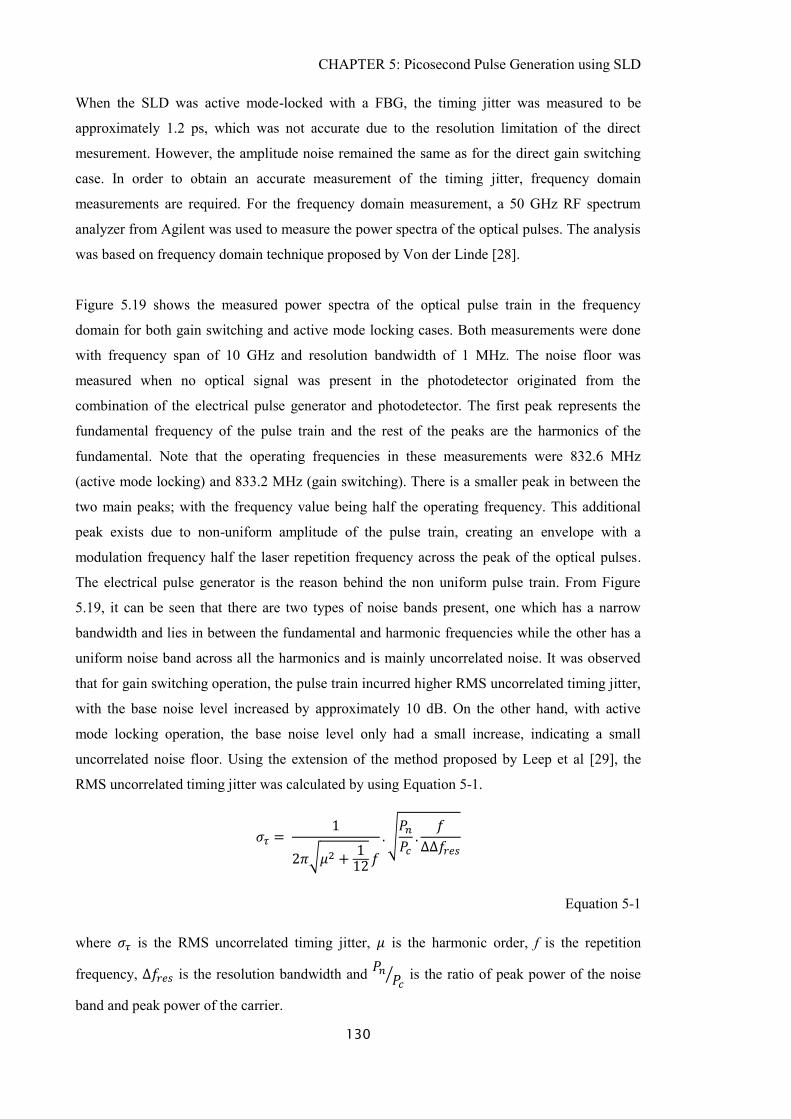
CHAPTER 5: Picosecond Pulse Generation using SLD
130
When the SLD was active mode-locked with a FBG, the timing jitter was measured to be
approximately 1.2 ps, which was not accurate due to the resolution limitation of the direct
mesurement. However, the amplitude noise remained the same as for the direct gain switching
case. In order to obtain an accurate measurement of the timing jitter, frequency domain
measurements are required. For the frequency domain measurement, a 50 GHz RF spectrum
analyzer from Agilent was used to measure the power spectra of the optical pulses. The analysis
was based on frequency domain technique proposed by Von der Linde [28].
Figure 5.19 shows the measured power spectra of the optical pulse train in the frequency
domain for both gain switching and active mode locking cases. Both measurements were done
with frequency span of 10 GHz and resolution bandwidth of 1 MHz. The noise floor was
measured when no optical signal was present in the photodetector originated from the
combination of the electrical pulse generator and photodetector. The first peak represents the
fundamental frequency of the pulse train and the rest of the peaks are the harmonics of the
fundamental. Note that the operating frequencies in these measurements were 832.6 MHz
(active mode locking) and 833.2 MHz (gain switching). There is a smaller peak in between the
two main peaks; with the frequency value being half the operating frequency. This additional
peak exists due to non-uniform amplitude of the pulse train, creating an envelope with a
modulation frequency half the laser repetition frequency across the peak of the optical pulses.
The electrical pulse generator is the reason behind the non uniform pulse train. From Figure
5.19, it can be seen that there are two types of noise bands present, one which has a narrow
bandwidth and lies in between the fundamental and harmonic frequencies while the other has a
uniform noise band across all the harmonics and is mainly uncorrelated noise. It was observed
that for gain switching operation, the pulse train incurred higher RMS uncorrelated timing jitter,
with the base noise level increased by approximately 10 dB. On the other hand, with active
mode locking operation, the base noise level only had a small increase, indicating a small
uncorrelated noise floor. Using the extension of the method proposed by Leep et al [29], the
RMS uncorrelated timing jitter was calculated by using Equation 5-1.
Equation 5-1
where is the RMS uncorrelated timing jitter, is the harmonic order, f is the repetition
frequency, is the resolution bandwidth and
is the ratio of peak power of the noise
band and peak power of the carrier.
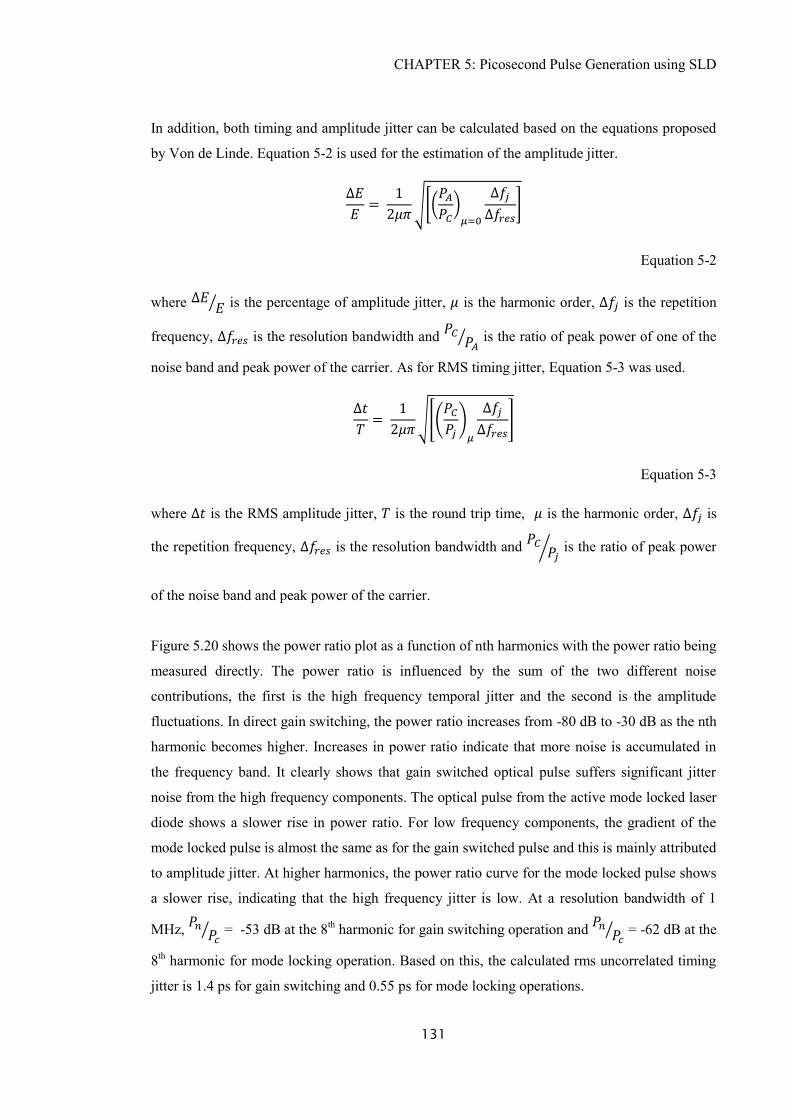
CHAPTER 5: Picosecond Pulse Generation using SLD
131
In addition, both timing and amplitude jitter can be calculated based on the equations proposed
by Von de Linde. Equation 5-2 is used for the estimation of the amplitude jitter.
Equation 5-2
where is the percentage of amplitude jitter, is the harmonic order, is the repetition
frequency, is the resolution bandwidth and
is the ratio of peak power of one of the
noise band and peak power of the carrier. As for RMS timing jitter, Equation 5-3 was used.
Equation 5-3
where is the RMS amplitude jitter, is the round trip time, is the harmonic order, is
the repetition frequency, is the resolution bandwidth and
is the ratio of peak power
of the noise band and peak power of the carrier.
Figure 5.20 shows the power ratio plot as a function of nth harmonics with the power ratio being
measured directly. The power ratio is influenced by the sum of the two different noise
contributions, the first is the high frequency temporal jitter and the second is the amplitude
fluctuations. In direct gain switching, the power ratio increases from -80 dB to -30 dB as the nth
harmonic becomes higher. Increases in power ratio indicate that more noise is accumulated in
the frequency band. It clearly shows that gain switched optical pulse suffers significant jitter
noise from the high frequency components. The optical pulse from the active mode locked laser
diode shows a slower rise in power ratio. For low frequency components, the gradient of the
mode locked pulse is almost the same as for the gain switched pulse and this is mainly attributed
to amplitude jitter. At higher harmonics, the power ratio curve for the mode locked pulse shows
a slower rise, indicating that the high frequency jitter is low. At a resolution bandwidth of 1
MHz,
= -53 dB at the 8
th harmonic for gain switching operation and
= -62 dB at the
8th harmonic for mode locking operation. Based on this, the calculated rms uncorrelated timing
jitter is 1.4 ps for gain switching and 0.55 ps for mode locking operations.
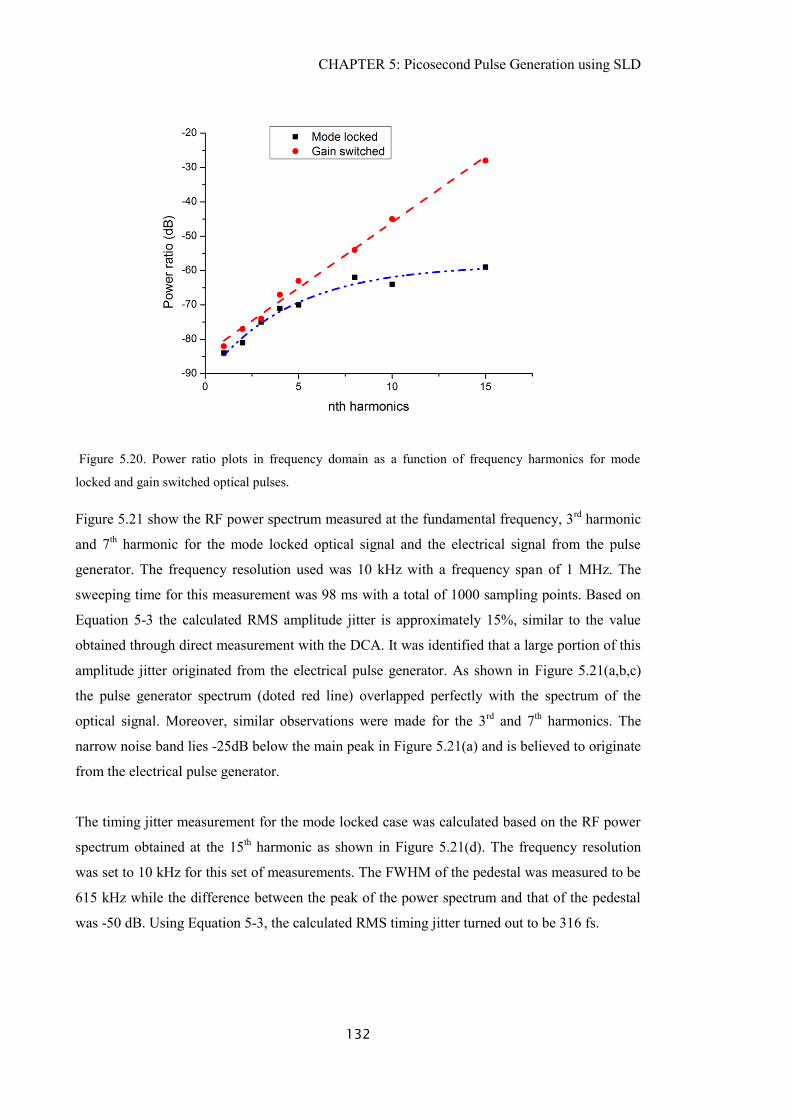
CHAPTER 5: Picosecond Pulse Generation using SLD
132
Figure 5.20. Power ratio plots in frequency domain as a function of frequency harmonics for mode
locked and gain switched optical pulses.
Figure 5.21 show the RF power spectrum measured at the fundamental frequency, 3rd
harmonic
and 7th harmonic for the mode locked optical signal and the electrical signal from the pulse
generator. The frequency resolution used was 10 kHz with a frequency span of 1 MHz. The
sweeping time for this measurement was 98 ms with a total of 1000 sampling points. Based on
Equation 5-3 the calculated RMS amplitude jitter is approximately 15%, similar to the value
obtained through direct measurement with the DCA. It was identified that a large portion of this
amplitude jitter originated from the electrical pulse generator. As shown in Figure 5.21(a,b,c)
the pulse generator spectrum (doted red line) overlapped perfectly with the spectrum of the
optical signal. Moreover, similar observations were made for the 3rd
and 7th harmonics. The
narrow noise band lies -25dB below the main peak in Figure 5.21(a) and is believed to originate
from the electrical pulse generator.
The timing jitter measurement for the mode locked case was calculated based on the RF power
spectrum obtained at the 15th harmonic as shown in Figure 5.21(d). The frequency resolution
was set to 10 kHz for this set of measurements. The FWHM of the pedestal was measured to be
615 kHz while the difference between the peak of the power spectrum and that of the pedestal
was -50 dB. Using Equation 5-3, the calculated RMS timing jitter turned out to be 316 fs.
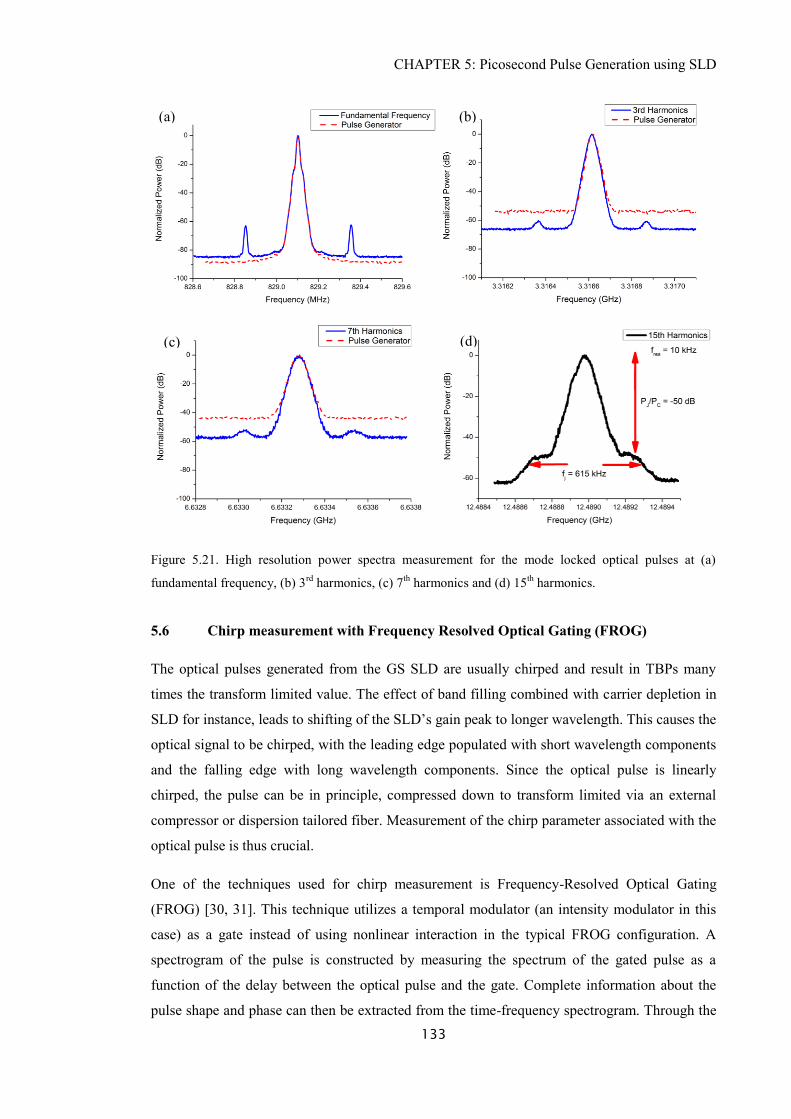
CHAPTER 5: Picosecond Pulse Generation using SLD
133
Figure 5.21. High resolution power spectra measurement for the mode locked optical pulses at (a)
fundamental frequency, (b) 3rd
harmonics, (c) 7th
harmonics and (d) 15th harmonics.
5.6 Chirp measurement with Frequency Resolved Optical Gating (FROG)
The optical pulses generated from the GS SLD are usually chirped and result in TBPs many
times the transform limited value. The effect of band filling combined with carrier depletion in
SLD for instance, leads to shifting of the SLD’s gain peak to longer wavelength. This causes the
optical signal to be chirped, with the leading edge populated with short wavelength components
and the falling edge with long wavelength components. Since the optical pulse is linearly
chirped, the pulse can be in principle, compressed down to transform limited via an external
compressor or dispersion tailored fiber. Measurement of the chirp parameter associated with the
optical pulse is thus crucial.
One of the techniques used for chirp measurement is Frequency-Resolved Optical Gating
(FROG) [30, 31]. This technique utilizes a temporal modulator (an intensity modulator in this
case) as a gate instead of using nonlinear interaction in the typical FROG configuration. A
spectrogram of the pulse is constructed by measuring the spectrum of the gated pulse as a
function of the delay between the optical pulse and the gate. Complete information about the
pulse shape and phase can then be extracted from the time-frequency spectrogram. Through the
(a)
(c)
(b)
(d)
CHAPTER 5: Picosecond Pulse Generation using SLD
134
use of a broadband intensity modulator, it is possible to characterise both short and long optical
pulses. Furthermore, the entire setup is fully fiberised and high delay resolution can be achieved
with an electronic delay generator.
Figure 5.22. Experimental setup for FROG measurement via the use of EOM.
The detailed setup for the FROG measurement using an EOM (intensity modulator) is shown in
Figure 5.22. A 10dB optical coupler was spliced to the seed, with the 90% output port fed to a
fiberised EOM. The EOM was driven by a square waveform, generated from a secondary pulse
generator. The master pulse generator triggered the secondary unit as well as modulating the
SLD. In order to have a full extinction of the EOM, the amplitude of the square waveform was
set to 5V. The square wave generator with the ability to vary both pulse duration and output
delay was controlled directly using a PC. The gate width used in this experiment was 100 ps,
and was limited by the bandwidth of the EOM. The delay step used was 1ps. The output from
the EOM was fed into an OSA with resolution set to 0.01 nm. At every delay step, a spectral
trace was taken and by overlapping all these traces the time-frequency spectrogram can be
produced with a spectrogram sample shown in Figure 5.23. Numerical retrieval was carried out
on the spectrogram using the blind deconvolution code developed at the ORC, University of
Southampton [32, 33].
GS / ML
SLD
EOM OSA
PC Pulse
Generator
(Slave)
Pulse
Generator
(Master)
Adjust
delay Trigger
Drive EOM DC Bias
Scanned
Spectrogram
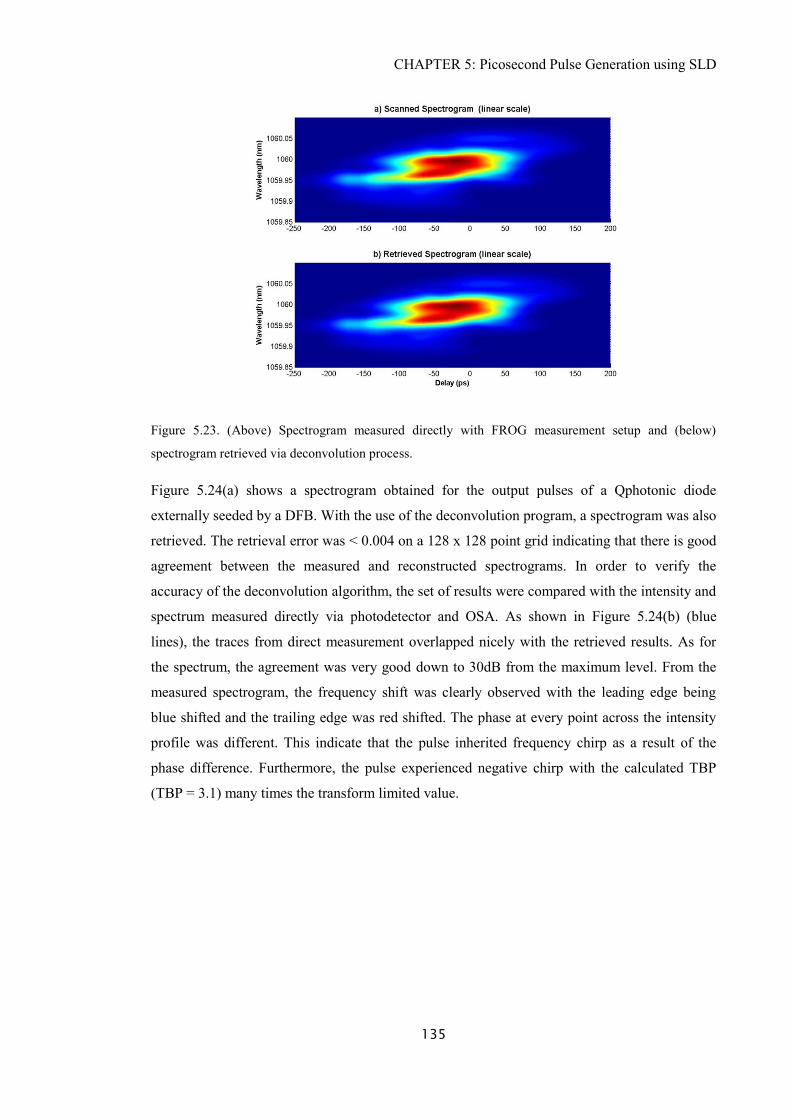
CHAPTER 5: Picosecond Pulse Generation using SLD
135
Figure 5.23. (Above) Spectrogram measured directly with FROG measurement setup and (below)
spectrogram retrieved via deconvolution process.
Figure 5.24(a) shows a spectrogram obtained for the output pulses of a Qphotonic diode
externally seeded by a DFB. With the use of the deconvolution program, a spectrogram was also
retrieved. The retrieval error was < 0.004 on a 128 x 128 point grid indicating that there is good
agreement between the measured and reconstructed spectrograms. In order to verify the
accuracy of the deconvolution algorithm, the set of results were compared with the intensity and
spectrum measured directly via photodetector and OSA. As shown in Figure 5.24(b) (blue
lines), the traces from direct measurement overlapped nicely with the retrieved results. As for
the spectrum, the agreement was very good down to 30dB from the maximum level. From the
measured spectrogram, the frequency shift was clearly observed with the leading edge being
blue shifted and the trailing edge was red shifted. The phase at every point across the intensity
profile was different. This indicate that the pulse inherited frequency chirp as a result of the
phase difference. Furthermore, the pulse experienced negative chirp with the calculated TBP
(TBP = 3.1) many times the transform limited value.
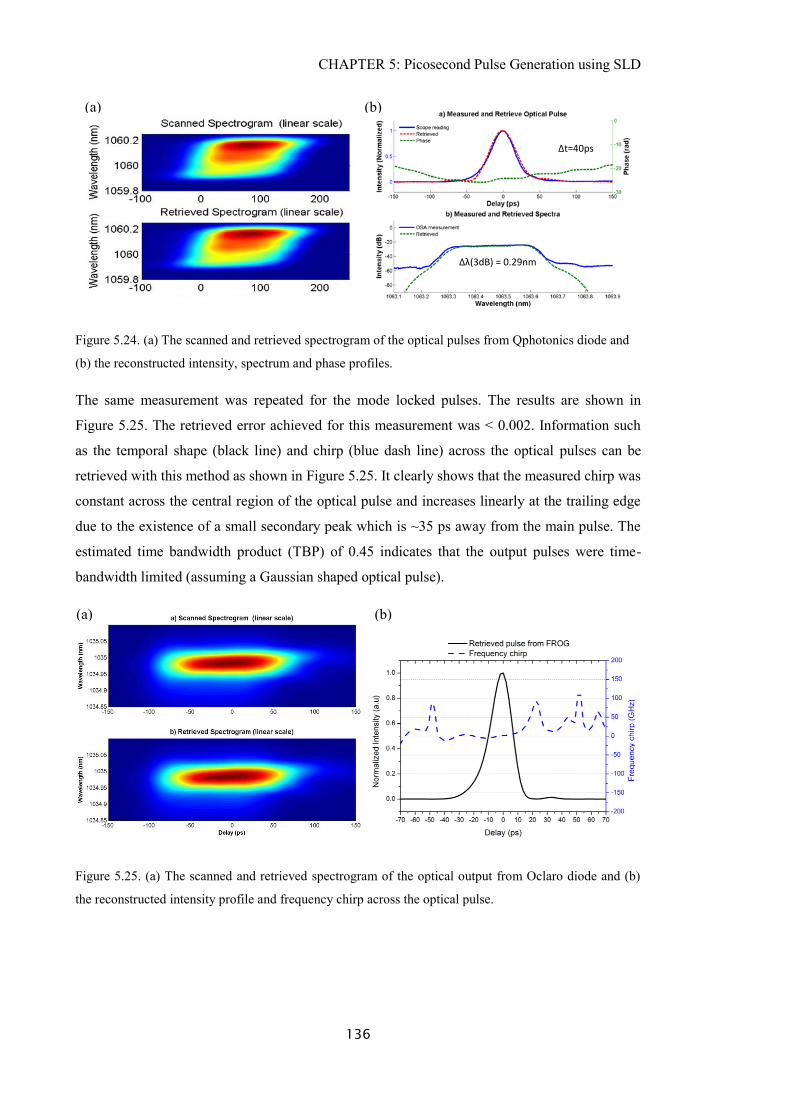
CHAPTER 5: Picosecond Pulse Generation using SLD
136
Figure 5.24. (a) The scanned and retrieved spectrogram of the optical pulses from Qphotonics diode and
(b) the reconstructed intensity, spectrum and phase profiles.
The same measurement was repeated for the mode locked pulses. The results are shown in
Figure 5.25. The retrieved error achieved for this measurement was < 0.002. Information such
as the temporal shape (black line) and chirp (blue dash line) across the optical pulses can be
retrieved with this method as shown in Figure 5.25. It clearly shows that the measured chirp was
constant across the central region of the optical pulse and increases linearly at the trailing edge
due to the existence of a small secondary peak which is ~35 ps away from the main pulse. The
estimated time bandwidth product (TBP) of 0.45 indicates that the output pulses were time-
bandwidth limited (assuming a Gaussian shaped optical pulse).
Figure 5.25. (a) The scanned and retrieved spectrogram of the optical output from Oclaro diode and (b)
the reconstructed intensity profile and frequency chirp across the optical pulse.
Δλ(3dB) = 0.29nm
Δt=40ps
(a) (b)
(a) (b)
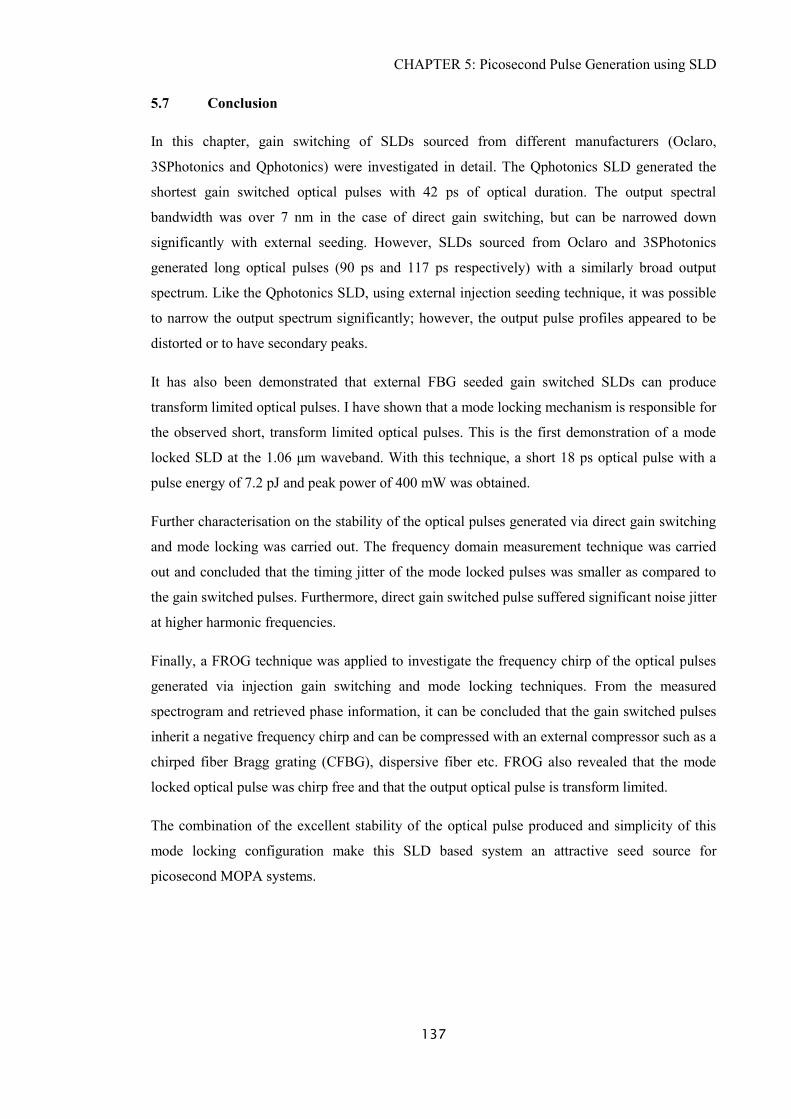
CHAPTER 5: Picosecond Pulse Generation using SLD
137
5.7 Conclusion
In this chapter, gain switching of SLDs sourced from different manufacturers (Oclaro,
3SPhotonics and Qphotonics) were investigated in detail. The Qphotonics SLD generated the
shortest gain switched optical pulses with 42 ps of optical duration. The output spectral
bandwidth was over 7 nm in the case of direct gain switching, but can be narrowed down
significantly with external seeding. However, SLDs sourced from Oclaro and 3SPhotonics
generated long optical pulses (90 ps and 117 ps respectively) with a similarly broad output
spectrum. Like the Qphotonics SLD, using external injection seeding technique, it was possible
to narrow the output spectrum significantly; however, the output pulse profiles appeared to be
distorted or to have secondary peaks.
It has also been demonstrated that external FBG seeded gain switched SLDs can produce
transform limited optical pulses. I have shown that a mode locking mechanism is responsible for
the observed short, transform limited optical pulses. This is the first demonstration of a mode
locked SLD at the 1.06 μm waveband. With this technique, a short 18 ps optical pulse with a
pulse energy of 7.2 pJ and peak power of 400 mW was obtained.
Further characterisation on the stability of the optical pulses generated via direct gain switching
and mode locking was carried out. The frequency domain measurement technique was carried
out and concluded that the timing jitter of the mode locked pulses was smaller as compared to
the gain switched pulses. Furthermore, direct gain switched pulse suffered significant noise jitter
at higher harmonic frequencies.
Finally, a FROG technique was applied to investigate the frequency chirp of the optical pulses
generated via injection gain switching and mode locking techniques. From the measured
spectrogram and retrieved phase information, it can be concluded that the gain switched pulses
inherit a negative frequency chirp and can be compressed with an external compressor such as a
chirped fiber Bragg grating (CFBG), dispersive fiber etc. FROG also revealed that the mode
locked optical pulse was chirp free and that the output optical pulse is transform limited.
The combination of the excellent stability of the optical pulse produced and simplicity of this
mode locking configuration make this SLD based system an attractive seed source for
picosecond MOPA systems.
CHAPTER 5: Picosecond Pulse Generation using SLD
138
5.8 References
1. F. Kienle, P. S. Teh, D. Lin, S.-u. Alam, J. H. V. Price, D. C. Hanna, D. J. Richardson,
and D. P. Shepherd, "High-power, high repetition-rate, green-pumped, picosecond LBO
optical parametric oscillator," Opt. Express 20, 7008-7014 (2012).
2. A. Ancona, S. Döring, C. Jauregui, F. Röser, J. Limpert, S. Nolte, and A. Tünnermann,
"Femtosecond and picosecond laser drilling of metals at high repetition rates and average
powers," Opt. Lett. 34, 3304-3306 (2009).
3. K. K. Chen, S.-u. Alam, J. H. V. Price, J. R. Hayes, D. Lin, A. Malinowski, C. Codemard,
D. Ghosh, M. Pal, S. K. Bhadra, and D. J. Richardson, "Picosecond fiber MOPA pumped
supercontinuum source with 39 W output power," Opt. Express 18, 5426-5432 (2010).
4. J. Yoonchan, J. Nilsson, J. K. Sahu, D. N. Payne, R. Horley, L. M. B. Hickey, and P. W.
Turner, "Power Scaling of Single-Frequency Ytterbium-Doped Fiber Master-Oscillator
Power-Amplifier Sources up to 500 W," Selected Topics in Quantum Electronics, IEEE
Journal of 13, 546-551 (2007).
5. H. Ito, H. Yokoyama, S. Murata, and H. Inaba, "Picosecond optical pulse generation from
an r.f. modulated AlGaAs d.h. diode laser," Electronics Letters 15, 738-740 (1979).
6. A. Piper, A. Malinowski, B. C. Thomsen, D. J. Richardson, L. M. B. Hickey, and M. N.
Zervas, "11.1 W average power, 20 ps pulses at 1 GHz repetition rate from a fiber-
amplified gain-switched 1.06 μm Fabry-Perot laser diode," in Lasers and Electro-Optics,
2005. (CLEO). Conference on(2005), pp. 1141-1143 Vol. 1142.
7. K. K. Chen, J. H. V. Price, S.-u. Alam, J. R. Hayes, D. Lin, A. Malinowski, and D. J.
Richardson, "Polarisation maintaining 100W Yb-fiber MOPA producing µJ pulses
tunable in duration from 1 to 21 ps," Opt. Express 18, 14385-14394 (2010).
8. K. A. Ahmed, H. F. Liu, N. Onodera, P. Lee, R. S. Tucker, and Y. Ogawa, "Nearly
transform-limited pulse (3.6 ps) generation from gain-swtiched 1-55 um distributed
feeback laser by using fibre compression technique," Electronics Letters 29, 54 (1993).
9. C. de Dios, and H. Lamela, "Improvements to Long-Duration Low-Power Gain-
Switching Diode Laser Pulses Using a Highly Nonlinear Optical Loop Mirror: Theory
and Experiment," Lightwave Technology, Journal of 29, 700-707 (2011).
10. A. Consoli, and I. Esquivias, "Pulse shortening of gain switched single mode
semiconductor lasers using a variable delay interferometer," Opt. Express 20, 22481-
22489 (2012).
11. D.-S. Seo, H.-F. Liu, D. Y. Kim, and D. D. Sampson, "Injection power and wavelength
dependence of an external-seeded gain-switched Fabry--Perot laser," Applied Physics
Letters 67, 1503-1505 (1995).
CHAPTER 5: Picosecond Pulse Generation using SLD
139
12. P. Downey, J. E. Bowers, R. Tucker, and E. Agyekum, "Picosecond dynamics of a gain-
switched InGaAsP laser," Quantum Electronics, IEEE Journal of 23, 1039-1047 (1987).
13. G. J. Aspin, J. E. Carroll, and R. G. Plumb, "The effect of cavity length on picosecond
pulse generation with highly rf modulated AlGaAs double heterostructure lasers,"
Applied Physics Letters 39, 860-861 (1981).
14. R. J. Helkey, and Y. Arakawa, "Cavity optimization for minimum pulsewidth of gain-
switched semiconductor lasers," Photonics Technology Letters, IEEE 7, 272-274 (1995).
15. K. Y. Lau, "Gain switching of semiconductor injection lasers," Applied Physics Letters
52, 257-259 (1988).
16. L. Pao-Lo, C. Lin, I. P. Kaminow, and J. J. Hsieh, "Picosecond pulse generation from
InGaAsP lasers at 1.25 and 1.3 μm by electrical pulse pumping," Quantum Electronics,
IEEE Journal of 17, 671-674 (1981).
17. M. Osinski, and M. J. Adams, "Picosecond pulse analysis of gain-switched 1.55 µm
InGaAsP laser," Quantum Electronics, IEEE Journal of 21, 1929-1936 (1985).
18. K. Wada, H. Yoshioka, J. Zhu, T. Matsuyama, and H. Horinaka, "Simple form of
multimode laser diode rate equations incorporating the band filling effect," Opt. Express
19, 3019-3036 (2011).
19. J. Lawrence, and D. Kane, "Injection locking suppression of coherence collapse in a
diode laser with optical feedback," Optics communications 167, 273-282 (1999).
20. A. Piper, A. Malinowski, B. C. Thomsen, D. J. Richardson, L. M. Hickey, and M. N.
Zervas, "11.1 W average power, 20 ps pulses at 1 GHz repetition rate from a fiber-
amplified gain-switched 1.06 µm Fabry-Perot laser diode," in Conference on Lasers and
Electro-Optics(Optical Society of America, 2005), p. CTuCC3.
21. P. A. Morton, R. Adar, R. C. Kistler, C. H. Henry, T. Tanbun-Ek, R. A. Logan, D. L.
Coblentz, A. M. Sergent, and K. W. Wecht, "Hybrid soliton pulse source using a silica
waveguide external cavity and Bragg reflector," Applied Physics Letters 59, 2944-2946
(1991).
22. Z. Ahmed, L. Zhai, A. J. Lowery, N. Onodera, and R. Tucker, "Locking bandwidth of
actively mode-locked semiconductor lasers," Quantum Electronics, IEEE Journal of 29,
1714-1721 (1993).
23. P. A. Morton, V. Mizrahi, P. A. Andrekson, T. Tanbun-Ek, R. A. Logan, P. Lemaire, D.
L. Coblentz, A. M. Sergent, K. W. Wecht, and P. F. Sciortino, Jr., "Mode-locked hybrid
soliton pulse source with extremely wide operating frequency range," Photonics
Technology Letters, IEEE 5, 28-31 (1993).
24. R. Paoletti, D. Bertone, R. Fang, G. Magnetti, M. Meliga, G. Meneghini, G. Morello, G.
Rossi, L. Tallone, and M. Scofet, "Repetition rate, using a mode-locked hybrid distributed
CHAPTER 5: Picosecond Pulse Generation using SLD
140
Bragg reflector (ML-HDBR) laser source," Photonics Technology Letters, IEEE 12, 245-
247 (2000).
25. A. J. Lowery, N. Onodera, and R. Tucker, "Stability and spectral behavior of grating-
controlled actively mode-locked lasers," Quantum Electronics, IEEE Journal of 27, 2422-
2430 (1991).
26. N. Dogru, "Effect of Grating Parameters on Mode-Locked External Cavity Lasers,"
Selected Topics in Quantum Electronics, IEEE Journal of 15, 644-652 (2009).
27. M. Jinno, "Correlated and uncorrelated timing jitter in gain-switched laser diodes,"
Photonics Technology Letters, IEEE 5, 1140-1143 (1993).
28. D. Linde, "Characterization of the noise in continuously operating mode-locked lasers,"
Appl. Phys. B 39, 201-217 (1986).
29. D. A. Leep, and D. A. Holm, "Spectral measurement of timing jitter in gain switched
semiconductor lasers," Applied Physics Letters 60, 2451-2453 (1992).
30. C. Dorrer, and I. Kang, "Simultaneous temporal characterization of telecommunication
optical pulses and modulators by use of spectrograms," Optics Letters 27, 1315-1317
(2002).
31. K. T. Vu, A. Malinowski, M. A. F. Roelens, M. Ibsen, P. Petropoulos, and D. J.
Richardson, "Full Characterisation of Low Power Picosecond Pulses From a Gain-
Switched Diode Laser Using Electro-Optic Modulation Based FROG," (Optical Society
of America, 2007), p. CFF4.
32. M. A. Roelens, B. C. Thomsen, and D. J. Richardson, "Multi-wavelength EAM based
optical sampling for performance monitoring in high bit-rate systems," (2004).
33. M. A. Roelens, M. Forzati, A. Djupsjöbacka, P. Petropoulos, A. Berntson, and D. J.
Richardson, "Linear frequency resolved optical gating as a line monitoring tool," in
Optical Fiber Communication Conference(Optical Society of America, 2006), p. OWN2.
CHAPTER 6: High Power and High Energy Picosecond Fiber Sources
141
Chapter 6. High Power and High Energy
Picosecond Fiber Sources
After investigating and analyzing the best solution for generating stable pulses in Chapter 5, the
seed laser will be amplified in a chain of fiber amplifiers to investigate the power scaling
capability. This chapter will present the work which explicitly targets a high energy and high
average power picosecond fiber MOPA. The challenges and laser efficiency will be discussed
with the experimental work on the fiber MOPA. Furthermore, the factor limiting the output
power will be analyzed.
Apart from this, both our project partners, SPI Laser and IFM have great interest for the work
done here. The improvement in power scaling capability in the picosecond fiber MOPA will
allow IFM to carry out more specific machining tests. As for SPI Lasers, valuable experimental
data can be obtained on the performance and capability of the fiber MOPA and will be useful
for their upcoming products.
6.1 Introduction
High-power lasers operating in the picosecond regime are becoming increasing useful for
various applications. With the cost of pump lasers coming down significantly from a few
hundreds of dollars per Watt to close to a dollar per Watt, manufacturers are looking at reliable
and cost effective laser systems as a replacement for some manufacturing processes. Many of
these applications require high average powers and high peak power picosecond pulses with
pulse repetition frequencies ranging from kHz to MHz ranges. Titanium sapphire lasers are
commonly employed for many of these applications but emerging fiber laser and amplifier
systems provide an attractive alternative solution [1]. Ytterbium-doped fiber amplifiers
(YDFAs) in particular have been demonstrated to be capable of providing high single-pass gain,
very high optical-to-optical efficiencies, diffraction-limited output beams and to be highly
robust with regards to thermal effects due to the fiber geometry which allows for the efficient
dissipation of heat generated in the lasing process [2-4].
In recent years, operation in the picosecond regime has become popular and various
demonstrations with high average power and high energy pulses are reported. The simplicity
and alignment free picosecond fiber MOPA system has attracted a lot of research interest and
the introduction of new fiber laser based applications. One of them is the high power green laser
generated through frequency doubling using a nonlinear bulk crystal. Dupriez et al reported an
80 W green laser generated through frequency doubling using an LBO crystal and with a total
CHAPTER 6: High Power and High Energy Picosecond Fiber Sources
142
conversion efficiency of 46% [5]. Other than that, there are also a growing number of
demonstrations using picosecond pulses to pump optical parametric oscillators (OPO), allowing
large wavelength tunability and representing an essential tool for spectroscopic applications [6-
8]. The use of picosecond optical pulses packed with high energy and operating at high
repetition frequency (MHz range) in processes such as Laser Induced Forward Transfer (LIFT)
has also been reported recently and has shown great results in device fabrication [9, 10]. The
picosecond-LIFT process has the advantage over ns-LIFT that the thermal effect is minimum,
thus avoiding cracking, melting and other common defects which often occur with the
nanosecond pulses.
In micromachining applications, picosecond optical pulses offer great advantages over other
tools due to the non-thermal ablation process. One of the main application of picosecond pulses
is the machining of hard transparent materials. A high precision cut with good edge quality on
glass materials can be achieved using a high power picosecond laser [11]. Besides, the
capability of high energy picosecond optical pulses to modify and polish the surface of stainless
steel was demonstrated recently [12, 13]. This opens up the possibility to produce ultra-smooth
substrates.
A key approach to generate high average power is the implementation of MOPA architecture.
The technique has been used successfully in the picosecond regime allowing pulses from either
a mode-locked or a gain-switched seed laser to be amplified to high optical output powers. Piper
et al demonstrated amplification of gain switched picosecond pulses in 2003 with 1 GHz
repetition frequency and 21 ps pulsewidth [14]. Further amplification of up to 341 W was
demonstrated with a similar setup by Dupriez et al [15]. However, the output was slightly
multimoded with M2 of 2.4 due to the use of a large diameter core fiber. The setup was not fully
fiberized with the power amplifier stage relying on free space in and out coupling. Kang et al
demonstrated a fully fiberized, gain switched seeded MOPA with a linearly polarized output of
up to 100 W over the operating frequencies between 908 MHz and 56 MHz[16]. The system is
capable of generating optical pulses tunable between 1 ps and 21 ps using an external
compressor. In addition, Chen et al demonstrated amplification of mode locked picosecond
pulse in a fiberized MOPA at a maximum power of 157 W at a repetition frequency of 480 MHz
[17].
A growing number of applications require significant amounts of optical energy in the short
pulse regime. Although DPSS systems can offer such optical parameters, bulk systems are no
longer the preferred option. The emerging fiber based laser systems are slowly replacing DPSS
system. Although the cw optical power achieved from fiber based laser system is comparable to
other competing technologies, the energy extraction is still modest. The advancement of fiber

CHAPTER 6: High Power and High Energy Picosecond Fiber Sources
143
fabrication technology and the availability of high brightness, high average power pump diodes
will be the catalyst for scaling both the optical power and energy in the fiber based laser system.
6.2 Challenges
Similar to solid-state lasers, fiber lasers also faces thermal management issues while scaling to
higher average output power. The fiber geometry which provides a large surface area to volume
ratio allows a better heat dissipation capacity than in bulk solid state laser counterparts.
However the use of short lengths of DC YDF in fiber amplifier so as to manage nonlinear
effects causes a significant amount of thermal loading. Furthermore, any splice loss also
contributes to the overall heat load. Thermal loads caused by the quantum defect in active fiber
and splice loss have to be managed properly to ensure that the fiber polymer coating does not
reach the critical temperature (80 ~ 150˚C). This can be achieved by sandwiching the active
fiber in between graphite sheets in order to spread the heat quickly since graphite has a good
thermal conductivity of approximately 1600 W/m-K [18] along the plane. Besides, forced air or
water-cooling may have to be incorporated for efficient thermal management.
Another challenge faced is damage to the fiber facet. The output end of high power fiber
MOPAs is usually prone to surface damage. This effect is known to affect picosecond and
nanosecond optical pulses and is caused by electron avalanche [19]. When the intensity of the
output beam exceeds the damage threshold of the fiber core material, it leads to fracture or
melting of silica glass. Typically, the surface damage threshold is lower than the bulk damage
(bulk optical damage irradiance ~4.75 kW/μm2) [20]. This is because surface cracks, scratches
or dust can concentrate the optical field locally and lead to plasma formation at a lower
threshold. It is reported [19-21] that by proper end face polishing, surface damage can be made
equal to the bulk value. Moreover, fiber with a larger mode field diameter can handle higher
peak intensity as the damage threshold scales with the mode area. Another option is to splice a
large silica rod of appropriate length at the output of the MOPA to allow the beam to expand
appreciably so as to reduce the intensity at the silica-air interface [22] resulting in a higher
damage threshold.
Although substantial progress has been made in scaling the average output power from fiberized
systems to the hundreds of watts level, the maximum peak power in these experiments has often
been limited by nonlinear effects such as SPM and SRS [23] due to the relatively long lengths
of active fiber required to absorb the coupled pump power in cladding pumped schemes. SPM in
particular will increase the signal linewidth and reduce its spectral purity. This will impact the
performance of the laser system when it is used as a pump source for frequency conversion e.g.
OPO, SHG etc. [7, 24].
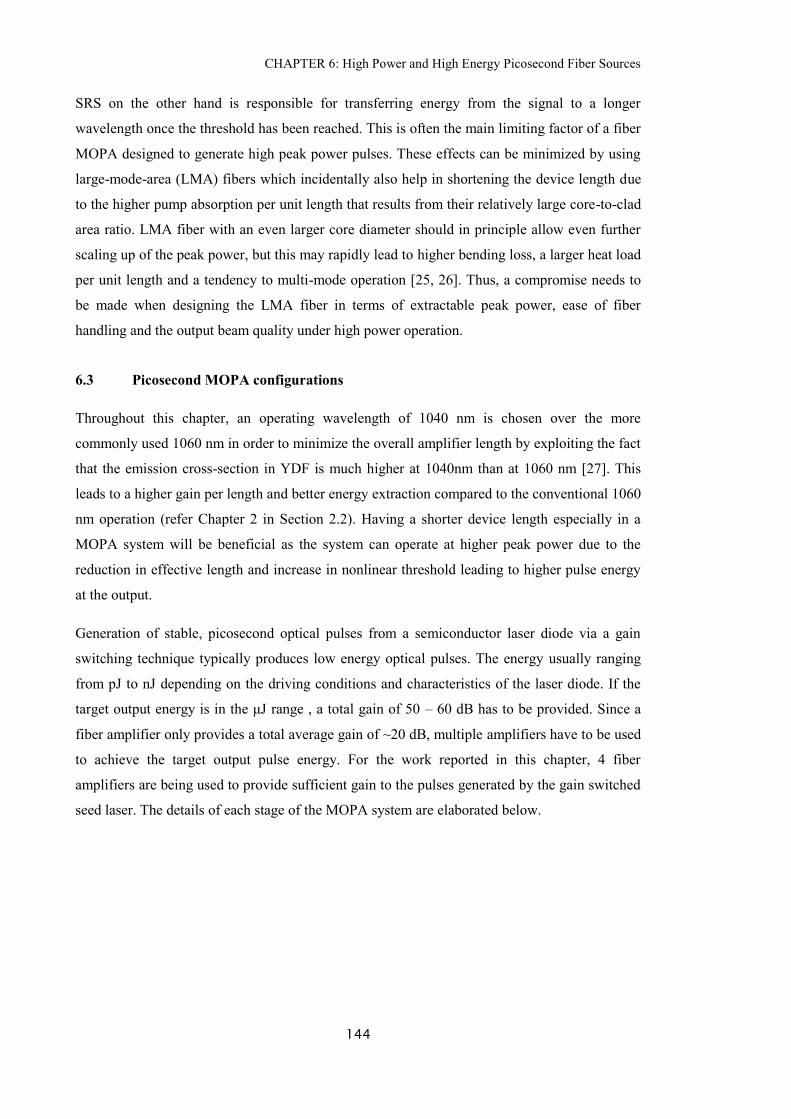
CHAPTER 6: High Power and High Energy Picosecond Fiber Sources
144
SRS on the other hand is responsible for transferring energy from the signal to a longer
wavelength once the threshold has been reached. This is often the main limiting factor of a fiber
MOPA designed to generate high peak power pulses. These effects can be minimized by using
large-mode-area (LMA) fibers which incidentally also help in shortening the device length due
to the higher pump absorption per unit length that results from their relatively large core-to-clad
area ratio. LMA fiber with an even larger core diameter should in principle allow even further
scaling up of the peak power, but this may rapidly lead to higher bending loss, a larger heat load
per unit length and a tendency to multi-mode operation [25, 26]. Thus, a compromise needs to
be made when designing the LMA fiber in terms of extractable peak power, ease of fiber
handling and the output beam quality under high power operation.
6.3 Picosecond MOPA configurations
Throughout this chapter, an operating wavelength of 1040 nm is chosen over the more
commonly used 1060 nm in order to minimize the overall amplifier length by exploiting the fact
that the emission cross-section in YDF is much higher at 1040nm than at 1060 nm [27]. This
leads to a higher gain per length and better energy extraction compared to the conventional 1060
nm operation (refer Chapter 2 in Section 2.2). Having a shorter device length especially in a
MOPA system will be beneficial as the system can operate at higher peak power due to the
reduction in effective length and increase in nonlinear threshold leading to higher pulse energy
at the output.
Generation of stable, picosecond optical pulses from a semiconductor laser diode via a gain
switching technique typically produces low energy optical pulses. The energy usually ranging
from pJ to nJ depending on the driving conditions and characteristics of the laser diode. If the
target output energy is in the μJ range , a total gain of 50 – 60 dB has to be provided. Since a
fiber amplifier only provides a total average gain of ~20 dB, multiple amplifiers have to be used
to achieve the target output pulse energy. For the work reported in this chapter, 4 fiber
amplifiers are being used to provide sufficient gain to the pulses generated by the gain switched
seed laser. The details of each stage of the MOPA system are elaborated below.
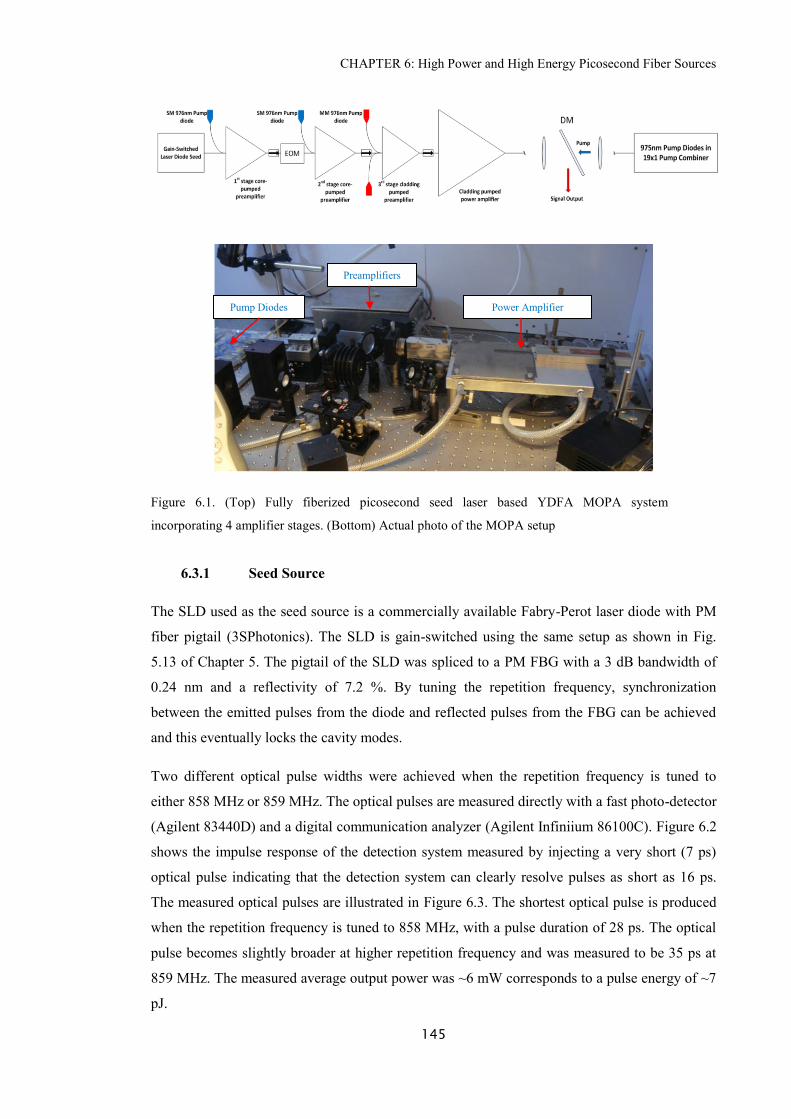
CHAPTER 6: High Power and High Energy Picosecond Fiber Sources
145
Figure 6.1. (Top) Fully fiberized picosecond seed laser based YDFA MOPA system
incorporating 4 amplifier stages. (Bottom) Actual photo of the MOPA setup
6.3.1 Seed Source
The SLD used as the seed source is a commercially available Fabry-Perot laser diode with PM
fiber pigtail (3SPhotonics). The SLD is gain-switched using the same setup as shown in Fig.
5.13 of Chapter 5. The pigtail of the SLD was spliced to a PM FBG with a 3 dB bandwidth of
0.24 nm and a reflectivity of 7.2 %. By tuning the repetition frequency, synchronization
between the emitted pulses from the diode and reflected pulses from the FBG can be achieved
and this eventually locks the cavity modes.
Two different optical pulse widths were achieved when the repetition frequency is tuned to
either 858 MHz or 859 MHz. The optical pulses are measured directly with a fast photo-detector
(Agilent 83440D) and a digital communication analyzer (Agilent Infiniium 86100C). Figure 6.2
shows the impulse response of the detection system measured by injecting a very short (7 ps)
optical pulse indicating that the detection system can clearly resolve pulses as short as 16 ps.
The measured optical pulses are illustrated in Figure 6.3. The shortest optical pulse is produced
when the repetition frequency is tuned to 858 MHz, with a pulse duration of 28 ps. The optical
pulse becomes slightly broader at higher repetition frequency and was measured to be 35 ps at
859 MHz. The measured average output power was ~6 mW corresponds to a pulse energy of ~7
pJ.
Preamplifiers
Power Amplifier Pump Diodes
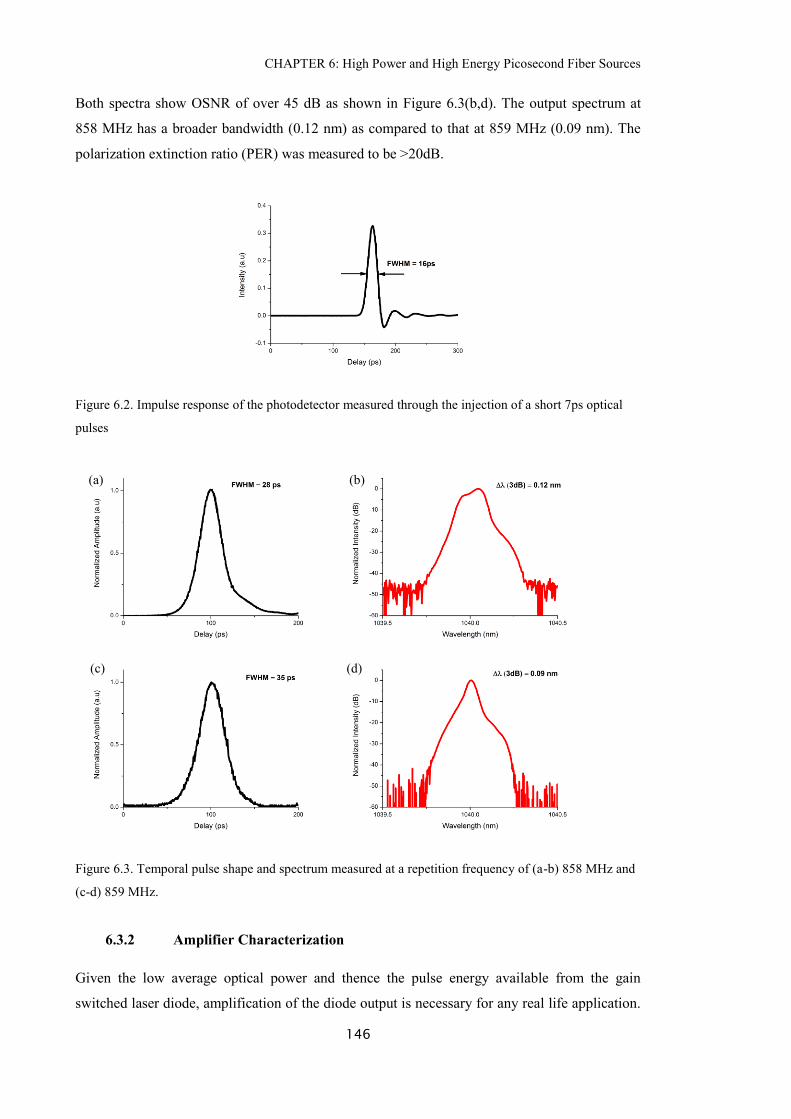
CHAPTER 6: High Power and High Energy Picosecond Fiber Sources
146
Both spectra show OSNR of over 45 dB as shown in Figure 6.3(b,d). The output spectrum at
858 MHz has a broader bandwidth (0.12 nm) as compared to that at 859 MHz (0.09 nm). The
polarization extinction ratio (PER) was measured to be >20dB.
Figure 6.2. Impulse response of the photodetector measured through the injection of a short 7ps optical
pulses
Figure 6.3. Temporal pulse shape and spectrum measured at a repetition frequency of (a-b) 858 MHz and
(c-d) 859 MHz.
6.3.2 Amplifier Characterization
Given the low average optical power and thence the pulse energy available from the gain
switched laser diode, amplification of the diode output is necessary for any real life application.
(a) (b)
(c) (d)
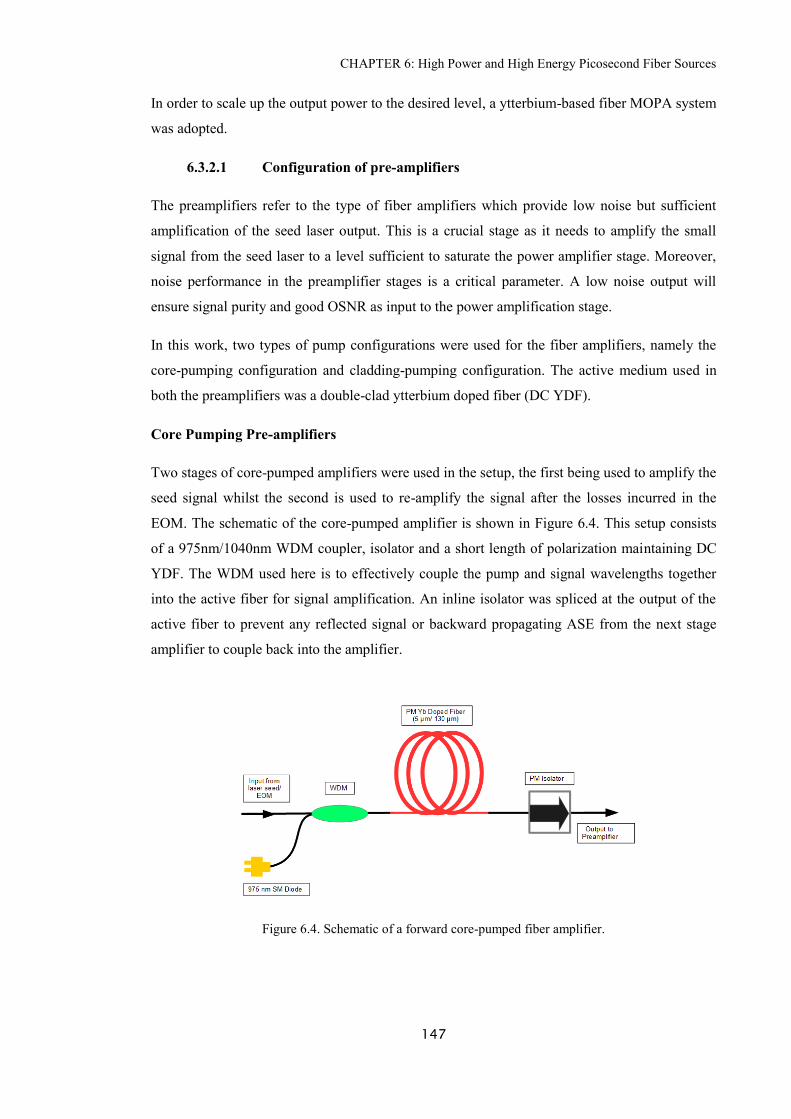
CHAPTER 6: High Power and High Energy Picosecond Fiber Sources
147
In order to scale up the output power to the desired level, a ytterbium-based fiber MOPA system
was adopted.
6.3.2.1 Configuration of pre-amplifiers
The preamplifiers refer to the type of fiber amplifiers which provide low noise but sufficient
amplification of the seed laser output. This is a crucial stage as it needs to amplify the small
signal from the seed laser to a level sufficient to saturate the power amplifier stage. Moreover,
noise performance in the preamplifier stages is a critical parameter. A low noise output will
ensure signal purity and good OSNR as input to the power amplification stage.
In this work, two types of pump configurations were used for the fiber amplifiers, namely the
core-pumping configuration and cladding-pumping configuration. The active medium used in
both the preamplifiers was a double-clad ytterbium doped fiber (DC YDF).
Core Pumping Pre-amplifiers
Two stages of core-pumped amplifiers were used in the setup, the first being used to amplify the
seed signal whilst the second is used to re-amplify the signal after the losses incurred in the
EOM. The schematic of the core-pumped amplifier is shown in Figure 6.4. This setup consists
of a 975nm/1040nm WDM coupler, isolator and a short length of polarization maintaining DC
YDF. The WDM used here is to effectively couple the pump and signal wavelengths together
into the active fiber for signal amplification. An inline isolator was spliced at the output of the
active fiber to prevent any reflected signal or backward propagating ASE from the next stage
amplifier to couple back into the amplifier.
Figure 6.4. Schematic of a forward core-pumped fiber amplifier.
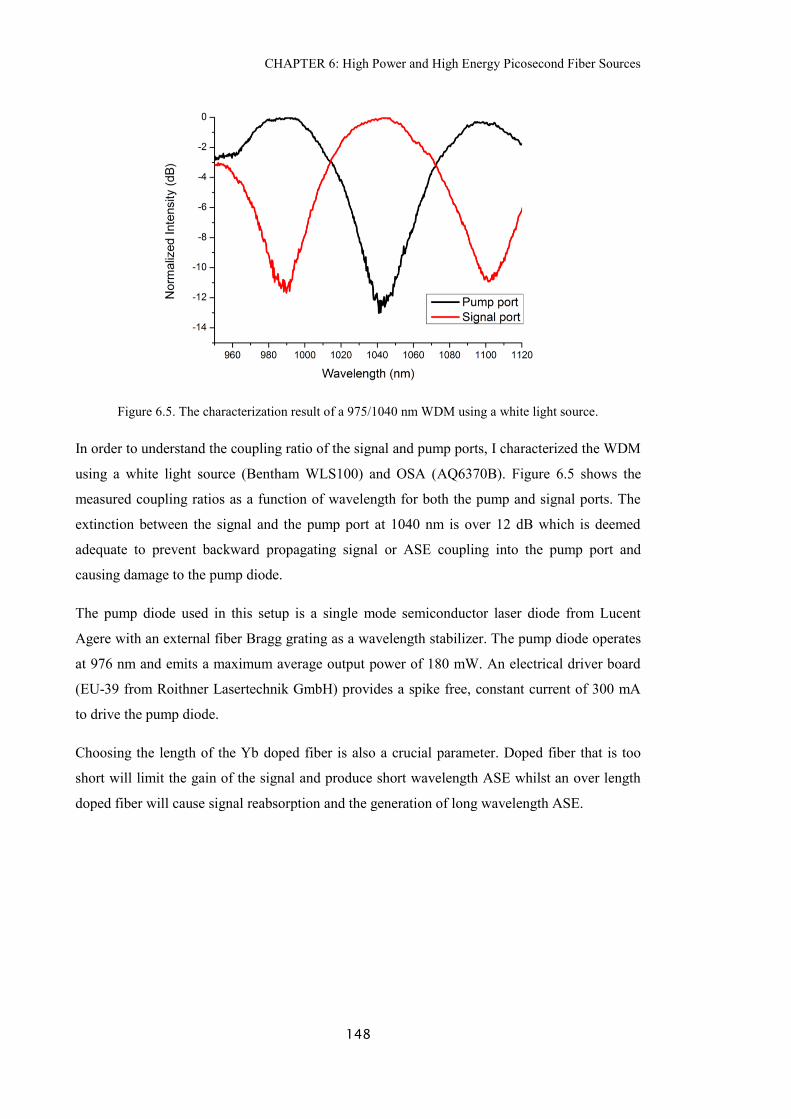
CHAPTER 6: High Power and High Energy Picosecond Fiber Sources
148
Figure 6.5. The characterization result of a 975/1040 nm WDM using a white light source.
In order to understand the coupling ratio of the signal and pump ports, I characterized the WDM
using a white light source (Bentham WLS100) and OSA (AQ6370B). Figure 6.5 shows the
measured coupling ratios as a function of wavelength for both the pump and signal ports. The
extinction between the signal and the pump port at 1040 nm is over 12 dB which is deemed
adequate to prevent backward propagating signal or ASE coupling into the pump port and
causing damage to the pump diode.
The pump diode used in this setup is a single mode semiconductor laser diode from Lucent
Agere with an external fiber Bragg grating as a wavelength stabilizer. The pump diode operates
at 976 nm and emits a maximum average output power of 180 mW. An electrical driver board
(EU-39 from Roithner Lasertechnik GmbH) provides a spike free, constant current of 300 mA
to drive the pump diode.
Choosing the length of the Yb doped fiber is also a crucial parameter. Doped fiber that is too
short will limit the gain of the signal and produce short wavelength ASE whilst an over length
doped fiber will cause signal reabsorption and the generation of long wavelength ASE.
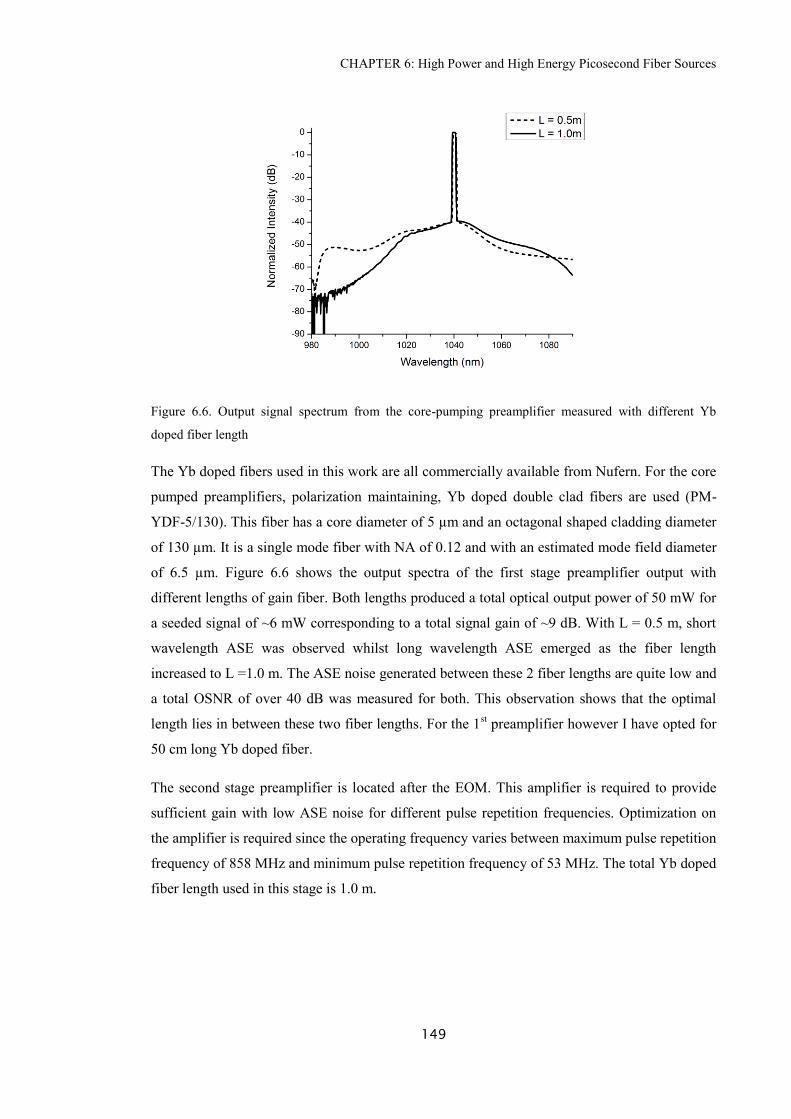
CHAPTER 6: High Power and High Energy Picosecond Fiber Sources
149
Figure 6.6. Output signal spectrum from the core-pumping preamplifier measured with different Yb
doped fiber length
The Yb doped fibers used in this work are all commercially available from Nufern. For the core
pumped preamplifiers, polarization maintaining, Yb doped double clad fibers are used (PM-
YDF-5/130). This fiber has a core diameter of 5 µm and an octagonal shaped cladding diameter
of 130 µm. It is a single mode fiber with NA of 0.12 and with an estimated mode field diameter
of 6.5 µm. Figure 6.6 shows the output spectra of the first stage preamplifier output with
different lengths of gain fiber. Both lengths produced a total optical output power of 50 mW for
a seeded signal of ~6 mW corresponding to a total signal gain of ~9 dB. With L = 0.5 m, short
wavelength ASE was observed whilst long wavelength ASE emerged as the fiber length
increased to L =1.0 m. The ASE noise generated between these 2 fiber lengths are quite low and
a total OSNR of over 40 dB was measured for both. This observation shows that the optimal
length lies in between these two fiber lengths. For the 1st preamplifier however I have opted for
50 cm long Yb doped fiber.
The second stage preamplifier is located after the EOM. This amplifier is required to provide
sufficient gain with low ASE noise for different pulse repetition frequencies. Optimization on
the amplifier is required since the operating frequency varies between maximum pulse repetition
frequency of 858 MHz and minimum pulse repetition frequency of 53 MHz. The total Yb doped
fiber length used in this stage is 1.0 m.
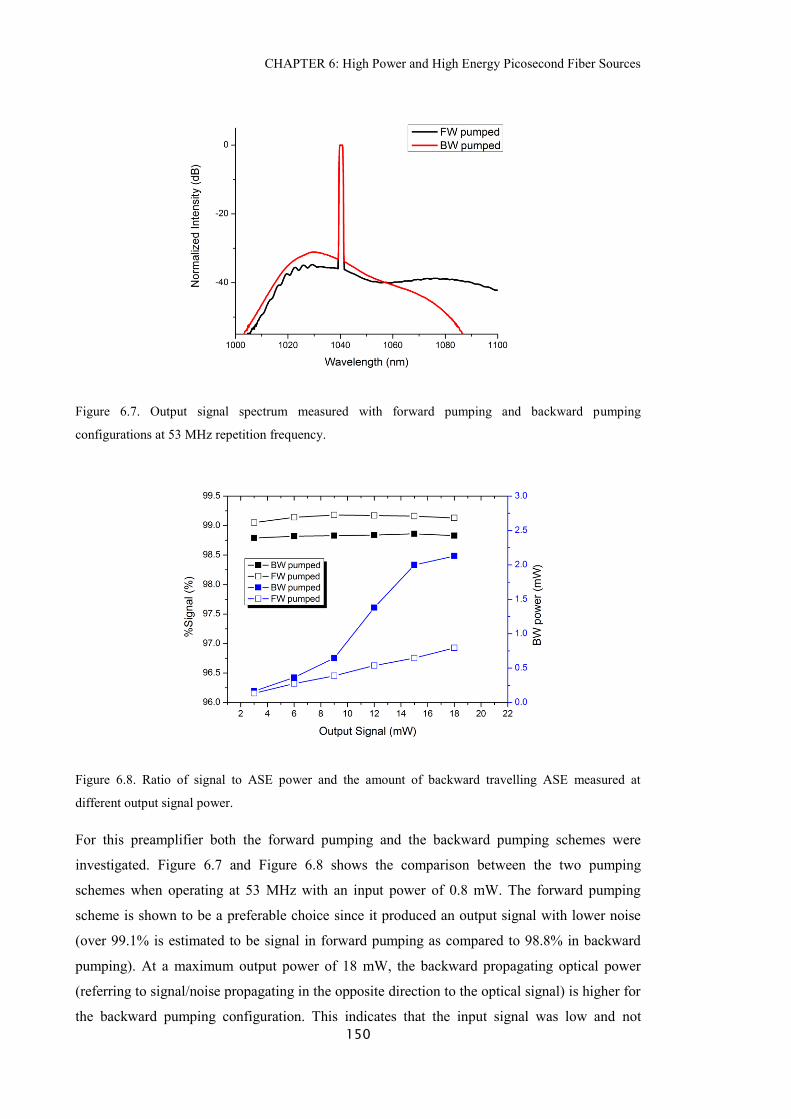
CHAPTER 6: High Power and High Energy Picosecond Fiber Sources
150
Figure 6.7. Output signal spectrum measured with forward pumping and backward pumping
configurations at 53 MHz repetition frequency.
Figure 6.8. Ratio of signal to ASE power and the amount of backward travelling ASE measured at
different output signal power.
For this preamplifier both the forward pumping and the backward pumping schemes were
investigated. Figure 6.7 and Figure 6.8 shows the comparison between the two pumping
schemes when operating at 53 MHz with an input power of 0.8 mW. The forward pumping
scheme is shown to be a preferable choice since it produced an output signal with lower noise
(over 99.1% is estimated to be signal in forward pumping as compared to 98.8% in backward
pumping). At a maximum output power of 18 mW, the backward propagating optical power
(referring to signal/noise propagating in the opposite direction to the optical signal) is higher for
the backward pumping configuration. This indicates that the input signal was low and not
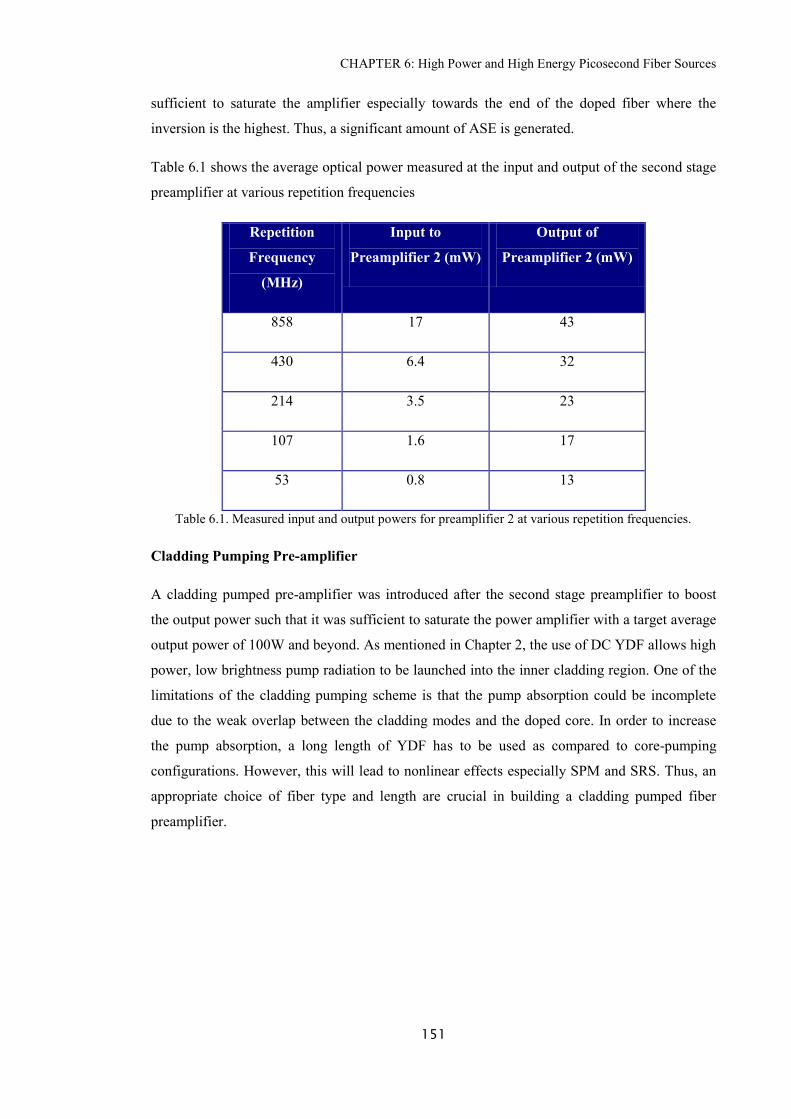
CHAPTER 6: High Power and High Energy Picosecond Fiber Sources
151
sufficient to saturate the amplifier especially towards the end of the doped fiber where the
inversion is the highest. Thus, a significant amount of ASE is generated.
Table 6.1 shows the average optical power measured at the input and output of the second stage
preamplifier at various repetition frequencies
Repetition
Frequency
(MHz)
Input to
Preamplifier 2 (mW)
Output of
Preamplifier 2 (mW)
858 17 43
430 6.4 32
214 3.5 23
107 1.6 17
53 0.8 13
Table 6.1. Measured input and output powers for preamplifier 2 at various repetition frequencies.
Cladding Pumping Pre-amplifier
A cladding pumped pre-amplifier was introduced after the second stage preamplifier to boost
the output power such that it was sufficient to saturate the power amplifier with a target average
output power of 100W and beyond. As mentioned in Chapter 2, the use of DC YDF allows high
power, low brightness pump radiation to be launched into the inner cladding region. One of the
limitations of the cladding pumping scheme is that the pump absorption could be incomplete
due to the weak overlap between the cladding modes and the doped core. In order to increase
the pump absorption, a long length of YDF has to be used as compared to core-pumping
configurations. However, this will lead to nonlinear effects especially SPM and SRS. Thus, an
appropriate choice of fiber type and length are crucial in building a cladding pumped fiber
preamplifier.
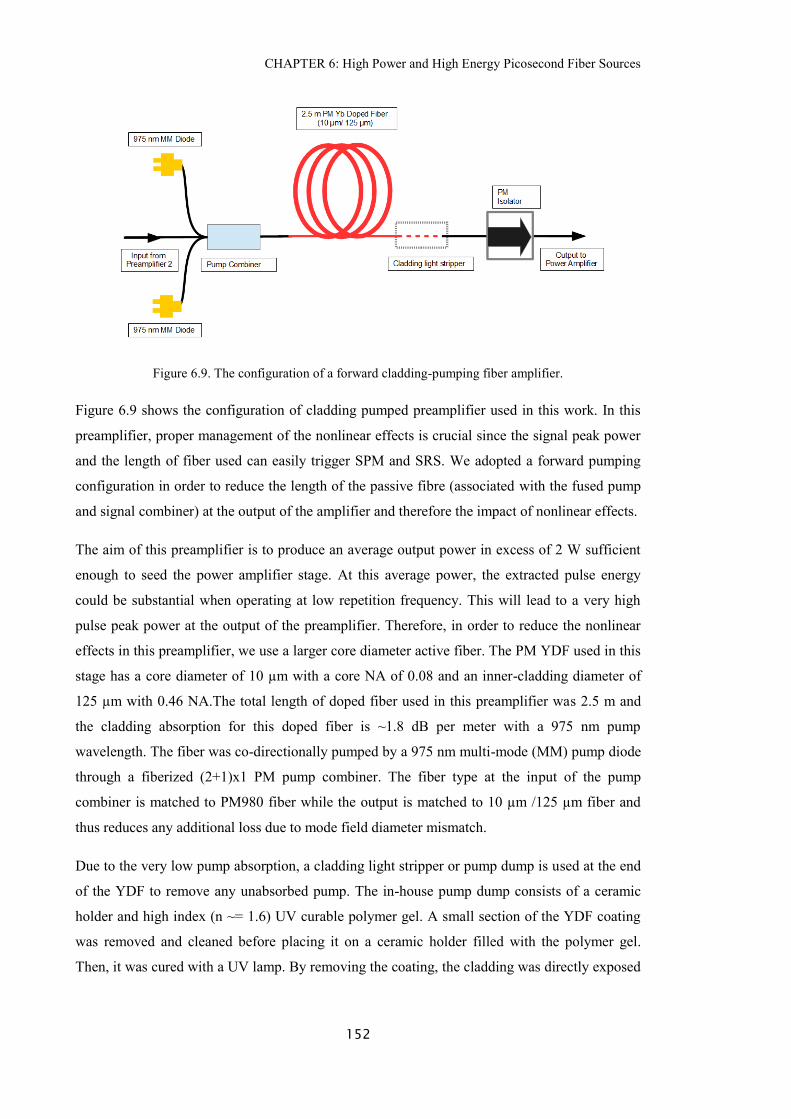
CHAPTER 6: High Power and High Energy Picosecond Fiber Sources
152
Figure 6.9. The configuration of a forward cladding-pumping fiber amplifier.
Figure 6.9 shows the configuration of cladding pumped preamplifier used in this work. In this
preamplifier, proper management of the nonlinear effects is crucial since the signal peak power
and the length of fiber used can easily trigger SPM and SRS. We adopted a forward pumping
configuration in order to reduce the length of the passive fibre (associated with the fused pump
and signal combiner) at the output of the amplifier and therefore the impact of nonlinear effects.
The aim of this preamplifier is to produce an average output power in excess of 2 W sufficient
enough to seed the power amplifier stage. At this average power, the extracted pulse energy
could be substantial when operating at low repetition frequency. This will lead to a very high
pulse peak power at the output of the preamplifier. Therefore, in order to reduce the nonlinear
effects in this preamplifier, we use a larger core diameter active fiber. The PM YDF used in this
stage has a core diameter of 10 µm with a core NA of 0.08 and an inner-cladding diameter of
125 µm with 0.46 NA.The total length of doped fiber used in this preamplifier was 2.5 m and
the cladding absorption for this doped fiber is ~1.8 dB per meter with a 975 nm pump
wavelength. The fiber was co-directionally pumped by a 975 nm multi-mode (MM) pump diode
through a fiberized (2+1)x1 PM pump combiner. The fiber type at the input of the pump
combiner is matched to PM980 fiber while the output is matched to 10 µm /125 µm fiber and
thus reduces any additional loss due to mode field diameter mismatch.
Due to the very low pump absorption, a cladding light stripper or pump dump is used at the end
of the YDF to remove any unabsorbed pump. The in-house pump dump consists of a ceramic
holder and high index (n ~= 1.6) UV curable polymer gel. A small section of the YDF coating
was removed and cleaned before placing it on a ceramic holder filled with the polymer gel.
Then, it was cured with a UV lamp. By removing the coating, the cladding was directly exposed
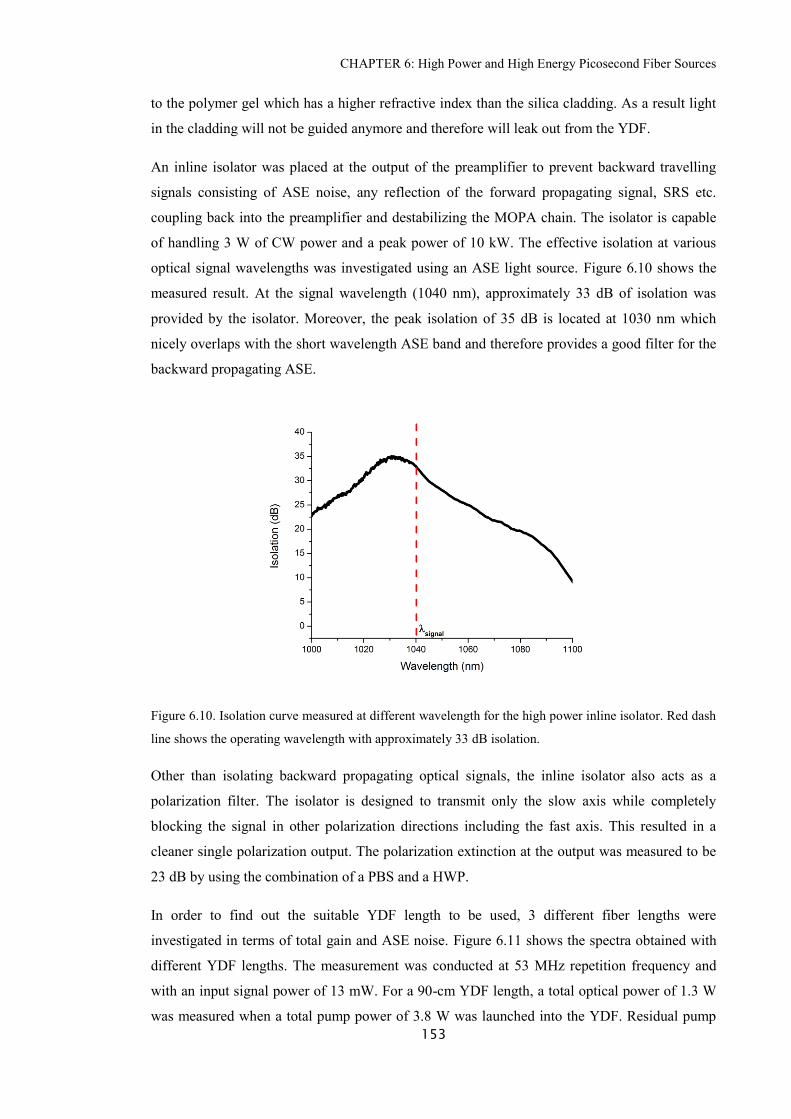
CHAPTER 6: High Power and High Energy Picosecond Fiber Sources
153
to the polymer gel which has a higher refractive index than the silica cladding. As a result light
in the cladding will not be guided anymore and therefore will leak out from the YDF.
An inline isolator was placed at the output of the preamplifier to prevent backward travelling
signals consisting of ASE noise, any reflection of the forward propagating signal, SRS etc.
coupling back into the preamplifier and destabilizing the MOPA chain. The isolator is capable
of handling 3 W of CW power and a peak power of 10 kW. The effective isolation at various
optical signal wavelengths was investigated using an ASE light source. Figure 6.10 shows the
measured result. At the signal wavelength (1040 nm), approximately 33 dB of isolation was
provided by the isolator. Moreover, the peak isolation of 35 dB is located at 1030 nm which
nicely overlaps with the short wavelength ASE band and therefore provides a good filter for the
backward propagating ASE.
Figure 6.10. Isolation curve measured at different wavelength for the high power inline isolator. Red dash
line shows the operating wavelength with approximately 33 dB isolation.
Other than isolating backward propagating optical signals, the inline isolator also acts as a
polarization filter. The isolator is designed to transmit only the slow axis while completely
blocking the signal in other polarization directions including the fast axis. This resulted in a
cleaner single polarization output. The polarization extinction at the output was measured to be
23 dB by using the combination of a PBS and a HWP.
In order to find out the suitable YDF length to be used, 3 different fiber lengths were
investigated in terms of total gain and ASE noise. Figure 6.11 shows the spectra obtained with
different YDF lengths. The measurement was conducted at 53 MHz repetition frequency and
with an input signal power of 13 mW. For a 90-cm YDF length, a total optical power of 1.3 W
was measured when a total pump power of 3.8 W was launched into the YDF. Residual pump
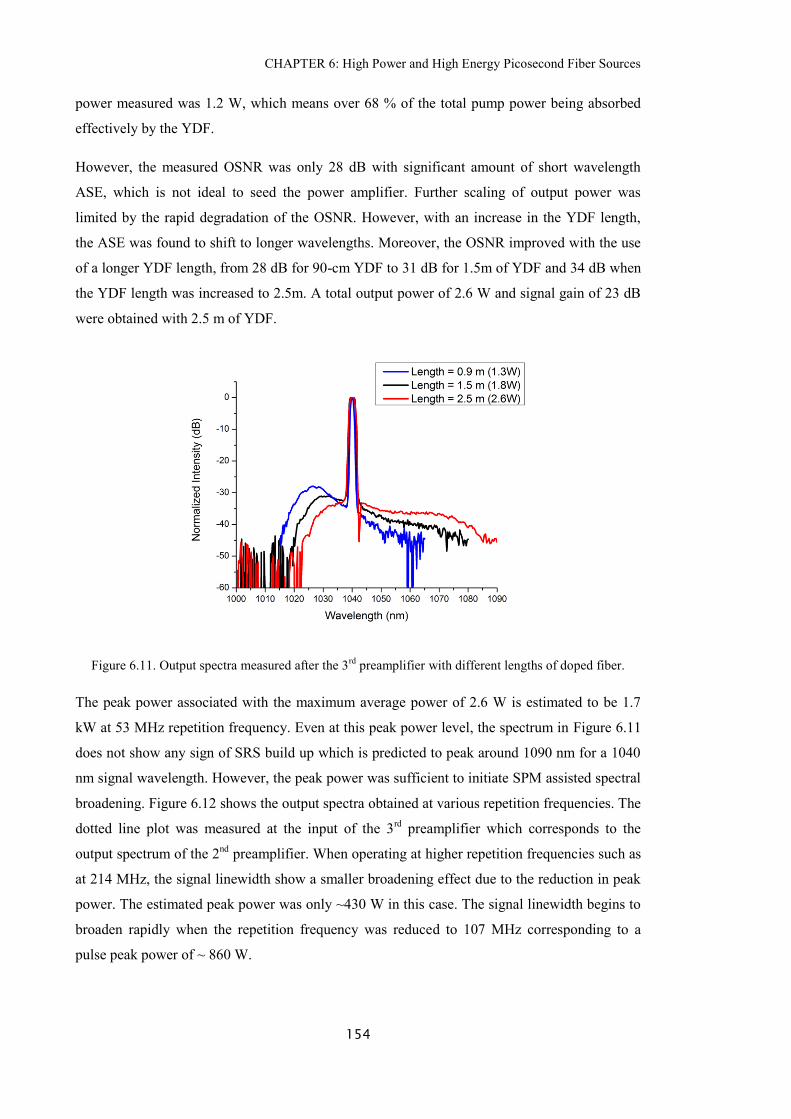
CHAPTER 6: High Power and High Energy Picosecond Fiber Sources
154
power measured was 1.2 W, which means over 68 % of the total pump power being absorbed
effectively by the YDF.
However, the measured OSNR was only 28 dB with significant amount of short wavelength
ASE, which is not ideal to seed the power amplifier. Further scaling of output power was
limited by the rapid degradation of the OSNR. However, with an increase in the YDF length,
the ASE was found to shift to longer wavelengths. Moreover, the OSNR improved with the use
of a longer YDF length, from 28 dB for 90-cm YDF to 31 dB for 1.5m of YDF and 34 dB when
the YDF length was increased to 2.5m. A total output power of 2.6 W and signal gain of 23 dB
were obtained with 2.5 m of YDF.
Figure 6.11. Output spectra measured after the 3rd
preamplifier with different lengths of doped fiber.
The peak power associated with the maximum average power of 2.6 W is estimated to be 1.7
kW at 53 MHz repetition frequency. Even at this peak power level, the spectrum in Figure 6.11
does not show any sign of SRS build up which is predicted to peak around 1090 nm for a 1040
nm signal wavelength. However, the peak power was sufficient to initiate SPM assisted spectral
broadening. Figure 6.12 shows the output spectra obtained at various repetition frequencies. The
dotted line plot was measured at the input of the 3rd
preamplifier which corresponds to the
output spectrum of the 2nd
preamplifier. When operating at higher repetition frequencies such as
at 214 MHz, the signal linewidth show a smaller broadening effect due to the reduction in peak
power. The estimated peak power was only ~430 W in this case. The signal linewidth begins to
broaden rapidly when the repetition frequency was reduced to 107 MHz corresponding to a
pulse peak power of ~ 860 W.
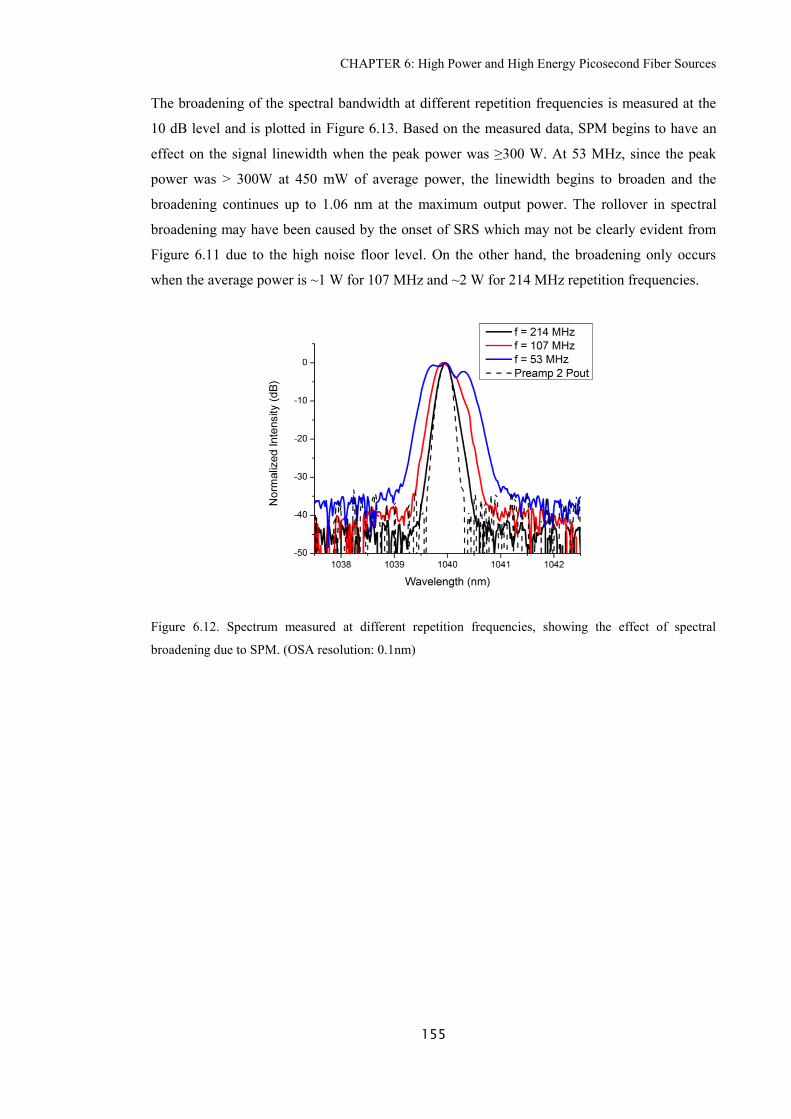
CHAPTER 6: High Power and High Energy Picosecond Fiber Sources
155
The broadening of the spectral bandwidth at different repetition frequencies is measured at the
10 dB level and is plotted in Figure 6.13. Based on the measured data, SPM begins to have an
effect on the signal linewidth when the peak power was ≥300 W. At 53 MHz, since the peak
power was > 300W at 450 mW of average power, the linewidth begins to broaden and the
broadening continues up to 1.06 nm at the maximum output power. The rollover in spectral
broadening may have been caused by the onset of SRS which may not be clearly evident from
Figure 6.11 due to the high noise floor level. On the other hand, the broadening only occurs
when the average power is ~1 W for 107 MHz and ~2 W for 214 MHz repetition frequencies.
Figure 6.12. Spectrum measured at different repetition frequencies, showing the effect of spectral
broadening due to SPM. (OSA resolution: 0.1nm)
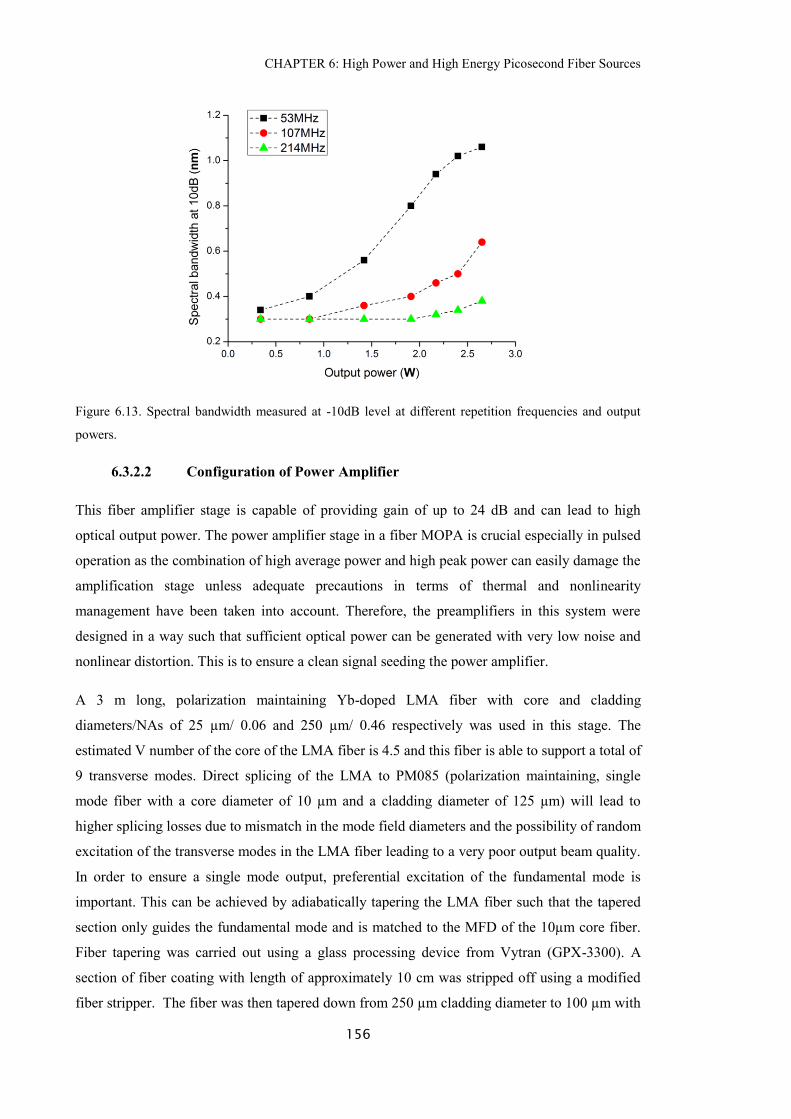
CHAPTER 6: High Power and High Energy Picosecond Fiber Sources
156
Figure 6.13. Spectral bandwidth measured at -10dB level at different repetition frequencies and output
powers.
6.3.2.2 Configuration of Power Amplifier
This fiber amplifier stage is capable of providing gain of up to 24 dB and can lead to high
optical output power. The power amplifier stage in a fiber MOPA is crucial especially in pulsed
operation as the combination of high average power and high peak power can easily damage the
amplification stage unless adequate precautions in terms of thermal and nonlinearity
management have been taken into account. Therefore, the preamplifiers in this system were
designed in a way such that sufficient optical power can be generated with very low noise and
nonlinear distortion. This is to ensure a clean signal seeding the power amplifier.
A 3 m long, polarization maintaining Yb-doped LMA fiber with core and cladding
diameters/NAs of 25 µm/ 0.06 and 250 µm/ 0.46 respectively was used in this stage. The
estimated V number of the core of the LMA fiber is 4.5 and this fiber is able to support a total of
9 transverse modes. Direct splicing of the LMA to PM085 (polarization maintaining, single
mode fiber with a core diameter of 10 µm and a cladding diameter of 125 µm) will lead to
higher splicing losses due to mismatch in the mode field diameters and the possibility of random
excitation of the transverse modes in the LMA fiber leading to a very poor output beam quality.
In order to ensure a single mode output, preferential excitation of the fundamental mode is
important. This can be achieved by adiabatically tapering the LMA fiber such that the tapered
section only guides the fundamental mode and is matched to the MFD of the 10µm core fiber.
Fiber tapering was carried out using a glass processing device from Vytran (GPX-3300). A
section of fiber coating with length of approximately 10 cm was stripped off using a modified
fiber stripper. The fiber was then tapered down from 250 µm cladding diameter to 100 µm with
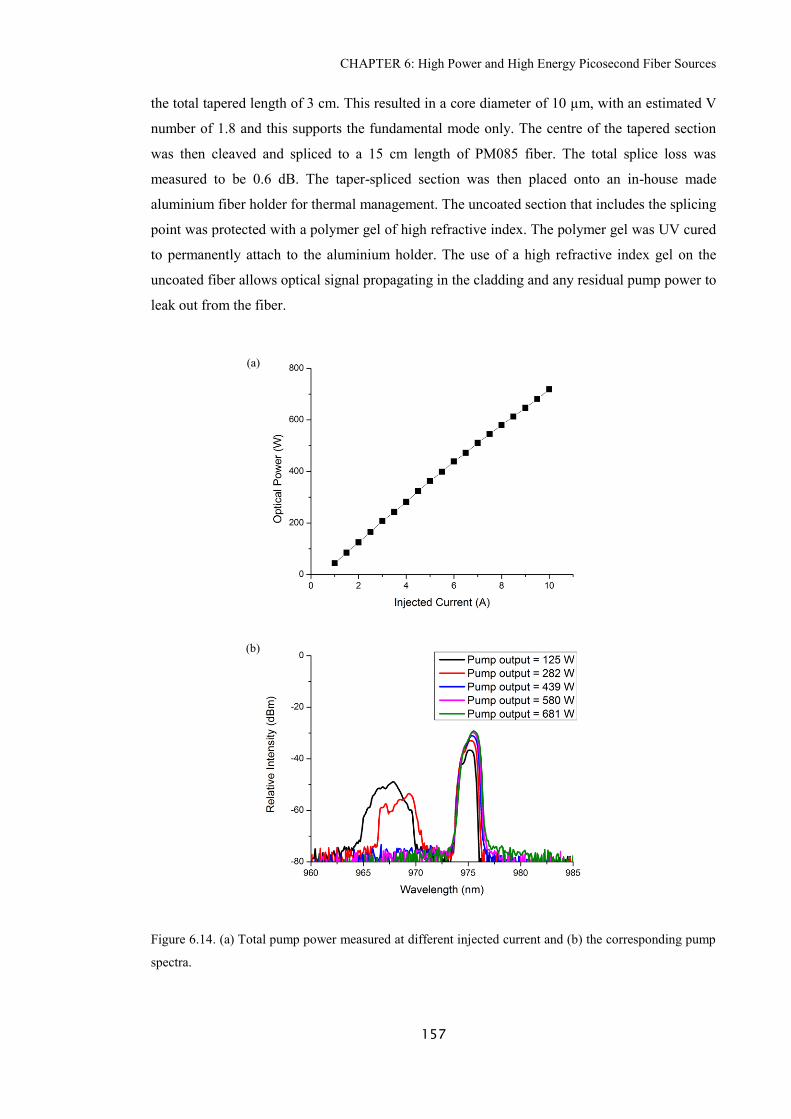
CHAPTER 6: High Power and High Energy Picosecond Fiber Sources
157
the total tapered length of 3 cm. This resulted in a core diameter of 10 µm, with an estimated V
number of 1.8 and this supports the fundamental mode only. The centre of the tapered section
was then cleaved and spliced to a 15 cm length of PM085 fiber. The total splice loss was
measured to be 0.6 dB. The taper-spliced section was then placed onto an in-house made
aluminium fiber holder for thermal management. The uncoated section that includes the splicing
point was protected with a polymer gel of high refractive index. The polymer gel was UV cured
to permanently attach to the aluminium holder. The use of a high refractive index gel on the
uncoated fiber allows optical signal propagating in the cladding and any residual pump power to
leak out from the fiber.
Figure 6.14. (a) Total pump power measured at different injected current and (b) the corresponding pump
spectra.
(a)
(b)
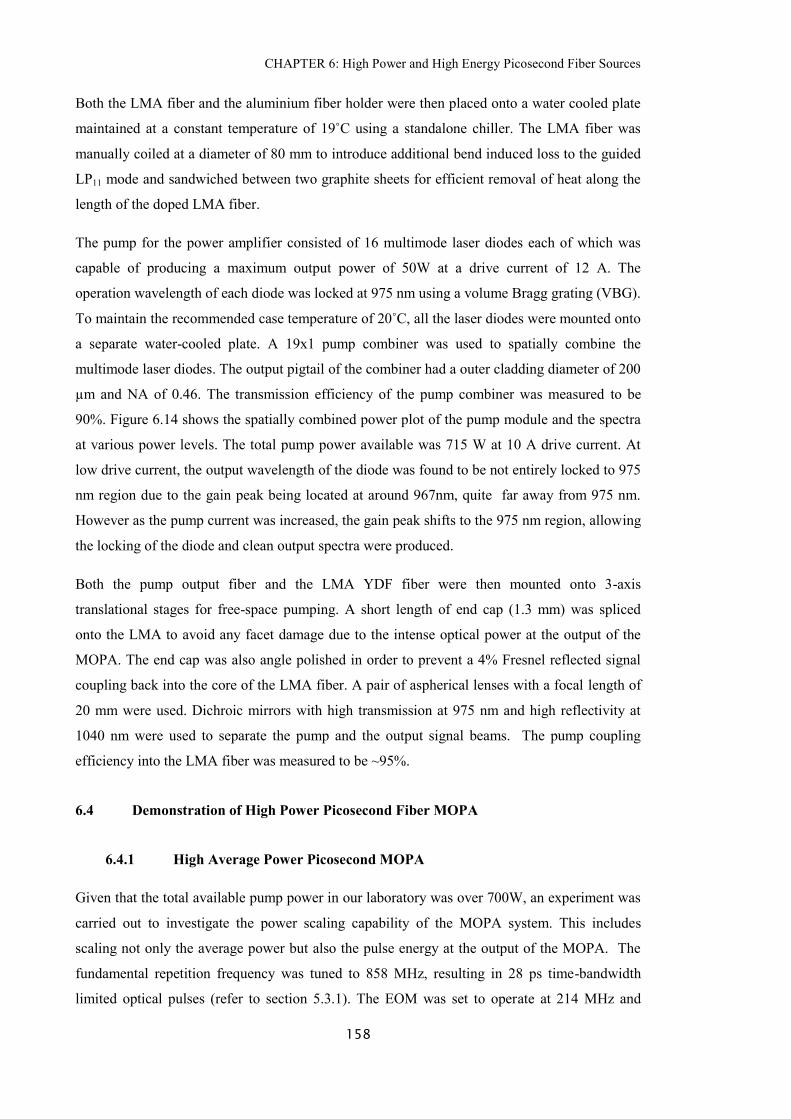
CHAPTER 6: High Power and High Energy Picosecond Fiber Sources
158
Both the LMA fiber and the aluminium fiber holder were then placed onto a water cooled plate
maintained at a constant temperature of 19˚C using a standalone chiller. The LMA fiber was
manually coiled at a diameter of 80 mm to introduce additional bend induced loss to the guided
LP11 mode and sandwiched between two graphite sheets for efficient removal of heat along the
length of the doped LMA fiber.
The pump for the power amplifier consisted of 16 multimode laser diodes each of which was
capable of producing a maximum output power of 50W at a drive current of 12 A. The
operation wavelength of each diode was locked at 975 nm using a volume Bragg grating (VBG).
To maintain the recommended case temperature of 20˚C, all the laser diodes were mounted onto
a separate water-cooled plate. A 19x1 pump combiner was used to spatially combine the
multimode laser diodes. The output pigtail of the combiner had a outer cladding diameter of 200
µm and NA of 0.46. The transmission efficiency of the pump combiner was measured to be
90%. Figure 6.14 shows the spatially combined power plot of the pump module and the spectra
at various power levels. The total pump power available was 715 W at 10 A drive current. At
low drive current, the output wavelength of the diode was found to be not entirely locked to 975
nm region due to the gain peak being located at around 967nm, quite far away from 975 nm.
However as the pump current was increased, the gain peak shifts to the 975 nm region, allowing
the locking of the diode and clean output spectra were produced.
Both the pump output fiber and the LMA YDF fiber were then mounted onto 3-axis
translational stages for free-space pumping. A short length of end cap (1.3 mm) was spliced
onto the LMA to avoid any facet damage due to the intense optical power at the output of the
MOPA. The end cap was also angle polished in order to prevent a 4% Fresnel reflected signal
coupling back into the core of the LMA fiber. A pair of aspherical lenses with a focal length of
20 mm were used. Dichroic mirrors with high transmission at 975 nm and high reflectivity at
1040 nm were used to separate the pump and the output signal beams. The pump coupling
efficiency into the LMA fiber was measured to be ~95%.
6.4 Demonstration of High Power Picosecond Fiber MOPA
6.4.1 High Average Power Picosecond MOPA
Given that the total available pump power in our laboratory was over 700W, an experiment was
carried out to investigate the power scaling capability of the MOPA system. This includes
scaling not only the average power but also the pulse energy at the output of the MOPA. The
fundamental repetition frequency was tuned to 858 MHz, resulting in 28 ps time-bandwidth
limited optical pulses (refer to section 5.3.1). The EOM was set to operate at 214 MHz and
CHAPTER 6: High Power and High Energy Picosecond Fiber Sources
159
effectively pulse picked at a duty cycle of 1/166. The 2nd
preamplifier was used to compensate
for the insertion loss of the EOM and power loss due to the reduction in repetition frequency.
The output of the 3rd
preamplifier was increased from 2.6 W to 3.4 W by increasing the
launched pump power. This is to ensure that sufficient signal is injected to saturate the power
amplifier.
The critical peak power at which SRS become significant (SRS peak lies ~23 dB below the
signal peak) with this 25 μm core and 3 m long LMA fiber is estimated to be ~75 kW [23].
However, at an output power of 351 W (corresponding to an estimated peak power of 59 kW),
a significant amount of SRS started to appear as shown in Figure 6.15, which according to our
calculation is still lower than the predicted threshold. One possible explanation for the low SRS
threshold may be related to the ASE noise generated from the 3rd
preamplifier. The long
wavelength ASE noise can act as a seed and effectively decrease the SRS threshold. A simple
solution to this could be to use a bandpass filter based isolator in between the preamplifier and
the power amplifier, however, this could not be manufactured within the timeframe of my
doctoral degree.
Figure 6.15. Output spectrum measured with different input pulse duration (28 ps and 35 ps).
In order to further increase the average power from the MOPA, the optical peak power has to be
reduced. Increasing the optical pulse duration by 25% should reduce the peak power to ~47 kW
at 351 W. This should allow further power scaling to beyond 500 W with an estimated peak
power of ~61 kW.
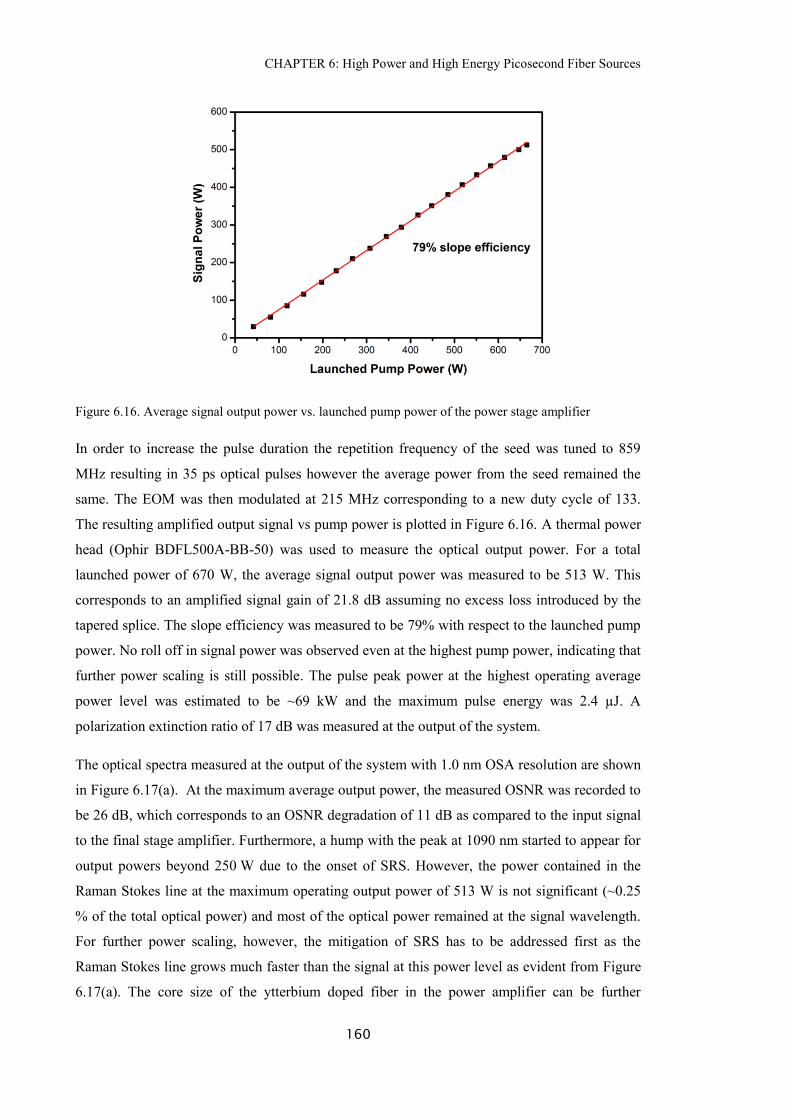
CHAPTER 6: High Power and High Energy Picosecond Fiber Sources
160
Figure 6.16. Average signal output power vs. launched pump power of the power stage amplifier
In order to increase the pulse duration the repetition frequency of the seed was tuned to 859
MHz resulting in 35 ps optical pulses however the average power from the seed remained the
same. The EOM was then modulated at 215 MHz corresponding to a new duty cycle of 133.
The resulting amplified output signal vs pump power is plotted in Figure 6.16. A thermal power
head (Ophir BDFL500A-BB-50) was used to measure the optical output power. For a total
launched power of 670 W, the average signal output power was measured to be 513 W. This
corresponds to an amplified signal gain of 21.8 dB assuming no excess loss introduced by the
tapered splice. The slope efficiency was measured to be 79% with respect to the launched pump
power. No roll off in signal power was observed even at the highest pump power, indicating that
further power scaling is still possible. The pulse peak power at the highest operating average
power level was estimated to be ~69 kW and the maximum pulse energy was 2.4 µJ. A
polarization extinction ratio of 17 dB was measured at the output of the system.
The optical spectra measured at the output of the system with 1.0 nm OSA resolution are shown
in Figure 6.17(a). At the maximum average output power, the measured OSNR was recorded to
be 26 dB, which corresponds to an OSNR degradation of 11 dB as compared to the input signal
to the final stage amplifier. Furthermore, a hump with the peak at 1090 nm started to appear for
output powers beyond 250 W due to the onset of SRS. However, the power contained in the
Raman Stokes line at the maximum operating output power of 513 W is not significant (~0.25
% of the total optical power) and most of the optical power remained at the signal wavelength.
For further power scaling, however, the mitigation of SRS has to be addressed first as the
Raman Stokes line grows much faster than the signal at this power level as evident from Figure
6.17(a). The core size of the ytterbium doped fiber in the power amplifier can be further
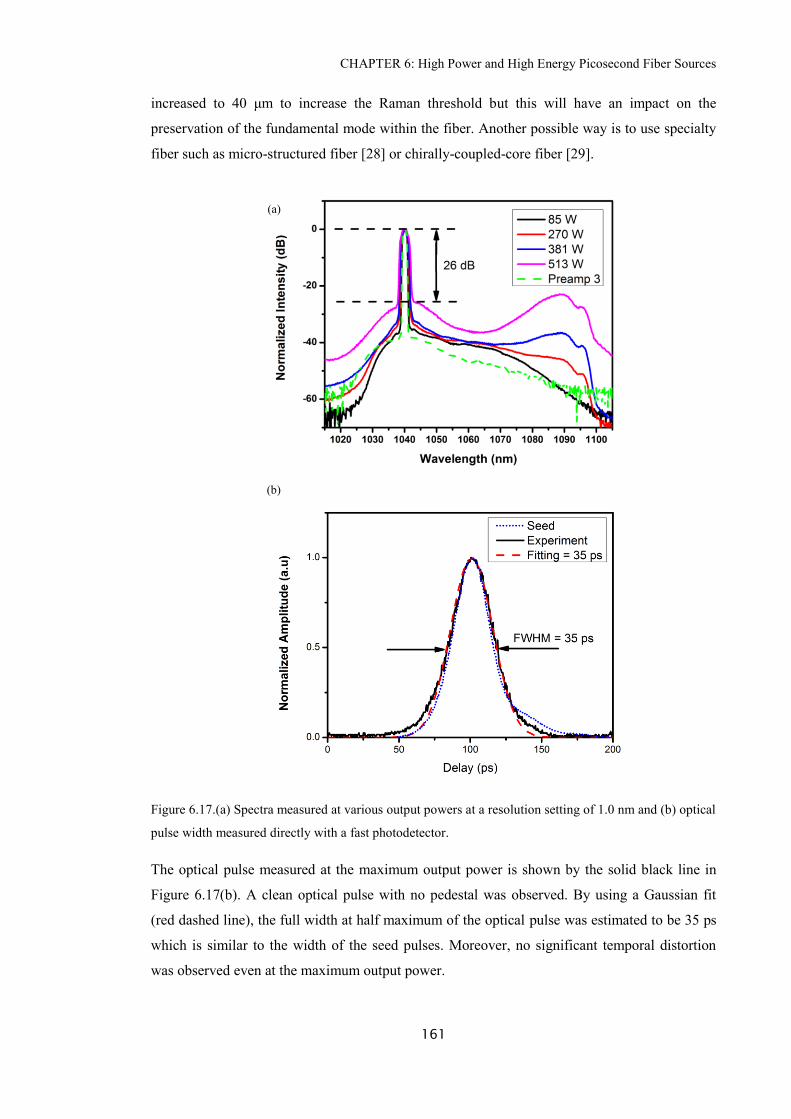
CHAPTER 6: High Power and High Energy Picosecond Fiber Sources
161
increased to 40 μm to increase the Raman threshold but this will have an impact on the
preservation of the fundamental mode within the fiber. Another possible way is to use specialty
fiber such as micro-structured fiber [28] or chirally-coupled-core fiber [29].
Figure 6.17.(a) Spectra measured at various output powers at a resolution setting of 1.0 nm and (b) optical
pulse width measured directly with a fast photodetector.
The optical pulse measured at the maximum output power is shown by the solid black line in
Figure 6.17(b). A clean optical pulse with no pedestal was observed. By using a Gaussian fit
(red dashed line), the full width at half maximum of the optical pulse was estimated to be 35 ps
which is similar to the width of the seed pulses. Moreover, no significant temporal distortion
was observed even at the maximum output power.
(a)
(b)
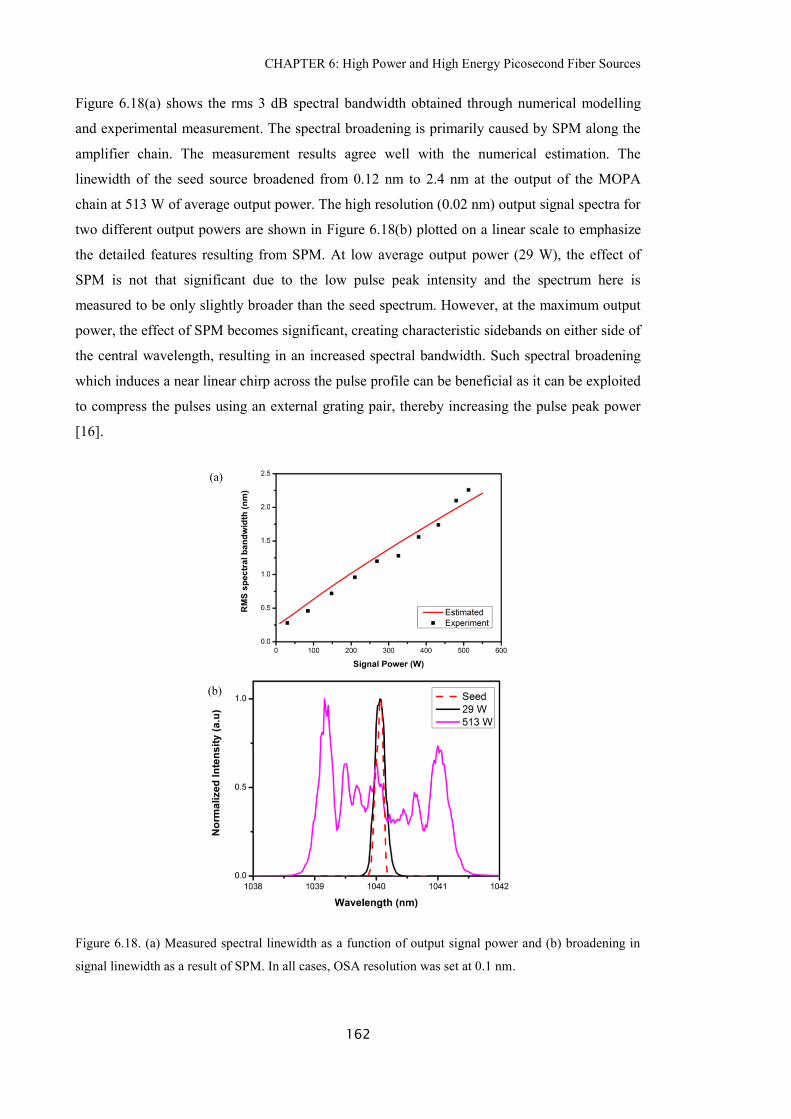
CHAPTER 6: High Power and High Energy Picosecond Fiber Sources
162
Figure 6.18(a) shows the rms 3 dB spectral bandwidth obtained through numerical modelling
and experimental measurement. The spectral broadening is primarily caused by SPM along the
amplifier chain. The measurement results agree well with the numerical estimation. The
linewidth of the seed source broadened from 0.12 nm to 2.4 nm at the output of the MOPA
chain at 513 W of average output power. The high resolution (0.02 nm) output signal spectra for
two different output powers are shown in Figure 6.18(b) plotted on a linear scale to emphasize
the detailed features resulting from SPM. At low average output power (29 W), the effect of
SPM is not that significant due to the low pulse peak intensity and the spectrum here is
measured to be only slightly broader than the seed spectrum. However, at the maximum output
power, the effect of SPM becomes significant, creating characteristic sidebands on either side of
the central wavelength, resulting in an increased spectral bandwidth. Such spectral broadening
which induces a near linear chirp across the pulse profile can be beneficial as it can be exploited
to compress the pulses using an external grating pair, thereby increasing the pulse peak power
[16].
Figure 6.18. (a) Measured spectral linewidth as a function of output signal power and (b) broadening in
signal linewidth as a result of SPM. In all cases, OSA resolution was set at 0.1 nm.
(a)
(b)
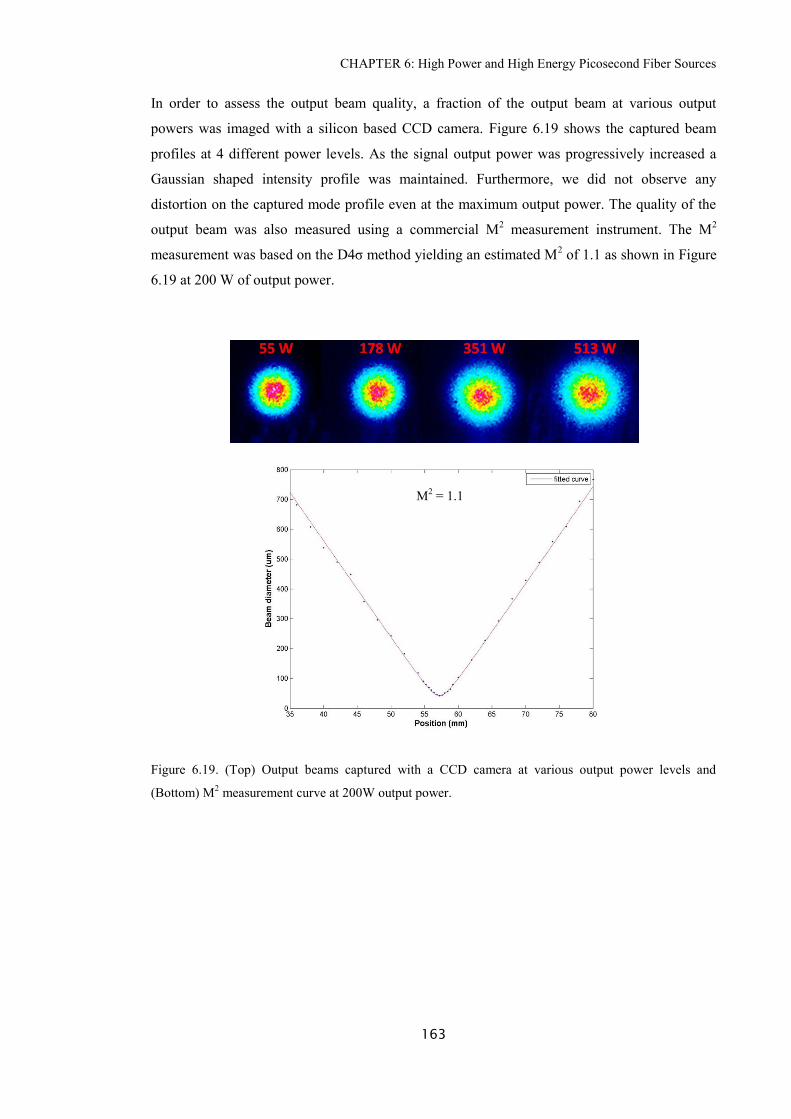
CHAPTER 6: High Power and High Energy Picosecond Fiber Sources
163
In order to assess the output beam quality, a fraction of the output beam at various output
powers was imaged with a silicon based CCD camera. Figure 6.19 shows the captured beam
profiles at 4 different power levels. As the signal output power was progressively increased a
Gaussian shaped intensity profile was maintained. Furthermore, we did not observe any
distortion on the captured mode profile even at the maximum output power. The quality of the
output beam was also measured using a commercial M2 measurement instrument. The M
2
measurement was based on the D4σ method yielding an estimated M2 of 1.1 as shown in Figure
6.19 at 200 W of output power.
Figure 6.19. (Top) Output beams captured with a CCD camera at various output power levels and
(Bottom) M2 measurement curve at 200W output power.
M2 = 1.1
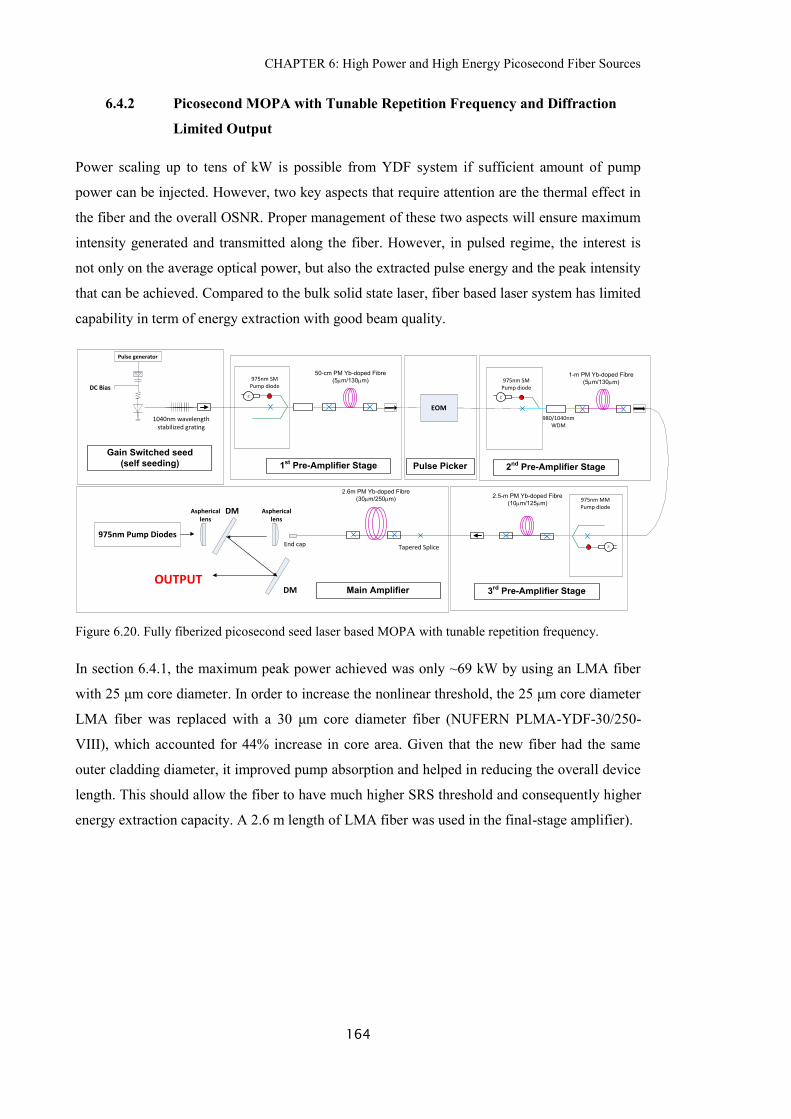
CHAPTER 6: High Power and High Energy Picosecond Fiber Sources
164
6.4.2 Picosecond MOPA with Tunable Repetition Frequency and Diffraction
Limited Output
Power scaling up to tens of kW is possible from YDF system if sufficient amount of pump
power can be injected. However, two key aspects that require attention are the thermal effect in
the fiber and the overall OSNR. Proper management of these two aspects will ensure maximum
intensity generated and transmitted along the fiber. However, in pulsed regime, the interest is
not only on the average optical power, but also the extracted pulse energy and the peak intensity
that can be achieved. Compared to the bulk solid state laser, fiber based laser system has limited
capability in term of energy extraction with good beam quality.
1st
Pre-Amplifier Stage
50-cm PM Yb-doped Fibre
(5mm/130mm)
P1
975nm SM Pump diode
1-m PM Yb-doped Fibre
(5mm/130mm)
P1
975nm SM Pump diode
980/1040nm WDM
2nd
Pre-Amplifier StagePulse Picker
2.6m PM Yb-doped Fibre
(30mm/250mm)
975nm Pump Diodes
DM
DMOUTPUT
Main Amplifier
Tapered SpliceEnd cap
3rd
Pre-Amplifier Stage
2.5-m PM Yb-doped Fibre
(10mm/125mm)
P1
975nm MM Pump diode
1040nm wavelength stabilized grating
Pulse generator
DC Bias
Gain Switched seed
(self seeding)
EOM
Aspherical lens
Aspherical lens
Figure 6.20. Fully fiberized picosecond seed laser based MOPA with tunable repetition frequency.
In section 6.4.1, the maximum peak power achieved was only ~69 kW by using an LMA fiber
with 25 μm core diameter. In order to increase the nonlinear threshold, the 25 μm core diameter
LMA fiber was replaced with a 30 μm core diameter fiber (NUFERN PLMA-YDF-30/250-
VIII), which accounted for 44% increase in core area. Given that the new fiber had the same
outer cladding diameter, it improved pump absorption and helped in reducing the overall device
length. This should allow the fiber to have much higher SRS threshold and consequently higher
energy extraction capacity. A 2.6 m length of LMA fiber was used in the final-stage amplifier).
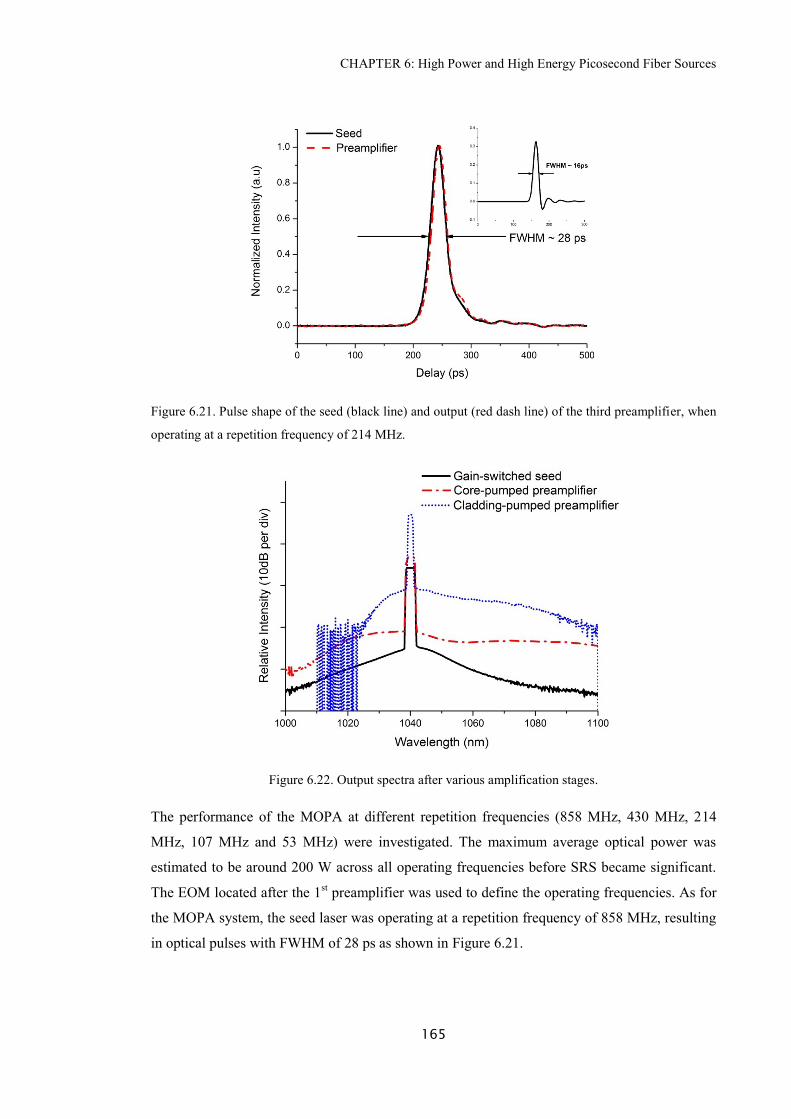
CHAPTER 6: High Power and High Energy Picosecond Fiber Sources
165
Figure 6.21. Pulse shape of the seed (black line) and output (red dash line) of the third preamplifier, when
operating at a repetition frequency of 214 MHz.
Figure 6.22. Output spectra after various amplification stages.
The performance of the MOPA at different repetition frequencies (858 MHz, 430 MHz, 214
MHz, 107 MHz and 53 MHz) were investigated. The maximum average optical power was
estimated to be around 200 W across all operating frequencies before SRS became significant.
The EOM located after the 1st preamplifier was used to define the operating frequencies. As for
the MOPA system, the seed laser was operating at a repetition frequency of 858 MHz, resulting
in optical pulses with FWHM of 28 ps as shown in Figure 6.21.
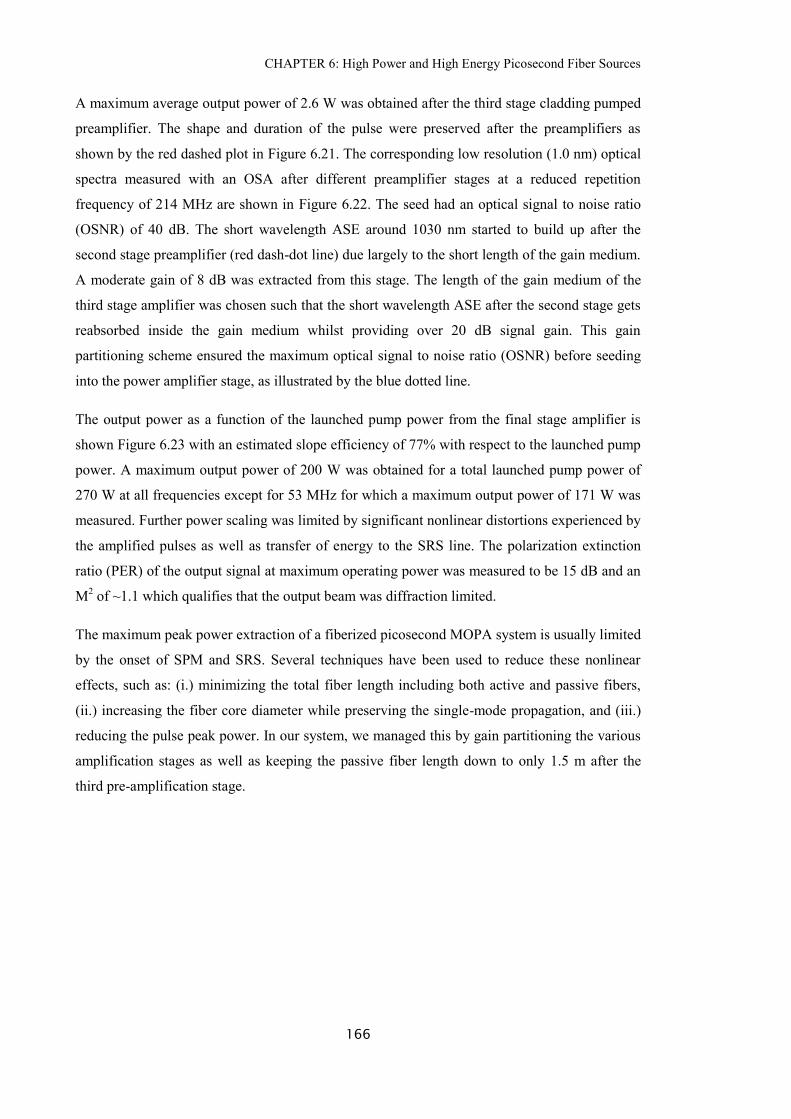
CHAPTER 6: High Power and High Energy Picosecond Fiber Sources
166
A maximum average output power of 2.6 W was obtained after the third stage cladding pumped
preamplifier. The shape and duration of the pulse were preserved after the preamplifiers as
shown by the red dashed plot in Figure 6.21. The corresponding low resolution (1.0 nm) optical
spectra measured with an OSA after different preamplifier stages at a reduced repetition
frequency of 214 MHz are shown in Figure 6.22. The seed had an optical signal to noise ratio
(OSNR) of 40 dB. The short wavelength ASE around 1030 nm started to build up after the
second stage preamplifier (red dash-dot line) due largely to the short length of the gain medium.
A moderate gain of 8 dB was extracted from this stage. The length of the gain medium of the
third stage amplifier was chosen such that the short wavelength ASE after the second stage gets
reabsorbed inside the gain medium whilst providing over 20 dB signal gain. This gain
partitioning scheme ensured the maximum optical signal to noise ratio (OSNR) before seeding
into the power amplifier stage, as illustrated by the blue dotted line.
The output power as a function of the launched pump power from the final stage amplifier is
shown Figure 6.23 with an estimated slope efficiency of 77% with respect to the launched pump
power. A maximum output power of 200 W was obtained for a total launched pump power of
270 W at all frequencies except for 53 MHz for which a maximum output power of 171 W was
measured. Further power scaling was limited by significant nonlinear distortions experienced by
the amplified pulses as well as transfer of energy to the SRS line. The polarization extinction
ratio (PER) of the output signal at maximum operating power was measured to be 15 dB and an
M2 of ~1.1 which qualifies that the output beam was diffraction limited.
The maximum peak power extraction of a fiberized picosecond MOPA system is usually limited
by the onset of SPM and SRS. Several techniques have been used to reduce these nonlinear
effects, such as: (i.) minimizing the total fiber length including both active and passive fibers,
(ii.) increasing the fiber core diameter while preserving the single-mode propagation, and (iii.)
reducing the pulse peak power. In our system, we managed this by gain partitioning the various
amplification stages as well as keeping the passive fiber length down to only 1.5 m after the
third pre-amplification stage.
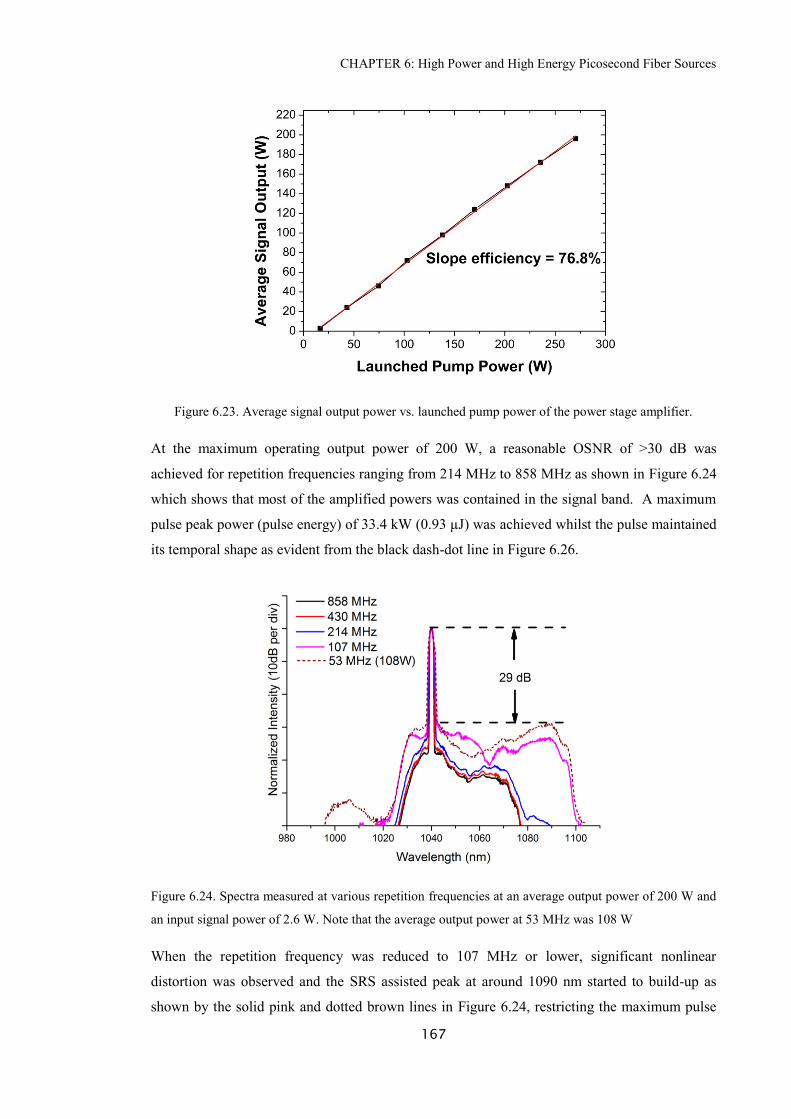
CHAPTER 6: High Power and High Energy Picosecond Fiber Sources
167
Figure 6.23. Average signal output power vs. launched pump power of the power stage amplifier.
At the maximum operating output power of 200 W, a reasonable OSNR of >30 dB was
achieved for repetition frequencies ranging from 214 MHz to 858 MHz as shown in Figure 6.24
which shows that most of the amplified powers was contained in the signal band. A maximum
pulse peak power (pulse energy) of 33.4 kW (0.93 µJ) was achieved whilst the pulse maintained
its temporal shape as evident from the black dash-dot line in Figure 6.26.
Figure 6.24. Spectra measured at various repetition frequencies at an average output power of 200 W and
an input signal power of 2.6 W. Note that the average output power at 53 MHz was 108 W
When the repetition frequency was reduced to 107 MHz or lower, significant nonlinear
distortion was observed and the SRS assisted peak at around 1090 nm started to build-up as
shown by the solid pink and dotted brown lines in Figure 6.24, restricting the maximum pulse
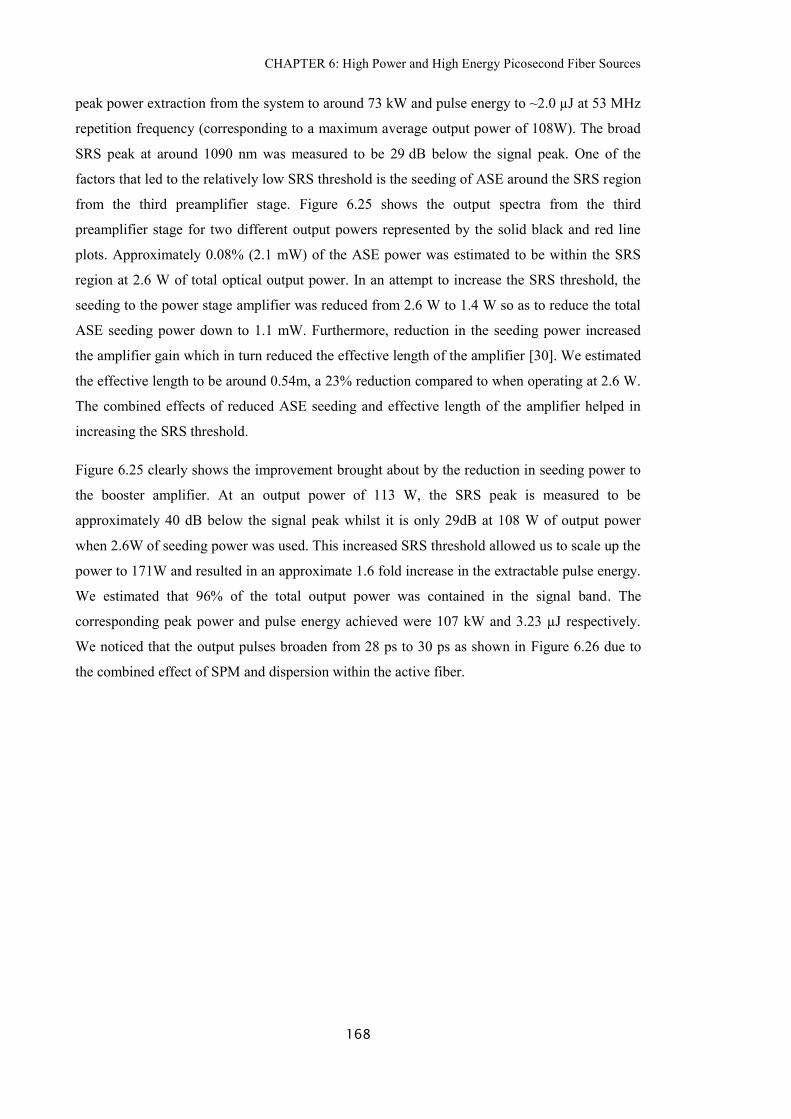
CHAPTER 6: High Power and High Energy Picosecond Fiber Sources
168
peak power extraction from the system to around 73 kW and pulse energy to ~2.0 µJ at 53 MHz
repetition frequency (corresponding to a maximum average output power of 108W). The broad
SRS peak at around 1090 nm was measured to be 29 dB below the signal peak. One of the
factors that led to the relatively low SRS threshold is the seeding of ASE around the SRS region
from the third preamplifier stage. Figure 6.25 shows the output spectra from the third
preamplifier stage for two different output powers represented by the solid black and red line
plots. Approximately 0.08% (2.1 mW) of the ASE power was estimated to be within the SRS
region at 2.6 W of total optical output power. In an attempt to increase the SRS threshold, the
seeding to the power stage amplifier was reduced from 2.6 W to 1.4 W so as to reduce the total
ASE seeding power down to 1.1 mW. Furthermore, reduction in the seeding power increased
the amplifier gain which in turn reduced the effective length of the amplifier [30]. We estimated
the effective length to be around 0.54m, a 23% reduction compared to when operating at 2.6 W.
The combined effects of reduced ASE seeding and effective length of the amplifier helped in
increasing the SRS threshold.
Figure 6.25 clearly shows the improvement brought about by the reduction in seeding power to
the booster amplifier. At an output power of 113 W, the SRS peak is measured to be
approximately 40 dB below the signal peak whilst it is only 29dB at 108 W of output power
when 2.6W of seeding power was used. This increased SRS threshold allowed us to scale up the
power to 171W and resulted in an approximate 1.6 fold increase in the extractable pulse energy.
We estimated that 96% of the total output power was contained in the signal band. The
corresponding peak power and pulse energy achieved were 107 kW and 3.23 µJ respectively.
We noticed that the output pulses broaden from 28 ps to 30 ps as shown in Figure 6.26 due to
the combined effect of SPM and dispersion within the active fiber.
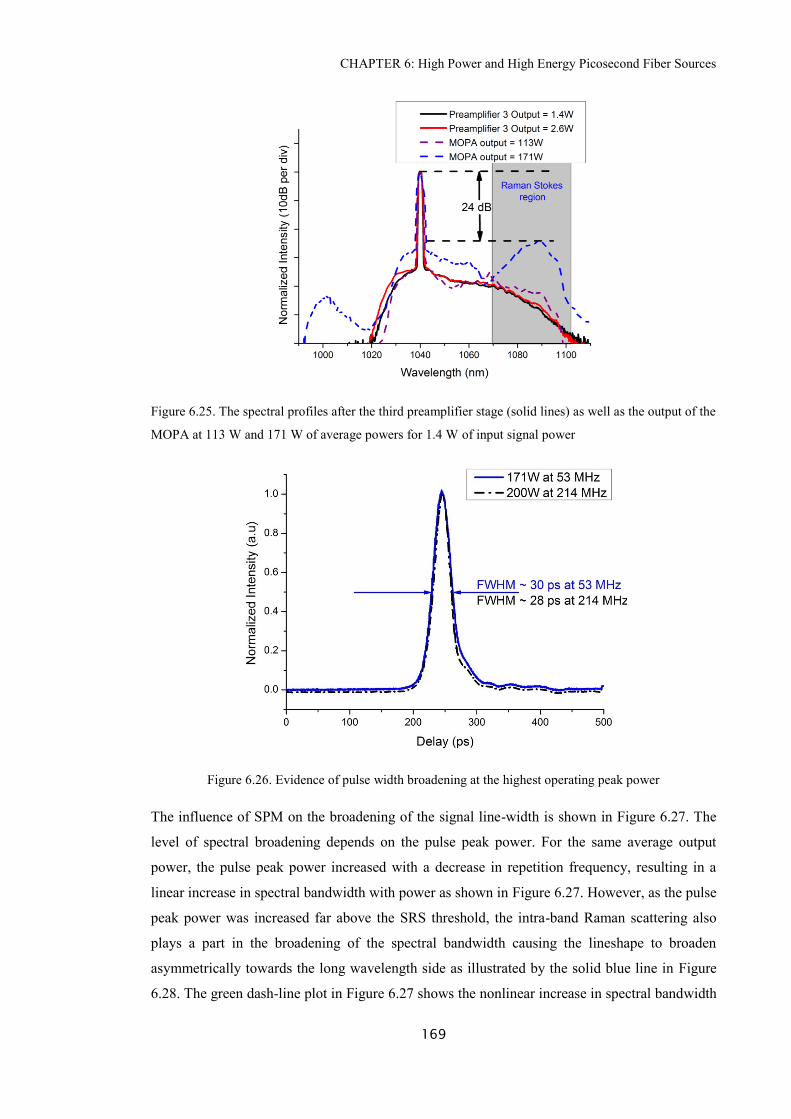
CHAPTER 6: High Power and High Energy Picosecond Fiber Sources
169
Figure 6.25. The spectral profiles after the third preamplifier stage (solid lines) as well as the output of the
MOPA at 113 W and 171 W of average powers for 1.4 W of input signal power
Figure 6.26. Evidence of pulse width broadening at the highest operating peak power
The influence of SPM on the broadening of the signal line-width is shown in Figure 6.27. The
level of spectral broadening depends on the pulse peak power. For the same average output
power, the pulse peak power increased with a decrease in repetition frequency, resulting in a
linear increase in spectral bandwidth with power as shown in Figure 6.27. However, as the pulse
peak power was increased far above the SRS threshold, the intra-band Raman scattering also
plays a part in the broadening of the spectral bandwidth causing the lineshape to broaden
asymmetrically towards the long wavelength side as illustrated by the solid blue line in Figure
6.28. The green dash-line plot in Figure 6.27 shows the nonlinear increase in spectral bandwidth
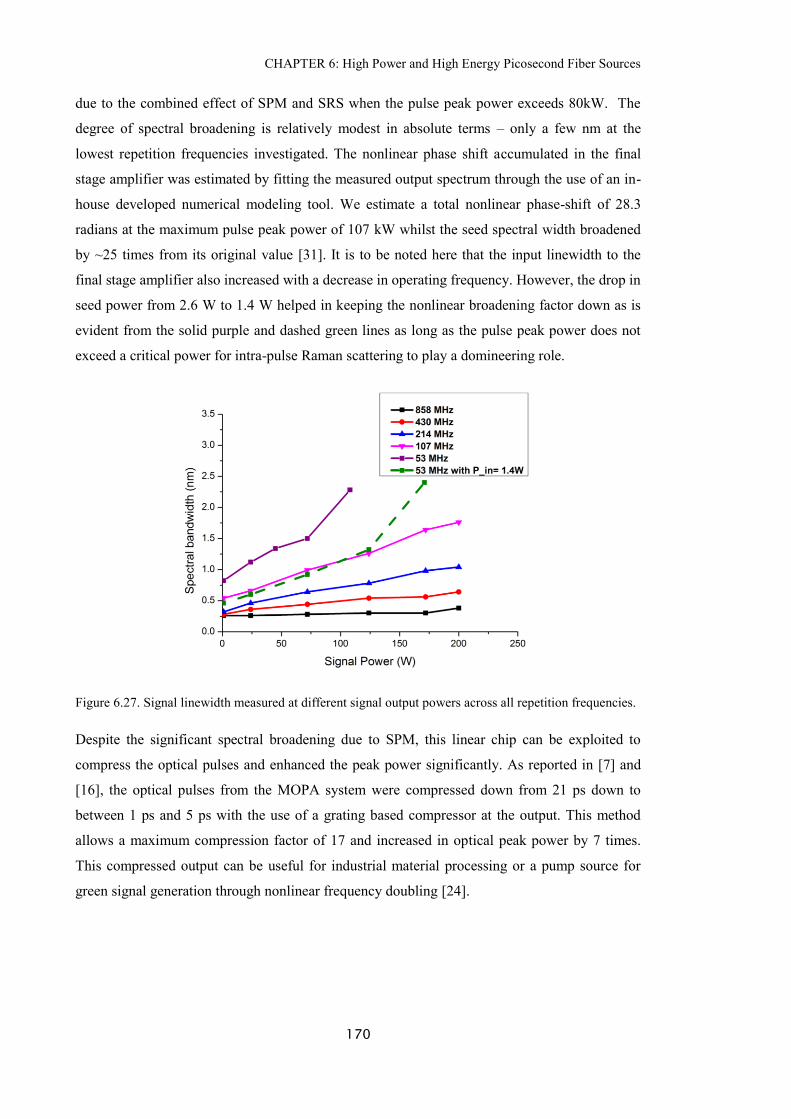
CHAPTER 6: High Power and High Energy Picosecond Fiber Sources
170
due to the combined effect of SPM and SRS when the pulse peak power exceeds 80kW. The
degree of spectral broadening is relatively modest in absolute terms – only a few nm at the
lowest repetition frequencies investigated. The nonlinear phase shift accumulated in the final
stage amplifier was estimated by fitting the measured output spectrum through the use of an in-
house developed numerical modeling tool. We estimate a total nonlinear phase-shift of 28.3
radians at the maximum pulse peak power of 107 kW whilst the seed spectral width broadened
by ~25 times from its original value [31]. It is to be noted here that the input linewidth to the
final stage amplifier also increased with a decrease in operating frequency. However, the drop in
seed power from 2.6 W to 1.4 W helped in keeping the nonlinear broadening factor down as is
evident from the solid purple and dashed green lines as long as the pulse peak power does not
exceed a critical power for intra-pulse Raman scattering to play a domineering role.
Figure 6.27. Signal linewidth measured at different signal output powers across all repetition frequencies.
Despite the significant spectral broadening due to SPM, this linear chip can be exploited to
compress the optical pulses and enhanced the peak power significantly. As reported in [7] and
[16], the optical pulses from the MOPA system were compressed down from 21 ps down to
between 1 ps and 5 ps with the use of a grating based compressor at the output. This method
allows a maximum compression factor of 17 and increased in optical peak power by 7 times.
This compressed output can be useful for industrial material processing or a pump source for
green signal generation through nonlinear frequency doubling [24].
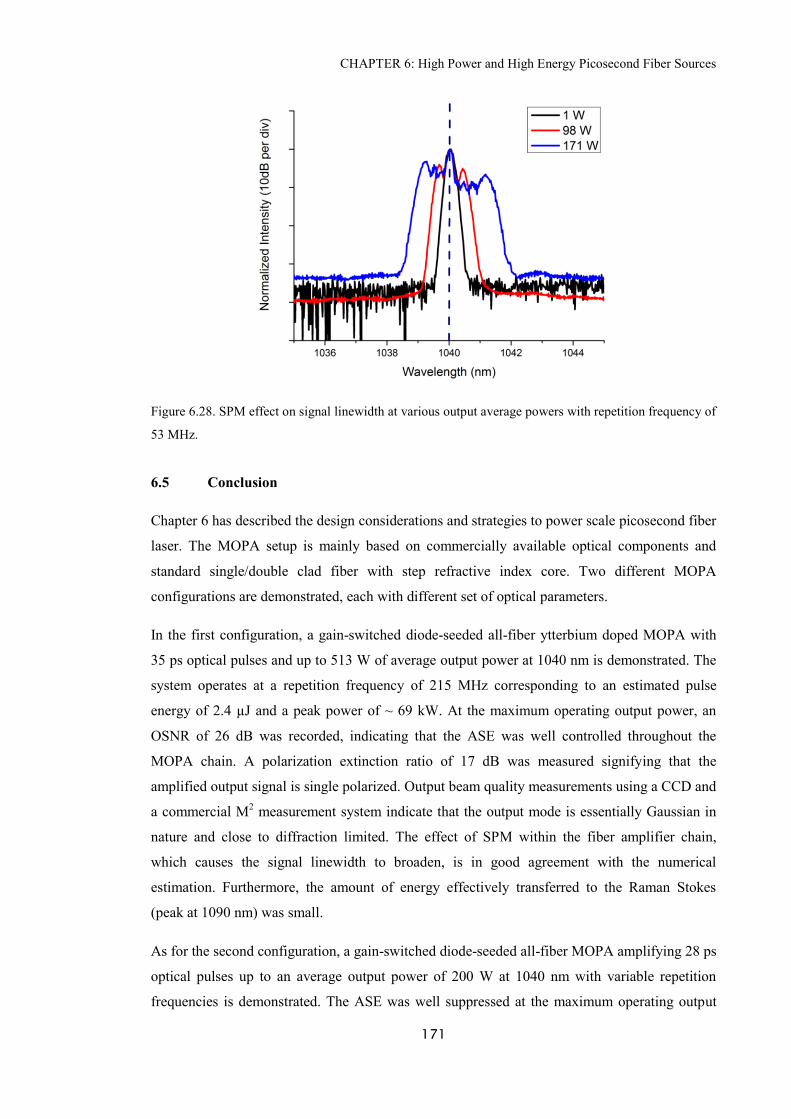
CHAPTER 6: High Power and High Energy Picosecond Fiber Sources
171
Figure 6.28. SPM effect on signal linewidth at various output average powers with repetition frequency of
53 MHz.
6.5 Conclusion
Chapter 6 has described the design considerations and strategies to power scale picosecond fiber
laser. The MOPA setup is mainly based on commercially available optical components and
standard single/double clad fiber with step refractive index core. Two different MOPA
configurations are demonstrated, each with different set of optical parameters.
In the first configuration, a gain-switched diode-seeded all-fiber ytterbium doped MOPA with
35 ps optical pulses and up to 513 W of average output power at 1040 nm is demonstrated. The
system operates at a repetition frequency of 215 MHz corresponding to an estimated pulse
energy of 2.4 µJ and a peak power of ~ 69 kW. At the maximum operating output power, an
OSNR of 26 dB was recorded, indicating that the ASE was well controlled throughout the
MOPA chain. A polarization extinction ratio of 17 dB was measured signifying that the
amplified output signal is single polarized. Output beam quality measurements using a CCD and
a commercial M2 measurement system indicate that the output mode is essentially Gaussian in
nature and close to diffraction limited. The effect of SPM within the fiber amplifier chain,
which causes the signal linewidth to broaden, is in good agreement with the numerical
estimation. Furthermore, the amount of energy effectively transferred to the Raman Stokes
(peak at 1090 nm) was small.
As for the second configuration, a gain-switched diode-seeded all-fiber MOPA amplifying 28 ps
optical pulses up to an average output power of 200 W at 1040 nm with variable repetition
frequencies is demonstrated. The ASE was well suppressed at the maximum operating output
CHAPTER 6: High Power and High Energy Picosecond Fiber Sources
172
power across all the operating frequencies with OSNR values ranging between 25 dB to 35 dB.
A maximum pulse energy of 3.23 μJ was achieved at the lowest operating frequency of 53 MHz
corresponding to a pulse peak power of 107 kW. Further energy scaling was primarily limited
by the rapid build-up of the SRS peak at around 1090 nm. It may be possible to enhance the
output pulse energy by filtering out the long wavelength signal components after the third pre-
amplifier stage using a narrow band-pass filter (<0.5 nm) which otherwise acts as a seed for the
SRS line.
Both configurations demonstrated that SRS is the main limiting factor for achieving high pulse
energy. The spectral purity of the input signal to the final amplifier plays crucial role in the
build-up of SRS peak. Proper management or filtering of the long wavelength ASE (>1070 nm)
generated from the 3rd
preamplifier is required to avoid SRS seeding in the final amplifier.
Moreover, the use of larger core fiber helped in increasing nonlinear threshold and allowed
scaling of the pulse peak power and pulse energy. However, mode preservation in fiber with
even larger core diameter will be challenging and specialty fiber (e.g. PCF) may need to be
explored for further energy scaling whilst maintaining good beam quality.
CHAPTER 6: High Power and High Energy Picosecond Fiber Sources
173
6.6 References
1. D. J. Richardson, J. Nilsson, and W. A. Clarkson, "High power fiber lasers: current status
and future perspectives [Invited]," J. Opt. Soc. Am. B 27, B63-B92 (2010).
2. H. M. Pask, R. J. Carman, D. C. Hanna, A. C. Tropper, C. J. Mackechnie, P. R. Barber,
and J. M. Dawes, "Ytterbium-doped silica fiber lasers: versatile sources for the 1-1.2
μm region," Selected Topics in Quantum Electronics, IEEE Journal of 1, 2-13
(1995).
3. Y. Jeong, J. Sahu, D. Payne, and J. Nilsson, "Ytterbium-doped large-core fiber laser with
1.36 kW continuous-wave output power," Opt. Express 12, 6088-6092 (2004).
4. Y. Fan, B. He, J. Zhou, J. Zheng, H. Liu, Y. Wei, J. Dong, and Q. Lou, "Thermal effects
in kilowatt all-fiber MOPA," Opt. Express 19, 15162-15172 (2011).
5. P. Dupriez, J. K. Sahu, A. Malinowski, Y. Jeong, D. J. Richardson, and J. Nilsson, "80 W
Green Laser Based on a Frequency-Doubled Picosecond, Single-Mode, Linearly-
Polarized Fiber Laser," in Conference on Lasers and Electro-Optics/Quantum Electronics
and Laser Science Conference and Photonic Applications Systems Technologies(Optical
Society of America, Long Beach, California, 2006), p. CThJ1.
6. F. Kienle, K. K. Chen, S.-u. Alam, C. B. E. Gawith, J. I. Mackenzie, D. C. Hanna, D. J.
Richardson, and D. P. Shepherd, "High-power, variable repetition rate, picosecond optical
parametric oscillator pumped by an amplified gain-switched diode," Opt. Express 18,
7602-7610 (2010).
7. F. Kienle, P. S. Teh, D. Lin, S.-u. Alam, J. H. V. Price, D. C. Hanna, D. J. Richardson,
and D. P. Shepherd, "High-power, high repetition-rate, green-pumped, picosecond LBO
optical parametric oscillator," Opt. Express 20, 7008-7014 (2012).
8. Z. Wei, G. McConnell, and M. Parsons, "Optical parametric oscillator system for CARS
microscopy," in Lasers and Electro-Optics 2009 and the European Quantum Electronics
Conference. CLEO Europe - EQEC 2009. European Conference on(2009), pp. 1-1.
9. L. Rapp, C. Cibert, A. P. Alloncle, and P. Delaporte, "Characterization of organic
material micro-structures transferred by laser in nanosecond and picosecond regimes,"
Appl. Surf. Sci. 255, 5439-5443 (2009).
10. D. A. Willis, and V. Grosu, "Microdroplet deposition by laser-induced forward transfer,"
Applied Physics Letters 86, - (2005).
11. D. Ashkenasi, T. Kaszemeikat, N. Mueller, A. Lemke, and H. J. Eichler, "Machining of
glass and quartz using nanosecond and picosecond laser pulses," (2012), pp. 82430M-
82430M-82437.
12. K. Pangovski, K. Li, and B. O’Neill, "Application of picosecond lasers for surface
modification and polishing."
CHAPTER 6: High Power and High Energy Picosecond Fiber Sources
174
13. M. Trtica, B. Gakovic, D. Batani, T. Desai, P. Panjan, and B. Radak, "Surface
modifications of a titanium implant by a picosecond Nd: YAG laser operating at 1064
and 532nm," Appl. Surf. Sci. 253, 2551-2556 (2006).
14. A. Piper, A. Malinowski, B. C. Thomsen, D. J. Richardson, L. M. B. Hickey, and M. N.
Zervas, "11.1 W average power, 20 ps pulses at 1 GHz repetition rate from a fiber-
amplified gain-switched 1.06 μm Fabry-Perot laser diode," in Lasers and Electro-
Optics, 2005. (CLEO). Conference on(2005), pp. 1141-1143 Vol. 1142.
15. P. Dupriez, A. Piper, A. Malinowski, J. K. Sahu, M. Ibsen, B. C. Thomsen, Y. Jeong, L.
M. B. Hickey, M. N. Zervas, J. Nilsson, and D. J. Richardson, "High average power, high
repetition rate, picosecond pulsed fiber master oscillator power amplifier source seeded
by a gain-switched laser diode at 1060 nm," Photonics Technology Letters, IEEE 18,
1013-1015 (2006).
16. K. K. Chen, J. H. V. Price, S.-u. Alam, J. R. Hayes, D. Lin, A. Malinowski, and D. J.
Richardson, "Polarisation maintaining 100W Yb-fiber MOPA producing µJ pulses
tunable in duration from 1 to 21 ps," Opt. Express 18, 14385-14394 (2010).
17. R. Song, J. Hou, S. Chen, W. Yang, and Q. Lu, "157 W all-fiber high-power picosecond
laser," Appl. Opt. 51, 2497-2500 (2012).
18. A. A. Balandin, S. Ghosh, W. Bao, I. Calizo, D. Teweldebrhan, F. Miao, and C. N. Lau,
"Superior thermal conductivity of single-layer graphene," Nano letters 8, 902-907 (2008).
19. A. V. Smith, and B. T. Do, "Bulk and surface laser damage of silica by picosecond and
nanosecond pulses at 1064 nm," Applied Optics 47, 4812-4832 (2008).
20. A. V. Smith, B. T. Do, G. R. Hadley, and R. L. Farrow, "Optical Damage Limits to Pulse
Energy From Fibers," Selected Topics in Quantum Electronics, IEEE Journal of 15, 153-
158 (2009).
21. A. Wetter, M. Faucher, B. Sévigny, and N. Vachon, "High core and cladding isolation
termination for high-power lasers and amplifiers," (2009), pp. 719521-719521-719528.
22. S. Sinha, K. E. Urbanek, A. Krzywicki, and R. L. Byer, "Investigation of the suitability of
silicate bonding for facet termination in active fiber devices," Opt. Express 15, 13003-
13022 (2007).
23. G. Agrawal, "Nonlinear Fiber Optics," in Nonlinear Science at the Dawn of the 21st
Century, P. L. Christiansen, M. P. Sørensen, and A. C. Scott, eds. (Springer Berlin
Heidelberg, 2000), pp. 195-211.
24. C. Kang Kang, S. U. Alam, J. R. Hayes, H. J. Baker, D. Hall, R. McBride, J. Price, D.
Lin, A. Malinowski, and D. J. Richardson, "56-W Frequency-Doubled Source at 530 nm
Pumped by a Single-Mode, Single-Polarization, Picosecond, Yb3+
-Doped Fiber MOPA,"
Photonics Technology Letters, IEEE 22, 893-895 (2010).
CHAPTER 6: High Power and High Energy Picosecond Fiber Sources
175
25. A. Tünnermann, T. Schreiber, F. Röser, A. Liem, S. Höfer, H. Zellmer, S. Nolte, and J.
Limpert, "The renaissance and bright future of fibre lasers," Journal of Physics B:
Atomic, Molecular and Optical Physics 38, S681 (2005).
26. S. Wielandy, "Implications of higher-order mode content in large mode area fibers with
good beam quality," Opt. Express 15, 15402-15409 (2007).
27. R. Paschotta, J. Nilsson, A. C. Tropper, and D. C. Hanna, "Ytterbium-doped fiber
amplifiers," Quantum Electronics, IEEE Journal of 33, 1049-1056 (1997).
28. J. Kim, P. Dupriez, C. Codemard, J. Nilsson, and J. K. Sahu, "Suppression of stimulated
Raman scattering in a high power Yb-doped fiber amplifier using a W-type core with
fundamental mode cut-off," Opt. Express 14, 5103-5113 (2006).
29. X. Ma, I. N. Hu, and A. Galvanauskas, "Propagation-length independent SRS threshold in
chirally-coupled-core fibers," Opt. Express 19, 22575-22581 (2011).
30. G. P. Agrawal, Nonlinear Fiber Optics (Academic Press, NY, 1995).
31. S. C. Pinault, and M. J. Potasek, "Frequency broadening by self-phase modulation in
optical fibers," J. Opt. Soc. Am. B 2, 1318 - 1319 (1985).

CHAPTER 6: High Power and High Energy Picosecond Fiber Sources
176
CHAPTER 7: Summary and Future Works
177
Chapter 7. Summary and Future Works
In this chapter, I will summarize the work presented here in this thesis and suggest possible
improvements and future research directions.
7.1 Summary
In Chapter 3, two different configurations of nanosecond fiber MOPA are demonstrated. The
first system was the improved version of the nanosecond MOPA with the use of EOM as pulse
shaping. The improvement towards the pulse shaping mechanism allows greater resolution and
faster rise/fall time for more accurate shaping. Pulse shape with higher complexity can now be
tailored with this system. The second system is known as SMART fiber laser system, which was
built in collaboration with SPI Lasers. The system is capable of producing up to 60W of average
power. AOM was used as pulse shaping for the first time and the high damage threshold of the
AOM allows it to be placed before the power amplifier. However, shaping is only limited to the
pulse leading edge due to the response of the AOM. Nevertheless, pulse energy up to 1.0mJ can
be extracted by shaping optical pulse using an AOM before the power amplifier. Output beam
quality (M2) was measured to be 1.1, close to the diffraction limited beam. The SRS limited
maximum pulse peak power was 18kW for 1.3 m of beam delivery fiber. The capabilities of
both MOPA systems were successfully tested with Si material processing experiment.
Chapter 4 introduces to a new technique of generating pulsed Raman based fiber laser. The use
of nanosecond MOPA with EOM as pulse shaping mechanism in an all fiber PM MOPA allows
the generation of shaped multistep pulses for selective excitation of the Raman stokes. With the
pump wavelength at 530 nm, Raman Stokes across different visible regions can be generated via
this technique. This resulting in output signal wavelength that changes sequentially from green,
to yellow to red (up to 7th stokes orders) using 530 nm pump pulses with 3 step profile or any
other two using 2-step pulses by exploiting the SRS in optical fiber. Operation in the NIR region
however is limited to 4 stokes order before zero dispersion wavelength of the fiber is reached.
Across that wavelength, a continuum started to build up. With the similar configuration
footprint and a small modification, a tunable, synchronous pumped Raman fiber laser was
developed. This Raman fiber laser can operate in the NIR and visible regions with continuous
tuning range of 28 nm in NIR and 2.8 nm in the visible regions. Efficiency of the Raman laser
increased with the use of feedback signal. Furthermore, linewidth of the Raman Stokes in both
regions shows narrowing effect. Although the average output power demonstrated is still
modest, however with the right fiber type (microstructured fiber) and length of Raman gain,
further power scaling is possible.
CHAPTER 7: Summary and Future Works
178
Chapter 5 demonstrates the use of SLD for gain switching. The SLD used are of different
manufacturers and both the characteristics of the temporal and spectral are investigated. Most of
the outputs have broad spectral as a result of excitation of multiple longitudinal modes in the
diode cavity. By using external seeding, the output spectrum can be compressed down.
Throughout the investigation both with and without external seeding, narrow output spectrum
was observed. However, this was accompanied by distorted output pulses. Next, with the use of
gain switched driving technique combined with a simply cavity consisting an external FBG,
both spectrum and temporal compression were observed. Optical pulses with transform limited
duration was obtained and mode-locking mechanism is believed to be the mechanism behind
this observation. With this technique, a short 18 ps optical pulse with a pulse energy of 7.2 pJ
and corresponding peak power of 400 mW was obtained. Further characterization works were
carried out resulting in the optical pulse with chirp free and with high stability (low timing
jitter).
Power scaling of picosecond seeded fiber MOPA is demonstrated in Chapter 6. Furthermore,
the design considerations and strategies to power scale picoseconds fiber laser are discussed in
this chapter. The MOPA setup is mainly based on commercially available optical components
and standard single/double clad with step refractive index fibers. Two different MOPA
configurations are demonstrated, each with different set of optical parameters. Both
configurations was seeded by a gain switched SLD and with operating wavelength of 1040 nm.
The first configuration demonstrated up to 513 W of optical output power with 35 ps pulses and
at 215 MHz repetition frequency. The corresponding peak power was estimated to be ~69 kW.
Furthermore, the output was single polarization, with PER of over 17 dB recorded. The second
configuration has 28 ps output pulses and with a total average power of 200 W. This
configuration is able to operate at repetition frequency between 858 MHz and 53 MHz with
maximum output power of 200 W (except for 53 MHz where maximum output power is only
171 W). The maximum peak power achieved was estimated to be ~107 kW. Both configurations
showed SRS is the main limiting factor for further power scaling. The spectral purity of the
input signal to the power amplifier plays crucial role in the build-up of SRS peak. Moreover,
spectral broadening as a result of SPM becomes significant when operating at high peak power.
EOM offers a continuous tunable repetition rate which enable generation of different peak
powers at a fixed average optical power, allowing control on the spectral broadening due to
SPM.
CHAPTER 7: Summary and Future Works
179
7.2 Future works
Demands for pulse energy from fiber based laser systems are increasing with more and more
new applications especially in material processing. It is a challenging task to extract more
energy from the fiber amplifiers since gain saturation, ASE, nonlinear effects and pump power
dictate the maximum energy that can be extracted from the amplifiers. The use of specialty fiber
such as Yb doped PCF can be the direct solution for obtaining higher pulse energy. Another
method worth venturing is operating the laser in burst mode with pulse tailoring profiles. The
first few pulses may consists of short nanosecond pulses but with high peak intensity sufficient
to melt the target area and followed by long nanosecond pulses packed with energy to help
further vaporisation and ejection of molten materials.
In the pulsed Raman based fiber laser, the performance can be further improved with better
selection of Raman gain fiber. Fiber resistance to photodarkening has to be used since the
operating signal is in visible regions. Thus, further works with the use of PCF as gain media can
be carried out to investigate the efficiency of Raman stokes generation. With large effective
mode area and the use of sufficiently short piece of PCF, Raman threshold can be further
increased, allowing more optical power to be transferred to the selected Raman stokes. Increase
in optical power in the selected Raman stokes will allow the system to be used effectively in the
field of spectroscopy, medical and many more.
The generation of transform limited optical pulses via gain switched SLD with FBG as external
cavity is an attractive scheme due to its simplicity and efficiency. By replacing the FBG with a
tunable Bragg grating, it is possible to achieve similar transform limited optical pulses across all
wavelengths tuning. Furthermore, since the gain of the SLD depends on the operating
wavelength, it is possible to achieve even shorter pulse duration if the gain and grating
bandwidth are both sufficiently wide.
Performance of picosecond all fiber MOPA has reached a new height with the recent
demonstration of over 500 W of optical power. This demonstration is by far the highest record
achieved by all fiber picosecond laser system to date. However, the experimental results showed
that there are still rooms for further power scaling. New fibers with better doping concentration
and larger effective mode area can improve the peak power of the system by a factor of 5.
Ultimately, peak power in MW range will be made possible and may replace bulk laser in most
applications. Besides that, the availability of high power pulsed source as pump source allows
high impact experiments to be done using various nonlinear frequency conversion media. For
example, record level optical power in green (via frequency doubling) or super bright white
light (via supercontinuum generation) can be achieved with such laser system. Furthermore, the
configuration can be further improvised to operate in burst mode. The burst picosecond optical

CHAPTER 7: Summary and Future Works
180
pulses can be shaped similar to nanosecond MOPA system. It has great advantage compared to
nanosecond MOPA as the picosecond burst MOPA is free from SBS.
Appendix: List of Publications
181
Appendix: List of Publications
Journals related to this thesis
1. P. S. Teh, S.-u. Alam, R. J. Lewis, and D. J. Richardson, "Single polarization
picosecond fiber MOPA power scaled to beyond 500 W," Laser Physics Letters 11,
085103 (2014).
2. P. S. Teh, S.-u. Alam, D. P. Shepherd, and D. J. Richardson, "Generation of mode-
locked optical pulses at 1035 nm from a fiber Bragg grating stabilized semiconductor
laser diode," Opt. Express 22, 13366-13373 (2014).
3. K. Pangovski, M. Sparkes, A. Cockburn, W. O'Neill, T. Peh Siong, L. Dejiao, and D.
Richardson, "Control of Material Transport Through Pulse Shape Manipulation: A
Development Toward Designer Pulses," Selected Topics in Quantum Electronics, IEEE
Vol. 20, 51-63 (2014).
4. P. S. Teh, R. J. Lewis, S.-u. Alam, and D. J. Richardson, "200 W Diffraction limited,
single-polarization, all-fiber picosecond MOPA," Opt. Express 21, 25883-25889
(2013).
5. D. Lin, S.-u. Alam, P. S. Teh, K. K. Chen, and D. J. Richardson, "Selective excitation
of multiple Raman Stokes wavelengths (green-yellow-red) using shaped multi-step
pulses from an all-fiber PM MOPA," Opt. Express 19, 2085-2092 (2011).
6. D. Lin, S.-u. Alam, P. S. Teh, K. K. Chen, and D. J. Richardson, "Tunable
synchronously-pumped fiber Raman laser in the visible and near-infrared exploiting
MOPA-generated rectangular pump pulses," Optics Letters 36, 2050-2052 (2011)
Conference contributions related to this thesis
1. T. Peh Siong, S. U. Alam, C. Ho-Yin, D. P. Shepherd, and D. J. Richardson,
"Generation of transform-limited picosecond pulses at 1.0um from a gain switched
semiconductor laser diode," in Photonics (ICP), 2013 IEEE 4th International
Conference on Photonics, Melaka, Malaysia (2013), pp. 240-243.
2. P. S. Teh, H.-Y. Chan, R. J. Lewis, S.-u. Alam, D. P. Shepherd, and D. J. Richardson,
"200W Gain-Switched-Diode-Seeded, Single-Polarization, Narrow-Linewidth, All-
Fiber, Picosecond MOPA," in CLEO: 2013(Optical Society of America, San Jose,
California, 2013), p. CW3M.2.
Appendix: List of Publications
182
3. S. Alam, L. Dejiao, T. Peh Siong, C. Kang Kang, and D. J. Richardson, "A fiber based
synchronously pumped tunable Raman laser in the NIR," in Lasers and Electro-Optics
Europe (CLEO EUROPE/EQEC), 2011 Conference on and 12th European Quantum
Electronics Conference(2011), pp. 1-1.
Other publications
1. F. Kienle, S.-u. Alam, P. S. Teh, D. Lin, J. H. V. Price, D. C. Hanna, D. J. Richardson,
and D. P. Shepherd, "High power high repetition rate picosecond optical parametric
oscillator pumped by frequency doubled all-fiber Yb-doped MOPA," In SPIE Photonics
Europe, pp. 843302-843302. International Society for Optics and Photonics, 2012.
2. F. Kienle, P. S. Teh, D. Lin, S.-u. Alam, J. H. V. Price, D. C. Hanna, D. J. Richardson,
and D. P. Shepherd, "High-power, high repetition-rate, green-pumped, picosecond LBO
optical parametric oscillator," Opt. Express 20, 7008-7014 (2012).
3. S. Jindan, F. Xian, P. Horak, C. Kangkang, T. Peh Siong, S. Alam, W. H. Loh, D. J.
Richardson, and M. Ibsen, "1.06 μm Picosecond Pulsed, Normal Dispersion Pumping
for Generating Efficient Broadband Infrared Supercontinuum in Meter-Length Single-
Mode Tellurite Holey Fiber With High Raman Gain Coefficient," Lightwave
Technology, Journal of 29, 3461-3469 (2011).
4. X. Feng, J. Shi, C.-C. Huang, P. Horak, P. S. Teh, S.-u. Alam, M. Ibsen, and W. H.
Loh, "Laser-induced crystalline optical waveguide in glass fiber format," Opt. Express
20, B85-B93 (2012).
5. Y. Jung, Q. Kang, V. A. J. M. Sleiffer, B. Inan, M. Kuschnerov, V. Veljanovski, B.
Corbett, R. Winfield, Z. Li, P. S. Teh, A. Dhar, J. Sahu, F. Poletti, S. U. Alam, and D.
J. Richardson, "Three mode Er3+ ring-doped fiber amplifier for mode-division
multiplexed transmission," Opt. Express 21, 10383-10392 (2013).
6. Z. Li, A. M. Heidt, P. S. Teh, M. Berendt, J. K. Sahu, R. Phelan, B. Kelly, S. U. Alam,
and D. J. Richardson, "High-energy diode-seeded nanosecond 2μm fiber MOPA
systems incorporating active pulse shaping," Optics Letters 39, 1569-1572 (2014).