university of southern queensland faculty of...
TRANSCRIPT
University of Southern Queensland
Faculty of Engineering & Surveying
Corrosion in the boiler tubes of the Tuas South Incineration Plant, Singapore
A dissertation submitted by
Noorahmad Bin Ali
in fulfilment of the requirements of
ENG4111/4112 Research Project
towards the degree of
Bachelor of (Mechatronic Engineering)
Submitted: October, 2005

Abstract Incineration of refuse has evolved into a widely used, established technology with reliable
modern facilities operating on a fully commercial basis in some advanced countries
including Singapore. However this method for processing refuse has produces pollutants
such as Carbon Monoxide (CO), Hydrochloride (HCl) and Sulphur Dioxide (SO2). Inside
the incinerator, these gases could cause corrosion and tamper with the efficiency of the
incinerator.
One such common occurrence of corrosion is the growth of slag, due to exposure to high
HCl concentration. This could affect the thermal efficiency of the incinerator due to
leakage of heat at elevated temperatures. It could also lead to corrosion-fatigue, which
would affect the structural integrity of the superheater tube.
The aim of this report, therefore, is to study the causes of corrosion to the incinerator, in
particular, the superheater tube, and to recommend measures that could minimize the
occurrence of the corrosion with a view to prolong the lifespan of the tube.
The report begins with an introduction of the Tuas South Incineration Plant (TSIP), where
the project was carried out, with an overview of the process flows in the plant undergone
by the refuse, flue gas, wastewater and feedwater.
The report next looks at the typical components of refuse ending up in an incinerator, how
these refuse components alter the characteristics of gases in flue gas, and how these gases
could affect the performance and integrity of the boiler. The report will establish that the
burning of plastics will release HCl which creates an environment that sets the stage for a
continuous attack on the metal structure of the boiler. Another finding is that the presence
of excess free oxygen in the furnace might affect the burning of refuse in the combustion
process. This is attributed by the fact that free oxygen could react with the metal of the
superheater tube to produce iron oxide (rust).
I

The report will also outline the analysis on the causes of corrosion on a critical part of the
boiler component – the superheater. The analysis will establish that the corrosion caused by
hydrogen chloride (HCl) found in flue gas is a general corrosion on the tubes.
Besides theoretical calculations, the report also reported on the experimental measurements
and observations carried out, to complete the analytical component of the project. The
experiment is performed by placing specimens (SA192-CARBON STEEL) in two different
furnaces of an actual incinerator (TSIP) over a period of time to determine the extent of
corrosion. The exact conditions experienced in a furnace are therefore replicated, to get as
realistic a result as possible.
Another avenue addressed by the report is the feasibility of material replacement. Two
candidates identified are nickel-chromium and nickel-chromium-molybdenum steel. Both
are viable alternatives to achieve the same performance, and have several characteristics that
are superior to carbon steel. After a careful consideration of the costs involved, including
depreciation, the costs of installation, maintenance and operation, it was found that it may
make more economics sense to use nickel-chromium steel. However, while apparent
theoretically, in reality the commercial availability of nickel-chromium steel tubes needs to
be ascertained. And more importantly, while it may have a long lifespan in theory, in
practice it could be retired well before it has reached its life because of the service
considerations of the particular boiler.
The report ends with several recommendations on measures that could minimize the
occurrence of the corrosion with a view to prolonging the lifespan of the superheater, taking
into consideration that there has yet to be a feasible solution that could completely eliminate
the problem. Recommended measures include reviewing existing operational practices (such
as proper mixture of refuse), installing additional equipment (to prevent the gases from
coming into contact with the tubes; to ensure that the gases are thoroughly mixed; and to
remove deposits by installing retractable soot blowers with wide access lanes) and to
manually clean deposits at the interval of six months after its annual overhaul works.
II
Disclaimer
University of Southern Queensland
Faculty of Engineering and Surveying
ENG4111 & ENG4112 Research Project
Limitations of Use The Council of the University of Southern Queensland, its Faculty of Engineering and Surveying and the staff of the University of Southern Queensland, do not accept any responsibility for the truth, accuracy or completeness of material contained within or associated with this dissertation. Persons using all or any part of this material do so at their own risk, and not at the risk of the Council of the University of Southern Queensland, its Faculty of Engineering and Surveying or the staff of the University of Southern Queensland. This dissertation reports an educational exercise and has no purpose or validity beyond this exercise. The sole purpose of the course pair entitled “Research Project” is to contribute to the overall education within the student’s chosen degree program. This document, the associated hardware, software, drawings, and other material set out in the associated appendices should not be used for any other purpose: if they are so used, it is entirely at the risk of the user. Prof G Baker Dean Faculty of Engineering and Surveying
III

Certification
I certify that the ideas, experimental work, result, analyses and conclusions set out in this
dissertation are entirely my on effort, except where otherwise indicated and acknowledged
To the best of my knowledge or belief, it contains no material previously published or
written by another person, except where due reference is made in the text of this thesis.
Noorahmad bin Ali
005006724
___________________
Signature
___________________
Date
IV

Acknowledgement I would like to take opportunity to thank the following people that graciously offered me their
invaluable time and guidance in the course of this project.
Dr.Wenyi Yan Project Supervisor
Mr Mohd Ghazali Operation Manager (TSIP)
I would also like to express my special thank to my family and friends for all their never-
ending help and support throughout the years of stud
V

Table of Contents ABSTRACT…………………………………………………………………………..I CERTIFICATION...........……………………………………………………………IV ACKNOWLEDGEMENT…..................................................…….......……...…..V TABLE OF CONTENTS…………………………………………………………….VI LIST OF FIGURES…………………………………………………………………..VIII LIST OF TABLES …………………………………………………………………...XI INTRODUCTION…………………………………………………………………….XII FORMAT OF REPORT……………………………………………………………....XIII 1 INTRODUCTION OF TUAS SOUTH INCINERATION PLANT IN SINGAPORE
1.1 Background……………………………………………………………………………………...1 1.2 TSIP…………………………………………………………………………………………….2 1.3 PROCESS DESCRIPTION…………………………………………………………………..…3
1.3.1 Refuse Flow………………………………………………………………………………5 1.3.2 Ash Flow………………………………………………………………………………...12 1.3.3 Flue Gas Flow and Lime Injection for Flue Gas Treatment…………………………….16 1.3.4 WASTE WATERTREATMENT SYSTEM………………………………………….…18
1.3.4.1 Waste Water Flow……………………………………………………………..20 1.3.4.2 Refuse Waste Water…………………………………………………...….…...20 1.3.4.3 Ash Waste water…………………………………………………………….....20 1.3.4.4 Neutralization Buffer Basin……………………………………………………21
1.3.5 FEEDWATER, STEAM AND CONDENSATE SYSTEM……………..……………...23 1.3.5.1 Boiler Circulation Circuits……………………………………………………23 1.3.5.2 Description Of Boiler Circulation…………………………………………….23 1.3.5.3 Steam Drum Internal…………………………………………………………..25 1.3.5.4 Steam Flow……………………………………………………………………26 1.3.5.5 Condensate Flow……………………………………………………………...28 1.3.5.6 Boiler Feedwater Flow………………………………………………………..31 1.3.5.7 Chemical Flow………………………………………………………………..31 1.3.5.8 Drain Flow…………………………………………………………………...31
2 WASTE FUEL FIRING
2.1 Introduction……………………………………………………………………………………..…33 2.2 Background…………….…………………………………………………………………………..33 2.3 Analysis of Solid Wastes…………………………………………………………………………..34 2.4 Combustion Theory and Calculations………………. …………………………………………….36
2.4.1 Theoretical Air for Combustion………………………………………………………….37 2.4.2 Excess Air and Percentage of Oxygen in Flue Gas………………………………………38 2.4.3 Excess Air Calculation…………………………………………………………………...39
VI
2.4.4 Requirements Combustion…………………………………………………………….....42 2.4.5 Flue Gas Analysis………………………………………………………………………...43
2.4.6 Flue Gas Sampling………………………………………………………………………..44 2..5 TSIP Combustion control System………………………………………………………..45 3 CAUSE OF CORROSION AND LEAKAGE IN THE BOILER SUPERHEATER
3.1 Introduction………………….……………………………………………………………………..49 3.2 Corrosion…………………………………………………………………………………………...49 3.3 Types of Corrosion…………………………………………………………………………………50
3.3.1 High Temperature Corrosion…………………………………………………………….50 3.2.2 Oxygen Corrosion………………………………………………………………...…...…51
3.4 Analysis of Superheater tube thickness measurement…………………………………………......53 3.5 Location of the Superheater Tube in the boiler…….........………………………………………...55 3.6 Environment Condition in the boiler at the Location of Superheater Tube….........………………56 3.7 Analysis on Raw Hydrochloride (HCL) and Oxygen Content during Combustion Process…...….62
4 EXPERIMENTAL
4.1 Introduction………………………………………………………………………………..……….64 4.2 Experimental Procedures…………………………………...………………………………………65
4.2.1 Safety Aspects...……………………………………………………………………..…..66 4.2.2 Permit-To-Work..…………………………………………..………………………...….67
4.3 Analysis on Corrosion of the Test Specimens in the Superheater location...............................................68
4.3.1 Observation........................................................................................................................68 4.3.2 Analyzing the ash deposited at the Superheater tube.................................................................68
4.3.3 Tune Metal Temperature....................................................................................................74 4.3.4 Experiment.........................................................................................................................76 4.3.5 Studies of TSIP incinerator Fly Ash...........................................................................................79
4.4 Stress Calculation in the Superheater tube 4.4.1 Internal Pressure in the superheater tube obtained through experimental...................................82 4.4.2 Stress calculation.........................................................................................................................83
5 MATERIAL SELECTION
5.1 Introduction………………………………………………….………………………………………85 5.2 Comparison of Properties Analysis.....................................................................................................85
5.2.1 Selection Of Material………………………… ………………….…………………..…...86 5.2.2 Service Requirements of a Material …….…………………..………………………….…87
5.3 The Incumbent – Carbon Steel………………………………………………………………………87 5.4 Alternative Metals...............................................................................................................................88
5.4.1 Nickel Chromium Steel……………………… ……………………………………..…….88 5.4.2 Nickel Chromium Molybdenum Steel ………………………..……………………….….90
5.5 The Next Step..…….……………………………………………………….......…91 6 COST ANALYSIS
6.1 Introduction………………………………………………….………………………………………92 6.2 Components of Costs..........................................................................................................................92 6.2.1 Capital Cost – Depreciation.................................................................................................93 6.2.2 Installation Cost......................................................................................................................95 6.2.3 Operating Cost........................................................................................................................95 6.2.3 Maintenance Cost...................................................................................................................96
VII
6.3 Cost Evaluation......................................................................................................................................96 6.4 Practical Consideration....................................................................................................................................97
7 CONCLUSIONS.......................................................................................................97 7.1 Conclusions ....................................................................................................................................................99
8 RECOMMENDATIONS................................................................................................102
List of Figures Figure 1.1A : Existing and Future Refuse Disposal Sites in Singapore…………….……2 Figure 1.1 B : Average Daily Refuse Generation Chart…………………………….…….3 Figure 1.2 : Overview of Tuas South Incineration Plant …………………..…………5 Figure 1.3.1.1 : Overview of WeighBridge………………………………….……………...6 Figure 1.3.1.2 : Overview of Refuse Truck Discharged Refuse into the Refuse Bunker…..8 Figure 1.3.1.3 : Overview of Screening Bulky Waste at the Refuse Reception Hall……..9 Figure 1.3.1.4A: Operator control the overhead grab cranes to feed the refuse into the Charging Hopper…………………………………….…………………….9 Figure1.3.1.4B : Rotary and Cutter Shear cut and crush bulky waste………….……………9
Figure 1.3.1.5 : Burning of refuse in the furnace…………………………….……………..11 Figure 1.3.1.6 : Schematic diagram for Stoker Grate…………………….………………..12 Figure 1.3.2.1A: Overview of ashes and scraps are separated and transported to the respective pit
before loading onto the truck by overhead crane……..………….… ..16 Figure 1.3.2.1B: Overview of ashes being sent to the Tuas Marine Transfer Station before dispose at Offshore Pulau Semakau Landfill………………....…..16 Figure 1.3.3.1 : Overview of Two-Zone Electrostatic Dust Precipitator…………………18 Figure 1.3.4.1 : Overview of Treated Water discharged to Public Sewer…………..….....21 Figure 1.3.5.2 : Boiler Circulation……..…………………………….………………….. .25 Figure 1.3.5.3 : Steam Drum Internals...…………………………….………………….. .26 Figure 1.3.5.4 : Overview of turbine room that steam turbine drives a generator to produce
electricity……………………………………………………………….. 28 Figure 1.3.5.5 : Overview of Monitoring and Control System……………………………29 Figure 2.4.4.1 : Chart for Approximating Total Air from the Flue Gas Analysis……...…...44
VIII

Figure 2.5.1 : HCl inside the furnace with respect to load...................................................46 Figure 2.5.2 : Oxygen content in the furnace at difference load .........................................46 Figure 2.5.3 : Carbon monoxide content in the furnace at difference load..........................47 Figure 3.3.1.1 : High temperature corrosion acts on the tube surface ……………….....…51 Figure 3.3.2.1 : Pitting attack from oxygen on outside surfaces of watertube boiler tube.....52 Figure 3.3.2.2 : Salt Bridge………………………………………………………….……...52 Figure 3.3.2.3 : Superheater tube outside diameter reading..................................................53 Figure 3.4.1 : Location of superheater tube in the furnace........……………………..……54 Figure 3.5.1 : Flue Gas Temperature at third pass section in the furnace……………...….55 Figure 3.5.2 : Wastage Profile on TSIP superheater tube ...............................….........……57 Figure 3.5.3 : Overview of slag accumulated on the superheater tube surface....... ……....58 Figure 3.5.3A : Schematic view of corrosion penetration on the tube.....................................59 Figure 3.5.3B : Effect of corrosion on the superheater tube....................................................60 Figure 3.6.1 : HCl inside the furnace with respect to load……………………….….…….62 Figure 3.6.2 : Oxygen Chart obtained from the furnace………………………..……...….62 Figure 4.3.2.1 :Temperature of the flue gas taken before boiler was shutdown...............69 Figure 4.3.2.2 :Temperature of the flue gas taken after boiler tube was cleaned.............70 Figure 4.3.2.3 : The increased of the tube metal temperature based on both its gas and steam temperature ............................................................................71 Figure 4.3.2.4: Deposit growth of boiler #6 tubes..............................................................72 Figure 4.3.2.5: Deposit growth of boiler #3 tubes..................................................................72 Figure 4.3.3.1: Two boiler on same load, boiler#2 due for its tube cleaning and #6 its tube..75 Figure 4.3.4.1 : Nikon ME 600 Image Analyzer.......................................................................77 Figure 4.3.4.2 : Specimen Corrosion Thickness Measurement for Boiler # 1.............................78 Figure 4.3.4.3 : Specimen Corrosion Thickness Measurement for Boiler # 2.............................78
IX
Figure 4.3.4.4: Test specimen for boiler #1.................................................................................79 Figure 4.3.4.5: Test specimen for boiler # 2................................................................................79 Figure 4.3.5.2 Distribution of heavy metal in TSIP fly ash....................................................80 Figure 4.3.5.3 Distribution of elements in TSIP fly ash.........................................................80 Figure 4.1.2: Internal pressure in the superheater pipe...........................................................81
X
List of Tables Table 2.3.1 : Average of Refuse Analysis Results for Samples……………………….34 Table 2.3.2 : Element Analysis of refuse……………………….……………………..35 Table 2.4.1 : Weight of some common elements……………………………………...36
Table 2.4.3.1 :Variation of excess air with percentage of oxygen (O2) in flue gas for refuse firing boiler……………………………………………….…...40 Table 5.4.1 : Summaries the chemical composition, mechanical properties, maximum working temperature and maximum working pressure.........................88
Table 6.2.1.1 :Cost depreciation of each of metals.....................................................92
Table 6.2.2.1 :Installation costs of the superheater for the various materials.............93
Table 6.3.1 : Annual costs for each metal...............................................................94
XI
Introduction Incineration has been used as method for processing waste since the beginning of the
century. Over the past few decades it has evolved into a widely used, established
technology with reliable modern facilities operating on a fully commercial basis in some
advanced countries. Modern incineration plants are now almost always built with energy
recovery units in place.
While there is energy recovery, waste incineration is not a source of renewable energy in
its strict sense. This is because waste, a by-product of modern civilization, is a non-
sustainable resource. Renewable energy also conjures up images of clean production and
non-pollutive emissions, whereas incineration of wastes produces such pollutants as
Carbon Monoxide (CO), Hydrochloride (HCL) and Sulphur Dioxide (SO2). Inside the
incinerator itself, these gases could already cause corrosion and tamper with the
efficiency of the incinerator.
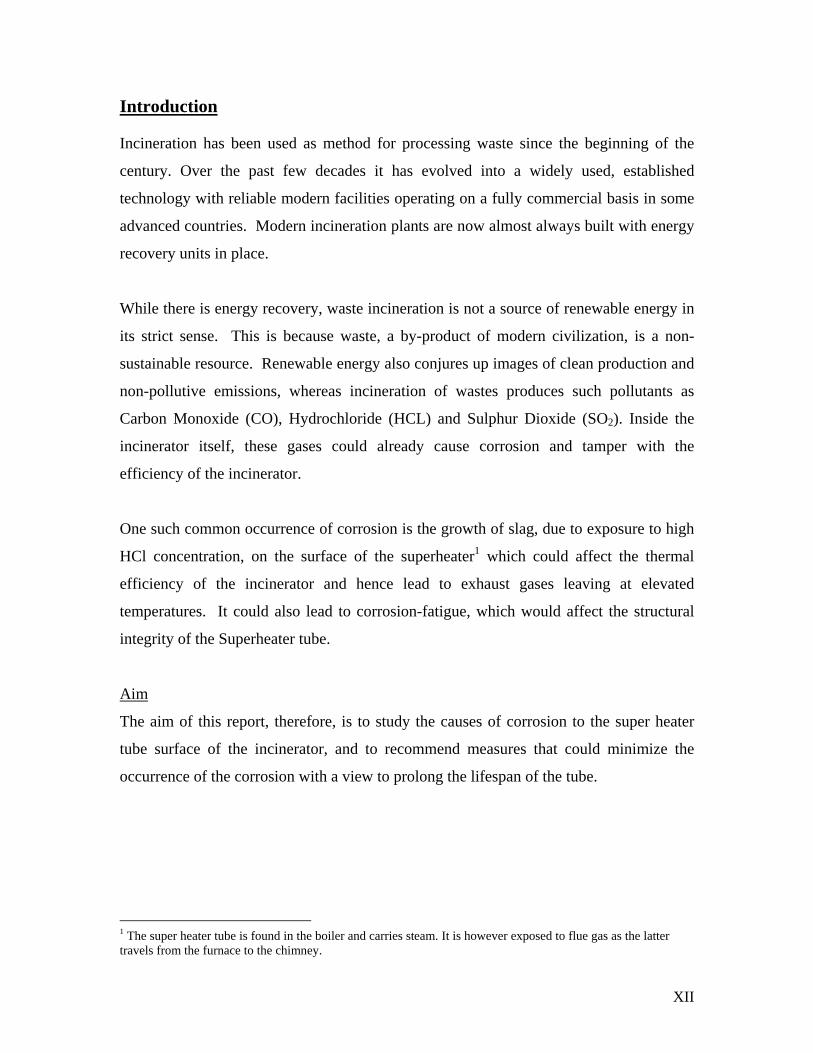
One such common occurrence of corrosion is the growth of slag, due to exposure to high
HCl concentration, on the surface of the superheater1 which could affect the thermal
efficiency of the incinerator and hence lead to exhaust gases leaving at elevated
temperatures. It could also lead to corrosion-fatigue, which would affect the structural
integrity of the Superheater tube.
Aim
The aim of this report, therefore, is to study the causes of corrosion to the super heater
tube surface of the incinerator, and to recommend measures that could minimize the
occurrence of the corrosion with a view to prolong the lifespan of the tube.
1 The super heater tube is found in the boiler and carries steam. It is however exposed to flue gas as the latter travels from the furnace to the chimney.
XII
Format of Report
• The report begins in Chapter 1 with an introduction of the Tuas South
Incineration Plant (TSIP), where the project was carried out. TSIP is one of the
four municipal incineration plants in Singapore. This chapter gives an overview of
the incineration plant, including the process flows undergone by the refuse, flue
gas, wastewater and feedwater.
• Chapter 2 looks at the typical components of refuse ending up in an incinerator,
how these refuse components alter the characteristics of gases in flue gas, and
how these gases could affect the performance and integrity of the boiler. The
chapter goes on to calculate the percentage of free oxygen in the flue gas given
the amount of excess air introduced during firing, and includes a brief mention on
the precautionary measures necessary in sampling flue gas and TSIP combustion
control philosophy.
• Chapter 3 outlines the analysis on the causes of corrosion on a critical part of the
boiler component – the super heater. The analysis will establish that the corrosion
is caused by hydrogen-chloride (HCl) found in flue gas. While not a cause of
corrosion, the report will also identify that slag, which is deposited on the super
heater by the rising ash-carrying flue gas, could potentially impair the structural
integrity of the tubes and its performance in conveying steam at the optimum
temperature.
• Chapter 4 shifts from theoretical calculations to experimental measurements and
observations, to complete the analytical component of the project. The experiment
will be performed by placing specimens in two different furnaces of an actual
incinerator (TSIP) over a period of time to determine the extent of corrosion. The
exact conditions experienced in a furnace are therefore replicated, to get as
realistic a result as possible.
XIII

• The feasibility of material replacement is addressed in Chapter 5. Carbon steel is
the mainstay constituent of the Superheater but is there another material which is
equally effective in performance yet has better corrosion-resistance properties,
longer lifespan and economically more viable? A literature research on material
properties will reveal that nickel-chromium and nickel-chromium-molybdenum
steel are viable alternatives to achieve the same performance, and have several
characteristics that are superior to carbon steel
XIV

Project Objectives
• To identify the components of solid wastes
• To determine the composition of flue gas
• To analyze the effect of corrosion growth on the surface of the super heater tube
• To explore ways to minimize the corrosion rate growth on the super heater tube
surface.
Project Methodology
The project was carried out employing the following methodology:
• Tuas South Incineration solid waste analysis to determine the refuse composite
example plastic.
• Using ‘Orsat’ analyzer to calculate percentage volume of free oxygen, carbon
dioxide and carbon monoxide in the flue gas.
• Experimental analysis of Martin-stoker boiler combustion control to determine
the behaviour of HCL, excess O2 and the third zone temperatures.
• Using USQ (Stress analysis) lectures to determine the theoretical stresses due to
pressure on the super heater tube.
• Investigation and analysis of corrosion
• Cost Analysis for final consideration and decisions
XV
1
_________________________________________ Chapter 1
Introduction of Tuas South Incineration Plant in Singapore 1.1 Background 1.2 TSIP 1.3 Process Description
1.3.1 Refuse Flow
1.3.2 Ash Flow 1.3.3 Flue Gas Flow and Lime Injection for Flue Gas Treatment
1.3.4 Waste Water Treatment System
1.3.4.1 Waste Water Flow
1.3.4.2 Refuse Waste Water
1.3.4.3 Ash Waste water
1.3.5 Feedwater, Steam and Condensate System
1.3.5.1 Steam Flow 1.3.5.2 Condensate Flow
1.3.5.3 Boiler Feedwater Flow
1.3.5.4 Chemical Flow
1.3.5.5 Drain Flow
1.1 Background
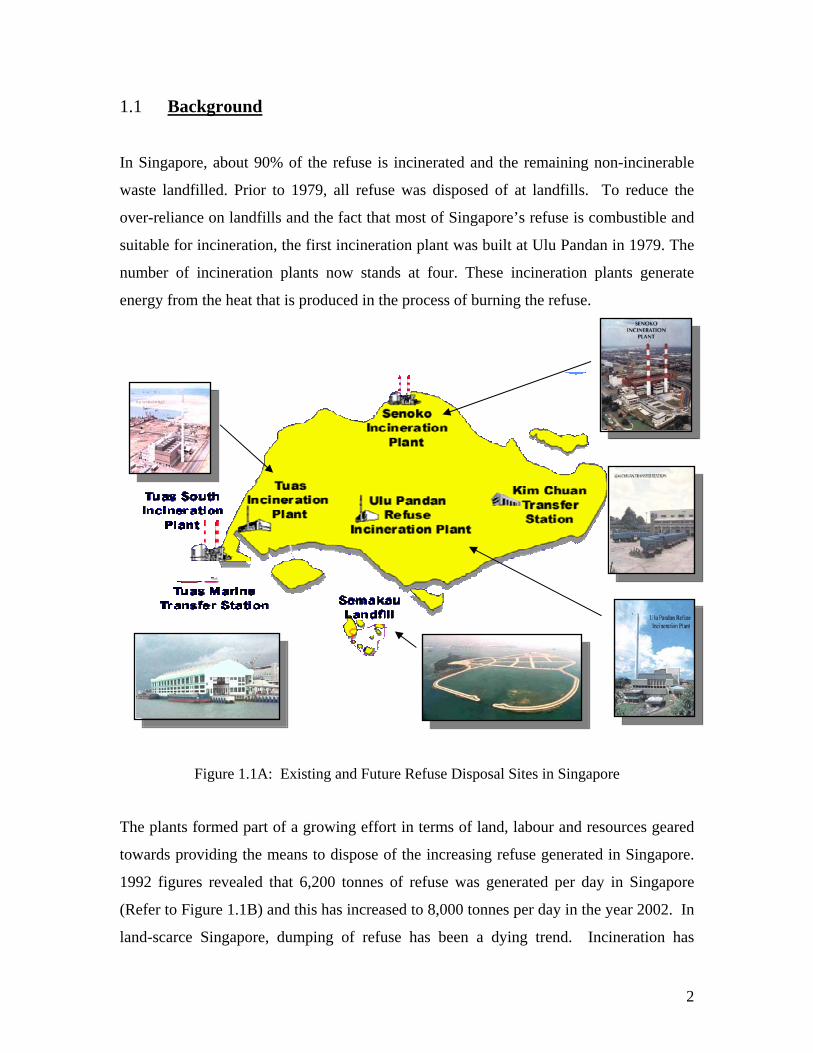
In Singapore, about 90% of the refuse is incinerated and the remaining non-incinerable
waste landfilled. Prior to 1979, all refuse was disposed of at landfills. To reduce the
over-reliance on landfills and the fact that most of Singapore’s refuse is combustible and
suitable for incineration, the first incineration plant was built at Ulu Pandan in 1979. The
number of incineration plants now stands at four. These incineration plants generate
energy from the heat that is produced in the process of burning the refuse.
Figure 1.1A: Existing and Future Refuse Disposal Sites in Singapore
The plants formed part of a growing effort in terms of land, labour and resources geared
towards providing the means to dispose of the increasing refuse generated in Singapore.
1992 figures revealed that 6,200 tonnes of refuse was generated per day in Singapore
(Refer to Figure 1.1B) and this has increased to 8,000 tonnes per day in the year 2002. In
land-scarce Singapore, dumping of refuse has been a dying trend. Incineration has
2

proven to be the most effective method of refuse disposal given that 90% reduction in
volume could be achieved by this method.
Figure 1.1B: Average Daily Refuse Generation Chart
Source: TSIP Yearly Report in Year 2002, 2003 & 2004
In line with the good environmental practice of recycling, much of the by-products of the
incineration process is put into good use and recovered. The heat released from the
combustion of refuse is used to generate electricity through a comprehensive boiler steam
plant and turbo-generators system. Scrap metal is extracted from the ash and is sold to a
local steel mill. Fly ash is collected and used for making pavement block.
1.2 TSIP
The Tuas South Incineration Plant (TSIP), built at a cost of approximately $900 million2,
is the fourth and latest municipal refuse incineration plant in Singapore (Refer to Figure
1.2A). It is also the largest in terms of capacity, designed to incinerate 3,200 tonnes of
refuse per day. The completion of the plant in June 1998 meant that the refuse
incineration capacity in Singapore has increased from the average 1,500 tonnes per day to
4,700 tonnes per day, thereby enabling all incinerable refuse to be disposal of by
incineration. TSIP stands on reclaimed land, approximately 10.5 ha, in the west of
32 Source: ESD Annual Report 2002

4
Singapore. The plant was built with state-of-the art technology. The various processes
are highly automated and controlled via a Digital Control System (DCS). Modern
equipment incorporating advanced technology is used in the plant to ensure a higher level
of efficiency and reliability.
TSIP boasts some of the most sophisticated system in combustion control and flue gas
treatment. These include the Advanced Automatic Combustion Control (AACC), Flue
Gas Conditioning Units and Electrostatic Precipitators, all of which enable the plant’s
dust and smoke emission to comply with the stringent Clean Air Act requirement. Two
chimneys were constructed high enough to maximize the dispersion of the flue gases by
winds. Combustion air is drawn from the storage bunker, keeping the bunker at sub-
atmospheric pressure and consequently preventing the odour of refuse in the bunker from
escaping. The refuse in the bunker is fed by refuse cranes into the six incinerators. TSIP,
together with the other 3 incineration plants, and the Offshore Semakau Landfill, will
meet the refuse disposal needs of Singapore for the next fifty years, and help in achieving
a clean living environment for all Singaporeans.
1.3 Process Description
In order to give a better understanding of how refuse is treated, it is necessary to outline
the different kinds of flows involved in the refuse incineration process. The entire
process can be broken down into five flows:
1. Refuse flow
2. Ash flow
3. Flue gas flow
4. Waste water flow
5. Steam flow (which is generated from the waste heat of the furnace)
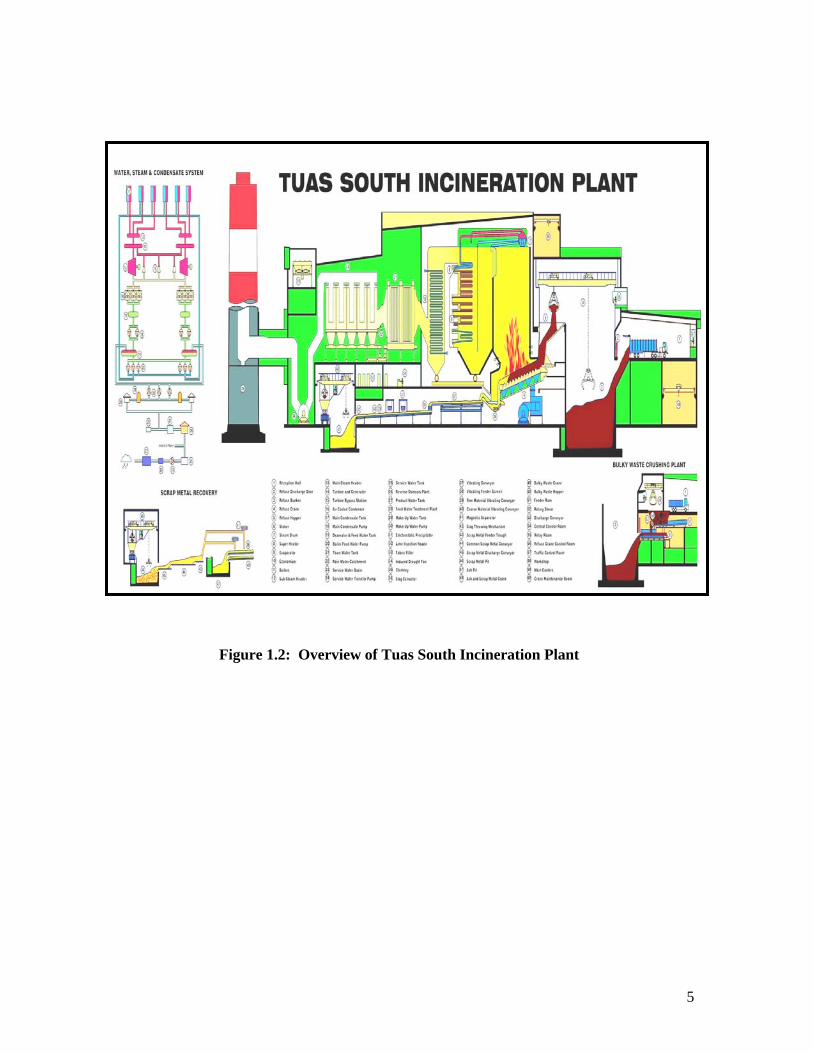
Figure 1.2: Overview of Tuas South Incineration Plant
5
1.3.1 Refuse Flow
Refuse Vehicles
WeighBridge
Refuse Reception Hall
Screening Hopper
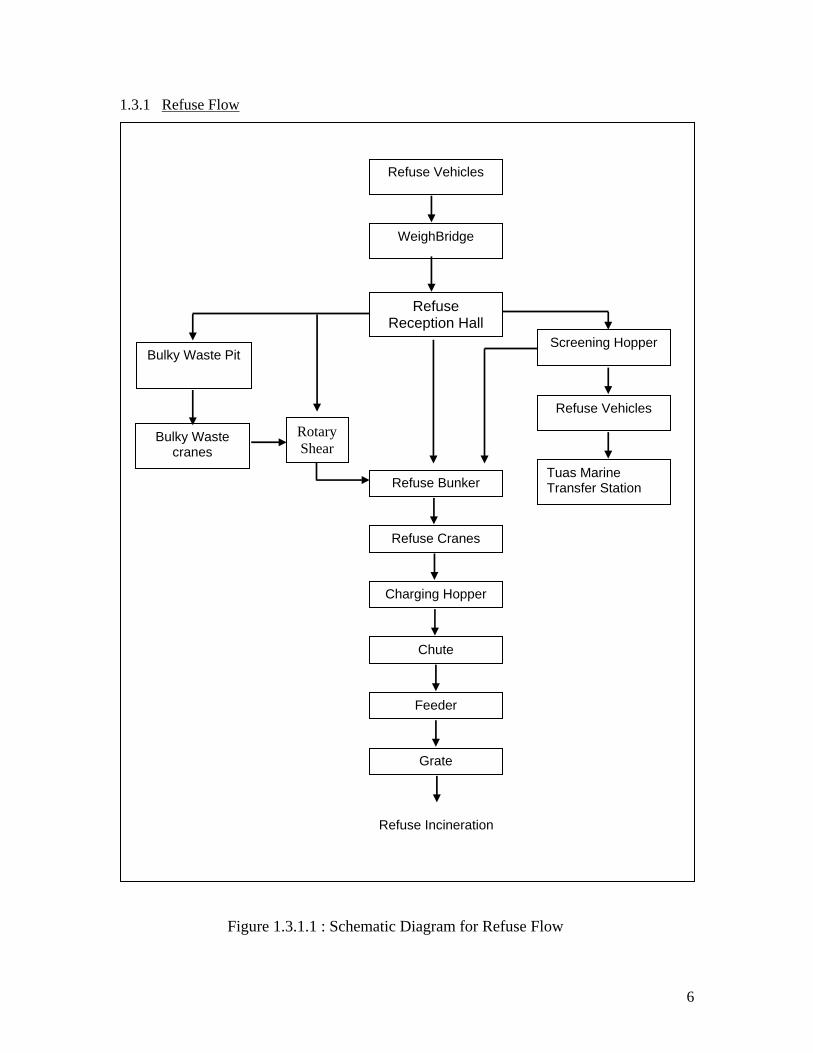
Figure 1.3.1.1 : Schematic Diagram for Refuse Flow
Refuse Bunker
Chute
Charging Hopper
Refuse Cranes
Feeder
Grate
Refuse Vehicles
Tuas Marine Transfer Station
Bulky Waste Pit
Rotary Shear
Bulky Waste cranes
Refuse Incineration
6

Refuse, garbage and other kinds of waste are first collected from residents and industries
by refuse collection trucks. Once the trucks arrive at the plant, they are weighed by the
one of the three weighing platforms at the weighbridge prior to being allowed to
discharge their refuse into the enclosed refuse bunker. The weighbridge also undertakes
the task of recording the weight, source and type of refuse carried by the refuse vehicle
automatically in a computer (Refer to Figure 1.3.1.1). After the refuse trucks have
unloaded the refuse into one of the two refuse bunkers, the empty trucks are weighed
again before they leave the plant to determine the weight of refuse disposed.
WeighBridge Control Room
Weighbridge platforms
Figure 1.3.1.1: Overview of WeighBridge
Source: TSIP Operation Manual 2002
The refuse is discharged into the refuse bunker through one of the 27 refuse discharge
bays at the reception hall (Refer to Figure 1.3.1.2). The refuse is temporarily stored in the
refuse bunker until it is loaded into the charging hopper located on the feeding side o the
incinerator. Bulky wastes are discharged separately for crushing. All discharge bays are
provided with hydraulic operated doors, which can be controlled manually or
automatically.
7
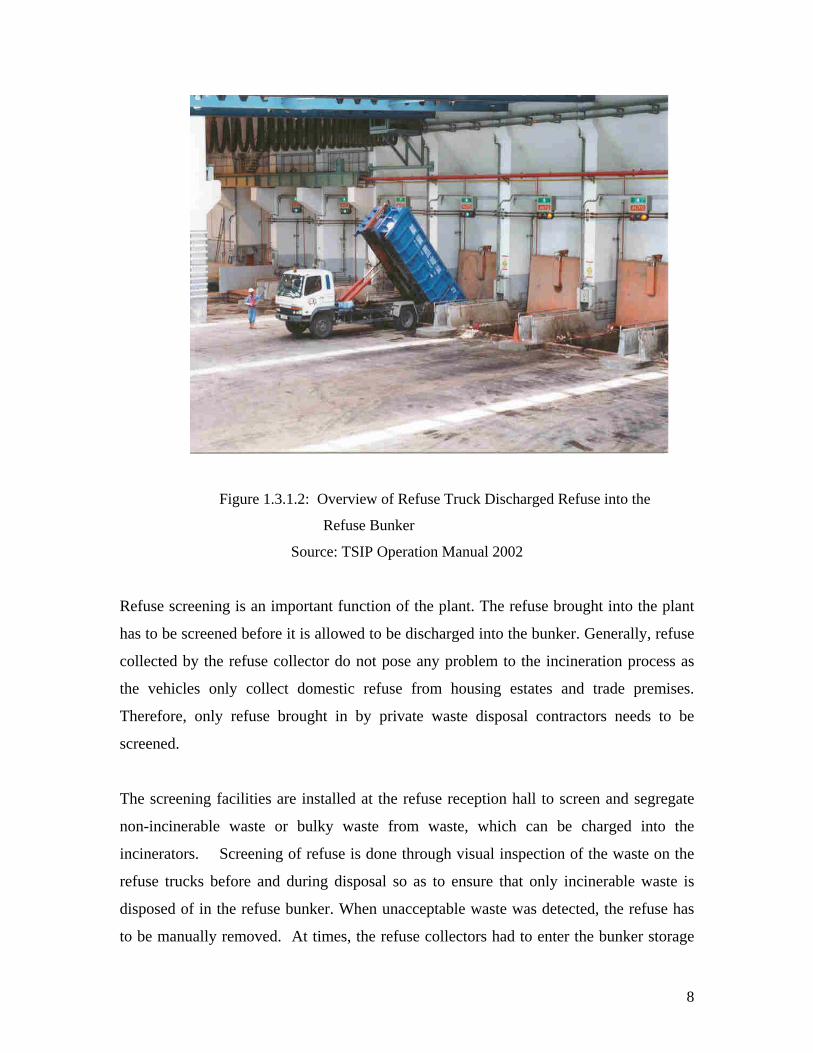
Figure 1.3.1.2: Overview of Refuse Truck Discharged Refuse into the
Refuse Bunker
Source: TSIP Operation Manual 2002
Refuse screening is an important function of the plant. The refuse brought into the plant
has to be screened before it is allowed to be discharged into the bunker. Generally, refuse
collected by the refuse collector do not pose any problem to the incineration process as
the vehicles only collect domestic refuse from housing estates and trade premises.
Therefore, only refuse brought in by private waste disposal contractors needs to be
screened.
The screening facilities are installed at the refuse reception hall to screen and segregate
non-incinerable waste or bulky waste from waste, which can be charged into the
incinerators. Screening of refuse is done through visual inspection of the waste on the
refuse trucks before and during disposal so as to ensure that only incinerable waste is
disposed of in the refuse bunker. When unacceptable waste was detected, the refuse has
to be manually removed. At times, the refuse collectors had to enter the bunker storage
8

area to retrieve the unacceptable waste. Another screening operation was the use of
bulldozers in the refuse reception hall where the trucks were randomly selected to
discharge their loads onto the floor before the discharge chutes leading into the refuse
bunker. Bulldozers will then sift through the pile of refuse on the floor and unacceptable
waste was reloaded onto the refuse truck for transportation to the correct disposal area
(Refer to Figure 1.3.1.3).
Unacceptable waste
Figure 1.3.1.3: Overview of Screening Bulky Waste at the Refuse Reception
Hall
Source: TSIP Operation Manual 2002
The fully enclosed refuse bunker is capable of storing 9,600 tonnes of refuse. At the
refuse bunker, three overhead grab cranes will feed the refuse into the charging hopper.
Each crane has the capacity to grab about 10 cu.m or 6 tonnes of refuse. These cranes are
operated from 3 control rooms, which oversee the entire refuse bunker. The rotary and
cutter shear will cut and crush bulky wastes such as tree trucks and furniture into small
pieces before being fed into the incinerator (Refer to Figure 1.3.1.4).
Charging Hopper
9

Figure 1.3.1.4 a: Operator control the overhead grab cranes to feed the refuse
into the Charging Hopper
Source: TSIP Operation Manual 2002
Figure 1.3.1.4 b: Rotary and Cutter Shear cut and crush bulky wastes
Source: TSIP Operation Manual 2002
Refuse in the charging hopper is transported the drying potion of the incinerator stoker by
the refuse feeder. After it is dried, the refuse passes to the combustion portion of the
stoker where it is incinerated at a high temperature. Finally, it is delivered to the post
combustion portion of the stoker where the cinder remnants of the refuse are allowed to
burn themselves out (Refer to Figure 1.3.1.5).
10
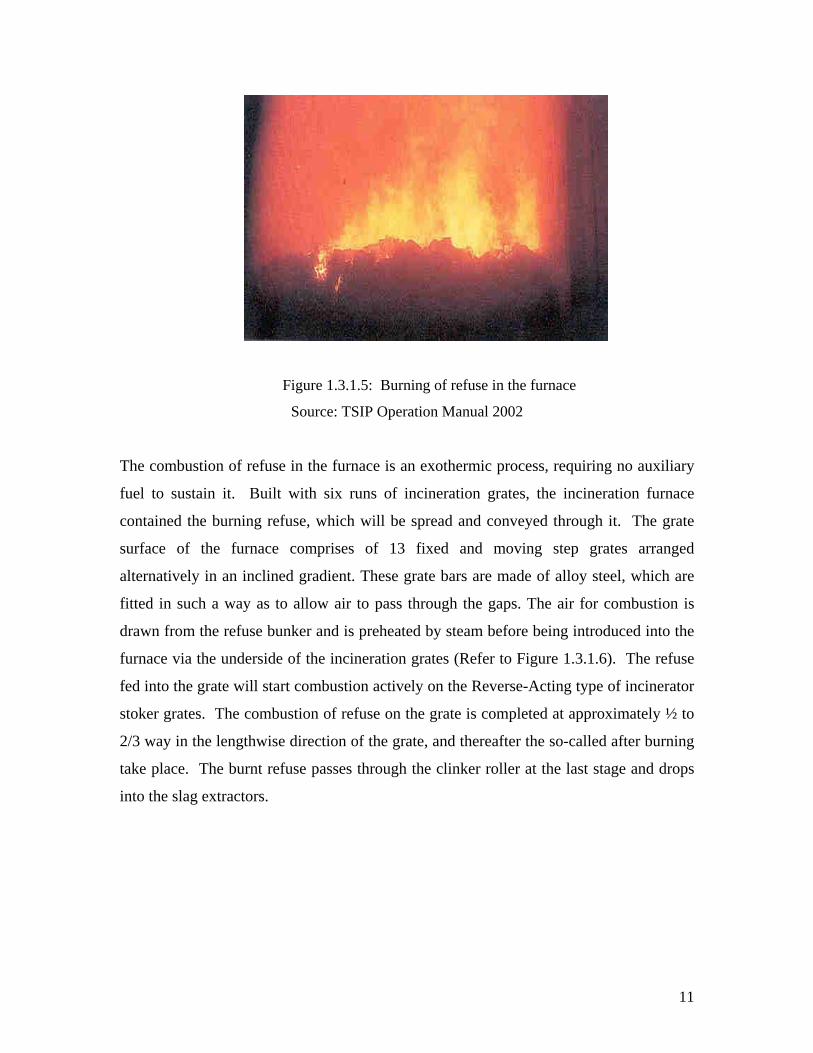
Figure 1.3.1.5: Burning of refuse in the furnace
Source: TSIP Operation Manual 2002
The combustion of refuse in the furnace is an exothermic process, requiring no auxiliary
fuel to sustain it. Built with six runs of incineration grates, the incineration furnace
contained the burning refuse, which will be spread and conveyed through it. The grate
surface of the furnace comprises of 13 fixed and moving step grates arranged
alternatively in an inclined gradient. These grate bars are made of alloy steel, which are
fitted in such a way as to allow air to pass through the gaps. The air for combustion is
drawn from the refuse bunker and is preheated by steam before being introduced into the
furnace via the underside of the incineration grates (Refer to Figure 1.3.1.6). The refuse
fed into the grate will start combustion actively on the Reverse-Acting type of incinerator
stoker grates. The combustion of refuse on the grate is completed at approximately ½ to
2/3 way in the lengthwise direction of the grate, and thereafter the so-called after burning
take place. The burnt refuse passes through the clinker roller at the last stage and drops
into the slag extractors.
11
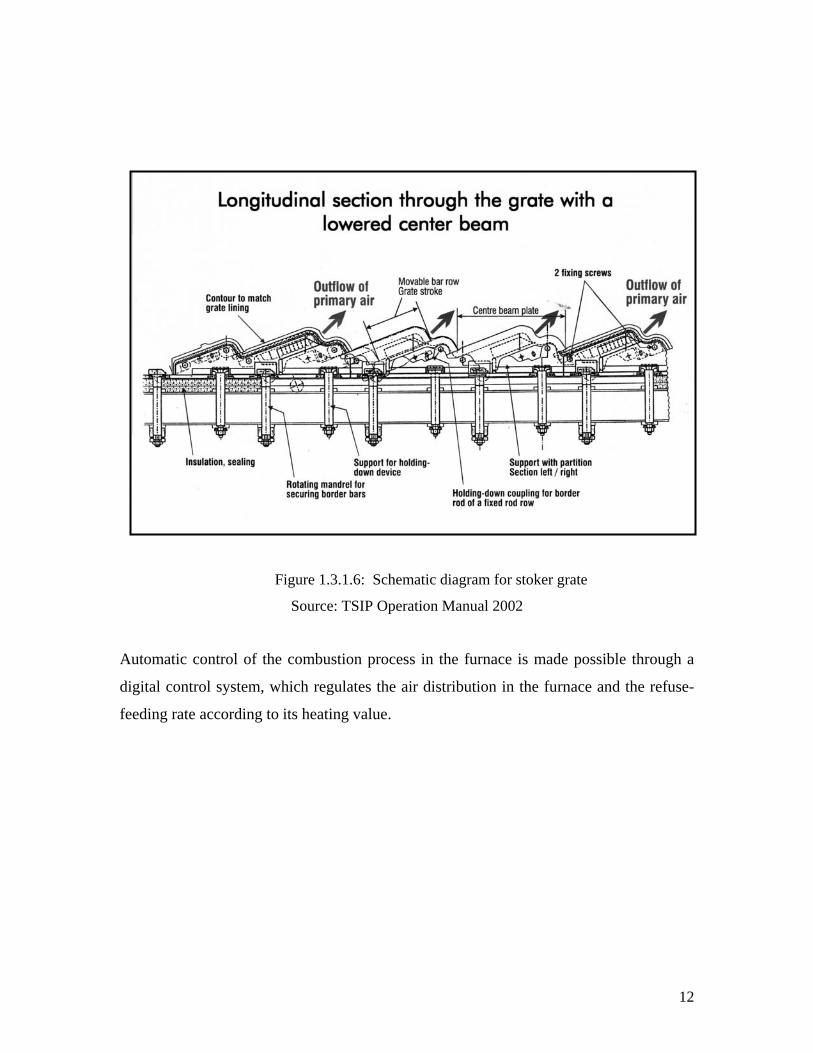
Figure 1.3.1.6: Schematic diagram for stoker grate
Source: TSIP Operation Manual 2002
Automatic control of the combustion process in the furnace is made possible through a
digital control system, which regulates the air distribution in the furnace and the refuse-
feeding rate according to its heating value.
12

1.3.2 Ash Flow
Incinerator Grate
Boiler/ Economizer
Electrostatic Precipitator
Clinker Roller
Slag Extractors
Vibrating Conveyors
Economizer Fly Ash Rotary Valve,
Boiler Fly Ash Conveyor
EP Ash Cushion Tank
EP Ash Screw Feeder EP Ash Humidifier
Emergency Cushion Tank
Emergency Screw Feeder
Emergency Humidifier
Reaction Product Changing Conveyor
Cushion Tank Transporter
Reaction Product Silo
Electro-magnetic Separator
Scrap feeder Trough
Vibrating Scrap Conveyors
Scrap Thrower
Scrap Pit
Ash / Scrap Cranes
Slag Throwing Mechanism
Ash Pit
Ash Vehicles Scrap Vehicles
Emergency
Vehicles
Fly Ash Humidifier
EP Ash Conveyor
Fabric Filter
Figure 1.3.1.7 : Schematic Diagram for Ash Flow
13
(1) Burned Residue
The burnt-out slag on the grate is discharged via the clinker roller into the slag extractor
(2 slag extractors for each incinerator), where they are extinguished and cooled by the
water bath inside the slag extractors. Cooled slag is discharged from the slag extractor
onto the vibrating feeder that feeds slag to the vibrating screen station. The slag
discharged from the vibrating feeder is separated into material smaller than and larger
than 300mm by the vibrating screen station. The separated slag that is smaller than
300mm is discharged onto the fine material vibrating conveyor and the remaining slag
onto the coarse material vibrating conveyor. And they are thrown into the ash pit by the
slag throwing mechanism.
Scraps in the slag transported via the fine material vibrating conveyor are separated by
the two overhead Electro-magnetic Separators before the slag is conveyed into the ash
pit. The electro-magnetic separators discharge the scrap metal onto the scrap feeder
trough that transfers the scrap to the common scrap vibrating conveyor. And that
conveyor transports the collected scrap metal to the scrap pit via the scrap discharge
conveyor and associated scrap throwing mechanism. The ferrous metals are then sold as
scrap to the local steel mill.
The riddling discharged from underneath the grate is sent to the slag extractors by air,
which is tapped from the primary air duct. The riddling ash is mixed with the slag from
the grate and discharged into the ash pit, via the vibrating feeder, screen station, vibrating
conveyors and slag throwers.
14

(2) Fly Ash and Reaction Product
The fly ash collected at the bottom of the boiler and economizer is conveyed to the
slag extractors, according to the flow pattern below:
Boiler fly ash: boiler fly ash conveyor → slag extractor
Economizer fly ash: boiler fly ash rotary valve → boiler fly ash conveyor →
slag extractor
Slag and scrap discharged into the ash/scrap pit are loaded onto the ash vehicles by
ash cranes. Three units of ash cranes are installed with one unit on common stand-by.
The fly ash collected by the Electrostatic Precipitators (EP) is conveyed to the EP ash
humidifier by the fly ash conveyor before being discharged into the ash pit. The
reaction products, unreacted lime and fly ash collected by fabric filters are conveyed
to the reaction product silos by the auxiliary compressed air system. Alternatively,
the reaction products can also conveyed to the emergency humidifier in case of
emergencies. The reaction product silos consist of two silos, with one silo serving
for three boilers. Each twin silo is separated into two storage spaces with one being
in use and the other being for stand-by. The reaction product is discharged onto the
truck by the reaction product humidifier and transported to the landfill. Each reaction
product discharging line has the capability for direct loading of drying reaction
products.
The overhead ash crane in turn loads the remaining ash stored in the ash pit onto ash
trucks, which then sent the ash to the Tuas Marine Transfer Station where they are
unloaded onto barges and transported to the offshore Pulau Semakau Landfill for
disposal (Refer to Figure 1.3.2.1 A & B).
The lifespan of Pulau Semakau is expected to last 30 years till 2030. If the rising
trend of waste generation is not curtailed, lifespan might be shorter than 30 years.
Ash Conveyor 15Scrap
Conveyor

Vibrating Conveyors
Ash Pit
Scrap Pit
Ash Crane
Ash Truck
Figure 1.3.2.1A: Overview of ashes and scraps are separated and
transported to the respective pit before loading onto the truck by overhead crane.
Source: TSIP Operation Manual 2002
Tuas Marine Station
Pulau Semakau Landfill
Figure 1.3.2.1B: Overview of ashes being sent to the Tuas Marine Transfer
Station before dispose at Offshore Pulau Semakau Landfill Source: TSIP Operation Manual 2002
16
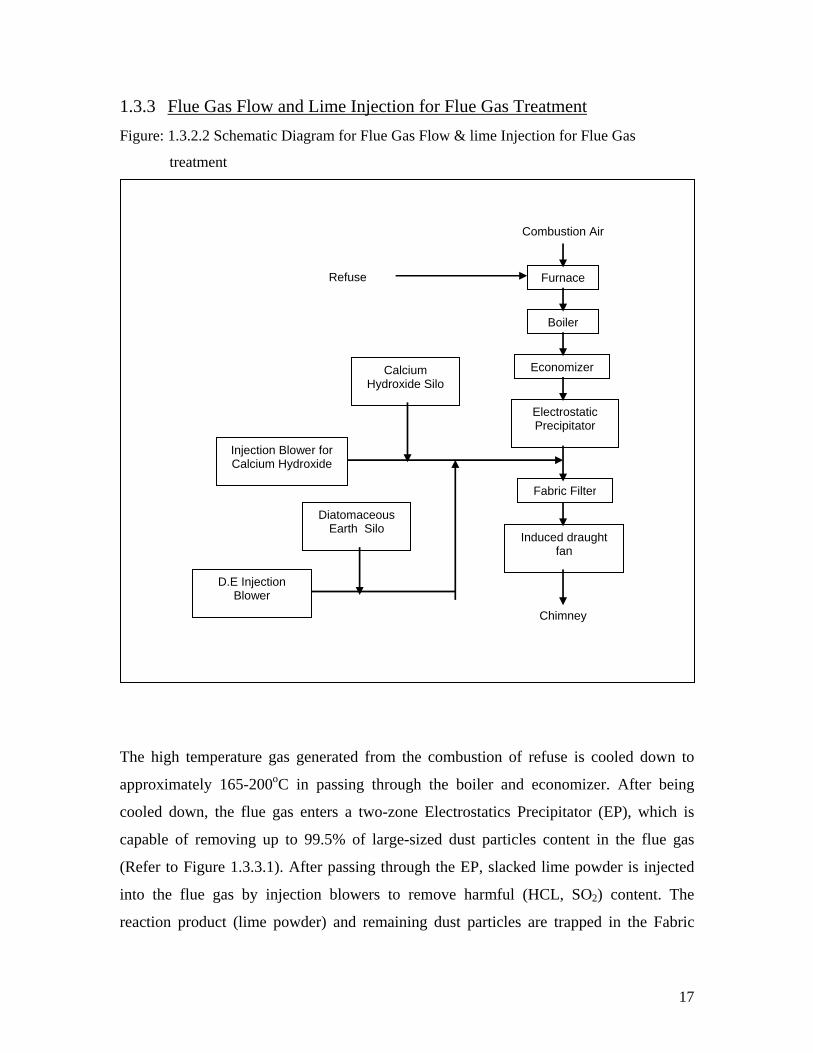
1.3.3 Flue Gas Flow and Lime Injection for Flue Gas Treatment Figure: 1.3.2.2 Schematic Diagram for Flue Gas Flow & lime Injection for Flue Gas
treatment
Combustion Air
Furnace Refuse
Boiler
Economizer Calcium Hydroxide Silo
Electrostatic Precipitator
Injection Blower for Calcium Hydroxide
Fabric Filter Diatomaceous
Earth Silo Induced draught
fan
Chimney D.E Injection
Blower
The high temperature gas generated from the combustion of refuse is cooled down to
approximately 165-200oC in passing through the boiler and economizer. After being
cooled down, the flue gas enters a two-zone Electrostatics Precipitator (EP), which is
capable of removing up to 99.5% of large-sized dust particles content in the flue gas
(Refer to Figure 1.3.3.1). After passing through the EP, slacked lime powder is injected
into the flue gas by injection blowers to remove harmful (HCL, SO2) content. The
reaction product (lime powder) and remaining dust particles are trapped in the Fabric
17
Filter Bags made of glass fibres, which are Teflon-coated for high temperature and acid
resistance. The bags are pulsed with a stream of compressed air to remove the
accumulated reaction product, which is pneumatically transported to the humidifiers and
discharged to ash truck for land filling. As flue gas is passed through the Fabric Filters,
acid gases in the flue gas (HCl,SO2) are further removed by the neutralizing reaction with
calcium hydroxide.
Reaction products together with the fly ash in the Fabric Filter are then periodically
removed by air back washing. The reaction products are then conveyor to the reaction
products silos. The treated flue gas from which Hydrochloride (HCl), fly ash and other
gas components have been removed are drawn by the induced draught fan and discharged
into the atmosphere through one of two 150m tall chimney.
Diatomaceous earth (DE) is only injected at the time of shut down of the incinerator for
pre-coating, and also when the filter bags are completely replaced. This is to help
prolong the life span of the filter bags.
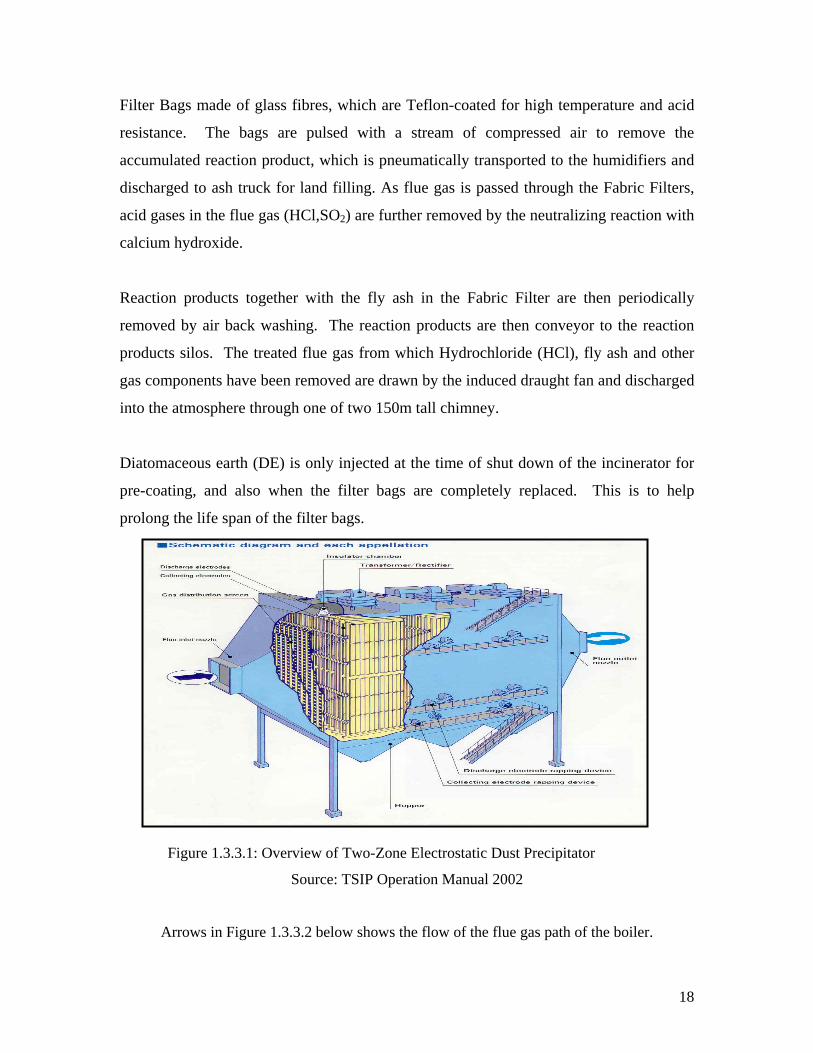
Figure 1.3.3.1: Ove recipitator
Source: TSIP Operation Manual 2002
Arrows in Figure 1.3.3.2 below shows the flow of the flue gas path of the boiler.
rview of Two-Zone Electrostatic Dust P
18

19
Source: TSIP Operation Manual 2002
SECONDARY S.H. OUTLET HEADER
+ 20.70 m
LOWER EVAPORTOR OUTLET HEADER
+ 18.80 m
LOWER RTOR EVAPOINLET
HEADER +17.30 m
HANGER TUBE OUTLET HEADER
3RD PASS REAR WALL LOWER HEADER
3RD PASS SIDE WALL LOWER HEADER
HANGER TUBES
3RD PASS FRONT WALL LOWER HEADER
2ND PASS SIDE WALLLOWER HEADER
+ 23.70 m + 24.20 m + 24.70 m
+ 25.60 m + 26.20 m FINAL S.H. OUTLET
HEADER SECONDARY DESUPERHEATERSECONDARY DESUPERHEATERFINAL S.H. INLET HEADER
PRIMARY DESUPERHEATERPRIMARY DESUPERHEATER
+ 28.70 m + 28.10 m
PRIMARY S.H. OUTLET HEADER
SECONDARY S.H. INLET HEADER SECONDAR
YSUPER HEATER TUBES
PRIMARYSUPER HEATER TUBES
UPPER EV RATOAPO R TUBES
+ 3+ 35.30 m 4.80 M
UPPER EVAPORATOR INLET HEADER PRIMARY S.H. INLET HEADER
LOWER RATOEVAPO R TUBE
S
FINAL SUPER EHEAT RTUBE
S
LOWER EVAPORATOR CONNECTING HEADER
UPPER TOEVAPORA ROUTLET
HEADER
3rd PASS ROOF TUBES
3rd PASS SIDE WALLUPPER HEADER
3rd PASS ROOF HEADER
3rd PASS FRONT WALLUPPER HEADER
HANGER TUBE INLET HEADER
PRIMARY DESUPER ER HEATTUBE
S
FURNACE ROOF TUBES
3rd PASS FRONT WALL TUBES
FURNACE REAR WALL TUBES
MANHOLE +14.00 m
ASH HOPPER
ASH CONVEYOR
+9.00 m
FURNACE REAR WALL LOWER HEADER
CLINKERCHILLHEADER
CLINKERCHILL TUBES
FURNACE FRONT WALL HEADER
FURNACE FRONT WALL TUBS
2nd PASS SIDE WALLUPPER HEADER
1st PASS SIDE W ALLUPPER
HEADER
BURNER
1st PASS
2nd PASS
3rd PASS
+ 35.10 m
+ 35. 10 m
+ 35.10 m
+ 37.50 m
+17.10 m +17.10
m
+ 18.60 m
+ 33.40 m
+ 30.90 m
+ 28.40 m
+ 25.90 m
+ 23.40 m
+ 20.90 m
STEAM DRUM ECONOMISE
R CONNECTION PIPE (FEEDWATER)
DOWNCOMER
SCREEN TUBES
Figure 1.3.3.2: Flue gas path flow
FEEDER TABLE
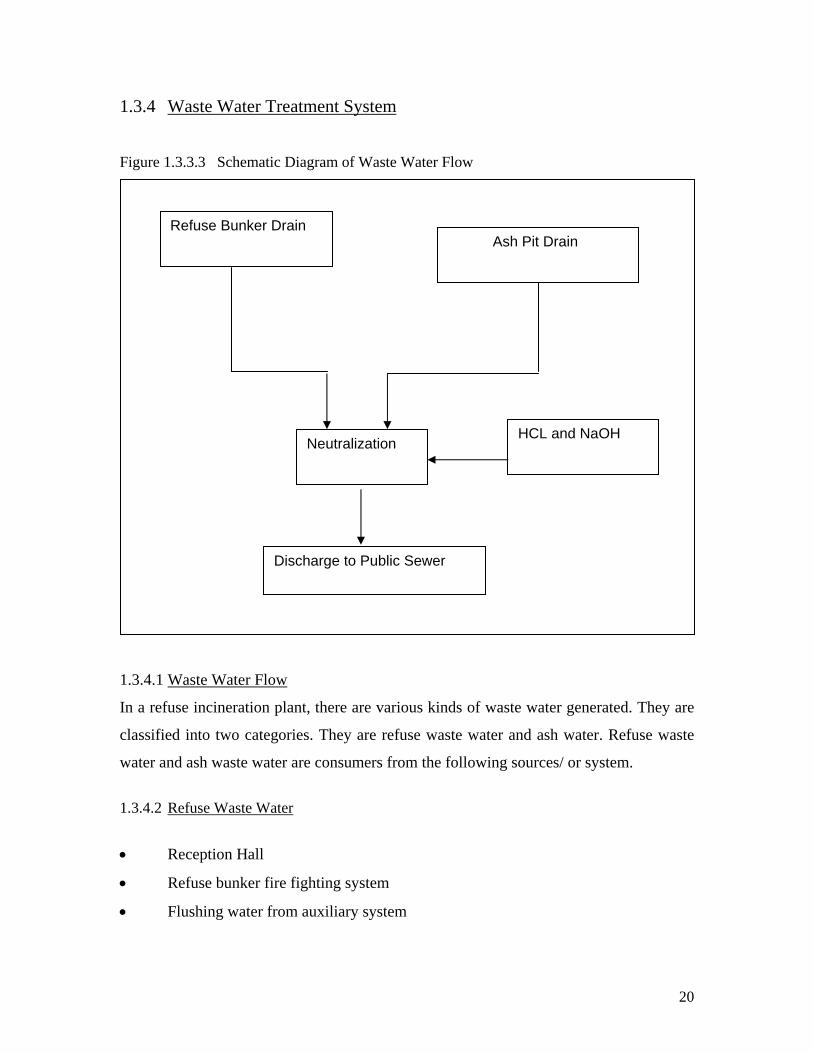
1.3.4 Waste Water Treatment System
Figure 1.3.3.3 Schematic Diagram of Waste Water Flow
1.3.4.1 Waste Water Flow
In a refuse incineration plant, there are various kinds of waste water generated. They are
classified into two categories. They are refuse waste water and ash water. Refuse waste
water and ash waste water are consumers from the following sources/ or system.
1.3.4.2 Refuse Waste Water
• Reception Hall
• Refuse bunker fire fighting system
• Flushing water from auxiliary system
NeutralizationHCL and NaOH
Refuse Bunker Drain Ash Pit Drain
Discharge to Public Sewer
20
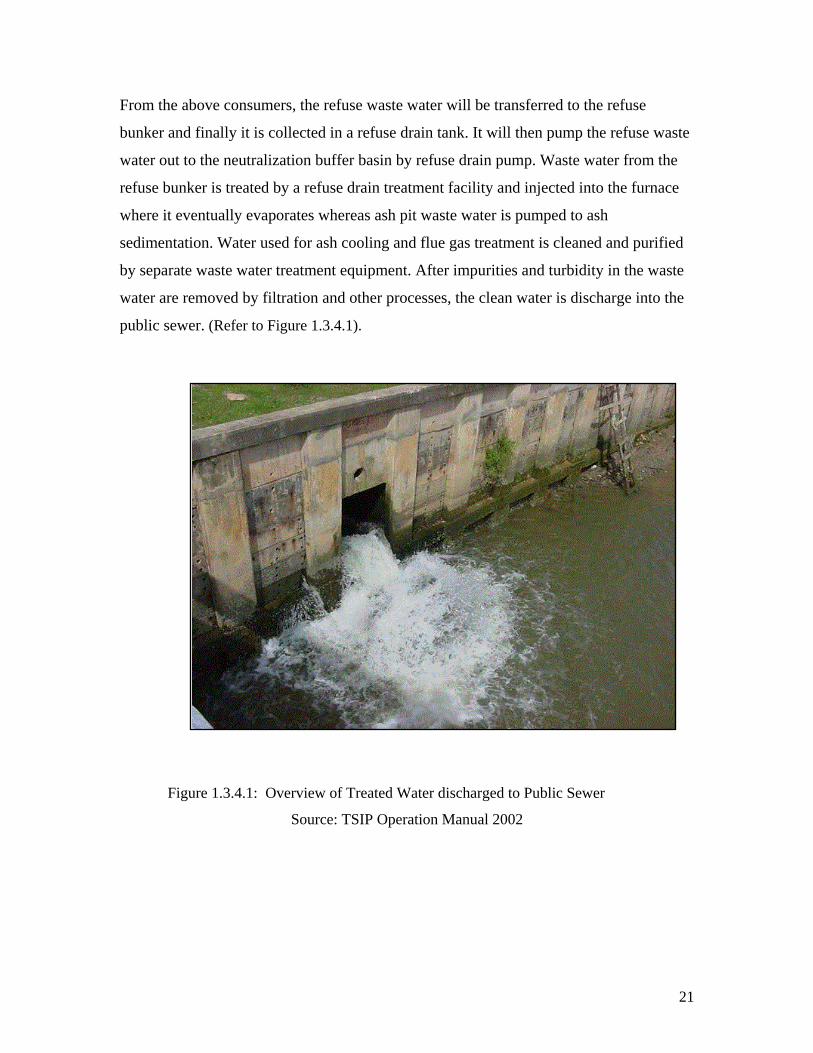
From the above consumers, the refuse waste water will be transferred to the refuse
bunker and finally it is collected in a refuse drain tank. It will then pump the refuse waste
water out to the neutralization buffer basin by refuse drain pump. Waste water from the
refuse bunker is treated by a refuse drain treatment facility and injected into the furnace
where it eventually evaporates whereas ash pit waste water is pumped to ash
sedimentation. Water used for ash cooling and flue gas treatment is cleaned and purified
by separate waste water treatment equipment. After impurities and turbidity in the waste
water are removed by filtration and other processes, the clean water is discharge into the
public sewer. (Refer to Figure 1.3.4.1).
Figure 1.3.4.1: Overview of Treated Water discharged to Public Sewer
Source: TSIP Operation Manual 2002
21

22
1.3.4.3 Ash waste water • Drainage from reaction product silo building and ash pit driveway
• Flushing water from auxiliary system water treatment plant
• Boiler and turbine house drainage
From the above consumers, the ash waste water will be collected in ash and scrap pit
drain chamber. Finally the ash sedimentation pump will pump out the ash waste water to
the neutralization buffer basin.
1.3.4.4 Neutralization Buffer Basin
Both refuse waste water and ash waste water will be stored in the neutralization buffer
basin. When the neutralization buffer basin unable to accept both waste water, the latter
will be sprayed into the refuse bunker through the dust suppression spray system.
In order to prevent sludge and solid from settling in the neutralization buffer basin, waste
water is agitated by air using air blower. Before waste water can be discharge to the
public sewer, they have to be treated to a acceptable range of pH value.
The waste water in neutralization buffer basin is neutralized by dosing HCL at 33 percent
or NAOH at 45 percent into the circulating waste water.
The pH range of waste water is expected to be 6 to 9 before it can be safely discharge to
the public sewer by waste water discharge or circulating pump. However, when the pH
value is not within the range, air blower is needed by dosing HCL or NAOH into the
circulation pipeline and agitating by air. But once the pH is within the range, dosing
pump will be operated intermittenly until pH is adjusted to the acceptable pH value.

23
Figure 1.3.3.4 Schematic Diagram for Waste Water Treatment System
Reception Hall
Refuse Bunker Fire
Fighting System
Flushing Water
from Auxiliary
Refuse Bunker Refuse Drain Tank
Pumps for refuse
Drain Tank
Refuse Bunker Refuse Drain Tank
Pumps for refuse
Drain Tank
Drainage from Reaction Product silo Building, Ash Pit Driveway
Flushing Water from Auxiliary System water Treatment Plant
Ash and Scrap Pit
Drain Chamber
Pump for Ash
Sedimentation
Service Water
Neutralization
Buffer Basin
Waste Water Discharge/
Recirculation Pump
NaOH Dosing Pump
Public Sewer
HCL Vapor Scrubber
HCL Tank NaOH Tank
HCL Dosing Pump
Boiler and Turbine House Drainage
Atmosphere
Air Blower
1.3.5 Feedwater, Steam and Condensate System1.3.5.1 Boiler Circulation Circuits To remove heat from the boiler surfaces, it is necessary that adequate and positive water
and steam circulation be provided (in a predetermined direction) throughout the boiler
circuits. The flow of water, steam, or other fluid within the boiler is called circulation.
When heated, water decreases in density and tends to rise to the top of the vessel;
conversely, cooler water tends to drop to the bottom. When water is heated to the boiling
point, small steam bubbles form on the heated surface. These bubbles cling to the metal
(because of surface tension) until they become large enough to overcome the tension or
until they are swept away by water circulation.
Steam is much lighter than water and rises rapidly. At the surface the steam bubbles
burst, releasing the steam. The movement of steam through the water creates turbulence
and circulation. 1.3.5.2 Description of Boiler Circulation The water tube boiler is of the top supported, natural circulation type with one steam
drum, and its general arrangement is shown above. The boiler circulation circuits are
shown in Figure 1.3.5.2 Unheated downcomers are located along the drum length, and
connected to each of the lower headers. Each wall tube circulation circuit is independent.
For example, the circulation circuit of the furnace front wall tubes and roof tubes is as
follows:
a) From the steam drum, boiler water is fed to furnace front wall header through the
downcomer.
b) Flowing up through the furnace front wall tubes and roof tubes, the feedwater
becomes a mixture of steam and water by absorbing heat from the flue gas.
c) The mixture of steam and water is collected in the furnace roof header and flows
through the riser tubes and back to the drum.
24

25
SECONDARY S.H. OUTLET HEADER
+ 20.70 m
LOWER EVAPORTOR OUTLET HEADER
+ 18.80 m
LOWER RTOR EVAPOINLET
HEADER +17.30 m
HANGER TUBEOUTLET HEADER
3RD PASS REAR WALL LOWER HEADER
3RD PASS SIDE WALL LOWER HEADER
HANGER TUBES
3RD PASS FRONT WALL LOWER HEADER
2ND PASS SIDE WALLLOWER HEADER
+ 23.70 m
+ 2
+ 24.70 m
4.20 m
+ 25.60 m
+ 26.20 m FINAL S.H. OUTLET
HEADER SECONDARY DESUPERHEATER SECONDARY DESUPERHEATER FINAL S.H. INLET HEADER
PRIMARY DESUPERHEATER PRIMARY DESUPERHEATER
+ 28.70 m+ 28.10 m
PRIMARY S.H. OUTLET HEADER
SECONDARY S.H. INLET HEADERSECONDAR
YSUPER HEATER TUBES
PRIMARYSUPER HEATER TUBES
UPPER OEVAPORAT RTUBE
S
+ 3+ 35.30 m 4.80 M
UPPER EVAPORATOR INLET HEADER PRIMARY S.H. INLET HEADER
LOWER ORATOEVAP RTUBE
S
FINAL SUPER EHEAT RTUBE
S
LOWER EVAPORATOR CONNECTING HEADER
UPPER TOEVAPORA ROUTLET
HEADER
3rd PASS ROOF TUBES
3rd PASS SIDE WALLUPPER HEADER
3rd PASS ROOF HEADER
3rd PASS FRONT WALLUPPER HEADER
HANGER TUBE INLET HEADER
PRIMARY DESUPER ER HEATTUBE
S
FURNACE ROOF TUBES
3rd PASS FRONT WALL TUBES
FURNACE REAR WALL TUBES
MANHOLE +14.00 m
ASH HOPPER
ASH CONVEYOR
+9.00 m
FURNACE REAR WALL LOWER HEADER
CLINKERCHILL HEADER
CLINKERCHILL TUBES
FURNACE FRONT WALL HEADER
FURNACE FRONT WALL TUBES
2nd PASS SIDE WALLUPPER HEADER
1st PASS SIDE WALL UPPER
HEADER
BURNER
1st PASS
2nd PASS
3rd PASS
+ 35.10 m
+ 35. 10 m
+ 35.10 m
+ 37.50 m
+17.10 m +17.10
m
+ 18.60 m
+ 33.40 m
+ 30.90 m
+ 28.40 m
+ 25.90 m
+ 23.40 m
+ 20.90 m
STEAM DRUM ECONOMISE
DOWNCOMER
R CONNECTION PIPE (FEEDWATE) R
SCREEN TUBES
Figure 1.3.5.2: Boiler circulation

1.3.5.3 Steam Drum Internals
26
The interior of the Steam Drum is shown in Figure 1.3.5.3, the flow of steam and water is
indicated by arrows below. The steam and water mixture entering the Drum from the Riser
Tubes, is collected in the chamber formed by the internal Baffle Plates. From this chamber
the mixture is first led through the Cyclone Separator (centrifugal type) which are arranged in
one row along the length of the Drum. A separating force is created by spinner vanes located
at the bottom, which impose a centrifugal motion to the mixture as it travels upward through
the separators, throwing the water to the outside and forcing the steam to the inside. A
portion of water flowing upward along the inner surface of the cylinder flows out to the
outside through the multi holes of the cylinder.
Figure 1.3.5.3 : Steam Drum Internals
STEAM FLOW WATER FLOW
STEAM &
WATER
STEAM DRUM
WATER
DOWN COMER NOZZLE
CONTINUOUS BLOW PIPE
DRAIN PIPE
WATER
FEEDWATER PIPE
BENT PANEL
SCRUBBER
BOILER FRONT SATURATED STEAM NOZZLE
RISER TUBE NOZZLE
BUFFER PLATE

1.3.5.4 Steam Flow High pressure steam of approximately 37 bar and 370oC that is generated from each
boiler, is channeled into two sub steam headers and led to two main steam headers, from
where the steam is distributed to each of the facilities. Each steam header serves three
boilers. Steam is distributed from the main steam headers to the two steam turbine units
and three systems of turbine by-pass stations. Steam is also distributed from the main
steam header to two turbine driven boiler feedwater pumps, turbine seal systems and
ejector units. Steam for sootblowers on the three boilers is supplied from each sub steam
header.
Additionally, back up steam for deaerators, steam heating of the Electrostatic
Precipitators (Eps), Fabric Filters and reaction product silos is branched off from each
main steam header and supplied after the pressure is reduced by the pressure-reducing
valve. Steam for the boiler feedwater treatment plant is branched off from each main
steam header and supplied after the pressure is reduced by the pressure-reducing valve.
High-pressure steam used in the second stage of the steam air pre-heater is directly
supplied as steam of approximately 42 bars from the steam drum of the boiler. Low-
pressure steam used in the first stage of steam air pre-heater is supplied from the turbine
first bleed steam lines or the back up steam after the pressure has been reduced.
The heat from the combustion is used to generate steam in boilers. The boiler produces
superheated steam at 33 bars and 370oC, which is expanded through two steam turbines.
Each turbine drives a generator to produce electricity for the plant and for feeding into
the grid (refer to Figure 1.3.5.4). Each turbo-generator set is rated at 35 MW. The outage
of a turbo-generator can be quickly resolved by channeling the steam to the other set to
maximize power generation. Any excess steam is then diverted through a pressure
reducing station. The exhaust steam is condensed by Air Cooled Condensers (ACC). The
plant’s generators are synchronized with the Public Utilities Board (PUB) grid. About
20% of the electricity generated is consumed by the plant equipment during operation
while the excess 80% is sold to the PUB through 10.5 / 66 kV transformers.
27
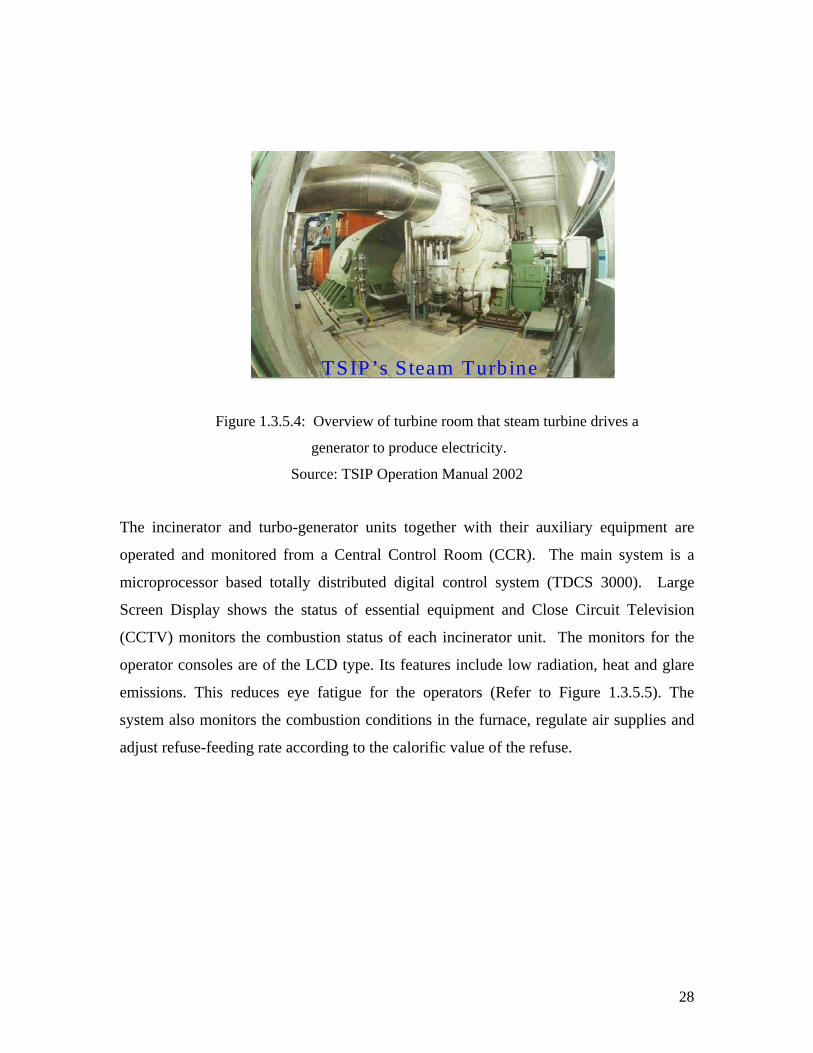
TSIP’s Steam Turbine
Figure 1.3.5.4: Overview of turbine room that steam turbine drives a
generator to produce electricity.
Source: TSIP Operation Manual 2002
The incinerator and turbo-generator units together with their auxiliary equipment are
operated and monitored from a Central Control Room (CCR). The main system is a
microprocessor based totally distributed digital control system (TDCS 3000). Large
Screen Display shows the status of essential equipment and Close Circuit Television
(CCTV) monitors the combustion status of each incinerator unit. The monitors for the
operator consoles are of the LCD type. Its features include low radiation, heat and glare
emissions. This reduces eye fatigue for the operators (Refer to Figure 1.3.5.5). The
system also monitors the combustion conditions in the furnace, regulate air supplies and
adjust refuse-feeding rate according to the calorific value of the refuse.
28

Figure 1.3.5.5: Overview of Monitoring and Control System
Source: TSIP Operation Manual 2002
1.3.5.4 Condensate Flow
Turbine section
The schematic diagram below shows exhaust steam from Steam Turbines (SA10D, 20D)
is to be led to Air Cooled Condensers (ACC) 3(QA10B, 20B), being condensed therein,
and is to be sent to Main Condensate Tanks (MCT) 4(RM10B, 20B). Condensate is also
collected from the Bypass Station (when the turbine is not in operation) in Exhaust Drain
Tanks (RK10B, 20B) and is first transferred into Vacuum Flash Tanks (RM12B, 22B) by
means of Exhaust Drain Pumps (RK11D, 21D, 31D, 41D) before returning back into the
Main Condensate Tanks. Condensate in the Main Condensate Tanks is to be sent to the
Feedwater Tanks (RL10B, 20B) by means of Main Condensate Pumps (RM11D, 21D,
31D, 41D) via Main Air Ejectors 5(QD13B, 14B, 23B, 24B), Gland Steam Condensers
(SG15B, 25B), Condensate Cartridge Filters (UB11B, 21B), L.P. Heaters (RH17B, 27B).
The condensate is then deaerated by the Deaerator inside the Feedwater Tanks and heated
3 ACC - to convert steam into condensate by cooling thru the use of Fans 4 MCT – to receive the condensate from the respective ACC 5 MAE -
29

30
up to 120oC ~ 130ºC together with the Make–Up Water before leaving the Feedwater
Tank. Boiler Section Condensate from 1st Stage S.A.H. is to be collected in two Main Flash Tanks (RU10B,
20B), via S.A.H. Drain tanks and is to be sent to the Feedwater Tanks (RL10, 20B) by
Main Flash Tank Pumps (RU11D, 12D, 21D, 22D). Condensate from the 2nd stage
S.A.H. (1 - 6NE20B) is to be collected in the S.A.H. Drain Tanks (1 ~ 6 RU2B1) placed
close to the S.A.H. and is to be returned directly to the 2nd S.A.H. Condensate Return
Headers (RU5, 6) before entering into the Feedwater Tanks (RL10B,20B). Condensate
from Steam Heating pipes, such as E.P.(1 ~ 6NL10), FF, RG is also returned to the two
Main Flash Tanks (RU10B, 20B), and is also pumped into the Feedwater Tanks (RL10,
20B) by the Main Flash Tank Pumps (RU11D, 12D, 21D, 22D).
31
M
M
M MM M MM
M M
F W T # 2
RL 20 B
M
MM
M
MM
M
MM
M
WTP
MM
SUB HDR # 1 (RA 1)SUB HDR # 2 (RA 2)
MAIN HDR # 1 (RA 10)
MAIN HDR # 2 (RA 20)
BLR 1
BLR 2
BLR 3
BLR 4
BLR 5
BLR 6
RA 15
DEAERATOR BACK-UP VALVE RA 15 S1
RA 36S2
PRESSURE REDUCING
VALVE RA 36S2
DEAERATOR BACK-UP VALVE RA 25 S1
RA 25
SA 40D
SA 30D
RL 13D
RL 12D
RL 11D
RL21D
RL 22D
RL 23D
TUAS SOUTH INCINERATION PLANT
GG
1
SA 20D
SA 10D
MAIN CONDENSATE TANK 1 (RM 10 B)
MAIN CONDENSATE TANK 2 (RM 20 B)
VACUUM FLASH
TANK 1 RM 12B
EXHAUST DRAIN TANK
1 RK 10B
EXHAUST DRAIN TANK
2 RK 20B
RK 11D
RK 12D
RK 21D
RK 22D
RM 11D
RM 21D
RM 31D
RM 41D
AIR COOLED CONDENSER QA 10B
AIR COOLED CONDENSER QA 20B
VACUUM FLASH
TANK 2 RM 22B
SG 15B
GLAND CONDENSER
MAIN AIR EJECTORQD 13B/14B
UB 11B
M
M M
M
FROM BFW
PUMPS
RA 21
RA 31
RA 11
MM
LP HEATER RH 17B
UB 21B
LP HEATER RH 27B
SG 25B
GLAND CONDENSER
MAIN AIR EJECTORQD 23B/24B
RK 10B
RK 20B
MAKE-UP
WATER
F W T # 1
RL 10 B
M
RU 12D
RU 11D
RU 22D
RU 21D
MAIN FLASH TANK
MAIN FLASH TANK
RU 10B
RU 20B
MAIN FLASH
TANK 1
MAIN FLASH
TANK 2
M
M
LP HEATER DRAIN PUMP
RN 11D
LP HEATER DRAIN PUMP
RN 21D
M MM
M
M
MM
MM
MM
M
M
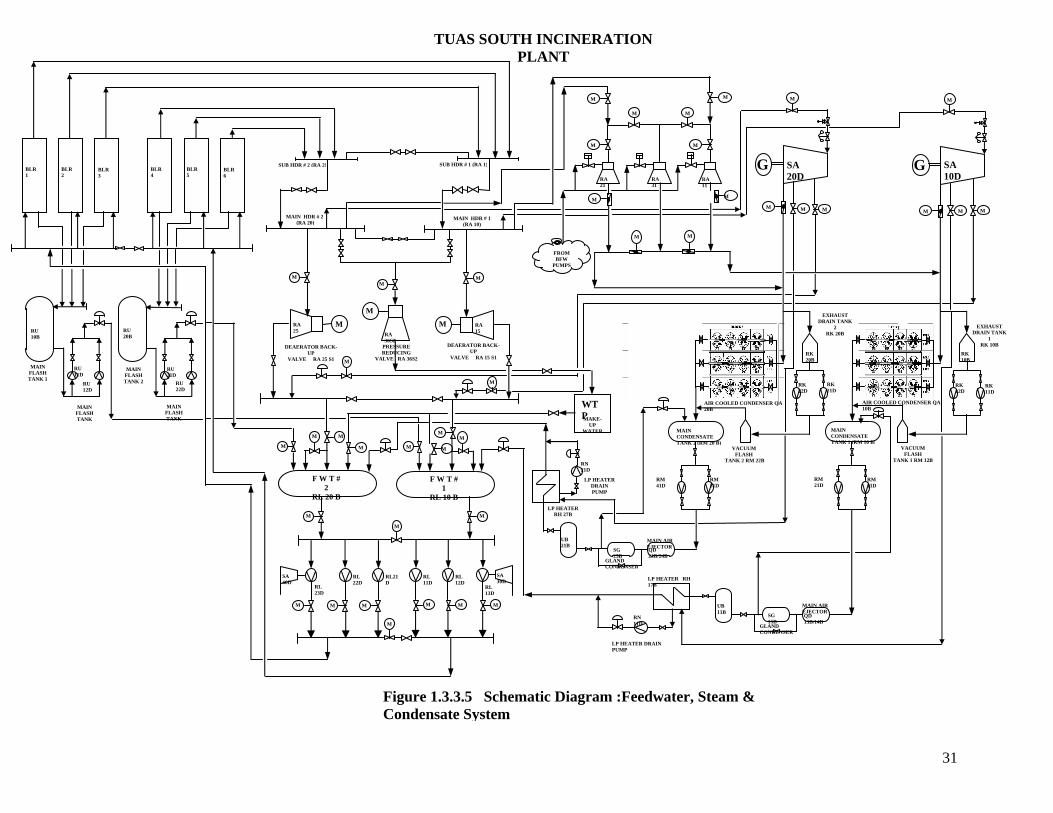
Figure 1.3.3.5 Schematic Diagram :Feedwater, Steam & Condensate System
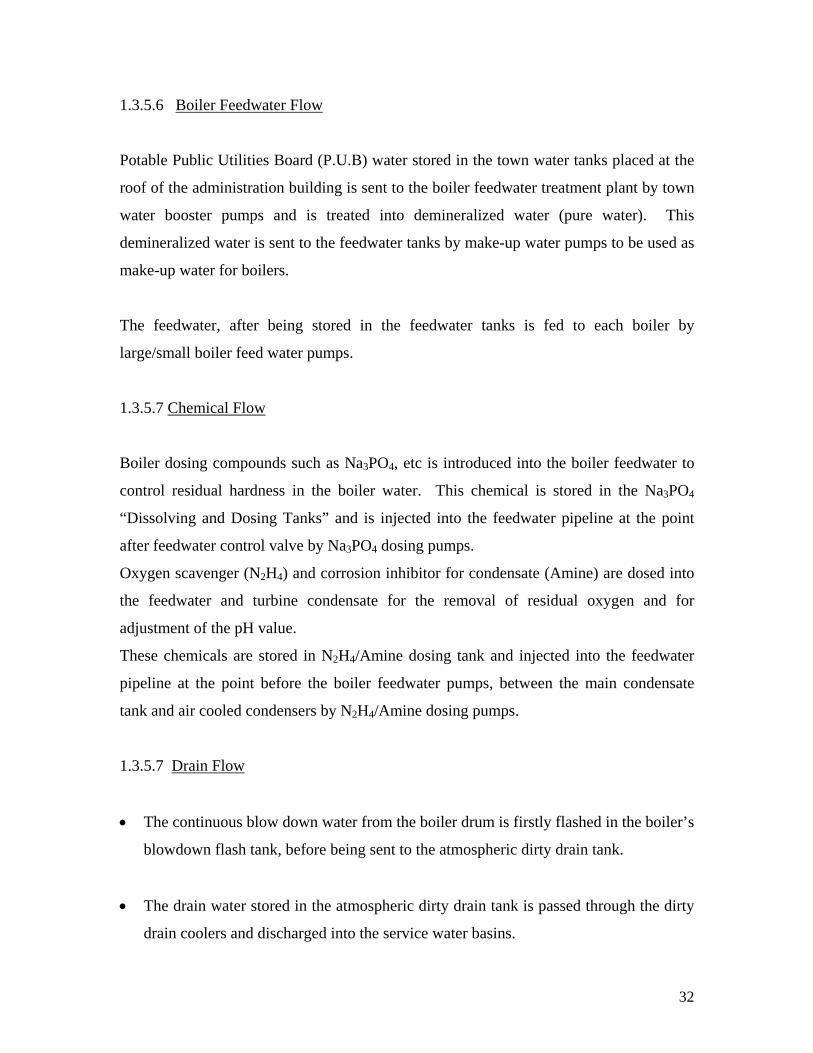
1.3.5.6 Boiler Feedwater Flow
Potable Public Utilities Board (P.U.B) water stored in the town water tanks placed at the
roof of the administration building is sent to the boiler feedwater treatment plant by town
water booster pumps and is treated into demineralized water (pure water). This
demineralized water is sent to the feedwater tanks by make-up water pumps to be used as
make-up water for boilers.
The feedwater, after being stored in the feedwater tanks is fed to each boiler by
large/small boiler feed water pumps.
1.3.5.7 Chemical Flow
Boiler dosing compounds such as Na3PO4, etc is introduced into the boiler feedwater to
control residual hardness in the boiler water. This chemical is stored in the Na3PO4
“Dissolving and Dosing Tanks” and is injected into the feedwater pipeline at the point
after feedwater control valve by Na3PO4 dosing pumps.
Oxygen scavenger (N2H4) and corrosion inhibitor for condensate (Amine) are dosed into
the feedwater and turbine condensate for the removal of residual oxygen and for
adjustment of the pH value.
These chemicals are stored in N2H4/Amine dosing tank and injected into the feedwater
pipeline at the point before the boiler feedwater pumps, between the main condensate
tank and air cooled condensers by N2H4/Amine dosing pumps.
1.3.5.7 Drain Flow
• The continuous blow down water from the boiler drum is firstly flashed in the boiler’s
blowdown flash tank, before being sent to the atmospheric dirty drain tank.
• The drain water stored in the atmospheric dirty drain tank is passed through the dirty
drain coolers and discharged into the service water basins.
32

_________________________________________ Chapter 2 Waste Fuel Firing 2.1 Introduction
2.2 Background
2.3 Analysis of Solid Wastes
2.4 Combustion Theory and Calculations
2.4.1 Theoretical Air for Combustion
2.4.2 Excess Air and Percentage of Oxygen in Flue Gas
2.4.3 Excess Air Calculation
2.4.4 Flue Gas Analysis
2.4.5 Flue Gas Sampling
2.5 TSIP Combustion control system
33

2.1 Introduction Solid waste typically contains plastic materials, papers, food waste, leather & textiles,
glass and others. These typical components of refuse ending up in an incinerator and are
sources of chlorine and sulfates than can form corrosive agents during the combustion of
refuse boiler. This chapter looks at these how typical refuse components alter the
characteristics of gases in flue gas, and how these gases could affect the performance and
integrity of the boiler. The chapter goes on to calculate the percentage of free oxygen in
the flue gas given the amount of excess air introduced during firing, and includes a brief
mention on the TSIP Stoker combustion control system and precaution measured when
sampling flue gas.
2.2 Background
Wastes have been fired in boilers in a number of industries for many years both as a
means of waste disposal and for energy recovery. For waste disposal it means large
reduction of its waste volume up to about 90% of reduction. Which its running cost can
be offset by heat recovery. Well-established examples are the firing of bagasse, which is
the residue from the processing sugar in sugar factories, and of blast furnace gas in steel
works. With increasing fuel and energy costs, consideration is now being given to energy
recovery by the firing in boilers of any combustible wastes, which can, in turn, reduce
fuel and final product production costs.
The type of waste product being burned, and also the combustion process required to
burn the waste, have a large influence upon the design of the boiler used. Particulate
carryover, in the case of solid fuels, and corrosive properties of the products of
combustion are significant considerations.
As the non-homogeneous composition of the refuse waste are used as fuels, it becomes
necessary to carry out tests to determine the most suitable methods of firing good
combustion in waste-boilers, these and a continuous process of boiler development is
required.
34
2.3 Analysis of Solid Wastes
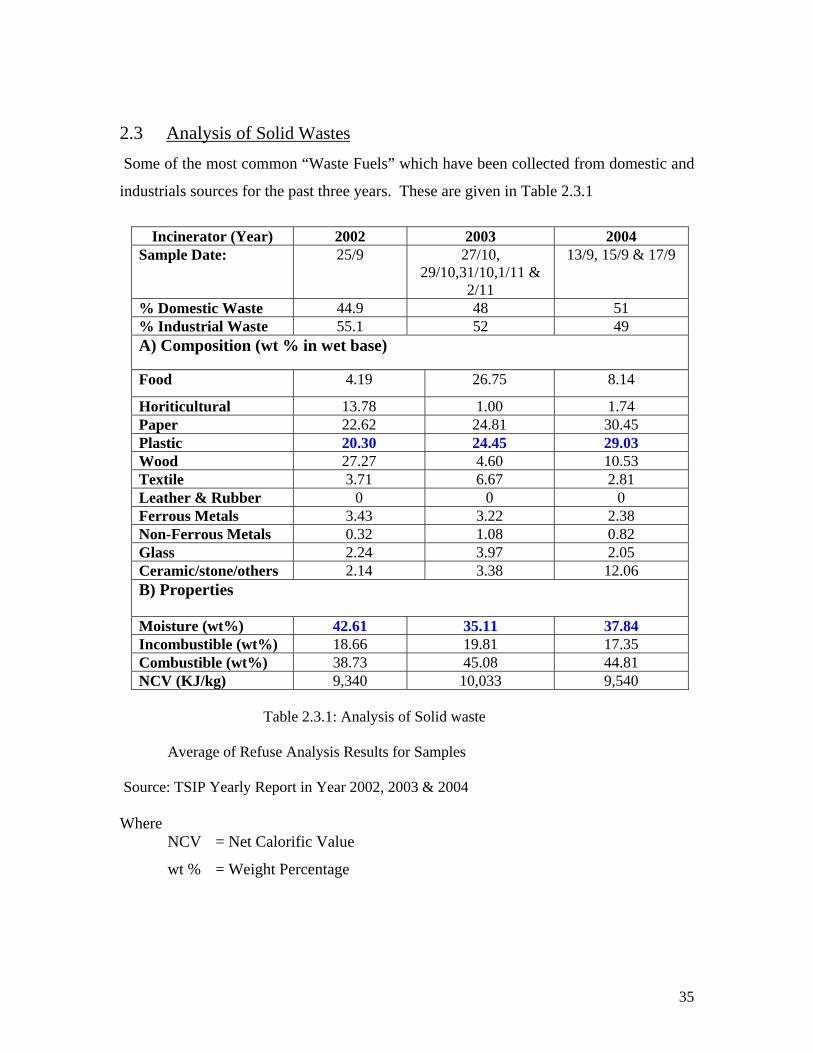
Some of the most common “Waste Fuels” which have been collected from domestic and
industrials sources for the past three years. These are given in Table 2.3.1
Incinerator (Year) 2002 2003 2004
Sample Date: 25/9 27/10, 29/10,31/10,1/11 &
2/11
13/9, 15/9 & 17/9
% Domestic Waste 44.9 48 51 % Industrial Waste 55.1 52 49 A) Composition (wt % in wet base)
Food 4.19 26.75 8.14
Horiticultural 13.78 1.00 1.74 Paper 22.62 24.81 30.45 Plastic 20.30 24.45 29.03 Wood 27.27 4.60 10.53 Textile 3.71 6.67 2.81 Leather & Rubber 0 0 0 Ferrous Metals 3.43 3.22 2.38 Non-Ferrous Metals 0.32 1.08 0.82 Glass 2.24 3.97 2.05 Ceramic/stone/others 2.14 3.38 12.06 B) Properties
Moisture (wt%) 42.61 35.11 37.84 Incombustible (wt%) 18.66 19.81 17.35 Combustible (wt%) 38.73 45.08 44.81 NCV (KJ/kg) 9,340 10,033 9,540
Table 2.3.1: Analysis of Solid waste
Average of Refuse Analysis Results for Samples Source: TSIP Yearly Report in Year 2002, 2003 & 2004 Where
NCV = Net Calorific Value
wt % = Weight Percentage
35
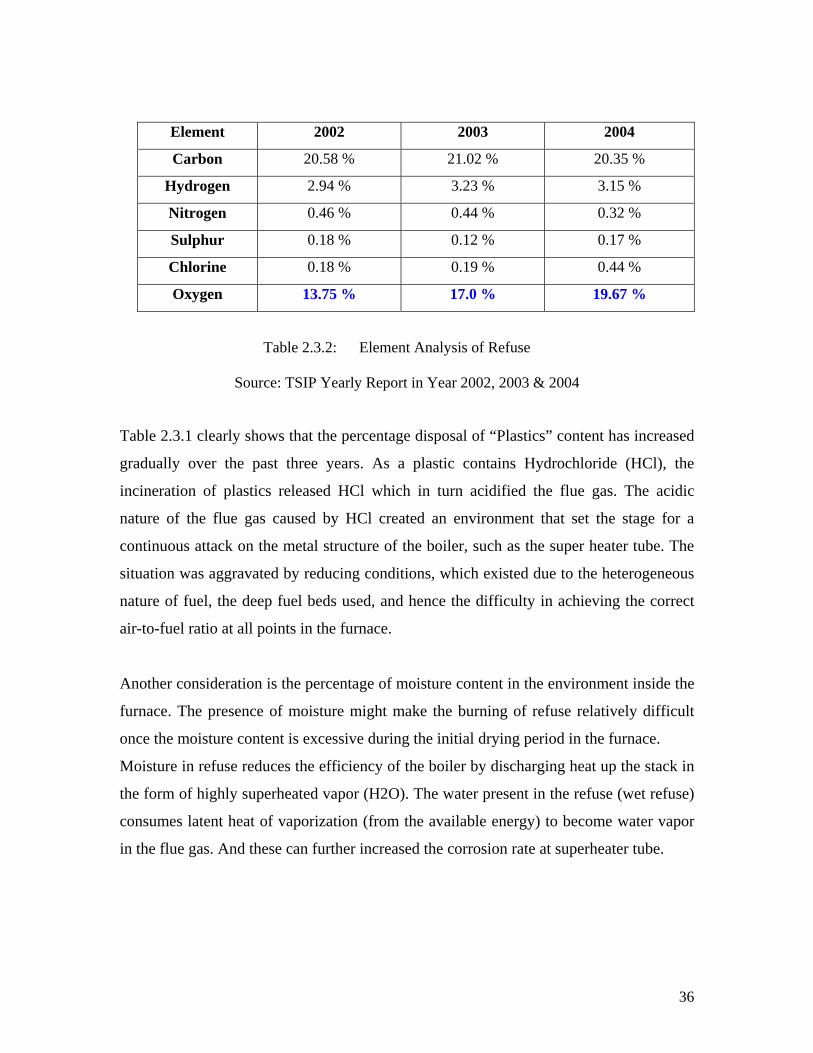
Element 2002 2003 2004
Carbon 20.58 % 21.02 % 20.35 %
Hydrogen 2.94 % 3.23 % 3.15 %
Nitrogen 0.46 % 0.44 % 0.32 %
Sulphur 0.18 % 0.12 % 0.17 %
Chlorine 0.18 % 0.19 % 0.44 %
Oxygen 13.75 % 17.0 % 19.67 %
Table 2.3.2: Element Analysis of Refuse
Source: TSIP Yearly Report in Year 2002, 2003 & 2004
Table 2.3.1 clearly shows that the percentage disposal of “Plastics” content has increased
gradually over the past three years. As a plastic contains Hydrochloride (HCl), the
incineration of plastics released HCl which in turn acidified the flue gas. The acidic
nature of the flue gas caused by HCl created an environment that set the stage for a
continuous attack on the metal structure of the boiler, such as the super heater tube. The
situation was aggravated by reducing conditions, which existed due to the heterogeneous
nature of fuel, the deep fuel beds used, and hence the difficulty in achieving the correct
air-to-fuel ratio at all points in the furnace.
Another consideration is the percentage of moisture content in the environment inside the
furnace. The presence of moisture might make the burning of refuse relatively difficult
once the moisture content is excessive during the initial drying period in the furnace.
Moisture in refuse reduces the efficiency of the boiler by discharging heat up the stack in
the form of highly superheated vapor (H2O). The water present in the refuse (wet refuse)
consumes latent heat of vaporization (from the available energy) to become water vapor
in the flue gas. And these can further increased the corrosion rate at superheater tube.
36
Moreover, it is clear from Table 2.3.2 that the percentage of oxygen content in the
furnace is above the recommended value of 9 %. The presence of excess free oxygen in
the furnace might affect the burning of refuse in the combustion process and may lead to
poor boiler performance. This is attributed by the fact that free oxygen could react with
the metal of the tube at the third zone to produce iron oxide (rust).
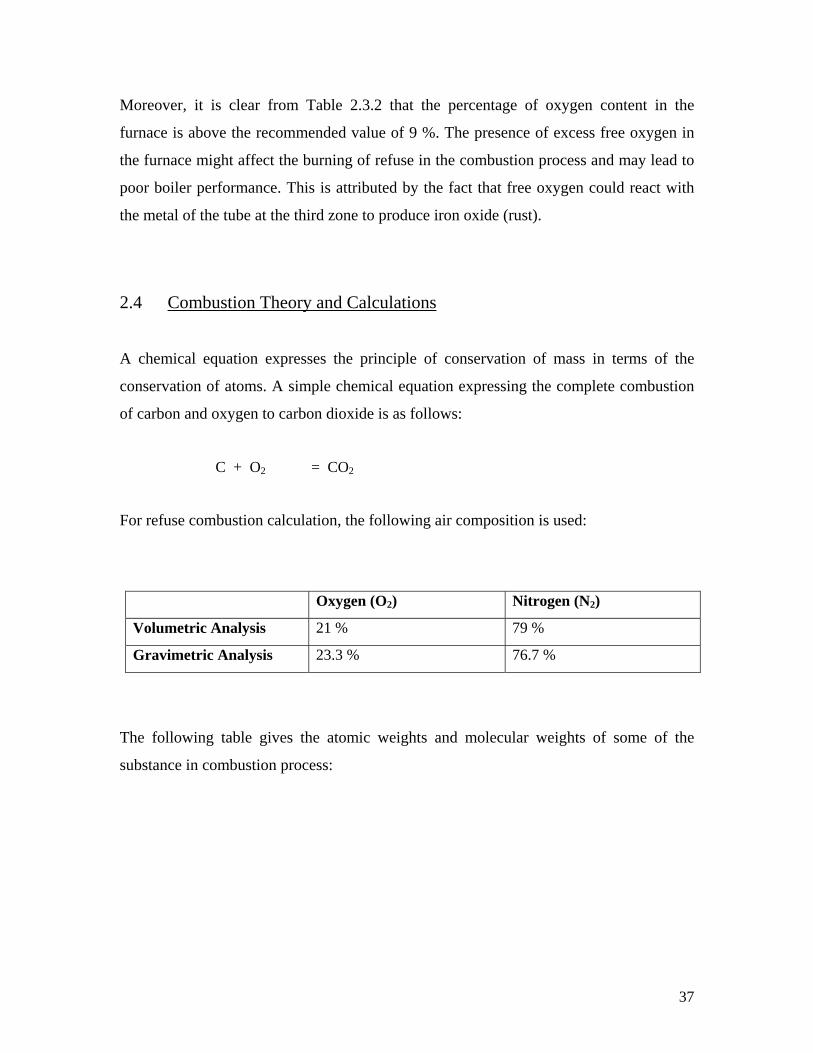
2.4 Combustion Theory and Calculations
A chemical equation expresses the principle of conservation of mass in terms of the
conservation of atoms. A simple chemical equation expressing the complete combustion
of carbon and oxygen to carbon dioxide is as follows:
C + O2 = CO2
For refuse combustion calculation, the following air composition is used:
Oxygen (O2) Nitrogen (N2)
Volumetric Analysis 21 % 79 %
Gravimetric Analysis 23.3 % 76.7 %
The following table gives the atomic weights and molecular weights of some of the
substance in combustion process:
37
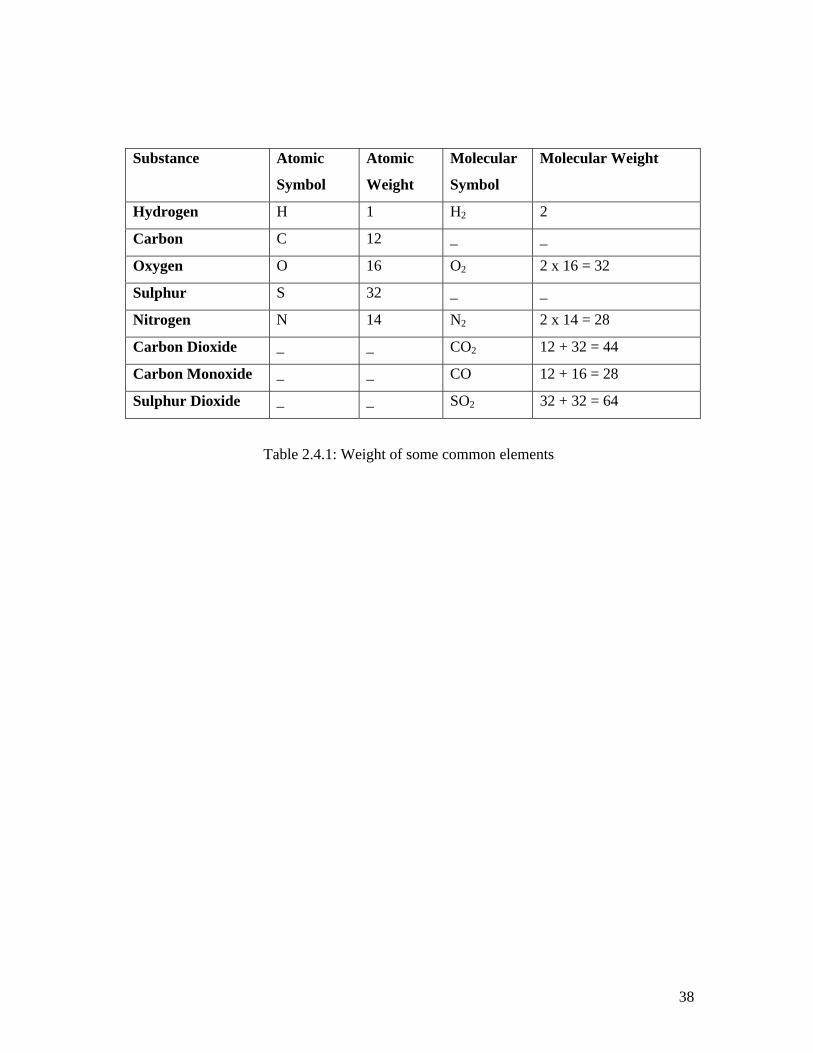
Substance Atomic
Symbol
Atomic
Weight
Molecular
Symbol
Molecular Weight
Hydrogen H 1 H2 2
Carbon C 12 _ _
Oxygen O 16 O2 2 x 16 = 32
Sulphur S 32 _ _
Nitrogen N 14 N2 2 x 14 = 28
Carbon Dioxide _ _ CO2 12 + 32 = 44
Carbon Monoxide _ _ CO 12 + 16 = 28
Sulphur Dioxide _ _ SO2 32 + 32 = 64
Table 2.4.1: Weight of some common elements
38

2.4.1 Theoretical Air for Combustion
Theoretical air is the quantity of air required to burn all the combustible elements present
in the refuse completely and it is refer to stoichiometric air. If the air is more than the
stoichiometric, it is called excess air.
For Elements
a) Carbon
C + O2 = CO2 12 kg C + 32 kg O2 = 44 kg CO2
Hence, 12 kg of carbon requires 32 kg of oxygen for complete combustion. Thus 1 kg of
carbon would require 32 / 12 or 2.67 kg of oxygen. Since air contains 23.3 % by weight
of oxygen, quantity of air required is 2.67 x (100 / 23) or 11.46 kg of air.
Similarly, 1 kg of carbon would require 1.33 kg of oxygen or 5.72 kg of air to burn to
2.33 kg of carbon monoxide.
C + ½ O2 = CO 12 kg C + 16 kg O2 = 28 kg CO
b) Hydrogen
H2 + ½ O2 = H2O 2 kg H2 + 16 kg O2 = 18 kg H2O
Here, 2 kg of hydrogen requires 16 kg of oxygen for complete combustion. Thus, 1 kg of
hydrogen would require 8 kg of oxygen or 34.33 kg of air.
39
C) Sulphur S + O2 = SO2 32 kg S + 32 kg O2 = 64 kg of SO2 Here, 1 kg of sulphur requires 1 kg of oxygen or 4.29 kg of air. 2.4.2 Excess Air and Percentage of Oxygen in Flue Gas In practical combustion systems, air in excess of the theoretical requirement is necessary
for complete combustion because of limited reaction time and the imperfect mixing of the
fuel and air. Furthermore, inert gas molecules like nitrogen obstruct the reaction between
active molecules of refuse and oxygen.
Air for combustion is divided into primary air and secondary air. Primary air provides a
main percentage of combustion air, but more importantly, controls the amount of refuse
that can be burned. Secondary air helps in burning refuse completely. The volatile gas
that escapes from the refuse is completely burned by secondary air. Most of the refuse
incinerators lack of control of this secondary air resulting on incompletely burned of
gases or more excess air in furnace chamber.
The quantity of excess air to be used is a matter of compromise, with no excess air,
incomplete combustion may occur resulting in losing available heat and black smoke
emission, whereas too much excess air will reduce the temperature of the furnace and
carrying away extra heat to the chimney. Too much excess air will also increase the
amount of sulphur trioxide (SO3) produced from sulphur dioxide (SO2), which in turn
combines with the water vapor to produce sulphuric acids. Sulphuric acid is deposited on
the cooler surfaces of the boilers particularly down stream equipment where temperature
is lower. The dew point corrosion might cause rapid corrosion to all metallic
components.
40

The percentage of oxygen (O2) in flue gas is an indicator of the quantity of excess air
used in boilers; the higher percentage of oxygen (O2) the higher the excess air used. The
recommendation percentage oxygen (O2) in the flue gas for common boilers is about 9 %
(9 % in refuse incineration plant). The analysis of flue gases is done by an instrument
call an “Orsat” which give the percentage volume of the amount of free oxygen, carbon
dioxide and carbon monoxide in the flue gas. For complete combustion, the percentage
of carbon monoxide (CO) should be zero.
2.4.3 Excess Air Calculation The immediate calculation below carries with it the assumption of perfect combustion (i.e. 0
% excess air) of refuse.
For all calculations, the elemental component of refuse as based on Year 2004 is as follows:
Carbon (C) = 20.35 % Hydrogen (H) = 3.15 % Sulphur (S) = 0.17 % The following products of combustion are formed for 1 kg of refuse: CO2 = (0.2035 / 12) x 44 = 0.746 kg CO2 H2O = (0.0315 / 2) x 18 = 0.2835 kg H2O SO2 = (0.0017 / 32) x 64 = 0.0034 kg SO2 N2 = [(0.2035 / 12) x 44] [76.7 / 23.3] + [(0.0315 / 2) x 18] [76.7 / 23.3] + [(0.0017 / 32) x 64] [76.7 / 23.3] = 2.456 + 0.933 + 0.011 = 3.40 kg N2 Total quantity of flue gas formed is 4.433 kg
41
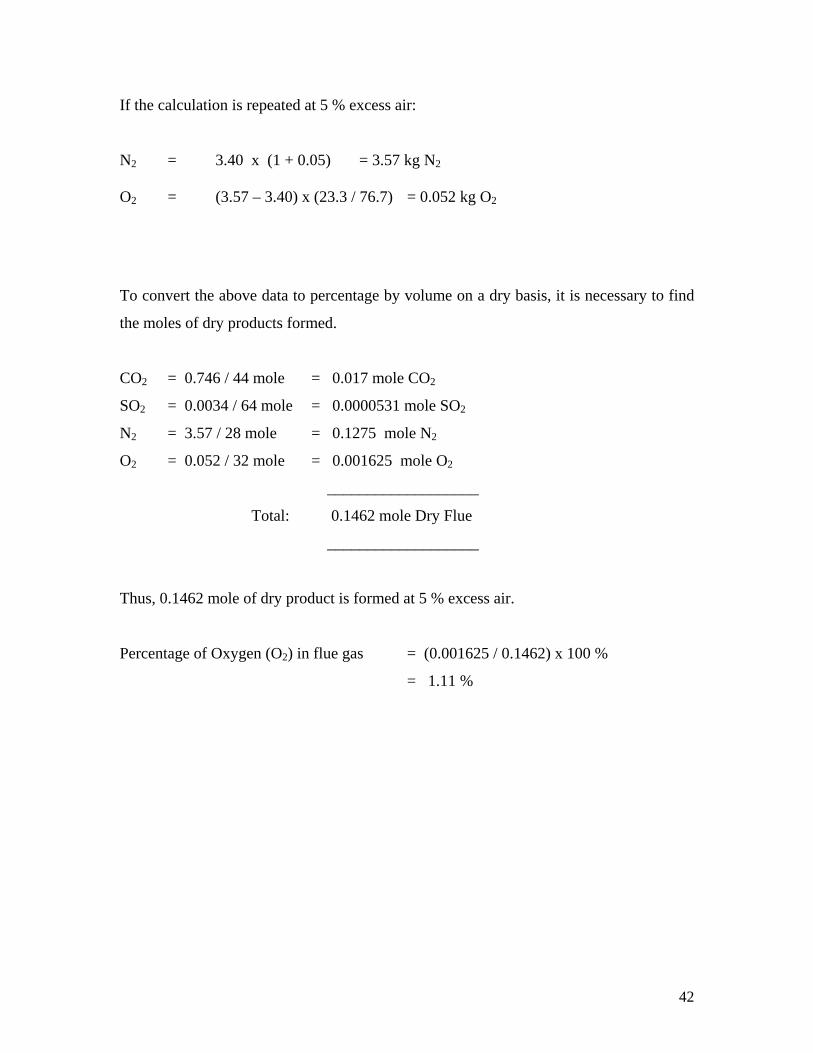
If the calculation is repeated at 5 % excess air: N2 = 3.40 x (1 + 0.05) = 3.57 kg N2 O2 = (3.57 – 3.40) x (23.3 / 76.7) = 0.052 kg O2
To convert the above data to percentage by volume on a dry basis, it is necessary to find
the moles of dry products formed.
CO2 = 0.746 / 44 mole = 0.017 mole CO2
SO2 = 0.0034 / 64 mole = 0.0000531 mole SO2
N2 = 3.57 / 28 mole = 0.1275 mole N2
O2 = 0.052 / 32 mole = 0.001625 mole O2
___________________
Total: 0.1462 mole Dry Flue
___________________
Thus, 0.1462 mole of dry product is formed at 5 % excess air.
Percentage of Oxygen (O2) in flue gas = (0.001625 / 0.1462) x 100 %
= 1.11 %
42
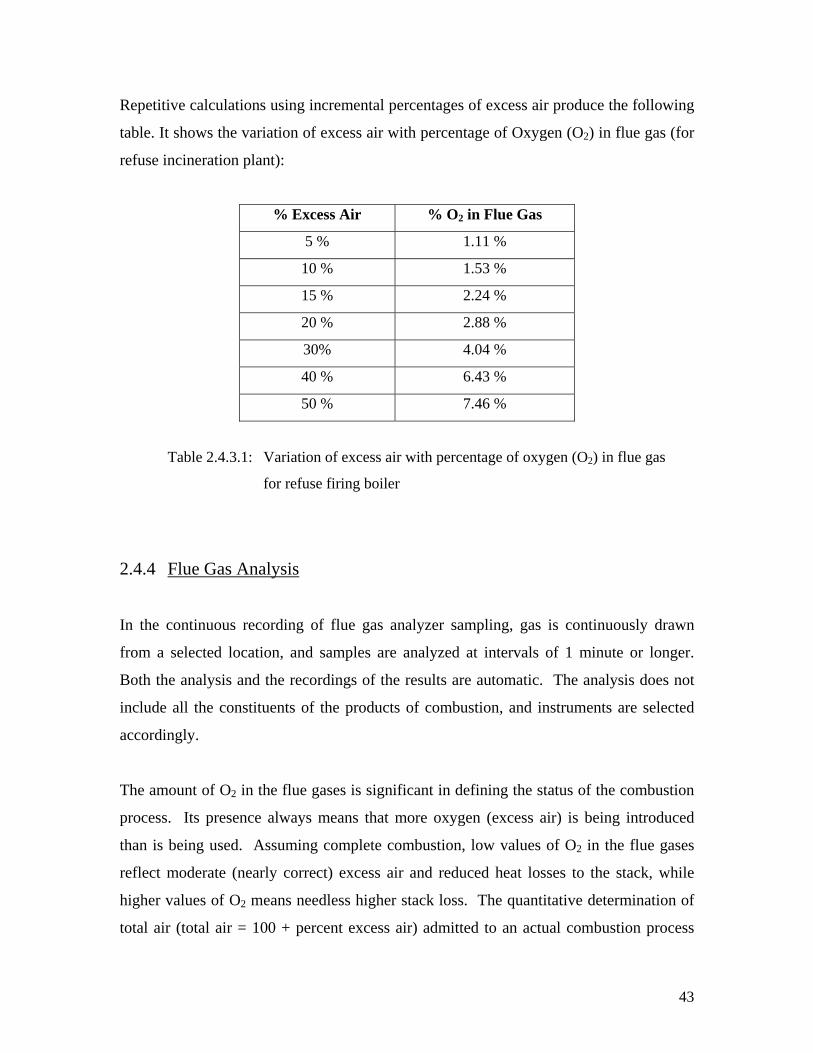
Repetitive calculations using incremental percentages of excess air produce the following
table. It shows the variation of excess air with percentage of Oxygen (O2) in flue gas (for
refuse incineration plant):
% Excess Air % O2 in Flue Gas
5 % 1.11 %
10 % 1.53 %
15 % 2.24 %
20 % 2.88 %
30% 4.04 %
40 % 6.43 %
50 % 7.46 %
Table 2.4.3.1: Variation of excess air with percentage of oxygen (O2) in flue gas
for refuse firing boiler
2.4.4 Flue Gas Analysis
In the continuous recording of flue gas analyzer sampling, gas is continuously drawn
from a selected location, and samples are analyzed at intervals of 1 minute or longer.
Both the analysis and the recordings of the results are automatic. The analysis does not
include all the constituents of the products of combustion, and instruments are selected
accordingly.
The amount of O2 in the flue gases is significant in defining the status of the combustion
process. Its presence always means that more oxygen (excess air) is being introduced
than is being used. Assuming complete combustion, low values of O2 in the flue gases
reflect moderate (nearly correct) excess air and reduced heat losses to the stack, while
higher values of O2 means needless higher stack loss. The quantitative determination of
total air (total air = 100 + percent excess air) admitted to an actual combustion process
43
requires a complete flue gas analysis for CO2, O2, CO and N2 (by difference) or the direct
measurement of the air supplied by a suitable fluid meter.
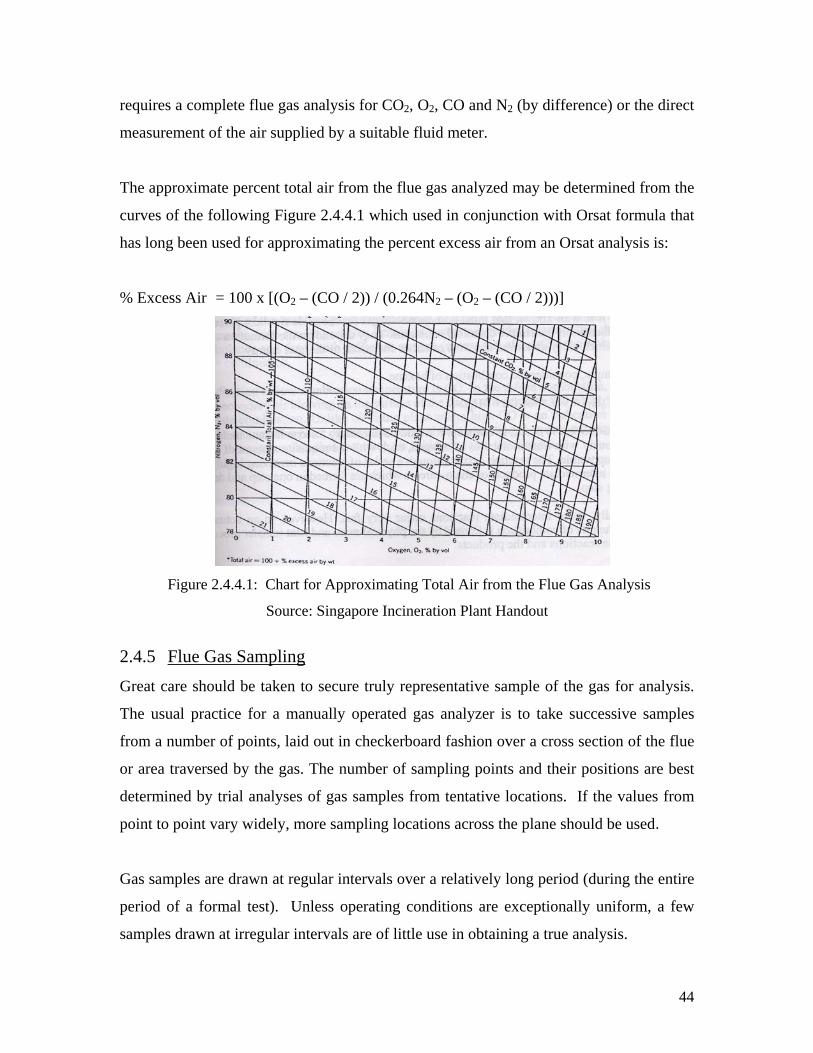
The approximate percent total air from the flue gas analyzed may be determined from the
curves of the following Figure 2.4.4.1 which used in conjunction with Orsat formula that
has long been used for approximating the percent excess air from an Orsat analysis is:
% Excess Air = 100 x [(O2 – (CO / 2)) / (0.264N2 – (O2 – (CO / 2)))]
Figure 2.4.4.1: Chart for Approximating Total Air from the Flue Gas Analysis
Source: Singapore Incineration Plant Handout
2.4.5 Flue Gas Sampling Great care should be taken to secure truly representative sample of the gas for analysis.
The usual practice for a manually operated gas analyzer is to take successive samples
from a number of points, laid out in checkerboard fashion over a cross section of the flue
or area traversed by the gas. The number of sampling points and their positions are best
determined by trial analyses of gas samples from tentative locations. If the values from
point to point vary widely, more sampling locations across the plane should be used.
Gas samples are drawn at regular intervals over a relatively long period (during the entire
period of a formal test). Unless operating conditions are exceptionally uniform, a few
samples drawn at irregular intervals are of little use in obtaining a true analysis.
44
Fixed-position samplers of the branch-pipe type, extending into the flue area, are likely to
give misleading results, since the proportion of gas drawn into each branch may not
correspond to the flows over the flue cross section. A better arrangement is to insert a
single sampling element in the flue, at a location established by thorough preliminary
analyses, from which samples can be drawn representing a fair average. Samples for the
automatic mechanical gas analyzers are frequently drawn through single sampling pipe
carefully located in this manner.
2.5 TSIP Combustion Control System
In TSIP refuse is burned under controlled conditions and heat is recovered to provide
steam for electricity generation. In TSIP its combustion control system has managed to
maintain a stable steam condition in the boiler. It is actually being able to burn the
composition of the refuse which are changing every moment. However others factors that
contribute corrosion in the boiler such as outlet flue gas temperature, HCI, carbon
monoxide (CO) and excess O2 are not being properly integrated into the control system
so that an ideal combustion situation can be achieved.
In normal operation of the Mitsubishi-Martin type incinerator its purpose of Automatic
Combustion Control (ACC) are for stabilization of combustion state and generation
steam amount. The combustion control system maintains a target steam flow rate by
adjustment of air and refuse-fuel flows. The control system, therefore, responds to
changes in amount of the steam generate. Figure 2.5.1 show the average of one day flue
gas temperature taken for operating boiler no: 6 at difference amount steam generated.
And figure 2.5.2 show percentage of oxygen content when boiler is operated at difference
load.
45

Flue gas temperature at third zone
600
500 TEMP
400 90t/h
300 80t/h
200
100
0 gas temp 1 gas temp 2 gas temp 3
Superheater area
70t/h
Figure 2.5.1: Flue Gas Temperature at third pass section in the furnace
O2 vol%
7.5
8
8.5
9
9.5
10
85t/h 75t/h 70t/h 65t/h
Steam
vol%
Figure 2.5.2: Oxygen content in the furnace at difference load
46

CO mg/Nm3
12.5
14.5
16.5
85t/h 75t/h 70t/h 65t/h
steam
mg/
Nm
3
Figure 2.5.3: Carbon monoxide content in the furnace at difference load
As calculated 50% excess air condition implies approximately 7.5% (refer to table
2.4.3.1) oxygen remains in the boiler exhaust stack. When boiler is operated at load of 65
to 85 ton per hour the oxygen percentage content was 9.5 to 8.4 and this more than 50%
excess used for the combustion. Carbon monoxide content in figure 2.5.3 indicated that
there is no difference of incomplete combustion.
It is due to control philosophy of Automated Control System for Mitsubishi-Martin type
incinerator that objective of controlling corrosion attack in tube at third zone are not
being properly understand.
Literature review of corrosion control in the refuse boiler is best by studying or even
visiting existing incinerators that have successfully implemented them. The Camden
Resource Recovery Facility in USA, to control the furnace condition in targeting
corrosion attack in furnace, furnace exit- temperature control loop is use to control its
furnace condition.
47
_________________________________________
Chapter 3 Cause of Corrosion and Leakage in the Boiler Super Heater Tube 3.1 Introduction 3.2 Corrosion 3.3 Types of Corrosion
3.3.1 High Temperature Corrosion
3.3.2 Oxygen Corrosion 3.4 Analysis of superheater tube thickness measured value. 3.4 Location of the Super Heater Tube in the boiler 3.5 Environment Condition in the boiler at the Location of Super Heater Tube 3.6 Analysis on Raw Hydrochloride (HCL) and Oxygen Content during Combustion
Process
48

3.1 Introduction Chapter 3 outlines the analysis on the causes of corrosion on a critical part of the boiler
component – the super heater. It will provide some empirical measurements of heat
transfer rate, surface temperature of the super heater tube, Hydrochloride (HCl) and the
thickness of the dry ashes accumulated. The analysis will establish that the corrosion is
caused by hydrogen-chloride (HCl) found in flue gas. While not a cause of corrosion, the
report will also identify that slag, which is deposited on the tube surface by the rising ash-
carrying flue gas, could potentially impair the structural integrity of the super heater tubes
its performance in conveying steam at the optimum temperature.
3.2 Corrosion
Million of dollars are lost each year because of corrosion. Much of this loss is due to the
corrosion of iron and steel, although many other metals may corrode as well. Corrosion is
the rotting or deterioration of a metal by chemical reaction. It implies the transformation
of a metal, in its elementary form, e.g. iron oxide or copper sulphide as a result of its
interaction with its environment. This tendency to corrode exists because a metal wants
to attain a more stable (less reactive) state. The problem with iron as well as many other
metals is that the oxide formed by oxidation does not firmly adhere to the surface of the
metal and flakes off easily causing “pitting”. Extensive pitting eventually causes
structural weakness and disintegration of the metal.
49
3.3 Types of Corrosion
Two types of fired-side corrosion can occur in boilers:
(a) High Temperature Corrosion
(b) Oxygen Corrosion
3.3.1 High Temperature Corrosion
Introduction
High temperature corrosion is a form of corrosion that does not require the presence of a
liquid electrolyte. Sometimes, this type of damage is called “Dry Corrosion” or
“Scaling”. The term oxidation is ambivalent since it can either refer to the formation of
oxides or to the mechanism of oxidation of a metal, i.e. its change to a higher valence
than the metallic state. In most corrosive high temperature environment, oxidation often
participates in the high temperature corrosion reactions, regardless of the predominant
mode of corrosion. Alloys often rely upon the oxidation reaction to develop a protective
scale to resist corrosion attach such as sulfidation, carburization and other forms of high
temperature attack. For Fe base alloys the formation of volatile iron chlorides, instead of
protective oxide, is the main driving force, Ni base alloys being more resistant.
High temperature corrosion has been a feature of boilers associated with mass burning
refuse incinerators, particularly when there are heating surfaces exposed to the gases in
the combustion chamber or high metal temperatures. It is believed that the high
hydrochloride (HCl) content of the gases is a major cause of this. This HCl results from
the high chloride content of the “Plastics” contained in the refuse. The situation is
aggravated by reducing conditions, which exists due to the heterogeneous nature of the
fuel, the deep fuel beds used, and hence the difficulty in achieving the correct air-to-fuel
ratio at all points, in the furnace. It will be realized that the bonding salt, sodium
pyrosulphate, will be present in most cases. This substance is highly corrosive to steel,
and if allowed to persist will cause corrosion to take place beneath the deposits.
50
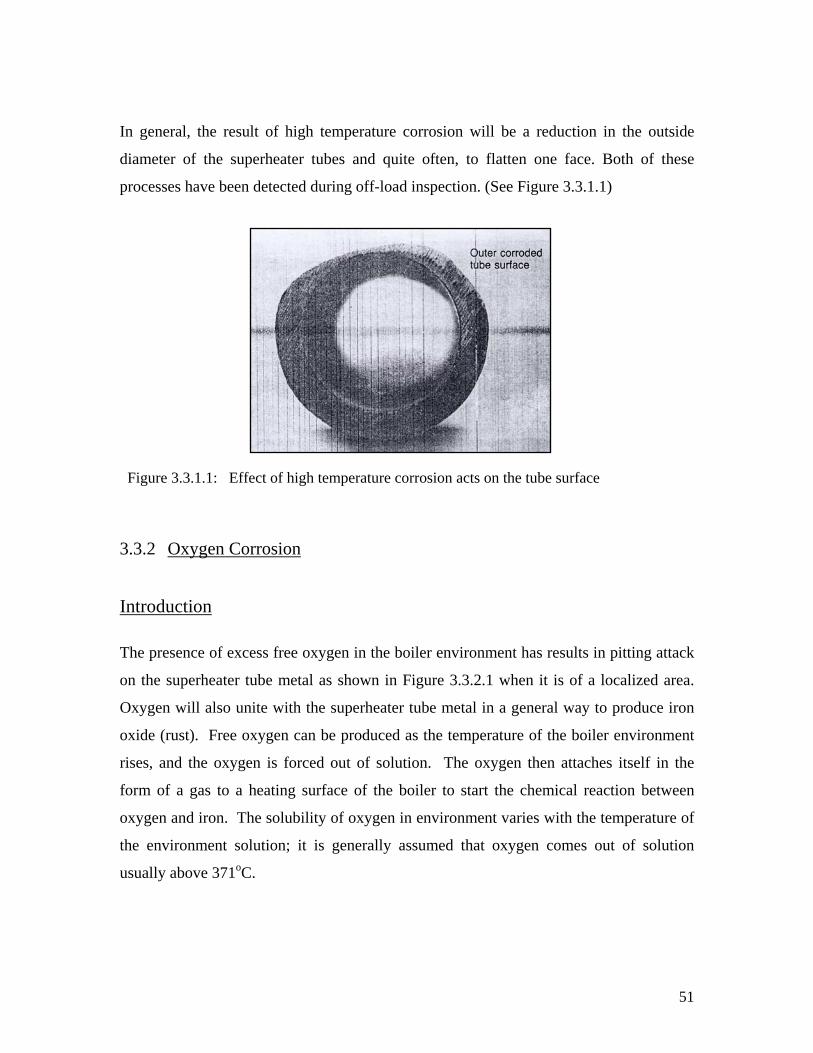
In general, the result of high temperature corrosion will be a reduction in the outside
diameter of the superheater tubes and quite often, to flatten one face. Both of these
processes have been detected during off-load inspection. (See Figure 3.3.1.1)
Figure 3.3.1.1: Effect of high temperature corrosion acts on the tube surface
3.3.2 Oxygen Corrosion
Introduction
The presence of excess free oxygen in the boiler environment has results in pitting attack
on the superheater tube metal as shown in Figure 3.3.2.1 when it is of a localized area.
Oxygen will also unite with the superheater tube metal in a general way to produce iron
oxide (rust). Free oxygen can be produced as the temperature of the boiler environment
rises, and the oxygen is forced out of solution. The oxygen then attaches itself in the
form of a gas to a heating surface of the boiler to start the chemical reaction between
oxygen and iron. The solubility of oxygen in environment varies with the temperature of
the environment solution; it is generally assumed that oxygen comes out of solution
usually above 371oC.
51

Figure 3.3.2.1: Pitting attack from oxygen on outside surfaces of boiler tube
The formation of rust can occur at some distance away from the actual pitting or erosion
of iron as illustrated below. This is possible because the electrons produced via the initial
oxidation of iron can be conducted through the metal and iron ions can diffuse through
the water layer to another point to the metal surface where oxygen is available. This
process results in an electrochemical cell in which iron serves as the anode, oxygen gas as
the cathode, and the aqueous solution of ions serving as a “Salt Bridge” as shown below
in Figure 3.3.2.2.
Figure 3.3.2.2: Salt Bridge
The involvement of water accounts for the fact that rusting occurs much more rapidly in
moist conditions as compared to a dry environment.
52
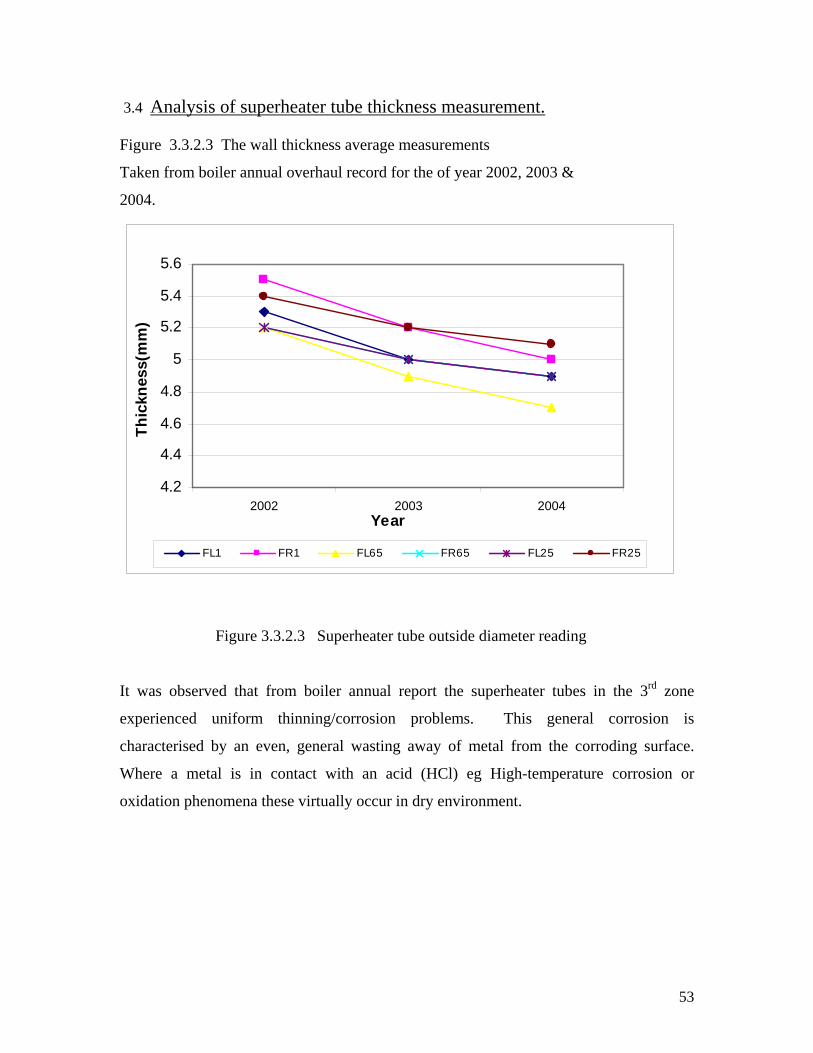
3.4 Analysis of superheater tube thickness measurement. Figure 3.3.2.3 The wall thickness average measurements
Taken from boiler annual overhaul record for the of year 2002, 2003 &
2004.
4.2
4.4
4.6
4.8
5
5.2
5.4
5.6
2002 2003 2004Year
Thic
knes
s(m
m)
FL1 FR1 FL65 FR65 FL25 FR25
Figure 3.3.2.3 Superheater tube outside diameter reading
It was observed that from boiler annual report the superheater tubes in the 3rd zone
experienced uniform thinning/corrosion problems. This general corrosion is
characterised by an even, general wasting away of metal from the corroding surface.
Where a metal is in contact with an acid (HCl) eg High-temperature corrosion or
oxidation phenomena these virtually occur in dry environment.
53
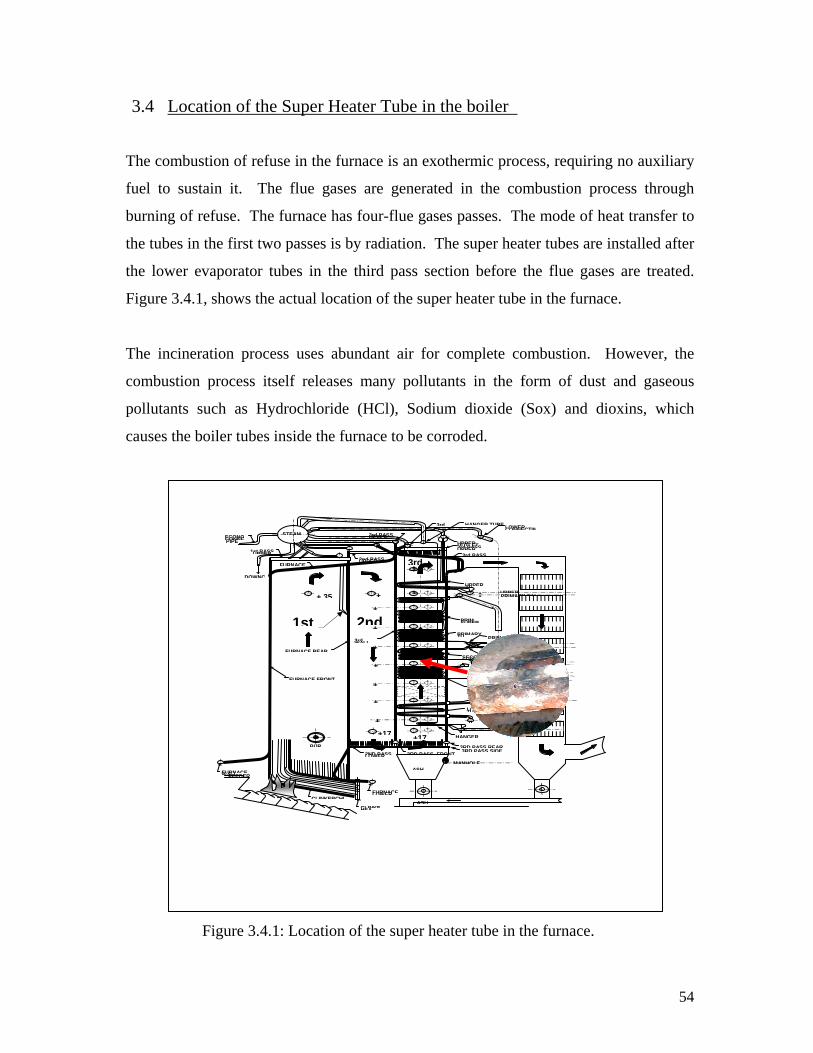
3.4 Location of the Super Heater Tube in the boiler The combustion of refuse in the furnace is an exothermic process, requiring no auxiliary
fuel to sustain it. The flue gases are generated in the combustion process through
burning of refuse. The furnace has four-flue gases passes. The mode of heat transfer to
the tubes in the first two passes is by radiation. The super heater tubes are installed after
the lower evaporator tubes in the third pass section before the flue gases are treated.
Figure 3.4.1, shows the actual location of the super heater tube in the furnace.
The incineration process uses abundant air for complete combustion. However, the
combustion process itself releases many pollutants in the form of dust and gaseous
pollutants such as Hydrochloride (HCl), Sodium dioxide (Sox) and dioxins, which
causes the boiler tubes inside the furnace to be corroded.
Figure 3.4.1: Location of the super heater tube in the furnace.
SECONDARY S H
+ LOWER EVAPORTOR
+ LOWERINLET
+17 HANGEOUTLET
3RD PASS REAR3RD PASS SIDE
HANGER
3RD PASS FRONT2ND PASSLOWER
+++++ FINAL S H
SECONDARYSECONDARYFINAL S H
PRIMARYPRIMARY
++
PRIMARY S H
SECONDARY S HSECOSUPER
PRIMSUPER
UPPERTU++ UPPERPRIMARY S H
LOWERTU
FINALTU
LOWERCONNECTIN
UPPEROUTLET
3rd PASS3rd PASSUPPER
3rd
3rd PASSUPPER
HANGER TUBE
STEAM
PRIMARYTU
FURNACE
3rdWALLFURNACE REAR
MANHOLEASH
ASH
FURNACELOWER
CLINKEHEA
CLINKERCHI
FURNACEWALL
FURNACE FRONT
2nd PASSUPPER
1st PASSUPPER
ECONOCONNEPIPE
3rd+
DOWNC
+++ 35
2nd
BUR
1st
+17 +17
+
+
+
+
+
+
+
FEEDER
54

3.5 Environment Condition at the Location of Super Heater Tube
The high temperature gases generated from the combustion of refuse are cooled down to
approximately 400oC to 470oC in passing through the wall tubes in the first two zones
before flowing across the lower evaporator tube in the bottom area of the third zone.
The combustion gases in the third zone then raises and goes through super heater tubes
area. Then the flue gas got into the economizer tube area through upper part of the third
zone before flow into the equipment in it downstream, EP and Fabric Filter. Base on the
data collected in the actual super heater tube located for one Week at difference operating
load, Figure 3.5.1 shows that the environment temperature in the third pass section of the
furnace is maintaining constantly at an average of 387oC, 437oC and 464oC.
Flue gas temperature at third zone
0
100
200
300
400
500
600
gas temp 1 gas temp 2 gas temp 3
Superheater area
Tem
pera
ture 90t/h
80t/h70t/h
Figure 3.5.1: Flue Gas Temperature at third pass section in the furnace
It can be seen that the environment temperature condition is much under the influence of
boiler operating load, which if boiler’s operating load much higher it causes reducing
atmosphere and minimum temperature at the tube. If these conditions do exists, the
hydrochloric acid will attack the tube metal. This is the main reason for tube metal
55

wastage by the corrosive action of gaseous hydrochloric acid, set free particularly when
burning PVC and other chlorinated plastics, as well as from heating sodium chloride and
other chlorides always abundantly present in household refuse. Research has also shown
that it would be desirable to limit boiler exit flue gas operating temperature at 6000C and
steam operating pressure not acceding design limit, taking into account the effects of the
respective saturated steam temperature of water-cooled evaporator tubes being a function
of the boiler operating temperature. Because these can maintain the boiler exit flue gas
operating temperature at desired limit and reduced corrosive attack on the tube.
In Hamm Plant in Dortmund, Germany, their superheater tubes had life spans of 10,000
to 12,000 hours because of the high flue gas temperature before the superheater of about
6500C leading to corrosion by Chlorine. The Plant then set the upper operating limit of
6000C for the exit flue gas temperature before the incinerator units are shut down for
cleaning. This frequent cleaning cycle of once every 4 to 6 months prevented the flue gas
temperature from reaching the upper limit of 6000c, thus extending the lifespan of the
superheater tubes to 20,000 hours.
There is also the possibility of the percentage of moisture content to be significantly
increased/decreased in the environment at the third zone section in the furnace depending
on how low/high the operating temperature is. Once the operating temperature is
decreased, which in turn increases the percentage of moisture content, the mixture molten
ash and moisture would rapidly increase the ‘Slag’ generated on the surface of the super
heater tube at the third pass section in the furnace (Refer to Figure 3.5.2).
Moreover, the formation of corrosion slag deposits is caused by the deposition of molten
ash on surfaces receiving heat by radiation such as the furnace and radiant sections of the
super heater. Entrained in the gas stream, molten ash particle strike the super heater tube
surfaces becoming chilled then solidify. (Refer to Figure 3.5.3).
This ‘Slag’ will follow the flue gases, which flow in an upward direction across the
superheater tube before flowing to the superheater tubes.
56
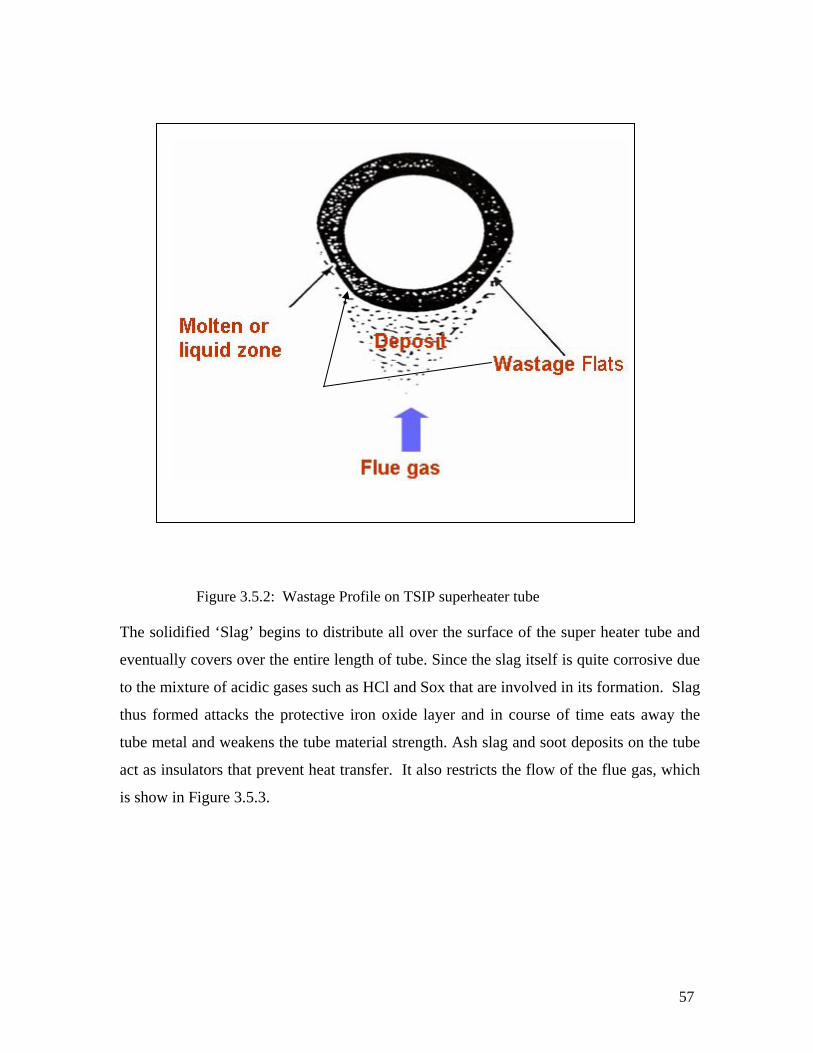
Figure 3.5.2: Wastage Profile on TSIP superheater tube The solidified ‘Slag’ begins to distribute all over the surface of the super heater tube and
eventually covers over the entire length of tube. Since the slag itself is quite corrosive due
to the mixture of acidic gases such as HCl and Sox that are involved in its formation. Slag
thus formed attacks the protective iron oxide layer and in course of time eats away the
tube metal and weakens the tube material strength. Ash slag and soot deposits on the tube
act as insulators that prevent heat transfer. It also restricts the flow of the flue gas, which
is show in Figure 3.5.3.
57

Bare Tube Ash Layer Thickness
Figure 3..5.3: Overview of slag accumulated on the tube surface
his slag would sign tly affect the properties of the tube in the boiler. The slag is
s can be appreciated for the description above, leakage and corrosion on the surface of
T ifican
thickened as times goes by, depending on the amount of flue gas passed through the
superheater tube in third zone of the furnace. When the ash layer builds to a particular
thickness, the film of liquid/moisture can no longer support the weight, the ash layer falls
off exposing the bare tube to the high temperature environment, and the local heat flux
jumps. This sudden rise in heat flux means a sudden rise in temperature and creates a
locally high stress. As the ash layer reforms, the insulating effects of the ash reduces the
metal temperature. Over several (or many) such cycles, corrosion-fatigue cracks form.
A
the super heater tube will eventually occur, which is shown in Figure 3.5.3B.
58
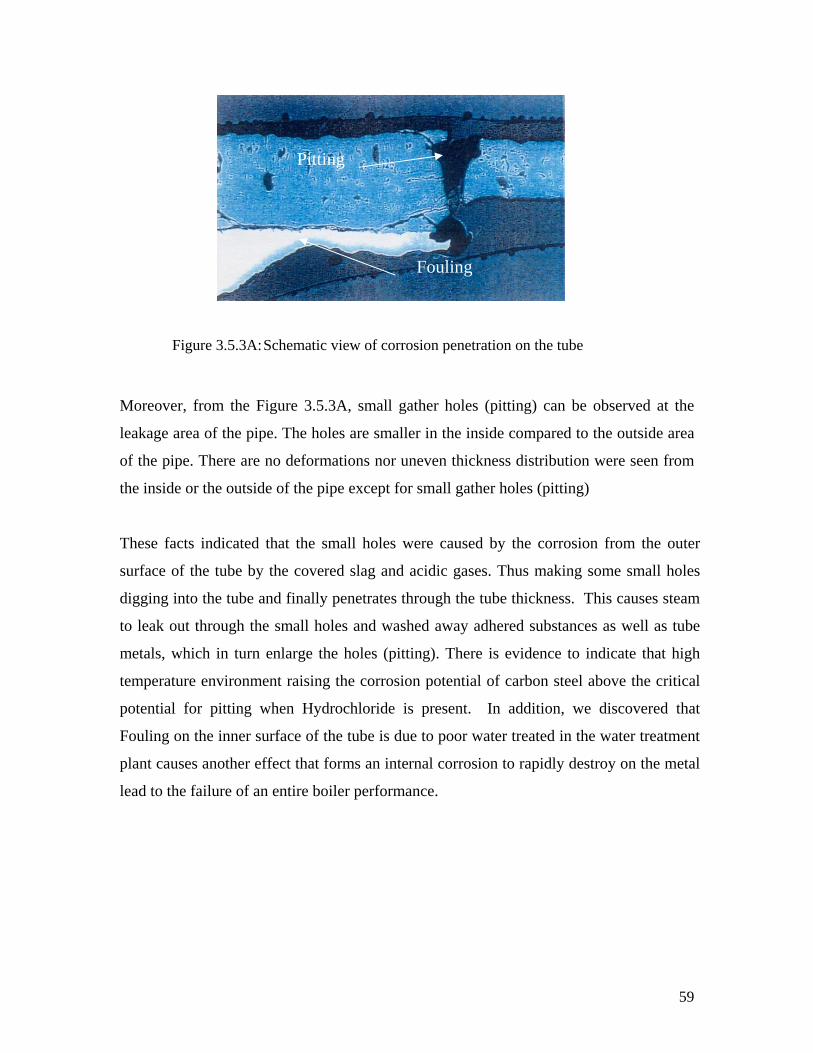
Pitting
Fouling
Figure 3.5.3A: Schematic view of corrosion penetration on the tube
Moreover, from the Figure 3.5.3A, small gather holes (pitting) can be observed at the
leakage area of the pipe. The holes are smaller in the inside compared to the outside area
of the pipe. There are no deformations nor uneven thickness distribution were seen from
the inside or the outside of the pipe except for small gather holes (pitting)
These facts indicated that the small holes were caused by the corrosion from the outer
surface of the tube by the covered slag and acidic gases. Thus making some small holes
digging into the tube and finally penetrates through the tube thickness. This causes steam
to leak out through the small holes and washed away adhered substances as well as tube
metals, which in turn enlarge the holes (pitting). There is evidence to indicate that high
temperature environment raising the corrosion potential of carbon steel above the critical
potential for pitting when Hydrochloride is present. In addition, we discovered that
Fouling on the inner surface of the tube is due to poor water treated in the water treatment
plant causes another effect that forms an internal corrosion to rapidly destroy on the metal
lead to the failure of an entire boiler performance.
Pitting
59
Fouling
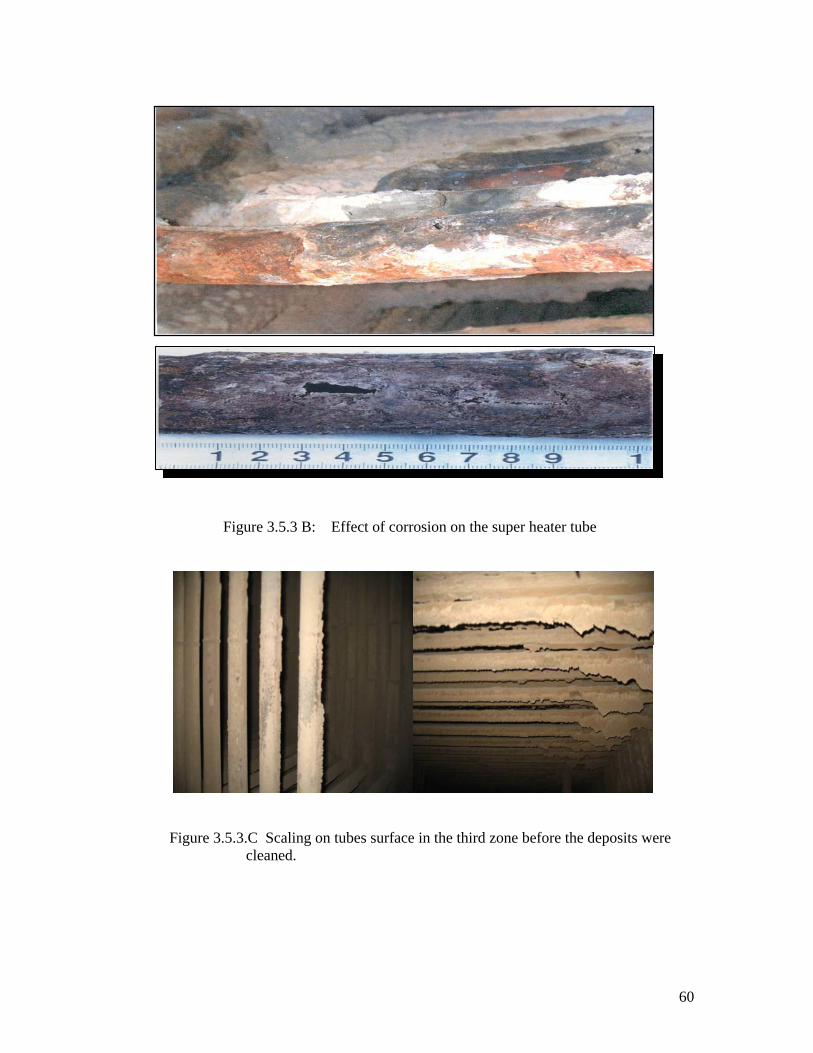
Figure 3.5.3 B: Effect of corrosion on the super heater tube
Figure 3.5.3.C Scaling on tubes surface in the third zone before the deposits were cleaned.
60
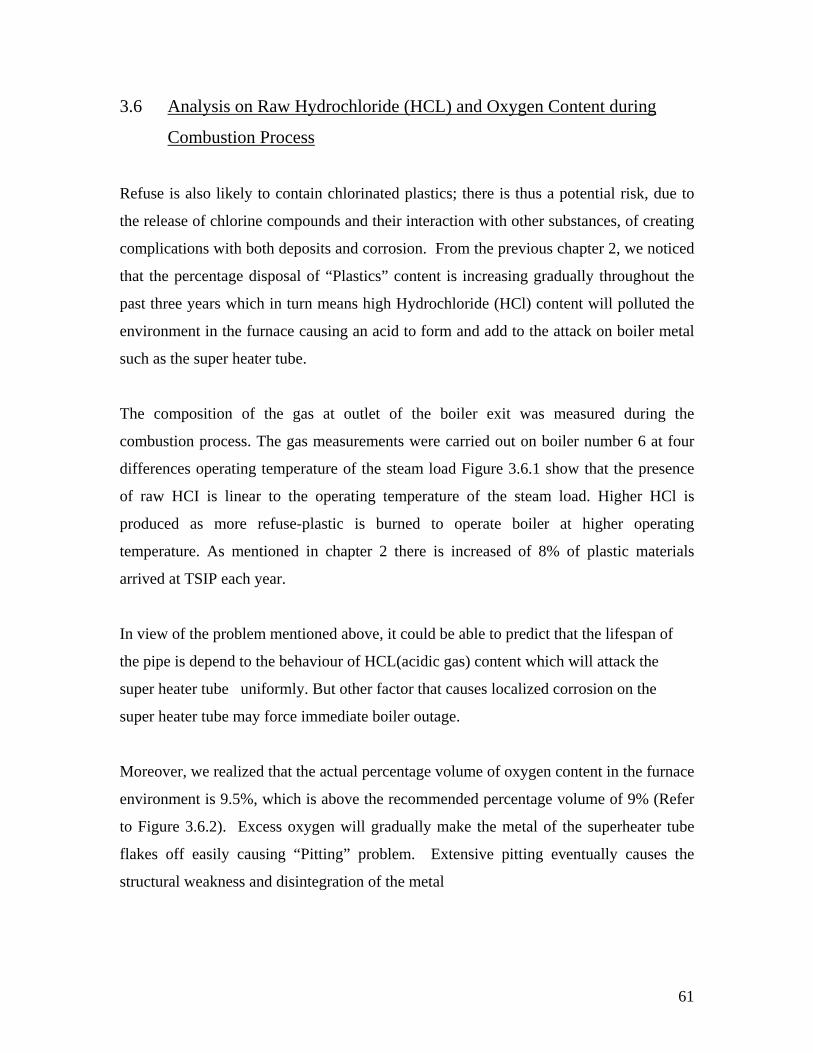
3.6 Analysis on Raw Hydrochloride (HCL) and Oxygen Content during
Combustion Process
Refuse is also likely to contain chlorinated plastics; there is thus a potential risk, due to
the release of chlorine compounds and their interaction with other substances, of creating
complications with both deposits and corrosion. From the previous chapter 2, we noticed
that the percentage disposal of “Plastics” content is increasing gradually throughout the
past three years which in turn means high Hydrochloride (HCl) content will polluted the
environment in the furnace causing an acid to form and add to the attack on boiler metal
such as the super heater tube.
The composition of the gas at outlet of the boiler exit was measured during the
combustion process. The gas measurements were carried out on boiler number 6 at four
differences operating temperature of the steam load Figure 3.6.1 show that the presence
of raw HCI is linear to the operating temperature of the steam load. Higher HCl is
produced as more refuse-plastic is burned to operate boiler at higher operating
temperature. As mentioned in chapter 2 there is increased of 8% of plastic materials
arrived at TSIP each year.
In view of the problem mentioned above, it could be able to predict that the lifespan of
the pipe is depend to the behaviour of HCL(acidic gas) content which will attack the
super heater tube uniformly. But other factor that causes localized corrosion on the
super heater tube may force immediate boiler outage.
Moreover, we realized that the actual percentage volume of oxygen content in the furnace
environment is 9.5%, which is above the recommended percentage volume of 9% (Refer
to Figure 3.6.2). Excess oxygen will gradually make the metal of the superheater tube
flakes off easily causing “Pitting” problem. Extensive pitting eventually causes the
structural weakness and disintegration of the metal
61

.
HCl mg/Nm3 reading at difference load
900
1000
1100
1200
85t/h 75t/h 70t/h 65t/h
Steam
mg/
Nm
3
Figure 3.6.1: HCl inside the furnace with respect to load.
Oxygen Content in the furnace
9.610.39.39.59.79.39.39.19.29.4
13.213.913.512.813.814.312.312.411.912.7
02468
10121416
1 2 3 4 5 6 7 8 9 10Period
Oxy
gen
Con
tent
(Vol
%)
Minimum Oxygen Content Maximum Oxygen ContnentRecommended Oxygen Content
Figure 3.6.2 : Oxygen Chart obtained from the furnace.
62

_________________________________________
Chapter 4 Experimental 4.1 Introduction 4.2 Experimental Procedures
4.2.1 Safety Aspect
4.2.2 Permit-To-Work Procedures
4.3 Analysis on Corrosion of the Test Specimens in the Superheater location
4.3.1 Observation
4.3.2 Analyzing the ash deposited at the Superheater tube
4.3.3 Tube metal temperature
4.3.4 Experiment
4.3.5 Studies of TSIP incinerator Fly Ash
4.4 Stress Calculation in the Superheater tube
4.4.1 Internal Pressure in the superheater tube obtained through experimental 4.4.2 Stress calculation
63

4.1 Introduction
Corrosion in any system depends upon two major factors – material used and
environmental conditions. Different materials may corrode at different rates in a given
environment. When corrosion takes place, the surface of the metal dissolves and a new
layer is exposed. Depending on a large number of conditions, the corrosion may be fairly
even over the whole surface (i.e. Uniform attacks) or it may be concentrated at some
points.
So the field test in high temperature environment of the TSIP boiler is part of this project
to study the caused of the boiler tube corrosion. This to evaluate the environmental
conditions in the boiler that produced by the incineration of refuse of the corrosion attack
on the present tube used and its experimental analysis results will focus on Slag Growth
Rate, Heat Transfer Rate and Metal Temperature of the super heater tube behavior for a
period of the test.
4.2 Experimental Procedures
These high temperature corrosion experiments will be conducted on a mild steel boiler
tube, ASME SA-192 steel cut from the original superheater tube, of nominal dimensions:
42.7 mm outer diameter by 11.35mm inner diameter. All samples of the tube were hand
sanded to remove a coating on the outside of the tube and to provide a uniform surface
finish. ‘ASTM G111’- Guide for Corrosion Tests in High Temperature are used as a
guild in this experimental.
The corrosion tests will be performed in a third-zone furnace with temperature range of
400ºC to 550ºC. The boiler will be burning a well mixed refuse in the bunker with
constant operating temperature. The third zone is simulation of the real environment to
conduct this high temperature corrosion test. Tests were conducted, where the gas and
specimens will be at approximately the same temperature. Unfortunately the specimens
64
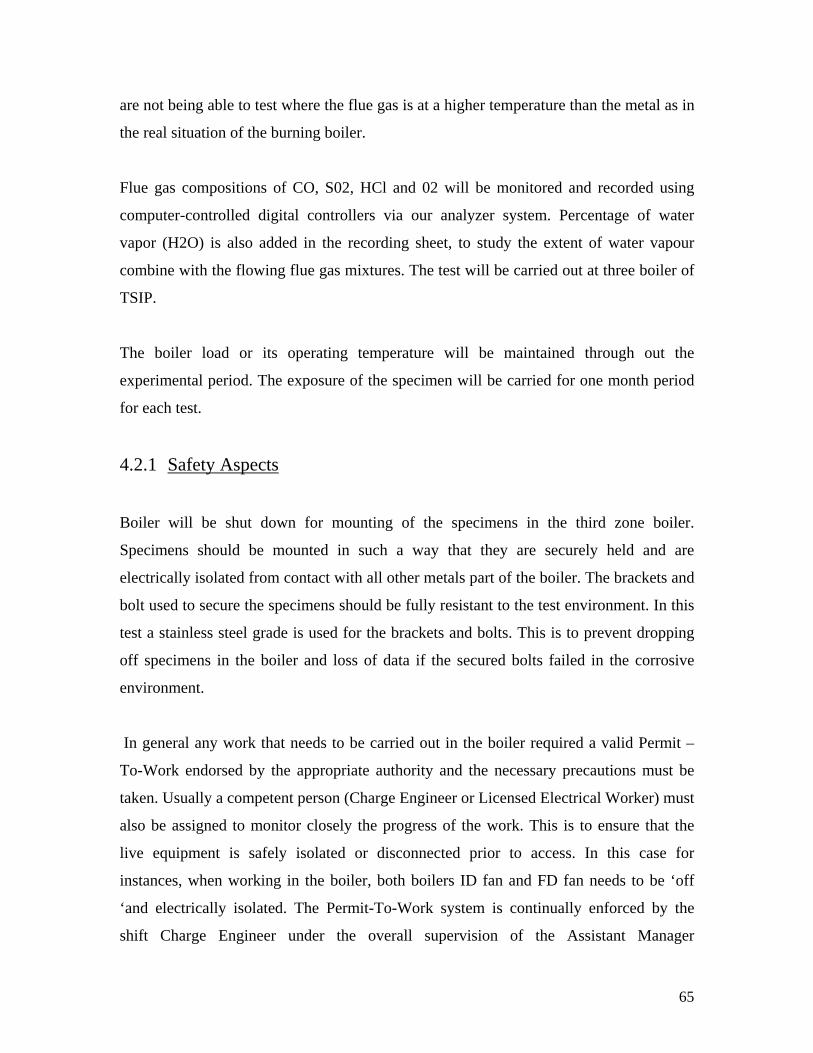
are not being able to test where the flue gas is at a higher temperature than the metal as in
the real situation of the burning boiler.
Flue gas compositions of CO, S02, HCl and 02 will be monitored and recorded using
computer-controlled digital controllers via our analyzer system. Percentage of water
vapor (H2O) is also added in the recording sheet, to study the extent of water vapour
combine with the flowing flue gas mixtures. The test will be carried out at three boiler of
TSIP.
The boiler load or its operating temperature will be maintained through out the
experimental period. The exposure of the specimen will be carried for one month period
for each test.
4.2.1 Safety Aspects
Boiler will be shut down for mounting of the specimens in the third zone boiler.
Specimens should be mounted in such a way that they are securely held and are
electrically isolated from contact with all other metals part of the boiler. The brackets and
bolt used to secure the specimens should be fully resistant to the test environment. In this
test a stainless steel grade is used for the brackets and bolts. This is to prevent dropping
off specimens in the boiler and loss of data if the secured bolts failed in the corrosive
environment.
In general any work that needs to be carried out in the boiler required a valid Permit –
To-Work endorsed by the appropriate authority and the necessary precautions must be
taken. Usually a competent person (Charge Engineer or Licensed Electrical Worker) must
also be assigned to monitor closely the progress of the work. This is to ensure that the
live equipment is safely isolated or disconnected prior to access. In this case for
instances, when working in the boiler, both boilers ID fan and FD fan needs to be ‘off
‘and electrically isolated. The Permit-To-Work system is continually enforced by the
shift Charge Engineer under the overall supervision of the Assistant Manager
65
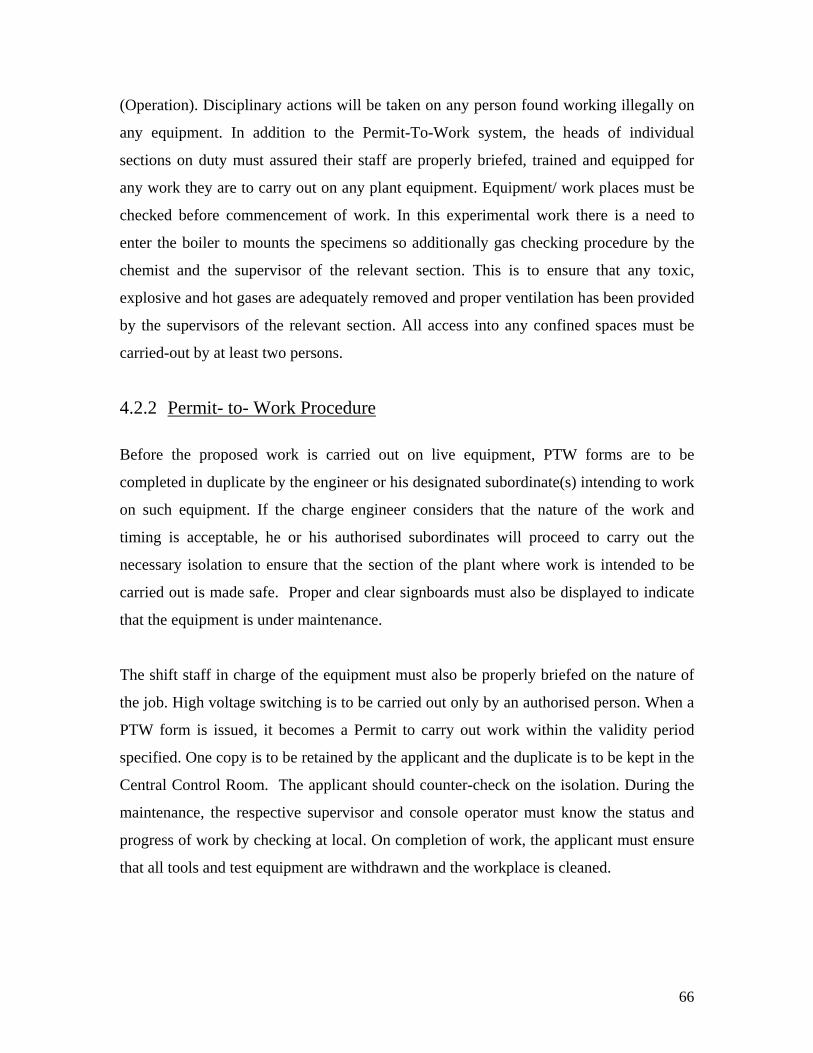
(Operation). Disciplinary actions will be taken on any person found working illegally on
any equipment. In addition to the Permit-To-Work system, the heads of individual
sections on duty must assured their staff are properly briefed, trained and equipped for
any work they are to carry out on any plant equipment. Equipment/ work places must be
checked before commencement of work. In this experimental work there is a need to
enter the boiler to mounts the specimens so additionally gas checking procedure by the
chemist and the supervisor of the relevant section. This is to ensure that any toxic,
explosive and hot gases are adequately removed and proper ventilation has been provided
by the supervisors of the relevant section. All access into any confined spaces must be
carried-out by at least two persons.
4.2.2 Permit- to- Work Procedure
Before the proposed work is carried out on live equipment, PTW forms are to be
completed in duplicate by the engineer or his designated subordinate(s) intending to work
on such equipment. If the charge engineer considers that the nature of the work and
timing is acceptable, he or his authorised subordinates will proceed to carry out the
necessary isolation to ensure that the section of the plant where work is intended to be
carried out is made safe. Proper and clear signboards must also be displayed to indicate
that the equipment is under maintenance.
The shift staff in charge of the equipment must also be properly briefed on the nature of
the job. High voltage switching is to be carried out only by an authorised person. When a
PTW form is issued, it becomes a Permit to carry out work within the validity period
specified. One copy is to be retained by the applicant and the duplicate is to be kept in the
Central Control Room. The applicant should counter-check on the isolation. During the
maintenance, the respective supervisor and console operator must know the status and
progress of work by checking at local. On completion of work, the applicant must ensure
that all tools and test equipment are withdrawn and the workplace is cleaned.
66
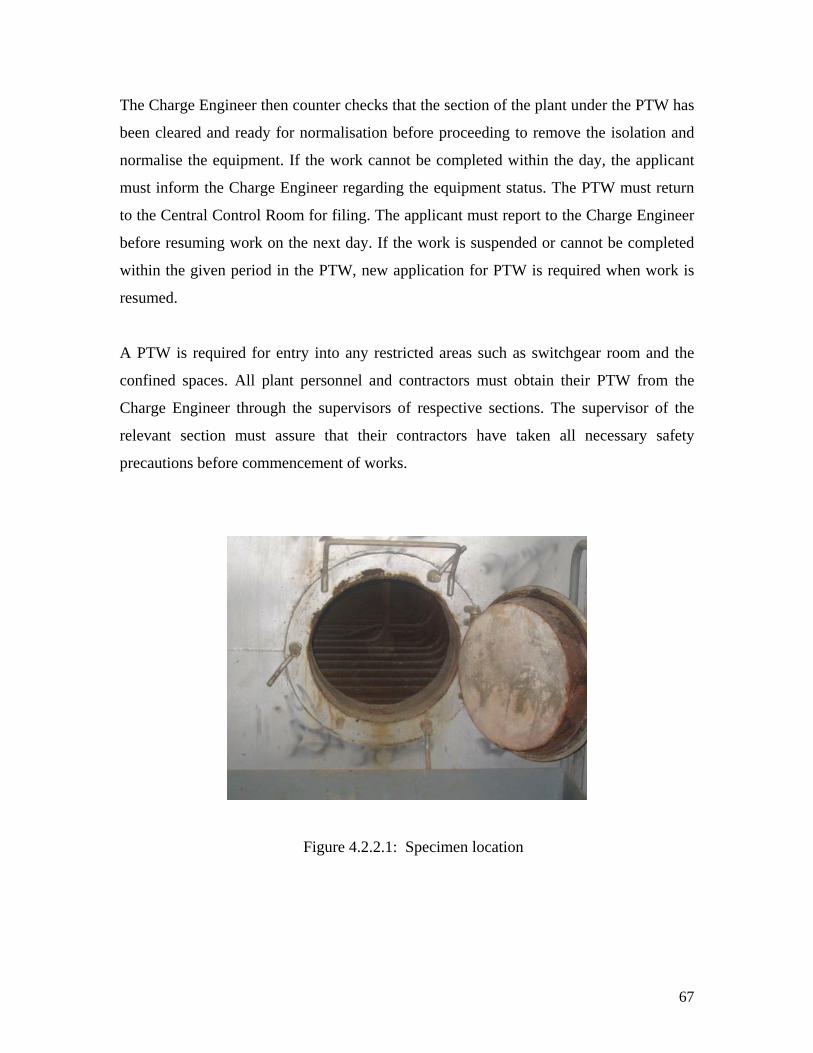
The Charge Engineer then counter checks that the section of the plant under the PTW has
been cleared and ready for normalisation before proceeding to remove the isolation and
normalise the equipment. If the work cannot be completed within the day, the applicant
must inform the Charge Engineer regarding the equipment status. The PTW must return
to the Central Control Room for filing. The applicant must report to the Charge Engineer
before resuming work on the next day. If the work is suspended or cannot be completed
within the given period in the PTW, new application for PTW is required when work is
resumed.
A PTW is required for entry into any restricted areas such as switchgear room and the
confined spaces. All plant personnel and contractors must obtain their PTW from the
Charge Engineer through the supervisors of respective sections. The supervisor of the
relevant section must assure that their contractors have taken all necessary safety
precautions before commencement of works.
Figure 4.2.2.1: Specimen location
67

4.3 Analysis on Corrosion of the Test Specimens in the Superheater location
4.3.1 Observation
During the operation of boilers, the variation of flue gas composition attributed by the
variation in composition of refuse supplied causes the percentage content of HCl to be
inconsistent in the environment inside the furnace. One of the problems with heat recovery
boilers behind incinerators of solid, liquid or municipal solid wastes is “High Temperature
Corrosion” associated with the formation of complex eutectics which have a low melting
point and deposit as slag on superheater tube surfaces. This is difficult to get rid of and
results in high temperature corrosion, fouling problems and consequent higher exit gas
temperature from the boiler and lower steam generation. Another concern in these
applications is the presence of corrosive gases such as chlorine and hydrogen chloride,
which corrode the boiler tubes, particularly those operating above metal temperature of
371oC, resulting in tube thinning and failure. Chlorine attacks steel even at 230oC to
330oC. In addition, several non-ferrous salts are formed with chlorine, which also have
very low melting points. These also deposit on low temperature surfaces such as
superheater tubes and corrode them.
With the combination of moisture (including excess air) and HCl in the flue gas flow
across the superheater tube, the surface of the superheater tube would then be corroded.
The thickness of corrosion deposits on the surface of the superheater tube increases
gradually with respect to time.
4.3.2 Analyzing the ash deposited at the Superheater tube
The steam generated in the boiler is wet saturated steam and contain some moisture. This
moisture is vaporized and further heat to produce dry saturated steam. The superheater is
the equipment that such dry saturated steam is formed. The superheater is mounted at the
third pass, where steam is super heated is formed. As accumulation of the ash deposited
at the tube increased the flue gas and steam operating temperature after hours of
68

operating. The boiler then needs to be shut down for tube cleaning.
Experimental analysis was carried out to find the effect condition of ash deposited at the
superheater tube. Figure 4.3.2.1: shown the third pass gas temperature at three difference
points before the tube is cleaned.
Figure 4.3.2.2 : shown the third pass gas temperature at the three difference points after
the tube is cleaned.
Gas Temperature before tube is cleaned
0
100
200
300
400
500
600
1 2 3 4 5 6 7 8 9 10 11 12 13 14 15 16 17 18 19 20 21 22 23 24
hour
tem
pera
ture
Oc
Steam t/h Gas temp1 Gas temp2 Gas temp3
Figure 4.3.2.1 : Temperature of the flue gas taken before boiler was shutdown
69
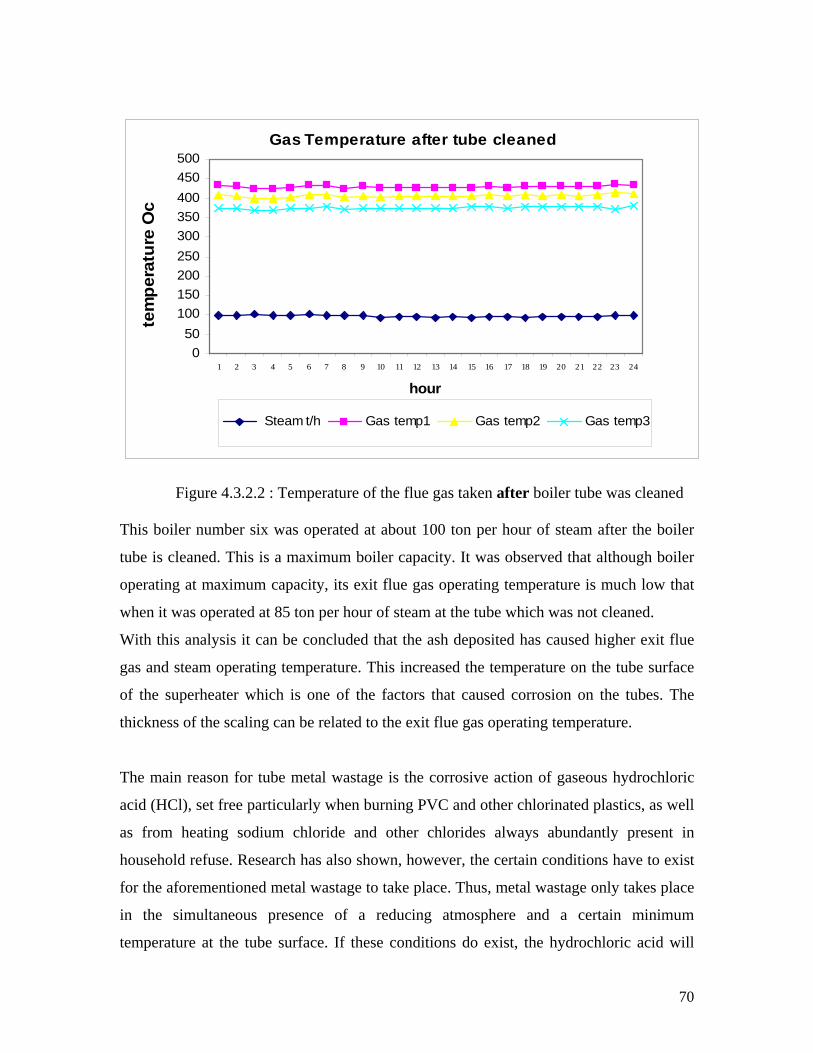
Gas Temperature after tube cleaned
050
100150200250300350400450500
1 2 3 4 5 6 7 8 9 10 11 12 13 14 15 16 17 18 19 20 21 22 23 24
hour
tem
pera
ture
Oc
Steam t/h Gas temp1 Gas temp2 Gas temp3
Figure 4.3.2.2 : Temperature of the flue gas taken after boiler tube was cleaned This boiler number six was operated at about 100 ton per hour of steam after the boiler
tube is cleaned. This is a maximum boiler capacity. It was observed that although boiler
operating at maximum capacity, its exit flue gas operating temperature is much low that
when it was operated at 85 ton per hour of steam at the tube which was not cleaned.
With this analysis it can be concluded that the ash deposited has caused higher exit flue
gas and steam operating temperature. This increased the temperature on the tube surface
of the superheater which is one of the factors that caused corrosion on the tubes. The
thickness of the scaling can be related to the exit flue gas operating temperature.
The main reason for tube metal wastage is the corrosive action of gaseous hydrochloric
acid (HCl), set free particularly when burning PVC and other chlorinated plastics, as well
as from heating sodium chloride and other chlorides always abundantly present in
household refuse. Research has also shown, however, the certain conditions have to exist
for the aforementioned metal wastage to take place. Thus, metal wastage only takes place
in the simultaneous presence of a reducing atmosphere and a certain minimum
temperature at the tube surface. If these conditions do exist, the hydrochloric acid will
70

attack the tube metal. Figure 4.3.2.3 shows the increasing temperature of the metal
surface for a period of six months. Both steam and flue gas temperature remained
constant at same steam load after this period. This analysis confirmed that deposits layer
build at the surface of cleaned tube reached its average maximum thickness after six
months after in operation. Figure 4.3.2.4 and 4.3.2.5 shown the analysis of deposits
growth of the tube surface.
Tube surface temperature
0
100
200
300
400
500
600
Aug-04 Sep-04 Oct-04 Nov-04 Dec-04 Jan-05 Feb-05
Month
Tem
pera
ture
Steam load Steam temperature gas temperature
Figure 4.3.2.3 : The increased of the tube metal temperature based on both its gas
and steam temperature.
71

Flue gas temperature at third zone #B6
0
100
200
300
400
500
600
Feb-04
Mar-04
Apr-04
May-04
Jun-04
Jul-04
Aug-04
Sep-04
Oct-04
Nov-04
Dec-04
Jan-05
Feb-05
Mar-05
Apr-05
Month
tem
pera
ture
oC
Steam gas1 gas2 gas3
Shut down for tube cleaning
Shut down for tube cleaning
deposits thicknes
20mm
0mm
Figure 4.3.2.4: Deposit growth of boiler #6 tubes
Flue gas temperature at third zone
0
100
200
300
400
500
600
Aug-04
Sep-04
Oct-04
Nov-04
Dec-04
Jan-05
Feb-05
Mar-05
Apr-05
May-05
Jun-05
Jul-05
Aug-05
Sep-05
Oct-05
Month
Tem
pera
ture
oC
Steam gas1 gas2 gas3
Boiler shut down for tube cleaning
20mm
0mm
deposits thickness
Figure 4.3.2.5: Deposit growth of boiler #3 tubes
72
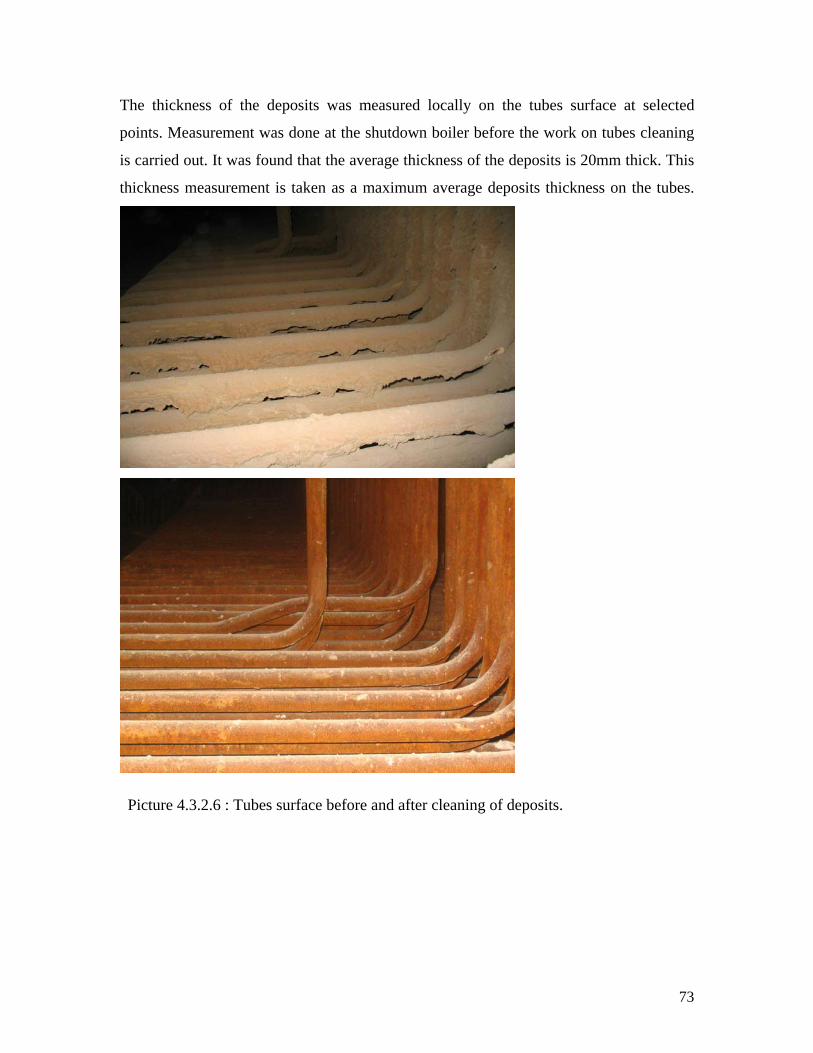
The thickness of the deposits was measured locally on the tubes surface at selected
points. Measurement was done at the shutdown boiler before the work on tubes cleaning
is carried out. It was found that the average thickness of the deposits is 20mm thick. This
thickness measurement is taken as a maximum average deposits thickness on the tubes.
Picture 4.3.2.6 : Tubes surface before and after cleaning of deposits.
73

4.3.3 Tube metal temperature Tube metal temperatures of the superheater vary throughout the year after the tubes were
cleaned. Highly sophisticated techniques of analysis and much experience go into
predicting what these temperatures will be; these temperatures rarely turn out exactly as
predicted, due to all the variables involved. So these analyze is done to predict that ash
deposits build at the tube influence the increased metal temperature.
The amount of literature on ash deposits related issues is immense. In any heat transfer
activities its effectiveness depends on surface absorptivity (R. P. Gupta et al –ref 1). The
deposits on the tube have a significant influence on the heat transfer rate. As shown in
figure 4.3.3.1 when boiler with maximum deposits on its superheater tubes it needed
higher gas and steam temperature to produce a same load compared to a cleaned tubes.
This is also increasing the metal temperature of the tube. Metal temperature for boiler #2
tube is higher as it gas temperature2 at point 3 is 557oC and steam temperature2 is 384oC.
While at same boiler load of steam 65 ton per hour metal temperature for boiler #6 is at
gas temperature6 of 403oC and steam temperature6 of 344oC. It is at lower range
compared to boiler #2. It is also shown in figure D that boiler #2 which is due for tube
cleaning produced a flue gas temperature2 of above 600oC when steam load is increased
to 85 ton per hour. Under TSIP boiler operating design inlet flue gas to superheater at
600oC and above may increase corrosion rate. Steam load of 85 ton per hour is well
below maximum load of 100 ton per hour.
74
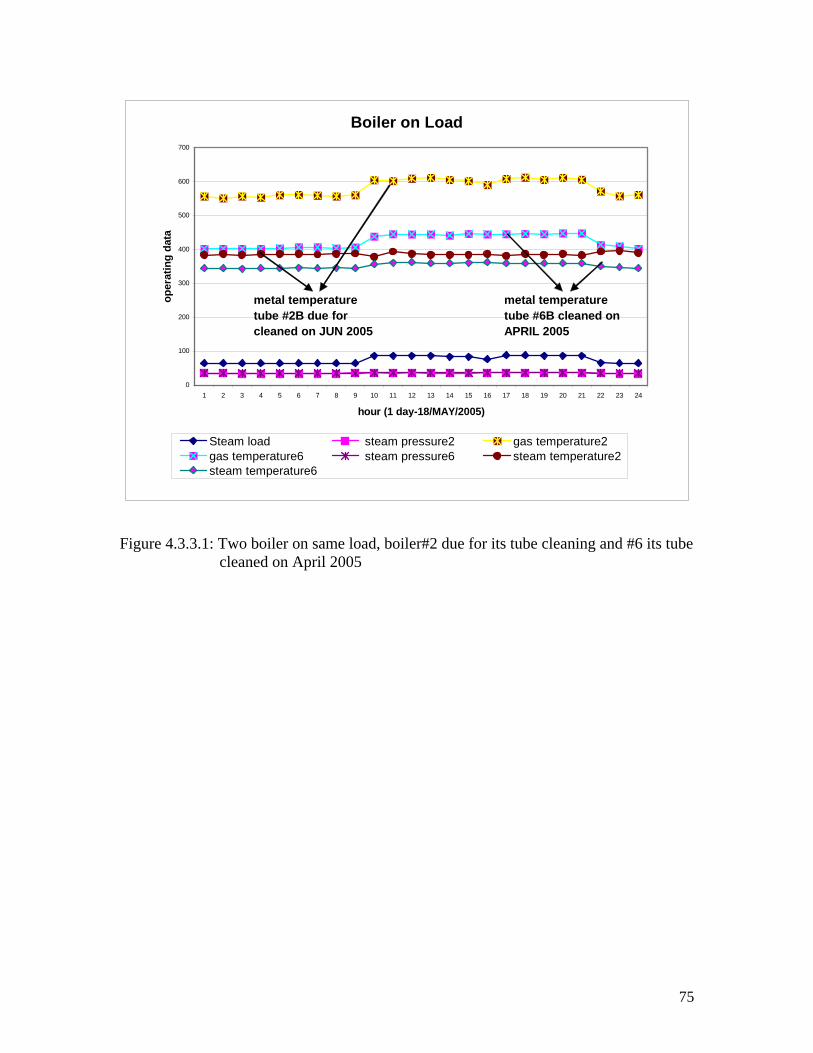
Boiler on Load
0
100
200
300
400
500
600
700
1 2 3 4 5 6 7 8 9 10 11 12 13 14 15 16 17 18 19 20 21 22 23 24
hour (1 day-18/MAY/2005)
oper
atin
g da
ta
Steam load steam pressure2 gas temperature2gas temperature6 steam pressure6 steam temperature2steam temperature6
metal temperature tube #6B cleaned on APRIL 2005
metal temperature tube #2B due for cleaned on JUN 2005
Figure 4.3.3.1: Two boiler on same load, boiler#2 due for its tube cleaning and #6 its tube cleaned on April 2005
75
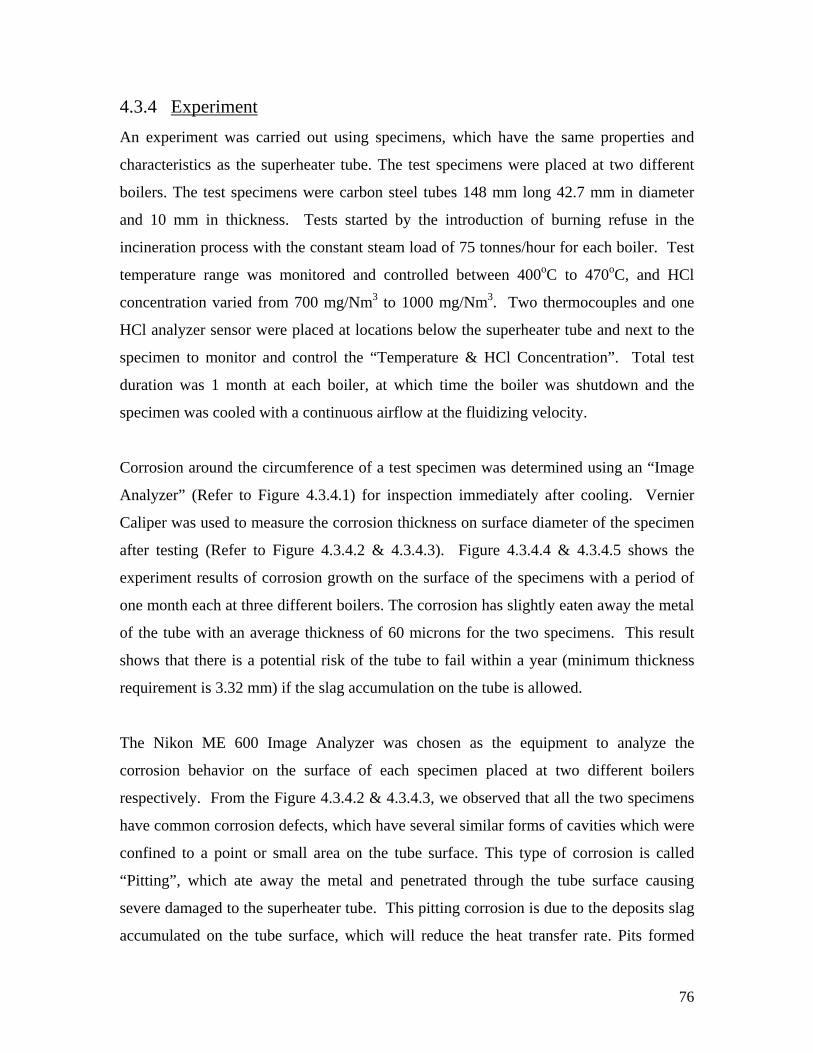
4.3.4 Experiment An experiment was carried out using specimens, which have the same properties and
characteristics as the superheater tube. The test specimens were placed at two different
boilers. The test specimens were carbon steel tubes 148 mm long 42.7 mm in diameter
and 10 mm in thickness. Tests started by the introduction of burning refuse in the
incineration process with the constant steam load of 75 tonnes/hour for each boiler. Test
temperature range was monitored and controlled between 400oC to 470oC, and HCl
concentration varied from 700 mg/Nm3 to 1000 mg/Nm3. Two thermocouples and one
HCl analyzer sensor were placed at locations below the superheater tube and next to the
specimen to monitor and control the “Temperature & HCl Concentration”. Total test
duration was 1 month at each boiler, at which time the boiler was shutdown and the
specimen was cooled with a continuous airflow at the fluidizing velocity.
Corrosion around the circumference of a test specimen was determined using an “Image
Analyzer” (Refer to Figure 4.3.4.1) for inspection immediately after cooling. Vernier
Caliper was used to measure the corrosion thickness on surface diameter of the specimen
after testing (Refer to Figure 4.3.4.2 & 4.3.4.3). Figure 4.3.4.4 & 4.3.4.5 shows the
experiment results of corrosion growth on the surface of the specimens with a period of
one month each at three different boilers. The corrosion has slightly eaten away the metal
of the tube with an average thickness of 60 microns for the two specimens. This result
shows that there is a potential risk of the tube to fail within a year (minimum thickness
requirement is 3.32 mm) if the slag accumulation on the tube is allowed.
The Nikon ME 600 Image Analyzer was chosen as the equipment to analyze the
corrosion behavior on the surface of each specimen placed at two different boilers
respectively. From the Figure 4.3.4.2 & 4.3.4.3, we observed that all the two specimens
have common corrosion defects, which have several similar forms of cavities which were
confined to a point or small area on the tube surface. This type of corrosion is called
“Pitting”, which ate away the metal and penetrated through the tube surface causing
severe damaged to the superheater tube. This pitting corrosion is due to the deposits slag
accumulated on the tube surface, which will reduce the heat transfer rate. Pits formed
76
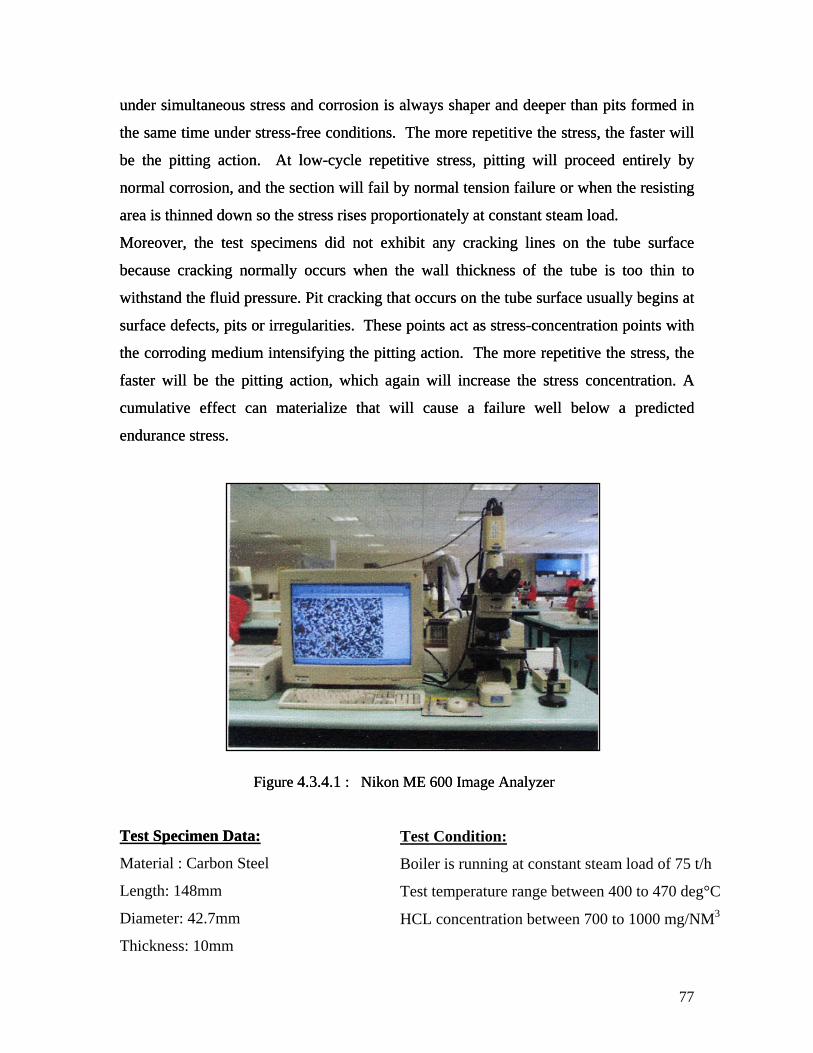
under simultaneous stress and corrosion is always shaper and deeper than pits formed in
the same time under stress-free conditions. The more repetitive the stress, the faster will
be the pitting action. At low-cycle repetitive stress, pitting will proceed entirely by
normal corrosion, and the section will fail by normal tension failure or when the resisting
area is thinned down so the stress rises proportionately at constant steam load.
Moreover, the test specimens did not exhibit any cracking lines on the tube surface
because cracking normally occurs when the wall thickness of the tube is too thin to
withstand the fluid pressure. Pit cracking that occurs on the tube surface usually begins at
surface defects, pits or irregularities. These points act as stress-concentration points with
the corroding medium intensifying the pitting action. The more repetitive the stress, the
faster will be the pitting action, which again will increase the stress concentration. A
cumulative effect can materialize that will cause a failure well below a predicted
endurance stress.
Figure 4.3.4.1 : Nikon ME 600 Image Analyzer Figure 4.3.4.1 : Nikon ME 600 Image Analyzer
Test Specimen Data:Test Specimen Data: Test Condition:
Material : Carbon Steel Boiler is running at constant steam load of 75 t/h
Length: 148mm Test temperature range between 400 to 470 deg°C
HCL concentration between 700 to 1000 mg/NM3Diameter: 42.7mm
Thickness: 10mm
77
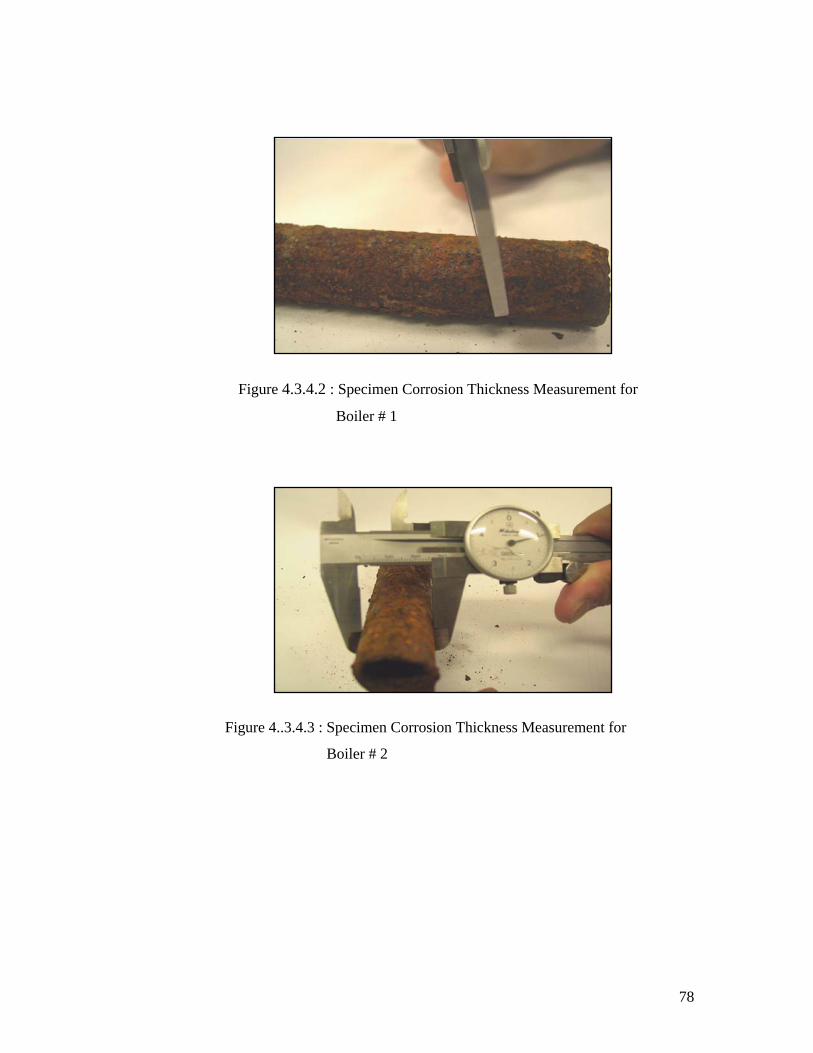
Figure 4.3.4.2 : Specimen Corrosion Thickness Measurement for
Boiler # 1
Figure 4..3.4.3 : Specimen Corrosion Thickness Measurement for
Boiler # 2
78
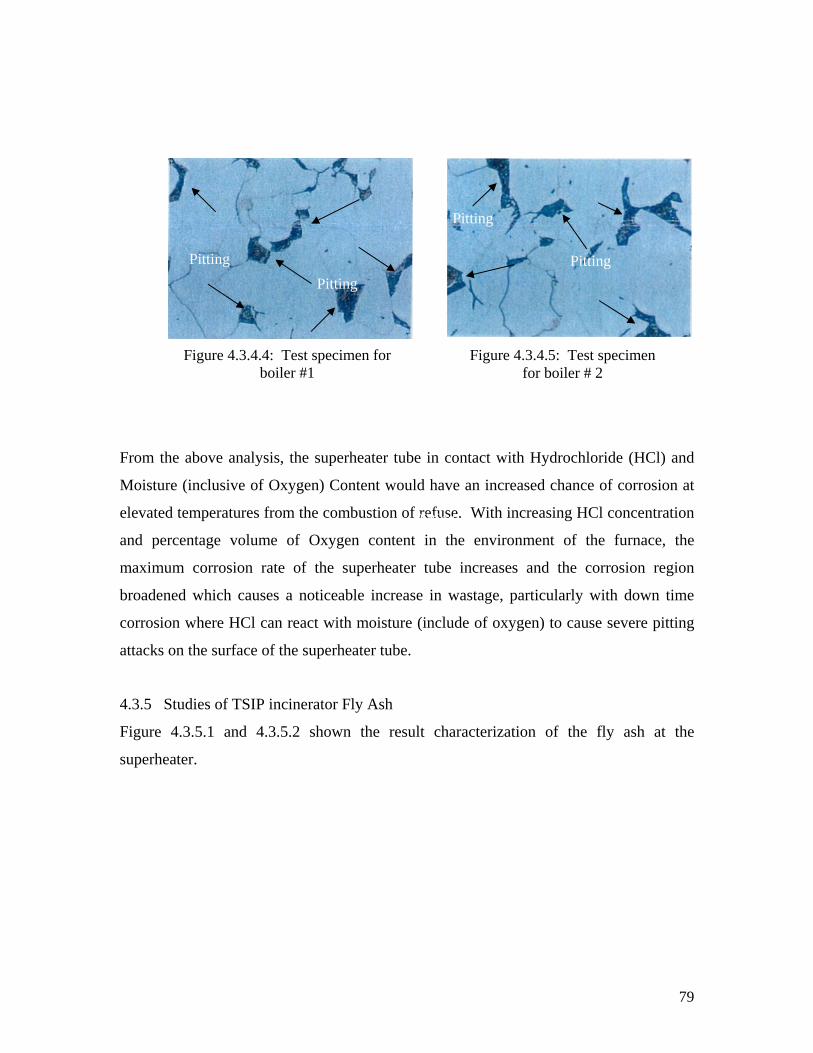
Pitting
Pitting
Figure 4.3.4.5: Test specimen for boiler # 2
Pitting Pitting
Figure 4.3.4.4: Test specimen for boiler #1
From the above analysis, the superheater tube in contact with Hydrochloride (HCl) and
Moisture (inclusive of Oxygen) Content would have an increased chance of corrosion at
elevated temperatures from the combustion of refuse. With increasing HCl concentration
and percentage volume of Oxygen content in the environment of the furnace, the
maximum corrosion rate of the superheater tube increases and the corrosion region
broadened which causes a noticeable increase in wastage, particularly with down time
corrosion where HCl can react with moisture (include of oxygen) to cause severe pitting
attacks on the surface of the superheater tube.
Pitting
4.3.5 Studies of TSIP incinerator Fly Ash
Figure 4.3.5.1 and 4.3.5.2 shown the result characterization of the fly ash at the
superheater.
79
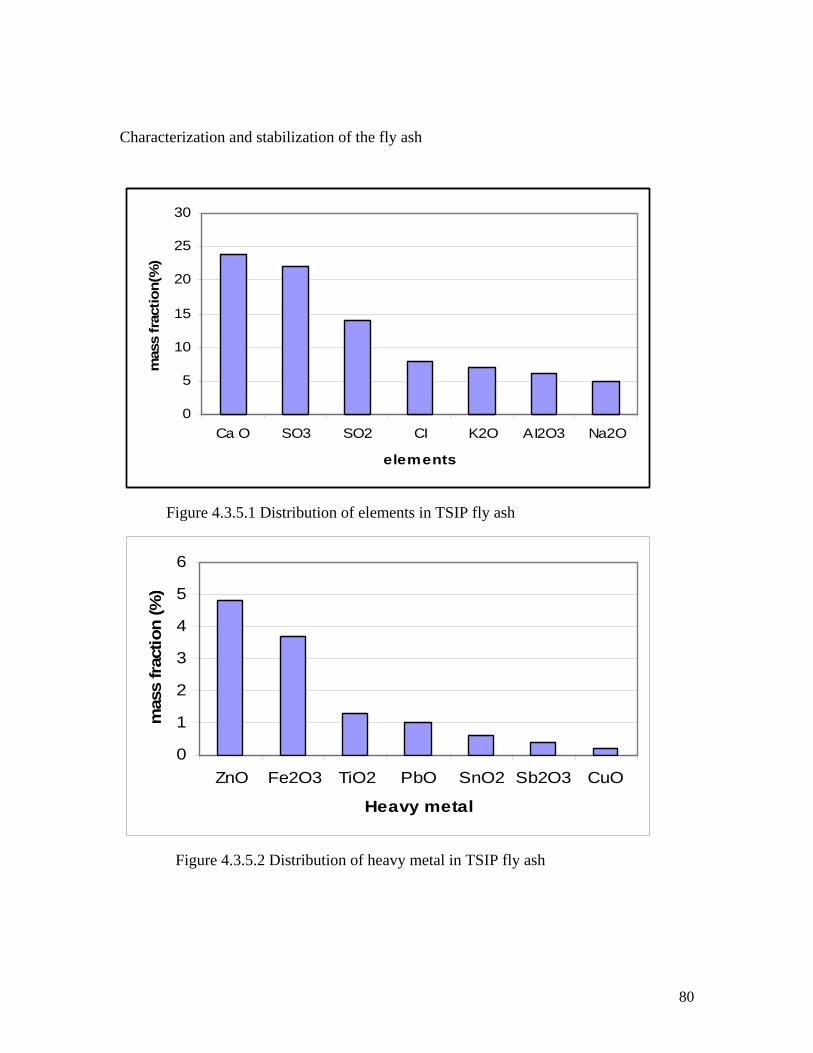
Characterization and stabilization of the fly ash
0
5
10
15
20
25
30
Ca O SO3 SO2 CI K2O AI2O3 Na2O
elements
mas
s fr
actio
n(%
)
Figure 4.3.5.1 Distribution of elements in TSIP fly ash
0
1
2
3
4
5
6
ZnO Fe2O3 TiO2 PbO SnO2 Sb2O3 CuO
Heavy metal
mas
s fr
actio
n (%
)
Figure 4.3.5.2 Distribution of heavy metal in TSIP fly ash
80

4.4 Stress Calculation in the Superheater tube Based on design data of TSIP boilers its superheater tube maximum internal pressure is at
45 bars. Its maximum steam temperature in the superheater shall be less that 400oC. The
average maximum steam temperature taken for 24 hours after boiler was in running for
12 month is 385oC. Its actual steam temperature is below the design steam temperature
limit.
4.4.1 Internal Pressure in the superheater tube obtained through
experimental The first loading for a superheater tube that is important in considering its strength is that
of internal pressure. Figure 5.1.1 shows that internal pressure of the superheater tube,
which has been taken for the period of a one day to determine the actual internal pressure
for ease in calculating the stress in superheater tube. The boiler was later shutdown for
tube cleaning.
Operating pressure100
90
70 temp/pressure 80
60
Figure 4.1.2: Maximum and Minimum internal pressure in the superheater pipe
0 10 20 30 40 50
1 2 3 4 5 6 7 8 9 10 11 12 13 14 15 16 17 18 19 20 21 22 23 24Hour (1 day)
Steam load steam pressure2
37.55 (maximum) 34.8 (minimum )
81
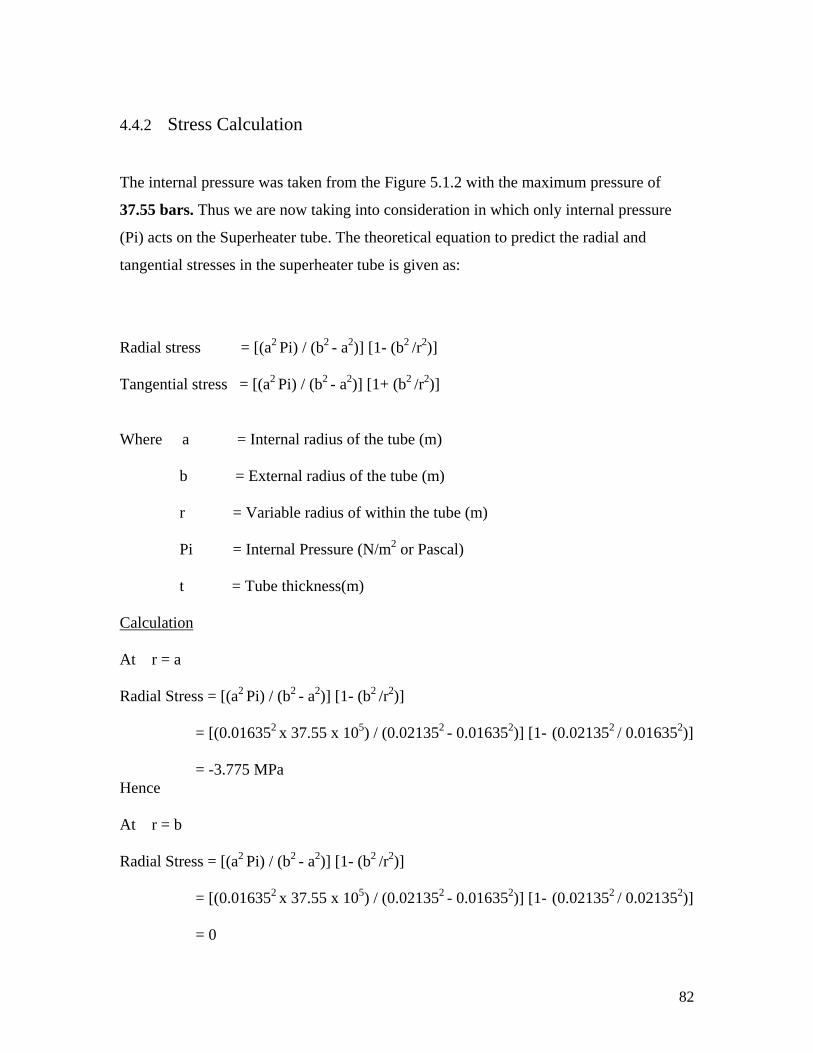
4.4.2 Stress Calculation
The internal pressure was taken from the Figure 5.1.2 with the maximum pressure of
37.55 bars. Thus we are now taking into consideration in which only internal pressure
(Pi) acts on the Superheater tube. The theoretical equation to predict the radial and
tangential stresses in the superheater tube is given as:
Radial stress = [(a2 Pi) / (b2 - a2)] [1- (b2 /r2)] Tangential stress = [(a2 Pi) / (b2 - a2)] [1+ (b2 /r2)] Where a = Internal radius of the tube (m) b = External radius of the tube (m) r = Variable radius of within the tube (m) Pi = Internal Pressure (N/m2 or Pascal) t = Tube thickness(m) Calculation At r = a Radial Stress = [(a2 Pi) / (b2 - a2)] [1- (b2 /r2)] = [(0.016352 x 37.55 x 105) / (0.021352 - 0.016352)] [1- (0.021352 / 0.016352)] = -3.775 MPa Hence At r = b Radial Stress = [(a2 Pi) / (b2 - a2)] [1- (b2 /r2)] = [(0.016352 x 37.55 x 105) / (0.021352 - 0.016352)] [1- (0.021352 / 0.021352)] = 0
82
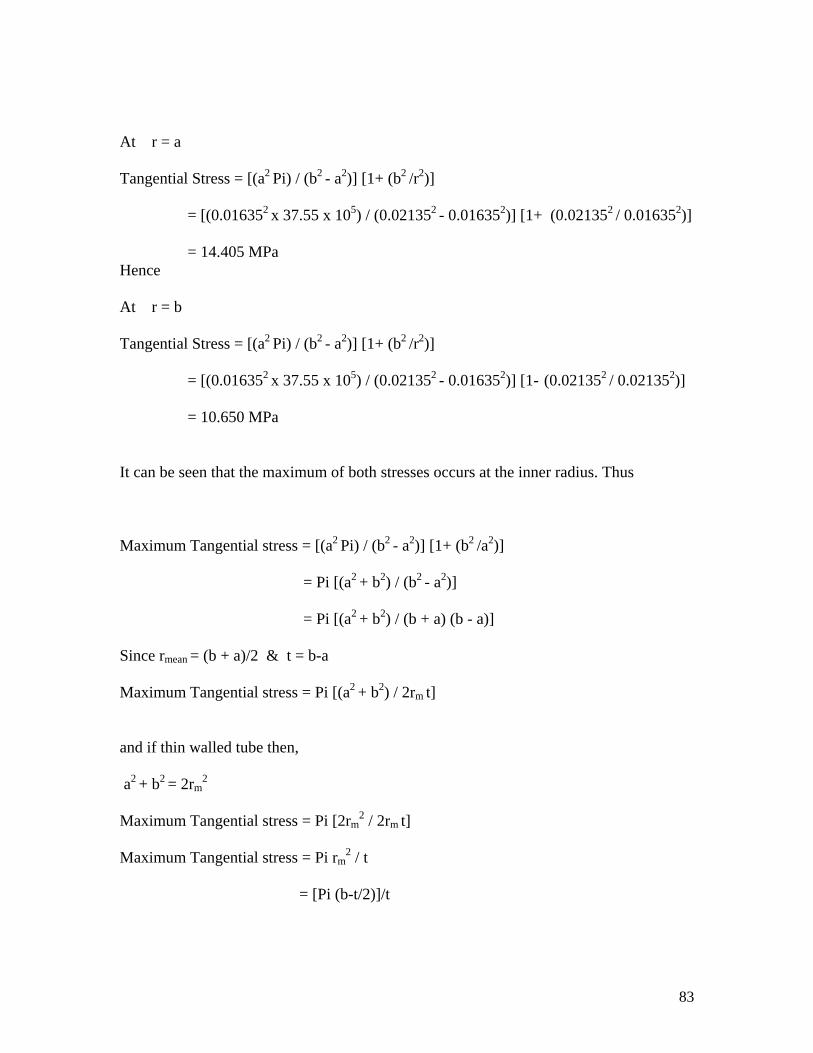
At r = a Tangential Stress = [(a2 Pi) / (b2 - a2)] [1+ (b2 /r2)] = [(0.016352 x 37.55 x 105) / (0.021352 - 0.016352)] [1+ (0.021352 / 0.016352)] = 14.405 MPa Hence At r = b Tangential Stress = [(a2 Pi) / (b2 - a2)] [1+ (b2 /r2)] = [(0.016352 x 37.55 x 105) / (0.021352 - 0.016352)] [1- (0.021352 / 0.021352)] = 10.650 MPa It can be seen that the maximum of both stresses occurs at the inner radius. Thus Maximum Tangential stress = [(a2 Pi) / (b2 - a2)] [1+ (b2 /a2)] = Pi [(a2 + b2) / (b2 - a2)] = Pi [(a2 + b2) / (b + a) (b - a)] Since rmean = (b + a)/2 & t = b-a Maximum Tangential stress = Pi [(a2 + b2) / 2rm
t] and if thin walled tube then, a2 + b2 = 2rm
2
Maximum Tangential stress = Pi [2rm
2 / 2rm t]
Maximum Tangential stress = Pi rm
2 / t = [Pi (b-t/2)]/t
83
Hence, t*(Maximum Tangential stress) = Pi b – Pi (1/2) t*[Maximum Tangential stress + Pi (1/2)] = Pi b if we multiplying both sides by 2, then t*(2 *Maximum Tangential stress + Pi)= Pi(2b) where 2b=Doutside
t = [(Pi Do) (2 Maximum Tangential stress + Pi)]
It can be observed that Radial stress always is a compressive and Tangential stress always
is a tensile stress.
84

_______________________________________ Chapter 5 Material Selection 5.1 Introduction 5.2 Comparison of Properties
5.2.1 Selection of Materials
5.2.2 Service Requirements of a material 5.3 The Incumbent – Carbon Steel 5.4 Alternative Metals
5.4.1 Nickel-chromium Steel 5.4.2 Nickel-chromium-molybdenum Steel
5.5 The Next Step
85
5.1 Introduction The Superheater is a component of a series of inter-connected tubes, which carry water
and steam around the boiler. The steam transfers heat away from the flue gas before the
latter undergoes treatment for removal of particles and harmful gases. The main purpose
of the Superheater is therefore to cool down the flue gas. In order to achieve this, it has to
be made of a material that allows quick exchange of heat from the flue gas to the steam.
This material is found in carbon steel, which is that used in many modern incinerators
such as TSIP.
However, any consideration in material selection must also factor in other relevant
properties that could affect the performance of the Superheater, such as structural
integrity, corrosion resistance, ease of maintenance, and finally cost. This chapter
explores other materials which could function as well as carbon steel in heat transfer
property but differs in other properties as described. Cost analysis will be carried out in
the following chapter.
5.2 Comparison of Properties
5.2.1 Selection of Materials
In choosing a material for a specific application certain criteria need to be considered:
a) The ability of the material to withstand service conditions
b) The method(s) by which it will be shaped
c) The overall cost and in some cases the availability of the material
In some cases, a number of materials may be satisfactory in respect of fulfilling the
service requirements. Normally, the chosen material is based on the cost of forming and
shaping of the material whereby, the lowest overall production cost will be the top
priority. Thus the cheapest material may not necessarily be the one that is used. A more
86

expensive material maybe capable of being formed very cheaply and so gives a lower
overall production cost.
5.2.2 Service Requirements of a material
The service requirements of a material may involve properties that fall under one or all of
the following three headings:
• Mechanical Properties
a) Tensile strength
b) Elasticity
c) Toughness
d) Stiffness (Young’s modulus)
e) Hardness
f) Fatique resistance
g) Resistance to creep
h) Frictional properties
• Physical Properties
a) Relative density
b) Melting-point
c) Thermal conductivity
d) Coefficient of expansion
e) Effect of temperature / changes of properties
f) Electrical conductivity
g) Magnetic properties
• Chemical Properties
a) Resistance to oxidation
b) Resistance to electrolytic corrosion
c) Resistance to degradation by electromagnetic radiation
87

88
5.3 The Incumbent – Carbon SteelCurrently, the superheater is made up of plain carbon steel tubes to perform its function
in extracting heat from the flue gas to the steam. Carbon steel is used because of two
considerations:
1. Its ability to be shaped and worked with relative ease
2. Its relatively low cost for replacement as compared with other alloy steels
The latter factor will be considered in the next chapter.
However, normal steel corrodes rapidly when left uncoated. At higher temperatures,
corrosion in the form of oxidation occurs even more rapidly. The corrosion of carbon
steel is due partly to electrolytic action between different phases in the structure of the
steel. In the case of the refuse burning boiler, corrosion is accelerated by the presence of
corrosive gases.
5.4 Alternative MetalsCandidates having the potential to replace carbon steel as the material in which the
superheater is made of should be able to function yet be more attractive in their
properties. One such property would be a longer lifespan over carbon steel such that it
would be able to be maintained less frequently than carbon steel.
Two such candidates are nickel-chromium and nickel-chromium-molybdenum steel. A
table 6.4.1 listing their chemical composition, mechanical properties, maximum working
temperature and maximum working pressure are listed below.

Types Of Metals Chemical Composition
%
Tensile Strength
(Nmm-2)
Maximum Working
Temperature(ºC)
Maximum Working
Pressure (bar)*
Carbon Steel
0.06-0.18 C
0.27-0.63 Mn
0.05 P
0.06 S
414
371
45
Nickel-Chromium Steel
1.0-3.5 Ni
0.5-1.75 Cr
990 800 60
Nickel-Chromium-
Molybdenum Steel
1.65-2.0 Ni
0.4-0.9 Cr
0.2-0.3 Mo
1700
1150
75
89
Table 5.4.1: Summaries the chemical composition, mechanical properties, maximum working temperature and maximum working
pressure.6
* Provided adequate thickness exists.
6 Source: R. A. Higgins 1984 Engineering Metallurgy Vol 1 Applied physical metallurgy Hodder and Stoughton

Resistance to oxidation is effected by adding chromium. This element coats the surface
with a tenacious layer of oxide, which protects the metal beneath from further attacks.
Nickel toughens the alloy by restricting grain-growth, but increased strength at high
temperatures is achieved by adding small amounts of tungsten, titanium, zirconium or
molybdenum.
5.4.1 Nickel-chromium steel
Nickel-chromium steel is a good candidate due to the following reasons:
a) It increases the hardenability of the steel thus prevent cracking and distortion
b) Chromium increases the metal’s resistance to corrosion and oxidation
c) Nickel not only increases hardenability but also increases the toughness of the
steel
d) The higher content of carbon in steel will cause it to harden from the shutting
down and starting up of the boiler
e) Nickel also prevents the growth of austenitic structure of the metal
f) Chromium enhances the steel at high temperature
5.4.2 Nickel-chromium-molybdenum steel
Nickel-chromium-molybdenum steel is the other good candidate owing to the following
additional properties that it has over nickel-chromium steel:
a) Unlike nickel-chromium, it does not suffer the same from a defect known as
‘temper brittleness’.
b) Temper brittleness can be largely eliminated by adding about 0.3 per cent
molybdenum to the steel, thus establishing the well known range of ‘nickel-
chrome-moly steels’
As the two candidates are primarily carbon steel with a few additives to enhance their
properties over plain carbon steel, it may be necessary to highlight the principal effects
90

the main alloying elements had on metals belonging to the carbon family. This is outlined
below:
• Nickel, Ni
a) Toughens steel by refining grain.
b) Strengthens ferrite.
c) Causes cementite to decompose – hence used by itself only in low-carbon steel
• Chromium, Cr
a) Stabilizes carbides and forms hard chromium carbide – hence increases hardness
of steel.
b) Promotes grain-growth and so causes brittleness.
c) Increases resistance to corrosion.
• Molybdenum, Mo
a) Reduces “temper brittleness” in nickel-chromium steels.
b) Stabilizes carbides.
c) Improves high-temperature strength
5.5 The Next Step
Having identified suitable metals in which to construct the superheater, the decision to
remain status quo or to have carbon steel replaced by either one of the two candidate
metals would depend on economic sensibility – the costs involved for either one option.
91
_______________________________________ Chapter 6 Cost Analysis 6.1 Introduction 6.2 Components of Costs
6.2.1 Capital Cost - Depreciation 6.2.2 Installation Cost
6.2.3 Operating Cost
6.2.3 Maintenance Cost
6.3 Cost Evaluation 6.4 Practical Considerations
92

6.1 Introduction
The preceding chapter explored possible alternatives to carbon steel in the construction of
the superheater. Nickel-chromium steel and nickel-chromium-molybdenum steel are
viable alternatives to achieve the same performance, and have several characteristics that
are superior to carbon steel. However, the final consideration in material selection must
be the cost involved in selecting the material, as this would affect the economic viability
of the entire project.
This chapter compares the costs of using each of the respective metal identified in Chapter
6. In the end, as in most cases, this would determine the material chosen finally.
6.2 Components of costs
The difference in the cost of using a material other than carbon steel for the superheater is
not merely restricted to the cost of the material; ie. it is not simply that a material that is
costlier than carbon steel is necessarily less economical in the overall cost analysis. There
are other cost factors that could weigh against a cheaper material selection. This could
very well be the case if the costs of installation, maintenance and operation are taken into
consideration along with depreciation.
6.2.1 Capital cost – depreciation Depreciation relates directly to the capital cost of the material and its lifespan. For all
intents and purposes, a cheaper material depreciates favourably economically than a
pricier alternative which has the same lifespan. However, typically, a more expensive
material can last longer. This holds true for carbon steel, nickel-chromium and nickel-
chromium-molybdenum. A table showing the depreciation of each of these metals is
shown below:
93
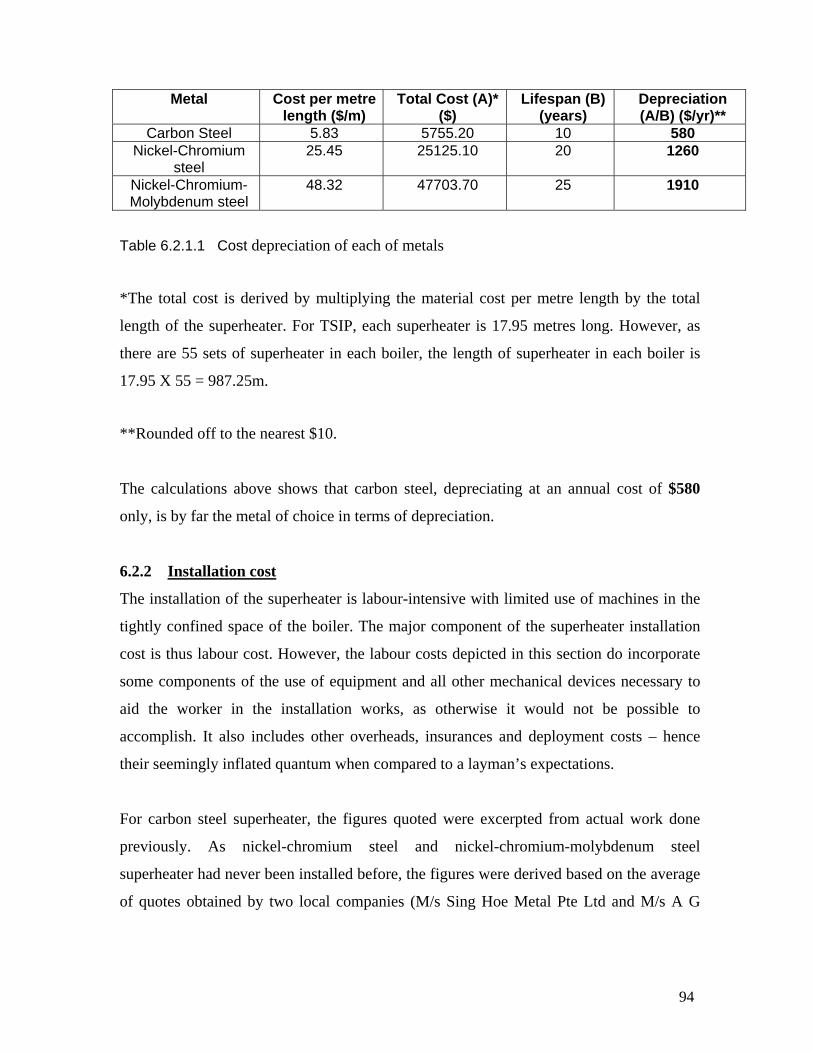
Metal Cost per metre length ($/m)
Total Cost (A)*($)
Lifespan (B) (years)
Depreciation (A/B) ($/yr)**
Carbon Steel 5.83 5755.20 10 580 Nickel-Chromium
steel 25.45 25125.10 20 1260
Nickel-Chromium-Molybdenum steel
48.32 47703.70 25 1910
Table 6.2.1.1 Cost depreciation of each of metals
*The total cost is derived by multiplying the material cost per metre length by the total
length of the superheater. For TSIP, each superheater is 17.95 metres long. However, as
there are 55 sets of superheater in each boiler, the length of superheater in each boiler is
17.95 X 55 = 987.25m.
**Rounded off to the nearest $10.
The calculations above shows that carbon steel, depreciating at an annual cost of $580
only, is by far the metal of choice in terms of depreciation.
6.2.2 Installation cost
The installation of the superheater is labour-intensive with limited use of machines in the
tightly confined space of the boiler. The major component of the superheater installation
cost is thus labour cost. However, the labour costs depicted in this section do incorporate
some components of the use of equipment and all other mechanical devices necessary to
aid the worker in the installation works, as otherwise it would not be possible to
accomplish. It also includes other overheads, insurances and deployment costs – hence
their seemingly inflated quantum when compared to a layman’s expectations.
For carbon steel superheater, the figures quoted were excerpted from actual work done
previously. As nickel-chromium steel and nickel-chromium-molybdenum steel
superheater had never been installed before, the figures were derived based on the average
of quotes obtained by two local companies (M/s Sing Hoe Metal Pte Ltd and M/s A G
94
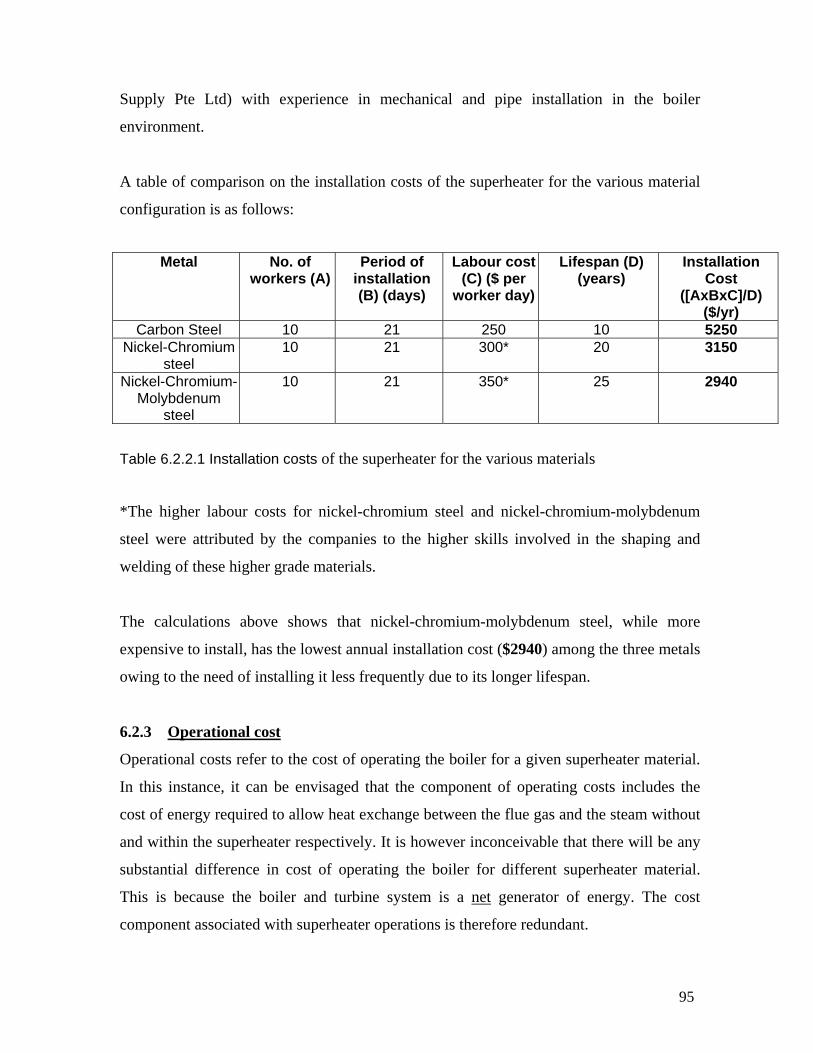
Supply Pte Ltd) with experience in mechanical and pipe installation in the boiler
environment.
A table of comparison on the installation costs of the superheater for the various material
configuration is as follows:
Metal No. of workers (A)
Period of installation (B) (days)
Labour cost (C) ($ per
worker day)
Lifespan (D) (years)
Installation Cost
([AxBxC]/D) ($/yr)
Carbon Steel 10 21 250 10 5250 Nickel-Chromium
steel 10 21 300* 20 3150
Nickel-Chromium-Molybdenum
steel
10 21 350* 25 2940
Table 6.2.2.1 Installation costs of the superheater for the various materials
*The higher labour costs for nickel-chromium steel and nickel-chromium-molybdenum
steel were attributed by the companies to the higher skills involved in the shaping and
welding of these higher grade materials.
The calculations above shows that nickel-chromium-molybdenum steel, while more
expensive to install, has the lowest annual installation cost ($2940) among the three metals
owing to the need of installing it less frequently due to its longer lifespan.
6.2.3 Operational cost
Operational costs refer to the cost of operating the boiler for a given superheater material.
In this instance, it can be envisaged that the component of operating costs includes the
cost of energy required to allow heat exchange between the flue gas and the steam without
and within the superheater respectively. It is however inconceivable that there will be any
substantial difference in cost of operating the boiler for different superheater material.
This is because the boiler and turbine system is a net generator of energy. The cost
component associated with superheater operations is therefore redundant.
95

6.2.4 Maintenance cost
Maintenance costs, when referring to the superheater, may be incurred when the boiler is
shutdown when maintenance works need to be carried out on the superheater. At the
present rate, each boiler of the TSIP is shutdown every 12 months for regular maintenance
of its components, including the superheater. There has never been any occurrence
whereby the boiler is shutdown because of the superheater. As the superheater is made up
of carbon steel, the lowest grade of the three metals under study, it is envisaged that the
present maintenance schedule will continue even if, and especially so, when the two
higher grades of metals are used.
For the actual cost of maintenance on the superheater, the difference in this cost for the
different superheater material is also negligible, due to the same nature of maintenance
work required on the superheater; ie. slag and ash removal. As in operating cost, the cost
component associated with superheater maintenance is also therefore redundant.
6.3 Cost Evaluation The summary table consolidating the costs associated with the superheater is shown
below. The figures have all been calculated on an annual cost basis.
Metal Depreciation (A) ($/yr)
Installation Cost (B) ($/yr)
Total Cost (A+B) ($/yr)
Carbon Steel 580 5250 5830 Nickel-Chromium
steel 1260 3150 4410
Nickel-Chromium-Molybdenum steel
1910 2940 4850
Table 6.3.1 Annual costs for each metal
Based on the table, it is apparent that it makes more economics sense to use Nickel-
Chromium steel as it exhibits the lowest annual cost ($4410).
96

6.4 Practical Considerations It is therefore seemingly apparent that nickel-chromium steel is a better choice than carbon
steel in both properties (corrosion resistance) and cost. While a theoretical
recommendation could be made for carbon steel to be replaced with nickel-chromium
steel, in reality such a hasty recommendation needs to be tempered. For one, the
commercial availability of nickel-chromium steel tubes needs to be ascertained. More
importantly, the lifespan used for all 3 metals in calculating depreciation and installation
costs above are rarely achieved in practice. This is due to the fact that the superheater
could very well be replaced before the lifespan of the metal is reached, because of the
service considerations of the particular boiler.
It seems therefore that ways to mitigate corrosion on the superheater bears more weight
than material selection, as is borne in reality. The cost analysis exercise is therefore more
often than not just an exercise. Nevertheless it should not be discounted but rather
encouraged in pursuit of a more comprehensive assessment.
97
Chapter 7 Conclusions
98
Conclusions
This project set out to explore the causes and effects of corrosion on the surface of the
superheater tube in the furnace of an incinerator.
A main component of the project is a study carried out in the furnace of an actual
incinerator. The exact conditions experienced in a furnace combustor are therefore
replicated, where high temperature corrosion normally occurs, which is above 371oC.
Observations, empirical analyses and experiments carried out under the project revealed
that the presence of Hydrochloride (HCl) in flue gas unequivocally increases the
corrosion rate on the superheater tube surface. A further finding was that the presence of
corrosive gases, such as chlorine and hydrochloride, corrode the boiler tubes, particularly
those operating above 371oC, resulting in tube thinning and failure.
The HCl concentration depends on the plastic content of the refuse thrown in into the
incinerator. This will determine how fast or slow will the corrosion growth on the
surface of the superheater tube. The high corrosion rates observed at elevated
temperatures were a result of an accelerated oxidation and a reduced scale adhesion.
From literature research on possible superheater material, nickel-chromium steel and
nickel-chromium-molybdenum steel are found to have corrosion-resistance properties
which are superior to carbon steel, which is the material most commonly used for
superheater. Cost analyses reveal that it is theoretically most economical to construct the
superheater out of nickel-chromium steel, but the practical and service considerations of
using this material must be taken into account.
Another finding of the project is with regards to slag formation on the surface of the
superheater tube. Slag formed on the surface of the superheater must be removed;
otherwise it could result in high temperature corrosion. The removal of slag formation is
a serious problem. By implementing intelligent retractable soot blowers, it is possible to
99
reduce slag formation rate on the superheater surface. This could restrict gas temperature
at the tube surface. The six months period for the maximum deposits to form at the
superheater tube suggest that an annual cleaning of the tube is not enough to prevent high
temperature corrosion.
Continuous measurement of combustion air and flue gases is a necessity in modern
practice to accomplish effective avoidance of High HCl Concentration, which affects the
properties of tube materials. Moreover, monitoring the amount of air content in the
furnace is recommended as air content is an added another factor in the corrosion
process. The amount of oxygen used in the furnace can be determined by installing a
device that can continuously record and give the desired information.
Burning of refuse fuel require a high excess air, a good air distribution could lead to
complete mixing and burning of the flue gas that could avoid corrosive situation.
100

______________________________________ Chapter 8 Recommendations
101

Recommendations
Listed below are several measures that can be taken to minimize the formation of slags
and the associated problems of corrosion. However there has yet to be a feasible solution
which could completely eliminate the problem.
1) High temperature corrosion can be mitigated by (i) preventing the gases from
coming into contact with the tubes until combustion is complete; (ii) ensuring that
the gases are thoroughly mixed by the use of at least 100% excess air; and (iii)
injecting secondary air. Protection from excess temperatures can be achieved by
covering the tubes with refractory material or by making the furnace independent
of the boiler. Even after taking these precautions it is necessary to prevent tube
metal temperatures to go above 425oC if high temperature corrosion of
superheater tube is to be avoided. This limits the steam conditions that can be
used with incinerators if high availability is required.
2) Oxygen corrosion on the inside of the water tubes can be prevented:
a) Externally by the use of deaerators in order to extract the air out of the
water before it is fed to the boiler
b) Chemically by the use of oxygen-scavenging chemicals. Chemicals
commonly used for this purpose are sodium sulfite, hydrazine and
catalyzed hydrazine.
3) Proper mixture of refuse is relatively important because it could lead to a
reduction in the percentage of plastic content in the refuse. The practice helps
maintain the HCL content in the furnace which in turn could mitigate the acidic
environment which is conducive for corrosion attack on boiler metal.
4) If the gas temperature entering the convection sections is cooled adequately,
slagging can be minimised. Cooling can be accomplished by using a large radiant
102

furnace section. However this is expensive and makes the boiler design more
complicated.
5) Flue gas recirculation could be used to re-circulate and mix cool gases from the
boiler exit with the hot incoming gases, thus reducing the temperature of the gas
let to the boiler. However this increases the mass flow through the boiler and
hence its initial cost. Operating costs are increased by using the recirculation fan.
6) Retractable soot blowers with wide access lanes (spaced tubes) are suggested for
removing the deposits as soon as they form so as to prevent metal temperature
fluctuations when slag accumulates on the surface of the superheater tube. This
method would mean a higher capital cost (the cost of the superheater is higher due
to lower log-mean temperature difference) but could be compensated over the
lifespan of the tube by lower depreciation costs (lower maintenance and
replacement costs spread over a longer life).
7) To clean the superheater tube at the interval of six month.
103
References
1) H.Kaesche, Metallic Corrosion, R.A. Rapp, transl., NACE, Houston, pp. 321-54,
1985.
2) M.G. Fontana, Corrosion Engineering, 3rd ed., McGraw-Hill. New York, pp. 72,
1986.
3) Z. Szklarska- Smialowska, Pitting Corrosion of Metal, NACE, Houston, pp. 377,
1986.
4) R.M. Kain, CORROSION/80, Paper 74, NACE, Houston, 1980.
5) R.M. Kain, Metals Handbook, Vol. 13, corrosion, 9th ed., ASM International, Metals
Park, OH, pp. 109, 1987.
6) R.W.Schutz and D.E. Thomas, Metals Handbook, Vol 13, Corrosion, 9th ed., ASM
International, Metals Park, OH, pp.303, 1987
7) A.I. Asphahani and W.L. Silence, Metals Handbook, Vol 13, corrosion, 9th ed., ASM
International, Metals Park, OH, pp. 113, 1987.
8) Birks, N., and Meier, G.H., Introduction to High Temperature Oxidation of Metals,
London, Edward Arnold, 1983.
9) Rapp, R. A., High Temperature Corrosion, Washington, D.C., The American
Chemical Society, 1980.
10) Gulbransen, E.A., and Jansson, S.A., Thermochemical Considerations of High
Temperature Gas-Solid Reactions, in Belton, G.R., and Worrell, W.F (eds.),
Heterogeneous Kinetics at Elevated Temperatures, New York, Plenum Press, 1970,
pp. 34-46.
11) Jones, D.A., Principles and Prevention of Corrosion, Upper Saddle River, N.J.,
Prentice Hall, 1996.
12) Roberge, P.R., Tullmin, M.A.A., and Trethewey, K., “Knowledge Discovery from
Case Histories of Corrosion Problems,” CORROSION 97, Paper 319.1997. Houston,
Tex, NACE International.
13) Staehle, R.W., Predicting the Performance of Pipnlines, Revie, R.W. and Wang, K.C.
International Conference on Pipeline Reliability, VII-1-1-VII-1-13. 1992. Ottawa,
Ont.,CANMET.
104
14) Dillon, C.P., Forms of Corrosion: Recognition and Prevention, Houston. Tex., NACE
International, 1982.
15) “Air Pollution Aspects of Incineration Facilities for Household Waste and
Comparable Commercial Waste”, Ministry of Public Housing, Urban Planning
and Environmental Management, Kingdom of the Netherlands, July 14, 1989.
16) Waste on Municipal Waste Combustion, Volume I, Hollywood, F.L, Hay, David
J. “Incineration of Municipal Solid Regulatory Initiatives in Canada”,
International Conference April 11-14, 1989.
17) Environment Canada, “The National Incinerator Testing and Evaluation Program:
Environmental characterization of Mass Burning Incinerator Technology at
Quebec City”,Report EPS 3/UP/5, June, 1988.
18) John Thompson Water Tube Boilers Ltd, “john Thompson LA MONT Steam
Generators”
19) Tuas South Incineration Plant Ltd, “TSIP Yearly Report in Year 2002, 2003 &
2004”,Pg 3.
20) Tuas South Incineration Plant Ltd, “Singapore Incineration Plant Handout”,
Pg 15-23 & 56-101.
21) Engineering materials : properties and selection / Kenneth G. Budinksi, Michael
K. Budinski, 2001 22) Engineering materials technology : structures, processing, properties, and
selection / James A. Jacobs, Thomas F. Kilduff, 2001 23) Engineering materials technology : structures, processing, properties & selection /
James A. Jacobs, Thomas F. Kilduff, 1997 24) Introduction to materials and processes / by John R. Wright, Larry D. Helsel.
Author Wright, John R., 1996
105

25) Engineering Metallurgy Vol 1 Applied physical metallurgy, R. A. Higgins Hodder and Stoughton, 1984
26) Tuas South Incineration Plant Ltd, “TSIP Operation Manual 2002”
27) Gupta, R.(Editor). “The Impact of Mineral Impurities in Solid Fuel Combustion.”
106

_______________________________________
Appendix Appendix A: Project Specification
107

Appendix A University of Southern Queensland
Faculty of Engineering and Surveying
ENG4111/2 Research Project PROJECT SPECIFICATION
For: Noorahmad Bin Ali Topic: Investigation of corrosion on boiler tube of Tuas South Incineration Plant Supervisor: Dr Nigel Hancock Dr.Wenyi Yan Mr Ghazali (NEA-TSIP) Project aim: The aim of this project is to study the causes of corrosion to the incinerator,
in particular, the super heater tube, and to recommend measures that could
minimize the occurrence of the corrosion with a view to prolong the life
span of the tube.
PROGRAMME: Issue A 21 March 2005
1) Research on past history record of Super heater tube. • Measurement tube record (done during boiler overhaul) • Leakages
2) Analysis of the incoming waste to the plant. • To identify the component of the solid waste.
3) Calculating and flue gas sampling testing. • To determine the composition of the flue gas.
4) Determine the percentage of HCL and OXYGEN content in the flue gas. 5) Analyze the effect of corrosion growth on the surface of the super heater tube. 6) To calculate the stresses on the Super heater tube surface due to pressure and
temperature. 7) To explore ways to minimize the corrosion on the tube surface.
• Viable material replacement • Controlling the environmental condition that could reduce corrosion.
As time permits: 8) Design and implement the measured system on one of the boiler. AGREED:
__________________ (Student) _________________ (Supervisor)
108
Dated : _________