university of tartu institute of sports pedagogy...
TRANSCRIPT
UNIVERSITY OF TARTU
Institute of Sports Pedagogy and Coaching
Elisabeth Juudas
Changes in Perceived Stress and Recovery During Block Training
Periodization Compared to Normal Training Periodization in Well-Trained
Junior Cross-country Skiers.
Master Thesis
Physical Education and Sport
Supervisor: docent Mehis Viru
Tartu 2013
Contents
INTRODUCTION ...................................................................................................................... 3
1. LITERATURE OVERVIEW .............................................................................................. 5
1.1 Periodization in endurance sports ................................................................................. 5
1.2 High intensity training in endurance sports .................................................................. 8
1.3 Overreaching and overtraining syndrome in sports training ........................................ 9
1.4 Monitoring overreaching and overtraining in training ............................................... 12
1.4.1 Performance markers ........................................................................................... 13
1.4.2 Biochemical markers ........................................................................................... 14
1.4.3. Heart rate markers .............................................................................................. 16
1.4.4 Psychometric markers ......................................................................................... 16
2. AIM OF THE STUDY AND PURPOSES ....................................................................... 19
3. METHODS ....................................................................................................................... 20
3.1 Participants ................................................................................................................. 20
3.2 Experimental protocol ................................................................................................ 20
3.3 Physical training ......................................................................................................... 20
3.4 Session RPE ................................................................................................................ 22
3.5 The recovery stress questionnaire ............................................................................... 22
3.6 Statistical analysis ...................................................................................................... 23
4. RESULTS ......................................................................................................................... 25
4.1 Session RPE ................................................................................................................ 25
4.2 Changes in stress-recovery state over time................................................................. 26
4.3 Specific changes in recovery-stress state scales ......................................................... 28
5. DISCUSSION ................................................................................................................... 34
6. CONCLUSIONS .............................................................................................................. 39
7. REFERENCES ................................................................................................................. 40
8. SUMMARY IN ESTONIAN ............................................................................................ 44
INTRODUCTION
Cross-country skiing is an endurance sport with high training demands, elite cross-country
skiers may reach a volume of 60-90 hours endurance training per month in the pre-season
period (Losnegard et al., 2011). A large volume (about 75 %) of the cross-country skiers
training sessions is performed below the first ventilatory threshold (≤ 2.0 mmol/L blood
lactate) and 15-20 % of training sessions are performed as interval bouts (Seiler & Kjerland,
2006).
To tolerate high training loads it is important to carefully plan all of the training sessions. A
common model in endurance sports is a traditional periodization model (Issurin, 2010) and
this is also widely used in cross-country skiing. Having a close relationship to cross-country
skiing I can say that often the main problem is to plan high intensity training (HIT) between
large volumes of training without losing the quality of the HIT sessions.
An alternative periodization model for traditional training periodization is block training
periodization which attempts to avoid concurrent training effects by focusing on a single
training aspect while maintaining the others (Issurin, 2010). This concept/model has been
applied to strength training programmes, but has not typically been used in endurance
training. One of the only studies on the effectiveness of the block training, when the increase
in HIT volume for several consecutive days followed by sufficient recovery (HIT shock
microcycle) was conducted by Breil et al. (2010) showed that it may be a promising way to
effectively improve VO2max and performance in competitive alpine skiers.
It is well known that large training loads can enhance performance, but by contrast they can
also lead to performance decline when there is insufficient recovery (Kenttä & Hassmen,
1998). To ensure maximal effect of shock microcycle periods it is important that overreaching
is carefully planned and recovery is extended (Breil et al., 2010; Smith, 2003). Finding a
balance between training stress and adequate recovery is essential for optimal performance
(Kellmann, 2002). Training monitoring has an important role to avoid or prevent overreaching
and overtraining (Budgett, 1998).
Approaching to problem from an athlete or coach perspective, the best method for training
monitoring should be easy to use, provide information quickly, non-invasive and sensitive to
changes in training load. After analysing the overtraining literature, a method that meets the
criteria is the Recovery Stress Questionnaire for Athletes (RESTQ-76 Sport) developed by
Kellmann & Kallus (2001). The questionnaire assesses systematically the recovery-stress state
4
of an athlete. Several studies have reported that the RESTQ-76 Sport may be a useful tool for
monitoring training, whereby changes in training volume were reflected by significant
changes in the RESTQ-76 Sport scales (Coutts et al., 2007; Gonzalez-Boto et al., 2008;
Jürimäe et al., 2002a; Mäestu et al., 2006). Therefore, using the RESTQ-76 Sport may detect
overreaching in its early stages.
Currently there is no information in the literature regarding the use of the RESTQ-76 Sport to
monitor changes in perceived stress and recovery during block training periodization which
includes a HIT shock microcycle.
The aim of the current study was to evaluate the impact of block training periodization
compared with normal training on the cross-country skiers’ perceived recovery-stress states
using the RESTQ-76 Sport questionnaire.
5
1. LITERATURE OVERVIEW
1.1 Periodization in endurance sports
The concept of periodization refers to the manipulation and sequencing of various aspects
(e.g., volume, intensity, load, exercise type) of a training program during specific periods
throughout the year to optimize athletic performance for major competitions (Bompa & Haff,
2009). To induce endurance training effects, frequency, duration and intensity play key roles
(Billat, 2001; Laursen & Jenkins, 2002; Rusko, 2003). To achieve maximal adaptive training
effects, world-class athletes endure extremely high endurance training loads (Rusko, 2003).
Elite cross-country skiers may reach a volume of 60-90 hours of endurance training per month
in the pre-season period. Training generally includes disciplines that focus on endurance
training such as cross-country skiing, running, roller-skiing and cycling (Losnegard et al.,
2011). Endurance and strength sessions are typically performed in parallel, which indicates
that the most common periodization method in cross-country skiing is traditional
periodization.
The traditional model of periodization was established in the 1960s and has not changed much
since; it became a universal and monopolistic approach for training planning and analysis
across a variety of sports in many countries, particularly in endurance sports. The traditional
periodization splits the seasonal training program into smaller training periods and guidelines
of the model are based on the concurrent development of many fitness components (e.g.
aerobic capacity, maximal aerobic power, maximum strength, etc.) within a regular workload
distribution. For example, the preparatory training period for endurance athletes is aimed at
developing many different skills, such as general aerobic ability, muscle strength and strength
endurance, general coordination, general explosive ability and general speed, basic mental
and technical abilities, etc. While all of the components require physiological, morphological
and psychological adaptations, many of the skills are not compatible, which causes conflicting
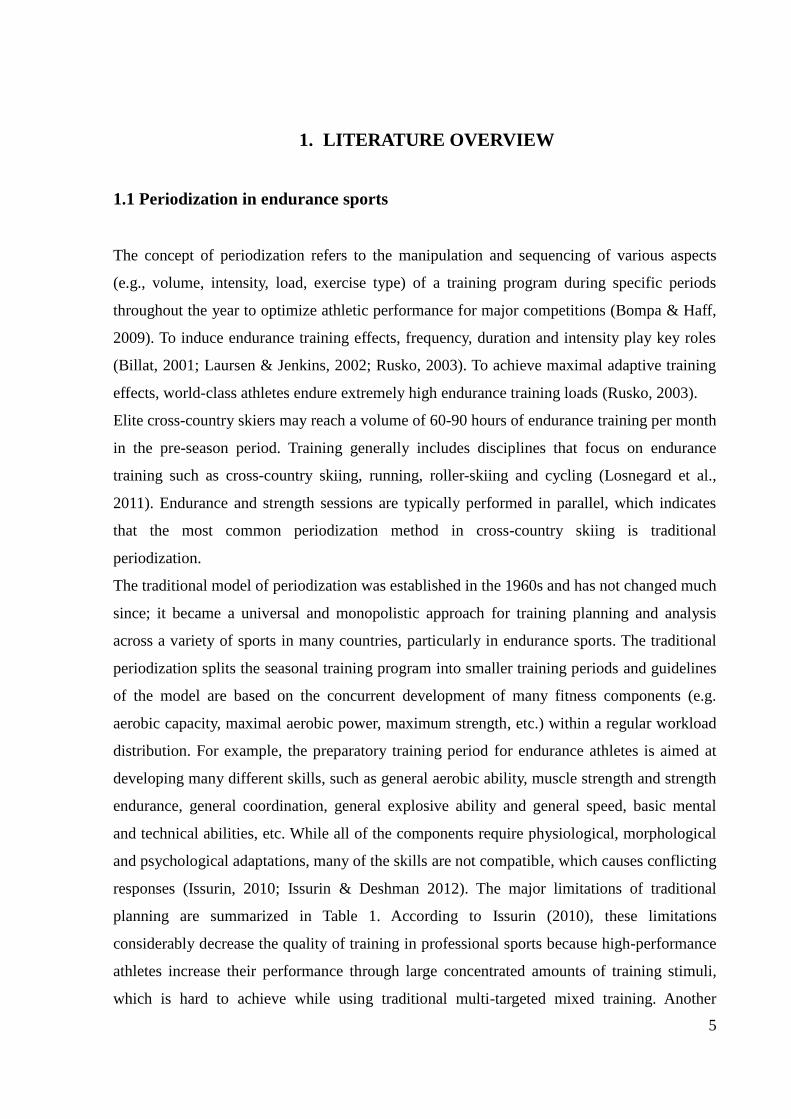
responses (Issurin, 2010; Issurin & Deshman 2012). The major limitations of traditional
planning are summarized in Table 1. According to Issurin (2010), these limitations
considerably decrease the quality of training in professional sports because high-performance
athletes increase their performance through large concentrated amounts of training stimuli,
which is hard to achieve while using traditional multi-targeted mixed training. Another
6
limitation is that high-performance athletes need to achieve excellent results throughout the
season, not only two to three times per year, as in traditional periodization (Issurin, 2010).
Table 1. Major limitations of the traditional periodization model for high performance
athletes’ preparation (based on Issurin, 2010).
Domain Major limitation
Physiology
Energy supply is not sufficient for concurrent performance of mixed multi-
targeted workloads
Different physiological systems required different periods of recuperation;
athletes do not get sufficient restoration
Exercise combining various modalities often interact negatively and
produce conflicting training
Psychology Performing stressful workloads demands high levels of mental
concentration that cannot be directed at many targets simultaneously
Training
Methodology
High-level athletes need for large amounts of training stimuli progression
that cannot be obtained by concurrent training for many targets
Inability to provide multi-peak preparation and successful performance
during the entire annual cycle
An alternative training concept to traditional periodization is block periodization, which
attempts to avoid concurrent training effects by organizing blocks that contain a large volume
of exercise directed to the minimal number of targeted abilities, unlike traditional
periodization, which focuses on multi-targeted mixed training (Issurin, 2010). This is shown
in Table 2.
The general principles of block training areas follows: (1) a high concentration of training
workloads; (2) a minimal number of targeted abilities within a single block; (3) consecutive
development of several athletic abilities; (4) the use of specialized mesocycle-block (Issurin
& Dreshman, 2012). The typical duration of a specialized training mesocycle (or block) is 2-6
weeks, and 3 mesocycle blocks form a single training stage, with the total duration of a single
training stage ranging from 5-10 weeks. The number of training stages depends on the
particular sport, the number of important competitions, etc. Usual variation is 4-7 stages
within one season (Issurin, 2010).
Garcia-Pallares et al. (2010) compared traditional periodization with block periodization. The
subjects were elite kayakers who underwent both training programs over consecutive years;
7
the first year was based on traditional periodization and the second year was based on block
training periodization. The analysed period was the first training cycle of each year and
according to the results, block training periodization was more effective than traditional
training periodization in similar increases in VO2max and in VO2 at the second ventilatory
threshold, while specific-paddling performance was significantly greater after block
periodization compared to traditional periodization. However, the block periodization
achieved similar results with the half the endurance training volume used in the traditional
periodization. This shows that improvements in performance are not always related with an
increase in training volume.
Table 2. Taxonomy of mesocycle blocks (Issurin & Dreshman, 2012).
Main
characteristics
Mesocycle type
Accumulation Transmutation Realization
Targeted motor
and technical
abilities
Basic abilities:
Aerobic endurance
Muscular strength
Basic coordination
Sport-specific
abilities:
Special endurance
Strength
endurance
Proper technique
Integrative
preparedness:
Modeled
performance
Maximal speed
Event specific
tactics
Volume-Intensity High volume
Reduced intensity
Reduced volume
Increased intensity
Low-medium volume
High intensity
Fatigue-Recovery
Reasonable recovery
to provide
morphological
adaptation
No possibility to
provide full recovery,
fatigue accumulated
Full recovery, athletes
should be well rested
Follow-up
particularities
Monitoring the level
of basic abilities
Monitoring the level
of sport-specific
abilities
Monitoring maximal
speed, event specific
strategy, etc.
8
1.2 High intensity training in endurance sports
Coaches and athletes in endurance sports quite often have a tendency to equate large volumes
of training with success (O´Toole, 1998). However, in a comparison of a high-volume, low
intensity versus low-volume, high-intensity training, a high training volume was shown to
have no advantage compared with high-intensity training including lower volume (Faude et
al., 2008).
High-intensity training (HIT) has an important role in both traditional and block training
periodization. It has been found that once an individual has reached a VO2max > 60 ml/kg/min,
endurance performance is not improved by a further increase in sub-maximal training
performance and that higher intensity training may be needed for well-trained subjects
(Londeree, 1997). Coaches and athletes have been using HIT to enhance endurance
performance and physiological markers (Laursen & Jenkins, 2002) and successful training
programs can benefit from manipulating training intensity over a short-term period (Laursen,
2010). HIT, also called transition training, is commonly achieved through the use of different
intervals, while the high volume training is characterised by prolonged, continuous sub-
maximal efforts. HIT can be defined as repeated bouts of short to moderate duration exercise
(i.e., 10 seconds to 5 minutes) performed at an intensity that is higher than the anaerobic
threshold where the intervals are separated by short periods of rest (low-intensity work or
inactivity), which allows a partial recovery (Laursen & Jenkins, 2002).
Buchheit and Laursen (2013) identified several variables that can be manipulated during a
HIT session: work interval intensity and duration (the key factors), exercise modality (i.e.
running vs. skiing, flat or uphill), number of repetitions, number of series, recovery duration
and intensity between series. One of the suggestions based on review was that a total HIT
session volume should enable athletes to spend ~ 5 min (team and racket sports) to ~ 10 min
(endurance sports) at VO2max.
Elite endurance athlete’s typical training patterns involve the accumulation of large volumes
of work at lower intensities (~ 65% VO2max) combined with 1-3 weekly bouts where
significant time is spent at intensities ≥ 90% of VO2max (Seiler & Kjerland, 2006). An
alternative time-efficient way to improve aerobic capacity is to employ the so-called HIT
shock microcycle, which involves a significant increase in HIT for several days in a row
followed by a sufficient recovery period (Breil et al., 2010, Stolen et al., 2005). Shock
9
microcycles are used to elicit training overload, but the cycles must be monitored carefully to
avoid injuries and development of overtraining (Smith, 2003). There are not much scientific
studies available about the HIT shock blocks, but the method has been used by different
coaches in a practical environment. One of the first scientific studies investigating HIT shock
microcycles was carried out by Breil et al. (2010), where junior alpine skiers performed 15
HIT sessions in an 11-day shock microcycle. Each HIT session consisted of four, 4-min
interval bouts at 90-95% of individual maximal heart rate (HRmax), separated by 3 min of
active recovery. The results of the study showed improvements in VO2max and peak power
output (PPO), which were achieved with in the short training period. However, limitation of
the study is that an intensified training group and a normal training group were not matched.
A more recent study showed that a 14-day shock microcycle including 15 HIT sessions is able
to improve time trial performance and PPO, but contrary to Breil et al. (2010) no
improvements in the VO2max were observed (Wahl et al., 2013).
1.3 Overreaching and overtraining syndrome in sports training
Training for success at a high level has become finding a balance between achieving peak
performance and avoiding negative consequences of overtraining (Kenttä & Hassemen,
1998). Achieving optimal adaption requires ability to manipulate the combination of volume
and intensity in the correct ratio of work to rest. Different individual capabilities makes it
difficult to identify a generic key to the ideal adaption, since the same training volume can
cause individual excessive overload for one, while for another causes adequate adaption
(O’Toole, 1998).
Intensified training periods are most commonly used to enhance performance. However,
increasing of the frequency of HIT sessions or competitions are the main causes of
overreaching in endurance sports (Urhausen et al., 1998). After intensive training periods,
athlete may experience acute feelings of fatigue and decreases in performance (i.e. after
training camp). An adequate rest period after intensive training can lead to a positive
adaptation or improvement in performance, which is the result of a well-conducted training
program. If the appropriate training stress and adequate recovery is not in balance, an
abnormal result of training may occur and a state of overreaching may develop (Meesuen et
al., 2013). A current information about OR and OT syndrome is mainly presented in review
articles, which indicates that OT syndrome is not fully understood. A number of research
10
articles is small.
Due to the lack of common and consistent terminology in this research field, below are the
definitions presented by Kreider et al. (1998):
Overreaching (OR) – an accumulation of training and/or non-training stress resulting in a
short-term decrement in performance capacity with or without related physiological and
psychological signs and symptoms of maladaptation, in which restoration of performance
capacity may take from several days to several weeks.
Overtraining (OT) – an accumulation of training and/or non-training stress resulting in a long-
term decrement in performance capacity with or without related physiological and
psychological signs and symptoms of maladaptation, in which restoration of performance
capacity may take from several weeks to several months.
These definitions emphasize that the difference between OR and OT is the amount of time
needed for performance restoration and not the type or duration of training stress or degree of
impairment.
The latest update in terminology is presented by leading sports science organizations, the
European College of Sport Science (ECSS) and the American College of Sports Medicine
(ACSM) Joint Consensus Statement (Meeusen et al., 2013) and states that ―overtraining‖ is
used as a verb meaning a process of intensified training with possible outcomes of short-term
OR (functional OR) and extreme OR (non-functional OR) or OT syndrome. The distinction
between these terms lies in the recovery period necessary after a high intensity training
period. Different stages that differentiate normal training from OR (short-term and extreme)
and OT syndrome are presented in Figure 1.
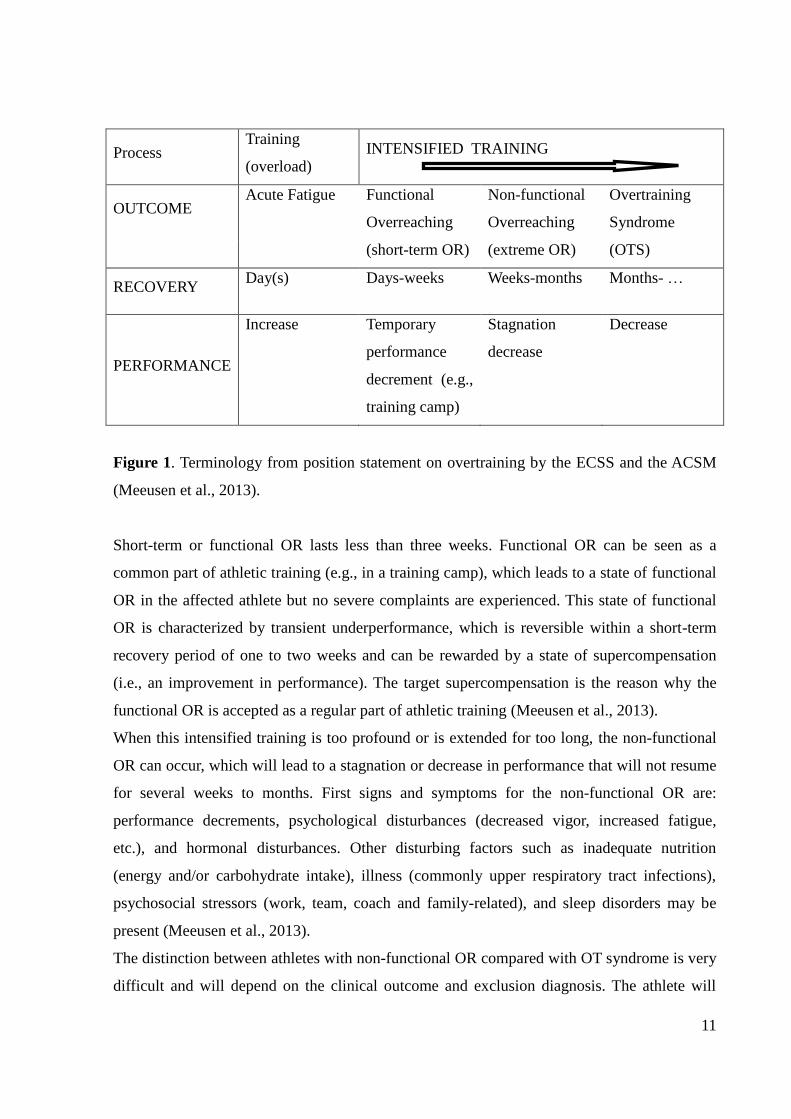
11
Process Training
(overload) INTENSIFIED TRAINING
OUTCOME Acute Fatigue
Functional
Overreaching
Non-functional
Overreaching
Overtraining
Syndrome
(short-term OR) (extreme OR) (OTS)
RECOVERY Day(s) Days-weeks Weeks-months Months- …
PERFORMANCE
Increase Temporary
performance
decrement (e.g.,
training camp)
Stagnation
decrease
Decrease
Figure 1. Terminology from position statement on overtraining by the ECSS and the ACSM
(Meeusen et al., 2013).
Short-term or functional OR lasts less than three weeks. Functional OR can be seen as a
common part of athletic training (e.g., in a training camp), which leads to a state of functional
OR in the affected athlete but no severe complaints are experienced. This state of functional
OR is characterized by transient underperformance, which is reversible within a short-term
recovery period of one to two weeks and can be rewarded by a state of supercompensation
(i.e., an improvement in performance). The target supercompensation is the reason why the
functional OR is accepted as a regular part of athletic training (Meeusen et al., 2013).
When this intensified training is too profound or is extended for too long, the non-functional
OR can occur, which will lead to a stagnation or decrease in performance that will not resume
for several weeks to months. First signs and symptoms for the non-functional OR are:
performance decrements, psychological disturbances (decreased vigor, increased fatigue,
etc.), and hormonal disturbances. Other disturbing factors such as inadequate nutrition
(energy and/or carbohydrate intake), illness (commonly upper respiratory tract infections),
psychosocial stressors (work, team, coach and family-related), and sleep disorders may be
present (Meeusen et al., 2013).
The distinction between athletes with non-functional OR compared with OT syndrome is very
difficult and will depend on the clinical outcome and exclusion diagnosis. The athlete will
12
often show the same clinical, hormonal, and other signs and symptoms. The diagnosis of OT
syndrome can often only be made retrospectively when the time course has been overseen
(Meeusen et al., 2013).
As mentioned above, the main reason for error in training is the imbalance between the load
and the recovery. But this is not the only possible cause of overtraining. Triggers can be also
monotony of training, too many competitions, personal and emotional (psychological)
problems and emotional demands of work. Less common possibilities are sleep disturbance,
altitude exposure and exercise heat stress. A key factor in the recognition of OT syndrome
might be prolonged maladaptation of athletic performance, due to several biological,
neurochemical, and hormonal regulation mechanisms (Meeusen et al., 2013).
1.4 Monitoring overreaching and overtraining in training
Training monitoring is important for the diagnosis of OR and OT syndrome and is also
essential for the assessment of any athlete to optimizing training programme design, reduce
injury or illness risk, increase career longevity, and maximize sports performance (Viru &
Viru, 2001). Training monitoring for OT status is still based on exclusion. There is no
diagnostic tool to identify whether an athlete is experiencing OT syndrome. Because of the
variety of different tools used for identifying OR or OT syndrome, the accuracy of correctly
diagnosing the problems is limited. For example, many endocrinological and clinical findings
due to OR and OT syndrome can mimic other diseases. Although, there is a lack of definitive
diagnostic criteria for OTS, there are several criteria that reliable markers for the onset of the
OT syndrome must fulfil, including sensitivity to the training load (Meesuen et al., 2013).
Only a minority of coaches and athletes have access (geographical and financial) to facilities
where they can receive sophisticated physiological, psychological, and biomechanical testing.
Such tests evaluate improvements, current biological status, performance efficiency, technical
effectiveness and psychological status (Bompa, 1999). Ideally, for the diagnosis of OT
syndrome, markers should be relatively easy to measure with fast access to the results, should
not disturb the overall training process and not be too invasive or expensive. There is a
specific need for identifying mechanisms which can detect early triggering factors of
overtraining (Meesuen et al., 2013; Urhausen & Kindermann, 2002).
So long there are no certain markers for diagnosing OT syndrome, careful monitoring of
13
athletes and their responses to training may help to prevent the OT syndrome (Budgett, 1998).
Different markers that have been used to avoid the negative consequences of training (i.e., OT
syndrome) are described here.
1.4.1 Performance markers
It appears that both the type of performance test and the duration/intensity of the performance
test are important in determining the changes in performance associated with OTS (Meeusen
et al., 2013). Several studies related to OT have reported that performance decreases during
OR (Brink et al., 2012; Coutts et al., 2007; Meeusen et al., 2004). However, it is unclear
which performance test is the most appropriate when attempting to diagnose OR or OT
syndrome. It is recommended to use sport-specific performance tests since they are better for
detecting subtle performance decrements, but many performance tests used among athletes
are not sport-specific. Time-to-fatigue tests will most likely show greater changes in exercise
capacity as a result of OR and OT syndrome (Halson & Jeukendrup, 2004; Meeusen et al.,
2013). Incremental performance tests might not be sensitive enough for detecting a small
performance decrease during OR in its early stages, due to the normal day-to-day variability
in performance in elite athletes (Rietjens et al., 2005).
According to Meeusen et al. (2004), a hallmark feature of the OT syndrome is the inability to
sustain intense exercise and recover for the next training session or competitions. An athlete
who is suffering from OT syndrome is able to start a normal training sequence or a race at his
normal training pace but is not able to complete the given training load or competition.
Therefore the authors/Meeusen et al. devised a test protocol involving two bouts of maximal
work. Seven cyclists performed two maximal exercise tests separated by 4 h. The purpose of
the study was to evaluate whether this method is able to more clearly distinguish between
healthy/trained and OR athletes. The results of the study supported their hypothesis, whereby
the first exercise test results were similar in the healthy/trained and the OR groups were
similar but differed significantly during the second exercise test (the performance decrease
was 3% in the trained group versus 6% in the OR group). In similar study Meeusen et al.
(2010) used the two bout exercise protocol and concluding that it could be a useful tool for
diagnosing non-functional OR and OT syndrome; however, more data is needed before this
can be used as the gold standard.
14
1.4.2 Biochemical markers
Biochemistry
The majority of biochemical markers used as diagnostic tools for OT syndrome do not appear
reliable due to inconsistent findings and the inability to distinguish acute fatigue resulting
from intensified training from OR or OT syndrome (Halson & Jeukendrup, 2004).
According to Meeusen et al. (2013) most of the blood parameters (e.g. blood count, C-
reactive protein, erythrocyte sedimentation rate, creatine kinase, urea, creatinine, liver
enzymes, glucose, ferritin, sodium, and potassium) are not capable of detecting OR or OT
syndrome. They may only be helpful in providing information on the actual health status of
the athlete and therefore useful in the ―exclusion diagnosis‖. For example, assessment of
plasma creatine kinase activity helps to identify a state of recent muscle damage, but is not as
a marker of impending overtraining (Gleeson, 2002). In addition, Rietjens et al. (2005) found
that changes in red blood cells after intensified training periods not usable as early markers of
OR and cannot detect OT.
Hormones
The endocrine system is one of the major systems involved in the responses to acute stress
and adaptation to chronic stress. This indicates that hormonal markers are potent parameters
for registering disturbances of homeostasis (Meeusen et al., 2013). The study described
previously using two-bout exercise protocol (Meeusen et al., 2004) also measured hormonal
responses (cortisol, ACTH, prolactin and growth hormone) and results showed that responses
to the second exercise test were different between the trained and OR athletes with the
increase in the trained group higher than in the OR group. In a similar study Meeusen et al.
(2010) showed that after the second exercise bout an overshoot of ACTH and prolactin in
non-functional OR athletes, whereas the OT syndrome athletes showed suppression. A
distinction between non-functional OR and OT syndrome was hypersensitivity of
glucocorticoid receptors in non-functional OR versus insensitivity in OT syndrome. However,
more data is needed before this test can be used as a reliable method.
One traditional measure for detecting OT in athletes is the plasma testosterone/cortisol ratio,
which for a long time was considered a good indicator of OT (Meeusen et al., 2013).
However, a study with cyclists showed that the resting levels of testosterone and cortisol and
the acute response to exercise had no correlation with performance pre and post training and
15
in spite of an increased catabolic state post training, there was an increase in
performance (Hoogeveen & Zonderland, 1996). The authors concluded that a decreased
testosteron/cortisol ratio does not automatically reflect to a decrease in performance or a state
of OT.
The results of research devoted to hormonal monitoring are far from consistent, mainly
because of preanalytical factors, i.e., factors that occur before the final analysis (time of
sampling, food intake, time after the end of exercise, gender, age, etc.), which may influence
the hormonal profile. In addition, hormone tests are considered as invasive, time consuming
and expensive. Also, differences between measuring methods and/or detection limits of the
analytical equipment used in different studies make results inconsistent. From OR/OT
syndrome aspects, the current information about the endocrine system shows that basal
(resting) hormone measurements cannot differentiate between athletes who successfully adapt
to OR and those who do not adapt and develop symptoms of OT syndrome (Meeusen et al.,
2013; Urhausen & Kindermann, 2002). Two studies investigating early symptoms of OR
reported that although hormonal changes appeared during OR period, the measures were not
correlated to the changes in performance or training load and therefore not reliable early
markers of OR (Bresciani et al., 2011; Coutts et al., 2007).
Immune system
The immune system is extremely sensitive to physiological and psychological stress, which
indicates that immune variables could be used as an index of stress in relation to exercise
training. The current information regarding the immune system and overreaching confirms the
role of intensified training in immune suppression, excessive amounts of prolonged high-
intensity exercise induce detrimental effects on immune function (Gleeson, 2006; Meeusen et
al., 2013). These include decreases in neutrophil function, serum and salivary
immunoglobulin concentrations an natural killer cell cytotoxic activity. Also, the incidence of
symptoms of upper respiratory tract infection (URTI) increases during periods of endurance
training (Gleeson, 2006). However, immune parameters change in response to training load
and those changes do not distinguish between those athletes who successfully adapt to OR
and those who maladapt and develop symptoms of OT syndrome. Problems with
immunological testing includes timing of the tests (time of day and time since last exercise
session), lack of consistency of the data in literature and is also time consuming and very
expensive (Meeusen et al., 2013).
16
1.4.3. Heart rate markers
According to Meeusen et al. (2013) there have been several proposals as to which
physiological measures might be indicative of OR and OT syndrome. Measuring resting heart
rate (HR) is one of the most common methods used by athletes and coaches. Review by
Achten and Jeukendrup (2003) indicates that in most studies no differences have been found
in the resting HR between normal and overreached states. In addition, a sleeping HR is a more
reliable method is compared to the waking resting HR, which can be easily disturbed by
external influences. Increased sleeping HR can be one indicator for OR. A more recent meta-
analysis by Bosquet et al. (2008) showed that an increase in the resting HR may be used as a
valid sign of short-term fatigue (possibly functional OR), but not long-term fatigue (possibly
non-functional OR or OT syndrome). Maximal HR values may be significantly reduced in
overtrained athletes, but the intra-individual decrease is only ~3 to 5 beats/min and is rather
small, that impairing the usefulness of this parameter in practice (Urhausen & Kindermann,
2002).
Even when the HR is relatively stable, the time between two beats (R-R interval) can differ
substantially. The variation in time between beats is being defined as heart rate variability
(HRV) (Achten & Jeukendrup, 2003). According to Meeusen et al. (2013), numerous studies
have examined the effects of training on indices of HRV but few studies have investigated
HRV in OR or OT syndrome athletes and results of those studies have been varied. More
research is necessary before HRV can be considered as a diagnostic measurement of OT
syndrome.
1.4.4 Psychometric markers
Increased exercise stress is not only manifested in physiological and biochemical changes, but
it is often presented in conjunction with psychological alterations. The advantage of
psychometric instruments is that they provide information quickly compared with
physiological monitoring (e.g., blood/hormone analysis) and performance changes (Meeusen
et al., 2013).
Psychomotor speed tests
The measurement of psychomotor speed is a relatively new tool for detecting non-functional
OR and a potentially preventing the development of OT syndrome (Rietjens et al., 2005;
17
Nederhof et al., 2008). Rietjens et al. (2005) found that one of the most sensitive parameters
for detecting OR is reaction time (indicative of cognitive brain function). They used finger
precuing test and found a significant decrease in reaction time in a group of seven well-trained
cyclists after they had doubled their training volume and increased the intensity by 15% over
a period of two weeks. The biggest advantage of psychomotor speed testing is that it is easy to
use in the field just by using a personal computer. Also the tests are non-invasive, resistant to
conscious manipulation by the athlete, and inexpensive. A disadvantage of the psychomotor
speed tests is that there is no scientific evidence to identify the most sensitive test for
detecting non-functional OR/ OT syndrome (Meeusen et al., 2013).
Questionnaires
Several questionnaires such as the Profile of Mood State (POMS) (Morgan et al., 1987);
Recovery-Stress Questionnaire (RESTQ-Sport) (Kellmann & Kallus, 2001); Daily Analysis
of Life Demands of Athletes (DALDA) (Rushall, 1990) and Total Quality Recovery (TQR)
(Kenttä and Hassemen, 1998) have been used to monitor psychological parameters in athletes.
As with all methods, potential problems exist with psychological assessments. For example,
mood state and other factors can be influenced by stressors unrelated to training and recovery
and psychological measures can be biased or rendered invalid by various forms of faking
(―faking bad‖ to reduce training load; ―faking good‖ to present yourself in a constantly
positive light). To avoid the risk of response distortion, researchers must provide athletes with
clear and guaranteed assurances that their data will remain confidential and not be used for
selection purposes, and there are no right or wrong ways to respond to the questionnaires
(Meeusen et al., 2013).
The RESTQ-76 Sport is one of the only questionnaires that measure the frequency of current
stress along with the frequency of recovery associated activities (Kellmann, 2002). The
RESTQ-76 Sport has mainly been used in training studies with rowers (Kellmann & Günther,
2000; Jürimäe et al., 2002ab; Mäestu et al., 2006), but also with triathletes (Coutts et al.,
2007), swimmers (Gonzalez-Boto et al., 2008), ultra-marathon runners (Nicolas et al., 2011)
and tennis players (Filaire et al., 2009). The RESTQ-76 Sport has been shown to be a valuable
tool for monitoring the reactions to changes in training load, with high training load
associated with elevated scores on measures of stress and simultaneous lowered scores on
measures of recovery (Filaire et al., 2009; Gonzalez-Boto et al., 2008; Jürimäe et al., 2002a;
Kellmann & Günther, 2000; Mäestu et al., 2006). Brink et al. (2010) showed that individual
monitoring of stress and recovery can warn and guide soccer players who are at risk for
18
injuries and illnesses.
A study with ultra-marathon runners (Nicolas et al., 2011) showed that measuring subjective
stress and recovery after an ultra-marathon race may help coaches and athletes to plan the
length of the recovery period following a race and potentially prevent OR and OT. RESTQ-76
Sport is also a valuable tool for the diagnosis of non-functional OR (Nederhof et al., 2008)
and perhaps the most effective predictor for OR opposed to biochemical and physiological
variables (Coutts et al., 2007). The results by Coutts et al. (2007) are supported by Bresciani
et al. (2011) and Brink et al. (2012), who indicated that psychological questionnaires may be a
useful means to detect early OR.
RESTQ-76 Sport has a good value also for coaches and athletes because it can be used as a
guideline for monitoring training and recovery and for developing an optimal training
program (Kenttä and Hassemen, 1998).
19
2. AIM OF THE STUDY AND PURPOSES
The aim of the current study was to evaluate the impact of block training periodization on the
cross-country skiers’ perceived recovery-stress states and compare it with normal training
periodization.
According to the aim of the study the following purposes were set:
To investigate the responses of perceived recovery-stress state (using the Recovery
Stress Questionnaire, RESTQ-76 Sport) to normal and block training using a
crossover design.
To compare block training perceived recovery-stress states with normal training
perceived recovery-stress states.
To assess changes in training load using a session Rate of Perceived Exertion (session
RPE) method.
20
3. METHODS
3.1 Participants
Seventeen (10 male and 7 female) well-trained cross-country skiers (17-20 years old,
including members of national junior team) from two Swedish ski gymnasiums (Sollefteå and
Sveg) participated in the study. After being informed of the aims and possible risks of the
study, subjects gave written consent to participate in all procedures and parental consent was
obtained from those aged under 18 years. The study was pre-approved by the Regional Ethical
Review Board, Umeå University, Umeå.
3.2 Experimental protocol
The investigation was conducted during the athletes’ off-season preparatory period (April-
May). The intervention period was carefully planned and co-ordinated with the coaches. A
crossover study design was used and before the first intervention period subjects were
randomly divided into two interventions, the normal training (NT) and block training (BT)
intervention. During the first three-week intervention period, eight subjects were in the NT
intervention and nine subjects were in the BT intervention. During the second three-week
intervention period subjects who were in the NT intervention switched to the BT intervention
and vice versa.
3.3 Physical training
Between the two interventions the overall training volume and intensity were the same during
the three-week period. Training was categorized into 1) low intensity (LIT; ~ 60- ~82 % of
HRmax), 2) high intensity (HIT; 90-95 % of HRmax) and 3) strength training. Three-week
training periods consisted of 9 HIT sessions and 6 strength sessions. The number of LIT
sessions was different (7 LIT sessions during normal training and 9 LIT sessions during block
training), but overall the LIT volume intensity was the same. Difference between the NT and
the BT interventions was the distribution of the sessions during three-week period.
The three normal training weeks ( N-1, N-2 and N-3) were part of the regular training cycle
for the athletes, with every week consisting of two strength sessions, two or three LIT
sessions (running, cycling, roller skiing, etc.) and three HIT sessions a week (Table 3).
Block training period consisted of two low-intensity weeks and a high-intensity week (HIT
shock week) sandwiched between them. The low-intensity weeks (B-1 and B-3) consisted of
21
three strength sessions and four or five LIT sessions. The HIT shock week (B-2) consisted of
nine HIT sessions (Table 4).
Each HIT session consisted of five, 4-min diagonal uphill roller-skiing interval bouts at 90-
95% of HRmax, separated by 6 min of active recovery (a slow downhill jog back to the start).
The HIT sessions took place on the same uphill asphalt slope in Sollefteå. HIT sessions were
always performed on roller skis, unless there was a problem with equipment, in which case
some individuals performed HIT sessions by running uphill. HIT sessions were supervised by
researchers and coaches and performed in groups of 6-8 athletes. A standardized 20-min
warm-up including a 2-min interval bout on the uphill was performed before each HIT session
and a cool-down was performed at the end.
Table 3. Training program during the normal 3-week training period.
Day 1 Day 2 Day 3 Day 4 Day 5 Day 6 Day 7
N-1 am HIT1 LIT1 Strength
Rest Strength LIT2
Rest pm Rest Rest HIT2 HIT3 Rest
N-2 am HIT4 LIT3 Strength
Rest Strength LIT4
Rest pm Rest Rest HIT5 HIT6 LIT5
N-3 am HIT7 LIT6 Strength
Rest Strength LIT7
Rest pm Rest Rest HIT8 HIT9 Rest
Table 4. Training program during the block 3-week training period.
Day 1 Day 2 Day 3 Day 4 Day 5 Day 6 Day 7
B-1 am Strength
Rest LIT2 LIT3
Rest Strength
Rest pm LIT1 Rest Strength LIT4
B-2 am HIT1 HIT3 Rest
Rest HIT6 Rest Rest
pm HIT2 HIT4 HIT5 HIT7 HIT8 HIT9
B-3 am
Rest Strength LIT6 Strength LIT7 Strength Rest
pm LIT5 Rest Rest Rest LIT8 LIT9
22
3.4 Session RPE
A modification of the category ratio rating of perceived exertion (RPE) for the entire session
was measured with a 10-point scale (Figure 2.) that was developed by Foster et al. (2001).
This measure was designed to provide a measure of the global perception of the intensity of
an entire session. Subjects were required to evaluate session RPE immediately after each
session and record it in their training diaries, answering to the simple question ―How was your
workout?‖
Figure 2. The session RPE scale developed by Foster et al. (2001).
3.5 The recovery stress questionnaire
The recovery stress questionnaire (RESTQ-76 Sport) is a psychometric instrument that can be
used to assess the balance of recovery-stress states and consists of 12 basic scales and 7
additional sport-specific scales with 1 warm-up question and 4 questions per scale. The
recovery-stress state indicates the extent to which an individual is physically and/or mentally
stressed, and whether or not the person is capable using individual strategies for recovery, and
also assesses which strategies are used. The result of the RESTQ-76 Sport provides an answer
to the question ―How are you?‖ and using a self-report approach to evaluate physical,
subjective, behavioural and social aspects of stress and recovery. The 12 basic scales include 7
scales covering different aspects of subjective stress and 5 general recovery scales. The 7
Rating Descriptor
0 Rest
1 Very, Very Easy
2 Easy
3 Moderate
4 Somewhat Hard
5 Hard
6
7 Very Hard
8
9
10 Maximal
23
sport-specific scales include 3 measures of stress and 4 of recovery (Table 5). Within each
scale, the subject must respond to four specific items. The items are then rated according to
their frequency on the Likert-type scale ranging from 0 (never) to 6 (always) measuring to
what extent the respondent took part in different activities during the last three days/nights.
The total stress score corresponds to the sum of all the stress subscale scores (7 general stress
scales + 3 sport-specific stress scales), and the total recovery score represents the sum of all
the recovery subscale scores (5 general recovery scales + 4 sport-specific scales). A general
indicator of the recovery-stress state was calculated as the total stress score minus total
recovery score. A high mean score in the stress-related scores reflect intense subjective stress,
whereas high mean scores in the recovery-related scales indicate good recovery activities
(Kellmann & Kallus, 2001).
The RESTQ-76 Sport 24-h test-retest reliability lies above r = 0.79, which implies that intra-
individual differences in recovery-stress states can be well produced (Kellmann & Kallus,
2001). The 24-h test-retest reliability of the Swedish version of the RESTQ-76 Sport,
translated from English version, was also relatively high, with Cronbach α values ranging
between 0.74 and 0.94 (unpublished data). The Swedish version of the RESTQ-76 Sport was
administered weekly to assess changes in subjectively perceived stress and recovery in the
previous training week. In addition baseline RESTQ-76 Sport scores were obtained pre-
normal period (Pre-N) and pre-block period (Pre-B). The RESTQ-76 Sport was filled in every
week at the same time of day. During the normal training period the athletes filled in the
questionnaire every 7th
day (on a rest day). During the block period the first and the third
week questionnaires were also filled in on the 7th
day (a rest day) and the second week
questionnaire was filled in on the 1st day of the week three since it was the first rest day after
the HIT shock week.
3.6 Statistical analysis
All analyses were conducted using SPSS for Windows software, version 20.0 (SPSS Inc.,
Chicago, Illinois, USA) and the level of statistical significance was set at p<0.05. Mean and
standard deviation (SD) were determined for stress, recovery and session RPE. ANOVA with
repeated measures was used to evaluate differences in scale scores among the different
measures taken (Pre-measures to week three). A post hoc test was used to identify the location
of the pairwise significant differences between training weeks, corrected using a Bonferroni
adjustment. A two-tailed paired t-test was used to determine differences between the
interventions (NT and BT).
24
Table 5. Dimensions and scales of the RESTQ-Sport (Kellmann & Kallus, 2001)
Dimension
(number of scales)
Scale
Description
General stress
(7 scales)
1 – General stress
Unspecific strain reaction
2 – Emotional stress
Anxiety, inhibitions and irritation
3 – Social stress
Frequency of arguments, fights, irritation concerning others, general upset
4 – Conflicts/pressure
Unsettled conflicts, unpleasant things and repetitive things.
5 – Fatigue
Disturbed work, over fatigue and lack of sleep
6 – Lack of energy
Deficiency in concentration, energy and decision-making.
7 – Physical complaints
Physical indisposition and physical complaints
General recovery
(5 scales)
8 – Success
Success related to performance in general
9 – Social recovery
Frequency of pleasurable social contacts, change combined with relaxation
and amusement.
10 – Physical Recovery
Physical recovery, physical well-being and fitness
11 – General well-being
Frequency of good mood and high well-being
12 – Sleep
Trouble in falling asleep and interrupted sleep
Sport-specific stress
(3 scales)
13 – Disturbed breaks
Defective recovery, pauses disturbed by situational aspects including the
other people
14 – Emotional exhaustion
Burnout, desire to quit
15 – Fitness/injury
Acute injury or vulnerability to injuries
Sport-specific recovery
(4 scales)
16 – Being in shape
Fitness, physical efficiency and vitality
17 – Burnout/Personal accomplishment
Feeling of integration in a team, good communication with team-mates, and
enjoyment in daily activities.
18 – Self-efficacy
Feeling of being well trained and optimally prepared
19 – Self-regulation
Use of mental skills to prepare, push, motivate and set goals
25
4. RESULTS
4.1 Session RPE
Session RPE increased significantly from the low-intensity week (B-1) to HIT shock week (B-
2) and decreased significantly again in the third week (B-3). No significant difference was
found between B-1 and B-3. No significant differences were found between N-1, N-2 and N-
3. During the low-intensity training weeks (B-1, B-3) session RPE was significantly lower
than the respective normal training weeks (N-1, N-3). During the HIT shock week (B-2) the
session RPE was significantly higher compared to the respective normal week (N-2) (Figure
3).
Figure 3. Mean (± SD) session RPE measured during the three-week training period for the
NT and BT interventions. *Significantly different from the Week 2 for the respective training
intervention. § Significantly different to the NT intervention for the respective week (p<0.05)
0
1
2
3
4
5
6
7
8
9
10
1 2 3
Ses
sion
RP
E
Week
Block
Normal
*§ *§
*§
26
4.2 Changes in stress-recovery state over time
No significant changes in the recovery-stress state (total recovery – total stress) were found
within the weeks and between the NT and BT (Figure 4).
Stress
Between the NT and BT the total stress score was significantly higher at B-2 compared to N-2
(p=0.001). Significant changes were observed for the general stress scales, the sport-specific
stress scales, and the sport-specific recovery scales. The general stress was significantly
higher at B-2 compared to N-2 (p=0.023). The sport-specific stress was significantly higher at
Pre-B compared to Pre-N (p=0.034), but after B-1 was significantly lower compared to N-1
(p=0.008) (Table 6).
During the three-week block training period the total stress score increased significantly after
B-2 compared to B-1 (p=0.021) and decreased significantly again after B-3 compared to B-2
(p=0.015). The sport-specific stress increased significantly at B-2 compared to B-1 (p=0.008)
and decreased significantly at B-3 compared to B-2 (p=0.016); there was also a significant
increase at B-2 compared to Pre-B (p=0.02).
During the three-week normal training period the total stress score was significantly higher
after N-1 compared to Pre-N (p=0.014). The sport-specific stress was significantly higher
after N-1 compared to Pre-N (p=0.041) and N-3 (p=0.047).
Recovery
No significant changes were found in the total recovery scores, both within the weeks and
between the NT and BT (Table 6). Between the NT and BT the sport-specific recovery was
significantly higher after N-1 compared to B-1 (p=0.011). Within the BT the sport-specific
recovery was significantly higher after B-2 compared to B-1 (p=0.004). Within the NT the
sport-specific recovery was significantly higher after N-1 (p=0.014) and N-2 (p=0.012)
compared to Pre-N.
27
Figure 4. Mean (± SD) recovery-stress (total recovery – total stress) state at the four time-
points during the three-week training period for NT and BT.
Table 6. Mean (± SD) total, general and sport-specific stress and recovery before the training
periods (Pre-N and Pre-B) and after the first (N-1 and B-1), second (N-2 and B-2) and third
(N-3 and B-3) training weeks for NT and BT. *Significantly different from the previous
measure for the respective intervention. §Significantly different from the Pre-measure for the
respective intervention. ≦Significantly different from the Week 1 for the respective
intervention. ǂSignificantly different from the BT for the respective week.
Pre-measure Week 1 Week 2 Week 3
Stress
Total score NT 7.60 ± 4.31 9.99 ± 5.03* 8.20 ± 4.67ǂ 8.30 ± 4.40
BT 8.53 ± 4.37 7.85 ± 4.51 11.09 ± 6.20* 7.65 ± 4.36*
General scales NT 5.90 ± 3.73 7.34 ± 4.01 6.05 ± 3.64ǂ 6.39 ± 3.23
BT 6.33 ± 2.98 6.07 ± 3.63 7.32 ± 4.10 5.57 ± 3.44*
Sport-specific scales NT 1.71 ± 0.84ǂ 2.65 ± 1.49*ǂ 2.15 ± 1.50 1.91 ± 1.38≦
BT 2.21 ± 1.57 1.78 ± 1.25 3.76 ± 2.40*§ 2.07 ± 1.22*
Recovery
Total score NT 28.62 ± 5.45 29.19 ± 5.84 30.88 ± 6.22 30.07 ± 5.60
BT 29.68 ± 3.83 28.60 ± 5.05 31.46 ± 4.25 30.32 ± 4.94
General Recovery NT 17.18 ± 3.07 16.38 ± 3.55 17.78 ± 3.46 17.26 ± 3.10
BT 17.54 ± 2.39 17.10 ± 2.80 17.25 ± 2.11 17.97 ± 2.59
Sport-specific scales NT 11.44 ± 2.82 12.81 ± 2.74*ǂ 13.10 ± 3.13§ 12.81 ± 2.78
BT 12.13 ± 2.43 11.50 ± 2.55 14.21 ± 2.66* 12.35 ± 2.56
0
5
10
15
20
25
30
35
PRE Week 1 Week 2 Week 3
∑T
ota
l re
cov
ery
-∑
To
tal
stre
ss
Block
Normal
28
4.3 Specific changes in recovery-stress state scales
Normal training compared to block training
Fatigue (p=0.03) and Emotional Exhaustion (p=0.024) were significantly lower at Pre-N
compared to Pre-B. The only recovery-related score that was significantly higher at Pre-NT
compared to Pre-B was Self-Regulation (p=0.014) (Table 7).
After the first training week NT had significantly higher scores in stress-related subscales for
Physical Complaints (p=0.035), Emotional Exhaustion (p=0.037) and Fitness/Injury
(p=0.001) and significantly lower, recovery-related subscale for Self-Regulation (p=0.001)
compared to BT.
After the second training week BT showed significantly higher results in General Stress
(p=0.038), Fatigue (p=0.04), Physical Complaints (p<0.001), Fitness/Injury (p<0.001) and
Self-Regulation (p=0.017) compared to NT. The HIT shock week (B-2) comparison with the
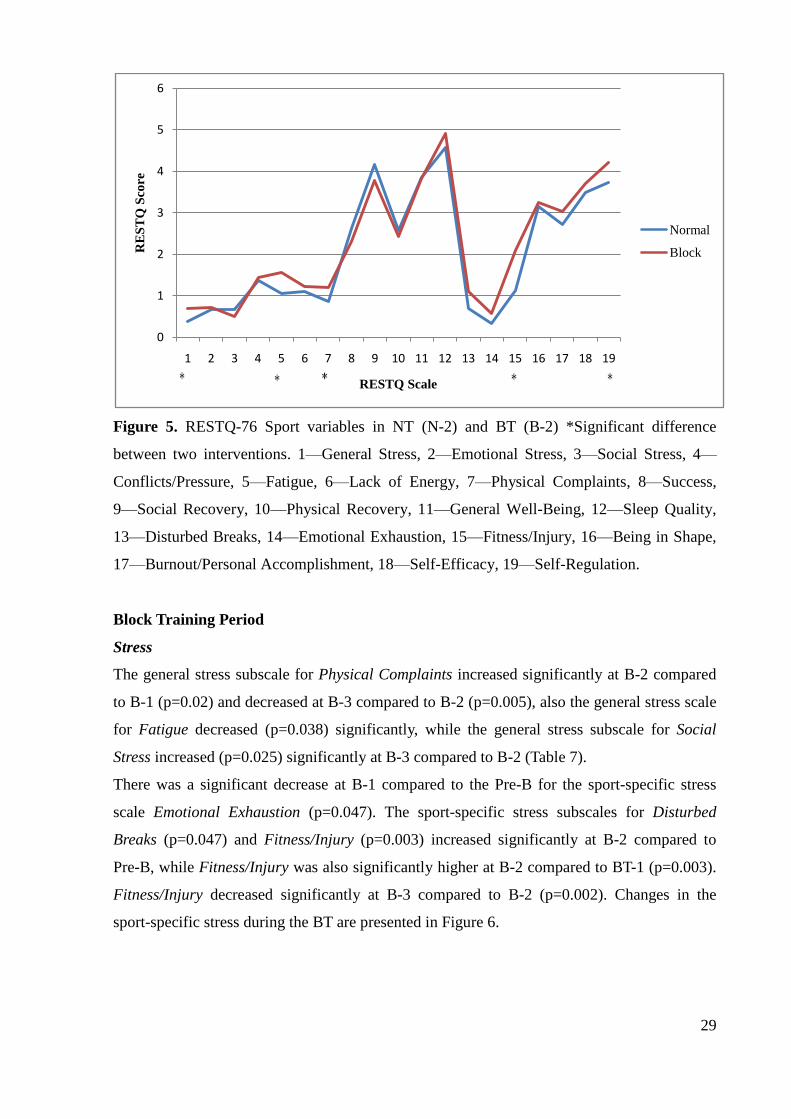
respective NT week (N-2) of all the RESTQ-76 Sport scales are presented in Figure 5.
After the third training week General-Well Being (p=0.046) and Burnout/Self-Accomplishment
(p=0.029) were significantly higher at B-3 compared to N-3, and Self-Regulation (p=0.001)
was higher at N-3 compared to B-3.
29
Figure 5. RESTQ-76 Sport variables in NT (N-2) and BT (B-2) *Significant difference
between two interventions. 1—General Stress, 2—Emotional Stress, 3—Social Stress, 4—
Conflicts/Pressure, 5—Fatigue, 6—Lack of Energy, 7—Physical Complaints, 8—Success,
9—Social Recovery, 10—Physical Recovery, 11—General Well-Being, 12—Sleep Quality,
13—Disturbed Breaks, 14—Emotional Exhaustion, 15—Fitness/Injury, 16—Being in Shape,
17—Burnout/Personal Accomplishment, 18—Self-Efficacy, 19—Self-Regulation.
Block Training Period
Stress
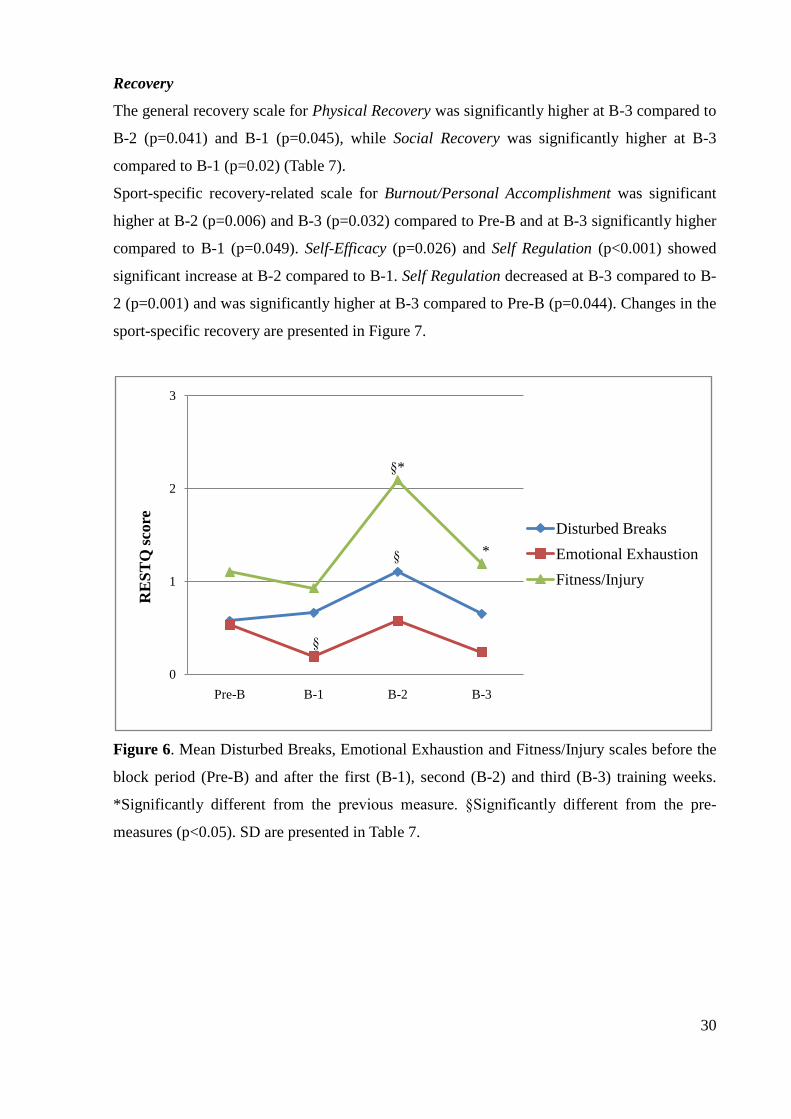
The general stress subscale for Physical Complaints increased significantly at B-2 compared
to B-1 (p=0.02) and decreased at B-3 compared to B-2 (p=0.005), also the general stress scale
for Fatigue decreased (p=0.038) significantly, while the general stress subscale for Social
Stress increased (p=0.025) significantly at B-3 compared to B-2 (Table 7).
There was a significant decrease at B-1 compared to the Pre-B for the sport-specific stress
scale Emotional Exhaustion (p=0.047). The sport-specific stress subscales for Disturbed
Breaks (p=0.047) and Fitness/Injury (p=0.003) increased significantly at B-2 compared to
Pre-B, while Fitness/Injury was also significantly higher at B-2 compared to BT-1 (p=0.003).
Fitness/Injury decreased significantly at B-3 compared to B-2 (p=0.002). Changes in the
sport-specific stress during the BT are presented in Figure 6.
0
1
2
3
4
5
6
1 2 3 4 5 6 7 8 9 10 11 12 13 14 15 16 17 18 19
RE
ST
Q S
core
RESTQ Scale
Normal
Block
30
Recovery
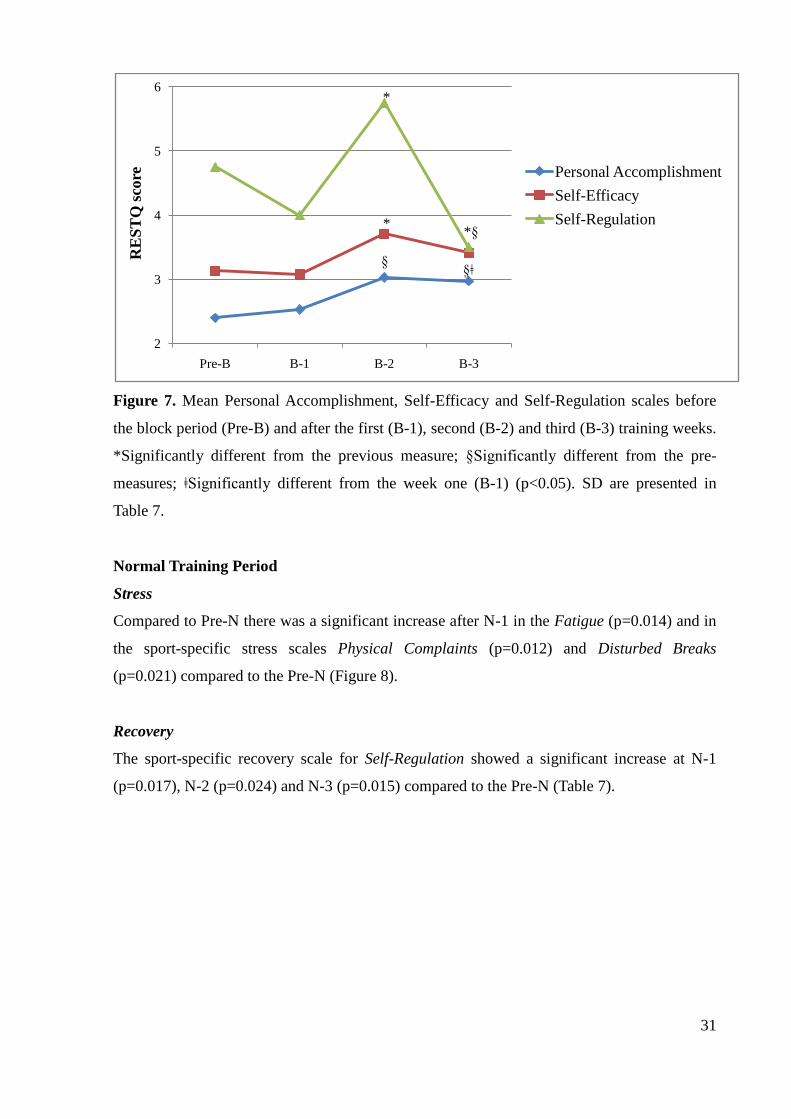
The general recovery scale for Physical Recovery was significantly higher at B-3 compared to
B-2 (p=0.041) and B-1 (p=0.045), while Social Recovery was significantly higher at B-3
compared to B-1 (p=0.02) (Table 7).
Sport-specific recovery-related scale for Burnout/Personal Accomplishment was significant
higher at B-2 (p=0.006) and B-3 (p=0.032) compared to Pre-B and at B-3 significantly higher
compared to B-1 (p=0.049). Self-Efficacy (p=0.026) and Self Regulation (p<0.001) showed
significant increase at B-2 compared to B-1. Self Regulation decreased at B-3 compared to B-
2 (p=0.001) and was significantly higher at B-3 compared to Pre-B (p=0.044). Changes in the
sport-specific recovery are presented in Figure 7.
Figure 6. Mean Disturbed Breaks, Emotional Exhaustion and Fitness/Injury scales before the
block period (Pre-B) and after the first (B-1), second (B-2) and third (B-3) training weeks.
*Significantly different from the previous measure. §Significantly different from the pre-
measures (p<0.05). SD are presented in Table 7.
0
1
2
3
Pre-B B-1 B-2 B-3
RE
ST
Q s
core
Disturbed Breaks
Emotional Exhaustion
Fitness/Injury
§*
§
§
*
31
Figure 7. Mean Personal Accomplishment, Self-Efficacy and Self-Regulation scales before
the block period (Pre-B) and after the first (B-1), second (B-2) and third (B-3) training weeks.
*Significantly different from the previous measure; §Significantly different from the pre-
measures; ǂSignificantly different from the week one (B-1) (p<0.05). SD are presented in
Table 7.
Normal Training Period
Stress
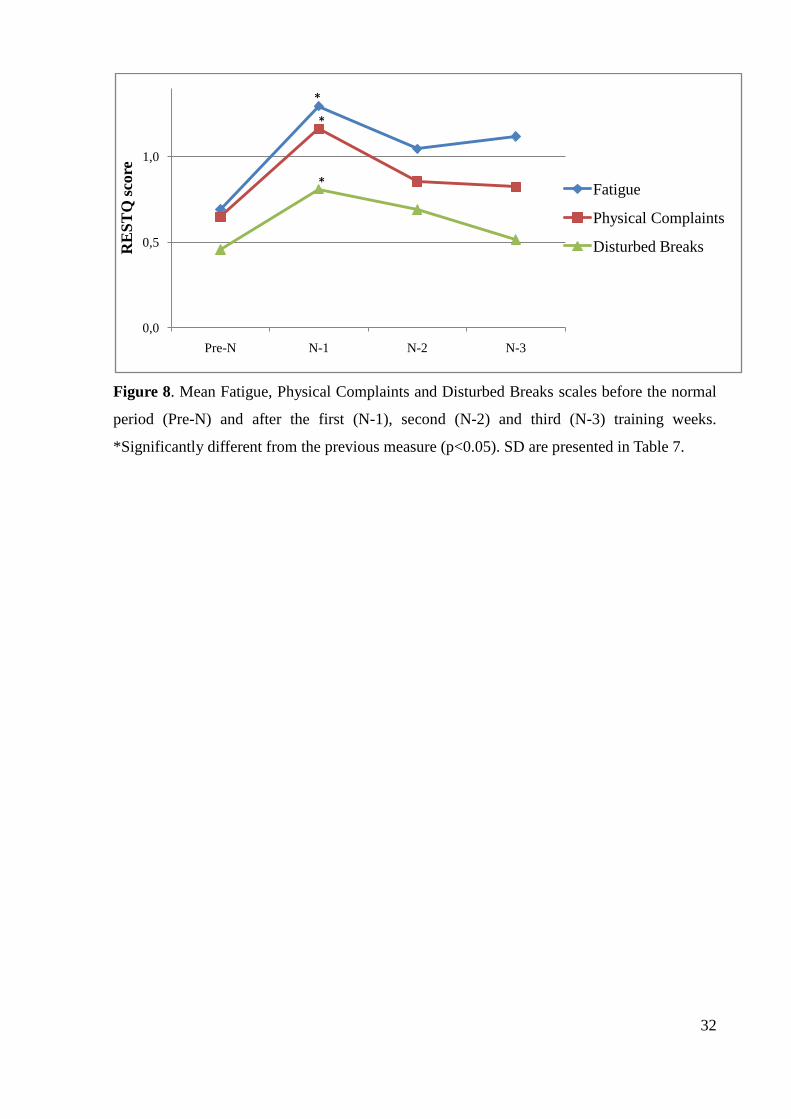
Compared to Pre-N there was a significant increase after N-1 in the Fatigue (p=0.014) and in
the sport-specific stress scales Physical Complaints (p=0.012) and Disturbed Breaks
(p=0.021) compared to the Pre-N (Figure 8).
Recovery
The sport-specific recovery scale for Self-Regulation showed a significant increase at N-1
(p=0.017), N-2 (p=0.024) and N-3 (p=0.015) compared to the Pre-N (Table 7).
2
3
4
5
6
Pre-B B-1 B-2 B-3
RE
ST
Q s
core Personal Accomplishment
Self-Efficacy
Self-Regulation*
*
§
*§
§ǂ
32
Figure 8. Mean Fatigue, Physical Complaints and Disturbed Breaks scales before the normal
period (Pre-N) and after the first (N-1), second (N-2) and third (N-3) training weeks.
*Significantly different from the previous measure (p<0.05). SD are presented in Table 7.
0,0
0,5
1,0
Pre-N N-1 N-2 N-3
RE
ST
Q s
core
Fatigue
Physical Complaints
Disturbed Breaks
*
*
*
33
Table 7. Mean (± SD) RESTQ-76 Sport subscales of stress and recovery measured in normal and block training periods. §Significantly
different to Pre-measure (p<0.05). * Significantly different to previous measure (p<0.05). ǂ Significantly different to week 1 (p<0.05).
≦Significantly different between NT and BT periods (p<0.05).
Measure Baseline
Week 1
Week 2 Week 3
Pre-N Pre-B N-1 B-1 N-2 B-2 N-3 B-3
General stress
General stress 0.62 ± 1.19 0.46 ± 0.50 0.63 ± 0.83 0.50 ± 0.58 0.37 ± 0.52≦ 0.69 ± 0.66 0.54 ± 0.52 0.37 ± 0.49
Emotional stress 0.69 ± 0.57 0.86 ± 0.52 0.75 ± 0.82 0.74 ± 0.68 0.66 ± 0.58 0.72 ± 0.57 0.78 ± 0.49 0.69 ± 0.56
Social stress 0.66 ± 0.47 0.65 ± 0.53 0.65 ± 0.52 0.72 ± 0.68 0.66 ± 0.78 0.50 ± 0.54 0.65 ± 0.67 0.71 ± 0.60*
Conflict/Pressure 1.26 ± 0.87 1.22 ± 0.60 1.50 ± 0.90 1.31 ± 0.95 1.36 ± 0.80 1.44 ± 0.89 1.33 ± 0.68 1.13 ± 0.83
Fatigue 0.69 ± 0.46≦ 1.09 ± 0.68 1.29 ± 0.65§ 0.97 ± 0.68 1.04 ± 0.64≦ 1.56 ± 1.12 1.12 ± 0.77 0.93 ± 0.64*
Lack of energy 1.32 ± 0.78 1.18 ± 0.59 1.35 ± 0.68 1.16 ± 0.60 1.10 ± 0.66 1.22 ± 0.60 1.15 ± 0.55 1.04 ± 0.64
Physical complaints 0.65 ± 0.70 0.88 ± 0.64 1.16 ± 0.80§≦ 0.68 ± 0.65 0.85 ± 0.63≦ 1.19 ± 0.67* 0.82 ± 0.62 0.71 ± 0.53*
Sport-specific stress
Disturbed breaks 0.46 ± 0.52 0.57 ± 0.68 0.81 ± 0.70§ 0.66 ± 0.66 0.69 ± 0.65 1.10 ± 0.99§ 0.51 ± 0.66 0.65 ± 0.59
Emotional exhaustion 0.21 ± 0.33≦ 0.53 ± 0.49 0.35 ± 0.39≦ 0.19 ± 0.23§ 0.34 ± 0.37 0.57 ± 0.67 0.32 ± 0.35 0.24 ± 0.34
Fitness/injury 1.04 ± 0.57 1.10 ± 0.86 1.49 ± 0.97≦ 0.93 ± 0.79 1.12 ± 0.88≦ 2.09 ± 1.25§* 1.07 ± 0.77 1.19 ± 0.80*
General recovery
Success 2.40 ± 0.70 2.40 ± 0.56 2.37 ± 0.90 2.59 ± 0.90 2.63 ± 0.92 2.31 ± 0.46 2.51 ± 0.70 2.46 ± 0.75
Social recovery 3.71 ± 0.84 3.85 ± 0.82 3.82 ± 0.76 3.63 ± 0.55 4.16 ± 0.82 3.78 ± 0.63 3.84 ± 0.56 3.94 ± 0.48ǂ
Physical recovery 2.59 ± 0.58 2.59 ± 0.65 2.21 ± 0.55 2.40 ± 0.67 2.57 ± 0.71 2.43 ± 0.57 2.60 ± 0.84 2.78 ± 0.57*ǂ
General well-being 3.84 ± 1.10 3.90 ± 0.90 3.74 ± 1.04 3.74 ± 1.02 3.84 ± 0.91 3.82 ± 0.93 3.71 ± 0.91≦ 3.96 ± 0.81
Sleep quality 4.65 ± 1.07 4.81 ± 0.92 4.25 ± 1.28 4.75 ± 0.93 4.57 ± 1.11 4.91 ± 0.84 4.60 ± 1.03 4.84 ± 0.77
Sport-specific Recovery
Being in shape 2.75 ± 0.75 3.04 ± 1.09 2.91 ± 0.91 3.10 ± 0.98 3.16 ± 1.03 3.25 ± 0.96 3.07 ± 0.78 3.01 ± 0.68
Burnout/Personal accompl. 2.49 ± 1.02 2.40 ± 1.01 2.75 ± 0.77 2.53 ± 1.00 2.72 ± 1.13 3.03 ± 0.99§ 2.56 ± 1.14≦ 2.97 ± 0.90§ǂ
Self-efficacy 3.23 ± 1.11 3.13 ± 1.04 3.37 ± 1.10 3.07 ± 0.99 3.50 ± 0.99 3.71 ± 0.97* 3.51 ± 0.97 3.41 ± 0.97
Self-regulation 2.97 ± 1.19≦ 3.56 ± 1.01 3.78 ± 0.95§≦ 2.79 ± 1.14 3.72 ± 1.02§≦ 4.22 ± 0.93* 3.66 ± 1.09§≦ 2.96 ± 1.20§*
34
5. DISCUSSION
The aim of the current study was to evaluate the impact of BT on the junior cross-country
skiers’ perceived recovery-stress states and compares it with NT. The main finding was that
although several small changes in stress and recovery subscales appeared, cross-country
skiers maintained the balance between the stress and recovery within the block and normal
training and no significant differences between two periodization models recovery-stress
states occurred.
The training intensity quantification used in the current study was the session RPE method
developed by Foster et al. (2001). The session RPE represents a single global rating of the
intensity for the entire session. According to Seiler and Kjerland (2006) session RPE may also
be useful in capturing changes in exercise stress that are not only due to the acute intensity,
but also because of the duration of a single session, the background of the training load and
accumulated fatigue experienced by the athlete. In the current study, during normal training
the weekly session RPE was stable, showing that similar training loads and intensities from
week to week leads to minimal changes in the average weekly session RPE. By contrast,
during block training the session RPE changed significantly from week to week. Two low-
intensity training weeks (B-1 and B-3) had similar, relatively low session RPE scores
(moderate to somewhat hard), while the HIT shock week (B-2) showed high session RPE
scores. The average HIT shock week score (8.0 ± 0.8) is similar to the average hard training
session scores (7.4 ± 0.8) measured in a study with well-trained Norwegian junior cross-
country skiers (Seiler & Kjerland, 2006). The results of our study are in agreement with
Foster et al. (2001) and Seiler and Kjerland (2006) showing session RPE to be a practical
method of monitoring daily training intensity due to it is sensitivity to changes in training
intensity over a variety of exercise sessions. Also, this method is easy to use and does not take
much time, which makes it convenient monitoring method for coaches and athletes.
According to Kellmann (2002, 2010), to reach the optimal recovery-stress state the increased
stress must co-occur with the increasing recovery and athletes must self-initiate recovery
activities to balance stress state. From this perspective athletes are responsible for their
recovery activities, and can actively initiate them. For example, going to a movie, visiting
close friends, going for a light run can be self-initiated, therefore, proactively put a person in
35
charge. This situation may appeared in the current study during the HIT shock week, the total
stress score and the sport-specific stress were significantly higher after the HIT shock week
compared to B-1 and B-3, although the total recovery score was not significantly higher,
significantly increased the sport-specific recovery during the HIT shock week compared to B-
1, which helped to hold the total recovery high. Therefore, the recovery-stress state was
maintained stable during the HIT shock week. This indicates that athletes were able to cope
with the training induced stress during the HIT shock week by increasing recovery efforts.
Several previous studies have found a dose-response relationship between increased training
load and subjective assessment of stress and recovery, concluding that after increased training
loads stress-related scores increase and recovery-related scores decrease (Coutts et al., 2007;
Filaire et al., 2009; Gonzalez-Boto et al., 2008; Jürimäe et al., 2002a; Mäestu et al., 2006;
Nederhof et al., 2008). These results are not in agreement with the current results, which
showed no decrease in recovery-related scores. However, in all of the previous studies the
training load increase was achieved by increasing training volume, not intensity. According to
my knowledge, no studies have measured the recovery-stress state over a HIT shock week.
Gonzalez-Boto et al. (2008) measured the recovery-stress state after a period of increased
intensity and 25% lowered volume and showed improvements in the recovery related
subscales. The reason for this might be that high intensity and low volume result in higher
quality training with a potential improvement in performance and this may influence an
athlete’s motivation and self-efficacy perception during the training. Discussions with the
athletes during the study support the results from the sport-specific recovery scales (increased
Self-Efficacy and Self-Regulation), with athletes mentioning that it is mentally easier to push
themselves and be motivated during the HIT shock week when the focus is solely on interval
trainings.
Comparing the HIT shock week with the corresponding NT week the total stress and the
general stress were significantly higher after the HIT shock week compared to N-2.
Significantly higher subscales were General Stress, Fatigue, Physical Complaints and
Fitness/Injury. Higher stress-related scales did not affect the perceived recovery-stress state,
because the total recovery was relatively high, therefore no significant difference between NT
and BT recovery-stress states appeared, which may indicate that athletes tolerated the 7-day
HIT shock week. Although a large change or increase in training load, like it was present
during a HIT shock week may lead to OR or even to OT (Budgett, 1998). The athletes in the
current study were able to maintain the balance between the stress and recovery, but same
36
increased stress-related scores have also been reported in previous studies, when the training
load was increased Physical Complaints (Coutts et al., 2007; Jürimäe et al., 2002a; Mäestu et
al., 2006) Fitness/Injury (Coutts et al., 2007; Gonzalez-Boto et al., 2008; Jürimäe et al.,
2002b; Mäestu et al., 2006) and Fatigue (Jürimäe et al., 2002a; Jürimäe et al., 2002b; Mäestu
et al., 2006) increased. In contrast to the current study they reported also a lowered recovery
scores. Higher Fatigue, Physical Complaints and Fitness/Injury were related to OR. Although
in the current study the lowered scores in recovery was not reported the higher stress-related
scores after the HIT shock week compared to low-intensity weeks and NT may warn that if
the intensity had been high over a longer period signs of OR had appeared.
As previous HIT shock studies (Breil et al., 2010; Wahl et al., 2013), we do not know how
many HIT sessions are tolerable. Further research is needed to investigate in which point the
OR appears during a HIT shock microcycle.
The week following to the HIT shock week showed a decrease in the total stress score, the
general and sport-specific stress. Almost every stress-associated subscale decreased after B-3
compared to the HIT shock week, significantly decreased Physical Complaints, Fatigue and
Fitness/Injury. Significant differences between the BT and NT are not present anymore after
the third training week in stress-related scores as it was after the previous week. These
changes after the third week suggest that one week with low intensity trainings was a
sufficient period of restoration of psychological stress measures to normal levels. Previous
studies about increased training volumes (Coutts et al., 2007; Mäestu et al., 2006) and a
follow-up study after 24 h ultra-marathon (Nicolas et al., 2011) have reported that two weeks
of taper is sufficient for restoration. Another HIT shock study suggested that a period of more
than 7 days could be necessary to allow complete recovery after a demanding HIT shock
microcycle. These previous results together with the current study may indicate that recovery
time needed after an increased high-intensity training period is shorter compared to the
recovery time needed after increasing training volume or after a long endurance competition.
During the NT the recovery-stress state did not changed significantly. After the first training
week the total stress and the sport-specific stress were significantly higher compared to the
pre-normal training measures. Increases in stress-related scores did not significantly affect the
recovery-stress state since the sport-specific recovery increase co-occurred with stress
increase. This indicates again that athletes were able to cope with the training induced stress
by increasing recovery efforts. The reason for increases in the stress-related subscales after
37
only the first week could be due to a low intensity prior to the pre-measures. Therefore, the
first week may have been increased total stress compared with previous week, but they
adapted to the training program after the first week and stress-related scores ceased to be
higher further.
The sport-specific subscale for Self-Regulation showed most significant variations during the
study period. During the normal training period Self-Regulation was stable, but all three NT
weeks had significantly higher scores compared to Pre-N. Self-Regulation during the HIT
shock week was significantly higher compared to low intensity weeks (B-1 and B-3) and to
respective normal training week (N-2). On the other hand, normal training weeks (N-1 and N-
3) had significantly higher Self-Regulation compared to respective block training weeks (B-1
and B-3) According to Kellmann and Kallus (2001) Self-Regulation refers to the use of
psychological skills when preparing for performance (e.g., goal setting, mental training,
motivation). This indicates that during the increased training intensity the athletes started to
self-initially use more mental skills to prepare themselves for trainings to tolerate increased
intensity, because no psychological training and goal setting/motivation skills were enforced by
conversations between the coaches and athletes. In conclusion, high Self-Regulation may play
important role in athlete’s performance to tolerate increased training loads.
The large between-athlete variation for each of the RESTQ-76 Sport scales, as shown by the
SD of each measure (Table 7), confirms inter-individual differences in adaption to training
load. Inter-individual differences may be in recovery potential, exercise capacity, non-training
stressors and stress tolerance. Non-training stressors like lifestyle (e.g., sleep, daily schedule,
nutrition, leisure activities, etc.), state of health (e.g., cold, fever, infections, etc.) and
environment (e.g., family, roommates, social contacts, school, etc.) affect athlete’s
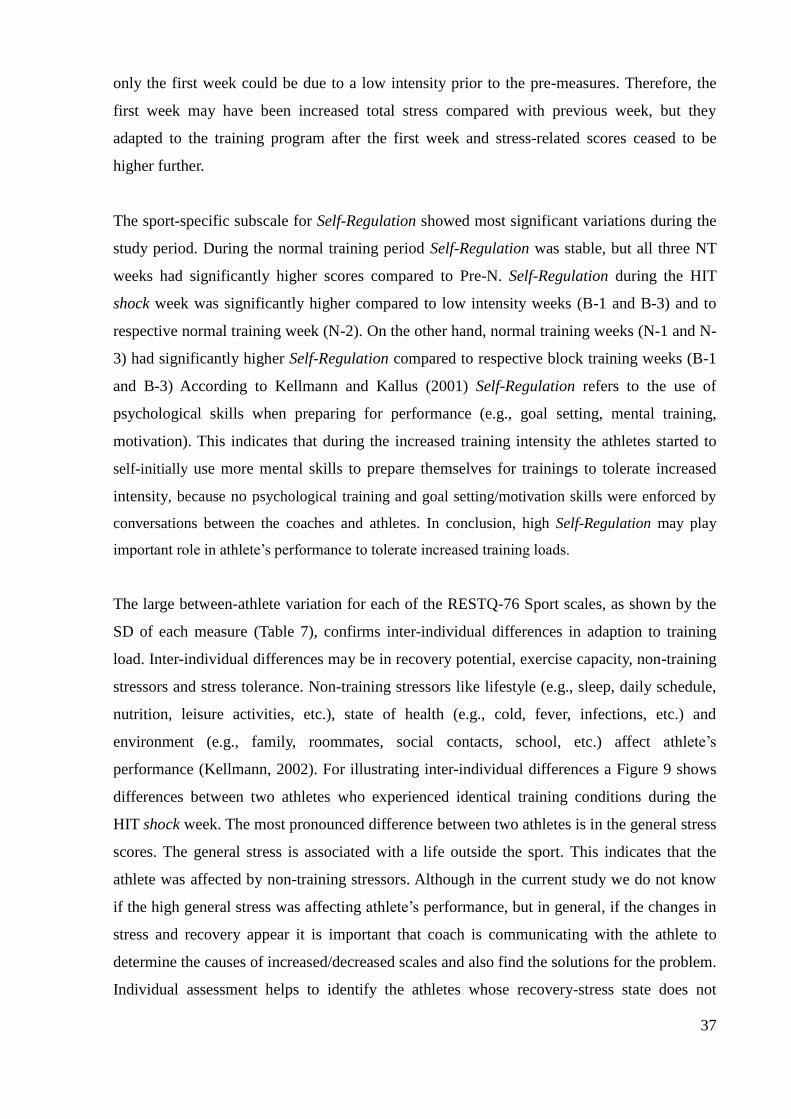
performance (Kellmann, 2002). For illustrating inter-individual differences a Figure 9 shows
differences between two athletes who experienced identical training conditions during the
HIT shock week. The most pronounced difference between two athletes is in the general stress
scores. The general stress is associated with a life outside the sport. This indicates that the
athlete was affected by non-training stressors. Although in the current study we do not know
if the high general stress was affecting athlete’s performance, but in general, if the changes in
stress and recovery appear it is important that coach is communicating with the athlete to
determine the causes of increased/decreased scales and also find the solutions for the problem.
Individual assessment helps to identify the athletes whose recovery-stress state does not
38
correspond to the training schedule, through early intervention, individual training can be
adapted in order to help the athlete to deal with training stress, optimize recovery and
subsequently prevent OT. RESTQ-76 Sport does not provide final diagnosis if an athlete is
OT, it is better suited to identifying athletes at risk of OT (Kellmann, 2010).
Figure 9. The RESTQ-76 Sport profiles of two athletes after HIT week (B-2). For explanation
of RESTQ-76 Sport scales, see Figure 7.
A limitation of the current study is that only subjective measures were taken to evaluate the
impact of different periodization models on athletes’ stress and recovery. Adding an objective
measure like performance test would give a better picture of the influences of HIT shock week
to athletes’ performance. Another limitation is that the study period was short, longitudinal
monitoring would probably show better how athletes’ recovery-stress states are responding to
the different periodization models.
In conclusion, the RESTQ-76 Sport showed several small changes in the stress and recovery
subscales, but well-trained junior cross-country skiers maintained the balance in recovery-
stress states during the block and normal training period and no significant difference between
block and normal training recovery-stress states occurred. The session RPE was a sensitive
marker to the changes in training intensity, which confirms its good practical value for
monitoring training load.
0
1
2
3
4
5
6
1 2 3 4 5 6 7 8 9 10 11 12 13 14 15 16 17 18 19
RES
TQ s
core
RESTQ scale
Athlete 1
Athlete 2
39
6. CONCLUSIONS
Although RESTQ-76 Sport showed several small changes in stress and recovery
subscales, well-trained junior cross-country skiers maintained a balance in recovery-
stress states during the normal and block training.
The recovery-stress states did not differ between the normal and block training.
Session RPE was a sensitive marker to the changes in training intensity during block
and normal training.
40
7. REFERENCES
1. Achten J & Jeukendrup E. Heart Rate Monitoring: Applications and Limitations. Sports
Med 2003; 33: 517-538
2. Billat Veronique L. Interval Training for Performance: A Scientific and Empirical Practice.
Special Recommendations for Middle- and Long-Distance Running. Part I: Aerobic
Interval Training. Sports Med 2001; 31: 13-31
3. Bompa TO. Periodization: theory and methodology of training. Champaign, IL: Human
Kinetics 1999
4. Bompa TO & Haff G. Periodization: Theory and Methodology of training. Champaign,
IL: Human Kinetics 2009
5. Bresciani G, Cuevas MJ, Mollinero O, Almar M et al. Signs of Overload After Intensified
Training. Int J Sports Med 2011; 32: 338-343
6. Breil FA, Weber SN, Koller S, Hoppeler H & Vogt M. Block Training Periodization in
Alpine Skiing: Effects of 11-day HIT on VO2max and Performance. Eur J Appl Physiol
2010; 109: 1077-1086
7. Brink MS, Visscher C, Arends S, Zwerver J et al. Monitoring Stress and Recovery: New
Insights for the Prevention of Injuries and Illnesses in Elite Youth Soccer Players. Br J
Sports Med 2010; 44: 809-815
8. Brink MS, Visscher C, Coutts AJ & Lemmink KAPM. Changes in Perceived Stress and
Recovery in Overreached Young Elite Soccer Players. Scand J Med Sci Sports 2012; 22:
285-292
9. Buchheit M & Laursen PB. High-Intensity Interval Training, Solutions to The
Programming Puzzle. Part I: Cardiopulmonary Emphasis. Sports Med 2013: Mar 29.
[Epub ahead of print]
10. Budgett R. Fatigue and Underperformance in Athletes: the Overtraining Syndrome. Br J
Sports Med 1998; 32: 107-110
11. Coutts AJ, Wallace LK & Slattery KM. Monitoring Changes in Performance Physiology,
Biochemistry, and Psychology during Overreaching and Recovery in Triathletes. Int J
Sports Med 2007; 28: 125-134
12. Faude O, Meyer T, Scharhag J, Weins F, Urhausen A & Kindermann W. Volume vs.
Intensity in the Training of Competitive Swimmers. Int J Sports Med 2008; 29: 906-12
13. Filaire E., Rouveix M., & Duclos M. Training and 24-hr Urinary Catecholamine
Exerction. Int J Sports Med 2009; 30: 33-39
41
14. Foster C, Florhaug JA, Franklin J, Gottschall L et al. A New Approach to Monitoring
Exercise Training. J Strength Cond Res 2001; 15(1): 109-115
15. Garcia-Pallares J, Garcia-Fernandez M et al. Performance Changes in World-Class
Kayakers Following Two Different Training Periodization Models. Eur J Appl Physiol
2010; 110: 99-107
16. Gleeson M. Review Article: Biochemical and Immunological Markers of Overtraining. J
Sports Sci and Med 2002; 1: 31-41
17. Gleeson M & Robson-Ansley P. Immune Responses to Intensified Training and
Overtraining. In: Gleeson M (Ed.) Immune Function in Sport and Exercise. Elsevier Ltd.
2006, 115-138
18. Gonzalez-Boto R, Salguero A, Tuero C, Gonzalez-Gallego J & Marquez S. Monitoring the
Effect of Training Load Changes on Stress and Recovery in Swimmers. J Physiol
Biochem 2008; 64: 19-26
19. Halson SL & Jeukendrup AE. Does Overtraining Exist? An Analysis of Overreaching and
Overtraining Research. Sports Med 2004; 34: 967-981
20. Hoogeveen AR & Zonderland ML. Relationship between Testosterone, Cortisol and
Performance in Professional Cyclists. Int J Sports Med 1996; 17: 423-428
21. Issurin VB. New Horizons for the Methodology and Physiology of Training Periodization.
Sports Med 2010; 40 (3): 189-206
22. Issurin VB & Dreshman R. Alternative Approach to Training for Endurance Athletes:
Block Periodization. In: Mujika I (Ed.) Endurance Training – Science and Practice,
Unknown Publisher, 2012, p. 12-19
23. Jürimäe J, Mäestu J, Purge P, Jürimäe T & Sööt T. Relations among heavy training stress,
mood state, and performance for male junior rowers. Percept Mot Skills 2002a; 95: 520-
526
24. Jürimäe J, Purge P, Mäestu J, Sööt T & Jürimäe T. Monitoring of Stress in Trained Male
Rowers. Journal of Human Kinetics 2002b; 7: 11-18
25. Kellmann M. Review: Preventing Overtraining in Athletes in High-Intensity Sports and
Stress/Recovery Monitoring. Scand J Med Sci Sports 2010; 20: 95-102
26. Kellmann M & Günther KD. Changes in Stress and Recovery in Elite Rowers During
Preparation for the Olympic Games. Med Sci Sports Exerc 2000; 32: 676-683
27. Kellmann M & Kallus KW. The Recovery-Stress Questionnaire for Athletes. User
Manual. Champaign, IL: Human Kinetics, 2001
28. Kellmann M. Underrecovery and Overtraining: Different Concepts-Similar Impact? In:
42
Kellmann M (Ed.) Enhancing Recovery: Preventing Underperformance in Athletes,
Champaign, IL: Human Kinetics, 2002, p. 3-24
29. Kenttä G & Hassmen P. Overtraining and Recovery: A Conceptual Model. Sports Med
1998; 26: 1-16
30. Kreider R, Fry AC, & O’Toole M. Overtraining in sport: terms, definitions, and
prevalence. In: Kreider R, Fry AC, and O’Toole M. (Eds.) Overtraining in Sport,
Champaign, IL: Human Kinetics, 1998, p. vii–xi.
31. Laursen PB & Jenkins DG. The Scientific Basis for High-Intensity Interval Training:
Optimising Training Programmes and Maximising Performance in Highly Trained
Endurance Athletes. Sports Med 2002; 32: 53-73
32. Laursen PB. Review: Training for Intense Exercise Performance: High-Intensity or High-
Volume Training? Scand J Med Sci Sports 2010; 20: 1-10
33. Londeree BR. Effect of Training on Lactate/Ventilatory Thresholds: A Meta-Analysis.
Med Sci Sports Exerc 1997; 29: 837-43
34. Losnegard T, Mikkelsen K, Ronnestad BR, Hallen J et al. The Effect of Heavy Strength
Training on Muscle Mass and Physical Performance in Elite Cross Country Skiers. 2011;
21 (3): 389-401
35. Meeusen R, Duclos M, Foster C, Fry A et al. Prevention, diagnosis and the treatment of
the Overtraining Syndrome: Joint Consensus Statement of the European College of Sports
Science and the American College of Sports Medicine. Med Sci Sports Exerc. 2013; 45:
186-205
36. Meeusen R, Nederhof E, Buyse L, Roelands B et al. Diagnosing Overtraining in Athletes
Using The Two-Bout Exercise Protocol. Br J Sports Med 2010; 44: 642-648
37. Meeusen R, Piacentini MF, Busschaert B, Buyse L et al. Hormonal Responses in Athletes:
the Use of a Two Bout Exercise Protocol to Detect Subtle Differences in (Over)training
Status. Eur J Appl Physiol. 2004; 91: 140–146
38. Morgan W, Brown D, Raglin J, O´Connor P et al. Psychological Monitoring of
Overtraining and Staleness. Br J Sports Med 1987; 21: 107-14
39. Mäestu J, Jürimäe J, Kreegipuu K & Jürimäe T. Changes in Percieved Stress and
Recovery During Heavy Training in Highly Trained Male Rowers. The Sport Psychologist
2006; 20: 24-39
40. Nederhof E, Zwerver J, Brink M, Meeusen R & Lemmink K. Different Diagnostic Tools
fo Nonfunctional Overreaching. Int J Sports Med 2008; 29: 590-597
41. Nicolas M, Banizette M & Millet G.Y. Stress and Recovery States After a 24-h Ultra
43
Marathon Race: A One-Month Follow- up Study. Psychology of Sport and Exercise 2011;
12:368-374
42. O’Toole M. Overreaching and Overtraining in Endurance Athletes. In: Overtraining in
Sport, edited by Kreider R, Fry AC, and O’Toole M. Champaign, IL: Human Kinetics,
1998, p. 3-17
43. Rietjens GJWM, Kuipers H, Adam JJ, Saris WHM et al. Physiological, Biochemical and
Psychological Markers of Strenuous Training-Induced Fatigue. Int J Sports Med 2005; 26:
16-26
44. Rushall BS. A Tool for Measuring Stress Tolerance in Elite Athletes. J Appl Sport
Psychol 1990; 2: 51–66
45. Rusko H. Cross Country Skiing. Oxford, UK: Blackwell Science Ltd, 2003
46. Seiler KS & Kjerland GO. Quantifying Training Intensity Distribution in Elite Endurance
Athletes: Is There Evidence of An ―Optimal‖ Distribution? Scand J Med Sci Sports 2006;
16: 49-56
47. Smith DJ. A Framework for Understanding the Training Process Leading to Elite
Performance. Sports Med 2003; 15: 1103-1126
48. Stolen T, Chamari K, Castagna C & Wisloff U. Physiology of Soccer: An Update. Sports
Med 2005; 35: 501–536
49. Urhausen A, Gabriel HHW, Weiler B & Kindermann. Ergometric and Psychological
Findings During Overtraining: A Long-Term Follow-Up Study in Endurance Athletes. Int
J Sports Med 1998; 19:114-120
50. Urhausen A & Kindermann W. Diagnosis of Overtraining: What Tools Do We Have?
Sports Med 2002; 32: 95-102
51. Viru A & Viru M. Biomechanical Monitoring of Sport Training. Champaign, IL: Human
Kinetics, 2001
52. Wahl P, Zinner C, Grosskopf C, Rossmann R et al. Passive Recovery is Superior to Active
Recovery During a High-Intensity Shock Microcycle. J Strength Cond Res 2013; 27 (5):
1384-93
44
8. SUMMARY IN ESTONIAN
Stressi- ja taastumisnäitajate erinevused murdmaasuusatajatel blokk- ja tavatreeningu
korral.
Sissejuhatus
Tippmurdmaasuusatajate igakuine treeningmaht ettevalmistusperioodil jääb 60-90 h tunni
vahele. Suuremahulise treeningu talumiseks tuleb hoolikalt treeninguid planeerida.
Vastupidavusspordialade ja sh ka murdmaasuusatamises on levinumaks planeerimise
mudeliks traditsiooniline meetod, kus paralleelselt viiakse läbi nii mahu-, intervall- kui ka
jõutreeningud. Jõualadele tüüpiline blokkperiodiseerimine, kus treeningblokkides
keskendutakse korraga ainult ühele/kahele treeningeesmärgile ei ole laialt levinud
vastupidavusspordialade seas. Viimastel aastatel on sellele aga rohkem tähelepanu pööratud ja
mõned üksikud teadusuuringud selles valdkonnas on ka saadavad. Üheks blokkmeetodiks,
mida vastupidavussportlased on kasutanud, on kõrge intensiivsusega löökmikrotsüklid (HIT
shock), et saavutada töövõime tõus. Järsk intensiivsuse tõus võib esile kutsuda üleväsimuse,
mis pikemaajalisel kestvusel võib viia ületreeningusündroomi tekkeni. Selle vältimiseks on
oluline järjepidev treeningu monitooring, et hoida stressi ja taastumise vahekord paigas.
Käesoleva töö eesmärgiks oli uurida stress- ja taastumisnäitajate erinevusi blokk- ja
tavatreeningu korral hästi treenitud murdmaasuusatajatel.
Magistritöö ülesanded:
Uurida muutusi stressi ja taastumisnäitajates blokk- ja traditsioonilise treeningu korral.
Võrrelda blokktreeningu stressi- ja taastumisnäitajaid traditsioonilise treeningu
samade näitajatega.
Hinnata treeningu subjektiivset koormust modifitseeritud RPE skaala abiga (session
RPE)
Vaatlusalused ja metoodika
Uuringus osales 17 juunior murdmaasuusatajat (10 meest ja 7 naist). Vaatlusalused jaotati
juhuslikkuse alusel kahte gruppi, tavatreeningu (NT) ja blokktreeningu (BT) grupp. Peale
kolme nädalat vahetasid sportlased treeningprogramme. Blokk- ja tavatreeningu maht ja
intensiivsus olid samad kolme nädala vältel. Erinevus seisnes treeningute paigutuses.
Tavatreeningu korral olid madala- ja kõrge intensiivsusega treeningud ning jõutreeningud
võrdselt kolme nädala vahel jaotatud. Blokktreeningu puhul olid esimene ja kolmas
45
treeningnädal madala intensiivsusega koos jõutreeningutega, teisel nädalal olid kõik
treeningud kõrge intensiivsusega, kokku üheksa intervalltreeningut seitsme päeva jooksul
(HIT shock nädal).
Stressi- ja taastumisnäitajate tasemed määrati RESTQ-76 Sport küsimustikku kasutades iga
treeningnädala lõpus. Treeningkoormuse hindamiseks kasutati subjektiivset koormuse näitajat
(session RPE), sportlased fikseerisid treeningpäevikus subjektiivse näitaja taseme peale igat
treeningut.
Järeldused:
Stressi- ja taastumisnäitajate alaskaalade tasemetes esines väikesi muutusi, kuid
sportlased olid võimelised hoidma stressi- ja taastumisnäitajad tasakaalus nii blokk-
kui ka tavatreeningu korral.
Blokk- ja tavatreeningu stressi- ja taastumisnäitajate vahekord ei olnud erinev.
Treeningu subjektiivne koormuse näitaja oli suusatajate treeningus sensitiivne marker
ja reageeris treeningu intensiivsuse tõusule.