university of the witwatersrand, johannesburg, in
TRANSCRIPT
A dissertation submitted to the Faculty oi Engineering, University of the Witwatersrand, Johannesburg, in fulfilment of the requirements for the degree of Master of Science in Engineering.
Johannesburg, 1989

I, SCHALK WILLEM HENDRIK EHGELBRECHT, declare that this is my own unaided work, and is being submitted for the degree of Master of Science in Engineering at the University of the Witwatersrjnd, Johannesburg. It has not been submitted before for any other degree or examination at any other university.

ACKNOWLEDGEMENTS
I wish to thank iscor, Vandetbijlpark for their permission and financial support for this project.A special word of thanks to the Personnel of the Central Maintenance Pool, especially the people of the Crane Maintenance Sections, who gave me valuable assistance and advice.My thanks also go to my supervisor, Dr. Geoff Krige, for his support and guidance throughout the project,I also wish to thank my wife Sibylle, my parents, family and friends for their support.

ABSTRACTThis dissertation is a practical investigation into the magnitude of the vertical and lateral forces exerted, by electric overhead travelling cranes, on their supporting structures during operation.The method of measuring the forces and the equipment used for the actual measurements are discussed, as well as the equipment used for the processing of the recoided date.The forces measured during the experiments, executed in two stages namely controlled conditions and normal operation, are discussed under the headings of vertical forces due to the weight of the crane and lead handled, and the lateral forces due to cross travel movement, skewing of the crane and acceleration/deceleration of the crane.It is shown that the vertical misalignment of the rails, together with the stiffness of the crane structure, has a large influence on the magnitude of the vertical forces.Drive wheel slip, tested under controlled conditions on two E-type cranes, proved to cause high lateral forces.Comparisons are made with the existing Codes of Practice as well as with the theoretical models of crane behaviour.

DECLARATIONACKNOWLEDGEMENTSABSTRACTCONTENTSLIST OF FIGURESLIST OF TABLES
1 INTRODUCTION
2 IDENTIFICATION OF FORCES2.1 Static2.2 Dynamic
3 MEASURING EQUIPMENT
4 EXECUTION OF TESTS4.1 Principle of measurement4.1.1 Strain gauge attachment4.1.2 Calibration4.1.3 Tests
5 PRESENTATION vF FORCES5.1 Computer programmes5.2 Graphtec plotter
6 CRANES TESTED
7 DETAIL EVALUATION OF CRANE 4397.1 Vertical forces without load7.2 Vertical forces during operation7.3 Horizontal forces without load7.4 Horizontal forces during operation7.5 Conclusions

Vertical forces Horizontal forces Conclusions
Crane 501 Vertical forces Horizontal forces Crane 563 Vertical forces Horizontal forces Crane 701 Vertical forces Horizontal forces Crane 270 Horizontal forces Conclusions
CODE COMPARISONVertical forces Horizontal forces General discussion
11 CONCLUSIONS
12 RECOMMENDATIONS FOR FUTURE WORK
LIST OP FIGURES
3.1 Arrangement of testing equipment
4.1 Strain gauge configuration and positionon bogie for horizontal forces 20
4.2 Strain gauge configuration and positionon bogie for vertical forces 23
4.3 Cross sensitivity test : Horizontal forceapplied to bogie. 26
4.4 Relation between horizontal fcixe and vertical deviation. 27
4.5 Cross sensitivity : Influence of vertical foroe on horizontal force 28
4.6 F.uipment used to utilise the displacement transducers. 29
5.1 Typical graph obtained using CRANFL 34S.2a Forces using CRAHPL 355.2b Forces using the GRAPHTEC plotter 35
Crane 439 : Keight distributioncrane 439 : Orientationcrane 439 : Vertical forces duringmovement under controlled conditionsCrane 439 : Vertical forces withcross travel movingCrane 439 : Vertical forces duringmovement with cross travel northCrane 439 : Vertical forces duringmovement with cross travel southCrane 439 : Vertical forces duringexecution of routine workCrane 439 : Vertical forces when magnetCrane 439 : Vertical loads when the light loads were handledCrane 439 ; Vertical forces when the heavy load was lifted.Crane 439 : Horizontal foroea duringmovement under controlled conditionsCrane 439 : Horizontal forces withthe cross travel movingCrane 439 s Horizontal forces withthe crane moving slowlyCrane 439 : Horizontal forces withthe crane moving at medium speedCrane 439 ,$•Horizontal forces withthe crane moving at high speed.

7.16 Crane 439 : Maximum forces measuredunder controlled conditions 58
7.17 Crane 439 : Influence of speed onthe magnitude of the horizontal forces 59
7.18 Crane 439 : Horizontal forces -thile executing normal work 59
7.19 Crane 439 : Horizontal forces while executing normal work, cross travel north 60
7.20 crane 439 : Horizontal forces whilehandling the heavy load 6.1
7.21 Crane- 439 : Crane hitting southside buffers 62
Crane 535 : Weight distribution 64Crane 535 : Orientation 65Crane 535 : Light load picked up 66Crane 535 : Light load swinging 67Crane 535 : Vertical forces when light lead was lowered 68Crane 535 : Medium load lifted 69Crane 535 : Crane moving with medium load 70Crane 535 : Medium load lowered 71Crane 535 : Heavy load lowered 71Crane 535 : Crane moves with heavy load 72Crane 535 : Vertical forces during operation 73 Crane 535 : Horizontal forces - Magnitude and direction with crane moving south 75crane 535 : Horizontal forces - Magnitude and direction with crane moving north 76Deflection of bogie due to weight lifted 77Crane 535 : Oscillating forces when heavy load was hoisted and lowered 79Crane 535 ; Horizontal forces when load was swinging 80Crane 535 s Horizontal forces when crane was moving with medium load 8„Crane 535 : Horizontal forces when the heavy load was lifted and the crane started moving 83
9.1 Crane 501 : Weight distribution 859.2 Crane 501 : Orientation 869.3 Crane 501 : Oscillating horizontal forces
during handling of load 899.4 Crane 501 : Horizontal forces generated when
the crane moved relative to the rails • 90

Figure Page7.16 Crane 439 : Maximum forces measured
under controlled conditions 597.17 Crane 439 : Influence of speed on
the magnitude of the horizontal forces 597.18 Crane 439 : Horizontal forces while
executing normal work 597.19 Crane 439 : Horizontal forces while
executing normal work. Cross travel north 607.20 Crane 439 : Horizontal forces while
handling the heavy load 617.21 Crane 439 : Crane hitting south
side buffers 62
Crane 535 : Weight distribution 64Crane 535 : Orientation 65Crane 535 s Light load picked up 66Crane 535 : Light load swinging 67Crane 535 : Vertical forces when light load was lowered 68Crane 535 : Medium load lifted 69crane 535 : Crane moving with medium load 70crane 535 : Medium load lowered 71Crane 535 : Heavy load lowered 71Crane 535 : Crane moves with heavy load 72Crane 535 : Vertical forces during operation 73 Crane 535 : Horizontal forces - Magnitude and direction with crane moving south 75Crane 535 : Horizontal forces - Magnitude and direction with crane moving north 76Deflection of bogie due to weight lifted 77Crane 535 s Oscillating forces when Mevy load was hoisted and lowered 79crane 535 : Horizontal forces when load was swinging 80Crane 535 : Horizontal forces when c:.d .■ was moving with medium load 82Crane 535 : Horizontal forces when the heavy load was lifted and the crane started moving 83
9.1 Crane 501 : Weight distribution 869.2 Crane 501 : Orientation 869.3 Crane 501 2 Oscillating horizontal forces
during handling of load 899.4 Crane 501 : Horizontal forces generated when
the crane moved relative to the rails 90

Figure
crane 501 : Horizontal forces - Magnitudeand direction when crane was skewingCrane 563 : Height distributionCrane 563 : OrientationCrane 563 : Load liftedCrane 563 : Horizontal forces with cranemoving with heavy load.Crane 563 Effect of drive wheel slip,causing skewingcrane 701 : Weight distributionCrane 701 : OrientationCrane 701 : Effect of drive wheel slip,
causing skewingCrane 270 Weight distributioncrane 270 • Orientation

LIST OF TABLESTable PageT7-01 Maximum and minimum forces with :
XT at north / slow speed west 44T7-02 Maximum and uiniraun forces with :
XT at north ; slow speed east 45T7-03 Maximum and minimum forces with s
XT at north ; medium speed west 45T7-04 Maximum and minimum forces with :
XT at north ; high speed west 45T7-06 Maximum and minimum forces with ;
XT at south ; varying speed 47T7-06 Crane 439 : Dynamic vertical forces
during handling of light loads 50T7-07 crane 439 : Dynamic vertical forces
during handling of the heavy load 52
T8-01 Crane 535 : Vertical loads with crane running slowly
T6-02 Crane 535 : Vertical loads with crane running at high speed
T8-03 Crane 535 : Increase in vertical forces due to the light load lifted
58-04 Crane 535 ; Decrease in vertical forces when light load was lowered
T8-05 Crane 535 : increase in vertical forces when medium load was lifted
T8-06 Crane 535 : Increase in vertical forces during crane movement
T8-07 Crane 535 : Decrease in vertical forces when heavy load was lowered
TB-08 Crane 535 : Comparison between calculated and measured values for induced force
T8-09 Crane 535 : Magnitude of horizontal forces when light load was swinging
T8-10 Crane 535 : Magnitude of forces shown inTB-11 Crane 535 : Magnitude of forces as shown in
T9-01 Crane 501 : Vertical forces with the cross travel, in different positions
T9-02 Crane 501 : Vertical forces with differentT9-03 crane 501 s Horizontal forces with the
cross travel centre T9-04 Crane 501 : Horizontal forces with the
cross travel south
Page 10

T9-05 Crane 501 ; Horizontal forces with the cross travel .icrth
T9-06 Crane 501 : Horizontal forces with the crane handling loads
T9-07 Crane 563 : Vertical forces with crane moving without load
T9-08 Crane 563 ; Vertical forces with crane handling loads
T9-09 Crsre 563 : Horizontal forces with the crane moving without loads
T9-10 Crane 553 : Horizontal forces with the light load (load A) lifted
T9-11 Crane 563 r horizontal forces generated when the cross travel hi': the ends tops
T9-12 Crane 563 : Horizontal forces during oft ventre lifting of tlie load
T9-13 Crane 563 : Horizontal forces generated during skewing of the crane
T9-14 Tane 701 : Vertical forces with the crane moving without load
T9-15 Crane 701 : Vertical forces with the crane moving with load
T9-16 Crane 701 : Horizontal forces with the crane moving without load
T9-17 crane 701 : crane moving with load T9-18 Crane 701 i Horizontal forces when the
cross travel hits the endstops.T9-19 Crane 701 : Horizontal forces with
skewing of the crane
T10-01 Vertical forces as predicted by various codes of practice
T10-02 Horizontal forces as per BS 449T10-03 Horizontal forces as per SABS 0160110-04 Horizontal forces as per BS 2573Tlo-05 Comparison of measured forces with the
models developed by Hunter <Ref 3>
1 INTRODUCTION
With the development of manufacturing equipment with increasing capacities, the material handling problem has become a major consideration, as the production schedule is often dependent on the material handling equipment. Electrical overhead travelling cranes (EOT cranes) are important units in material handling and are depended on to bring about increased production, lower shop costs and better working conditions.<Re£.1>Cyclic operation, comprising frequent stopping, reversing and starting are characteristic of many types of machines, including EOT cranes. The operation of such machines is very different from those operating continuously and leads to a variety of dynamic loading conditions. This makes their design, production and operation difficult, and introduces special requirements for the design of their supporting structures.The principle of indestructibility until recently formed part of the basis of design for machine parts.It was assumed that safety and indestructibility could be ensured by selecting a sufficiently large safety factor, this being the ratio of the limiting load (stress) to the actual value. Design and operating experience with such supporting structures and machines has shown however that it is practically impossible, and often unnecessary, to strive for indestructibility. Thus in recent years the fundamental approach to design has changed. The present requirement is that optimum reliability must be ensured.A crane designer has two methods for solving problems - a theoretical and an experimental one. The method of testing is simpler and cheaper in many cases where one is considering large numbers of crane parts whose design and operating conditions vary only gradually in the course of time, other parts and components of the crane, which are produced in small quantities and are redesigned frequently, necessitate theoretical analysis. However, even a theoretical analysis must be based on test results. <Ref. 2>Through the years several codes of practice were developed, using theoretical analysis as well as experimental values. A comparative study done previously by Hunter <Ref. 3>, with the emphasis on lateral design loads on cranes, came to the conclusion that the assessment of the lateral loads is not consistent, and that the actions producing the forces are not agreed upon and in some cases not even • identified.

It is therefore important that experiments be carried out to improve the existing codes and contribute to more uniform and accurate design criteria.As Hunter's study of the codes ot practice indicated <Ref. 3>, a great deal of uncertainty exists regarding the magnitude and cause of horizontal wheel loads on EOT cranes. Considering that several of the maintenance problems on cranes stem from these horizontal loads, and that a good knowledge of these loads is required for th* economical and reliable design oS cranes and crane buildings, a study was conducted to measure these forces.The purpose of this study is to experimentally determine the size and importance of the forces acting on EOT cranes and their supporting gantries, as well as the influence of certain external factors on these
The study was conducted at the Vanderbijlpark Works of ISCOR, a major iron and steel manufacturing Corporation, which, with its great variety uf cranes, provided excellent opportunities for testing. Measurements could thus be taken on cranes working under normal conditions in an industrial environment. Certain measurements under controlled conditions were also possible.This presentation is divided into four main categories, namely :1) Discussion of the methods and equipment used.2) Detailed evaluation of two cranes to determine the accuracy of the measurements and the two methods used for the presentation of the results.3) Measurements taken on a further four cranes in summarised form.4 > Comparison of the measured forces with the forces predicted by Hunter <Ref. 3> and the various design
As the dissertation is c discussion on the measurement of forces, the graphs are not grouped together in an appendix, but rather shown together with its relevant discussion to ensure that all reference to graphs could be followed with greater ease.

v , '
with either four or eight wheels, and
I

2 IDENTIFICATION OF FORCES
A detailed study of the different forces present in cranes and crane structures was done by Hunter <Ref. 3>, in short the forces are:
Static ForcesVerticalHorizontal
2.2 Dynamic ForcesVertical forces due to the following
Acceleration and retardation of lifting hoist Unevenness of rail in level Rail joints during travelling2.2.2 Horizontal forces due to the following :Elastic shortening of inside of crane columns Lateral travel of crab and load Misalignment of rails Dynamic asymmetry - Rotational force
during braking or accelerating Skew travel of crane Drive wheel slip on one rail
A series of measurements, described subsequently, has been carried out on a variety of cranes, and most of these forces were observed during the testing of the cranes under normal working conditions. Skew travel of the crane as well es drive wheel slip, were simulated by disconnecting the one drive motor of the crane.This was done on two four wheel cranes. The drive wheels of the 8-wheel cranes are mechanically coupled and as these cranes are used in the production process they could not be taken off-line for the period required to remove the mechanical coupling, with the result no simulation could be done on the 8-wheel cranes.
MEASURING EQUIPMENT
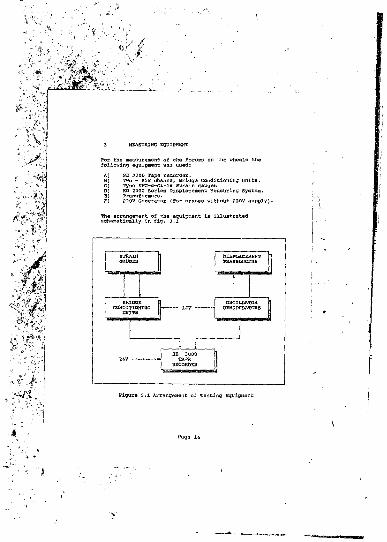
For the measurement of the forces on the wheels the following equipment was used:A) SB 3060 Tape recorder.B) Two - Six channel Bridge Conditioning Units.C) Type KFC-5-C1-1S Strain gaugesD) KD 2300 Series Displacement Measuring System.B) Transformers.F) 220V Generator (For cranes without 220V supply).
The arrangement of the equipment is illustrated schematically in fig. 3.1
Figure 3.1 Arrangement of Testing Equipment

3.1.1 Tape recorderRecording of the data was done by means of the SB 3000 14-channel, portable tape recorder. The data was stored in analogue form to maximize data storage and to reduce bulk of the equipment which had to be used on the cranes.The tape recorder is suitable for both rack and bench mounting a« well as for field use. The conditions Under which the recorder can operate are:
TemperatureHumidity"ibration
25% to 90% non-condensing Stationary and mobile
environments,
The recorder consists of three main assemblies:Tape Transport Power supply unit Data Electronic Unit
The tape transport can operate at eight standard switch selected speeds from 15/32 inch/sec. to 60 inch/sec. The tapes used are 8 inch diameter 0,5 inch tapes.
The power requirement of the recorder is a DC Power unit, 11V to 30V used together with a transformer where 220V AC is available. On the cranes which were not equipped with 220V supply, a 220V portable power generator was used.
3.1.2 Bridge conditioning unitsSignal conditioning was achieved by means of two 6- channel SB 994 conditioner units. These supplied the excitation for the strain gauges as well as the amplification of the output signals.

The power supply to the amplifiers is 220V AC. They provit’e an accurately regulated excitation supply of 5V to 15V (DC) to the transducers and the output is ±1V rms (nominal).
3.1.3 Strain gaugesThe gauges used are standard gauges with one measuring grid and are temperature compensated for steel. The gauge resistance is 120 Ohms (±0,3) and has a grid length of 5mm.
3.1.4 Displacement measuring systemThe system used is a non-contacting linear proximity measuring system for use in static as well as dynamic applications.The output voltage of the system is proportional to the distance between the face of the sensor and the metallic (conductive) target.The system uses a principal of impedance variation which is caused by eddy currents induced in a conductive metal target. The coupling between a coil in a sensor and a target is dependent upon their displacement (gap).The electronics consist of an oscillator, linearization network, amplifiers and a demodulator which provides an analogue voltage directly proportional to displacement.The range of the KD-2300-12CU transducers which were used, is a 0,2 inch offset gap plus an additional 2,00 inch linear range.Conditions under which the system can work are;Temperature
Sensor -55‘c to iso'c Electronics 0’C to 55‘C
EnvironmentFor use in oil, water and dirt.
The system was therefore suitable for the conditions on the cranes.

v ;' '
'. *<\
4 EXECUTION OF TESTS
4.1 Principle Of MeasurementWith the B-wheel, bogie type cranes, the forces developed in the crane structure are transmitted through t.\~ four pivot bogie pine to the bogle and onto the rails and structure. The forces on each bogie could thus be measured at these points by means of strain gauges attached in such a way that either the effect of vertical wheel loads is eliminated, and only the bending due to horizontal loads is recorded, or the effect of horizontal loads is eliminated and vertical loads are recorded.Forces on the 4-wheel, fixed wheel type are transmitted directly from the crane structure onto the wheels and rails. The strain gauges therefore had to be attached near the wheel axle in such a position that the elastic strain of the crane structure due to the forces were as big as possible.The displacement transducers were attached to the four corners of the crane, as near as possible to the wheels, to get an accurate positioning of the crane wheels relative to the rails. It should be noted that the displacement recorded were the displacements between the wheels and the fails. So':e consideration was given to measuring the absolute position of the crane or rails, but this would have been difficult and probably not very significant. Hunter <Ref. 3> found that rail alignment was not very important provided it was within the tolerances allowed by the wheel flange spacing.The tests were done in three stages:Attaching of strain gauges and displacement transducers.Calibration.
4.1.1 Attachment of strain gaugesFor both the vertical force measurement and the horizontal forces, the strain gauges were attached to the structure in the form of a Four arm Wheatstone bridge configuration, in order to eliminate temperature and cable length effects.
I

Connection for horizontal loadsThe strain gauge configuration for horizontal loads is shown in Fig. 4.1
T " '
Section A-A
positionFigure 4.1 Strain gauge configuration and
bogif for horizontal forces
When a force is applied to the side of the bogie as shown in Fig. 4.1, R,, will lengthen, thereby increasing its reeistSnce and then correspondingly R.. will shorten and thus decreasing its resistance. Assuming that, due to the symmetry of the bogie, the deformation of the material of the bogie is equal in both sides, then the change in resistance of the two

I241
I231
E / [(R + <R) + (R - iR)l
t / 2R + E5R / 2R - E/2
{ ij R), and equations 2 and 4 become t

[:{* + «1 R)1 / (2(R + ^R)]
4
" -

Section A-A
Figure 4.2 Strain gauge configuration and position on bogia for vertical forces

When a vertical force is exerted on the bogie, both R24 and R 13 will lengthen and thus incu:ease their resistance, and Ra3 and R 14 will shori;iin. The shortening of R23 and is proportional to thelengthening of R13 and R 24, If the remistance of R13 and R2, increase by SR, the resistance of R22 end R14 will decrease by x < R. The potential differencerecorded will be:
I241 =• E / CvR - x 5R) + (R + 5 R) ]- E / A , where A ■» JR + (1 • xi iR
I231 “ B / [(R - X SR) + (R + S R) ]
V24 . E(R24 ) / A£E(R + iR)] / A
- £E(R - X5R)] / A 9
<• Equation B - Equation 9
- £(SS / & ) + (E6R / A)3-£(ES / A) - (XB5R/A)]
= (BiR(l *• X)] / [2R + (1 - X^RJ ---------- 10

If a horizontal force acts on the bogie simultaneously, the resistance of $t2, decreases / increases by y 4 Rand R14 increases / decreases by y 6 R. Then:R24 - R * 6 RR1 4 - R - X j S + y 4RR2 3 » R - X < R - y » R
I2*1 - ■ / + R w )=• B / 8, where S => 2R + 6R{ 1 - x + y) 11
4:1 = 2 / (B Z3 + R 13)» E / C, where C » 2R + iR(i - x - y) ---— 12
V24 -» [ E CR 24) 1 / B=■ (ER + SSR) / B 13
v z3 => c e (R 2 3 M / c
» (ES - XB5R - yBSR) / C 14
V «• Equation 13 - equation 14- £(ER + EtfR) / B3 - [(ER - xE5R - yBtfR) / C)
£ER < R£ a 2X) + E i R2 (1 - JC2 y2 ) J/ £4R2 +R 5 R(4 -4X)+ 5 R2 (1 - 2X + X2 - y2 )}
Assuming that (4 R)2 y2 can be neglected, equation 15 becomes
V » £8R5 R(2 + 2V.} + 35 R2 (1 - x2 )]/ £4R2 + R 5 - 4X) * 8R2 <1 - 2X + X 2)]
Page zs

With an excitation o£ 5V, an amplification oC 10U and the design criterion of horizontal load *= 0,2 x Vertical load <Rei:. S>, tha difference betweenequations 16 and IV Is 0,02%, therefore the effect of the horizontal loads on the vertical readings is negligible.
Cross sensitivity o£ the two configurationsThe above calculations were based on ,the asBumpt.’. >n that the strain gauge positions were such that perfect signal separation was obtained. In order to verify the signal separation in the actual experiments, an additional test was done on the South bogie of Crane 535. The crane bogie was lifted and different forces wore applied to the side of the bogle. The result Is shown In Fig. 4.3.
Figure 4.3 Cross sensitivity test s Horizontal forces applied tc the bogin’
Usins FiS- k,3, three points are plotted on Fis.4.4, showing a linear relation between the horizontal force on the bogie and the vertical force induced through this action.On thia graph the maximum horizontal force of 40 kN, measured on the crane during the experiments < chapter 8 Table l'B-11, is shown to oauss a vertical load indication of approximately 6,5kN due to the cross sensitivity.
Page 26

Figure 4.4 Relation Between horizontal force and vertical deviation
Thus no more then approximately 6,5kN of the variation in vertical forces are due to the horizontal force on the bogle.
No clear indication of the influence of the vertioal forces on the horizontal forces oould be determined from this particular experiment. The calculations and measurements of Table T8-06, p78, are used for the determination of the relationship.The calculations and measurements on the crane were done with the crane standing. During lifting of the load, the horizontal force generated on the bogie can only be dt-.' to the elastic deformation of the bridge. The diffe..u'noe between the calculated and measured values a m therefore caused by the vertical force, due to the cross sensitivity of the measuring method, inducing an apparent horizontal force.Using the values of Table TB-00 and the vortical forces on the SW bogie due to lifting of the load, a linear relation is again.seen, as shown in Pig. (i.B.

20 , 4,0 60 00
Incraaso In Vortioal Coroa (kN)
SiBVtre 1*. 3 Croan aenaitivityi Influenco of veitioal foros on horizontal fojroa
From the aSova graphs and measurements it can bo accepted that the influence of the cross sensitivity is sufficiently low not to detrimentally affect the aacuraay and usefulness of the results obtained,
The construction of the crane structures in the vicinity where the forces ware measured is symmetrical and the straingauges were attached in similar positions on the cranes, which indicates that the results obtained on the other cranes will have a similar degree o£ accuracy.
Attachment to the craneBecause of the limited time available to do the experiments, it was found that it was not possible to do the wiring coimaating the strain gauges after they . had been attached, on the a-ane. On the first crane it was found that the wiring of two bogies took about six
rf; the limited space end poor lighting, itwas difficult to be assured of good connections.
Page 28

For the experiments on the other cranes, the wiring was dono beforehand in the workshop laboratory, where the connections could be checked and the circuits tested before attaching the strain gauges to the cranes. This procedure worked very well. The time it took to attach the strain gauges to the cranes was approx. 1 3/4 hours for all four bogies.
Displacement transducersThe position of the crane relative to the rails was measured by attaching the transducers to the crane and having the reflectors run against the rails. Equipment -..-gs built for this purpose as shown in Fig. 4.6. The mechanisms were adjustable to fit different cranes.The wheel running against the rail moves the reflector, thereby changing the gap between the transducer and the reflector.
Crane Platform
Figure 4.6 Equipment used to utilise the displacement transducers
4.1.2 Calibration Strain gaugesVertical loads. The signal from the strain gauges was recorded with the crane standing on the rails. This gave the weight of the crane. Eaoh bogle in turn was then lifted off the rail using a hydraulic jack and the strain gauge signal was again recorded. This gave the aero load value for each bogie.
Page 29

Horizontal loads. With the bogie lifted from the rail, the horizontal load was zero. A force was applied to the side of the bogie with a hydraulic jack equipped with a pressure gauge. By applying a certain pressure to the bogie, a signal was obtained for a known force. By multiplying this force by the ratio of the distances from the bogie pin to the wheel surface and to the point of application of the force, a calibration force was obtained.
Displa- jnfc transducers. The transducers were calibrated beforehand in the workshop by adjusting the oscillator-demodulators. They were adjusted to give an output of o ,SV/Z0®m movement.
4.1.3 TestsThe tests on each crane were done in 1 Controlled tests
s side of the crane 1
Running the crane with the crab at one end at slow speed, at medium speed, and at maximum speed. The crab was then moved to the other end and the procedure repeated.Running the crane at different speeds while the orab was moving. These tests were done without a load suspended from the cranes.
Picking up of a load at a predetermined angle. Running the crab against the endstops.
Recording during normal operationThe crane was normal work s measurements
then brought back into operation and as carried out for 1H to 2 hours, while were continued.
Page 30
PRESENTATION OF FORCES
Two Methods of evaluation were used. Analogue to digital conversion was accomplished by means of a DBG KWll-A, 16 channel, analogue-to-digital converter, connected to a PDP 11/23 computer. Three programmes which were previously written for similar types of recordings <Ref 4> were used to sample the data on the different channels at a rate of 20 samples per sec. and store the results on disks, to retrieve the unformatted data and adjust it for zero values and scale, and to print the values in graphical form.The second method was with the use of a Graphtec Linear recorder Mark Vll, a 5-channel plotter, using heat sensitive paper. It has an accuracy of 0,51 over the full scale. The analogue data was plotted directly in graphical form, which gave a better overall picture of the forces during operation.
5.1 Presentation using The PDP 11/23
The processing of the recorded data was done using the thrae programmes previously developed :
6.1.1 InitThis program is used for the determination of the zero and scale values by sampling the calibration data recorded for each channel. The analogue values recorded are converted to digital values as follows :

determined, as shown in the example:
Channel 6 which was measuring
Channel 8 recorded the horizontal force of 42,5 kH the South-west bogie of Crane 43*.
Using this program, selected pieces of the tape arc sampled for a specified time. Analogue to digital conversion is done and the data is stored in files, With this program specific periods of the tests car evaluated, for example when the orab strikes the
4
Digital to real value conversion is done by this
..
a typical graph
Using The GtiA^HTEC plotter
A disatvantage of the plotter is the limited vertical
See Pig, 5.2a and Fig 5.2b for a comparison of the two

Figure 5.1
o. '

using CRANPL
Figure 5.2b Forces using the GRAPHTEC plotter

the following cranes
Capacity
weightLong Travel (LT)
Capacity
S wheels, 4 driven 236,56 to’-- IBOm/min 66,8m/min 17,9m/min
Weight
Capacity
W-typeDuty Class Wheels Weight Speed Ix

Capacity
Duty Class
Long Travel
An E-type drive system is independently driven and « mechanically coupled.
A W-type drive system is electrically or mechanic:
Page 37

Crane 270 was the first crane tested and only two bogies were wired up and measured. The purpose of this trial run was to find the best way to do the connections and to determine if such measurements of the forces could be done. With this test several problems were identified, for example the time it took to do the connecting up of the gauges and wires, and the need for special equipment for the displacement transducers.It was not possible to take readings on high capacity cranes, due to the construction of these cranes (12 wheels) and the fact that the cranes are used in the Iron manufacturing process, and -nn therefore not be taken out of production for long periods.

The graphs obtained through the POP 11/23 Computer, as well as with the Graphtec plotter were evaluated in detail to determine the efficiency and accuracy of the
The following values and drawings :
Hass of bridge
Total weight
(52 007kg)
Weight distributionFigure 7.1
Light load (magnet
4"

Figure 7.2 Crane 439 : Orientation,
* :1'

V.■ \

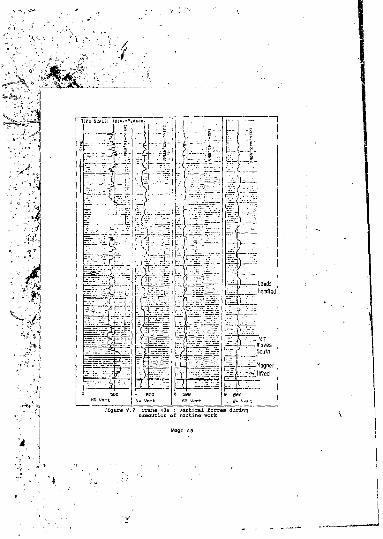
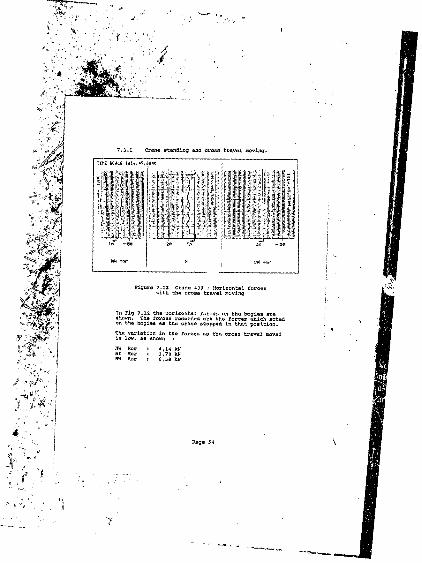
Fig 7.3 represents 23 minutes of recording, consisting
Crane standing with cross travel moving north to south and back.Crane moving at slow, medium and fast speed (0,5m/s to1,2 m/s) with the cross travel at the north side.Cross travel moves to the south.Crane moving with varying speed with the cross travel at the south side.
During long travel a certain pattern in the variation of the vertical forces was observed. The forces on the MW and SB bogies increased together while the forces on the HE and SW bogies decreased at the same time. These variations appear to account for most of the dynamic portion of the forces and probably arise due to the torsional stiffness of the crane and small vertical misalignments of the rails.Transfer of vertical load from one bogie to the other occurs when the slope of the rails change. A crane with a very high torsional stiffness will transfer the total load of the one bogie to the other should the rails be vertically misaligned. A crane with a very low tow torsional stiffness will transfer very little load from the one h die to the other as the bogie carriage will stay parallel to the rails. It is not possible to comment on this from a measurement point of view as the rail alignment was not measured.

crane standing with cross travel moving north
Figure 7.4 Crane 439 : Vertical forces with cross travel moving
Values from Fig.
bogie (NE) bogie (HW) bogie (SB) bogie (SK)
Total weight
The calculated weight of the crane is 1648,. difference between the calculated and moesu:
' 'I

■ n
7.1,2 Crone running with cross tra\
Fash EashSrash Wash
Medium
Medium
Standing
DYNAMIC (kN)STATIC(kN)
%INCRBASEMAX MIN MAX MIN
445,5 478,71 34,77 - 6,93NW 331,3 488,41 15,22 -32,2
160,3 302,28 15,2 -46,9BW 393,5 213,7 329,99 -35,5
Table 17-01 s XT at North ? Slow speed West

DYNM4IC (KM) , %INCRBASE
MAX MIN MAX MIN
630,3 437,25 31,67 - 8,67
577,6 339,7 488,41 18,26 -30,4
343,5 146,6 302,28 13,63 -51,5
434,2 329,99 31,58 -32,9
Table T7-02 North ,* Slow epee
DYNAMIC %INCRBASBMAX MIN MAX MIN
645,0 437,2 34,73 - 8,6m 569,1 352,5 488,4’ 16,5 -27,8
334,34 160,3 302,28 10,6 -46,9416,a 238,8 326,99 26,3 -27,6
Table T7-03 XT at North ; Medium speed West
DYNAMIC (kN)STATIC(kN)
%INCREASE
MAX MIN MAX445,5 34,77
560,6 360,9 488,41 14,78
329,7 302,28 9,39 -45,4329,99 31,58 -25,0
Table 17-04 5 XT at North ,* High speed West
Page 45

Crane running with the cross travel at the
Crane 439 : vertical forces during
In Fig 7.6 the recording of the forces with the crane moving with varying speeds and with the cross travel at
Page 46
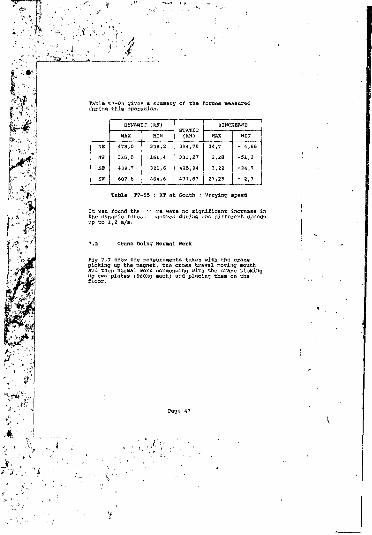
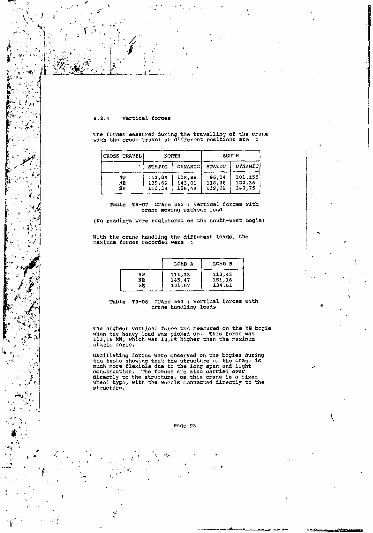
Table 17-05 gives a summary of the forces measured during this operation.
Table T7-05 : XT at South ; Varying speed
significant increase in '— different speedsthe dynamic ferc«- • :asured during"
crane Doing Normal work
Fig 7.7 show the measurements taken with the crane picking up the magnet, the cross travel moving south and then normal work commencing with the crane picking up two plates (960kg each) and placing them on the
.handled
1.

7.2.1 Crane picking up the magnet (5800 kg)
Figure 7.8 Crana 439 i Vertical forces when magnet was lifted (weight 5000 kg)
Pig 7.8 shows ttle lifting of the magnet.The forces measured are :
HE 5*7,3 kNSfl 233*5 kNSW 464,6 kN
Total 1648,0 kNThe neasured value for the weight of the crane is 1597 KN. The difference is 51 kN, which gives a mass for the magnet of 5200 kg. (The calculated value is 5800 kg).

Pig. 7.9 shows the plates being handled. The maximum
iblc T7-06 Crane 439 : Dynamic vertical forces during handling of. light loads.

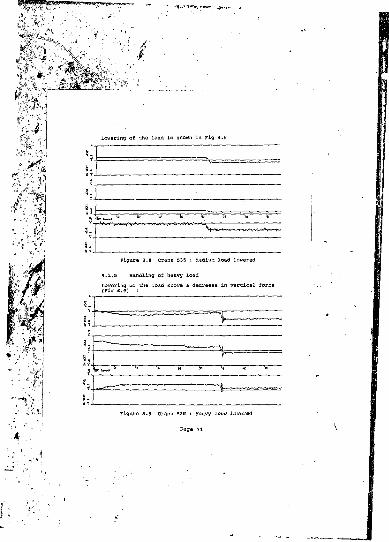
7.2.2 Crane handling a heavy load
TIME SCALE,
/ C # -
i forces when the
: " : i
Point V on Pig 7.10 shows the beams and hooks being lifted. The total force measured is I 669,7 ktf, which gives a weight for the beam of 72,67 kN, or 7 400kg. The calculated mass is 8 060kg, a 8,9% difference.Point W on Fig 7.10 shows the loading lifted. The total force is 2 041,S kN, which is a mass of 45 300kg. The actual mass is 41 060kg, a 9,361 difference.Point X on Pig. 7.10 shows the load lowered.

The dynamic forces when the crane was moving during the period W and X (Fig. 7.10) were ;
445,5 KN
503.8 KH607.9 KN
445.5 kN 416,2 kN 358,78 kN629.6 kN
Table T7rfl7 Crane 439 : Dynamic vertical forces during handling of the heavy load

only channel e.'ftich did not record any readings
Pig 7.3 (Page 41)
9 7.11 Grand 439 : Horizontal Coraas during movement under controlled conditions _ ,
7.3.1 Crane standing and cross travel moving.
A sli
A l l1 5 5 * / ijl!
liiji I'1 ) 1I ‘M: i''|i
Figure 7.12 crane 439 : Horizontal forces with the cross travel moving
In Fig V.12 the horizontal forces on the bogies are shown. The forces recorded are the forces which acted on the bogies as the crane stopped in that position.
/i

7.3.2 Crane running slowly with the XT NorthThe forces exerted by the bogies on tv e mils while the crane was running at slow speed are shown in Fig 7.13.
The maximum forces recorded during the slow run were: Last - west West - east
-32,14 kN 19,74 k#
-47,70 kNwhere the negative (-) sign shows an outward force,During the first ran of the crane, moving slowly East-west, exceptional high forces were measured on the West side bugles. As seen in Fig 7.11, this does not fit into the pattern for the rest of the controlled speed runs.This first slow run was done directly after the crane was lifted for oalibratio . purposes. The crane was pushed out of its normal running position. The crane then had to drive itself out of this skew position into its normal more stable running position, hence the more regular pattern during the rest of the controlled speed runs,This corresponds with Hunter's <Ref. 3> observations during his experiment with his scale model where high forces were measured with the drive wheel slipping and the crane driving itself into a severe skew before straightening
Page 55

7.3.3 Crane moving at aedJ.ua speed
Figure 7.14 Crane 439 i HoeizonCaJ. forces with the crane moving at medium speed.
-In Pig 7.14 the forces are shown as the crane moved at medium speed. Kith tho crane moving westwards, the forces recorded varied :W Hor : Between -19,74 and 10,10 KMNS Hor : Between -4,7 and 15,98 kNSW Hor i Between -ia,93 and -a,55 kNThe forces decreased on the North side bogies as the crane accelerated and increased again as the c.-ane decelerated. This is due to the fact that the crane tends to centralise itself while running, Kith the iross travel at the north side, the bigger inertia at that aide causes the crane to move relative to the rails during deceleration and the forces to increase.on the South side tha forces did not vary as much mainly due to the cross travel being at the North side.

7.3.4 crane moving at high speed
HW Hor ! Between -32,14 and 9,18 kNHE Hor s Between -5,64 and 16,64 kNSW Hor s Between 0 and -18,73 kN
When the crane was travelling at maximum speed with the XT at the south aide, the forces on all the bogies were high (Fig 7.16).

Figura 7.16 Crane 439 : Maximum forces measured
HW Hor i -37,65 KNHE Hor ! 33,84 XXSW Hor : 27,96 kNAs shown in Fig 7.is the North side bogies were runningagainst the rail when these forces occurred. (Point
The crane then started moving mor i to the South side and this sideways movement caused the high force on the South bogie, (point B).The highest force on the North-west bogie occurred the outside flange ran against the rail. (Point C).Fig 7.17 is a graph showing the influence of the crane speed on the magnitude of the horizontal forces, without the values for the first East-west run, The increase is negligible except for the MW bogie, where rail/flange contact caused1 one high peak force.Hunter <Ref 3) has also concluded that dynamic factors such as dynamic aosymgtry only becomes sicnifioant in cranes with speeds of >lm/s and that skewing and subsequent rail/flange contacu produce the largest lateral forces in cranes with speeds up to Im/s.
Pago 58

slow medium his1"-
Figure 7.17 Crane '139 •• Influenoe of speed an the magnitude oC the horizontal forces
7.4 Crana Doing ttormel iferJcDuring thesa cycles of work, which consisted of handling plates with the cross travel mostly at the • South side of Kho crane, the highest lorcas ocourrad on the South bogie each tine the wheel Clangs ran againsti the rail. (Pig 7.IB)
Ii i i
Figure 7.IS cirano 439 i Horizontal forces while executing nsinal week
Paya 59

executing normal work. .Cross travel north
Fig 7.19 shows a period where the
North-west bogie. On the North-east bogie the forces increased as the flange touched the rails. The forces on the south-east bogie changed from inward to outward forces. This is again due to the bigger inertia causing a tendency for the crane to move sideways during braking.
Page 60

7.4.1 Crane handling heavy load
Figure 7.20 crane 439 : Horizontal forces while handling the heavy load
With the handling ot the heavy load the crane appeared to centralise itself on the rails and the forces recorded were smallerMW Hot : Between -2,75 and 34,89 kNHE Hotr : Between 10,24 and 2,16 kNsw nor i Between -6,58 and 6,58 kNThis observation can possibly be attributed to two main factors :The crane bridge is 1,5 m higher than the rails and the neutral axis of the crane is high above the rail level. Any lateral movement will therefore be magnified. Carrying the load, the centre of gravity of the system is much lower, which causes a more stable movement.Due to the higher vertical forces when the load? were carried, the Higher friction forces limited lat- • movement and flange contact, resulting in smalle;
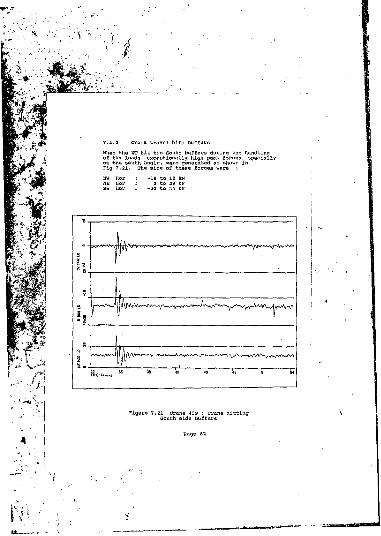
7.4.2 Cross travel hits buffersWhen the XT hit the South Buffers during the handling of the loads, exceptionally high peek forces, specially on the south bogie, were generated as shown in Fig 7.21. The size of these forces were :
•30 to 34 kN
Figure 7.21 crane 439 i crane hitting South side buffers
Page 62
7.5 ConclusionsVertical forcesNo increase in the magnitude of the forces were measured during the different s-yeeds up to 1,2 m/s.The increase/decrease in the forces measured on the NB and SW bogies and the simultaneous decrease/increase in the forces on the W and SB bogies, show that small vertical misalignment of the rails can lead to increased maintenance due to high forces on the crane and gantry.With the low loads the accuracy of the measurements is more than 96%, but decreases to 91% with the heavy
Dynamic forces up to 34,7% higher than the static loads were measured.
Horizontal forcesNo significant increase in forces was measured while the cross travel was moving with the crane stationary. The cross travel speed was low : 0,508 m/s max.The highest forces were measured when the wheel flanges were in contact with the rails. The wheel flange/rail contact is a very important factor in the magnitude of the lateral forces.The higher load produced lower forces than the light load, due to a centralising effect on the crane.
Fig 7.17 shows that with the exception of the NW bogie, which shows a peak force of 32,14 3cN, the increase in force with the increase in speed (up to 1 m/s) is negligible.
The max forces measured during the handling of the
NW Her : 7,7% of cross travel + loadNB Hor : 6,7% of cross travel + loadSW Hor i 3,61 of cross travel + load
The method of measuring the forces gives detail daca showing the forces and factors which influence the magnitude of both the vertical and horizontal forces.Where certain tests were repeated, during the experiment, the results obtained were similar as can be seen from Fig 7.4, Fig 7.7 and Fig 7.12.

Crane 535 is a Class 4 crane with a capacity of 50 tons, being used for handling at coils as well as for maintenance work on the Mills.Values from the crane' Mass of bridge Hass of cross travel Mass of cabin
=»Total weight
files and drawings are
25 923 kg 1 958 kg
113 307 kg 1 .1.10,41 kN
333,39 kN 222,8? kN
Figure 6,1 Crane 535 : Weight distribution.
Loads handled :Light load (C-Hook) : 85,54 kNMedium load (Hill roll) : 194,884 kNHeavy load (Mill roll + bearings) s 336,58 kN
Page 64

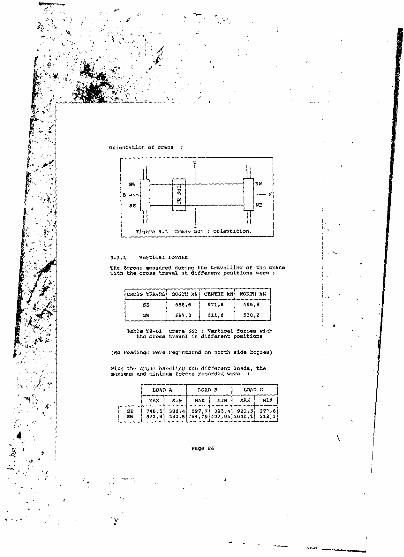
Orientation of Crane 535
Figure 8.2 Crane 535 : Orientation.
Vertical Forces
i the crane
) data recorded
DYNAMIC (kN)STATIC
%INCREASEMAX
360 300 350 2,85260 250 4,0 -12,0
tra 365 9,04 - 4,1
Page 65

With the crane running at high speed, the forces
DYNAMIC (KN)
Table T8-02 Crane 533 : Vertical loads with crane running at high speed
.1.3 Handling of light load
Fig 8.3 shows the light load being picked up at the side of the bay
Figure 8.3 Crane 535 s bight load picked up
Page 66

The increase in forces were
MM : Prom 400 to 435 kN => 35 HNSW : From 370 to 410 kN => 40 kMSB : From 243 to 250 kN => 7 kN
Table T8-03 crane 535 : Increase in verticalforces due to the light load lifted
Assuming that the increase at the NE bogie was 7 kN as well, the measured increase in the weight was 69 kN, while the calculated weight is 85,54 kN. The difference is 4,04%.When the load was swinging, the forces showed a wave pattern, oscillating as shown in Fig 8.4 s
t F S R IS 75 ST
Figure 8.4 Crane 535 : Light load swinging
The variation in vertical forces were :

The lowering of < forces (Fig 8.5)
load caused
Figure 6.5 Crane 535 : Vertical forces when the ligh* load was lowered
From 435 to - From 410 to . From 240 to '
Assuming that the force on the Mi bogie was also 10 kN, the decrease measured value was 90 kN, a 5,2% difference with the calculated weight of 3^,54 kN.
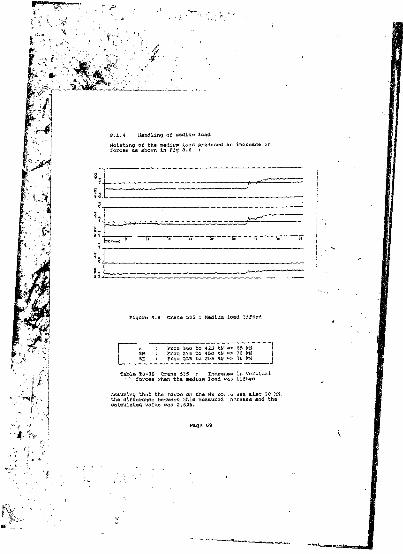
a.1.4 Handling o£ nedius loadHoisting of the medium load produced an increase in forces as shown in Fig 8.6 :
Figure 8.6 Crane 535 : Medl-im load lifted
□ is ; From 360 to 425 kN => 65 KMSW ; From 375 to 450 kN => 75 XH
SB : From 225 to 255 IcN => 30 kH
Table 18-05 Crane 535 : Increase in vertical' ' forces when the medium load w-i) lifted
Assuming that the force on the ME bov u «as also 30 JtN, the difference between this measured n.-cease and the calculated value was 2,62%.
Page 69

moving west. seconds the crane started moving, rel was still moving west.
forces during orane
The dynamic foroes static weight on t!
.5% higher than
load is shown in FlyLowering of
Figure 6.8 Crane 535 i Medium load lowered
8.1.5 Handling of heavy loadLowering of the load shows a decrease in vertical force (Fig 8.9) ?
Figure 8.9 crane
I

bearings) weighed 253,'
SW bogie and
Figure 3.
of recordings, a 20 minute period of recording, plotted with the graphtbc plotter, is shown in Fig 8..11, giving a better overall indication of the variation in forces during the travelling of the crane.
4"


Horizontal ForcesNo data was recorded on the NW bogie.
8.2.1 The forces generated with the crane stationary and the cross travel moving, were a maximum of 2 kN.
8.2.2 With the crane moving slowly north to south and the cross travel west, the forces on the bogies varied :
SW : Between 18 and -10 kNNE i Between 8 and -10 kNSB : Between -25 and -35 kN, the (-) indicates an
outward ftvoeWith the crane moving at high speed, the forces varied:
SW : Between 6 and -If kNNE : Between -28 and -40 kNSB : Between -40 and -18 kN
When the crane was moving south and the cross travel moving as well, the forces on the SW and NE bogies were outward and on the SB bogie mostly inwards (Fig 8.12)

3.12 crane 535 : Horizontal forces Magnitude and direction with
the crane moving south

crane moving in the opposite direction, the n of the Forces on the bogies changed as shov
Figure 8.13 crane 535 : Horizontal, forces Magnitude and direction with

Although the displacement transducers wars not connected, the direction of the forces indicates that the crane was skewing during this time. High forces were measured iSW : Between -40 and 20 k>lHE ; Between -37 and 10 kNSB s Between -40 and 8 kN
8.2.3 Leads liftedElastic deformation of the bridge occurred with the handling c£ the load. This deflection of the bridge caused rotation of the bogies, and induced a horizontal component to the vertical force, as illustrated in Fly 8.24. The flexural stiffness of the structure plays a role in the magnitude of these induced forces, as well as the position of the wheels relative to the neutral axis. Should the neutral axis be much higher than the wheel surface , a larger displacement of the wheel surface will occur, which can causa flange/rail contact and high induced forces,
Figure 8.14 Deflection of bogie due to weight lifted
To compare the magnitude of the measured and calculated values of Fnet , tne flexural stiffness of Crane 535 was determined, as well as the expected deflection of the bridge due to the lifting of the different forces. Fhor was then calculated.
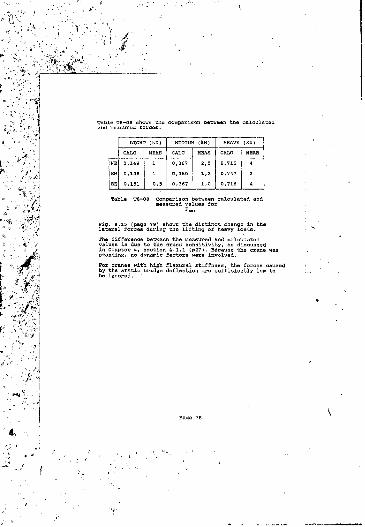
Table T8-0S shows the comparison between
Fig. B.15 (page 79) shows
°4.

Figure 6.15 crane 535 : Oscillating horiaontal forces whan heavy load was
1

It appears that i' • ••rarte, c'.multanaously with the elastic deformati of the bridge, was rotating in the horizontal plane as tan be observed by the diagonally opposite forces ohangu.g concurrently.
8.2.5 Forces during travelling Light loadin Fig 8.16 it is shown that oscillating forces were generated on the bogies as the load was swinging. The forces varied in magnitude :SW : Between 3 and -3 kwNB i Between -14 and -23 kNSB : Between -11 and -18 kN
Figure 8,16 Crane 535 ; Horizontal forces when load was swinging

During the movement of the crane with the light load, the forces on the bogies varied as shown in Table
DYNAMIC (ktJ)TRAVEL
% OF LOAD + XTMIN
9 - 339,84-21 -IS 339,54
- 339,84
Table 8-09 Crane 535 : Magnitude of horizontalforces when light load was swinging.

Figure 8.17 Crane 535 : Horizontal forces when crane was moving with medium load
The magnitude of the forces
Table T8-10 Crane 535 : Magnitude offorces shown in Fig 8.17.
The maximum force recorded was 7,16 of the cross travel weight plus load carried.
Page 82
I
I

Heavy load.arrying
as shown In Fig s.xa the magnitudes.
Figure 8.18 Crane 535 : Horizontal forces when the heavy load was lifted and the crane started moving
Table T6-11 Crane 535 : Magnitude of forces as shown in Fig 6.18
weight plus load handled.
I . : '
8.3 ConclusionsverticalWith the assumption that the forces on the HE bogie, where the recording did not work, varied with the same magnitude as the SE bogie, the measured values were within 56 of the calculated load values.Dynamic forces due to the movement of the crane were a maximum of 206 of the static value.Oscillating forces generated when the load was lowered onto the floor, were due to the elastic deformation of the bridge structure. These forces had a magnitude of up to 9 kN. The deformation of the structure was felt during the execution of the tests.When the loads were lifted, a greater increase of forces was observed in the bogies closer to the cross
Swinging of the load, observed i Pig 8.4, showed to have a marked influence on the ignitude of the vertical forces.
Horizontal forcesWhen the cross travel moved while the crane was standing, only small variations in the horizontal forces were observed.Although the displacement transducers could not be connected, the variation in forces as shown in Pig 8.12 and Fig 8.13, indicated that the crane was skewing.High forces were recorded during this period, confirming that the flange contact with the rails is an important factor in the magnitude of the lateral
Elastic deformation of the bridge induces lateral forces on the bogies, which are influenced by the flexural stiffness of the bridge, the position of the wheel surface relative to the rail and the position of the cross travel.

Crane 501 is a SO ton capacity crane with the longest span (45 maters) at ISCOR works. The crane is used for
Mass of bridge
=>Total weight
Weight distribution with
Figure 9.1 Crane SOI : Weight distribution.
Orientation of crane
Figure 9.2 crane 501 i orientation
Vertical forces
CROSS TRAVEL SOUTH kH CENTRE kN NORTH US I656,6 371,8 465,9697,2 61.1,6 338,2
(No readings were registered on north side bogies)
LOAD k LOAD B LORD CMAX HIS MAX j KIN MAX MIK
597,7j 323,4764,791-437,04

The highest force was measured when the cross travel was maximum south, during the handling of load C. This force was 25,19% higher than the static force on the
Oscillating forces were observed on the SW Bogie during the handling of the load C, showing that the structure of the crane, due to the long span, deformed elastically.
Crane travelling without loadThe forces recorded during the travelling of the crane with different speeds and with the cross travel in the

crane handling loadsThe maximum forces recorded during the handling of the
with the crane handling loads
High oscillating hoisting of scuie

Figure 9.3 Crane 501 : Oscillating horizontal forces during handling oE load.
observed that the high forcesDuring the test it — --------- — _...------Were generated when the bogies were running against the rails. Fig “ ' ' "" --- '— *---- --------(Page 90) shows how the forces changed
'■'#4 ‘‘■v

r«
Figure 9.4 Crane SOI : Horizontal forces generated
It was also observed that the crano was skewingin Fig 9.5 (Page 91). The maximum forcer ---generated during the times the wheels we; to the skewing motion, against the rails,
running, due
i

Figure 9.5 Crane 501 : Horizontal forces - Magnitude and direction when crane was skewing

9.2 Crane 563Crane 563 is a 16 ton capacity, pendant controlled crane with a span of 37 meters. The crane is used for the handling of spares.Crane data :
Weight distribution with cross travel South
Figure 9.6 Crane 563 : Weight distribution.
Loads handled
Orientation of orane
Figure 9.7 Crane
Page 92
The forces measured during the travelling of the crane with the cross travel at different positions are :
me moving without load registered on the south-west bogie)(Ho readings
With the crane handling the different loads, the
crane handling loads
The highest vertical force when the heavy load '151,16 kN, which was
/as picked up. This force was 12,5% higher than the maximum
Oscillating forces - — ... — — ,— ---------*the tests showing that the structure of the crane is much more flexible due to the long span and light construction. The forces are also carried over directly to the structure, as this crane is a fixed wheel type, with the wheels connected directly to the
the bogies during
i)r '

9.2.3 ’ Horizontal Pore sr-rane travelling without xoadThe forces recorded during the travelling of the orane with different speeds and with the cross travel in different positions were :
(Ho readings recorded on the south-east bogie)
Crane nendling loads
Figure 9.6 Crane 563 : Load lifted

If
FORCE (kN)
Table T9-10 crane 563 : Horizontal foroea with the light load (load A) lilted
The forces generated are transmitted more directly through the structure, as there is no bogie pin which con have a reducing effect on the forces.As there is always play between the bogie pins and its housing, forces due to small movements of the bridge relative to the bogies, are absorbed by this play. In the case of the directly coupled wheels, the forces are transmitted directly through the structure.Pig 9.9 show, the forces during a period where the crane was moving with load.
Figure 9.9 Crane 563 ; Horizontal forces with crane moving with heavy load

Hitting the end stopsClue to the low velocity of the cross travel, the forces generated during the collision with the end stops were
Table T9-11 Crane 563 : Horizontal forces generated when the cross travel hit the endstops
Off-centre lifting of the loadThis action also produced low forces :
Table T9-12 Crane 563 : Horizontal forces during off centre lifting of the loid
Skewing of craneSlipping of the drive wheel, causing skewing of the crane, was simulated by disconnecting the one drive wheel. The crane was then driven by the NE drive wheel. Fig 9.10 (Page 97) shows the forces recordec during these tests, w i t h ....... --j-..- jmagnitudes: cjmmarised in
generated during skewing of the crane •


ton capacity, pendant controlledtype crane with four wheels, drive. The crane is used in crushing facility.
the servicing of
of bridge
Weight distribution
Figure 9.11 Weight distribution.
Figure 9.12 Crane

9.3.X Vertical forcesThe vertical forces recorded with the crane travelling: without load, but with the cross travel in different positions are shown in Table T9-14 :
MAX MIN t*N)sw 32 18NW 33 17
Table T9-14 Crane 701 : Vertical forces with the crane moving without load.
With the crane handling the load, the forces recorded
MAX (kN) MIN (kN)3? 33
mt 40 80
Table T9-15 Crane 701 : Vertical forces with the crane moving with load.
The highest vertical force measured was 40,6 kH, an increase of 6,23% on the maximum static wheel load.
9.3.2 Horizontal forces Crane moving without loadThe forces recorded when the crane was travelling without the load are shown in Table T9-16 :
FORCES (kN)
Table Y9-16 Crane 701 : Horizontal forces with the crane moving without lead.

i
Crane handling the load
FORCES (kN)
Table T9-17 Crane 701 : Crane moving with load.
Hitting the end stopsDue to the very low velocity of the crons travel (0,127m/s), the forces generated when the cross travel hit the end stops were low, as seen in Table T9-18.
FORCES (kN)
Skewing of craneFor this measurement the East drive motor was disconnected. Fig 9.13 shows che sharp forces generated similar to the forces observed on crane 563. Table T9-19 shots the magnitudes.
Table T9*-19 Crane 701 : Horizontal forces with skewing of the crane.
Page 100

Figure 9.13 Crane 701 : Effect of drive wheel slip, causing skewing

9.4 crane 270Crane 270 was the first crane tested and only two bogies were wired up and measured. As the wiring was done on the crane itself, the connections were not good and only one channel, the SW horizontal force, recorded meaningful data.This crane is a 22,7 ton capacity orane with a span of 28,95 m and is used in the storing of hot rolled coils.Crane data :Mass of bridgeMass of cross travelHass of cabin
Total mass=> Total weight
Weight distribution with cross travel north
SOUTH I NORTHSW SB | | w NS |
21 870 kg 22 590 kg 32 505 kg 33 830 kg(214,573'' ; (221, 69kN) (318,S7kN) (339,89kN)
Figure 9.14 Crane 270 : Weight distribution.
Loads handled :Load A : 3 2,96 kNLoad B : 53,95 kN
86 808 kg 21 260 kg
110 808 kg1087,03 kN
Page 102

Orientation of the crane
Figure 9.15 Crane 270 : Orientation.
9.4.1 Horizontal forcesWith the crane moving east without a load, the maximum force was 16,93 kN outwards.The highest force recorded when.the crane was moving with load A was 24,48 kN, which was the overall highest force recorded.As the crane moved west with the heavier load B, the maximum force recorded was 15,84 KN.Although the insufficient data dees not give an idea of the actions of the crane i.e. skewing, dynamic asymmetry, etc, the readings do give an indication of the magnitude of the forces exerted on the crane wheels.
page 3 03

Conclusions9.3.1 Vertical ForcesDynamic forces when lifting and lowering loads are more prominent in the cranes with long spans, as were recorded on cranes 501 and 563. The elasticity of the crane structure is an important factor in the magnitude of the vertical forces.The highest force Measured during the operation of the cranes was 25,19% higher than the static force at that point (crane 501).
9.5.2 Horizontal ForcesThe dynamic forces were also observed in the horizontal direction during the lifting of the loads. It was more prominent in the long span cranes.High forces were recorded when the crane wheels were running against the rails.The l=rge lateral forces observed by Hunter in his scale model <Ref 3> when the drive wheel slipped, were measured on the two four wheel cranes as well, thereby confirming his observations. These forces were up to 32,18% of the cross travel weight, plus load handled.Off-vertical lifting of the loads produced only low forces, and can be neglected in the design criteria.Xn the low velocity cranes (<0,127m/s), the forces produced when the cross travel hits the end stops, are negligible.
CODE COMPARISON
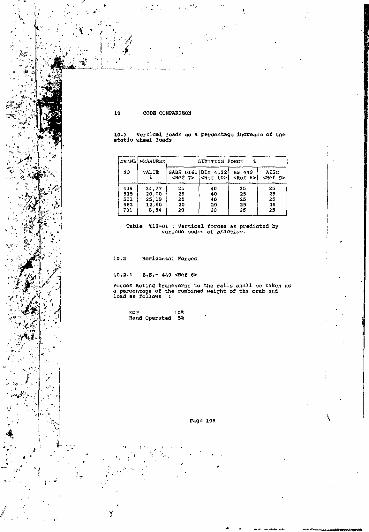
10.1 Vertical loads as a percentage increase of the static wheel loads
MEASURED JjIMITING FORCE
Table T10-01 : Vertical forces as predicted by various codes of practice.

Table T3.0-02 : Horizontal forces as per BS 449.
Allowance Cor accelerating or braking :Combined weight of crab and load lifted multiplied by s Class 1 0,05
Divide the forces amongst all the wheels.According to this; standard, cranes 439, 235, 501 and 270 are class 3 cranes.
Page 106
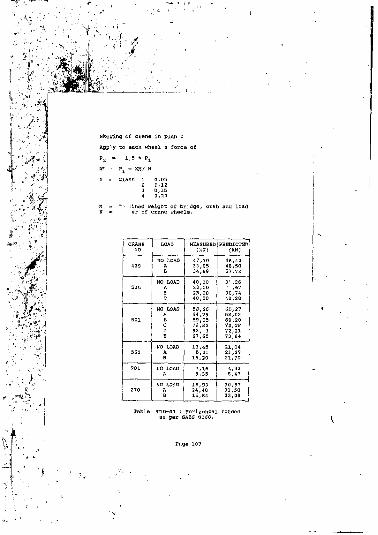
Skewing of crane in plan
P2 = 1,5 * P]_fff' • P1 = XH/ N X b Class 1 0.05
M = lined weight of bridge, crab and loadN = er of crane wheels.
MEASUREDfkN)
PREDICTED
NO LOAD 47,7033,05
NO LOADli'H
= 01NO LOAD 58,56
54,7959,05
NO LOAD16,'20
NO LOAD5,47
NO LOAD 30,5731,50
Table T10-03 : Horizontal forceo as per SABS 0160.
Page 107

10.2.3 B.S.- 2573 <?.ef 5>Skew loads due to travelling :Multiply the vertical forces on each wheel or bogie by
< .1 f- S 10 12KnVic Span Z Wheelbase
110 LOAD 1
Table T10-04 i Horizontal forcesas per BS 2573.
Page 108

10.2.4 F.B.M. Section 1 <Re£ 9>Transverse reactions due to rolling actionWhen two wheels for two bogies) roll along a rail, the couple formed by the horizontal forces normal to the rail shall be taken into consideration. The components of this couple are obtained by multiplying the vertical load exerted on the wheels (or bogies) by a coefficient A which depends upon the ratio of the span p to the wheel base a.As shown in the graph, this coefficient lies between 0,05 and 0,2 for ratios of P/a between 2 and 8.
0 2 4 6 8 10 12
The values are the same as for BS 2573 <Ref 5>
10.2.5 Models developed by Hunter <Ref 3>The models developed by Hunter were used to predict the forces on three of the cranes tested.the three crant-s evaluated were Crane 701, Crane 563 and Crane 439.

CRAKE 701 563 439TYPE E E W
Building stiffness (kN/m) 7434 3483Mass of bridge (ton) 43,37Mass of cross travel (ton)Mass of load (ton) 0,8Mass moment of inertia (t.m) 222,32 20163,35Crane span (o) 12,0 37,0 30,48Wheel centres (m) 4,32 6,15 7,16Max. cross travel limit (m) 10,0 34,0 27,0Wheel radius (m) 0,157 0,230 0,419Flange contact radius (m) 0,169 0,236 0,445Crane velocity (m/s) 0,193 0,330 1,219Initial angle of skew (rad) -0,0032 -0,00296 -0,00397Time step (sec) 0,001 0,001 0,001Rail 1 - Vertical reaction (kN) 48,06 234,75Sail 2 - Vertical reaction (kN) 48,06 234,75Rail l - Wheel resistance (kN) 2,90 13,01 54,025Rail 2 - Wheel resistance (kN) 13,01 54,025Rail 1 - Braking force (kN) 86,95 164,63Rail 2 - Braking force (kN) 86,95 164,63Rail head width fm) 0,08 0,10Pendulum length (m) 13,0Buffer stiffness (kN/m) 2000,0 1200,0 1250,0Bridge mase+portion of building 141,28Log decrement of building 0,3 0,3Log decrement, of buffer 0,5

With these parameters the programs CROSS TRAVEL, CRAB and SKEW were run. Table T1Q-05 gives a summary of the predicted and measured values. It is olear that the values as predicted by Hunter <Ref 3> compare well with
Table T10-05 : Comparison of measured forces the models developed by Hunter <Ref 3>
The skewing forces and cross travel forces easily determined than the forces due to tt
The values for the forces due to the dynamic asymmetry were taken as the forces recorded just before and after the change of direction of the crane as can be seen in
These models were developed assuming that the vertical reactions on all the wheels are equal, which is not the case in practice. The values, however, correlate well.

10.3 General DiscussionThe accurate determination of the forses generated during operation is important for both the crane design and the structure. It is therefore very important that design codes of practice include all the possible actions when giving formulae for limiting forces.
10.3.1 Vertical forcesDIM 4132 <Ref 10> is the only code where the measured forces were lower than the limiting force predicted.The limiting force according to SABS 0160 <Ref 7> was, except for crane 535, lower than the forces measured. Although the limiting forces predicted by BS 449 <Ref 6> and AJSC <Ref 9> are lower than those predicted by the other codes, the values measured on the cranes were all still lower except for two exceptions (Table T10-01
The high force on Crane 439 was due to the observation that forces on the bogies diagonally opposite each other increased as the forces on the other two bogies decreased. The weight of the crane was then mostly carried by the two bogies, giving a larger percentage increase in the static wheel loads.
10.3.2 Horizontal forcesMost of the measured forces which were higher than the limiting predicted forces, were measured when the cranes were running without load- This can possibly be attributed to the centre of gravity of the cranes being above rail level, as well as the higher friction forces during the carrying of the loads, which limited lateral movement and flange contact, resulting in lower forces.Drive wheel slip occurs during normal operation of the cranes, either because of dirt or grease on the rai's, or failure of one drive system due to electrical failure of the motor oi mechanical failure of the coupling or drive shaft.The very high forces on Cranes 563 and 701 were measured when the drive wheel slip was simulated. The codes of practice do not take this into consideration, but it was seen to cause very high forces on the wheels.
In the codes of practice where the weight of the crane bridge is taken into consideration, especially on the light structured cranes 563 and 701, the predicted limiting forces were closer to the measured values than BS 449 <R6f S.-', where only the weight of the cross travel (crab) is taken into consideration. This was due to the fact that in a long span, low capacity crane the bridge structure is heavy, but the cross travel weight low, and low forces are therefore predicted.

10.3.3 Factors not taken into consideration in the codes of practice
The torsional stiffness of the crane structure together with the vertical misalignment of rails.Drive wheel slip.When the crane is running without load.Elastic deformation of the crane structure.Swinging of the load.
These factors were found to he important factors in the magnitude of the forces generated.
10.3.4 Actions influencing the maximum forces.
These forces are generated by the cross travel movement and/or hitting the end stops. Here the forces due to the different actions can act together and when working in the same direction cause high forces.It was seen j i Pig 7.21 (Page 62) that high forces developed in the same direction when the cross travel hit the end stops.

Due to the deformation of the crane bridge and/or the misalignment of the rails, outward forces are exerted on both rails. These forces will have an influence on th«t supporting columns.These forces will, however, have a less severe influence on the supporting columns with structures where the column'- also support a roof structure than the forces in Case 1. Fig 8.15 (Page 79) shows that the forces were mostly outward during handling of the loads. It appeared that the crane bridge did not deform uniformly but that the crane rotated in the horizontal plane.Lifting of the load, occurring simultaneously with the outward forces, will increase the total force on each
Those forces are caused by skewing of the crane due to unequal wheel diameters, difference in drive motor speeds (for E-type cranes) and drive wheel slip. These forces will primarily effect the gantry beams, and also the connection point between two beams, or between the beams and the column, when the wheels are on both sideu of the joint.When the cross travel hits the endstops during this action, the worst situation probably occurs. It was seen thahig.i forces were measured when the crane was skewing, as well as when the cross travel hits the endstops. Should these actions occur simultaneously.
the forces on the one bogie will add up, giving a very high resultant force, while the force on the other bogie on the same side will decrease. The oscillations during the lifting of a load are, however, of sufficiently short duration that they will not occur simultaneously with skewing or drive wheel slip and need not be considered together.
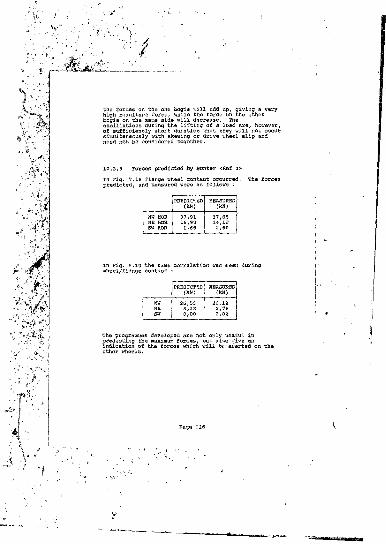
10.3.5 Forces predicted by Hunter <Ref 3>in Fig. 7,16 flange wheel contact occurred. The forces predicted, and measured were as follows s
PREDK'VijD(KK)
MEASURED
NW HOR
In Fig. 2.10 the same correlation was seen during wheel/flange contact :
PREDICTED MEASURED(k»)
S»
The program:.iee developed are not only useful in predicting the maximum forces, but aluo give an indication of the forces which will b< exerted on the other wheels.

10.3.6 General
When we consider the design of the building supporting the crane, the problem is not only to find the maximum forces on the individual wheels, as the combination of certain -Actions can cause higher resultant forces on the structure.In ell these cases it is clear that the forces are transmitted by the crane rails to the structures and must therefore also be taken into consideration in the design of the rail fasteners.From this study, as well as the work done by Hunter <Ref 3>, it is clear that all the actions producing the forces are not taken into consideration in tha codes of practice.Lower forces are predicted in the codes where only the cross travel and the load are taken into consideration. In the case of long span , low capacity cranes (Crane 563), the bridge needs to be heavy for strength and higher forces are therefore generated (Table 10-02 Page 106). The codes taking the bridge weight into consideration , predicted higher forces (Table 10-03 Page 107 and Table 10-04 Page 108)Higher forces for the high capacity cranes are predicted by the codes which take the span of the crane into consideration than those only using the weight of the crane components as a criterion.The neutral axis of the 8 wheel cranes are higher than the wheels at rail level. This can cause a magnifying effect on the forces generated and higher forces were therefore measured on Cranes 439, 535 and 501.(Table 10-03 Page 107). Relatively high forces were measured on Crane 701, a light structured, low oapacity
The codes do take skewing caused by misalignment of wheels, different wheel diameters or difference in rail levels, Hunter <Ref 3>, into consideration but do not consider the case where the crane is driven skew. This driving aocion produced much higher forces than the forces predicted by the codes tor other forms of skewing. (Fig 9.10 Page 97 and Pig 9.13 Page 101)

CONCLUSIONSi) The method of measuring ■ »e forces is practical
and gives accurate data of the forces generated during operation. Due to the dirty environment and vibrations experienced on the cranes in the Iron manufacturing Process, problems were experienced with bad connections, leading to channels not acrking. Cross sensitivity was found to ee low.ii) Processing of the data using the POP 11/23
computer gives accurate results, as a wide scale range can be used. The Graphtec plotter gives a better overall picture of the whole period of operation, but is limited in the vertical scale range.ill) Vertical Forcesa) For speeds up to 1 m/s, the dynamic increase in force was independent of crane speed.b) Small vertical misalignments in the rails lead to high forces on the crane and gantry.c) Oscillating forces are generated during lifting and lowering of the loads, due to the elastic deformation of the bridge. These forces are higher in the cranes with longer spans.d) The measured values compare well with the predicted values of the different codes of practice.
iv) Horizontal Forcesa) The low cross travel speeds of the cranes tested, showed that this action caused very low forces and can be neglected in the design of the cranes.b) Wheel/Flange contact produces high forces on the rails and is -one of the primary cause# of lateral forces on the crane wheelsci The increase in lateral forces with the increase in crane speed tup to 1 m/s), is negligible.

d) No correlation was observed between the lateral forces and the loads handled. On Crane 439 the forces decreased with the increase in loads handled. It appears that the load has a stabilising effect on the crane, tending to keep the crane from "wandering" whereby the flange/wheel contact is limited. On Crane 501 higher forces were observed when the crane handled a lighter load than when it was handling a high load. (Table T9-06)e) Deformation of the bridge generated cyclic forces during hoisting of loads.f) Off-centre lifting of loads produced low forces. However, it was only tested with the load slidi’-g into position, and not with an obstacle preventing e iaways movement of the load.g) Large lateral forces, observed by Hunter <Ref 3> in his scale model when the drive wheel slipped, were observed on the two four wheel cranes tested for this purpose.h} The present Codes of Practice are too inconsistent and all the actions generating forces are not always taken into consideration.i) For the heavier, faster orane the values predicted by Hunter <Ref. 3> compare well. The difference in the measured and predicted forces can be attributed to the fact that in practice the different forces never occur in isolation, but are rather the combination of different forces wh: .-h then increase or reduce the resultant force on each bogie.j) Not only the maximum forces, but also the combination of forces are important in the design of cranes and their supporting structurec.

12 RECOMMENDATIONS FOR FURTHER WORK1) The effects of vertical misalignment of the rails on the magnitude ot the forces needs to be investigated further.2) The action or a drive wheel slipping on one side showed the development of large forces. This needs to be investigated.3) The influence of the position of the centre of the gravity of the crane on the behaviour of the crane and the magnitude of forces need to be assessed.4) The forces on very light, ow capacity cranes, which were found to be higher than predicted.5) From Hunter's work <Ref. 3> and the correlation found in the measurements between his prediction and forces found in practice, a revision of existing codes

REFERENCES
<i> Greiner H.G. "Whiti; j Crane Handbook."Whiting Corporation, 1967.<2> Kogan Joseph. "Crane Design." John Wiley 6 Sons, New York. 1967.<3> Hunter D.W. "The determination of lateralloads from electric overhead travelling cranes." MSc Theses submitted to the University of the Witwatersrand, Johannesburg. March 1986,<4> Krige G.J., Kemp A.R., Alport B. & PotopoulosM. "The behaviour and design of mineshaft steelwork and conveyances." chamber of Mines Research Project GY2W02 : Report #3.3> British Standards "Crane Code", B.S.-2573.
<6> British Standards Institution, "Specificationfor the use of stru?turai steel in buildings", B.S. 449
<?> south African standard, "The general procedures and loadings to be adopted for the design or buildings." S.A.B.S. 0260, 2980.<8> Federation Europeene De La Manutention S*>ix r>1 Heavy lifting equipment "Rules for the design cl hoisting appliances" 2nd. edition, Dec. 1970.<9> Association of Iron and Steel EngineersStandard, "specification for electric overhead travelling cranes for steel mill service." No.6, 1969.<10> German Standard, "craneways steel structures."DIN 4132, 1982.
Page 121


Author Engelbrecht S W B (Schalk Willem Burger)Name of thesis The Measurement Of Vertical And Lateral Forces On Electric Overhead Cranes During Operation. 1989
PUBLISHER:University of the Witwatersrand, Johannesburg ©2013
LEGAL NOTICES:
Copyright Notice: All materials on the Un i ve r s i t y of t he W i t w a t e r s r an d , Johannesbu r g L i b r a r y website are protected by South African copyright law and may not be distributed, transmitted, displayed, or otherwise published in any format, without the prior written permission of the copyright owner.
Disclaimer and Terms of Use: Provided that you maintain all copyright and other notices contained therein, you may download material (one machine readable copy and one print copy per page) for your personal and/or educational non-commercial use only.
The University o f the W itwatersrand, Johannesburg, is not responsible for any errors or omissions and excludes any and all liability for any errors in or omissions from the information on the Library website.