university of washington enterprise risk...
TRANSCRIPT

University of Washington
ENTERPRISE RISK MANAGEMENT2012 ANNUAL REPORT

TABLE OF CONTENTS
Memorandum to President Michael Young ................................................................................................. 1
I. Executive Summary ................................................................................................................................. 2
II. Strengthening Management of Risk at the UW
A. Background ........................................................................................................................................ 3
B. 2012: Maturing the “Culture of Compliance”, improving safety of the community and transforming administrative infrastructure..................................................................................... 3
C. Strengthening ERM Fundamentals ...................................................................................................... 5
III. Top Institutional Risks ............................................................................................................................. 8
IV. Conclusion............................................................................................................................................ 10
CONTENTS OF APPENDICES
Appendix 1: Roles within the ERM Governance Structure .......................................................................... 12
Appendix 2: Enterprise Risk Management Process Overview ..................................................................... 13
Appendix 3: Enterprise Risk Management Achievements ........................................................................... 14
Appendix 4: Moody’s Investors Services Elements of Stability and Success ................................................ 15
Appendix 5: Dashboard View of Key Enterprise Metrics for Institutional Success ....................................... 15
Appendix 6: President’s Advisory Committee on ERM Membership .......................................................... 16
Appendix 7: Compliance, Operations, and Finance Council Membership ....................................................17
Appendix 8: Tools to Evaluate Risks ........................................................................................................... 18
Appendix 9: UW Information Technology Advisory Structure .................................................................... 20
Appendix 10: UW Medicine Patient Safety ................................................................................................ 21
Appendix 11: UW Human Resources ......................................................................................................... 22
Appendix 12: ERM Presentation to the Pacific Northwest Enterprise Risk Forum ........................................ 26

July 11, 2013
TO: President Michael Young
FROM: President’s Advisory Committee on Enterprise Risk Management
SUBJECT: Enterprise Risk Management 2012 Annual Report
This has been an incredible year for the growth in the Enterprise Risk Management (ERM) program
at the University of Washington (UW). We have seen broader consideration of risk in decision-
making and the continued evolution in the use of metrics and data to evaluate operational
effectiveness and strategic initiatives.
We look back at 2012 as a year of significant progress in advancing the maturity of our enterprise-
wide risk management processes. This year’s growth in UW ERM arises from President’s Advisory
Committee on Enterprise Risk Management (PACERM) meetings, small group discussions, and use
of real-time audience response survey instruments and industry best practices to identify the top 15
most important risks facing the institution. In total, we engaged more than 60 UW senior leaders,
including the Compliance, Operations and Finance Council (COFi Council), and other subject matter
experts to refine over 70 institutional performance measures, identify tolerance, and most critically,
to engage stakeholders in developing consensus. This will establish an important baseline to support
targeted mitigation going forward.
Additional efforts, with leadership from Finance and Facilities and the Office of Planning and
Budgeting, made significant progress to develop a financial forecasting model that will enable data-
driven analysis of strategic opportunities and risks.
The growth and accomplishments of ERM in 2012 are a direct reflection of your interest in this work.
We appreciate the support and input you have provided as we have developed, for example, more
robust institutional metrics and financial modeling, and your continued interest in ensuring safety
on campus, and in encouraging continued expansion of a culture of compliance for the University
community.
Over the next year, PACERM will continue refinement of the institutional metrics and top risks
with dashboards to ease monitoring, with primary effort focused on analysis and mitigation of key
areas of concern. We will also help to support efforts towards achieving institutional strategies and
objectives using data to measure progress.
PAGE 12012 ANNUAL REPORT
Events across college campuses, such as natural disasters, major compliance failures, technology breaches, and crime on or near campus, have an increasing number of college and university leaders re-examining their approaches to risk management ...
I. EXECUTIVE SUMMARY
Events across college campuses, such as natural disasters, major compliance failures, technology breaches, and crime on or near campus, have an increasing number of college and university leaders re-examining their approaches to risk management in an effort to become better informed and more prepared to address emerging threats to their institutions.
The UW is no exception to these efforts. With its inception in 2006, the Enterprise Risk Management (ERM) program at the UW set out to achieve 8 key goals:
1. Integrate key risks into the decision-making deliberations of senior leaders and Regents,
2. Create an integrated, institution-wide approach to compliance,
3. Ensure that good information is available for campus community,
4. Create a safe way for interested parties to report problems,
5. Minimize surprises by identifying emerging compliance and risk issues,
6. Recommend solutions to appropriate decision-makers,
7. Check progress on compliance and risk initiatives, and
8. Maintain a strong audit team.
The ERM program itself has continued to evolve, developing structural mechanisms to support the 8 initial recommendations. For example, the President’s Advisory Committee on Enterprise Risk Management, composed of executive leadership of the University, meet periodically to prioritize the risk areas for in-depth assessment, discuss key emerging risks, and share mitigation strategies. In addition, reporting to the PACERM, the Compliance-Operations-Financial Council brings together campus compliance experts to identify compliance and risk issues, develop a common awareness of functional and strategic risks, and works to ensure good information is available to the University community with
ultimate goals to enhance and strengthen UW’s culture of compliance while protecting the decentralized, collaborative, entrepreneurial nature of our institution. In response to the 8th recommendation, the internal audit unit was augmented with additional staff, including increased focus on the clinical enterprise, to strengthen the audit function.
The program continues to identify and incorporate best practices to assist in strengthening compliance, and most recently, to integrate metrics and data to facilitate the identification of top institutional risks. These efforts and others have led to increased management capability to address specific areas of concern and anticipate emerging risks.
The 2012 annual report highlights progress of the formal ERM program over the past year. In addition, and perhaps more importantly, this report summarizes and provides examples of broader institutional efforts to address both specific and strategic risk areas, demonstrating a growing institutional maturity and appreciation of incorporating best practices in risk assessment and mitigation. The report concludes with a look ahead to greater refinement of institutional success metrics, increased assessments of risks identified and continued expansion across the University to incorporate risk assessment into decision-making and strategic planning.
The work plan for 2013 – 2014, is to:
1. Quantify top risks, identify risk owners, and monitor with a dashboard that includes actionable metrics,
2. Charter efforts to address and mitigate selected top risk areas (e.g., lab safety),
3. Collect input from University executives about emerging risks, incorporating into existing dashboards, and
4. Select a limited set of key metrics to monitor the quality of the undergraduate education, financial health, core UW values, and mission-critical activities.
PAGE 2UW ENTERPRISE RISK MANAGEMENT

II. STRENGTHENING MANAGEMENT OF RISK AT THE UW
A. BACKGROUND
ERM at the UW began in 2006 by establishing a collaborative approach and structure to consider broad perspectives in identifying and assessing risk. This strategy has, in many respects, overcome common challenges with implementing ERM at universities, including:
• Addressingconcernsabouttherealeffectivenessofriskassessment,
• Movingpastpersonalbiases,
• Rationalizing(scarce)resourceallocation,multiplebottomlines,multipleconstituencies, inflexible funding and budget models,
• Gettingagreementondefinitionsofimpact,
• Seekingengagementfromcampus,
• Identifyingrisk“owners”,
• Establishingaccountabilityforriskmitigation,
• Movingbeyondrisk“discussion”andfocusingonmitigation,and
• Identifyingincentivestospurunit-levelaction.
The structure established to address these concerns includes the President’s Advisory Committee on Enterprise Risk Management (PACERM) – senior leaders of the University whose role is to provide oversight for the ERM program, support improving the UW’s culture of compliance, discuss top risk issues, review institutional metrics, and recommend actions to the President. Reporting to the PACERM is the Compliance, Operations, and Financial Council (COFi Council). COFi Council was created to nurture a more comprehensive institutional perspective on compliance, operations, and financial risk issues.
The first five years in the evolution of enterprise risk management at the UW were formative and included the following key activities:
• Developedacommonlanguagearoundrisk,
• Conductedover30individualriskassessments,somefocusedonkeyopportunitiesandinitiatives,including major research proposals,
• FocuseddiscussionandmitigationoftheGreatRecession,
• Comparedinstitutionalfinancialstrength(asgaugedbyMoody’sInvestorServices)againstpeers,and
• Draftedaninitialcompendiumofenterprise-widesuccessmetrics.
B. 2012: MATURING THE “CULTURE OF COMPLIANCE”, IMPROVING SAFETY OF THE COMMUNITY AND TRANSFORMING ADMINISTRATIVE INFRASTRUCTURE
Duringthelastyear,theUWhasdemonstratedabroaderutilizationandalignmentof“riskthinking”into a number of efforts across the institution, many coordinated external to the formal ERM program and structure and utilizing a variety of approaches, including:
• Establishingnew,and/orimprovingexistingprocesses;
• Benchmarkingemergingrisksagainstpeersandbestpractices,1and/or
• Eliminatingrisksaltogether.
These activities underscore the growing ability of senior leaders and managers at the UW to identify risks, take action as needed and to monitor effectiveness of mitigation. In addition, these efforts suggest a maturation of the culture to a more sophisticated approach to managing compliance responsibilities, in ensuring the day-to-day safety of the university community, and in evaluating key institutional projects to transform critical administrative infrastructure.
1 APracticalApproachtoInstitutionalRiskManagement,EducationalAdvisoryBoard,UniversityBusinessExecutiveRoundtableRiskRegister 2012
PAGE 32012 ANNUAL REPORT

ComplianceAlthoughoneisnever“done”withcomplianceandamoreintegratedfocusoncompliancecontinuestoevolve, the UW considers its role as a steward of the public’s trust and resources as a critical component to successfully achieving its mission. Key areas, such as research, patient care, athletics, instruction and finance all have active and formal mechanisms for monitoring compliance with both internally and externallyimposedrequirements.The“toneatthetop”attheUniversityofWashingtonsupportsthecommitment to excellence in this regard, to expanding the culture of compliance, and working towards instilling a sense that good stewardship is everyone’s responsibility. Specific efforts over the last year to strengthen compliance in key areas include the following:
• Title IX: The Office of Risk Management established a program to coordinate assistance to units to ensure gender equity in academic programs.
• Animal care: Planning was initiated to develop a new multi-species Animal Research and Care Facility on campus to further advances in science and medicine and to strengthen compliance. The intent is to create a more centralized, efficient and flexible facility to address current and future research needs.
• State procurement reform: UW Financial Management staff played a leadership role in assisting thenewWashingtonStateDepartmentofEnterpriseServicestodevelopaninnovative,risk-based approach to regulatory oversight over the purchase of goods and services in State government, including higher education. This model moves away from a one-size-fits-all approach to accountability and extends greater consideration of risk mitigation capabilities within agency procurement programs.
SafetyThe UW is both a safe place to work, study and visit, and a place where continuous improvement in ensuring a safe community will always be a critical foundation to support all other activities. For example, theUWPoliceDepartment’s(UWPD)statisticsdemonstratethatoverall,incidentsofcrimehavedecreasedover the last 5 years.2
Capital construction experienced its second busiest year on record in 2012, while at the same time, achieving a long standing goal of having a total incident rate of less than 2 (e.g., 1.41). Lost time incident rates also continued to decline, and are currently just 17% of the average for the State of Washington. Additional efforts to improve safety in 2012 and early 2013 included the following:
• Safety of minors: An assessment coordinated by the Office of the President evaluated current programs and policies involving minors, and documented additional opportunities to strengthening existing protocols.
• Student mental health: Additional staff added in Student Life to manage increased demand for student mental health services.
• Sexual assault prevention and response: A committee charged by President Young in early 2013 to assess current protocols and where appropriate, draft an action plan to improve prevention and response to sexual assaults on campus.
• Violence prevention and response program (VPRP): Human Resources expanded its training efforts in2012byjoiningwiththeUWPDtosuccessfullypilotactiveshooterresponsetraining.
• Laboratory safety risk framework: A pilot effort will be launched to develop a risk-based approach to manage safety in laboratories, identifying key elements and mechanisms necessary for achieving lower risk profiles within labs.
• Patient care:
– Advancement of an electronic dashboard tool for monitoring and reporting of the UW Medicine Patients Are First. The dashboard incorporates quality & safety data, with drill-down capabilities for physician quality of care and patient satisfaction data.
– Successful completion of the first series of Patient Safety Innovation Program (PSIP) grants for promising pilot projects that promote collaboration between clinicians and researchers to explore solutions to patient safety and quality of care challenges. An example of a recently completed project is“HighlightingRadiologyCriticalResultsinUWMedicineElectronicMedicalRecordsSystems”.
2 www.washington.edu/admin/police/statistics_reports/AnnualReport.pdf
PAGE 4UW ENTERPRISE RISK MANAGEMENT
II. STRENGTHENING MANAGEMENT OF RISK AT THE UW

Infrastructure Management and Administrative TransformationOver the last several years, numerous efforts have focused on strengthening administrative infrastructure. In particular, as central and departmental budgets have contracted in recent years, in many respects, institutional leaders have stepped up efforts to reduce administrative burden for faculty and students, streamline and even enhance where possible, administrative support. Many of these efforts are the result of new or enhanced technologies, which have also provided new tools to strengthen compliance protocols. Innovative approaches, such as the use of Lean process improvement in Finance and Facilities, have yielded positive results, such as significant reduction in backlogs in post award grants management and in processing traffic citation appeals. Other activities, such as improved ITsecurityandtheinitialphasetomodernizehumanresource/payrolltechnology,haveexplicitlyincorporated risk assessments as part of the standard approach to decision-making. Examples of these efforts include the following:
• Information technology security:
– Collaboration between Office of the Chief Information Security Officer and the Office of Risk Management to obtain information security and privacy insurance.
– Developmentofariskassessmenttooltohelpbusinessunitsassessrisksandmakeinformeddecisions about information security and privacy.
– Improved spam detection and mitigation capabilities, deploying new tools to help identify malicious network traffic.
• Strategic Initiatives:
– HumanResource/PayrollModernizationProject:Riskassessmentconductedtoidentifyrisksof not replacing the current payroll system in addition to identifying project specific risks and corresponding mitigation activities.
– ProcuretoPayInitiative:UtilizingLean,ProcurementServicesinFinancialManagement/Financeand Facilities continued efforts to transform procurement at the UW to a fully integrated and on-line process. These efforts have significantly enhanced internal controls and compliance by eliminating duplicate entry, enhancing automating approvals, increasing data and information to campus, and reducing cost of goods and services.
– Consolidating Administrative Support Services: Expansion of efforts in College of Arts and Sciences and School of Medicine to streamline support and strengthen compliance for payroll, procurement, pre-award grants management and visa processing.
– 2012 Legislative Session Administrative Efficiencies: Led by administrative leaders from the UW, and in coordination with other state higher education institutions and the Council of Presidents, efforts successfully achieved legislative relief benefitting procurement, travel reimbursement, and payroll processes.
C. STRENGTHENING ERM FUNDAMENTALS
In addition to specific efforts that demonstrate a broader adoption of risk-based decision-making, the fundamental structures and systems to support effective management of enterprise risk continue to evolve. Over the last year, capabilities to manage operational and financial health have deepened with the planned launch of UW Profiles, an initial release of a robust financialforecastingmodel,andselected“dashboards for success”builtfromthe Compendium of Enterprise Metrics (See Figure 1 on page 7).
These tools, developed using best practices, are intended to be dynamic, and were coordinated with broad input and support from individuals and units across the UW and, to the extent possible, come from common data sets and definitions. However, much of the data is sourced to unit-specific databases and other repositories that aren’t widely accessible. Thus, the longer term goal is to consolidate the data intheEnterpriseDataWarehouse(EDW)toenableefficientandconsistentaccesstometrics,data,andreports generated using these tools.
Innovative approaches, such as the use of Lean process improvement, have yielded positive results...
PAGE 52012 ANNUAL REPORT
Future Perfect is a comprehensive, fully integrated tool that will enable campus-wide planning into a single institutional point of view.
Financial ForecastsEffective and robust forecasting at the institutional level has, up to this point, been somewhat elusive, primarily due to the lack of a usable tool to model the complexities of the UW. Yet, the ability to project howdecisionsimpact“thebottomline”ismorecriticalnowthanever.Asingle,significantfinancialsetbackcanwreakhavoconthefinancesandoperationsofanyorganization.AttheUW,theGreatRecession confirmed that a perfect storm of concurrent and devastating economic events can significantly strain resources, impact operations and individuals, and stifle strategic priorities and initiatives.
The events of 2008-2010 impacted every revenue stream supporting the mission, including State appropriations and federal student financial aid, research, and payments for patient care. In addition, activities were further constrained by low investment returns and philanthropy negatively impacted by the economy. While robust scenario planning may not have predicted the actual events that occurred, the ability to effectively model individual as well as simultaneous events, based on real data, may have provided a window into potential impacts and created a broader platform for discussion and action that could have lessened the impact. For that reason, in 2012, Finance and Facilities, in collaboration with PlanningandBudgetingandotherpartners,beganimplementationofafinancialprojectiontoolcalledFuture Perfect.
FuturePerfectisastrategic/financialplanningplatformspecificallydevelopedtoaccommodatethe complexities of colleges and universities. It is a comprehensive, fully integrated tool that will enable campus-wide planning into a single institutional point of view. It facilitates modelingvariedand/orconcurrentscenarios,suchaschangesinenrollment,researchandworkforce volumes, auxiliary cash flow adjustments and investment opportunities, and possible financial stresses. The intent is to inform proactive and more targeted decision-making, based on data-driven scenarios that align with the actual finances of the University.
The expected completion of the initial phase of implementation incorporating institution-level financial data is scheduled for early Summer 2013. Follow-on phases will be focused onintegratingunitleveldatatoenablemoreeffectivedecision-makingbyDeansandothersenior leaders.
UW Profiles ThiseffortbytheOfficeofPlanningandBudgeting,willprovidecurrentmetricsanddataforacademicand central units focused on key areas of excellence, strategy and potential concerns. The tool is built on data visualization tools with charts and graphs that will allow senior leaders and others to select reports and measures they care about, as well as provide a platform for conducting ad hoc investigative analysis. The target date for first release is Fall 2013 and initial elements will include:
• AcademicMeasures:studentcredithours,degreesgranted,enrolledmajors,
• FinancialMeasures:fundingmix,researchdollars,overallfinancialviability,and
• HumanResourceMeasures:fulltimeemployees,andotheremployeecounts.
Futurereleasesmayinclude(manyoftheserelyonnewdatabeingaddedtotheEDW):
• Facultyworkload,
• “Costper…”measures(costperstudent,costpercourse,etc.),
• Spaceusage,and
• Turnoverstatistics.
Dashboards for SuccessIn 2011, a collaborative effort involving key PACERM members, Provost Cauce and President Young, resulted in the development of a compendium of institutional metrics, or key performance indicators (KPIs) focused on broad elements of stability and success as identified by Moody’s Investor Services (See Appendix 4).
The next phase of this effort draws from the compendium KPIs, and forms the basis for consolidating various“views”,ordashboardsofselectedmeasuresintoasinglepage-viewofoperationalandfinancialhealth, top institutional risks, and key initiatives (See Appendix 5). PACERM will take an active oversight
PAGE 6UW ENTERPRISE RISK MANAGEMENT
II. STRENGTHENING MANAGEMENT OF RISK AT THE UW

role in using risk-based dashboards to monitor current indicators and trends over time and to charter groups such as the COFi Council to address specific risk areas. The dashboards will also be used for communicating key data supporting institutional health, as well as progress on strategies and risk mitigation activities to the President, Provost and other stakeholders.
As a follow-on to their 2011 effort, in early 2013, Moody’s Investors Service revised its outlook for the entire US higher education sector to negative, marking a shift to negative from stable for even leading research universities. And while the credit rating for the UW remains Aaa, the reliance on federal funding sources suggests more scrutiny as a result of expectations that government support will be stagnant or negative for several years.3
According to Moody’s, five critical factors contribute to the negative outlook:
1. Price sensitivity continues to suppress net tuition revenue growth,
2. Allnon-tuitionrevenuesourcesarestrained;diversitynolongeroffersasafehaven,
3. Rising student loan burden and defaults taint perception of value of a college degree,
4. Increased public scrutiny drives escalated risk of more regulation and accreditation sanctions, and
5. Prospects for long term sustainability depend upon strong leadership through better governance and management.
Figure 1: Measuring Financial Health
3 U.S. Higher Education Outlook Negative in 2013. Moody’s Investors Service, January 16, 2013
PAGE 72012 ANNUAL REPORT

III. TOP INSTITUTIONAL RISKS
Like most large research universities, the UW is a very decentralized institution divided into academic units (e.g., schools and colleges) and administrative units (e.g., core services and support functions). While individual units have generally and, in most cases, effectively managed risks within their functional areas, until recently, a common view of top risks facing the UW did not exist, particularly those risk areas that cross functional silos.
Using best practice methodology and beginning with an analysis of over 400 risks identified by higher education leaders throughout the US4, the PACERM and COFi Council, along with feedback from the President and Provost, narrowed the list of 400 to the top 15 risk areas by evaluating each one for likelihood, impact, velocity and vulnerability (See Table 1 on page 9). While the risks identified in these preliminary rankings are not necessarily unique to the University of Washington, developing consensus amongst senior leadership to establish baseline is critical to inform, prioritize and support next steps towards mitigation.
Thepreliminaryassessmentsuggests,atthispoint,therearenoriskareasthatrank“extreme”.Yet,if“high”or“substantial”rankingrisksareleftunattended,theycouldhavesignificantimpactsovertime.Therefore, a thoughtful, yet expedient and systematic approach to better understanding these top
risks, including internal controls and metrics evaluating current state will help inform appropriate prioritization of mitigation activities. Risk owners will be identified and, depending on the prioritization, may be chartered by PACERM to develop additional efforts to reduce risk. These efforts will be the primary focus of the 2013–14 ERM workplan.Bywayofoneexamplealreadyinearlyplanningstages,in2013–14,thePACERM will pilot an approach to mitigation utilizing an innovative risk-based model focused on strengthening safety in research laboratories. This approach employs a collaborative structure to foster ownership, understanding, and compliance and most importantly, how laboratory staff can achieve a lower risk environment. This is an extremely critical area supporting the research enterprise with significant compliance requirements. So, if using this approach proves successful, it can be expanded to address other top risk areas.
The top risks, particularly those with active mitigation efforts, will be incorporated into a dashboard to facilitate monitoring by PACERM and expanded, as appropriate, to accommodate any emerging risks, and it provides a helpful basis for communicating riskissuestothebroaderUWcommunity,stakeholders,andtheBoardofRegents.
The preliminary assessment suggests, at this point, there are no risk areas that rank “extreme”. Yet, if
“high” or “substantial” ranking risks are left unattended, they could have significant impacts over time.
4 APracticalApproachtoInstitutionalRiskManagement,EducationalAdvisoryBoard,UniversityBusinessExecutiveRoundtableRiskRegister 2012
PAGE 8UW ENTERPRISE RISK MANAGEMENT
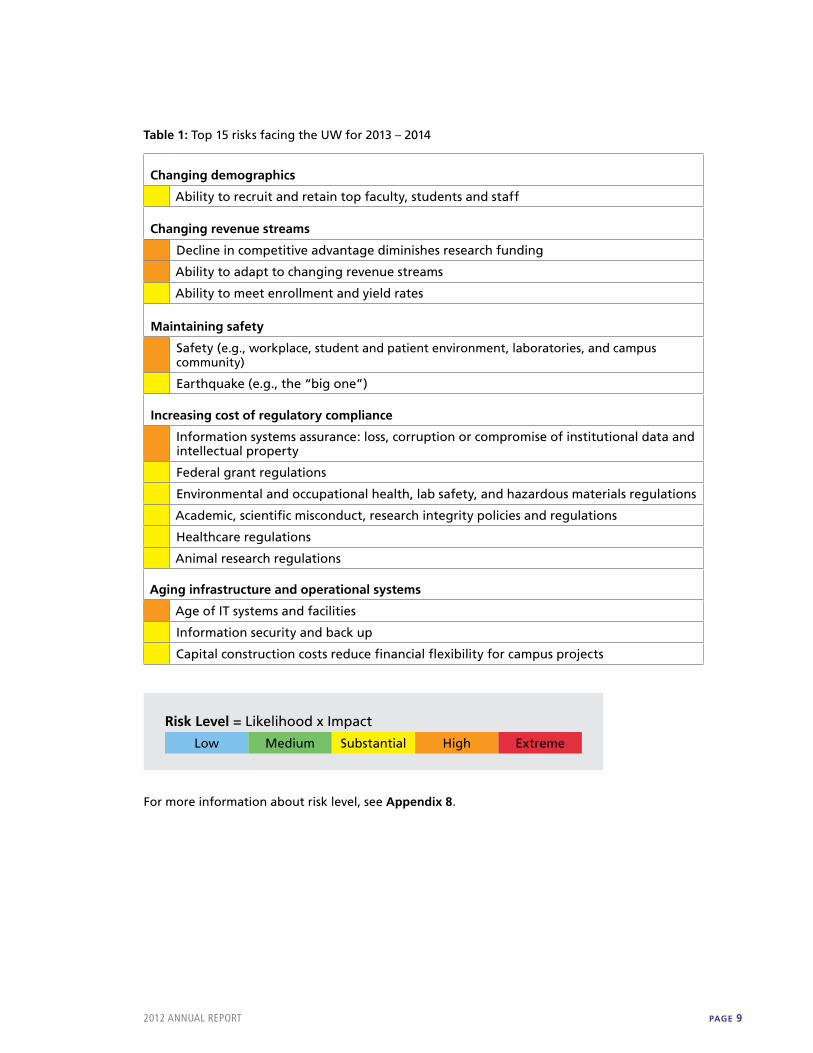
Table 1: Top 15 risks facing the UW for 2013 – 2014
Changing demographics
Ability to recruit and retain top faculty, students and staff
Changing revenue streams
Declineincompetitiveadvantagediminishesresearchfunding
Ability to adapt to changing revenue streams
Ability to meet enrollment and yield rates
Maintaining safety
Safety (e.g., workplace, student and patient environment, laboratories, and campus community)
Earthquake(e.g.,the“bigone”)
Increasing cost of regulatory compliance
Information systems assurance: loss, corruption or compromise of institutional data and intellectual property
Federal grant regulations
Environmental and occupational health, lab safety, and hazardous materials regulations
Academic, scientific misconduct, research integrity policies and regulations
Healthcare regulations
Animal research regulations
Aging infrastructure and operational systems
Age of IT systems and facilities
Information security and back up
Capital construction costs reduce financial flexibility for campus projects
Risk Level = Likelihood x Impact
Low Medium Substantial High Extreme
For more information about risk level, see Appendix 8.
PAGE 92012 ANNUAL REPORT

IV. CONCLUSION
This has been a year of evolution for the UW’s ERM program, with great strides made in addressing specific areas of risk and in strengthening the foundations of the program with data, metrics and information for more informed decision-making.
The next year will focus on refinement of top risks, continued build-out of metrics and data for financial profiling and projections, strengthening stewardship and compliance, and finally, to continue to encourage the integration of risk based thinking into decision-making at all levels. Institution-wide risks will be prioritized and mitigation efforts advanced in a thoughtful and candid manner. In support of
these objectives, the ERM program itself will focus on coordinating discussion, assisting in the development of facts and data to augment solid judgment and expertise, and to help drive action.
Effective management of an ever-increasing institutional risk profile with engagement at all levels will be critical in maintaining an environment that enhances excellence and discovery by faculty, students and staff. These ingredients will be critical in ensuring the UW can continue making important contributions to society and build on its status as a world-class institution for research, learning and service.
Institution-wide risks will be prioritized and mitigation efforts advanced in a thoughtful and candid manner.
PAGE 10UW ENTERPRISE RISK MANAGEMENT

CONTENTS OF APPENDICES
Appendix 1: Roles within the ERM Governance Structure ...........................................................................12
Appendix 2: Enterprise Risk Management Process Overview .......................................................................13
Appendix 3: Enterprise Risk Management Achievements ............................................................................14
Appendix 4: Moody’s Investors Services Elements of Stability and Success ..................................................15
Appendix 5: Dashboard View of Key Enterprise Metrics for Institutional Success .........................................15
Appendix 6: President’s Advisory Committee on ERM Membership ...........................................................16
Appendix 7: Compliance, Operations, and Finance Council Membership ....................................................17
Appendix 8: Tools to Evaluate Risks ............................................................................................................18
Appendix 9: UW Information Technology Advisory Structure .....................................................................20
Appendix 10: UW Medicine Patient Safety .................................................................................................21
Appendix 11: UW Human Resources ..........................................................................................................22
Appendix 12: ERM Presentation to the Pacific Northwest Enterprise Risk Forum .........................................26
PAGE 112012 ANNUAL REPORT
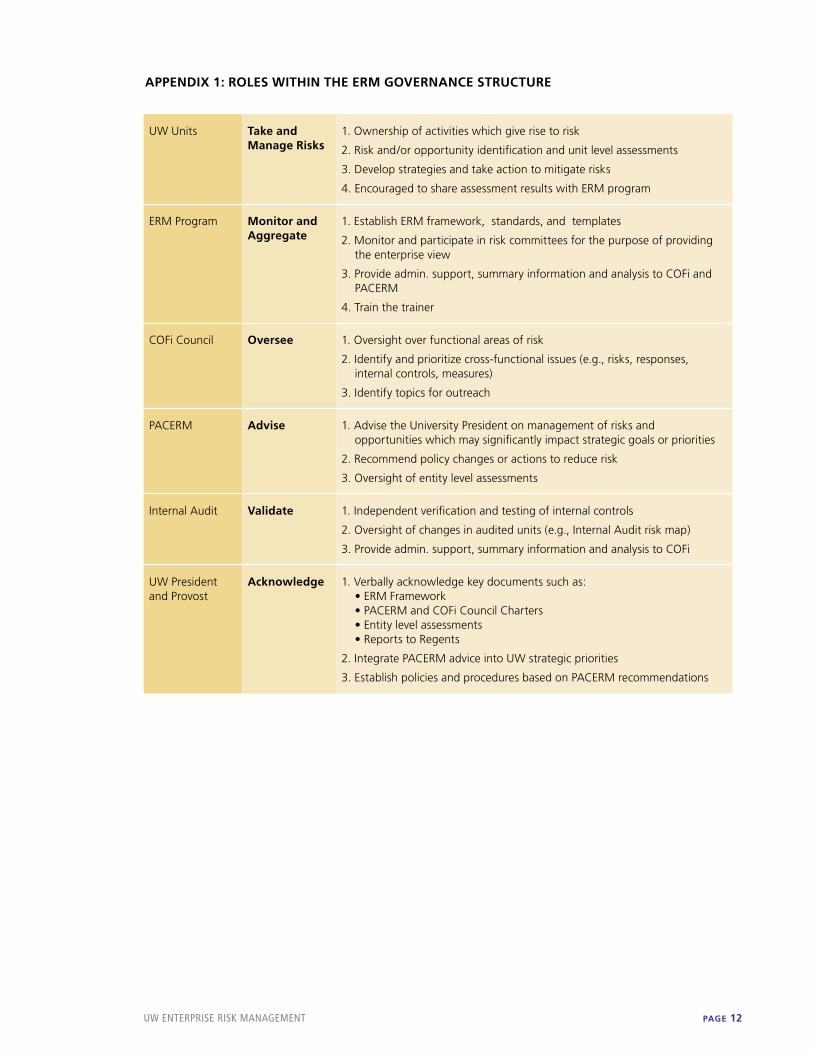
APPENDIX 1: ROLES WITHIN THE ERM GOVERNANCE STRUCTURE
UW Units Take and Manage Risks
1. Ownership of activities which give rise to risk
2. Risk and/or opportunity identification and unit level assessments
3. Develop strategies and take action to mitigate risks
4. Encouraged to share assessment results with ERM program
ERM Program Monitor and Aggregate
1. Establish ERM framework, standards, and templates
2. Monitor and participate in risk committees for the purpose of providing the enterprise view
3. Provide admin. support, summary information and analysis to COFi and PACERM
4. Train the trainer
COFi Council Oversee 1. Oversight over functional areas of risk
2. Identify and prioritize cross-functional issues (e.g., risks, responses, internal controls, measures)
3. Identify topics for outreach
PACERM Advise 1. Advise the University President on management of risks and opportunities which may significantly impact strategic goals or priorities
2. Recommend policy changes or actions to reduce risk
3. Oversight of entity level assessments
Internal Audit Validate 1. Independent verification and testing of internal controls
2. Oversight of changes in audited units (e.g., Internal Audit risk map)
3. Provide admin. support, summary information and analysis to COFi
UW President and Provost
Acknowledge 1. Verbally acknowledge key documents such as: • ERM Framework • PACERM and COFi Council Charters • Entity level assessments • Reports to Regents
2. Integrate PACERM advice into UW strategic priorities
3. Establish policies and procedures based on PACERM recommendations
PAGE 12UW ENTERPRISE RISK MANAGEMENT
APPENDIX 2: ENTERPRISE RISK MANAGEMENT PROCESS OVERVIEW
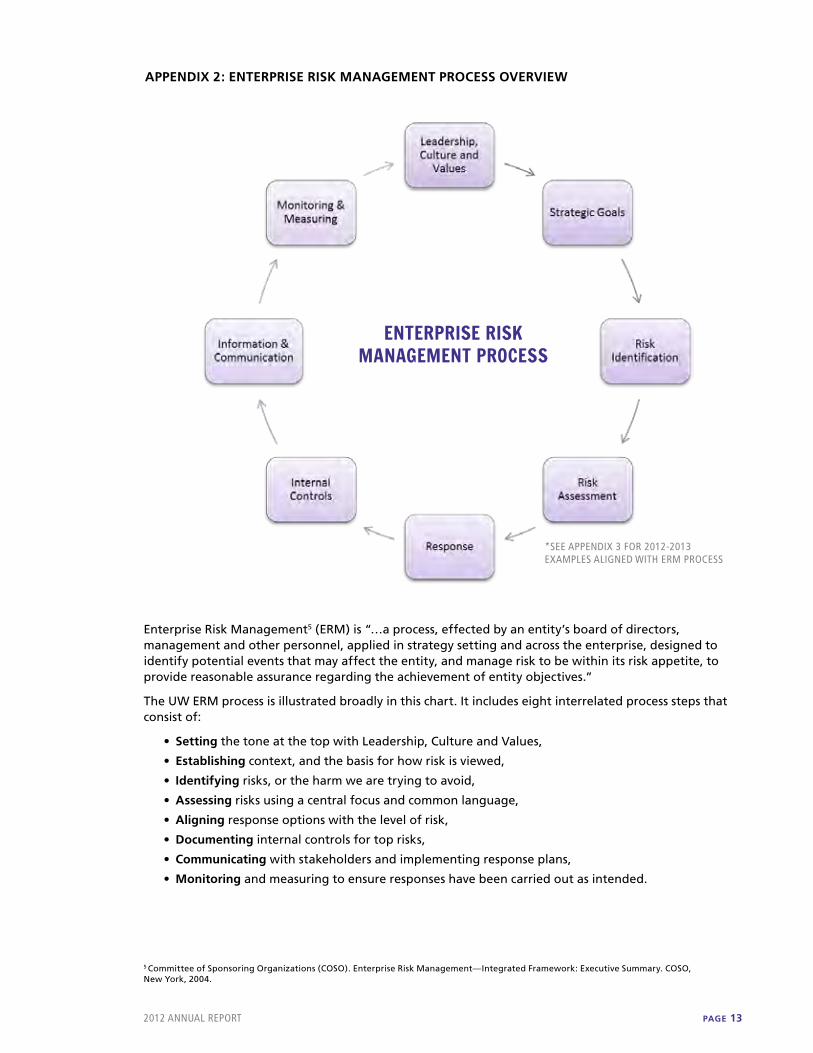
Enterprise Risk Management5(ERM)is“…aprocess,effectedbyanentity’sboardofdirectors,management and other personnel, applied in strategy setting and across the enterprise, designed to identify potential events that may affect the entity, and manage risk to be within its risk appetite, to providereasonableassuranceregardingtheachievementofentityobjectives.”
The UW ERM process is illustrated broadly in this chart. It includes eight interrelated process steps that consist of:
• Setting the tone at the top with Leadership, Culture and Values,
• Establishing context, and the basis for how risk is viewed,
• Identifying risks, or the harm we are trying to avoid,
• Assessing risks using a central focus and common language,
• Aligning response options with the level of risk,
• Documenting internal controls for top risks,
• Communicating with stakeholders and implementing response plans,
• Monitoring and measuring to ensure responses have been carried out as intended.
*SEE APPENDIX 3 FOR 2012-2013 EXAMPLES ALIGNED WITH ERM PROCESS
ENTERPRISE RISK MANAGEMENT PROCESS
5 Committee of Sponsoring Organizations (COSO). Enterprise Risk Management—Integrated Framework: Executive Summary. COSO, New York, 2004.
PAGE 132012 ANNUAL REPORT

• Financial Forecasts
• UW Profiles
• Dashboard view of key institutional success metrics
• Peer sourced list of over 400 risks, narrowed to 140 risk areas applicable to UW
APPENDIX 3: 2012-2013 ENTERPRISE RISK MANAGEMENT ACHIEVEMENTS
• Compliance: Title IX, Animal care facilities, State procurement reform
• Safety: Protection of minors, Sexual assault prevention, Violence prevention and response, Student mental health counselors added, and Lab safety risk pilot project
• Patient Care: Dashboard tool for monitoring Patients are First quality and safety data, and Patient Safety Innovation Program grants
• Infrastructure and Administration: IT Security and privacy insurance, and Tools to identify malicious traffic
• Strategic Initiatives: HR / Payroll Modernization Project, and Consolidating administrative support services, and 2012 Legislative Session administrative efficiencies
• Ranked 140 risk areas, and determined the top 32 UW risk areas
• PACERM members ranked impact for the top 28 risks
• COFi Council steering committee ranked likelihood, velocity, and vulnerability for top risks
Moody’s Elements of Stability and Success
• Market leadership with global reputation
• Top students and faculty
• Diversified funding sources
• Strong donor and community support
• Solid financial metrics
PAGE 14UW ENTERPRISE RISK MANAGEMENT

APPENDIX 4: MOODY’S INVESTORS SERVICES ELEMENTS OF STABILITY AND SUCCESS
The corresponding areas of focus represent criteria for stability as identified by Moody’s Investor Services.6 The associated metrics communicate quantitative information to senior leadership about key areas of excellence, strategy and potential concern.
1. Market leadership with global reputation and top-ranked programs
2. Top students and faculty
3. Multiple lines of business and diversified funding sources
4. Strong donor and community support
5. Solid financial metrics
APPENDIX 5: DASHBOARD VIEW OF KEY ENTERPRISE METRICS FOR INSTITUTIONAL SUCCESS
NOTE: Although this information represents actual UW data, it is for illustrative purposes. It is intended to demonstrate how tolerance is set (e.g., internally or externally) and displayed in dashboard format. Thedashboardis“preliminary”anddoesnotreflectthefinalmetricsPACERMhasagreedtomonitorforinstitutional success.
6 Moody’saffirmsUniversityofWashington’sAaarating;outlookrevisedtostablefromnegative.Moody’sInvestorsService,January2,2012
PAGE 152012 ANNUAL REPORT

APPENDIX 6: PRESIDENT’S ADVISORY COMMITTEE ON ERM 2011 – 2012 MEMBERSHIP
Ana Mari Cauce, Provost and Executive Vice President, PACERM Co-Chair
V’Ella Warren, Senior Vice President, Finance & Facilities, PACERM Co-Chair
DavidAnderson,Executive Director, Health Sciences Administration
Sandra Archibald, Dean, Evans School of Public Affairs
Cheryl Cameron, Vice Provost for Academic Personnel, Office of the Provost
Kenyon Chan, Chancellor, UW Bothell
GaryFarris,Interim Dean and Vice Provost, The Graduate School
EricGodfrey,Vice President and Vice Provost, Student Life
JamesGregory,Chair, Faculty Senate
Randy Hodgins, Vice President, Office of External Affairs
GaryIkeda,Division Chief, Attorney General’s Office
Paul Jenny, Vice Provost, Office of Planning and Budgeting
Mindy Kornberg, Vice President, Human Resources
Connie Kravas, Vice President, University Advancement
Mary Lidstrom, Vice Provost for Research, Office of Research
GeraldMiller,Chair, Faculty Council on Research
Harlan Patterson, Vice Chancellor for Administrative Services, UW Tacoma
Shondell Reed, Senior Associate Athletic Director, Intercollegiate Athletics
Rakesh Saini, Graduate and Professional Student Senate, University of Washington
Joseph Salama, Associate Students of the UW, University of Washington
Johnese Spisso, Vice President for Medical Affairs, UW Medicine
Robert Stacey, Dean, College of Arts and Sciences
Tom Stritikus, Dean, College of Education
Kellye Testy, Dean, School of Law
Kelli Trosvig, Vice President and Vice Provost, UW Information Technology
Support provided by Joanne Matson, Office of the Senior Vice President
PAGE 16UW ENTERPRISE RISK MANAGEMENT

APPENDIX 7: COMPLIANCE, OPERATIONS, AND FINANCE COUNCIL 2011 – 2012 MEMBERSHIP
Richard Cordova, Internal Audit, Facilitator
Ann Anderson, Financial Management
James Angelosante, Facilities Services
KirkBailey,Office of the CISO
Sue Camber, Financial Management
Jeff Cheek, Office of Research
Elizabeth Cherry, Risk Management
Sue Clausen, UW Medicine
Marilyn Cox, UW Bothell
WaltDryfoos,University Advancement
Virjean Edwards, Office of the Registrar
DarleneFeikema,College of Environment
JessieGarcia,Human Resources
SaraGomez,UW Information Technology
DavidGreen,School of Medicine
Shelley Kostrinsky, Academic Personnel
Jack Lee, Faculty Senate Representative
Kay Lewis, Student Life
Richard Meeks, UW Medicine
Todd Mildon, Planning and Budgeting
Karen Moe, Human Subjects Division
Kyle Pifer, Intercollegiate Athletics
Linda Nelson, College of Arts and Sciences
Nona Phillips, Office of Animal Welfare
GaryQuarfoth,Planning and Budgeting
Carol Rhodes, Office of Sponsored Programs
BenRobinson,School of Public Health
Jan Rutledge, UW Tacoma
Marcia Rhodes, Health Sciences Risk Management
Clark Westmoreland, Educational Outreach
JudeVanBuren,Environmental Health and Safety
AdvisorsAndrew Faris, Enterprise Risk Management
Charlene Hansen, Internal Audit
Kerry Kahl, Enterprise Risk Management
DinaYunker,Attorney General’s Office
Support provided by Tamara Young, Internal Audit
PAGE 172012 ANNUAL REPORT

APPENDIX 8: TOOLS TO EVALUATE RISKS
Assessing risks consists of assigning values to each risk using defined criteria. To be effective and sustainable, the risk assessment process needs to be simple and easy to understand.
RiskassessmentisessentialtoestablishandfosteranactivedialoguebetweentheBoardofRegentsandseniorleadersaboutriskandhowitinformsdecisionmakingandbetterenabletheBoardtofulfillitsoversight role.
To answer questions such as how fast could a risk arise and paint the full picture, ranking scales are provided for likelihood, impact, velocity, and vulnerability.
Results will produce a risk summary picture that displays the level of risk associated with each option.
Likelihood of Occurrence (e.g., probability or frequency) is estimated by using a scale from 1 – 5. What do you think is the likelihood of risk occurrence?
Rank Measures of Likelihood
- 1 - Rare
Not expected to occur in the next 5 years
- 2 - Unlikely
Could occur at some time in the next 5 years
- 3 - Possible
Might occur in the next 1 – 5 years
- 4 - Likely
Will probably occur at least once per year
- 5 - Almost Certain
Expected to occur more than once per year
Impact from Occurrence (e.g., consequence or severity) is estimated by using a scale from 1–5. When an event has multiple impacts, select the highest number for the measure of impact. What impact would a risk have?
Rank Generic Meaning InjuriesInterruption of Services Financial Loss
Performance Loss Reputation & Image
- 1 - Insignificant
Little or no impact on the achievement of goals or capability
No injuries < ½ day < $5M or < 1% of GOF/DOF Budget
Up to 5% variation to Key Performance Indicators (KPI)
Unsubstantiated, low impact, low profile or no news items
- 2 - Minor
May degrade the achievement of some goals or capability
First aid treatment
½ – 1 day $5 - $20M or up to 2% of GOF/DOF Budget
5 - 10% variation to KPI
Substantiated, low impact, low news profile
- 3 - Serious
Will degrade the achievement of some goals or capability
Medical treatment
> 1 day – < 1 week
$20M - $50M or 6% of GOF/DOF Budget
10 - 25% variation to KPI
Substantiated, public embarrassment, moderate impact, moderate news profile
- 4 - Disastrous
Significantly degrades the achievement of goals or capability
Death or extensive injuries
1 week – 1 month
$50M - $150M or < 18% of GOF/DOF Budget
25 - 50% variation to KPI
Substantiated, public embarrassment, high impact, high news profile, third party actions
- 5 - Catastrophic
Significant capability loss and the achievement of goals is unlikely
Multiple deaths or severe permanent disabilities
> 1 month > $150M or > 18% of GOF/DOF Budget
> 50% variation to Key Performance Indicators
Substantiated, public embarrassment, very high multiple impacts, high widespread news profile, third party actions
PAGE 18UW ENTERPRISE RISK MANAGEMENT
APPENDIX 8: TOOLS TO EVALUATE RISKS (CONTINUED)
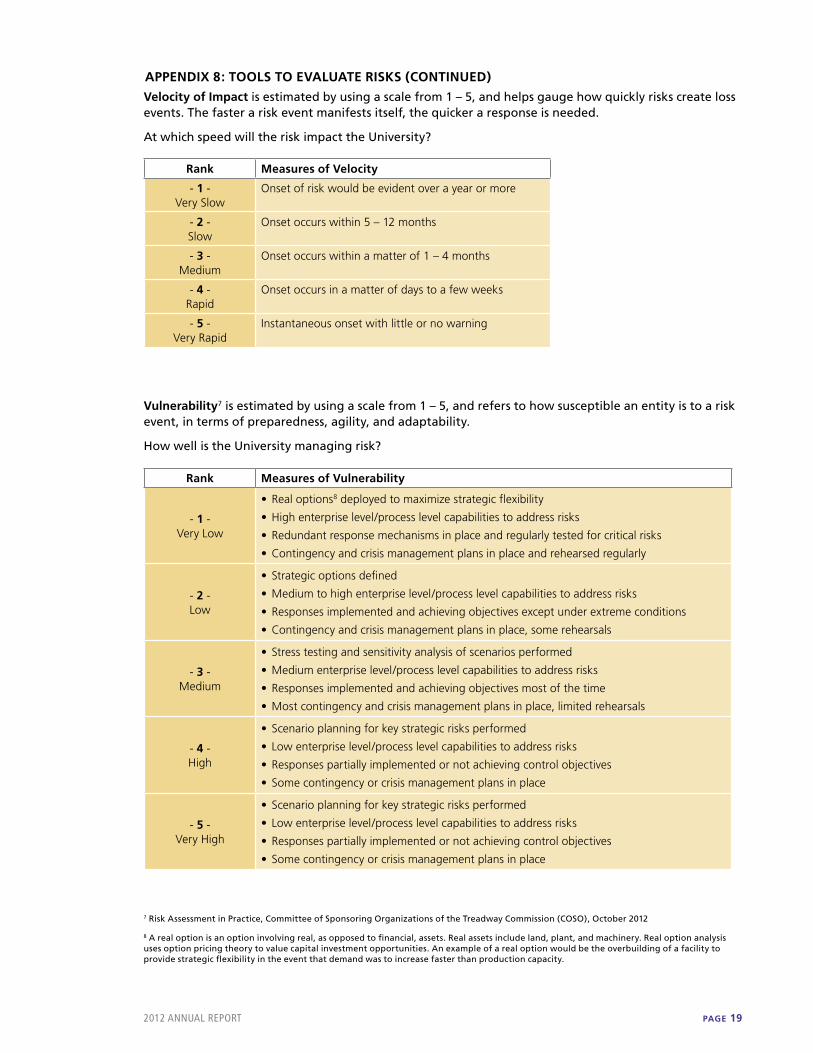
Velocity of Impact is estimated by using a scale from 1 – 5, and helps gauge how quickly risks create loss events. The faster a risk event manifests itself, the quicker a response is needed.
At which speed will the risk impact the University?
Rank Measures of Velocity
- 1 - Very Slow
Onset of risk would be evident over a year or more
- 2 - Slow
Onset occurs within 5 – 12 months
- 3 - Medium
Onset occurs within a matter of 1 – 4 months
- 4 - Rapid
Onset occurs in a matter of days to a few weeks
- 5 - Very Rapid
Instantaneous onset with little or no warning
Rank Measures of Vulnerability
- 1 - Very Low
• Real options8 deployed to maximize strategic flexibility
• High enterprise level/process level capabilities to address risks
• Redundant response mechanisms in place and regularly tested for critical risks
• Contingency and crisis management plans in place and rehearsed regularly
- 2 - Low
• Strategic options defined
• Medium to high enterprise level/process level capabilities to address risks
• Responses implemented and achieving objectives except under extreme conditions
• Contingency and crisis management plans in place, some rehearsals
- 3 - Medium
• Stress testing and sensitivity analysis of scenarios performed
• Medium enterprise level/process level capabilities to address risks
• Responses implemented and achieving objectives most of the time
• Most contingency and crisis management plans in place, limited rehearsals
- 4 - High
• Scenario planning for key strategic risks performed
• Low enterprise level/process level capabilities to address risks
• Responses partially implemented or not achieving control objectives
• Some contingency or crisis management plans in place
- 5 - Very High
• Scenario planning for key strategic risks performed
• Low enterprise level/process level capabilities to address risks
• Responses partially implemented or not achieving control objectives
• Some contingency or crisis management plans in place
Vulnerability7 is estimated by using a scale from 1 – 5, and refers to how susceptible an entity is to a risk event, in terms of preparedness, agility, and adaptability.
How well is the University managing risk?
7 Risk Assessment in Practice, Committee of Sponsoring Organizations of the Treadway Commission (COSO), October 2012
8 A real option is an option involving real, as opposed to financial, assets. Real assets include land, plant, and machinery. Real option analysis uses option pricing theory to value capital investment opportunities. An example of a real option would be the overbuilding of a facility to provide strategic flexibility in the event that demand was to increase faster than production capacity.
PAGE 192012 ANNUAL REPORT

APPENDIX 9: INFORMATION TECHNOLOGY GOVERNANCE STRUCTURE
PAGE 20UW ENTERPRISE RISK MANAGEMENT
APPENDIX 10: UW MEDICINE PATIENT SAFETY
UW Medicine Continues to Advance Patient Safety & Quality
UW Medicine - Harborview Medical Center (HMC), UW Medical Center (UWMC), Northwest Hospital (NWH), Valley Medical Center (VMC), UW Neighborhood Clinics (UWNC), UW Physicians (UWP), Airlift Northwest (ALNW), and the UW School of Medicine (SOM) continue to focus on Patient Safety and Quality of Care as the top priority through our Patients Are First initiative and our Coordinated Quality Improvement Program (CQIP) plan.9 Major steps in accelerating the quality and safety agenda over the past year include:
• OngoingintegrationofPatientSafetyandQualityprograms/metricsacrossUWMedicinesystem asoutlinedintheUWMedicineStrategicPlanandtheUWMedicinePatientsAreFirstPillarGoalsfor FY 13.
• DevelopmentofanewUWMedicineBoardlevelPatientSafetyandQualityCommitteethat meets quarterly to review the system-wide efforts. The committee has met over the past year anddevelopedthefirstannualreporttotheUWBoardofRegentswhichwaspresentedinNovember 2012.
• ContinuedengagementoftheUWMedicineBoard,eachentitylevelboard,and/orcommitteesofthe boards in review and oversight of activities regarding patient safety, quality of care, access to care and satisfaction with care and services.
• StrategicGoalsandMetricsdeveloped,withfocuson:ReductionsinPreventableDeaths,HospitalAcquiredInfections,andPreventableAdverseEvents;andImprovementinCoreMeasuresofCare,in Ambulatory Health Measures and Patient Satisfaction using national and regional benchmarks for comparison.
• AdvancementoftheUWMedicineelectronicdashboardtoolformonitoringandreportingofallUW Medicine Patients Are First quality & safety data with ability to drill-down into site-specific and physician specific performance related to quality of care and patient satisfaction data.
• SuccessfulimplementationofthemajorITprojectforCernerComputerizedPhysicianOrderEntry(CPOE) at Harborview and UW Medical Center this past year. CPOE provides over 400 standard order sets to assure high quality, safe, and cost effective care for our patients.
• UWMedicinesystem-wideInfectionControlCommitteecreatedtocoordinatethedevelopment,implementation, and resource utilization to support those infection control activities that span across UW Medicine and to develop and promote standardized infection control practices.
• AccelerationofTeamSteppstrainingforphysiciansandhealthcareteammembersandsupporteddevelopment of additional ISIS simulation training.
• ParticipationinanAssociationofAmericanMedicalColleges(AAMC)andUniversityHealthSystemConsortium(UHC)“BestPracticesforBetterCare”initiativetoimprovethequalityandsafetyofhealthcare by expanding the culture of safety into medical education at the undergraduate and graduate medical education levels, and enhancing research into quality and patient safety.
• ContinuedtoadvanceandimprovetheUHCAnnualReportCardonPatientSafetyandQualityin academic medical centers. Harborview and UW Medical Center are performing at or above the mean score in UHC which includes over 100 academic medical centers.
• SuccessfulcompletionofthefirstseriesofPatientSafetyInnovationProgram(PSIP)grantsforpromising pilot projects that promote collaboration between clinicians and researchers to explore solutions to patient safety and quality of care challenges. An example of a recently completed projectis“HighlightingRadiologyCriticalResultsinUWMedicineEMRSystems”.Sevennewprojects were selected and launched on February 1, 2013.
9 RCW 43.70.510
PAGE 212012 ANNUAL REPORT

APPENDIX 11: UW HUMAN RESOURCES
UW SafeCampus Update: Now in its fifth year of operation, the Violence Prevention and Response Program (VPRP) expanded its training efforts in 2012 by joining UW Police to pilot active shooter response training. In addition, the SafeCampus public information campaign, a violence prevention component in the new employee orientation for staff, is an ongoing training effort available to the community-at-large through general sessions, or upon request to specific groups or departments. Online training videos are also available on the SafeCampus website.
Staffed by individuals with experience in violence prevention, victim advocacy, and program management, the VPRP team responds to calls from the three SAFE phone lines. The phone lines operate 24/7andservetheSeattle,Bothell,andTacomacampuses.Staffhelpcallersclarifytheirconcerns,identify immediate risk mitigation steps, connect callers with University or community resources, and arrange for follow-up as needed.
Program enhancements and the volume of services provided are outlined in a SafeCampus report in the Appendices.
UW Affiliation of People Involved in Incidents
UW Affi l iation CountNone Listed 0Other 0Public 8Public (Patient) 4Public (Personal Relationship)
3
Public (Previous UW Affi l iation)
3
Unknown Identity 1UW Faculty 2UW Graduate Student 4UW Staff - Non supervisor 21UW Staff - Supervisor 2UW Undergraduate Student 16VPRP Partner 0
Person Causing a ConcernUW Affi l iation CountNone Listed 0Other 0Public 0Public (Patient) 0Public (Personal Relationship)
0
Public (Previous UW Affi l iation)
1
Unknown Identity 0UW Faculty 13UW Graduate Student 6UW Staff - Non supervisor 25UW Staff - Supervisor 3UW Undergraduate Student 10VPRP Partner 0
Person Experiencing a ConcernUW Affi l iation CountNone Listed 2Other 1Public 2Public (Patient) 0Public (Personal Relationship)
1
Public (Previous UW Affi l iation)
1
Unknown Identity 0UW Faculty 18UW Graduate Student 3UW Staff - Non supervisor 24UW Staff - Supervisor 26UW Undergraduate Student 10VPRP Partner 9
Person Reporting a Concern
PAGE 22UW ENTERPRISE RISK MANAGEMENT

APPENDIX 11: UW HUMAN RESOURCES CONTINUED:
SAFECAMPUS QUARTERLY REPORT 10/01/2012 – 12/31/2012
NUMBER OF INCIDENTS AND ASSESSMENTS BY MONTH
Compared to Previous Year
32 31 26
7 4 4
0 5
10 15 20 25 30 35
Incidents
Assesments
25 25 28
5 3 3
0
5
10
15
20
25
30
Incidents
Assesments
1
10
76
2
Number of Incidents by Response Level Total- 89 Incidents
Level 1- Immediate notification. Violence Prevention Assessment Team (VPAT) is notified and convened as soon as possible.
Level 2- Standard notification. Issue is discussed at next scheduled VPAT meeting (VPAT held3x/week) and Risk Mitigation Plan is developed.
Level 3- Situations assigned Level 3 do not have a VPAT. VPRP is responsible for monitoring and following up on required risk mitigation strategies or they are referred to other UW departments to be the lead and carry out further actions. Level 4- Request for information/materials or not UW jurisdiction.
PAGE 232012 ANNUAL REPORT

APPENDIX 11: UW HUMAN RESOURCES CONTINUED:
SAFECAMPUS QUARTERLY REPORT 10/01/2012 – 12/31/2012
51
3 3
6
10
16
Count by Incident Type Total 89 Incidents
Inappropriate Behavior Information
Other
Self Harm - concerns
Violence - actual
Violence - concerns
4
13
1 5 14
13
1
Inappropriate Behavior Breakout of 51 Issues
Personal Relationship
Unwanted Contact - non relationship Interpersonal Conflict - non relationship- 0 Suspicious Activity
Workplace conduct
Academic Conduct
Other
Of the 10 incidents of actual violence, seven were related to intimate partner violence, two were employee-on-employee assaults, and one involved a parking lot altercation between a professor and student.
Inappropriate behavior is used to categorize a range of behaviors that are disruptive to the workplace or campus community. This graph shows the breakdown of different types of things categorized under the broad heading of inappropriate behavior.
PAGE 24UW ENTERPRISE RISK MANAGEMENT
APPENDIX 11: UW HUMAN RESOURCES CONTINUED:
SAFECAMPUS QUARTERLY REPORT 10/01/2012 – 12/31/2012
COMMUNICATIONS, OUTREACH, AND TRAINING
Campus Violence Prevention TrainingDuringthisquarter,357participantsattendedtheviolencepreventiontraining.SafeCampushostedfourgeneral sessions open to anyone on campus.
Response To Active Shooter TrainingSeventy participants attended a training conducted for the iSchool.
Specialized Training OutreachThe Violence Prevention & Response Program continued partnering with Arts & Sciences leaders to increase training for the school’s faculty and staff. The Political Science, Sociology, Center for the Studies ofDemographyandEcology,andPhysicsdepartmentsallheldtrainingsessionsduringthetimeperiod.
Green DotTheGreenDotTeamgave14overviewspeechestocampusgroupsandconductedthesix-hourbystander training for 25 students.
SafeCampus Website CommunicationsThe SafeCampus website was accessed 5,302 times by 2,911 unique visitors during the fourth quarter of 2012, with an average of 2.55 page views per visit.
UW CareLinkUW CareLink utilization was at 6.0%, and 446 news cases were opened.
On outcome surveys, 90 to 92% of respondents indicated that they were able to function better at work, could manage their problems better, and had improved relationships.
UW Police DepartmentUWPDofficersprovided13standbys,8safetypresentations,5securityassessments,andservedorattempted to serve 21 courts orders. Participants registered 67 bikes and 279 pieces of electronic equipmentwithUWPD.
UWPD Victim AdvocateThe victim advocate worked with 33 new clients and provided 8 accompaniments to court. The victim advocate had a total of 329 client contacts in the fourth quarter.
UW AlertUWAlerthad54,338subscribersduringthetimeperiod.Therewere2alertstotheBothellCampusand9 alerts to the Seattle Campus.
Report prepared by the Violence Prevention and Response Program (VPRP), University of Washington. VPRP acts as the central point of communication and the coordinating unit for violence mitigation activities across the UW. The Violence Prevention and Response Program is a partnership of key players in campus safety and violence prevention, including Student Life, Human Resources, theBothellandTacomacampuses,UWandHarborviewMedicalCenters,theUWPoliceDepartment,AcademicHumanResources,andtheGraduateSchool.
PAGE 252012 ANNUAL REPORT

APPENDIX 12: ENTERPRISE RISK MANAGEMENT PRESENTATION TO THE PACIFIC NORTHWEST ENTERPRISE RISK FORUM
PAGE 26UW ENTERPRISE RISK MANAGEMENT

PAGE 272012 ANNUAL REPORT

PAGE 28UW ENTERPRISE RISK MANAGEMENT

PAGE 292012 ANNUAL REPORT

PAGE 30UW ENTERPRISE RISK MANAGEMENT

PAGE 312012 ANNUAL REPORT

PAGE 32UW ENTERPRISE RISK MANAGEMENT

PAGE 332012 ANNUAL REPORT

PAGE 34UW ENTERPRISE RISK MANAGEMENT

PAGE 352012 ANNUAL REPORT

PAGE 36UW ENTERPRISE RISK MANAGEMENT

PAGE 372012 ANNUAL REPORT

PAGE 38UW ENTERPRISE RISK MANAGEMENT

PAGE 392012 ANNUAL REPORT

PAGE 40UW ENTERPRISE RISK MANAGEMENT

PAGE 412012 ANNUAL REPORT

PAGE 42UW ENTERPRISE RISK MANAGEMENT

PAGE 432012 ANNUAL REPORT

PAGE 44UW ENTERPRISE RISK MANAGEMENT

