university of wisconsin la crosse · 2017-09-19 · weekly room hours wrh + wrh's rolled...
TRANSCRIPT

Paulien & Associates
University of Wisconsin‐La CrosseJanuary 2015 Presentation of Findings

Paulien & Associates
Agenda | Project Scope
• New Science Office Reconciliation
• Classroom Mix & Utilization Findings
• Space Needs Analysis Findings
• Reallocation/Implementation Strategies
• College of Business Administration ‐ Review 2011 Study
2

Paulien & Associates
New Science Office Reconciliation• Position Reconciliation:
– Four (4) additional T/TT Faculty headcount– Nine (9) additional Lecturer headcount– Balance in non‐instruction/lab support– One (1) fewer Classified– Eight (8) fewer graduate assistants– Two (2) fewer teaching assistants
• Square Foot Reconciliation:
– Short 1,560 ASF in faculty office space– Excess of 1,320 ASF in open office environment– Overall 240 ASF short of office space
3
Paulien & Associates
Classroom Mix
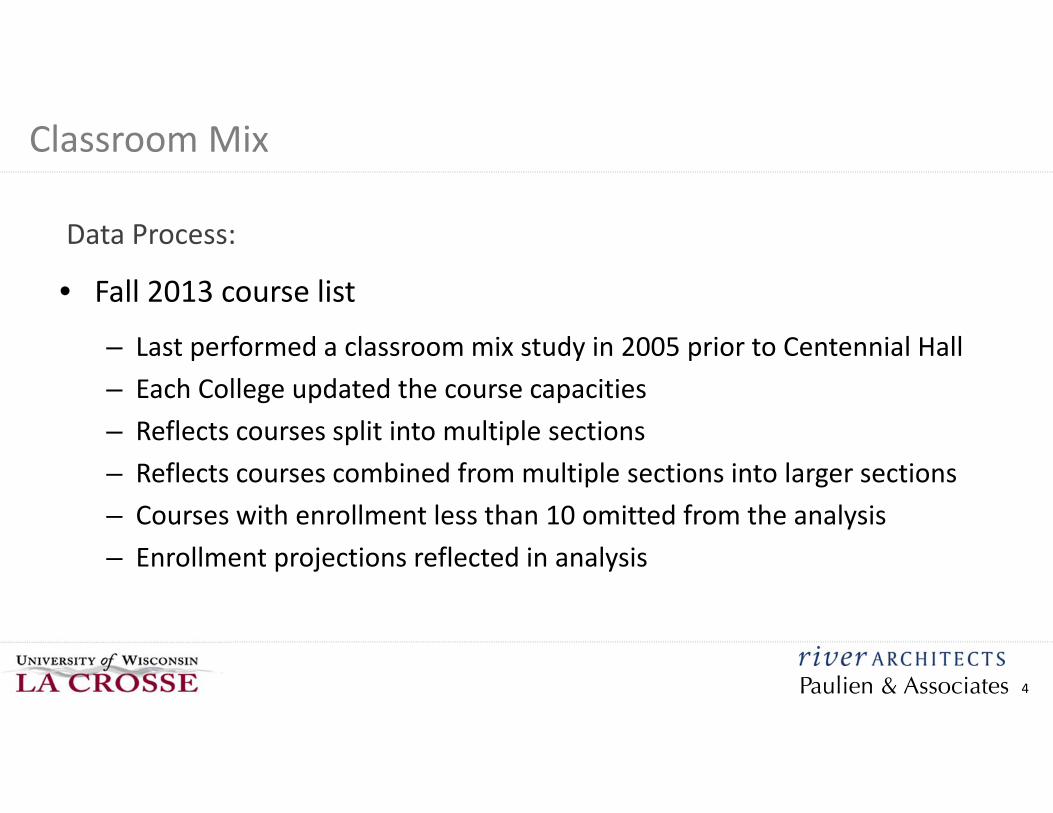
Data Process:
• Fall 2013 course list
– Last performed a classroom mix study in 2005 prior to Centennial Hall– Each College updated the course capacities– Reflects courses split into multiple sections – Reflects courses combined from multiple sections into larger sections– Courses with enrollment less than 10 omitted from the analysis– Enrollment projections reflected in analysis
4

Paulien & Associates
Classroom MixData Process:
• “B” classrooms removed from inventory
– The total classrooms in the utilization will not equal the total classroom existing in the mix analysis
• Remaining classrooms right‐sized with following exceptions
– Fixed seat classrooms not right‐sized– Centennial Hall classrooms not right‐sized
• Health Science Center not included in the analysis
• UW System current utilization expectation used in analysis
– 35 WRH, sliding scale SSO (current UWL 30 WRH, 60% SSO)
Building RoomCowley Hall CH 41Cowley Hall CH 45Cowley Hall CH 405Thomas Morris Hall TMH 165Wimberly Hall WH 332
Fall 2013 - "B" Classroom List
5
Paulien & Associates
Classroom Mix
6
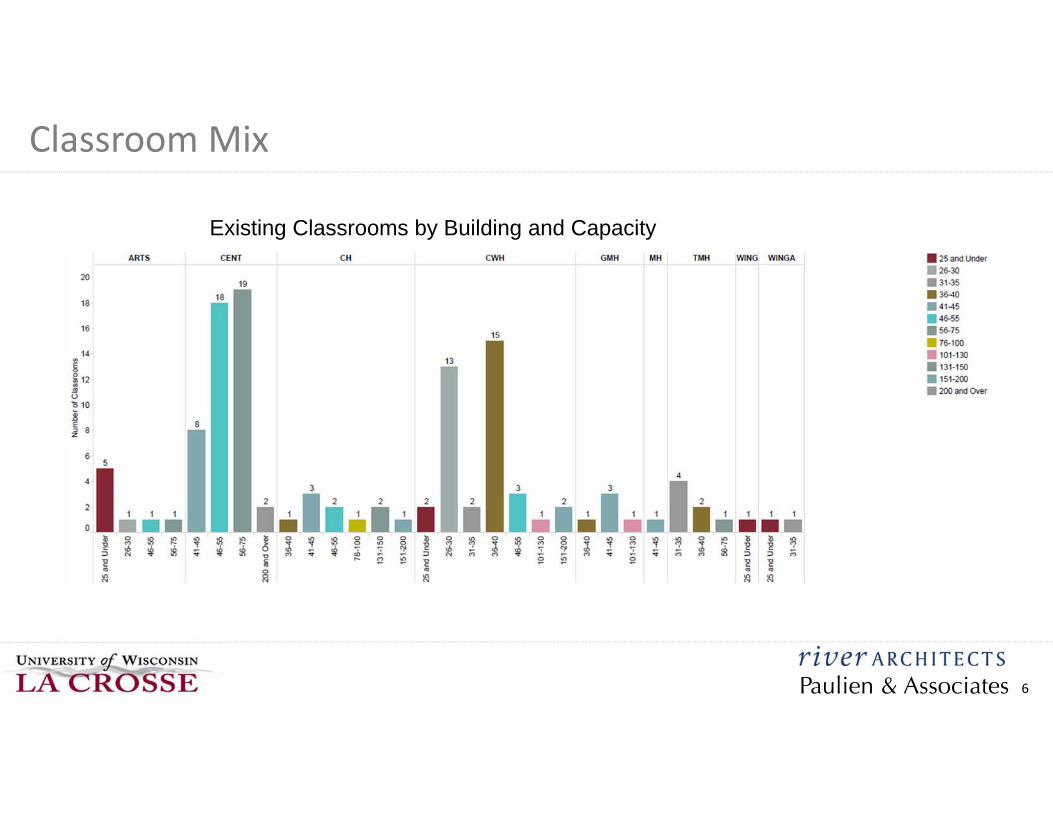
Existing Classrooms by Building and Capacity

Paulien & Associates
Classroom Mix
8
Projected Classroom Mix Analysis Scenario 3.5% GrowthAnalysis excludes courses with fewer than ten students enrolled
Classroom Capacity Groupings
Total No. of Seats
Total No. of Rooms
Weekly Room Hours
WRH + WRH's Rolled
Forward
WRH's to Roll
ForwardNo. of
RoomsSurplus/ (Deficit)
25 and Under 248 12 512 512 22 14 (2)26-30 592 21 267 289 9 8 1331-35 365 11 585 594 0 17 (6)36-40 580 15 424 424 4 12 341-45 473 11 310 314 0 9 246-55 966 19 784 784 14 22 (3)56-75 1,333 20 378 392 7 11 976-100 0 0 207 214 4 6 (6)101-130 130 1 91 95 25 2 (1)131-150 283 2 0 25 25 0 2151-200 561 3 9 34 0 1 2200 and Over 510 2 12 12 1 1
TOTAL 6,043 117 3,579 103 14
Existing Classrooms Right-Sized Projected Classroom Need with WRHs rolled forward
11(26-30)
(1)(41-45)
(2)(76-100)
6(56-75)
Paulien & Associates
Classroom Mix
9

Paulien & Associates
Classroom MixScenarios:
• Overabundance of 26‐30 station rooms– Increase SSO to approaching 75% to accommodate 31‐35
shortfall– Add seats to select rooms to increase stations– Combination of the above
• Overabundance of 56‐75 station rooms– Same options as above to compensate for lack of 76‐100
station rooms– Remove seats to create active learning spaces
• Lack of 76‐100 station rooms– Combine 56‐75 rooms if possible– Look for opportunities to create active learning spaces– Wimberly Hall/Cowley Hall Phase II options
Classroom Capacity Groupings
Total No. of Rooms
No. of Rooms
Surplus/ (Deficit)
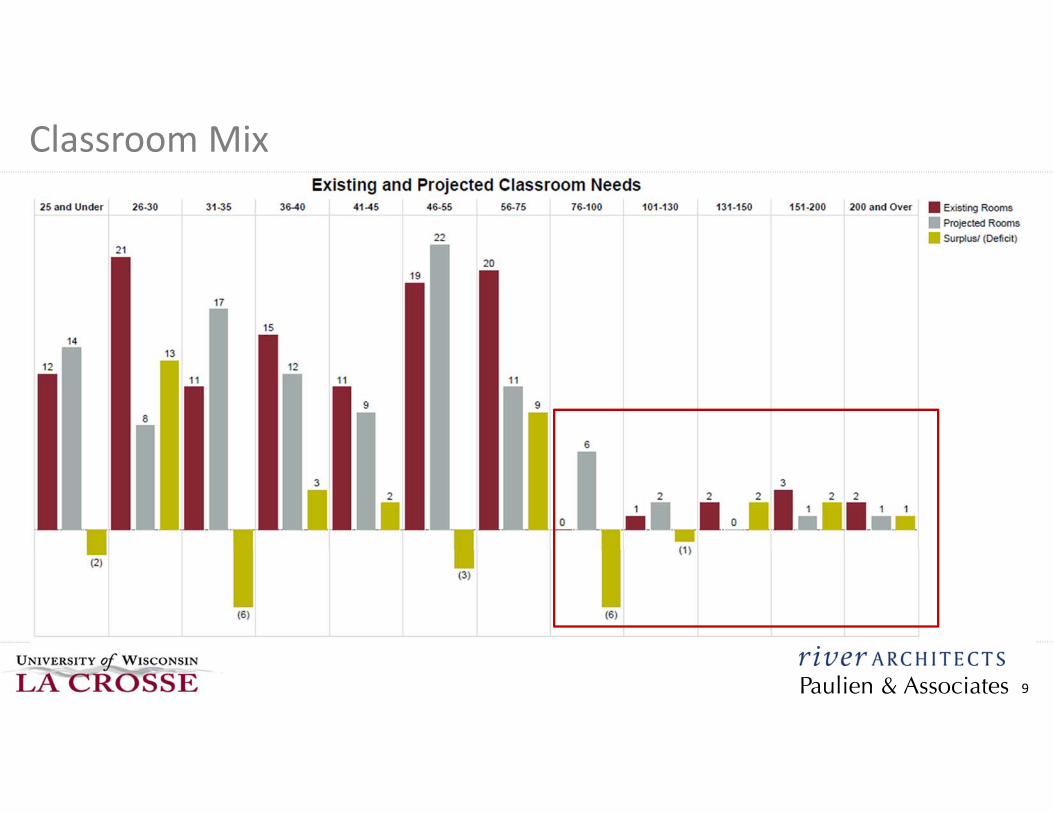
25 and Under 12 14 (2)26-30 21 8 1331-35 11 17 (6)36-40 15 12 341-45 11 9 246-55 19 22 (3)56-75 20 11 976-100 0 6 (6)101-130 1 2 (1)131-150 2 0 2151-200 3 1 2200 and Over 2 1 1
TOTAL 117 103 14
Existing Classrooms Right-Sized
Projected Classroom Need with WRHs rolled
forward
11(26-30)
(1)(41-45)
(2)(76-100)
6(56-75)
10

Paulien & Associates
Classroom MixScenarios:
• 112 WRH in sections over 100 students
– @ 35 WRH equals 3.2 rooms
• Currently eight classrooms over 100 stations
– 3 in Wimberly Hall– 3 in Cowley Hall– 2 in Centennial Hall– Mix shows need for four rooms
100 stations or greater
Classroom Over 100 StationsUtilization Review
Building Room ID ASFNo.
Stations Seat Type Dept.Classroom
group WRH SSOCWH CWH 141 1,826 130 Fixed Stations CNG 101-130 36 61%CH CH 156 1,600 138 Fixed Stations CHM 131-150 33 55%CH CH 100 1,872 145 Fixed Stations BIO 131-150 30 60%CWH CWH 122 2,512 185 Fixed Stations CNG 151-200 24 52%CWH CWH 102 2,510 185 Fixed Stations CNG 151-200 30 34%CH CH 140 1,995 191 Fixed Stations BIO 151-200 35 43%CENT CENT 1400 3,443 255 Fixed Stations CNG 200 and Over 35 32%CENT CENT 1309 3,438 255 Fixed Stations CNG 200 and Over 30 59%
WRH = Weekly Room HourSSO = Student Station OccupancyASF = Assignable Square Feet
11
Paulien & Associates
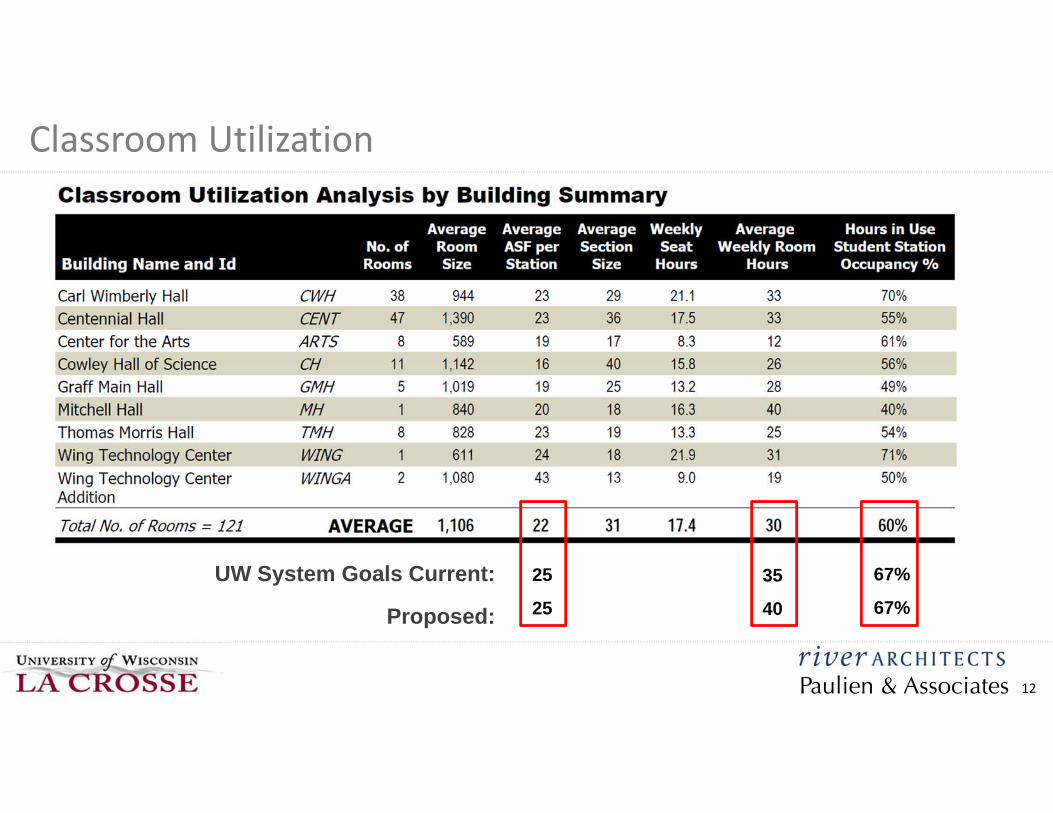
Classroom Utilization
35
40
67%
67%
25
25
UW System Goals Current:
Proposed:
12
Paulien & Associates
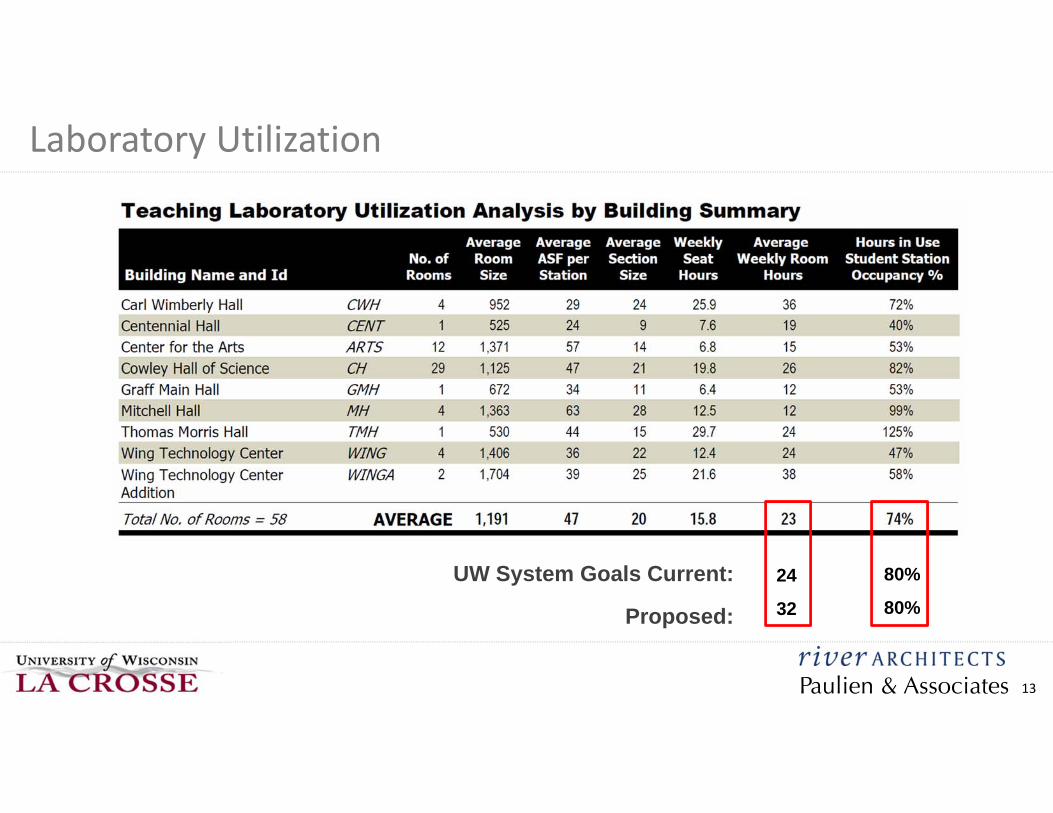
Laboratory Utilization
24
32
80%
80%
UW System Goals Current:
Proposed:
13

Paulien & Associates
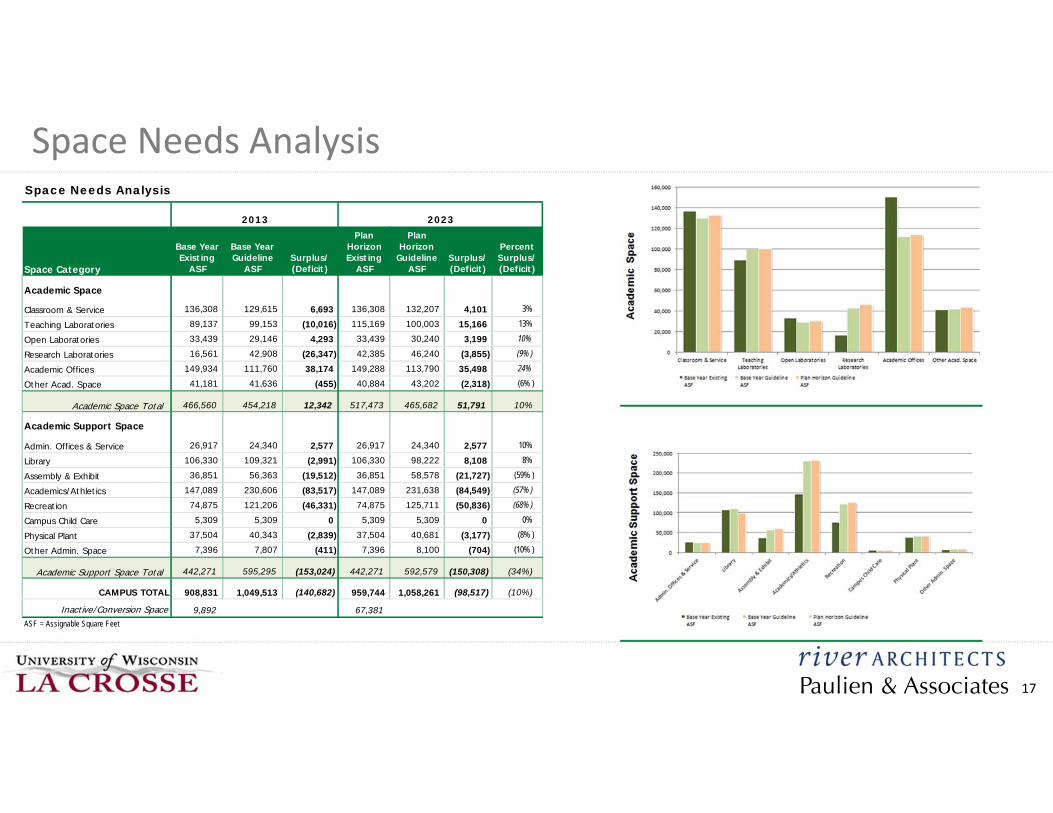
Space Needs Analysis
• SNA by space category
– Academic Space– Academic Support Space
• Base Year 2013 ‐ Plan Horizon 2023
• Not Included in Study:
– Residence Life/Dining– Upper Level Administration– Student Center
• Data Included:
– Fall 2013 course file– UWL facility inventory file– January 28, 2014 Staffing file
• Enrollment and Staffing projections provided by UWL
• Plan Horizon existing ASF includes
– New Science pre‐design space program
14

Paulien & Associates
• Existing Space in Study
15
Space Needs Analysis
Space Category Total ASF
Classroom Space 136,308Laboratory Space 89,137Open Laboratory Space 33,439Research Space 16,561Office Space 176,851Library Space 106,330Athletics/Academics 147,089Recreation 74,875Campus Child Care 5,309Assembly & Exhibit 36,851Other Academic/Admin Department 48,577Physical Plant 37,504
Total ASF 908,831
ASF = Assignable Square Feet

Paulien & Associates
Enrollment | Faculty & Staff ProjectionsFaculty and Staff Projections
Unduplicated Headcount
Employee TypeExisting
(Fall 2013)Plan Horizon
(2023)
Percent Increase/ Decrease (from
existing)Faculty | Total 622 642 3%Staff | Total 680 685 1%
Total Faculty & Staff Headcount: 1,302 1,327
Full-time Equivalent (FTE)
Employee TypeExisting
(Fall 2013)Plan Horizon
(2023)
Percent Increase/ Decrease (from
existing)Faculty Full Time| On-campus 530 540Faculty Part Time| On-campus 41 46Faculty | On-line (if on-campus) 0 0Faculty | Total 571 586 3%Staff | Total 648 652 1%
Total Faculty & Staff FTE: 1,219 1,238
16
Paulien & Associates
Space Needs AnalysisSpace Needs Analysis
Space Category
Base Year Existing
ASF
Base Year Guideline
ASFSurplus/(Deficit)
Plan Horizon Existing
ASF
Plan Horizon
Guideline ASF
Surplus/(Deficit)
PercentSurplus/(Deficit)
Academic Space
Classroom & Service 136,308 129,615 6,693 136,308 132,207 4,101 3%
Teaching Laboratories 89,137 99,153 (10,016) 115,169 100,003 15,166 13%
Open Laboratories 33,439 29,146 4,293 33,439 30,240 3,199 10%
Research Laboratories 16,561 42,908 (26,347) 42,385 46,240 (3,855) (9%)
Academic Offices 149,934 111,760 38,174 149,288 113,790 35,498 24%
Other Acad. Space 41,181 41,636 (455) 40,884 43,202 (2,318) (6% )
Academic Space Total 466,560 454,218 12,342 517,473 465,682 51,791 10%
Academic Support Space
Admin. Offices & Service 26,917 24,340 2,577 26,917 24,340 2,577 10%
Library 106,330 109,321 (2,991) 106,330 98,222 8,108 8%
Assembly & Exhibit 36,851 56,363 (19,512) 36,851 58,578 (21,727) (59% )
Academics/Athletics 147,089 230,606 (83,517) 147,089 231,638 (84,549) (57%)
Recreation 74,875 121,206 (46,331) 74,875 125,711 (50,836) (68%)
Campus Child Care 5,309 5,309 0 5,309 5,309 0 0%
Physical Plant 37,504 40,343 (2,839) 37,504 40,681 (3,177) (8% )
Other Admin. Space 7,396 7,807 (411) 7,396 8,100 (704) (10% )
Academic Support Space Total 442,271 595,295 (153,024) 442,271 592,579 (150,308) (34%)
CAMPUS TOTAL 908,831 1,049,513 (140,682) 959,744 1,058,261 (98,517) (10%)
Inactive/Conversion Space 9,892 67,381ASF = Assignable Square Feet
2013 2023
17
Paulien & Associates
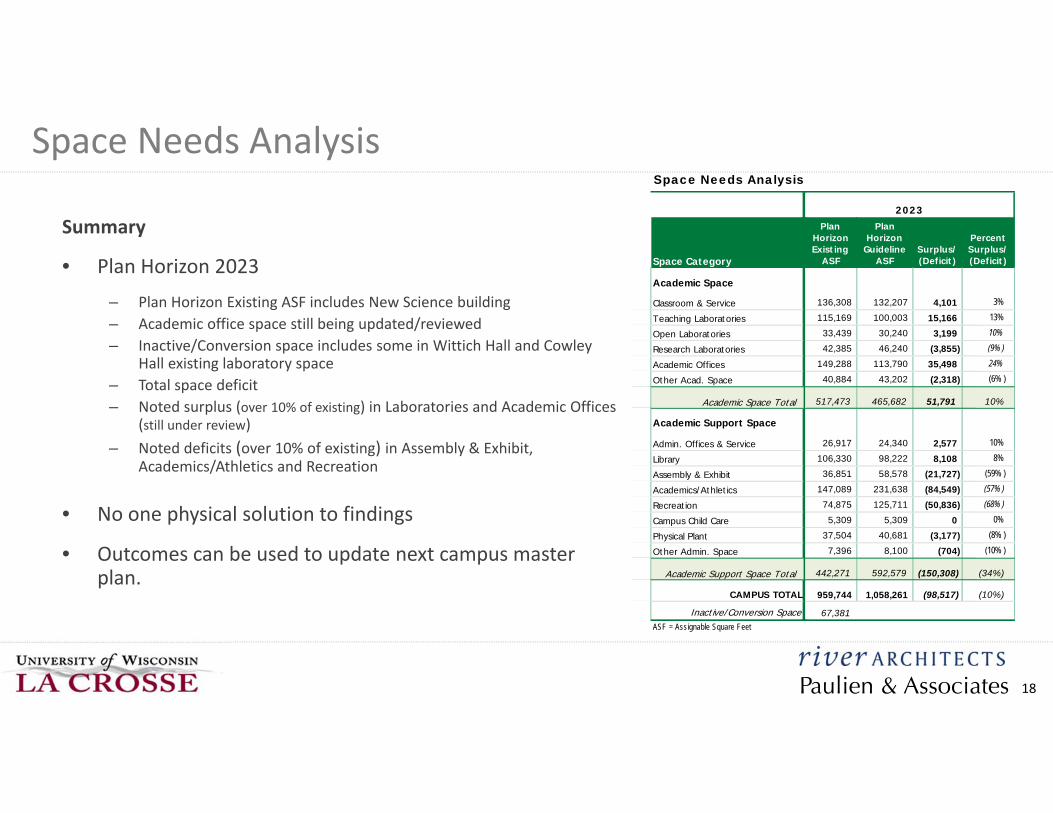
Space Needs Analysis
Summary
• Plan Horizon 2023– Plan Horizon Existing ASF includes New Science building– Academic office space still being updated/reviewed– Inactive/Conversion space includes some in Wittich Hall and Cowley
Hall existing laboratory space– Total space deficit– Noted surplus (over 10% of existing) in Laboratories and Academic Offices
(still under review)– Noted deficits (over 10% of existing) in Assembly & Exhibit,
Academics/Athletics and Recreation
• No one physical solution to findings
• Outcomes can be used to update next campus master plan.
Plan Horizon Existing
ASF
Plan Horizon
Guideline ASF
Surplus/(Deficit)
PercentSurplus/(Deficit)
136,308 132,207 4,101 3%115,169 100,003 15,166 13%
33,439 30,240 3,199 10%
42,385 46,240 (3,855) (9%)
149,288 113,790 35,498 24%
40,884 43,202 (2,318) (6% )
517,473 465,682 51,791 10%
26,917 24,340 2,577 10%106,330 98,222 8,108 8%
36,851 58,578 (21,727) (59% )147,089 231,638 (84,549) (57%)
74,875 125,711 (50,836) (68%)
5,309 5,309 0 0%37,504 40,681 (3,177) (8% )
7,396 8,100 (704) (10% )
442,271 592,579 (150,308) (34%)
959,744 1,058,261 (98,517) (10%)
67,381
2023
Space Needs Analysis
Space Category
Academic Space
Classroom & Service
Teaching Laboratories
Open Laboratories
Research Laboratories
Academic Offices
Other Acad. Space
Academic Space Total
Academic Support Space
Admin. Offices & Service
Library
Assembly & Exhibit
Academics/Athletics
Recreation
Campus Child Care
Physical Plant
Other Admin. Space
Academic Support Space Total
CAMPUS TOTAL
Inactive/Conversion SpaceASF = Assignable Square Feet
18

Paulien & Associates
Reallocation/Implementation StrategiesFacility Reuse Options:
• CoBA vacated space with completion of Wittich Hall capital project
– Potential backfill of Wimberly Hall• Disability Resources – Upward Bound – Military Science• Health Education & Health Professions• Conversion of some classrooms to collaborative learning spaces• Others
• Cowley Hall Phase II
– Science soft support space– Classrooms?
• One tiered 100 seat active learning classroom• One flat floor 100 station active learning environment• XX number of mid size standard classrooms• Need to offset any classrooms with reductions in other
buildings per classroom mix analysis– Offices (some private some open office w/huddle rooms?)– Other academic support space
College of Business Administration - Existing Space
Building ClassroomsTeaching
Labs Acad Office Total
Carl Wimberly Hall 8,212 0 12,642 20,854
Wing Technology Center 0 0 1,229 1,229
Cowley Hall of Science 810 1,080 0 1,890
Total 9,022 1,080 13,871 23,973
19
Paulien & Associates
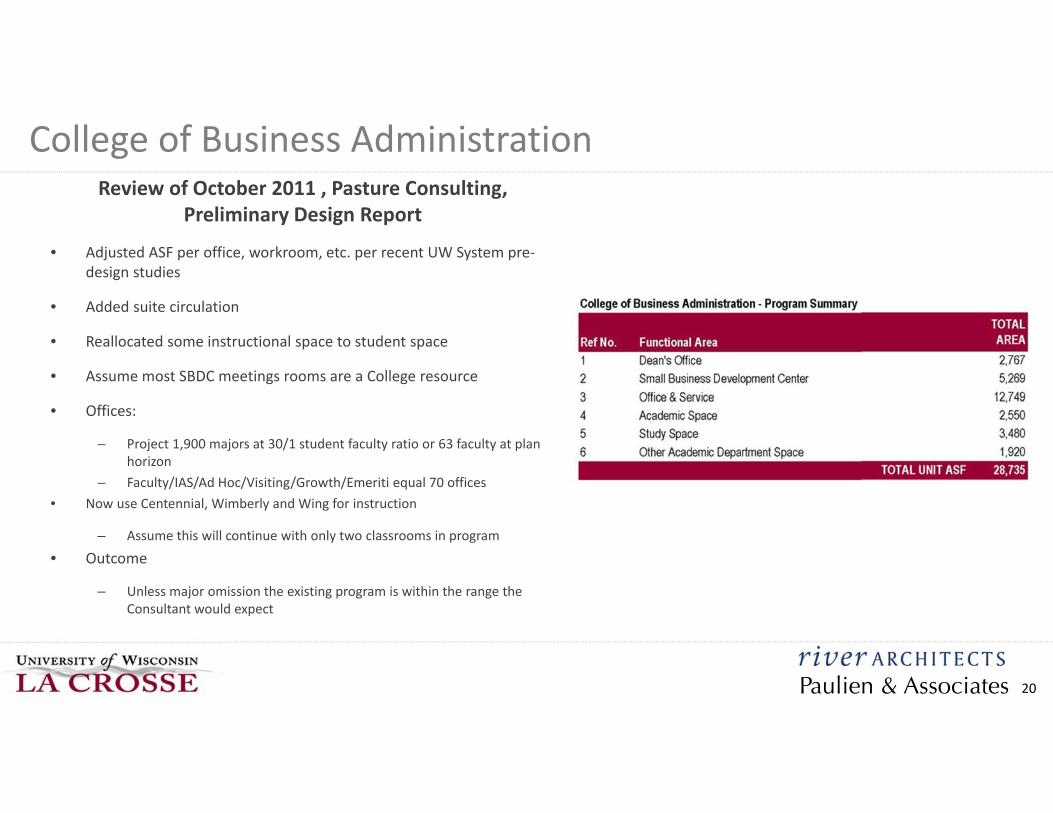
College of Business AdministrationReview of October 2011 , Pasture Consulting,
Preliminary Design Report
• Adjusted ASF per office, workroom, etc. per recent UW System pre‐design studies
• Added suite circulation
• Reallocated some instructional space to student space
• Assume most SBDC meetings rooms are a College resource
• Offices:
– Project 1,900 majors at 30/1 student faculty ratio or 63 faculty at plan horizon
– Faculty/IAS/Ad Hoc/Visiting/Growth/Emeriti equal 70 offices• Now use Centennial, Wimberly and Wing for instruction
– Assume this will continue with only two classrooms in program
• Outcome
– Unless major omission the existing program is within the range the Consultant would expect
20
Paulien & Associates
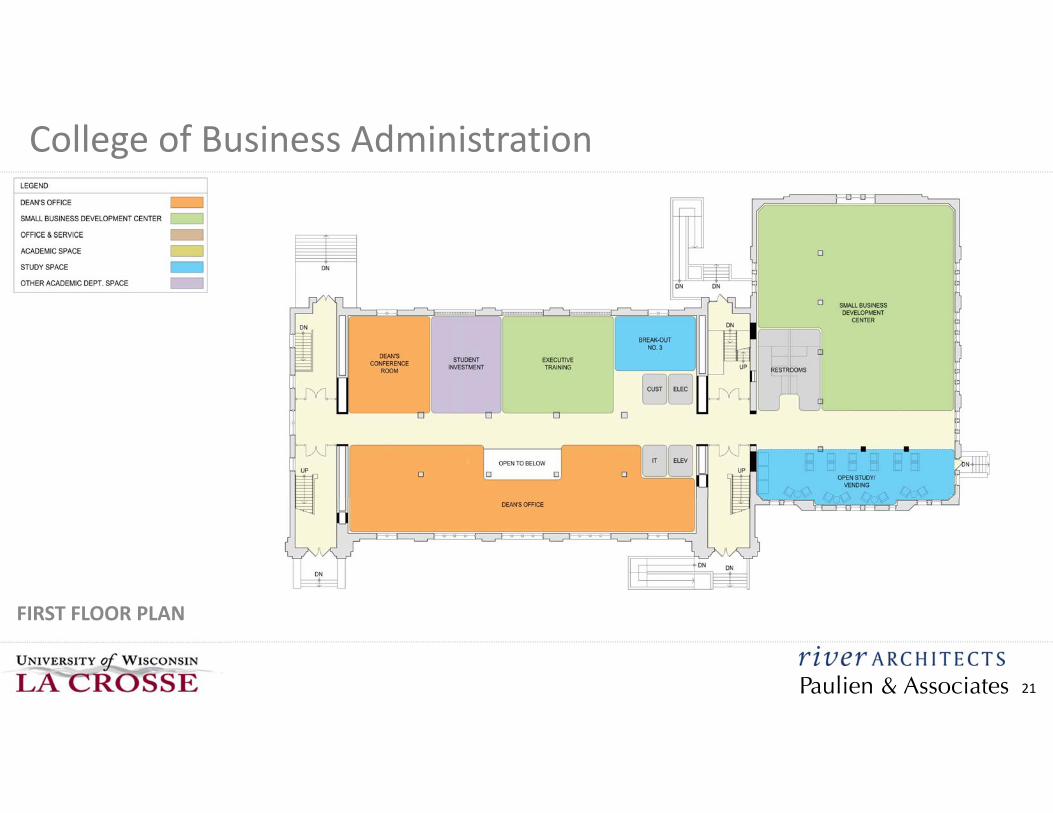
College of Business Administration
FIRST FLOOR PLAN
21
Paulien & Associates
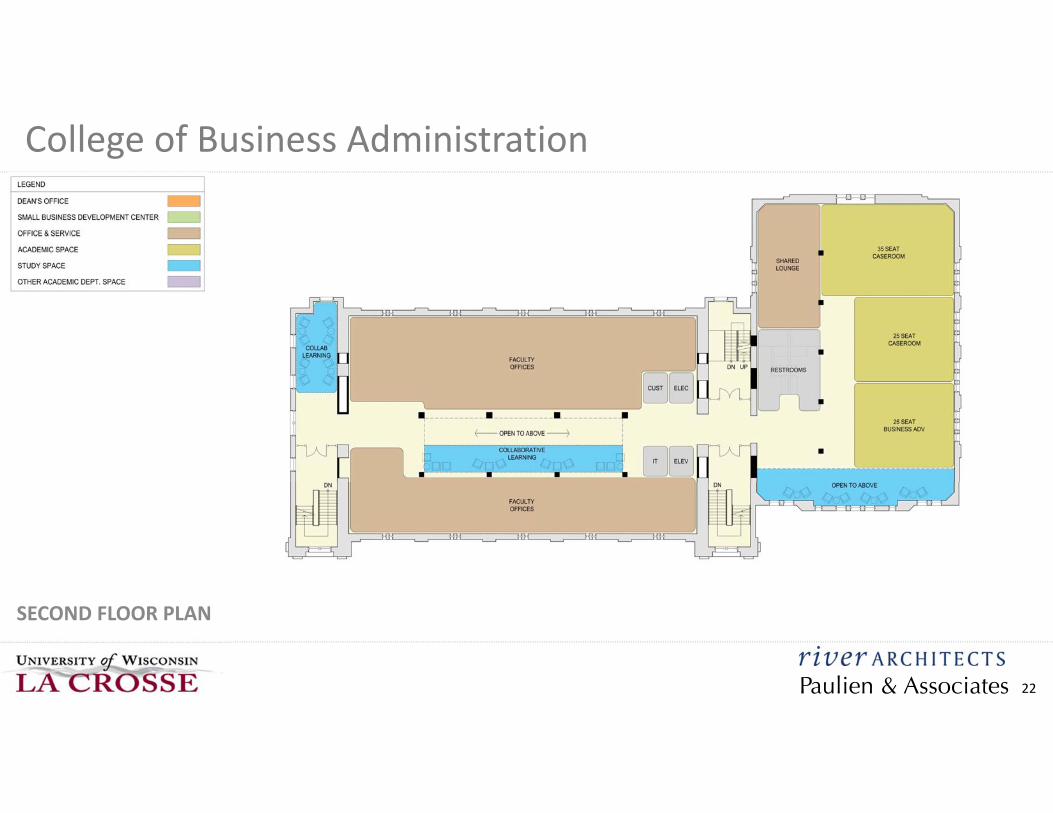
College of Business Administration
SECOND FLOOR PLAN
22

Paulien & Associates
College of Business Administration
THIRD FLOOR PLAN
23

Paulien & Associates
College of Business Administration
LOWER LEVEL FLOOR PLAN
24

Paulien & Associates
College of Business Administration• Summary:
• Project Cost Review• $21,420,000 Pasture Report (2011)
• Engineering Review• Assumptions still valid
25

Paulien & Associates
Questions?University of Wisconsin‐La Crosse
January 2015 Presentation of Findings