university, yogyakarta, indonesia 2 department of environmental technology, technical university...
TRANSCRIPT
1 23
Applied Water Science ISSN 2190-5487Volume 6Number 3 Appl Water Sci (2016) 6:279-292DOI 10.1007/s13201-016-0427-y
Improving sustainability by technologyassessment and systems analysis: the case ofIWRM Indonesia
S. Nayono, A. Lehmann, J. Kopfmüller &H. Lehn
1 23
Your article is published under the Creative
Commons Attribution license which allows
users to read, copy, distribute and make
derivative works, as long as the author of
the original work is cited. You may self-
archive this article on your own website, an
institutional repository or funder’s repository
and make it publicly available immediately.
ORIGINAL ARTICLE
Improving sustainability by technology assessment and systemsanalysis: the case of IWRM Indonesia
S. Nayono1 • A. Lehmann2 • J. Kopfmuller3 • H. Lehn3
Received: 20 January 2016 / Accepted: 12 May 2016 / Published online: 10 June 2016
� The Author(s) 2016. This article is published with open access at Springerlink.com
Abstract To support the implementation of the IWRM-
Indonesia process in a water scarce and sanitation poor
region of Central Java (Indonesia), sustainability assess-
ments of several technology options of water supply and
sanitation were carried out based on the conceptual
framework of the integrative sustainability concept of the
German Helmholtz association. In the case of water supply,
the assessment was based on the life-cycle analysis and
life-cycle-costing approach. In the sanitation sector, the
focus was set on developing an analytical tool to improve
planning procedures in the area of investigation, which can
be applied in general to developing and newly emerging
countries. Because sanitation systems in particular can be
regarded as socio-technical systems, their permanent
operability is closely related to cultural or religious pref-
erences which influence acceptability. Therefore, the
design of the tool and the assessment of sanitation tech-
nologies took into account the views of relevant stake-
holders. The key results of the analyses are presented in
this article.
Keywords IWRM � Indonesia � Water supply � Sanitation �Technology assessment � Sustainability assessment �Stakeholder involvement
Background and objectives of the work
To suitably cope with existing severe deficits in fresh water
supply and sanitation, and following the Agenda 21 which
was adopted at the UN Conference on Environment and
Development 1992 in Rio, these issues were addressed in
the framework of the United Nations Millennium Devel-
opment Goals in 2000 (United Nations 2000). Here, the
international community of states determined, among oth-
ers, the target 7c to ‘‘halve, by 2015, the proportion of the
population without sustainable access to safe drinking
water and basic sanitation’’. According to this, the imple-
mentation of integrated water resource management
(IWRM) projects all over the world, particularly in
developing and newly emerging countries, has been pro-
moted. Currently, the IWRM approach represents the main
guiding principle in the water sector. According to the
widely accepted definition of the Global Water Partnership,
‘‘IWRM is a process which promotes the co-ordinated
development and management of water, land, and related
resources, to maximize the resultant economic and social
welfare in an equitable manner without compromising the
sustainability of vital ecosystems’’ (GWP 2000).
Since water is a critical, but often neglected element to
achieve global sustainable development, improved water
management strategies are highly necessary. Basically,
IWRM was developed as a cross-sectoral approach,
designed to replace traditional, mostly fragmented sectoral
approaches which dominated the water sector by then and
imposed high economic, social, and ecological costs on
human societies and the natural environment. In this sense,
‘‘integrated management’’ is understood and should be
implemented in four main respects: (1) by considering
ecological, economic, social, as well as institutional and
cultural aspects and their interlinkages; (2) by addressing
& H. Lehn
1 Department of Civil Engineering, Faculty of Engineering,
Janabadra University, Yogyakarta, Indonesia
2 Department of Environmental Technology, Technical
University Berlin, Berlin, Germany
3 Institute for Technology Assessment and Systems Analysis,
KIT, Karlsruhe, Germany
123
Appl Water Sci (2016) 6:279–292
DOI 10.1007/s13201-016-0427-y
the interdependencies between water—as a natural, social,
and economic good—and land and other natural resources;
(3) by taking into consideration, the different usages of
water—for drinking, food production, industries, or
ecosystems functioning—which may lead to conflicting
uses under certain conditions; (4) by considering a key
element of the sustainability model, participatory and
transdisciplinary approaches are an additional request for
integration, by ensuring that management and decision
making takes into account the needs and preferences of
different users and stakeholders suitably (US AfID 2003).
Like other basic supply infrastructure systems, such as
energy, transportation, etc., the freshwater-/wastewater
system is a socio-technical system. This means that both,
its functioning and transformation, are influenced not only
by technical and economic factors, but similarly by societal
and individual values and preferences, by the degree of
public acceptance and willingness to actively support
transition processes, and by organizational, political, and
institutional conditions. The interdependencies between the
different system components have to be considered here in
particular, to be able to achieve integrated results. Thus,
IWRM can serve as a driving force for technological as
well as organizational or social innovations that are needed
to realize the sustainability targets in the water sector.
In the case of the IWRM Indonesia project which is
presented in this special issue, the fresh water situation in
the area under investigation in the Gunung Kidul Province
(Central Java, Indonesia) is characterized by a monsoon
climate leading to water abundance during the rainy season
and severe scarcities during the dry season. The impact of
water scarcity is aggravated by the karstic geology that
causes a rapid seepage of rainwater into underground
drainage systems and caves. This is one reason why this
region is considered to be one of the poorest regions in
Indonesia and is included in the list of the most disad-
vantaged regions by the Indonesian Ministry for the
Development of Disadvantaged Regions (KEMENNEG
PDT 2005). In the year 2002, the installation of the Bribin
supply scheme, based on a hydropower-driven water sup-
ply plant, was initiated. This scheme allows for using
underground water resources (Nestmann et al. 2009), and
in the framework of a collaborative research project, fun-
ded by the German Federal Ministry for Education and
Research (BMBF), (Nestmann et al. 2010), it was further
developed into an integrated water management plan for
the whole region.
To make matters worse, water resources in the project
area are highly vulnerable due to the often lacking filtration
of pollutants in the underground and the quick transport of
underground water through the karst drainage systems. In
addition, the existing sanitation system suffers from a poor
standard of planning, designing, and operation.
Predominantly, the used technologies are not capable to
retain hygienic and chemical pollution from the environ-
ment resulting in health risks for the population. A con-
siderable improvement of the sanitation system is even
more urgent, because the newly developed underground
water resource could secure permanently water supply for
75,000 people in the Bribin distribution area over the past
4 years (Oberle et al. 2016), and thus has to be protected
against pollution.
IWRM-related research has to take into account the
integration aspects mentioned above. Within the IWRM-
Indonesia project, the main task of the sub-project descri-
bed here was to provide knowledge and tools to contribute
to an improved dealing with the following questions: how
can the sustainability performance of fresh water supply
technologies that are implemented or discussed in the area
under investigation be optimized? How can life-cycle
thinking be suitably included in this analysis? Which san-
itation technologies perform best with respect to sustain-
ability under the regional framework conditions? How can
the knowledge about sustainability in the sanitation sector
be transferred into operable planning steps to improve the
sanitation situation in a developing country? The knowl-
edge and instrumental basis should be used to contribute to
an improvement of the resilience of the natural system and
the socio-technical water system in the region, a reduction
of existing vulnerabilities, and an improvement of system
adaptability against changing climatic, economic, or
political framework conditions.
Methods
Methodologically, this was done by carrying out integra-
tive sustainability analyses and adopting a systems ana-
lytical perspective. In the case of the sanitation-related
analysis, this was embedded in the development of an
innovative planning tool and its application to a pilot vil-
lage within the area under investigation (see ‘‘The sus-
tainability-based sanitation planning tool (SusTA)’’). In the
case of the fresh water-related analysis, the sustainability
assessment of technologies was combined with a life-cycle
approach (see ‘‘Life Cycle Analysis: LCA and LCC’’).
Both perspectives were complemented by an analysis of
the vulnerability of the karstic water resource in the water
catchment area, addressing causes, impacts, and solution
options.
In a broader sense, systems’ analysis is a general
methodology (not a fixed set of techniques) that applies a
‘systemic’, comprehensive perspective by taking into
account all relevant aspects and elements of a situation or a
research question, particularly the interactions between
different elements. This is a suitable approach, especially
280 Appl Water Sci (2016) 6:279–292
123
in the cases of complex, multi-sectoral, multi-scale, or
multi-actor contexts, such as the socio-technical water
management system. It provides a framework for collect-
ing, integrating, and interpreting different knowledge ele-
ments to support decision-making processes.
The integrative sustainability concept of the German
Helmholtz association, developed by Kopfmuller et al.
(2001), provided the necessary conceptual basis for the
sustainability assessments carried out in the project. In
distinction from the vast majority of existing sustainability
concepts which focus on the classical ‘‘pillars’’ of eco-
nomic, ecological, and social aspects, the Helmholtz con-
cept starts from three constitutive elements of
sustainability: (1) the postulate of inter- and intra-genera-
tional justice as basis for the organization of societies, (2)
the global perspective, and (3) an ‘‘enlightened’’ anthro-
pocentrism denying own ‘‘rights’’ for the natural environ-
ment, but including an obligation for mankind to interact
cautiously with nature based on a well-understood self-
interest. At its core, the concept consists of a set of sus-
tainability rules which substantiate these constitutive ele-
ments (for more details, see ‘‘Methods’’). These rules serve
as a goal orientation for future development and for soci-
etal learning processes, and also as a basis for criteria to
assess development performances, both requiring substan-
tiation by indicators and target values. To date, this concept
is still one of the very few scientific concepts that are
applied systematically in a range of research projects and
consultancy activities within and outside Germany.
In the field of freshwater supply, the sustainability
assessment of different technological options could be
carried out by applying already developed methods, such as
life-cycle assessment (LCA) and life-cycle costing (LCC),
to the extent information needed for this assessment, for
example, data on alternative water extraction, water dis-
tribution, and water treatment technologies, and was
available. The results of the assessments can be used, e.g.,
for decision support within the IWRM. In the case of
sanitation technologies, where information on suit-
able technologies was still lacking at the time of this pro-
ject, a new additional decision support tool had to be
developed. Since many sanitation technologies often do not
work in the context of rural conditions in developing
countries, the new assessment tool needs to include aspects
regarding a suitable realization of the intended use of the
technologies.
The sustainability-based sanitation planning tool
(SusTA)
In the real world of planning, decision makers and project
implementers need a planning tool to realize projects
suitably. Sanitation is considered as a particularly sensitive
topic. It addresses a basic need, but many beneficiaries are
not open enough to discuss this issue. In many developing
countries where water supply and sanitation facilities have
already been installed, it is estimated that 30–60 % of
existing rural systems are inoperative at any given time
(Brikke and Bredero 2003). In addition to technical fail-
ures, many disfunctionalities in sanitation facilities are the
result of a wrong selection of technologies which do not
suitably meet the needs of the beneficiaries.
To avoid this problem, several organizations and agen-
cies that are involved in the sanitation sector have devel-
oped planning tools. Some of these tools put emphasis on
changing community’s behavior related to sanitation.
Others focus on technology implementation and provide
different frameworks to select a technology. The approa-
ches of open planning and HCES (Eawag 2005) are
equipped with a selected list of technological options.
Sanitation 21 and CLUES (Luthi et al. 2011) prescribe a
generic analysis of several sanitation systems. Although
technology selection criteria are provided by some tools,
there is no clear indication which conditions have to be
fulfilled to meet these criteria. Specifically, there is no
reference to what is meant by a sustainable technology for
a particular context.
The sustainability-based sanitation planning tool
(SusTA) described here is designed to fill this gap. It shall
provide support to sanitation planners, project imple-
menters, and decision makers in developing countries to
select the most sustainable sanitation technology for a
given context by considering beneficiaries’ concerns. As a
part of the tool, SusTA tries to offer a transparent assess-
ment, based on a rather simple method using only few data,
to provide an operable tool for developing countries’
contexts.
Developing a planning tool requires both, a conceptual
and an empirical basis. It requires many observations about
the interaction between sanitation-related stakeholders,
technology developers, practical users, and the environ-
ment. For this reason, a case study area which experiences
common problems in developing countries was needed, to
first apply and test the tool. The village of Pucanganom in
Gunung Kidul, Java, Indonesia was selected for this. This
village is located in the catchment area of the newly
developed freshwater resource, the underground Bribin
river, and represents a village experiencing a top-down
planning approach, where no systematic sustainability
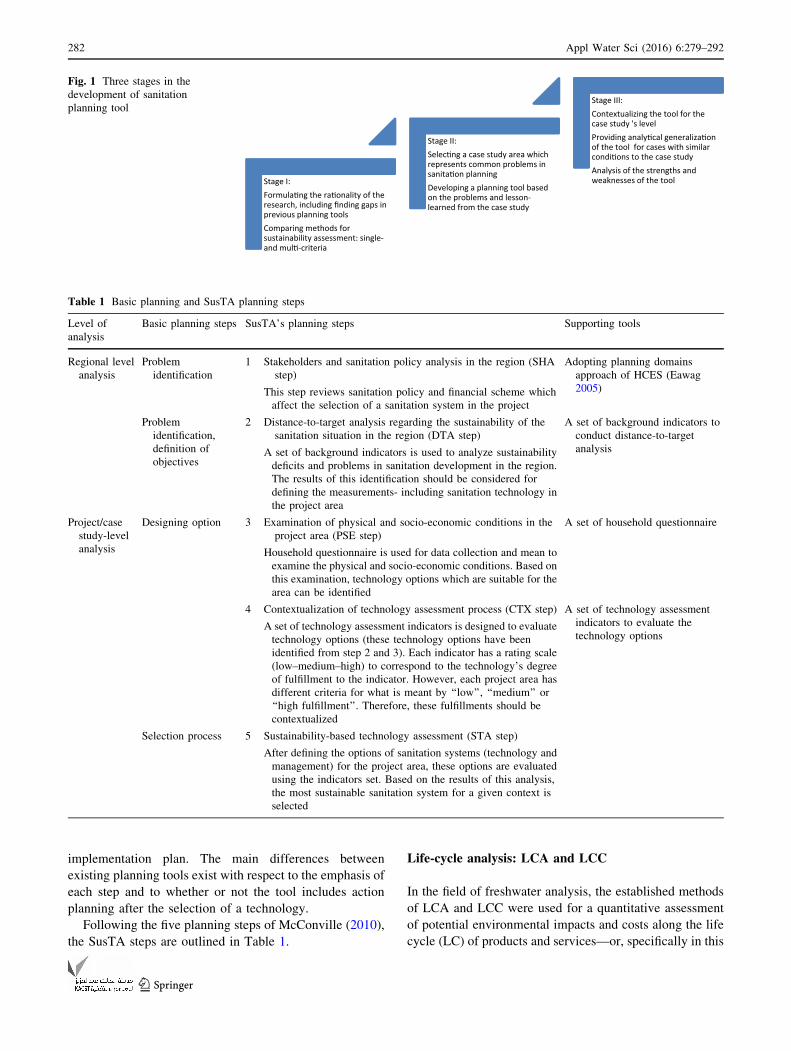
assessment is carried out to date. Figure 1 shows the three
general stages of developing a planning tool.
In general, planning tools for the implementation of
technologies consist of five basic steps as concluded by
McConville (2010): (1) problem identification, (2) defini-
tion of objectives, (3) design of alternative options, (4)
technology selection process, and (5) development of an
Appl Water Sci (2016) 6:279–292 281
123
implementation plan. The main differences between
existing planning tools exist with respect to the emphasis of
each step and to whether or not the tool includes action
planning after the selection of a technology.
Following the five planning steps of McConville (2010),
the SusTA steps are outlined in Table 1.
Life-cycle analysis: LCA and LCC
In the field of freshwater analysis, the established methods
of LCA and LCC were used for a quantitative assessment
of potential environmental impacts and costs along the life
cycle (LC) of products and services—or, specifically in this
Stage I:Formula�ng the ra�onality of the research, including finding gaps in previous planning toolsComparing methods for sustainability assessment: single-and mul�-criteria
Stage II:Selec�ng a case study area which represents common problems in sanita�on planningDeveloping a planning tool based on the problems and lesson-learned from the case study
Stage III:Contextualizing the tool for the case study 's levelProviding analy�cal generaliza�on of the tool for cases with similar condi�ons to the case studyAnalysis of the strengths and weaknesses of the tool
Fig. 1 Three stages in the
development of sanitation
planning tool
Table 1 Basic planning and SusTA planning steps
Level of
analysis
Basic planning steps SusTA’s planning steps Supporting tools
Regional level
analysis
Problem
identification
1 Stakeholders and sanitation policy analysis in the region (SHA
step)
This step reviews sanitation policy and financial scheme which
affect the selection of a sanitation system in the project
Adopting planning domains
approach of HCES (Eawag
2005)
Problem
identification,
definition of
objectives
2 Distance-to-target analysis regarding the sustainability of the
sanitation situation in the region (DTA step)
A set of background indicators is used to analyze sustainability
deficits and problems in sanitation development in the region.
The results of this identification should be considered for
defining the measurements- including sanitation technology in
the project area
A set of background indicators to
conduct distance-to-target
analysis
Project/case
study-level
analysis
Designing option 3 Examination of physical and socio-economic conditions in the
project area (PSE step)
Household questionnaire is used for data collection and mean to
examine the physical and socio-economic conditions. Based on
this examination, technology options which are suitable for the
area can be identified
A set of household questionnaire
4 Contextualization of technology assessment process (CTX step)
A set of technology assessment indicators is designed to evaluate
technology options (these technology options have been
identified from step 2 and 3). Each indicator has a rating scale
(low–medium–high) to correspond to the technology’s degree
of fulfillment to the indicator. However, each project area has
different criteria for what is meant by ‘‘low’’, ‘‘medium’’ or
‘‘high fulfillment’’. Therefore, these fulfillments should be
contextualized
A set of technology assessment
indicators to evaluate the
technology options
Selection process 5 Sustainability-based technology assessment (STA step)
After defining the options of sanitation systems (technology and
management) for the project area, these options are evaluated
using the indicators set. Based on the results of this analysis,
the most sustainable sanitation system for a given context is
selected
282 Appl Water Sci (2016) 6:279–292
123
project, of different technologies—to provide valid infor-
mation to realize optimization potentials and for appro-
priate decision support. LCA and LCC are relevant tools
within sustainability assessments, because the LC per-
spective helps to avoid a shift of burden between life-cycle
phases or to future generations. Specifically, with LCA and
LCC, the inputs and outputs of a product (e.g., materials,
energy, costs and emissions, and costs/revenues, respec-
tively) are analyzed for all phases of raw material pro-
duction, manufacturing, use of products, recycling, and
disposal. This LC perspective as well as the reference to
the so-called functional unit (fU) distinguishes LCA and
LCC from other existing environmental and economic
assessment methods. The fU is the ‘‘quantified’’ function,
which serves as reference unit for calculations and allows
for assessing alternative products and services by assigning
them the same function (ISO 2006a, b; Hunkeler et al.
2008; Swarr et al. 2011).
Within the application of the Sustainability concept of
the Helmholtz Association, LCA and LCC (besides other
methods) are used as tools for assessing environmental and
economic aspects of sustainability. In the IWRM project,
LCA and LCC were used for analyzing alternative tech-
nology options for water supply (extraction); distribution
and treatment within the area of investigation to identify
which of the potential alternatives are ‘‘more’’ sustainable.
A ‘‘more’’ sustainable option is here understood as the
option, which shows a better environmental and economic
performance compared to its alternatives. In addition, LCA
and LCC were used to assess the environmental impacts
and costs/benefits of the oldwater supply system which
existed before the IWRM activities, and the projected new
system after an implementation of selected technology
options within the IWRM. Various LCA studies assessing
different technologies for water supply, distribution, and
treatment are already available (an overview is provided,
e.g., by Lassaux et al. 2007). For LCC, only few studies are
available (e.g., Barriosa et al. 2008; Ghimire et al. 2012;
Ambrose et al. 2008). However, most of these LCA and
LCC studies focus on urban systems in industrialized
countries. Thus, the studies conducted within this IWRM
project can be seen as one of the first cases focusing on
rural regions in developing or emerging countries. More-
over, it was the first time that LCA and LCC were used
within an IWRM project as part of a sustainability
assessment of technologies.
The several technology options for the different pro-
cesses of the water sector, i.e., water supply, distribution,
and treatment, considered for the LCA and LCC studies,
included existing technologies in the investigation area as
well as technologies proposed and/or implemented within
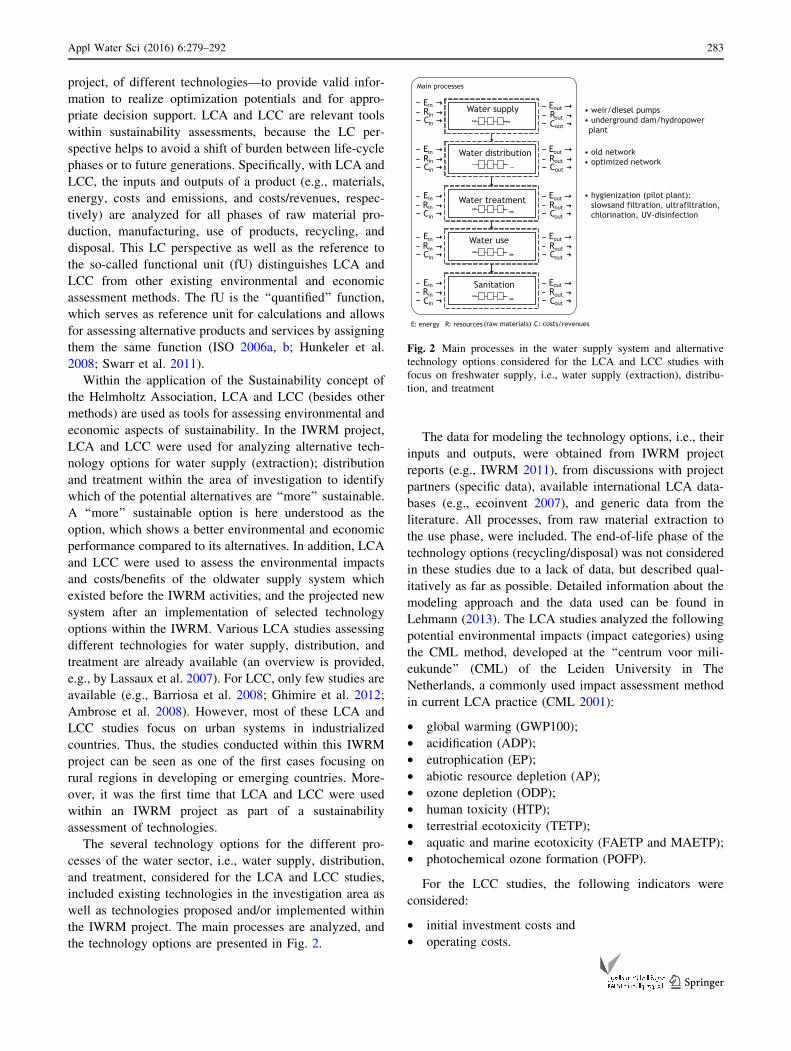
the IWRM project. The main processes are analyzed, and
the technology options are presented in Fig. 2.
The data for modeling the technology options, i.e., their
inputs and outputs, were obtained from IWRM project
reports (e.g., IWRM 2011), from discussions with project
partners (specific data), available international LCA data-
bases (e.g., ecoinvent 2007), and generic data from the
literature. All processes, from raw material extraction to
the use phase, were included. The end-of-life phase of the
technology options (recycling/disposal) was not considered
in these studies due to a lack of data, but described qual-
itatively as far as possible. Detailed information about the
modeling approach and the data used can be found in
Lehmann (2013). The LCA studies analyzed the following
potential environmental impacts (impact categories) using
the CML method, developed at the ‘‘centrum voor mili-
eukunde’’ (CML) of the Leiden University in The
Netherlands, a commonly used impact assessment method
in current LCA practice (CML 2001):
• global warming (GWP100);
• acidification (ADP);
• eutrophication (EP);
• abiotic resource depletion (AP);
• ozone depletion (ODP);
• human toxicity (HTP);
• terrestrial ecotoxicity (TETP);
• aquatic and marine ecotoxicity (FAETP and MAETP);
• photochemical ozone formation (POFP).
For the LCC studies, the following indicators were
considered:
• initial investment costs and
• operating costs.
• weir/diesel pumps• underground dam/hydropower plant
• old network• optimized network
• hygienization (pilot plant): slowsand filtration, ultrafiltration,chlorination, UV-disinfection
Water supply
Water distribution
Water treatment
Water use
Sanitation
Main processes
EinRinCin
EoutRoutCout
EinRinCin
EinRinCin
EinRinCin
EinRinCin
EoutRoutCout
EoutRoutCout
EoutRoutCout
EoutRoutCout
E: energy R: resources (raw materials) C: costs/revenues
Fig. 2 Main processes in the water supply system and alternative
technology options considered for the LCA and LCC studies with
focus on freshwater supply, i.e., water supply (extraction), distribu-
tion, and treatment
Appl Water Sci (2016) 6:279–292 283
123
Results
The sustainability-based sanitation planning tool
(SusTA)
The technology options which are appropriate for a par-
ticular context can be identified from step 2 and 3 of
SusTA. This paper will focus only on the technology
assessment part (step 4 and 5). Details about other steps of
SusTA can be found in Nayono (2014).
The identified options of step 2 and 3 are then evaluated
using a set of multi-criteria technology assessment indi-
cators (step 4 and 5 of SusTA), which have been derived
from the integrative Helmholtz concept of sustainability
(Kopfmuller et al. 2001). The indicators are presented in
Table 2.
The set of indicators is ranked by the main stakeholders
in the wastewater sector, which have been identified within
the first step of SusTA, namely:
• institutions (authority, governmental agency);
• practitioners (non-governmental organization, consul-
tants) and
• users/beneficiaries (common users and users who also
serve as village administrators and operators).
A simple ranking approach is applied due to the fact that
there is a big gap of knowledge between stakeholders.
Practically, some stakeholders might have difficulties using
other methods, such as weighting the indicators or using
the analytical hierarchy process (Saaty 1980). Assuming
that each stakeholder has the same power and there is no
weight of power considered, the results of indicators’
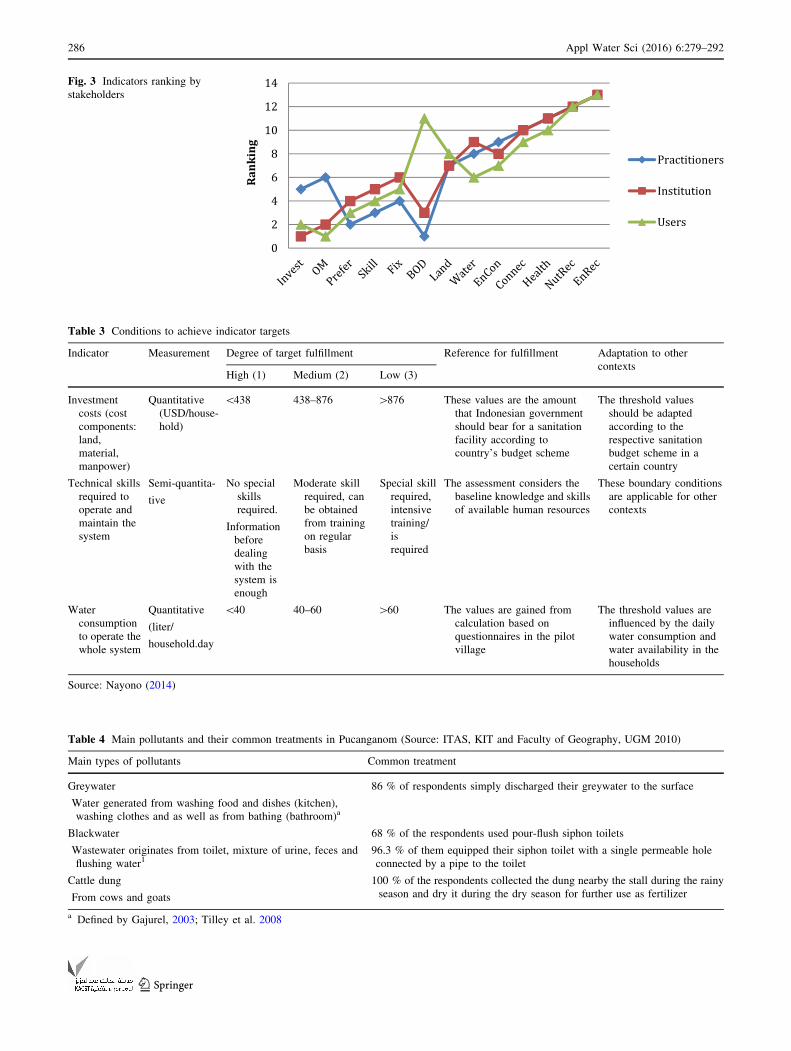
ranking are shown in Fig. 3.
The ranking is obtained by taking the average numerical
values assigned by all stakeholders to each indicator. Based
on this, ‘‘the investment cost’’ becomes the most important
indicator (low numerical value), while ‘‘potential energy
recovery of a system’’ is considered as the least important
(high numerical value). The differing opinions of the
stakeholders are captured in ‘‘operational and maintenance
cost’’. In the case study area, operational and maintenance
(OM) costs of a system are born by the users. Therefore, it
becomes their prime concern. The ‘‘biochemical oxygen
demand (BOD) removal efficiency’’ indicator (measuring
the remaining biodegradable organic matters in the efflu-
ent) represents a particular environmental performance of a
system. This indicator was ranked most controversially
between stakeholders, being a crucial issue for practitioners
(designer) and institutions (regulator), and, contrary to
them, less important to the users.
After the indicators are ranked, the next step is to pro-
pose the assessment method and fulfillment conditions of
all indicators. To select a proper assessment method for
each indicator, the main question is how can a certain
indicator be assessed? In the case study area, many data are
not available. Therefore, the most appropriate method is
selected with a primary concern for data availability. In
defining the fulfillment conditions for each indicator, a
rating method (using scale 1–3) is developed. Here, a value
of 1 represents the highest fulfillment, and a value of 3
represents the lowest fulfillment. This rating method is
important to provide transparency in the analysis, so that
technologies can be compared using the same assessment
basis. Some examples of the rating values and their ful-
fillment conditions are given in Table 3.
The boundaries for fulfillment conditions are obtained
from several references (see Table 3, column 6), such as
national/local regulation (e.g., indicator concerning
investment costs), a combination of survey and stake-
holders’ opinions (e.g., indicator concerning water con-
sumption), and own observations of the author (e.g.,
indicator concerning technical skill). Some of these con-
ditions are applicable to other contexts (e.g., technical
skill). For some boundary conditions which are only suit-
able for particular cases (e.g., water consumption and
investment cost), hints for an adaptation to other contexts
are provided (see Table 3, column 7).
The pilot case of IWRM Indonesia is located in a part
of the village Pucanganom, with 741 inhabitants or 196
households (ITAS, KIT, and Faculty of Geography, UGM
2010). There is a sinkhole located in the middle of the
rural settlements known as Kalen sinkhole, or in the local
language, Luweng Kalen surrounded by settlements in
higher elevation; the sinkhole becomes an entrance point
of pollutants, which are flushed to the sinkhole by heavy
rainfall. Based on a vulnerability analysis (Heckmann
2011) and tracer tests (Eiche et al. 2013), it is proven that
the sinkhole is connected to the Bribin system. Therefore,
pollutants entering the sinkhole threaten the water quality
of the Bribin water supply system. Table 4 describes the
types of major pollutants and their common treatment in
the village of Pucanganom.
To prevent future contamination, two sanitation systems
have been constructed in the village of Pucanganom by two
different projects (System I and System II). For compar-
ison, an additional alternative sanitation system is proposed
in this analysis (System III). System III is proposed as the
result of step 2 and 3 of SusTA. All three systems consist of
two sub-systems (sub-systems a and b), which are installed
at different scales and management levels: private/single
household, shared facility in a cluster (3–6 households), or
communal facility (38 households).
These three system options are then analyzed using a
set of sustainability-based technology assessment
284 Appl Water Sci (2016) 6:279–292
123
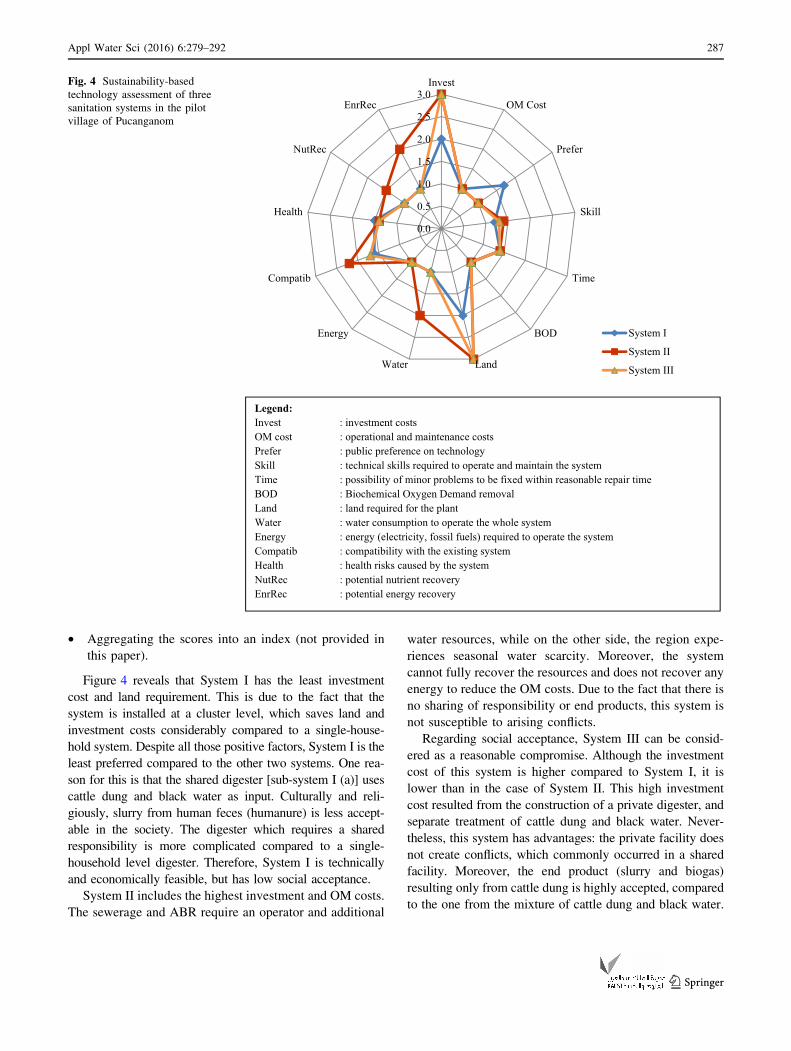
indicators. The ranking of indicators is expressed in a
clockwise direction (first rank investment cost, second
rank OM cost, and so on). Detailed matrixes and analysis
can be found in Nayono (2014). The indicators’ scoring
for Systems I, II, and III is presented in a rose-chart dia-
gram (Fig. 4). The diagram shows the distance of each
indicator’s value to the target (the center of the diagram).
The closer the distance to the center, the higher the
degree of target fulfillment of this indicator for a certain
system (Table 5).
After all the systems are assessed using these indicators,
the selection of the most sustainable system can be based
on several methodological options:
• Single indicators, such as social preference, health risk,
or investment costs.
• Particular sustainability dimension (e.g., economy
investment and OM costs).
• Distance-to-target considerations, e.g., number of indi-
cators close (to be defined) to the targets.
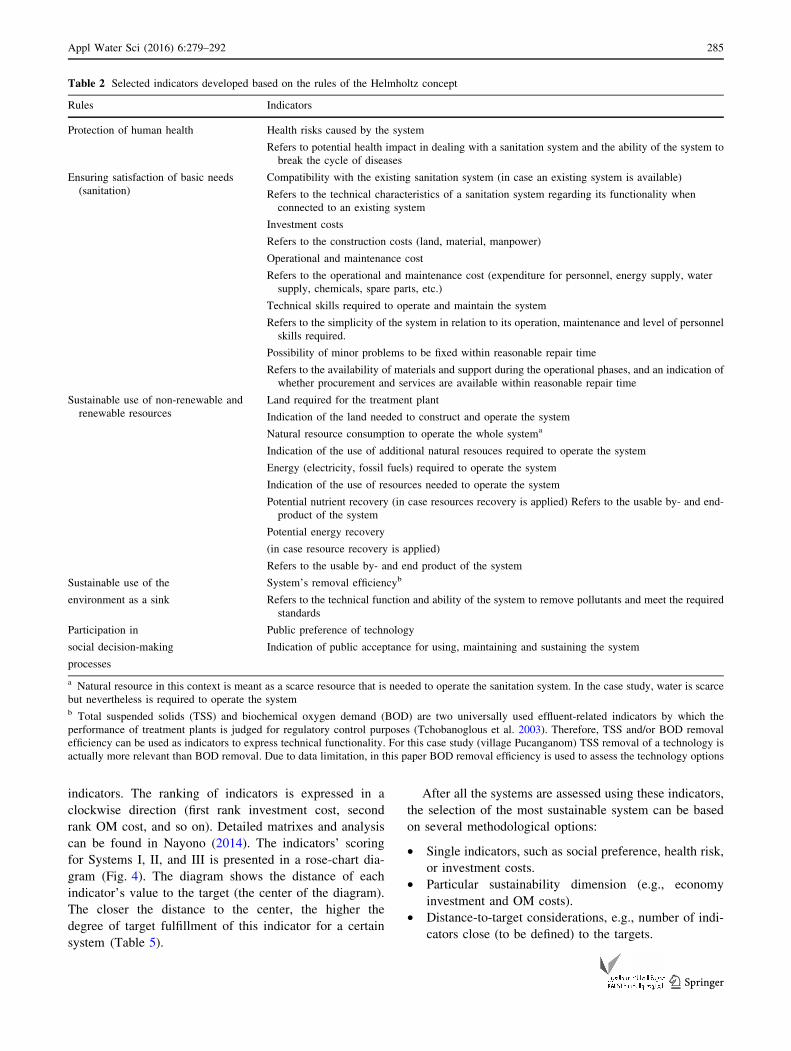
Table 2 Selected indicators developed based on the rules of the Helmholtz concept
Rules Indicators
Protection of human health Health risks caused by the system
Refers to potential health impact in dealing with a sanitation system and the ability of the system to
break the cycle of diseases
Ensuring satisfaction of basic needs
(sanitation)
Compatibility with the existing sanitation system (in case an existing system is available)
Refers to the technical characteristics of a sanitation system regarding its functionality when
connected to an existing system
Investment costs
Refers to the construction costs (land, material, manpower)
Operational and maintenance cost
Refers to the operational and maintenance cost (expenditure for personnel, energy supply, water
supply, chemicals, spare parts, etc.)
Technical skills required to operate and maintain the system
Refers to the simplicity of the system in relation to its operation, maintenance and level of personnel
skills required.
Possibility of minor problems to be fixed within reasonable repair time
Refers to the availability of materials and support during the operational phases, and an indication of
whether procurement and services are available within reasonable repair time
Sustainable use of non-renewable and
renewable resources
Land required for the treatment plant
Indication of the land needed to construct and operate the system
Natural resource consumption to operate the whole systema
Indication of the use of additional natural resouces required to operate the system
Energy (electricity, fossil fuels) required to operate the system
Indication of the use of resources needed to operate the system
Potential nutrient recovery (in case resources recovery is applied) Refers to the usable by- and end-
product of the system
Potential energy recovery
(in case resource recovery is applied)
Refers to the usable by- and end product of the system
Sustainable use of the
environment as a sink
System’s removal efficiencyb
Refers to the technical function and ability of the system to remove pollutants and meet the required
standards
Participation in
social decision-making
processes
Public preference of technology
Indication of public acceptance for using, maintaining and sustaining the system
a Natural resource in this context is meant as a scarce resource that is needed to operate the sanitation system. In the case study, water is scarce
but nevertheless is required to operate the systemb Total suspended solids (TSS) and biochemical oxygen demand (BOD) are two universally used effluent-related indicators by which the
performance of treatment plants is judged for regulatory control purposes (Tchobanoglous et al. 2003). Therefore, TSS and/or BOD removal
efficiency can be used as indicators to express technical functionality. For this case study (village Pucanganom) TSS removal of a technology is
actually more relevant than BOD removal. Due to data limitation, in this paper BOD removal efficiency is used to assess the technology options
Appl Water Sci (2016) 6:279–292 285
123
0
2
4
6
8
10
12
14
Rank
ing
Practitioners
Institution
Users
Fig. 3 Indicators ranking by
stakeholders
Table 3 Conditions to achieve indicator targets
Indicator Measurement Degree of target fulfillment Reference for fulfillment Adaptation to other
contextsHigh (1) Medium (2) Low (3)
Investment
costs (cost
components:
land,
material,
manpower)
Quantitative
(USD/house-
hold)
\438 438–876 [876 These values are the amount
that Indonesian government
should bear for a sanitation
facility according to
country’s budget scheme
The threshold values
should be adapted
according to the
respective sanitation
budget scheme in a
certain country
Technical skills
required to
operate and
maintain the
system
Semi-quantita-
tive
No special
skills
required.
Information
before
dealing
with the
system is
enough
Moderate skill
required, can
be obtained
from training
on regular
basis
Special skill
required,
intensive
training/
is
required
The assessment considers the
baseline knowledge and skills
of available human resources
These boundary conditions
are applicable for other
contexts
Water
consumption
to operate the
whole system
Quantitative
(liter/
household.day
\40 40–60 [60 The values are gained from
calculation based on
questionnaires in the pilot
village
The threshold values are
influenced by the daily
water consumption and
water availability in the
households
Source: Nayono (2014)
Table 4 Main pollutants and their common treatments in Pucanganom (Source: ITAS, KIT and Faculty of Geography, UGM 2010)
Main types of pollutants Common treatment
Greywater
Water generated from washing food and dishes (kitchen),
washing clothes and as well as from bathing (bathroom)a
86 % of respondents simply discharged their greywater to the surface
Blackwater
Wastewater originates from toilet, mixture of urine, feces and
flushing water1
68 % of the respondents used pour-flush siphon toilets
96.3 % of them equipped their siphon toilet with a single permeable hole
connected by a pipe to the toilet
Cattle dung
From cows and goats
100 % of the respondents collected the dung nearby the stall during the rainy
season and dry it during the dry season for further use as fertilizer
a Defined by Gajurel, 2003; Tilley et al. 2008
286 Appl Water Sci (2016) 6:279–292
123
• Aggregating the scores into an index (not provided in
this paper).
Figure 4 reveals that System I has the least investment
cost and land requirement. This is due to the fact that the
system is installed at a cluster level, which saves land and
investment costs considerably compared to a single-house-
hold system. Despite all those positive factors, System I is the
least preferred compared to the other two systems. One rea-
son for this is that the shared digester [sub-system I (a)] uses
cattle dung and black water as input. Culturally and reli-
giously, slurry from human feces (humanure) is less accept-
able in the society. The digester which requires a shared
responsibility is more complicated compared to a single-
household level digester. Therefore, System I is technically
and economically feasible, but has low social acceptance.
System II includes the highest investment and OM costs.
The sewerage and ABR require an operator and additional
water resources, while on the other side, the region expe-
riences seasonal water scarcity. Moreover, the system
cannot fully recover the resources and does not recover any
energy to reduce the OM costs. Due to the fact that there is
no sharing of responsibility or end products, this system is
not susceptible to arising conflicts.
Regarding social acceptance, System III can be consid-
ered as a reasonable compromise. Although the investment
cost of this system is higher compared to System I, it is
lower than in the case of System II. This high investment
cost resulted from the construction of a private digester, and
separate treatment of cattle dung and black water. Never-
theless, this system has advantages: the private facility does
not create conflicts, which commonly occurred in a shared
facility. Moreover, the end product (slurry and biogas)
resulting only from cattle dung is highly accepted, compared
to the one from the mixture of cattle dung and black water.
0.0
0.5
1.0
1.5
2.0
2.5
3.0Invest
OM Cost
Prefer
Skill
Time
BOD
LandWater
Energy
Compatib
Health
NutRec
EnrRec
System I
System II
System III
Legend: Invest : investment costs OM cost : operational and maintenance costs Prefer : public preference on technology Skill : technical skills required to operate and maintain the system Time : possibility of minor problems to be fixed within reasonable repair timeBOD : Biochemical Oxygen Demand removalLand : land required for the plant Water : water consumption to operate the whole system Energy : energy (electricity, fossil fuels) required to operate the systemCompatib : compatibility with the existing system Health : health risks caused by the systemNutRec : potential nutrient recovery EnrRec : potential energy recovery
Fig. 4 Sustainability-based
technology assessment of three
sanitation systems in the pilot
village of Pucanganom
Appl Water Sci (2016) 6:279–292 287
123
LCA and LCC
The results of the LCA and LCC studies show that
potential environmental impacts and costs (for technology
users) related to the technologies considered derive mainly
from the technologies’ energy demand. Detailed results of
the LCA and LCC studies on different technologies of
water supply, distribution and treatment as well as detailed
descriptions of challenges of modeling the technologies
can be found in Lehmann (2013). An example for one of
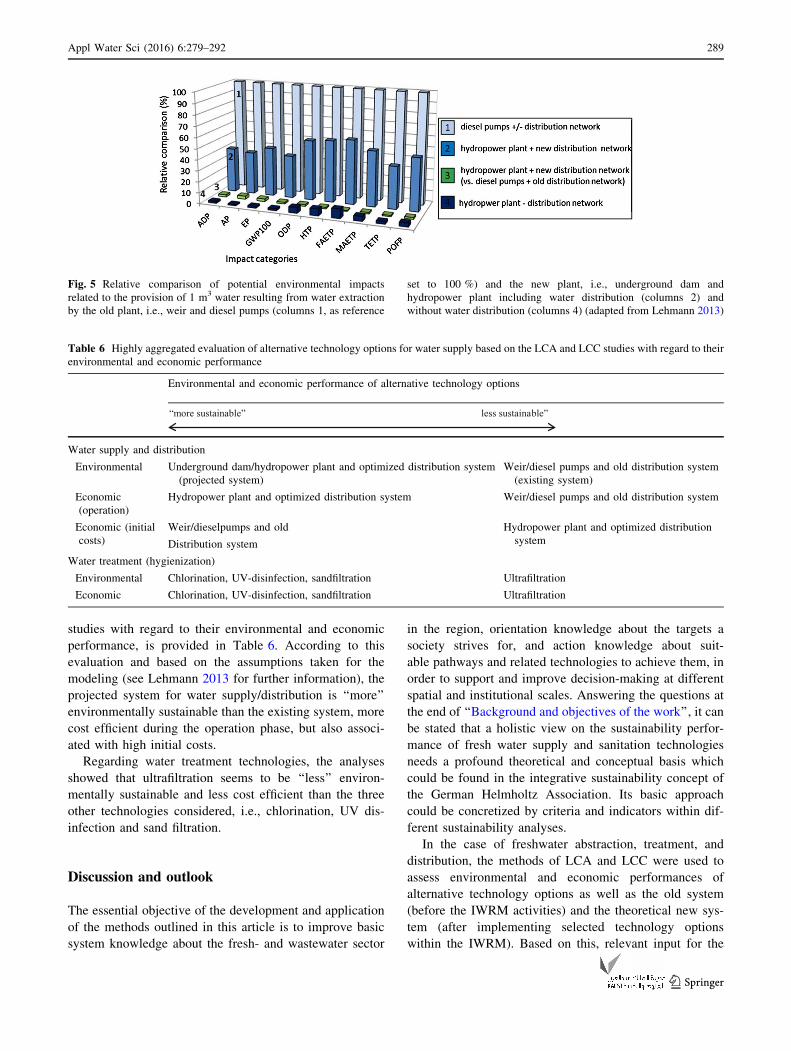
the LCA results is presented in Fig. 5. The figure compares
the potential environmental impacts related to the provision
of 1 m3 water of the new plant (underground dam with
hydropower plant), including the new distribution system
(i.e., distribution with an optimized network), and the old
plant (weir with diesel pumps), including the old distri-
bution system (i.e., distribution with the old network). For
a relative comparison of the new and the old plants and
systems, the total potential environmental impacts of the
old plant/system are set to 100 % (see columns 1 in Fig. 5).
These columns serve as reference in three respects:
First, they can be regarded as relative potential envi-
ronmental impacts of water supply by the old plant
(without considering water distribution). The LCA showed
that water supply with the new plant (Fig. 5, columns 4)
leads to a decrease of environmental impacts of more than
90 % related to the provision of 1 cubic meter water. The
main reason for the better environmental performance of
the new plant is the substantially reduced energy demand
for water extraction (hydropower plant instead of diesel
pumps). However, in water supply systems, a major part of
energy demand is accounted to the distribution of water.
Therefore, in a second analysis, the potential environ-
mental impacts are calculated for water supply including
distribution. In Fig. 5, both distribution by the new opti-
mized network and by the old network is considered. To
illustrate the influence of the new network, columns 1 now
can be regarded as the relative potential environmental
impacts of water supply by the old plant including an
assumed water distribution within the new network. It is
shown that the new system still can lead to a reduction of
potential environmental impacts of 40–70 % (columns 2),
mainly due to the significant energy savings caused by the
new plant for water extraction.
Finally, to illustrate the influence of the old network,
columns 1 in Fig. 5 can also be regarded as relative potential
environmental impacts of water supply by the old plant
including an assumed water distribution within the old net-
work. It is shown that by implementing the new system, i.e.,
the projected water supply and new optimized network
(Fig. 5, columns 3), potential environmental impacts related
to water provision can be reduced up to 90 % compared to
the old system (existing water supply and old network).
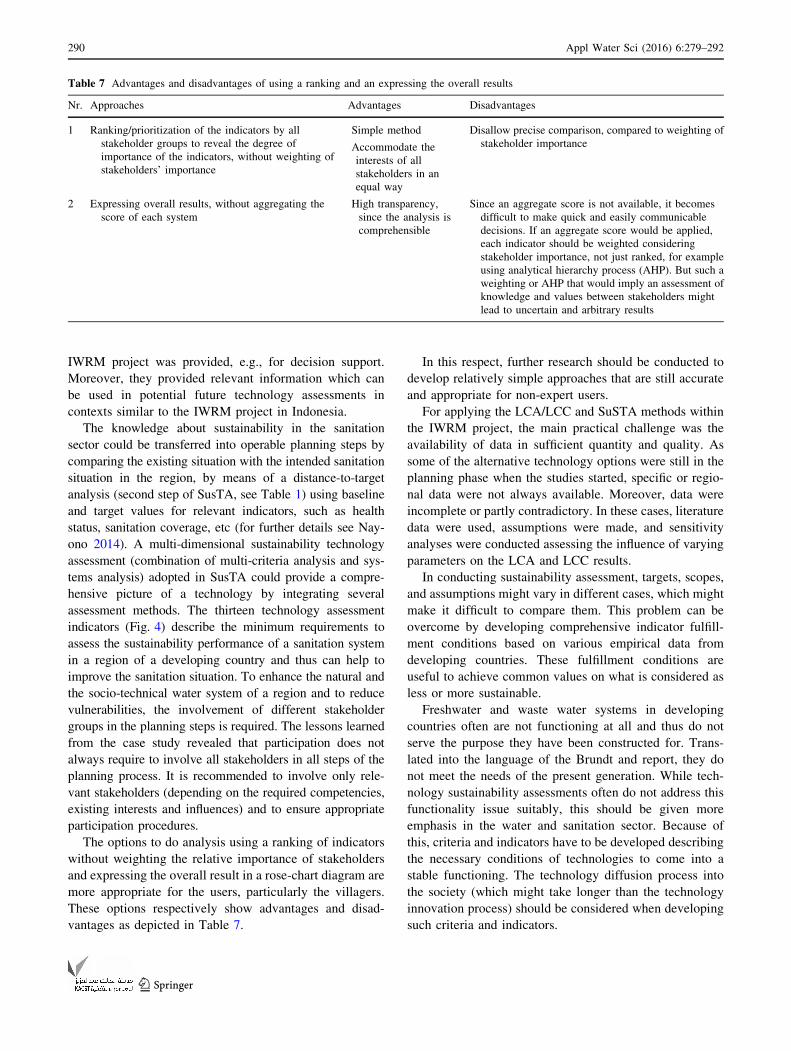
A highly aggregated summary of the evaluation of
alternative technologies for water supply and distribution
as well as water treatment, based on the LCA and LCC
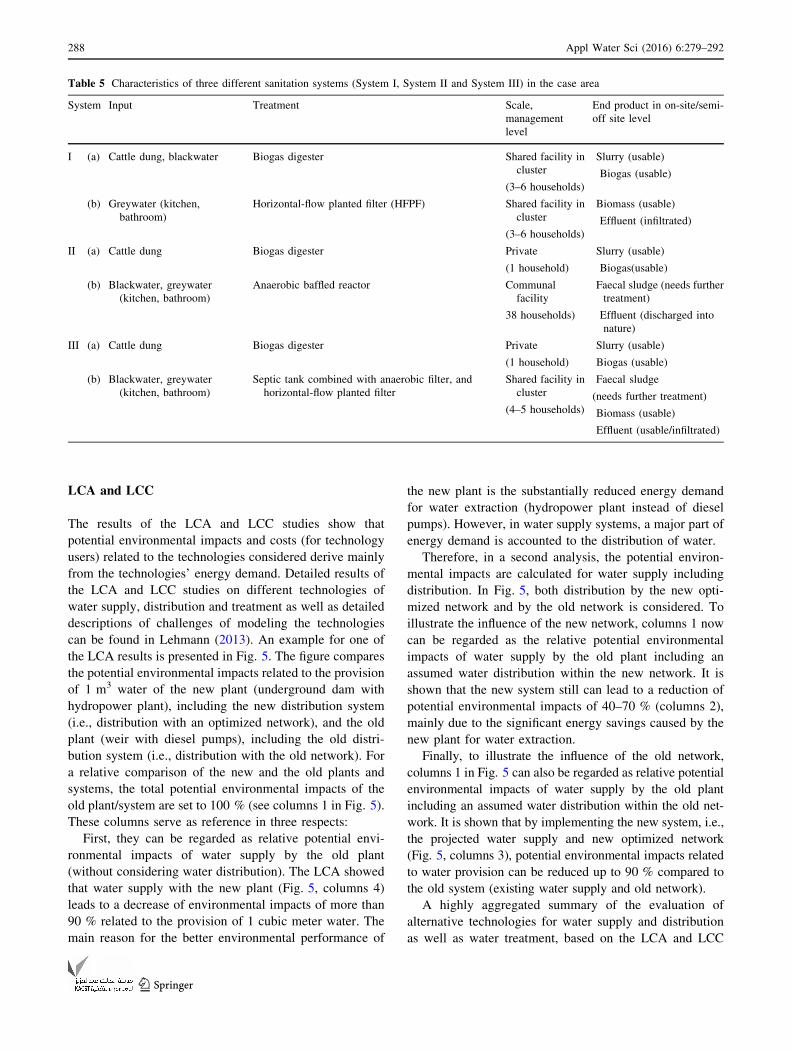
Table 5 Characteristics of three different sanitation systems (System I, System II and System III) in the case area
System Input Treatment Scale,
management
level
End product in on-site/semi-
off site level
I (a) Cattle dung, blackwater Biogas digester Shared facility in
cluster
(3–6 households)
Slurry (usable)
Biogas (usable)
(b) Greywater (kitchen,
bathroom)
Horizontal-flow planted filter (HFPF) Shared facility in
cluster
(3–6 households)
Biomass (usable)
Effluent (infiltrated)
II (a) Cattle dung Biogas digester Private
(1 household)
Slurry (usable)
Biogas(usable)
(b) Blackwater, greywater
(kitchen, bathroom)
Anaerobic baffled reactor Communal
facility
38 households)
Faecal sludge (needs further
treatment)
Effluent (discharged into
nature)
III (a) Cattle dung Biogas digester Private
(1 household)
Slurry (usable)
Biogas (usable)
(b) Blackwater, greywater
(kitchen, bathroom)
Septic tank combined with anaerobic filter, and
horizontal-flow planted filter
Shared facility in
cluster
(4–5 households)
Faecal sludge
(needs further treatment)
Biomass (usable)
Effluent (usable/infiltrated)
288 Appl Water Sci (2016) 6:279–292
123
studies with regard to their environmental and economic
performance, is provided in Table 6. According to this
evaluation and based on the assumptions taken for the
modeling (see Lehmann 2013 for further information), the
projected system for water supply/distribution is ‘‘more’’
environmentally sustainable than the existing system, more
cost efficient during the operation phase, but also associ-
ated with high initial costs.
Regarding water treatment technologies, the analyses
showed that ultrafiltration seems to be ‘‘less’’ environ-
mentally sustainable and less cost efficient than the three
other technologies considered, i.e., chlorination, UV dis-
infection and sand filtration.
Discussion and outlook
The essential objective of the development and application
of the methods outlined in this article is to improve basic
system knowledge about the fresh- and wastewater sector
in the region, orientation knowledge about the targets a
society strives for, and action knowledge about suit-
able pathways and related technologies to achieve them, in
order to support and improve decision-making at different
spatial and institutional scales. Answering the questions at
the end of ‘‘Background and objectives of the work’’, it can
be stated that a holistic view on the sustainability perfor-
mance of fresh water supply and sanitation technologies
needs a profound theoretical and conceptual basis which
could be found in the integrative sustainability concept of
the German Helmholtz Association. Its basic approach
could be concretized by criteria and indicators within dif-
ferent sustainability analyses.
In the case of freshwater abstraction, treatment, and
distribution, the methods of LCA and LCC were used to
assess environmental and economic performances of
alternative technology options as well as the old system
(before the IWRM activities) and the theoretical new sys-
tem (after implementing selected technology options
within the IWRM). Based on this, relevant input for the
Fig. 5 Relative comparison of potential environmental impacts
related to the provision of 1 m3 water resulting from water extraction
by the old plant, i.e., weir and diesel pumps (columns 1, as reference
set to 100 %) and the new plant, i.e., underground dam and
hydropower plant including water distribution (columns 2) and
without water distribution (columns 4) (adapted from Lehmann 2013)
Table 6 Highly aggregated evaluation of alternative technology options for water supply based on the LCA and LCC studies with regard to their
environmental and economic performance
Environmental and economic performance of alternative technology options
“more sustainable” less sustainable”
Water supply and distribution
Environmental Underground dam/hydropower plant and optimized distribution system
(projected system)
Weir/diesel pumps and old distribution system
(existing system)
Economic
(operation)
Hydropower plant and optimized distribution system Weir/diesel pumps and old distribution system
Economic (initial
costs)
Weir/dieselpumps and old
Distribution system
Hydropower plant and optimized distribution
system
Water treatment (hygienization)
Environmental Chlorination, UV-disinfection, sandfiltration Ultrafiltration
Economic Chlorination, UV-disinfection, sandfiltration Ultrafiltration
Appl Water Sci (2016) 6:279–292 289
123
IWRM project was provided, e.g., for decision support.
Moreover, they provided relevant information which can
be used in potential future technology assessments in
contexts similar to the IWRM project in Indonesia.
The knowledge about sustainability in the sanitation
sector could be transferred into operable planning steps by
comparing the existing situation with the intended sanitation
situation in the region, by means of a distance-to-target
analysis (second step of SusTA, see Table 1) using baseline
and target values for relevant indicators, such as health
status, sanitation coverage, etc (for further details see Nay-
ono 2014). A multi-dimensional sustainability technology
assessment (combination of multi-criteria analysis and sys-
tems analysis) adopted in SusTA could provide a compre-
hensive picture of a technology by integrating several
assessment methods. The thirteen technology assessment
indicators (Fig. 4) describe the minimum requirements to
assess the sustainability performance of a sanitation system
in a region of a developing country and thus can help to
improve the sanitation situation. To enhance the natural and
the socio-technical water system of a region and to reduce
vulnerabilities, the involvement of different stakeholder
groups in the planning steps is required. The lessons learned
from the case study revealed that participation does not
always require to involve all stakeholders in all steps of the
planning process. It is recommended to involve only rele-
vant stakeholders (depending on the required competencies,
existing interests and influences) and to ensure appropriate
participation procedures.
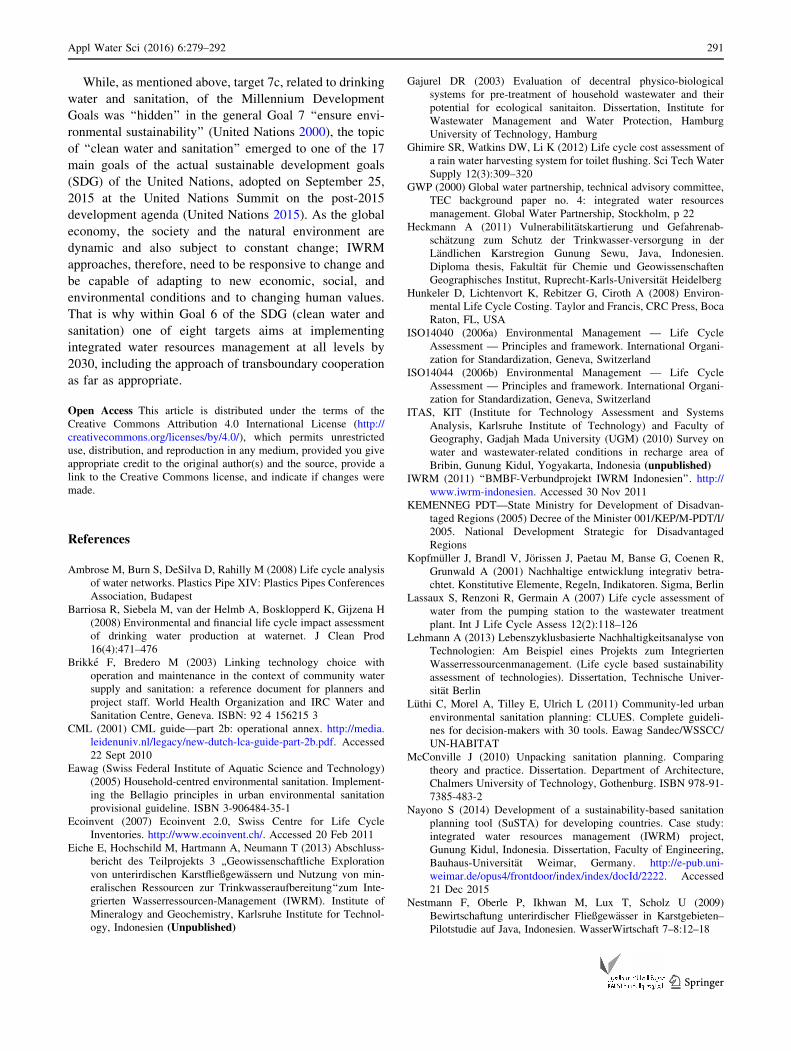
The options to do analysis using a ranking of indicators
without weighting the relative importance of stakeholders
and expressing the overall result in a rose-chart diagram are
more appropriate for the users, particularly the villagers.
These options respectively show advantages and disad-
vantages as depicted in Table 7.
In this respect, further research should be conducted to
develop relatively simple approaches that are still accurate
and appropriate for non-expert users.
For applying the LCA/LCC and SuSTA methods within
the IWRM project, the main practical challenge was the
availability of data in sufficient quantity and quality. As
some of the alternative technology options were still in the
planning phase when the studies started, specific or regio-
nal data were not always available. Moreover, data were
incomplete or partly contradictory. In these cases, literature
data were used, assumptions were made, and sensitivity
analyses were conducted assessing the influence of varying
parameters on the LCA and LCC results.
In conducting sustainability assessment, targets, scopes,
and assumptions might vary in different cases, which might
make it difficult to compare them. This problem can be
overcome by developing comprehensive indicator fulfill-
ment conditions based on various empirical data from
developing countries. These fulfillment conditions are
useful to achieve common values on what is considered as
less or more sustainable.
Freshwater and waste water systems in developing
countries often are not functioning at all and thus do not
serve the purpose they have been constructed for. Trans-
lated into the language of the Brundt and report, they do
not meet the needs of the present generation. While tech-
nology sustainability assessments often do not address this
functionality issue suitably, this should be given more
emphasis in the water and sanitation sector. Because of
this, criteria and indicators have to be developed describing
the necessary conditions of technologies to come into a
stable functioning. The technology diffusion process into
the society (which might take longer than the technology
innovation process) should be considered when developing
such criteria and indicators.
Table 7 Advantages and disadvantages of using a ranking and an expressing the overall results
Nr. Approaches Advantages Disadvantages
1 Ranking/prioritization of the indicators by all
stakeholder groups to reveal the degree of
importance of the indicators, without weighting of
stakeholders’ importance
Simple method
Accommodate the
interests of all
stakeholders in an
equal way
Disallow precise comparison, compared to weighting of
stakeholder importance
2 Expressing overall results, without aggregating the
score of each system
High transparency,
since the analysis is
comprehensible
Since an aggregate score is not available, it becomes
difficult to make quick and easily communicable
decisions. If an aggregate score would be applied,
each indicator should be weighted considering
stakeholder importance, not just ranked, for example
using analytical hierarchy process (AHP). But such a
weighting or AHP that would imply an assessment of
knowledge and values between stakeholders might
lead to uncertain and arbitrary results
290 Appl Water Sci (2016) 6:279–292
123
While, as mentioned above, target 7c, related to drinking
water and sanitation, of the Millennium Development
Goals was ‘‘hidden’’ in the general Goal 7 ‘‘ensure envi-
ronmental sustainability’’ (United Nations 2000), the topic
of ‘‘clean water and sanitation’’ emerged to one of the 17
main goals of the actual sustainable development goals
(SDG) of the United Nations, adopted on September 25,
2015 at the United Nations Summit on the post-2015
development agenda (United Nations 2015). As the global
economy, the society and the natural environment are
dynamic and also subject to constant change; IWRM
approaches, therefore, need to be responsive to change and
be capable of adapting to new economic, social, and
environmental conditions and to changing human values.
That is why within Goal 6 of the SDG (clean water and
sanitation) one of eight targets aims at implementing
integrated water resources management at all levels by
2030, including the approach of transboundary cooperation
as far as appropriate.
Open Access This article is distributed under the terms of the
Creative Commons Attribution 4.0 International License (http://
creativecommons.org/licenses/by/4.0/), which permits unrestricted
use, distribution, and reproduction in any medium, provided you give
appropriate credit to the original author(s) and the source, provide a
link to the Creative Commons license, and indicate if changes were
made.
References
Ambrose M, Burn S, DeSilva D, Rahilly M (2008) Life cycle analysis
of water networks. Plastics Pipe XIV: Plastics Pipes Conferences
Association, Budapest
Barriosa R, Siebela M, van der Helmb A, Bosklopperd K, Gijzena H
(2008) Environmental and financial life cycle impact assessment
of drinking water production at waternet. J Clean Prod
16(4):471–476
Brikke F, Bredero M (2003) Linking technology choice with
operation and maintenance in the context of community water
supply and sanitation: a reference document for planners and
project staff. World Health Organization and IRC Water and
Sanitation Centre, Geneva. ISBN: 92 4 156215 3
CML (2001) CML guide—part 2b: operational annex. http://media.
leidenuniv.nl/legacy/new-dutch-lca-guide-part-2b.pdf. Accessed
22 Sept 2010
Eawag (Swiss Federal Institute of Aquatic Science and Technology)
(2005) Household-centred environmental sanitation. Implement-
ing the Bellagio principles in urban environmental sanitation
provisional guideline. ISBN 3-906484-35-1
Ecoinvent (2007) Ecoinvent 2.0, Swiss Centre for Life Cycle
Inventories. http://www.ecoinvent.ch/. Accessed 20 Feb 2011
Eiche E, Hochschild M, Hartmann A, Neumann T (2013) Abschluss-
bericht des Teilprojekts 3 ,,Geowissenschaftliche Exploration
von unterirdischen Karstfließgewassern und Nutzung von min-
eralischen Ressourcen zur Trinkwasseraufbereitung‘‘zum Inte-
grierten Wasserressourcen-Management (IWRM). Institute of
Mineralogy and Geochemistry, Karlsruhe Institute for Technol-
ogy, Indonesien (Unpublished)
Gajurel DR (2003) Evaluation of decentral physico-biological
systems for pre-treatment of household wastewater and their
potential for ecological sanitaiton. Dissertation, Institute for
Wastewater Management and Water Protection, Hamburg
University of Technology, Hamburg
Ghimire SR, Watkins DW, Li K (2012) Life cycle cost assessment of
a rain water harvesting system for toilet flushing. Sci Tech Water
Supply 12(3):309–320
GWP (2000) Global water partnership, technical advisory committee,
TEC background paper no. 4: integrated water resources
management. Global Water Partnership, Stockholm, p 22
Heckmann A (2011) Vulnerabilitatskartierung und Gefahrenab-
schatzung zum Schutz der Trinkwasser-versorgung in der
Landlichen Karstregion Gunung Sewu, Java, Indonesien.
Diploma thesis, Fakultat fur Chemie und Geowissenschaften
Geographisches Institut, Ruprecht-Karls-Universitat Heidelberg
Hunkeler D, Lichtenvort K, Rebitzer G, Ciroth A (2008) Environ-
mental Life Cycle Costing. Taylor and Francis, CRC Press, Boca
Raton, FL, USA
ISO14040 (2006a) Environmental Management — Life Cycle
Assessment — Principles and framework. International Organi-
zation for Standardization, Geneva, Switzerland
ISO14044 (2006b) Environmental Management — Life Cycle
Assessment — Principles and framework. International Organi-
zation for Standardization, Geneva, Switzerland
ITAS, KIT (Institute for Technology Assessment and Systems
Analysis, Karlsruhe Institute of Technology) and Faculty of
Geography, Gadjah Mada University (UGM) (2010) Survey on
water and wastewater-related conditions in recharge area of
Bribin, Gunung Kidul, Yogyakarta, Indonesia (unpublished)IWRM (2011) ‘‘BMBF-Verbundprojekt IWRM Indonesien’’. http://
www.iwrm-indonesien. Accessed 30 Nov 2011
KEMENNEG PDT—State Ministry for Development of Disadvan-
taged Regions (2005) Decree of the Minister 001/KEP/M-PDT/I/
2005. National Development Strategic for Disadvantaged
Regions
Kopfmuller J, Brandl V, Jorissen J, Paetau M, Banse G, Coenen R,
Grunwald A (2001) Nachhaltige entwicklung integrativ betra-
chtet. Konstitutive Elemente, Regeln, Indikatoren. Sigma, Berlin
Lassaux S, Renzoni R, Germain A (2007) Life cycle assessment of
water from the pumping station to the wastewater treatment
plant. Int J Life Cycle Assess 12(2):118–126
Lehmann A (2013) Lebenszyklusbasierte Nachhaltigkeitsanalyse von
Technologien: Am Beispiel eines Projekts zum Integrierten
Wasserressourcenmanagement. (Life cycle based sustainability
assessment of technologies). Dissertation, Technische Univer-
sitat Berlin
Luthi C, Morel A, Tilley E, Ulrich L (2011) Community-led urban
environmental sanitation planning: CLUES. Complete guideli-
nes for decision-makers with 30 tools. Eawag Sandec/WSSCC/
UN-HABITAT
McConville J (2010) Unpacking sanitation planning. Comparing
theory and practice. Dissertation. Department of Architecture,Chalmers University of Technology, Gothenburg. ISBN 978-91-
7385-483-2
Nayono S (2014) Development of a sustainability-based sanitation
planning tool (SuSTA) for developing countries. Case study:
integrated water resources management (IWRM) project,
Gunung Kidul, Indonesia. Dissertation, Faculty of Engineering,
Bauhaus-Universitat Weimar, Germany. http://e-pub.uni-
weimar.de/opus4/frontdoor/index/index/docId/2222. Accessed
21 Dec 2015
Nestmann F, Oberle P, Ikhwan M, Lux T, Scholz U (2009)
Bewirtschaftung unterirdischer Fließgewasser in Karstgebieten–
Pilotstudie auf Java, Indonesien. WasserWirtschaft 7–8:12–18
Appl Water Sci (2016) 6:279–292 291
123
Nestmann F, Oberle P, Ikhwan M, Stoffel D (2010) Adaptive water
resources management under extreme climatic and hydrogeo-
logical conditions: interdisciplinary research activities in Karst
Regios of South East Asia. In: Proceedings of the IWRM
Karlsruhe 2010, Karlsruhe, pp 300–307
Oberle P, Ikhwan M, Stoffel D Nestmann F (2016) Adapted
hydropower-driven water supply system: assessment of an
underground application in an Indonesian karst area. J Appl
Water Sci (this special issue)Saaty TL (1980) The analytic hierarchy process. McGraw-Hill
international, New York
Swarr T, Hunkeler D, Klopffer W, Pesonen H-L, Ciroth A, Brent AC,
Pagan, R (2011) Environmental life cycle costing: a code of
practice. Int J Life Cycle Assess. 13(2):89–95
Tchobanoglous G, Burton FL, Stensel HD, Metcalf and Eddy, Inc
(2003) Wastewater engineering: treatment and reuse. 4th edn,
McGraw-Hill, New York, USA
Tilley E, Luthi C, Morel A, Zurbrugg C, Schertenleib R (2008)
Compendium of sanitation systems and technologies. Swiss
Federal Institute of Aquatic Science and Technology (Eawag),
Dubendorf. ISBN 978-3-906484-44-0
United Nations (2000) Millenium development goals and beyond
2015—goal 7. http://www.un.org/millenniumgoals/environ.
shtml. Accessed 25 Nov 2015
United Nations (2015) Sustainable development goals. http://www.
un.org/sustainabledevelopment/sustainable-development-goals/.
Accessed 25 Nov 2015
US AfID (2003) US Agency for International Development 2003.
Online at cited in: Cardwell HE, Cole RA, Cartwright LA,
Martin LA (2006) Integrated water resources management:
definitions and conceptual musings. J Contemp Water Res Educ
135:8–18
292 Appl Water Sci (2016) 6:279–292
123