unlocking and using practice performance intelligence
TRANSCRIPT

1
Unlocking and Using Practice Performance Intelligence
Patti Peets, Director, Revenue Cycle Management
CareCloud, Miami
Patti Peets does not have a financial conflict to report at this time.

2
©2017 MGMA. All rights reserved. - 3 -
Learning Objectives
• Identify which metrics are leading
indicators for high-performing
practices
• Interpret MGMA benchmarks in
assessing practice performance
• Describe steps to make practice
performance data easier to capture
- 4 -©2017 MGMA. All rights reserved.
The Qualities of High Performing Practices
Drives key practice performance indicators through the adoption of new technologies
Focuses on improving the patient experience through new technologies and better services
Collects regular feedback from patients through a variety of touch points, including online reviews
\http://www.carecloud.com/practice-profitability-index/

3
- 5 -©2017 MGMA. All rights reserved.
Better Performing Practices
“MGMA 2015 Cost and Revenue Executive
Summary Report”. Used with permission
from MGMA, 104 Inverness Terrace East,
Englewood, Colorado 80112. 877.275.6462.
www.mgma.com. © MGMA 2018.
- 6 -©2017 MGMA. All rights reserved.
Top 10 Reasons Practice Lose Money
• Failure to maintain comprehensive policies, procedures & internal oversight controls
• Failure to collect patient co-pay and co-insurance
• Hiring the wrong people & the wrong number of people
• Failure to work denials adequately
• Taking unnecessary write-offs
• Inadequate focus on patient collections
• Failure to verify insurance & check eligibility
• Not using a claims edits engine & E&M Coder
• Failure to satisfy new demands of patient consumerism
• Failure to measure Key Performance Indicators consistently

4
- 7 -©2017 MGMA. All rights reserved.
Top 10 Reasons Practice Lose Money
• Failure to maintain comprehensive policies, procedures & internal oversight controls
• Failure to collect patient co-pay and co-insurance
• Hiring the wrong people & the wrong number of people
• Failure to work denials adequately
• Taking unnecessary write-offs
• Inadequate focus on patient collections
• Failure to verify insurance & check eligibility
• Not using a claims edits engine & E&M Coder
• Failure to satisfy new demands of patient consumerism
• Failure to measure Key Performance Indicators consistently
- 8 -©2017 MGMA. All rights reserved.
What are Key Performance Indicators?
Metrics that can help you determine whether your revenue management cycle
processes are efficient and effective
• A/R Over 120
• Total Accounts Receivable Over 120
• Patient A/R Over 120
• Days in A/R
• Reimbursement Rates
• Gross Collection Rate
• Revenue Realization Rate
• Net Collection Rate
• Average Reimbursement per Encounter
• First Pass Denial Rates and Resolution Rates
5
- 9 -©2017 MGMA. All rights reserved.
“If you can't measure it,
you can't improve it.”
- Peter Drucker
- 10 -©2017 MGMA. All rights reserved.
Set Your Goals
Choose the most important indicators for your organization’s goals
Create action plans to achieve the goals
Implement the action plans
Monitor the results of the implementation
Communicate the results back to the affected parties for feedback
Develop positive and negative consequences based on the results
Measuring is the first step to identifying the problem and then fixing it.

6
- 11 -©2017 MGMA. All rights reserved.
http://www.mgma.com/data/benchmarking-data/costs-revenue-data
- 12 -©2017 MGMA. All rights reserved.
MGMA Accounts Receivable DashboardPrimary Care Single Specialties
MGMA 2016 DataDive Cost and Revenue. Used with permission from MGMA, 104
Inverness Terrace East, Englewood, Colorado 80112. 877.275.6462.
www.mgma.com. © MGMA 2016.

7
- 13 -©2017 MGMA. All rights reserved.
KPI: A/R > 120
DEFINITION: Total amount owed to practice for services rendered either by 3rd party
insurance or patients that is 120 days old or older
Accounts Receivable (A/R) is generally grouped into aging buckets based on 30-day increments of elapsed time (30, 60, 90, 120 days).
• Total A/R that falls into the inclusive A/R>120 bucket.
Benchmark: Less than 25% of your A/R should be in the >120 days bucket.
• Identify what your 120+ is made up of.
• By Payer and Responsibility
Uncollectable A/R?
• What are your write-off policies, insurance follow-up policies?
• What do your denials look like and the processes you follow to work denials?
Patient responsibility?
• What are your processes for collecting co-pay, eligibility verification, pre-authorization processes? Are you collecting amounts applied to deductible? Are you providing your patients a convenient way to pay?
- 14 -©2017 MGMA. All rights reserved.
A/R > 120 Indications and Impact
• Timely filing risk
• Denials are high
• Insurance is not being followed-up in
timely manner or
• Indicates insurance denials may not be
worked effectively
Example:
If patient A/R > 120 is high – possible
causes• Co-pays aren’t collected
• Eligibility Denials may be high
• Inadequate focus on patient collections
• Deductibles not checked or collected
• Patient statements are not effective
• Example:
If insurance A/R > 120 is high –
possible causes
Impact of A/R over 120 Days
Current A/R Over 120 381,073.44$
Benchmark A/R >120 55,367.14$
Difference 325,706.30$
At NET 146,567.84$
Impact of Patient A/R>120
Patient A/R Over 120 364,130.90$
Patient A/R 91-120 21,867.08$
Total 385,997.98$
Probable LEAK 302,970.37$
**79% of Patient A/R over 120 never collected
**70% of Patient A/R over 90 not likely to pay
8
- 15 -©2017 MGMA. All rights reserved.
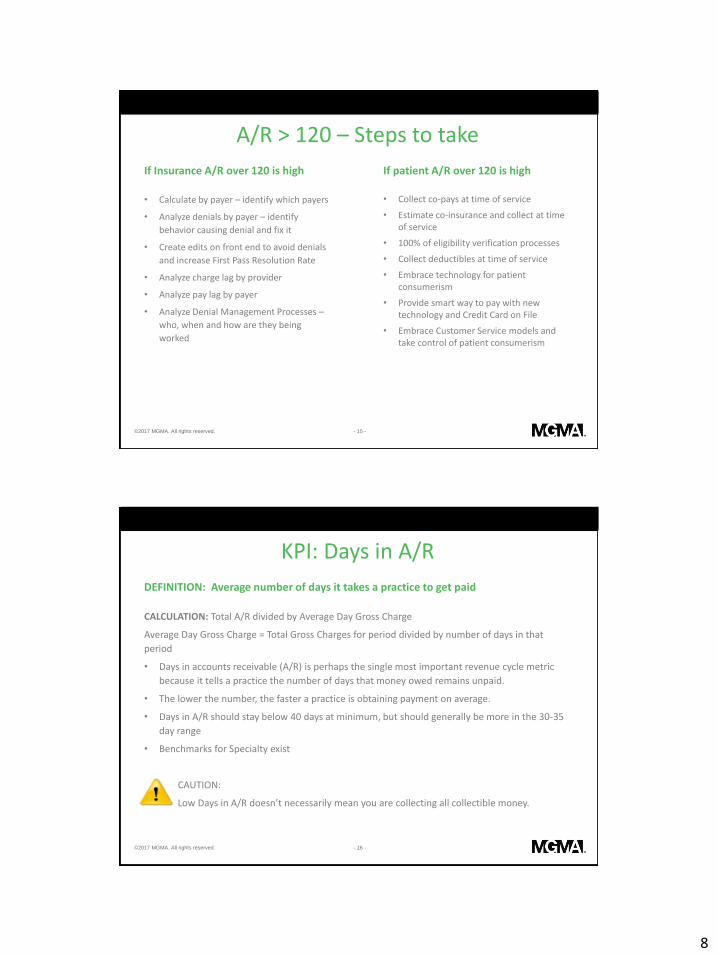
A/R > 120 – Steps to take
If Insurance A/R over 120 is high
• Calculate by payer – identify which payers
• Analyze denials by payer – identify
behavior causing denial and fix it
• Create edits on front end to avoid denials
and increase First Pass Resolution Rate
• Analyze charge lag by provider
• Analyze pay lag by payer
• Analyze Denial Management Processes –
who, when and how are they being
worked
If patient A/R over 120 is high
• Collect co-pays at time of service
• Estimate co-insurance and collect at time of service
• 100% of eligibility verification processes
• Collect deductibles at time of service
• Embrace technology for patient consumerism
• Provide smart way to pay with new technology and Credit Card on File
• Embrace Customer Service models and take control of patient consumerism
- 16 -©2017 MGMA. All rights reserved.
KPI: Days in A/R
DEFINITION: Average number of days it takes a practice to get paid
CALCULATION: Total A/R divided by Average Day Gross Charge
Average Day Gross Charge = Total Gross Charges for period divided by number of days in that
period
• Days in accounts receivable (A/R) is perhaps the single most important revenue cycle metric
because it tells a practice the number of days that money owed remains unpaid.
• The lower the number, the faster a practice is obtaining payment on average.
• Days in A/R should stay below 40 days at minimum, but should generally be more in the 30-35
day range
• Benchmarks for Specialty exist
CAUTION:
Low Days in A/R doesn’t necessarily mean you are collecting all collectible money.

9
- 17 -©2017 MGMA. All rights reserved.
Days in A/R Indications and Impact
If Days in A/R is high – possible causes
• Charge Lag may be high
• Lack of follow-up processes for denied and no response claims
• Inadequate focus on insurance and/or patient collections
• Inadequate focus on patient collection at time of service
• Lack of adequate rules engine for claims edits
• Lack of front-end processes to verify eligibility, obtain authorization
• Inadequate coding and justification for billing
• Lack of credentialing processes
Example:
- 18 -©2017 MGMA. All rights reserved.
Days in A/R – Steps to take
If Days in A/R is high – Steps you can take
• Calculate Days in A/R for each Payer to identify specific payers slow to pay
• Analyze all denial reasons for each Payer that has Days in A/R over 40
• Calculate Days in A/R for each Provider to identify if there is problem with single provider
• Re-evaluate process for working denials (Who, When, How)
• Analyze statement processes to make sure statements are going out timely and effectively
• Revamp front end processes to collect all patient responsibility at time of service
• 100% of eligibility verification
• Analyze your rules engine to increase First Pass Resolution Rate to 96% or higher
• Training and Education for Providers if Denials are Justification and Coding

10
- 19 -©2017 MGMA. All rights reserved.
KPI: First Pass Resolve Rate
DEFINITION: Percent of claims that are successfully resolved on the initial submission
(e.g., paid or transferred to patient responsibility)
CALCULATION: Total claims submitted first pass / Total claims paid
• Practice wants this to be high.
• Less deals to work and less deals to follow up on if paid first time.
• 96% or higher is great
• Most systems don’t track this
• MGMA states 25% of all claims not paid are never followed up on
- 20 -©2017 MGMA. All rights reserved.
FPRR – Steps to take
If FPRR is below 96%
• Calculate by payer – identify which payers have low FPRR
• Analyze denials by payer – identify behavior causing denial and fix it
• Implement Robust Rules Engine to catch claims before submission
• Educate and Train if coding is large percentage of denials
• 100% of eligibility verification
• Alerts for Authorizations Required (or Robust Rules Engine)
11
- 21 -©2017 MGMA. All rights reserved.
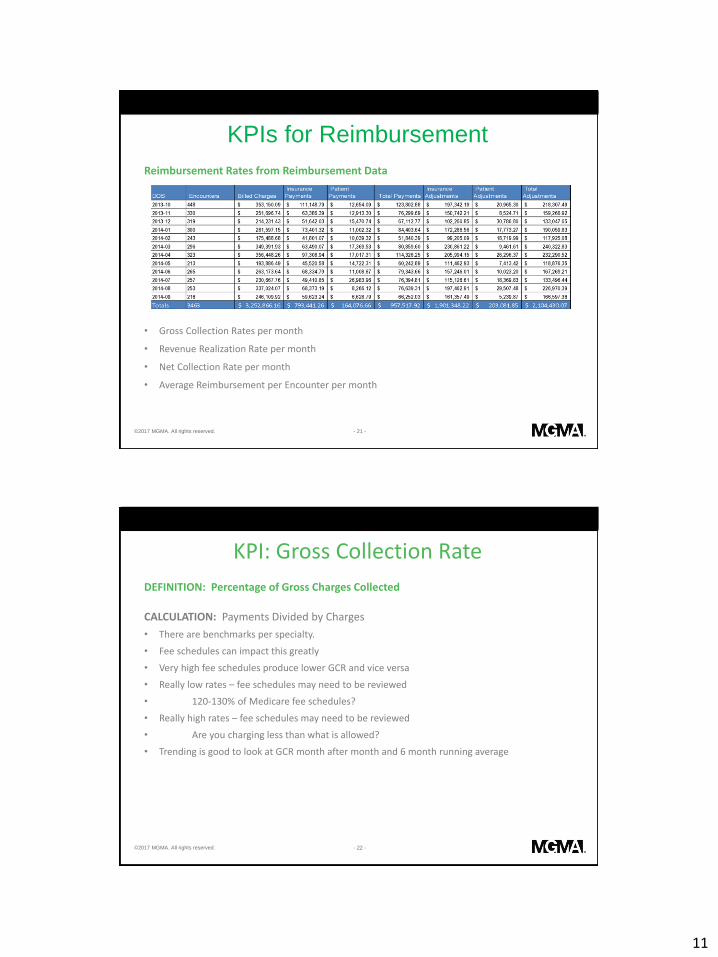
KPIs for Reimbursement
Reimbursement Rates from Reimbursement Data
• Gross Collection Rates per month
• Revenue Realization Rate per month
• Net Collection Rate per month
• Average Reimbursement per Encounter per month
- 22 -©2017 MGMA. All rights reserved.
KPI: Gross Collection Rate
DEFINITION: Percentage of Gross Charges Collected
CALCULATION: Payments Divided by Charges
• There are benchmarks per specialty.
• Fee schedules can impact this greatly
• Very high fee schedules produce lower GCR and vice versa
• Really low rates – fee schedules may need to be reviewed
• 120-130% of Medicare fee schedules?
• Really high rates – fee schedules may need to be reviewed
• Are you charging less than what is allowed?
• Trending is good to look at GCR month after month and 6 month running average

12
- 23 -©2017 MGMA. All rights reserved.
KPI: Revenue Realization Rate
DEFINITION: Percentage of Charges that were collected or adjusted off
CALCULATION: : (Payments + Adjustments) Divided by Charges
Caution: High Rate doesn’t necessarily mean you are collecting every dollar
• If number is high – Ideal Scenario
• Practice is billing out timely
• Claims are adjudicated (contractual adjustments are made)
• Patient balances are all collected
• If number is high – Not so Ideal Scenario
• Practice is billing out timely
• Claims are adjudicated (contractual adjustments are made)
• Patient balances are NOT collected (other adjustments are made)
• If number is high – Not good at all Scenario
• Practice is billing out timely
• Claims are adjudicated and denied and adjusted off without working the adjustment
• Patient balances are NOT collected (patient balances are adjusted off)
- 24 -©2017 MGMA. All rights reserved.
KPI: Net Collection Rate
DEFINITION: The net collection rate represents the percentage of reimbursement
collected from the total amount allowed based on contractual agreements
CALCULATION: Cash collections divided by net charges (charge value)
Net charges are the difference between gross charges and required government and third party adjustments.
This is using Contractual Adjustments only
If number is high
Practice is billing out timely
Claims are adjudicated (contractual adjustments are made)
Patient balances are all collected (not a lot of non-contractual adjustments)
If number is low
Practice is not billing out timely and/or claims are not being followed-up
Balances are not being collected after payer adjudication
Money is not being collected

13
- 25 -©2017 MGMA. All rights reserved.
A couple of facts
• Out-of-pocket costs for patients has increased by 230 percent in the previous 10 years,
according to a recent study from InstaMed.
• 40% of Providers fail to collect over $31,713 a year from patients.
• Insurance deductibles have increased by 255 percent since 2006.
• 83 percent of Physician Practices under five practitioners said the slow payment of high-
deductible plan patients are their top collection challenge.
Black Book RCM Survey 2017Kaiser Family Foundation’s Survey 2017InstaMed
- 26 -©2017 MGMA. All rights reserved.
Practices are not addressing patient balances
37%
43%
20%
Patient Balances
Written off as Bad Debt
Collected at Time of Service
Collected After Service
Digital Payment Progress Report™. Used with permission from MGMA, 104 Inverness Terrace East,
Englewood, Colorado 80112. 877.275.6462. www.mgma.com. Copyright 2017.

14
- 27 -©2017 MGMA. All rights reserved.
Patient Balances – Steps to take
If Inadequate Patient Collections is impacting all of your KPIs negatively
• Implement new processes to collect patient money at time of service
• Train your front end operations staff to have conversations with patients about money
• Train your schedulers to have conversations with patient about money
• Embrace new technology for patient consumerization technology
• Focus on patient experience to increase patient satisfaction
• Conduct patient satisfaction surveys
• Implement Credit Card on File and mobile solutions for patients
- 28 -©2017 MGMA. All rights reserved.
Patient Experience Technology Works
18

15
- 29 -©2017 MGMA. All rights reserved.
Knowledge is Power
Example of Real Assessment
Avg Reimbursement / Encounter 270.00$ Avg Reimbursement / Encounter 267.56$
A/R Over 120 Days 17.42% A/R Over 120 Days 12.89%
Days in A/R 42.32 Days in A/R 22.60
Gross Collection Rate 45.5% Gross Collection Rate 63.99%
Revenue Realization Rate 100.0% Revenue Realization Rate 98.50%
Net Collection Rate > 95% Net Collection Rate 95.95%
First Pass Resolution Rate 94% First Pass Resolution Rate 98.44%
Denial Percentage 2 - 4 Denial Percentage 1.5%
Practice KPIsBenchmark KPIs
- 30 -©2017 MGMA. All rights reserved.
Knowledge is Power
Another Example of Real Assessment
• A/R Over 120 is extremely high running at 62% compared to 8% benchmark
• Days in A/R is extremely high running at 73 compared to 28 benchmark
• Net Collection Rate is low at 89% when at minimum should be 95%
Avg Reimbursement / Encounter 173.00$ Avg Reimbursement / Encounter 166.78$
A/R Over 120 Days 8.24% A/R Over 120 Days 62.01%
Days in A/R 28.18 Days in A/R 72.95
Gross Collection Rate 50.9% Gross Collection Rate 39.30%
Revenue Realization Rate 98.4% Revenue Realization Rate 93.27%
Net Collection Rate > 95% Net Collection Rate 89.58%
First Pass Resolution Rate 94% First Pass Resolution Rate 81%
Denial Percentage 2 - 4 Denial Percentage 13.0%
Practice KPIsBenchmark KPIs

16
- 31 -©2017 MGMA. All rights reserved.
Convert Analysis to Dollars
Example of Net Collection Improvement
• Multiply the Net Charges (Charges less Contractual Adjustments) by 95%
• This yields what should have been collected. Subtract actual collections.
• This will give you the Opportunity for Net Collection Improvement in Dollars
November 2016 - October 2017 Charges Collections Cont Adj. Man Adj.
12 Months $ 3,344,174.69 $ 1,400,426.29 $ 1,780,864.85 $ 23,999.44
Credit Balances ($86,240.91)
Gross Collection Ratio 39.30% Collections / Charges
Revenue Realization Rate 93.27% (Collections plus Adjustments) / Charges
Net Collection Ratio 89.58% Collections / (Charges less Contractual Adjustment) without credit factor
Based on improving from 89.58% to following: Improvement GCR
Collections at 95% NCR $1,485,144 $ 170,958.97 44%
Collections at 96% NCR $1,500,777 $ 186,592.07 45%
©2017 MGMA. All rights reserved. - 32 -
Become a High Performer
Drive KPIs
• Revamp front end processes
• Implement robust rules
engine
• Analyze denials and modify
behavior
• Focus on patient collections
• Analyze KPIs consistently
• Communicate results
effectively
Patient Experience
• Embrace patient consumerization with new technology and customer service
• Implement credit card on file and mobile solutions
• Conduct patient satisfaction surveys
• Retain patients and attract new patients with consumer technology

17
- 33 -©2018 MGMA. All rights reserved.
Continuing Education ACMPE credit for medical practice executives…………... 1ACHE credit for medical practice executives…………..…. 1CME AMA PRA Category 1 Credits™……………………….. 1
*CPE credit for certified public accountants (CPAs)……….. 1.2CEU credit for generic continuing education………..……. 1
*CPE CODE
Let the speakers know what you thought!Evaluations will be emailed to you daily.
Thank You.
MGMA.COM
Patti Peets
601-214-1009
CareCloud
5200 Blue Lagoon Dr.
Ste 900
Miami, FL 33126