unlocking the value of human capital analytics for the cfo · pdf fileunlocking the value of...
TRANSCRIPT

Unlocking the Value of Human Capital
Analytics for the CFO Mick Collins, Vice President, Workforce Analytics & Planning, SuccessFactors
October 9, 2015 Public

© 2015 SAP SE or an SAP affiliate company. All rights reserved. 2
The goal of human capital
analytics is to drive business
outcomes by optimizing
investments in talent
The reality is that HR often
defaults back to traditional
metrics with little connection to
business strategy…

© 2015 SAP SE or an SAP affiliate company. All rights reserved. 3
Example of an HR Metrics Dashboard

© 2015 SAP SE or an SAP affiliate company. All rights reserved. 4
The CFO’s role is to assist in
taking the “raw” human capital
insight and helping quantify
the extent to which it creates a
material risk that could impact
strategy and growth
Source: CFO.com
© 2015 SAP SE or an SAP affiliate company. All rights reserved. 5
For every 1
percent increase in
terminations…
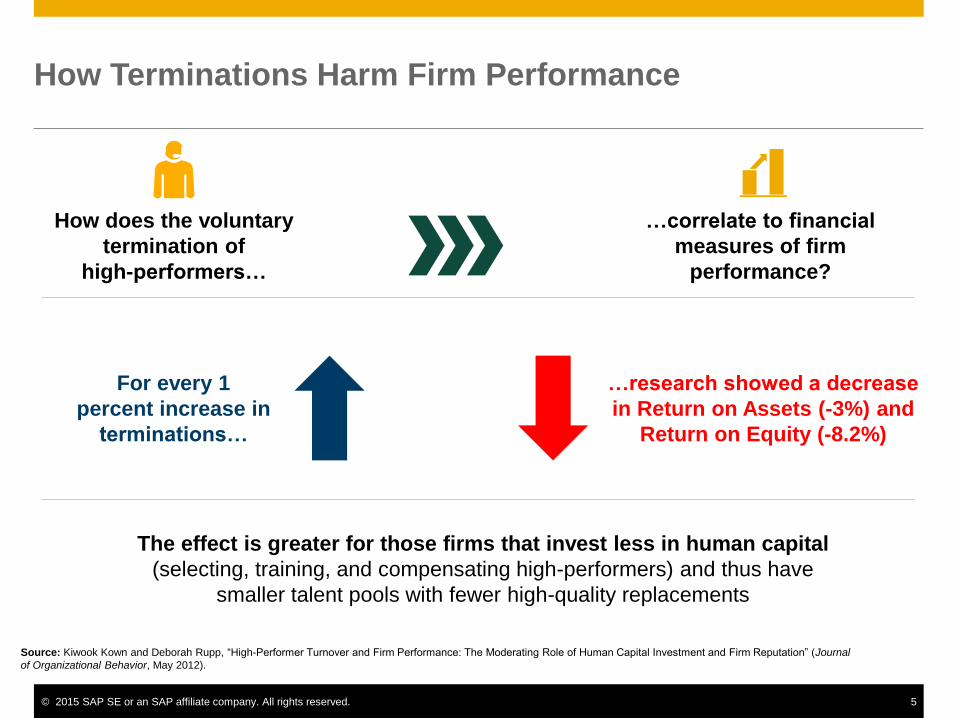
Source: Kiwook Kown and Deborah Rupp, “High-Performer Turnover and Firm Performance: The Moderating Role of Human Capital Investment and Firm Reputation” (Journal
of Organizational Behavior, May 2012).
How Terminations Harm Firm Performance
How does the voluntary
termination of
high-performers…
…correlate to financial
measures of firm
performance?
…research showed a decrease
in Return on Assets (-3%) and
Return on Equity (-8.2%)
The effect is greater for those firms that invest less in human capital
(selecting, training, and compensating high-performers) and thus have
smaller talent pools with fewer high-quality replacements

© 2015 SAP SE or an SAP affiliate company. All rights reserved. 6
-7,0%
0,4%
9,8%
-2,7%
5,7%
25,4%
10,9% 12,9%
26,2%
14,8%
19,9%
28,0%
-10%
-5%
0%
5%
10%
15%
20%
25%
30%
Low-Performers Mid-Performers Top Performers
Human Capital ROI Ratio Return on Human Capital Investment
Stock Price Market Value (Capitalization)
Human Capital Metrics Link to Stock Price Human Capital Metrics Track With Stock Price
Top quartile companies improved workforce productivity 9.8% & 25.4% annually,
seeing 26.2% annual stock price gains, double the market average improvement
Source: Human Capital Management Institute, “Human Capital and Market Capitalization, Financial Services”, October, 2015
Financial Services Industry Change Rates (CAGR) 2012-2014

© 2015 SAP SE or an SAP affiliate company. All rights reserved. 7
One Question, Two Approaches
“How Many People Do We Have?”
“Finance has the
answer”
“Wait…HR has the
answer”
“We have our own
definition” “So do we”
“We use this data to
identify talent gaps”
“We use this data to
plan our budgets”
“Where does this
data go?”
“Please fill in the
spreadsheet”

© 2015 SAP SE or an SAP affiliate company. All rights reserved. 8
How can CFOs and
Heads of HR collaborate
to use workforce data and
impact business results?

© 2015 SAP SE or an SAP affiliate company. All rights reserved. 9
CFOs Expect CHROs to Develop Financial Acumen and to
Align Workforce & Financial Strategies
Improve
Knowledge
of Metrics
Monitor
Headcount
& Costs
CHRO Competencies
Develop financial expertise to
engage in cost–benefit analysis
and strengthen the financial
acumen of the HR team
Business Alignment
CFOs and CHROs set realistic
expectations - for line managers -
about workforce needs, allowing
for disciplined decision-making
Source: Bridging the CHRO/CFO Divide: Four Areas Where CFOs and CHROs Disagree, www.executiveboard.com/blogs/bridging-the-chrocfo-divide-four-areas-where-
cfos-and-chros-disagree/?business_line=finance

© 2015 SAP SE or an SAP affiliate company. All rights reserved. 10
Human Capital Risks, Revenues, & Costs:
How Well Do You Know Your Organization?
What is your revenue per FTE, compared to your
competitors’? Which BUs have the lowest?
How many units of profit are generated for every
unit invested in compensation & benefits?
What is the increase in workforce performance
resulting from every 1 percent increase in pay?
What “hidden costs” – such as contingent labor
spend - does your business not track?
What percentage of HR programs actually
achieve the ROI stated in their project proposals?
Is the human capital ROI higher than working
capital, invested capital, or plant/equipment ROI?
Are you understaffed in areas that, if you were to
add people, you could increase our profitability?
What new sources of revenue will require a very
different type of employee that those of today?
What is the percentage increase in performance
as a result of every $1,000 spent on training?
What is the Total Cost of Workforce required to fill
long-term talent gaps?
In the last five years, has workforce productivity
increased, decreased, or remained the same?
Which executive roles face the greatest
vacancy/readiness risk?
Do you retain your key/most productive people at
a higher rate than our best competitors do?
Which BUs have the greatest annual knowledge
loss from terminations, transfers, & promotions?
How many workplace injuries occur each year?
Which locations have the highest incident rates?
What will be the five most important
competencies for your firm in 2, 3, or 5 years?
How do you define talent “innovation” and what
data will you use to measure it?
What percentage of your workforce will retire in
the next five years?
What percentage of your high performers are at
high risk for departure?
Which demographic trends (aging population,
outsourcing, etc.) will most impact your business?
Near-Term Mid/Long-Term
Revenue
& Costs
Risks
© 2015 SAP SE or an SAP affiliate company. All rights reserved. 11
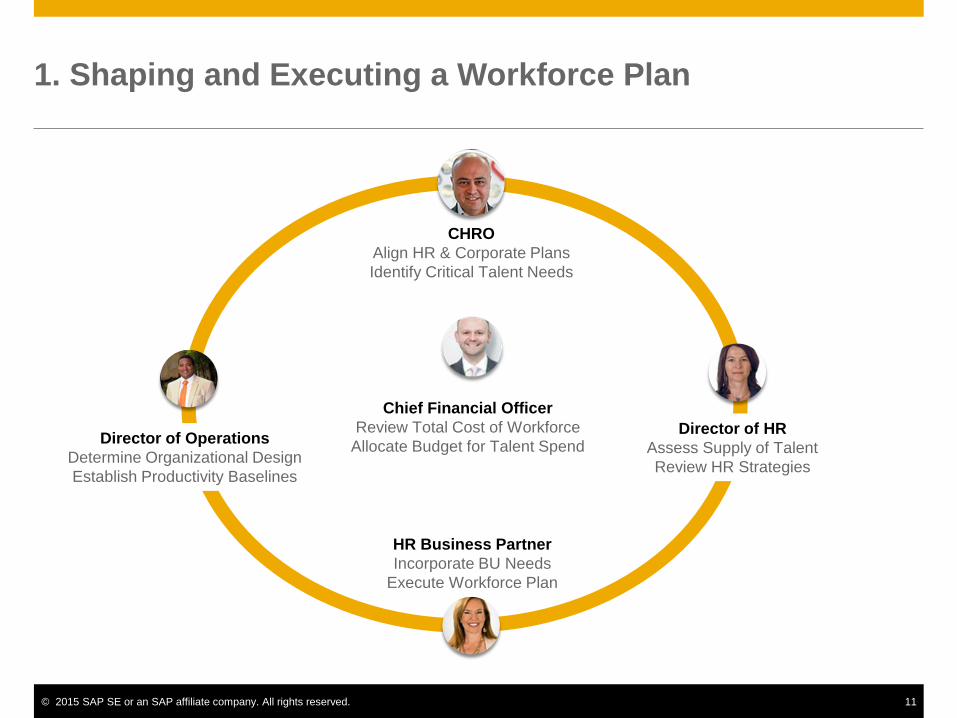
1. Shaping and Executing a Workforce Plan
CHRO
Align HR & Corporate Plans
Identify Critical Talent Needs
Director of Operations
Determine Organizational Design
Establish Productivity Baselines
HR Business Partner
Incorporate BU Needs
Execute Workforce Plan
Director of HR
Assess Supply of Talent
Review HR Strategies
Chief Financial Officer
Review Total Cost of Workforce
Allocate Budget for Talent Spend

© 2015 SAP SE or an SAP affiliate company. All rights reserved. 12
2. Improving Operational Efficiency
Operational
Efficiency
Manage
“Hidden” Costs
Manage “Human
Capital Supply
Chain” Risks
Workforce Mix
Contingent Labor
Span of Control
Unscheduled Absence
Controllable Turnover
Productivity

© 2015 SAP SE or an SAP affiliate company. All rights reserved. 13
3. Driving New Revenue Opportunities

© 2015 SAP SE or an SAP affiliate company. All rights reserved. 14
Start With a Business Hypothesis, Use Big Data, Change Behaviors
Wawa finds a high correlation between
terminating employees that are younger than
30 and have <3 months tenure, prompting the
firm to use big data to investigate related trends.
The company finds that the “danger zone” for high
turnover risk is employees working seven to 16
hours per week and those with less than 39 days of
tenure. If the firm can get employees to 39 days, their
probability of staying one year rises dramatically.
Wawa educates their managers on policies for
new-hire scheduling and working hours. The
company plans to revisit recruitment, onboarding,
training and other engagement practices to ensure
employees receive full cultural immersion…
Sources: Wawa Uses Analytics to Bring Fresh Insights to Strategic Workforce Planning and Corporate Strategy,
SuccessConnect 2015; “America’s Favorite Convenience Store Finds Recipe for Fresh Workforce Analytics,
http://news.sap.com/wawa-americas-favorite-convenience-store-finds-recipe-for-fresh-workforce-analytics/
…with turnover cost savings estimated at
$1 million per year.
$1M

© 2014 SAP SE or an SAP affiliate company. All rights reserved. 15
How SuccessFactors Workforce Analytics & Planning Can Help
“On my desk is one of the most amazing pieces of HR work I’ve ever run across. At 600 pages, the spiral bound
book is a ream of paper devoted to the
documentation of HR Metrics.”
John Sumser (HR Examiner.com)
What SuccessFactors Offers:
30 years of domain expertise,
including workforce planning
GAAP-like industry standard
metrics; pre-built analytical
models
Revenue, cost, and risk metrics,
delivered directly to people
managers
Strategy-driven workforce
forecasting to identify and mitigate
human capital risks
Extensive partner network, to
deliver added capabilities

© 2015 SAP SE or an SAP affiliate company. All rights reserved.
Thank you
Contact information:
Mick Collins
Vice-President, Workforce Analytics & Planning
Email: [email protected]
Twitter: @mickcollins