unlocking value - utah · will include solar panels, consistent with tejon ranch’s commitment to...
TRANSCRIPT

U N L O C K I N G V A L U E
T E J O N R A N C H C O .
A N N U A L R E P O R T2 0 1 6
California Aqueduct
Kern County
to B
akersfield
Los Angeles County
Corporate Headquarters
MOUNTAIN VILLAGE
CENTENNIAL
GRAPEVINE
138
Quail Lake
Castac Lake
Ventura County
99
223
58
5
5
to Los Angeles
TEJON RANCH COMMERCE CENTER
U N L O C K I N G V A L U E T E J O N R A N C H C O .
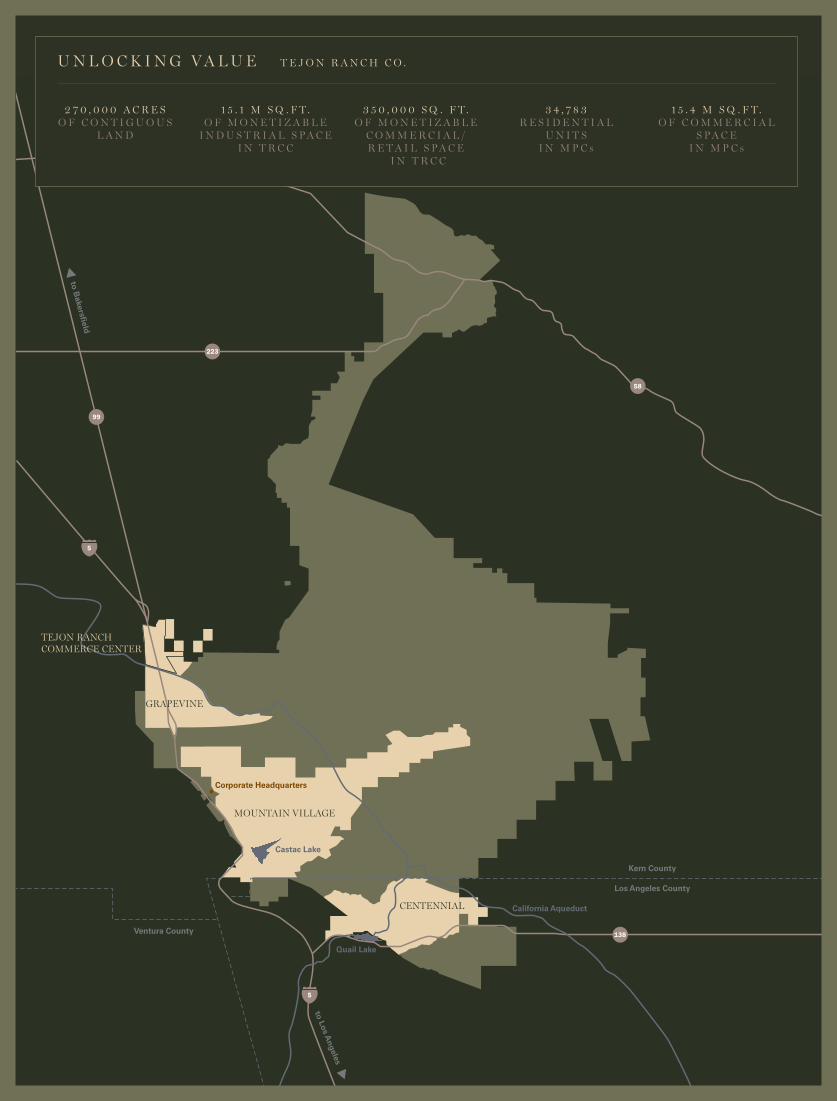
2 7 0 , 0 0 0 A C R E S O F C O N T I G U O U S
L A N D
1 5 . 1 M S Q . F T . O F M O N E T I Z A B L E
I N D U S T R I A L S PA C EI N T R C C
3 5 0 , 0 0 0 S Q . F T . O F M O N E T I Z A B L E
C O M M E R C I A L / R E T A I L S PA C E
I N T R C C
3 4 , 7 8 3 R E S I D E N T I A L
U N I T S I N M P C s
1 5 . 4 M S Q . F T . O F C O M M E R C I A L
S PA C EI N M P C s
T O O U R V A L U E D S H A R E H O L D E R S
Driving north on Interstate 5 from Los
Angeles, the sky opens up almost imme-
diately as you pass through the densely
populated San Fernando and Santa Clarita
Valleys into the mountains that make up
the Angeles National Forest. A quick half
hour later, the southern rim of Tejon Ranch
begins to fill in, the highway draws near
our headquarters, through the Grapevine
and down into the San Joaquin Valley.
The distance traveled covers much of the
western boundary of the 270,000 acres
that make up Tejon Ranch, and the diversity
in landscape, commerce and community
you see from the highway, parallel the
core assets of our company. As a diversified
real estate development and agribusiness,
our land is tied to how we are unlocking
asset value.
In 2016, each of the company’s five business
segments: Commercial/Industrial Real Estate,
Resort/Residential Real Estate, Mineral
Resources, Farming, and Ranch Operations,
played an integral role in driving value for
the company. The progress we are making
with our large-scale master planned real
estate developments aligns with the
continued traction we are experiencing at
the Tejon Ranch Commerce Center (TRCC),
our 1,450-acre commercial/industrial
development. The steady cash flow gen-
erated from our commercial division, our
mineral resources, and farming operations
serves as a solid foundation for supporting
the development of our real estate assets.
Demand for economic development and
housing continues to rise throughout our
region, and the trajectory for population
1
3%
17%
38%
1%
22%
9%
3%
7%
U N L O C K I N G V A L U E
T E J O N R A N C H C O . A n n u a l R e p o r t 2 0 1 6
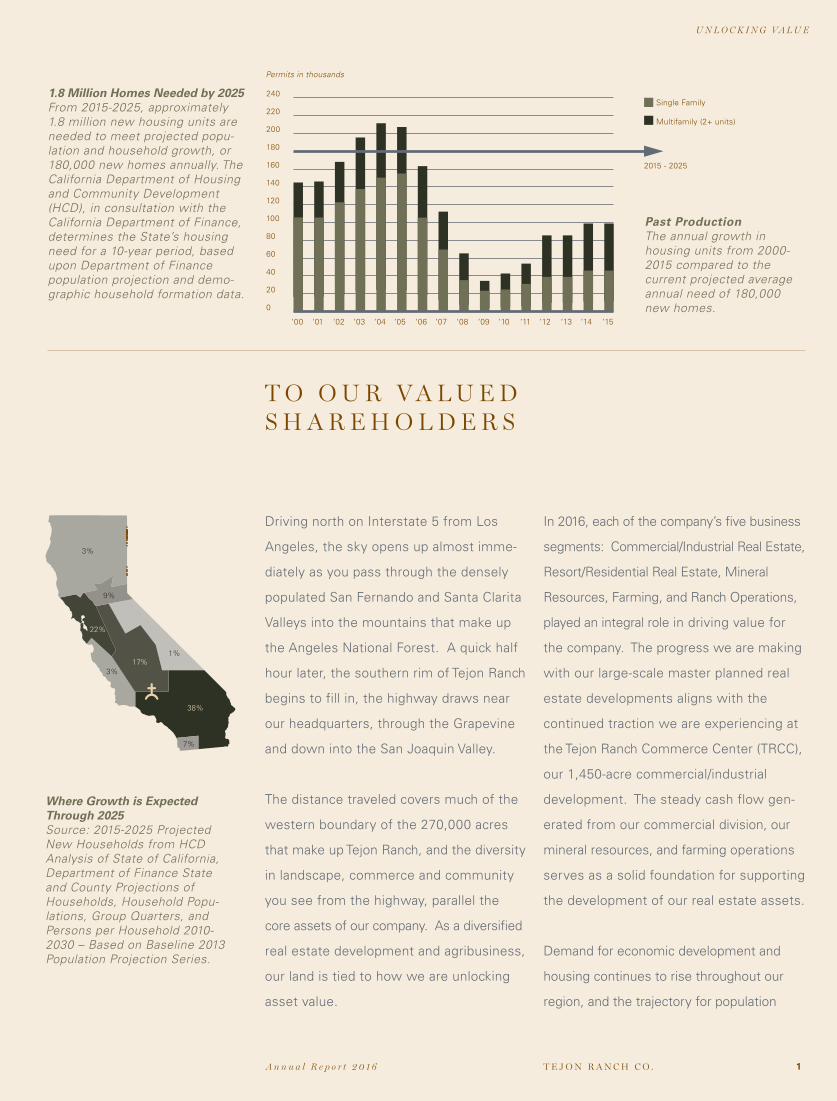
1.8 Million Homes Needed by 2025From 2015-2025, approximately 1.8 million new housing units are needed to meet projected popu-lation and household growth, or 180,000 new homes annually. The California Department of Housing and Community Development (HCD), in consultation with the California Department of Finance, determines the State’s housing need for a 10-year period, based upon Department of Finance population projection and demo-graphic household formation data.
Where Growth is Expected Through 2025Source: 2015-2025 Projected New Households from HCD Analysis of State of California, Department of Finance State and County Projections of Households, Household Popu-lations, Group Quarters, and Persons per Household 2010-2030 – Based on Baseline 2013 Population Projection Series.
Past ProductionThe annual growth in housing units from 2000-2015 compared to the current projected average annual need of 180,000 new homes.
‘00 ‘01 ‘02 ‘03 ‘04 ‘05 ‘06 ‘07 ‘08 ‘09 ‘10 ‘11 ‘12 ‘13 ‘14 ‘15
Single Family
Multifamily (2+ units)
2015 - 2025
Permits in thousands
240
220
200
180
160
140
120
100
80
60
40
20
0

growth is headed in our direction. California’s
population is expected to increase almost
30 percent to 50 million during the next
three decades, and nearly half of those
residents will live in Southern California. The
challenge is where will they all live? California
is perhaps the most highly regulated state in
the nation and has created a series of barriers
that are contributing to a severe housing
shortage. Tejon Ranch is answering that
challenge through our resources, knowledge
and vast experience.
Solid Progress
That’s why our strategy focuses on the
development of large scale residential and
mixed use communities. We have honed
our expertise over the years navigating
California’s complex regulatory landscape,
and we believe we have a formula in place
that puts shovels in the ground effectively.
The process entails securing local entitle-
ments, obtaining state and federal permits
to develop the land, producing detailed
tract maps showing exact locations of lots
and systems infrastructure, which sets the
stage to apply for permits to commence
construction.
While none of this happens overnight,
and working through regulatory require-
ments may ultimately take a decade or
more from start-to-finish before we can
break ground on a development, each of
our residential communities – Mountain
Village, Grapevine, and Centennial – is
well positioned and making solid progress
toward beginning construction.
ABOVE: Interstate 5 as it winds through Grapevine Canyon. Tejon Ranch owns 16 miles of freeway frontage along I-5.
U N L O C K I N G V A L U E
T E J O N R A N C H C O . A n n u a l R e p o r t 2 0 1 62
We are very excited about the stage we’ve
entered with Mountain Village, which is in
the final phase of the regulatory process.
The property is fully entitled and important
state and federal permits have been
secured. The Board of Directors has
approved our business plan and tentative
tract maps have been submitted to Kern
County. Once approved, we can move forward
with the final steps to begin construction.
The community is entitled for 3,450
homes, 750 hotel keys and approximately
160,000 commercial square feet, offering
owners and guests a wide variety of high
quality and much-desired amenities, as
well as a robust technology infrastructure
to ensure people stay connected.
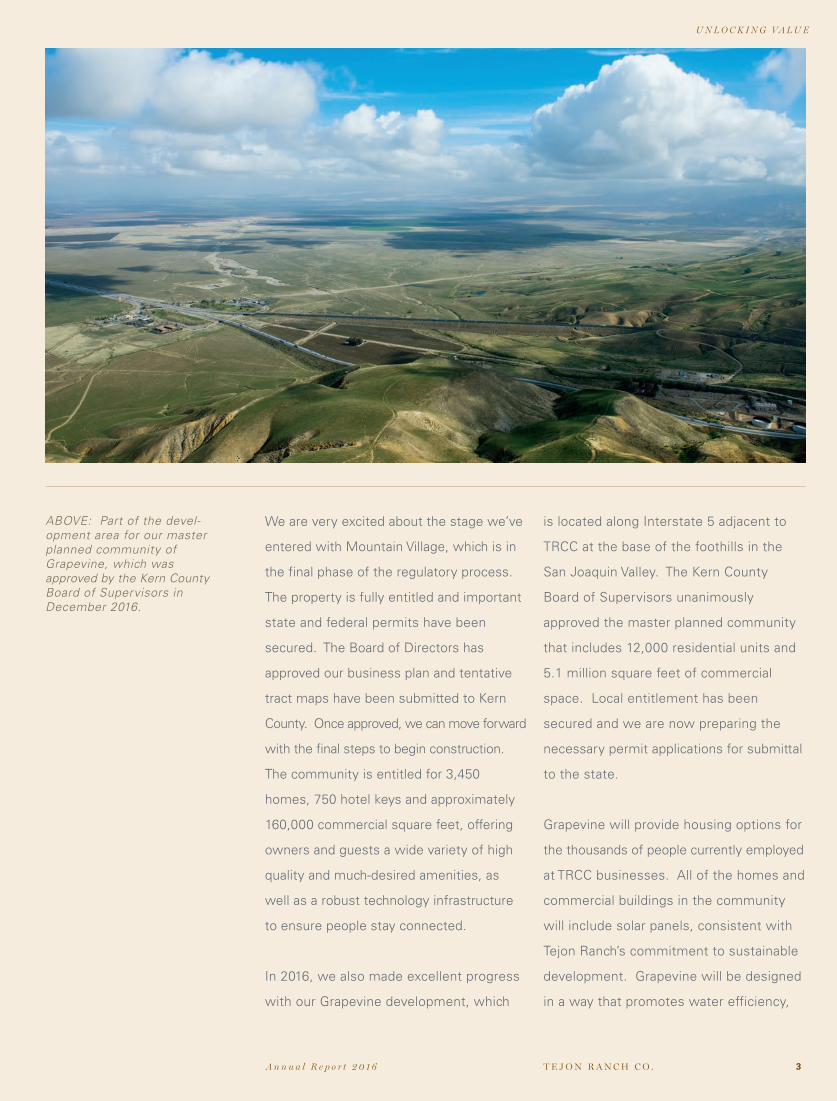
In 2016, we also made excellent progress
with our Grapevine development, which
is located along Interstate 5 adjacent to
TRCC at the base of the foothills in the
San Joaquin Valley. The Kern County
Board of Supervisors unanimously
approved the master planned community
that includes 12,000 residential units and
5.1 million square feet of commercial
space. Local entitlement has been
secured and we are now preparing the
necessary permit applications for submittal
to the state.
Grapevine will provide housing options for
the thousands of people currently employed
at TRCC businesses. All of the homes and
commercial buildings in the community
will include solar panels, consistent with
Tejon Ranch’s commitment to sustainable
development. Grapevine will be designed
in a way that promotes water efficiency,
ABOVE: Part of the devel-opment area for our master planned community of Grapevine, which was approved by the Kern County Board of Supervisors in December 2016.
3
U N L O C K I N G V A L U E
T E J O N R A N C H C O . A n n u a l R e p o r t 2 0 1 6

and that provides an extensive network of
bike and walking trails.
The Ranch’s southern-most master-
planned development is Centennial, a Los
Angeles County-based property that will
help address the region’s housing needs,
while also embracing economic development,
sustainability and conservation. In 2017,
Los Angeles County is expected to circulate
an environmental impact report and
process the community’s Specific Plan
for county approval, a plan that includes
19,333 residential units and 10.1 million
square feet of commercial space. In 2015,
we received approval from the Los Angeles
County Board of Supervisors, providing
land use designations in the county’s
General Plan and zoning for the property.
In addition to much-needed housing, our
vision for Centennial includes business
districts, schools, retail and entertainment
centers, medical facilities and other
commercial offices, in addition to light
industrial businesses that, when complete,
would create a substantial number of jobs.
Even as we work to address the need for
more housing in the state, we have also been
steadfast to maintain our conservation
heritage. You’ll recall, in 2008 we entered
into a voluntary agreement with a number
of major environmental groups to provide for
significant conservation while still preserving
the Company’s real estate development and
value creation activities. As we progress in
those efforts, it is particularly important to
note that this agreement and Tejon Ranch’s
holistic approach is supported by key regula-
tory agencies in the state.
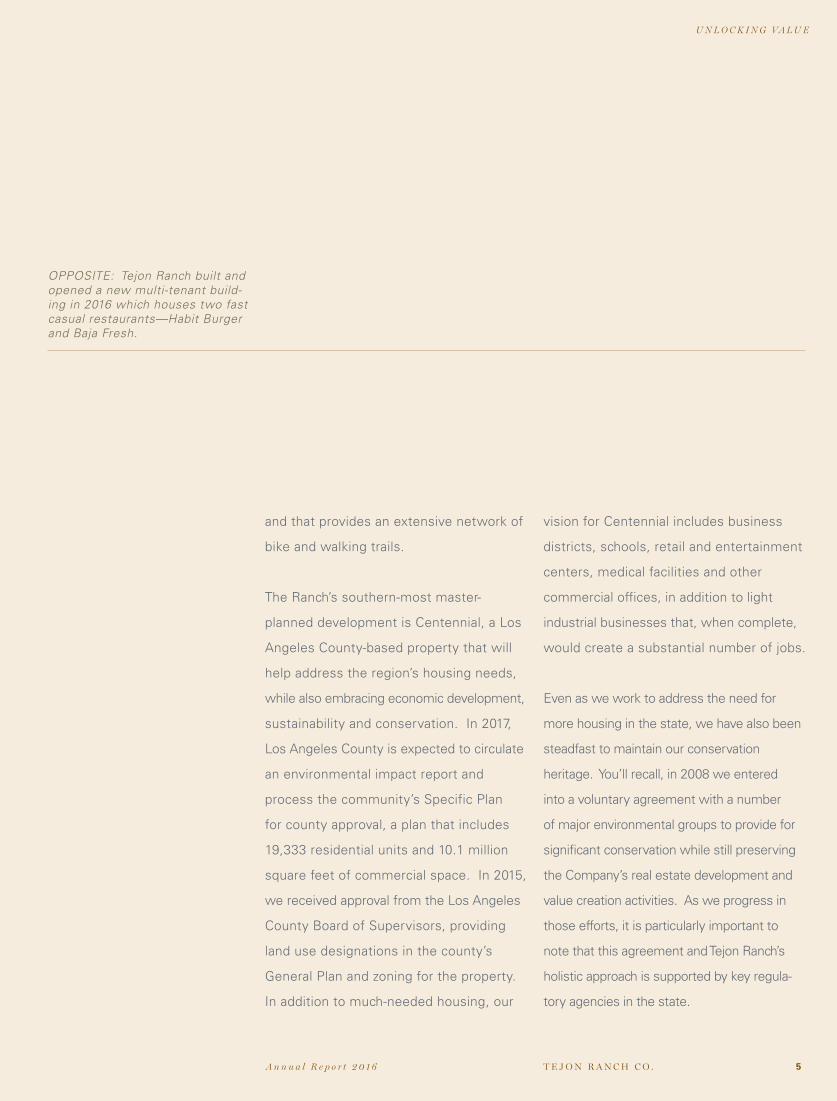
OPPOSITE: Tejon Ranch built and opened a new multi-tenant build-ing in 2016 which houses two fast casual restaurants—Habit Burger and Baja Fresh.
5
U N L O C K I N G V A L U E
T E J O N R A N C H C O . A n n u a l R e p o r t 2 0 1 6
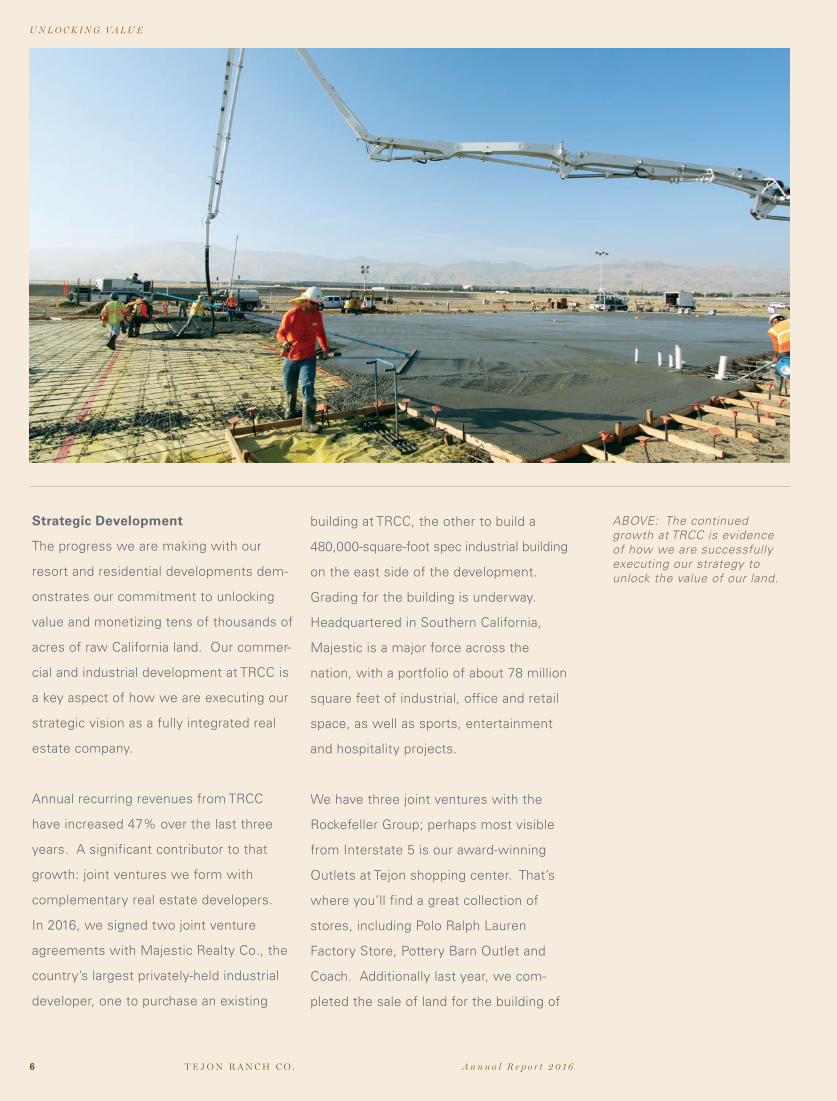
Strategic Development
The progress we are making with our
resort and residential developments dem-
onstrates our commitment to unlocking
value and monetizing tens of thousands of
acres of raw California land. Our commer-
cial and industrial development at TRCC is
a key aspect of how we are executing our
strategic vision as a fully integrated real
estate company.
Annual recurring revenues from TRCC
have increased 47% over the last three
years. A significant contributor to that
growth: joint ventures we form with
complementary real estate developers.
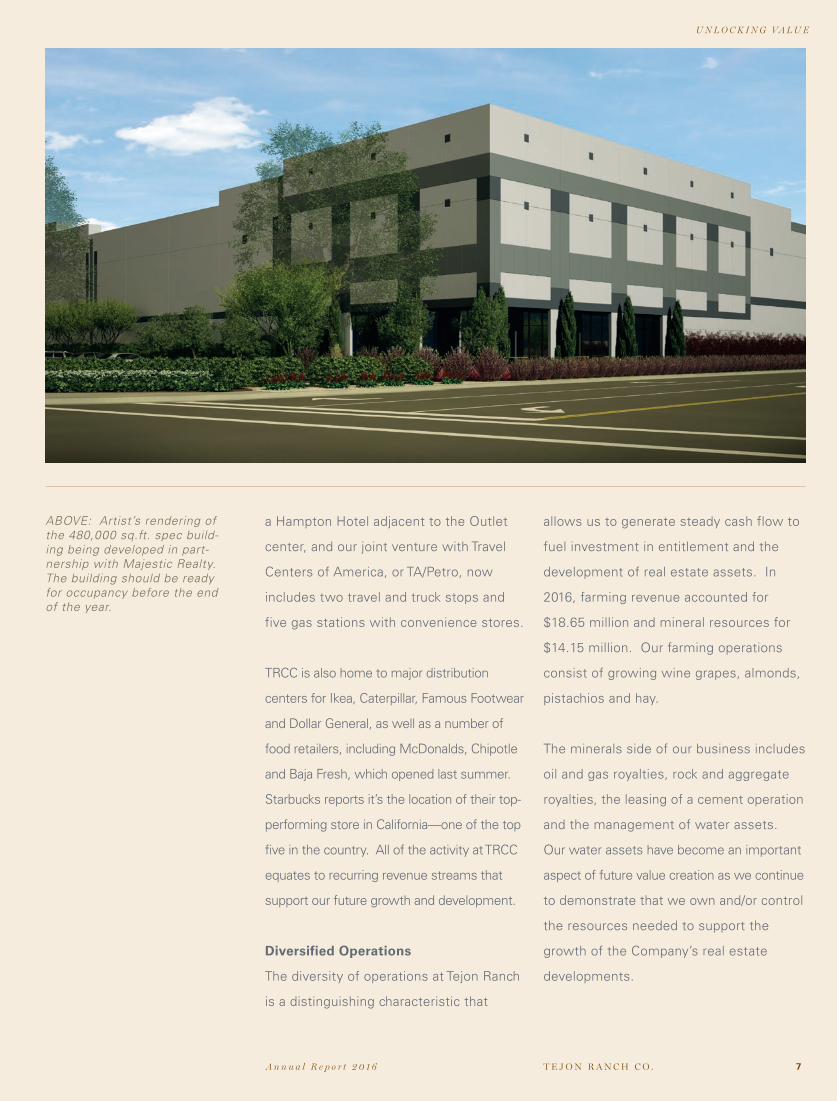
In 2016, we signed two joint venture
agreements with Majestic Realty Co., the
country’s largest privately-held industrial
developer, one to purchase an existing
building at TRCC, the other to build a
480,000-square-foot spec industrial building
on the east side of the development.
Grading for the building is underway.
Headquartered in Southern California,
Majestic is a major force across the
nation, with a portfolio of about 78 million
square feet of industrial, office and retail
space, as well as sports, entertainment
and hospitality projects.
We have three joint ventures with the
Rockefeller Group; perhaps most visible
from Interstate 5 is our award-winning
Outlets at Tejon shopping center. That’s
where you’ll find a great collection of
stores, including Polo Ralph Lauren
Factory Store, Pottery Barn Outlet and
Coach. Additionally last year, we com-
pleted the sale of land for the building of
U N L O C K I N G V A L U E
T E J O N R A N C H C O . A n n u a l R e p o r t 2 0 1 66
ABOVE: The continued growth at TRCC is evidence of how we are successfully executing our strategy to unlock the value of our land.
a Hampton Hotel adjacent to the Outlet
center, and our joint venture with Travel
Centers of America, or TA/Petro, now
includes two travel and truck stops and
five gas stations with convenience stores.
TRCC is also home to major distribution
centers for Ikea, Caterpillar, Famous Footwear
and Dollar General, as well as a number of
food retailers, including McDonalds, Chipotle
and Baja Fresh, which opened last summer.
Starbucks reports it’s the location of their top-
performing store in California—one of the top
five in the country. All of the activity at TRCC
equates to recurring revenue streams that
support our future growth and development.
Diversified Operations
The diversity of operations at Tejon Ranch
is a distinguishing characteristic that
allows us to generate steady cash flow to
fuel investment in entitlement and the
development of real estate assets. In
2016, farming revenue accounted for
$18.65 million and mineral resources for
$14.15 million. Our farming operations
consist of growing wine grapes, almonds,
pistachios and hay.
The minerals side of our business includes
oil and gas royalties, rock and aggregate
royalties, the leasing of a cement operation
and the management of water assets.
Our water assets have become an important
aspect of future value creation as we continue
to demonstrate that we own and/or control
the resources needed to support the
growth of the Company’s real estate
developments.
7
ABOVE: Artist’s rendering of the 480,000 sq.ft. spec build-ing being developed in part-nership with Majestic Realty. The building should be ready for occupancy before the end of the year.
U N L O C K I N G V A L U E
T E J O N R A N C H C O . A n n u a l R e p o r t 2 0 1 6
Solid Foundation
These attributes contribute to a solid foun-
dation that puts Tejon Ranch in a position
of strength to capitalize on its real estate
assets. From a financial perspective, that
means having the right capital structure in
place to invest in core business segments
and achieve profitable future growth.
At December 31, 2016, we had approxi-
mately $28.0 million in cash and securities
and $22.3 million available on our revolving
line of credit to meet short-term investing
needs. We will continue to explore partner-
ships and other financing options to further
enhance the company’s strong balance sheet.
By the time you read this letter, wildflow-
ers will be in bloom throughout Tejon Ranch.
More progress will have been made on our
master planned communities. And more than
20 million people will have driven through
the Tejon Ranch Commerce Center since the
beginning of the year.
Words can only describe the transformation
we’re experiencing at Tejon Ranch, and I
encourage you to visit us to see it firsthand.
Thank you for your continued support as
we make substantial progress in unlocking
asset value.
Gregory S. Bielli
President & CEO
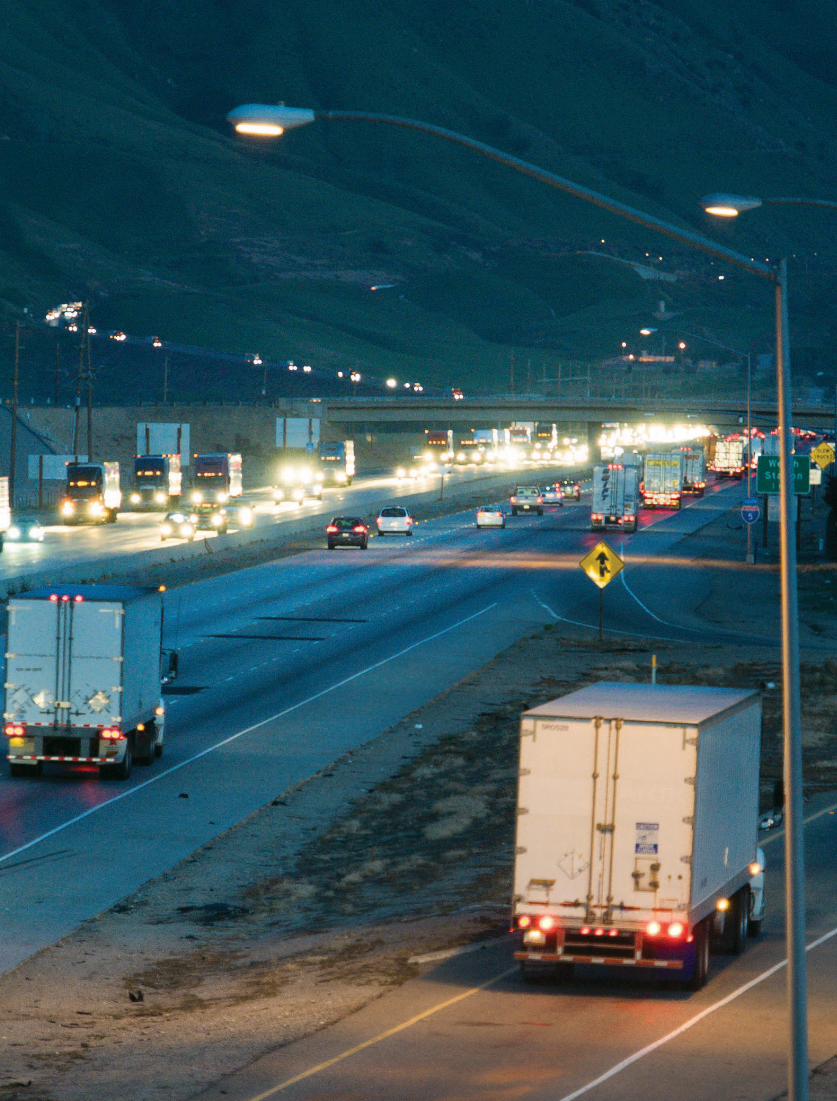
OPPOSITE: Traffic continues to increase on Interstate 5, making Tejon Ranch visible to millions of people.
U N L O C K I N G V A L U E
T E J O N R A N C H C O . A n n u a l R e p o r t 2 0 1 6 9
F I N A N C I A L H I G H L I G H T S

U N L O C K I N G V A L U E T E J O N R A N C H C O .
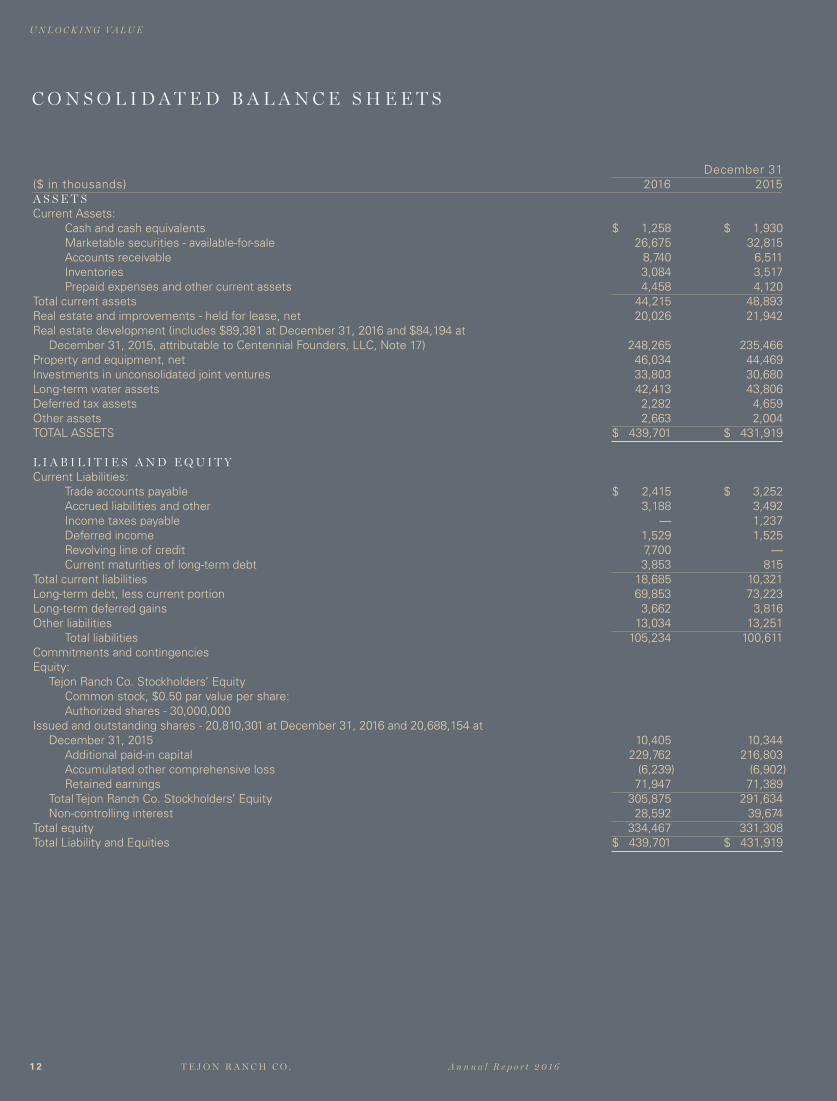
December 31($ in thousands) 2016 2015A S S E T SCurrent Assets: Cash and cash equivalents $ 1,258 $ 1,930 Marketable securities - available-for-sale 26,675 32,815 Accounts receivable 8,740 6,511 Inventories 3,084 3,517 Prepaid expenses and other current assets 4,458 4,120Total current assets 44,215 48,893Real estate and improvements - held for lease, net 20,026 21,942Real estate development (includes $89,381 at December 31, 2016 and $84,194 at December 31, 2015, attributable to Centennial Founders, LLC, Note 17) 248,265 235,466Property and equipment, net 46,034 44,469Investments in unconsolidated joint ventures 33,803 30,680Long-term water assets 42,413 43,806Deferred tax assets 2,282 4,659Other assets 2,663 2,004TOTAL ASSETS $ 439,701 $ 431,919
L I A B I L I T I E S A N D E Q U I T Y Current Liabilities: Trade accounts payable $ 2,415 $ 3,252 Accrued liabilities and other 3,188 3,492 Income taxes payable — 1,237 Deferred income 1,529 1,525 Revolving line of credit 7,700 — Current maturities of long-term debt 3,853 815Total current liabilities 18,685 10,321Long-term debt, less current portion 69,853 73,223Long-term deferred gains 3,662 3,816Other liabilities 13,034 13,251 Total liabilities 105,234 100,611Commitments and contingencies Equity: Tejon Ranch Co. Stockholders’ Equity Common stock, $0.50 par value per share: Authorized shares - 30,000,000 Issued and outstanding shares - 20,810,301 at December 31, 2016 and 20,688,154 at December 31, 2015 10,405 10,344 Additional paid-in capital 229,762 216,803 Accumulated other comprehensive loss (6,239) (6,902) Retained earnings 71,947 71,389 Total Tejon Ranch Co. Stockholders’ Equity 305,875 291,634 Non-controlling interest 28,592 39,674Total equity 334,467 331,308Total Liability and Equities $ 439,701 $ 431,919
C O N S O L I D A T E D B A L A N C E S H E E T S
U N L O C K I N G V A L U E
T E J O N R A N C H C O . A n n u a l R e p o r t 2 0 1 61 2

C O N S O L I D A T E D S T A T E M E N T S O F I N C O M E
U N L O C K I N G V A L U E
T E J O N R A N C H C O . A n n u a l R e p o r t 2 0 1 6 1 3
Year Ended December 31($ in thousands, except per share amounts) 2016 2015 2014R E V E N U E S : Real estate - commercial/industrial $ 9,438 $ 8,272 $ 7,845 Mineral resources 14,153 15,116 16,255 Farming 18,648 23,836 23,435 Ranch operations 3,338 3,923 3,534 Total revenues 45,577 51,147 51,069Costs and Expenses: Real estate - commercial/industrial 7,100 6,694 7,206 Real estate - resort/residential 1,630 2,349 2,608 Mineral resources 7,796 7,396 6,418 Farming 18,673 18,984 16,250 Ranch operations 5,734 6,112 5,998 Corporate expenses 12,550 12,808 10,646 Total expenses 53,483 54,343 49,126Operating (loss) income (7,906) (3,196) 1,943Other Income: Gain on sale of real estate 1,044 — — Investment income 457 528 696 Other income 158 381 526 Total other income 1,659 909 1,222(Loss) income from operations before equity in earnings of unconsolidated joint ventures (6,247) (2,287) 3,165Equity in earnings of unconsolidated joint ventures, net 7,098 6,324 5,294Income before income tax expense 851 4,037 8,459Income tax expense 336 1,125 2,697Net income 515 2,912 5,762Net (loss) income attributable to non-controlling interest (43) (38) 107Net income attributable to common stockholders $ 558 $ 2,950 $ 5,655Net income per share attributable to common stockholders, basic $ 0.03 $ 0.14 $ 0.27Net income per share attributable to common stockholders, diluted $ 0.03 $ 0.14 $ 0.27
C O N S O L I D A T E D S T A T E M E N T S O F C O M P R E H E N S I V E I N C O M E
Year Ended December 31($ in thousands) 2016 2015 2014Net income $ 515 $ 2,912 $ 5,762 Other comprehensive income/(loss): Unrealized loss on available-for-sale securities 62 (188) (208) Benefit plan adjustments (371) (1,301) (3,168) Benefit plan reclassification for losses included in net income — 536 407 SERP liability adjustments 214 234 (1,003) Equity in other comprehensive income of unconsolidated joint venture — — — Unrealized interest rate swap gains/(losses) 1,040 678 (2,227) Other comprehensive income (loss) before taxes 945 (41) (6,199) Benefit (provision) for income taxes related to other comprehensive loss items (282) 38 2,644 Other comprehensive (loss) income 663 (3) (3,555)Comprehensive income 1,178 2,909 2,207Comprehensive (loss) income attributable to non-controlling interests (43) (38) 107Comprehensive income attributable to common stockholders $ 1,221 $ 2,947 $ 2,100
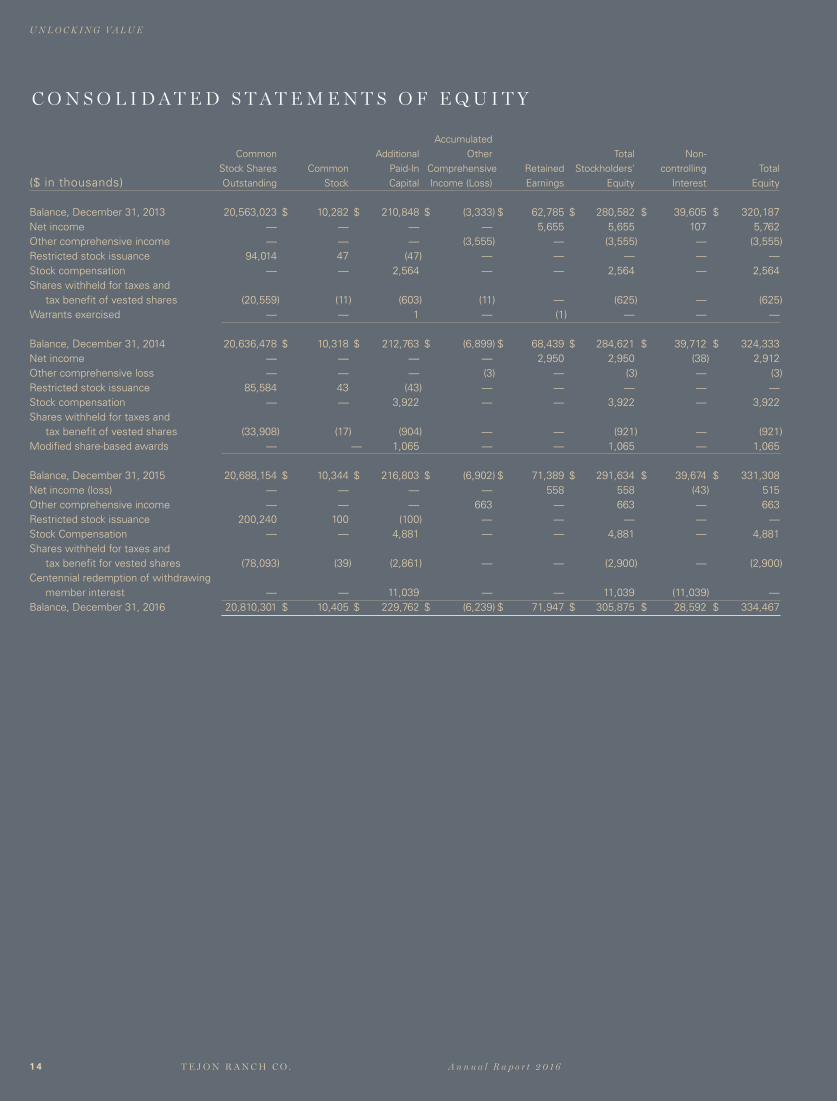
C O N S O L I D A T E D S T A T E M E N T S O F E Q U I T Y
U N L O C K I N G V A L U E
T E J O N R A N C H C O . A n n u a l R a p o r t 2 0 1 61 4
Accumulated Common Additional Other Total Non- Stock Shares Common Paid-In Comprehensive Retained Stockholders’ controlling Total ($ in thousands) Outstanding Stock Capital Income (Loss) Earnings Equity Interest Equity
Balance, December 31, 2013 20,563,023 $ 10,282 $ 210,848 $ (3,333) $ 62,785 $ 280,582 $ 39,605 $ 320,187Net income — — — — 5,655 5,655 107 5,762Other comprehensive income — — — (3,555) — (3,555) — (3,555)Restricted stock issuance 94,014 47 (47) — — — — —Stock compensation — — 2,564 — — 2,564 — 2,564Shares withheld for taxes and tax benefit of vested shares (20,559) (11) (603) (11) — (625) — (625)Warrants exercised — — 1 — (1) — — —
Balance, December 31, 2014 20,636,478 $ 10,318 $ 212,763 $ (6,899) $ 68,439 $ 284,621 $ 39,712 $ 324,333Net income — — — — 2,950 2,950 (38) 2,912Other comprehensive loss — — — (3) — (3) — (3)Restricted stock issuance 85,584 43 (43) — — — — —Stock compensation — — 3,922 — — 3,922 — 3,922Shares withheld for taxes and tax benefit of vested shares (33,908) (17) (904) — — (921) — (921)Modified share-based awards — — 1,065 — — 1,065 — 1,065
Balance, December 31, 2015 20,688,154 $ 10,344 $ 216,803 $ (6,902) $ 71,389 $ 291,634 $ 39,674 $ 331,308Net income (loss) — — — — 558 558 (43) 515Other comprehensive income — — — 663 — 663 — 663Restricted stock issuance 200,240 100 (100) — — — — —Stock Compensation — — 4,881 — — 4,881 — 4,881Shares withheld for taxes and tax benefit for vested shares (78,093) (39) (2,861) — — (2,900) — (2,900)Centennial redemption of withdrawing member interest — — 11,039 — — 11,039 (11,039) —Balance, December 31, 2016 20,810,301 $ 10,405 $ 229,762 $ (6,239) $ 71,947 $ 305,875 $ 28,592 $ 334,467
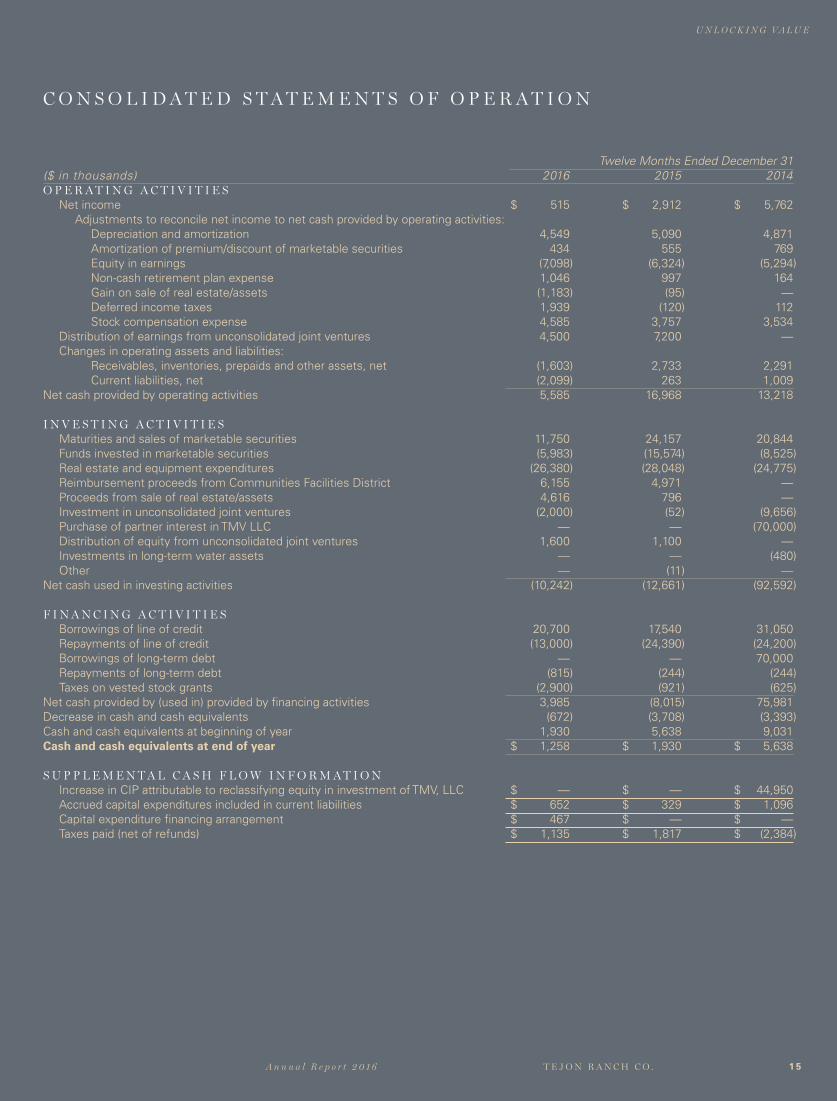
C O N S O L I D A T E D S T A T E M E N T S O F O P E R A T I O N
U N L O C K I N G V A L U E
T E J O N R A N C H C O . A n n u a l R e p o r t 2 0 1 6 1 5
Twelve Months Ended December 31($ in thousands) 2016 2015 2014O P E R A T I N G A C T I V I T I E S Net income $ 515 $ 2,912 $ 5,762 Adjustments to reconcile net income to net cash provided by operating activities: Depreciation and amortization 4,549 5,090 4,871 Amortization of premium/discount of marketable securities 434 555 769 Equity in earnings (7,098) (6,324) (5,294) Non-cash retirement plan expense 1,046 997 164 Gain on sale of real estate/assets (1,183) (95) — Deferred income taxes 1,939 (120) 112 Stock compensation expense 4,585 3,757 3,534 Distribution of earnings from unconsolidated joint ventures 4,500 7,200 — Changes in operating assets and liabilities: Receivables, inventories, prepaids and other assets, net (1,603) 2,733 2,291 Current liabilities, net (2,099) 263 1,009Net cash provided by operating activities 5,585 16,968 13,218
I N V E S T I N G A C T I V I T I E S Maturities and sales of marketable securities 11,750 24,157 20,844 Funds invested in marketable securities (5,983) (15,574) (8,525) Real estate and equipment expenditures (26,380) (28,048) (24,775) Reimbursement proceeds from Communities Facilities District 6,155 4,971 — Proceeds from sale of real estate/assets 4,616 796 — Investment in unconsolidated joint ventures (2,000) (52) (9,656) Purchase of partner interest in TMV LLC — — (70,000) Distribution of equity from unconsolidated joint ventures 1,600 1,100 — Investments in long-term water assets — — (480) Other — (11) —Net cash used in investing activities (10,242) (12,661) (92,592)
F I N A N C I N G A C T I V I T I E S Borrowings of line of credit 20,700 17,540 31,050 Repayments of line of credit (13,000) (24,390) (24,200) Borrowings of long-term debt — — 70,000 Repayments of long-term debt (815) (244) (244) Taxes on vested stock grants (2,900) (921) (625)Net cash provided by (used in) provided by financing activities 3,985 (8,015) 75,981Decrease in cash and cash equivalents (672) (3,708) (3,393)Cash and cash equivalents at beginning of year 1,930 5,638 9,031Cash and cash equivalents at end of year $ 1,258 $ 1,930 $ 5,638
S U P P L E M E N T A L C A S H F L O W I N F O R M A T I O N Increase in CIP attributable to reclassifying equity in investment of TMV, LLC $ — $ — $ 44,950 Accrued capital expenditures included in current liabilities $ 652 $ 329 $ 1,096 Capital expenditure financing arrangement $ 467 $ — $ — Taxes paid (net of refunds) $ 1,135 $ 1,817 $ (2,384)
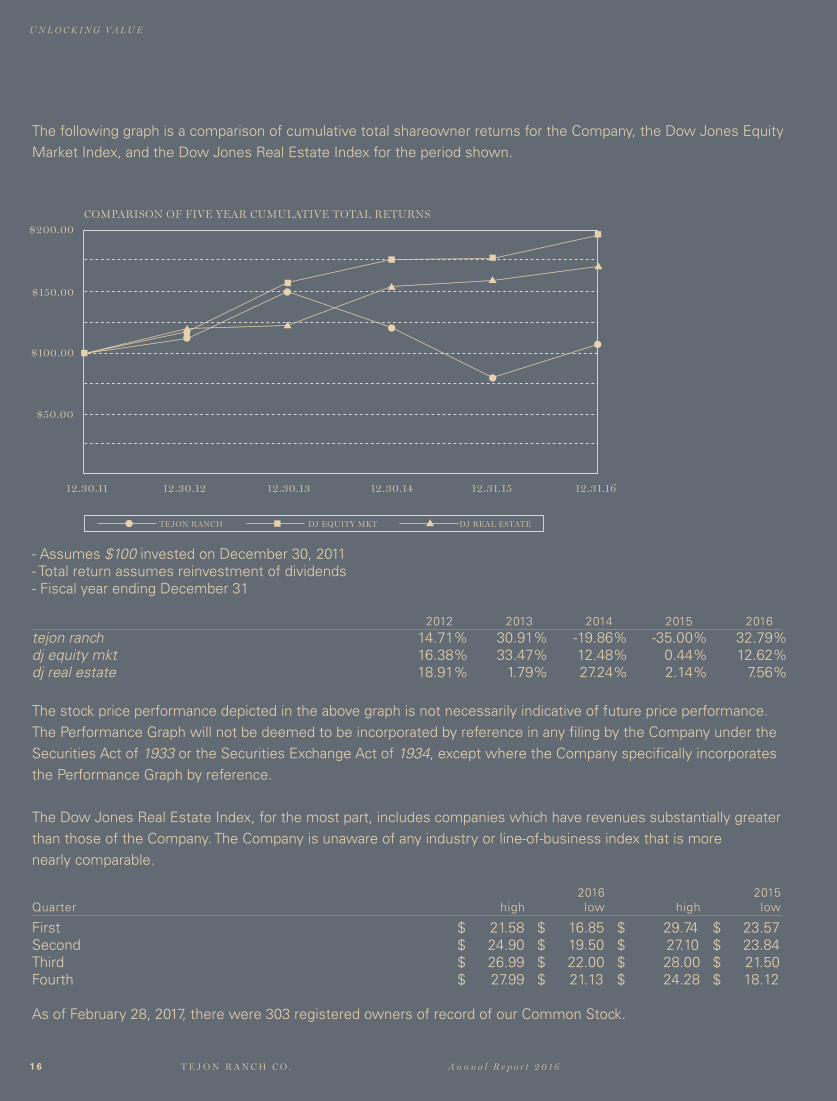
The following graph is a comparison of cumulative total shareowner returns for the Company, the Dow Jones Equity Market Index, and the Dow Jones Real Estate Index for the period shown.
- Assumes $100 invested on December 30, 2011- Total return assumes reinvestment of dividends - Fiscal year ending December 31
2012 2013 2014 2015 2016tejon ranch 14.71% 30.91% -19.86% -35.00% 32.79%dj equity mkt 16.38% 33.47% 12.48% 0.44% 12.62%dj real estate 18.91% 1.79% 27.24% 2.14% 7.56%
The stock price performance depicted in the above graph is not necessarily indicative of future price performance. The Performance Graph will not be deemed to be incorporated by reference in any filing by the Company under the Securities Act of 1933 or the Securities Exchange Act of 1934, except where the Company specifically incorporates the Performance Graph by reference.
The Dow Jones Real Estate Index, for the most part, includes companies which have revenues substantially greater than those of the Company. The Company is unaware of any industry or line-of-business index that is more nearly comparable.
2016 2015Quarter high low high low
First $ 21.58 $ 16.85 $ 29.74 $ 23.57Second $ 24.90 $ 19.50 $ 27.10 $ 23.84 Third $ 26.99 $ 22.00 $ 28.00 $ 21.50Fourth $ 27.99 $ 21.13 $ 24.28 $ 18.12
As of February 28, 2017, there were 303 registered owners of record of our Common Stock.
$50.00
$100.00
12.30.11 12.30.12 12.30.13 12.30.14 12.31.15 12.31.16
$150.00
$200.00
TEJON RANCH DJ EQUITY MKT DJ REAL ESTATE
COMPARISON OF FIVE YEAR CUMULATIVE TOTAL RETURNS
U N L O C K I N G V A L U E
T E J O N R A N C H C O . A n n u a l R e p o r t 2 0 1 61 6

Norman MetcalfeChairman of the Board,Tejon Ranch Co.Real Estate and Investments
Robert A. AlterPresident,Seaview Investors, LLC
Steven A. BettsReal Estate and Investments
Gregory S. BielliPresident and Chief Executive Officer,Tejon Ranch Co.
John L. GoolsbyPrivate Investments and Real Estate
Anthony L. LeggioPresident,Bolthouse Properties LLC Real Estate Development and Management
Geoffrey L. StackManaging Director,SARES-REGIS GroupReal Estate Development and Management
Daniel R. TischManaging Member,TowerView LLCInvestment Management
Frederick C. TuomiChief Executive Officer,Colony Starwood Homes
Michael H. WinerPortfolio Manager,Third Avenue Management LLCInvestment Management
Corporate OfficeTejon Ranch Company Post Office Box 1000 4436 Lebec Road Tejon Ranch, California 93243 Telephone: (661) 248-3000
Securities Listing Tejon Ranch Company Common Stock is listed on the New York Stock Exchange under the ticker symbol: TRC
Stock Transfer Agent & RegistrarComputershare Shareowner Services LLC 480 Washington Boulevard Jersey City, NJ 07310-1900Telephone: (877) 898-2101
Auditors Ernst & Young LLP
Form 10-KA copy of this report and the Company’s Annual Report to the Securities and Exchange Commission on Form 10-K, without exhibits, will be provided without charge to any stockholder submitting a written or electronic request to Investor Relations:
Barry ZoellerVice President,Corporate Communications & Investor [email protected]
Tejon Ranch CompanyPost Office Box 1000 Tejon Ranch, California 93243
D I R E C T O R S E X E C U T I V E O F F I C E R S
C O R P O R A T E D I R E C T O R Y
Gregory S. BielliPresident and Chief Executive Officer
Allen E. LydaExecutive Vice President,Chief Financial Officer and Assistant Secretary
Hugh F. McMahon IVExecutive Vice President,Commercial and Industrial Real Estate
Joseph N. RentfroExecutive Vice President,Real Estate
Dennis J. AtkinsonSenior Vice President,Agriculture and Water Resources
Michael R.W. HoustonSenior Vice President,General Counsel and Corporate Secretary
Robert D. VelasquezVice President of Finance,Chief Accounting Officer

w w w . t e j o n r a n c h . c o m