unrecorded alcohol in the baltic states summary report
TRANSCRIPT

Acknowledgment: Funding for the Survey of Unrecorded Alcohol in the Baltic States and was provided by IARD in accordance with the Dublin Principles and IARD’s General Principles for Research.
Unrecorded Alcohol in the Baltic States
Summary Report
Katrin Lang & Inge Ringamets, University of Tartu, Tallin, Estonia
1. Background
a. WHO estimates of recorded and unrecorded alcohol and public health implications
According to the World Health Organization (WHO), roughly 25 percent of alcohol consumed around the world is unrecorded, or not reflected in official statistics of the country of production, the country of consumption, or both. The unrecorded market includes both licit and illicit beverage alcohol, as well as surrogate alcohol products. Because unrecorded alcohol evades regulation, it is a concern for government, industry, and the public health community. However, there is relatively little information on the size, composition, and operation of the unrecorded market, the characteristics of consumers, the characteristics of producers, and distributors of unrecorded alcohol, and the health safety of unrecorded products. This project was developed to help increase knowledge and understanding of the unrecorded market in the Baltic states of Estonia, Latvia, and Lithuania.
b. Alcohol consumption estimates from existing studies
Individual-level alcohol consumption data obtained using general population surveys have advantages over other measures of alcohol use such as sales data (1). Such data allow researchers to link alcohol drinking with related consequences as well as to adjust for individual-level characteristics (2). However, self-reported alcohol consumption typically only accounts for 40–60% of total alcohol sales (3). Recorded alcohol consumption in the 15+ population in the Baltic countries by type of alcohol has been reported in the WHO Health for All Database and is presented in Table 1. It is calculated as the sum of beverage-specific alcohol consumption of pure alcohol (beer, wine, spirits, other) from different sources. The first priority in the decision tree is given to government statistics; second are country-specific alcohol industry statistics in the public domain (Canadian, IWSR, OIV, Wine Institute, historically World Drink Trends); and third is the Food and Agriculture Organization of the United Nations' statistical database (FAOSTAT) (4). These data are abstracted from the database and presented in Table 1. As the category “other
Page 2
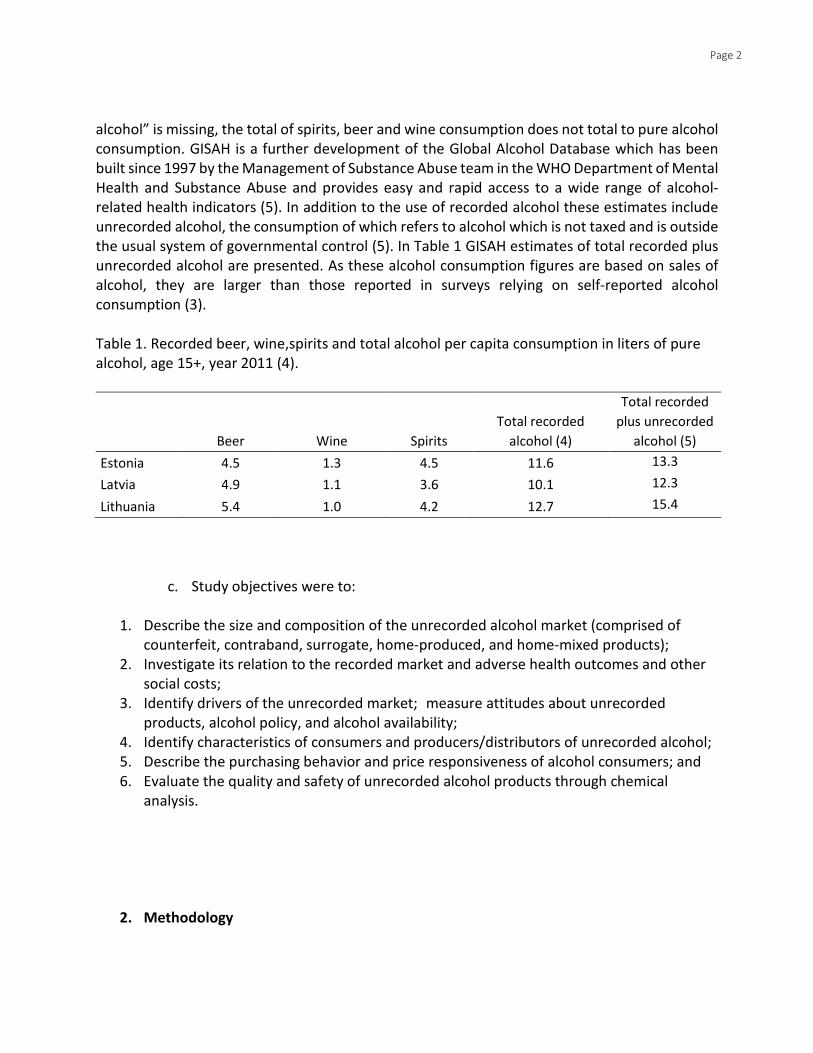
alcohol” is missing, the total of spirits, beer and wine consumption does not total to pure alcohol consumption. GISAH is a further development of the Global Alcohol Database which has been built since 1997 by the Management of Substance Abuse team in the WHO Department of Mental Health and Substance Abuse and provides easy and rapid access to a wide range of alcohol-related health indicators (5). In addition to the use of recorded alcohol these estimates include unrecorded alcohol, the consumption of which refers to alcohol which is not taxed and is outside the usual system of governmental control (5). In Table 1 GISAH estimates of total recorded plus unrecorded alcohol are presented. As these alcohol consumption figures are based on sales of alcohol, they are larger than those reported in surveys relying on self-reported alcohol consumption (3). Table 1. Recorded beer, wine,spirits and total alcohol per capita consumption in liters of pure alcohol, age 15+, year 2011 (4).
Beer Wine Spirits Total recorded
alcohol (4)
Total recorded plus unrecorded
alcohol (5) Estonia 4.5 1.3 4.5 11.6 13.3
Latvia 4.9 1.1 3.6 10.1 12.3
Lithuania 5.4 1.0 4.2 12.7 15.4
c. Study objectives were to:
1. Describe the size and composition of the unrecorded alcohol market (comprised of counterfeit, contraband, surrogate, home-produced, and home-mixed products);
2. Investigate its relation to the recorded market and adverse health outcomes and other social costs;
3. Identify drivers of the unrecorded market; measure attitudes about unrecorded products, alcohol policy, and alcohol availability;
4. Identify characteristics of consumers and producers/distributors of unrecorded alcohol; 5. Describe the purchasing behavior and price responsiveness of alcohol consumers; and 6. Evaluate the quality and safety of unrecorded alcohol products through chemical
analysis.
2. Methodology

Page 3
a. In brief
This study was conceived in early 2012 by the International Alliance for Responsible Drinking (IARD) (then, International Center for Alcohol Policies) as part of a larger, global research program on the unrecorded alcohol market. The research was designed as a three-country (Estonia, Latvia, and Lithuania) study of the unrecorded market in the Baltics. The general design for this study was developed by IARD staff, in collaboration with the project’s Steering Group and the survey research firm contracted to carry out the field work (Research Cube). Ethics approvals were granted from all relevant boards of ethics in the three Baltic countries.
b. Study design The study was designed as a cross-sectional questionnaire study in all three Baltic countries, using representative population samples and an additional targeted strategy to recruit experts (see sampling below) as well as key informants.
c. Sampling
All subjects were 18 years of age or older. Surveys were administered to three different samples:
1. 1140 members of the general population from each of the three Baltic countries through face-to-face interviews. These subjects were recruited through door-to-door recruitment visits.
2. 25 subject matter experts from all three Baltic countries (medical professionals, academics, and government officials). These subjects were identified by Research Cube and recruited through either telephone calls or in-person visits.
3. 30 key informants (producers and distributors of unrecorded alcohol) through either telephone or face-to-face interviews. Subjects were identified by unrecorded alcohol consumers (Sample 1). These subjects were recruited through either telephone calls or in-person visits.
Subjects of the general population survey who reported consuming unrecorded alcohol were asked if they would be willing to provide a sample of alcohol to the interviewer. Samples collected were sent to a lab for chemical analysis. (Results of the chemical analysis are not included in this report.)
Page 4
d. Questionnaire development
General population and expert survey questionnaires were based on earlier work carried out by IARD and were sourced by IARD from existing national and international surveys. The surveys were discussed at the Steering Group meeting in Riga in February 2014 and further circulated and commented by country expert groups in all three of the countries. Research Cube also participated in the development of survey instruments and administered the pilot study of the survey instruments. One of the inputs from the Steering Group members from Estonia was adding home-mixed alcohol as one of the entities of unrecorded alcohol, defined as “beverages mixed at home from different components, such as spirits mixed with illegal alcohol products, or surrogate alcohol mixed with other alcoholic or non-alcoholic beverages”. This is different from homemade alcohol defined as beer brewed at someone’s home, wine fermented, or spirits distilled in someone’s home. The general population interview was expected to take no more than 40 minutes to complete. To maintain anonymity, no identifying information was collected from subjects. Subjects were made aware that they are free to skip any questions or stop the interview altogether at any time. The interview for experts and subjects bringing boost sample was expected to take no more than 25 minutes to complete.
e. Calculating %ABV Percent ABV for beer, wine, and spirits, were included as self-reported and in case of missing values 5% for beer, 12% for wine, 18% for fortified wine, and 40% for spirits. %ABV for surrogates was 50%ABV and for home-mixed alcohol %ABV was calculated based on the type of alcohol it contained.
f. Data collection period
Field studies were started in June 2015 and finished January 2016.
3. Key Findings
a. Drinker status (current drinkers, former drinkers, lifetime abstainers)
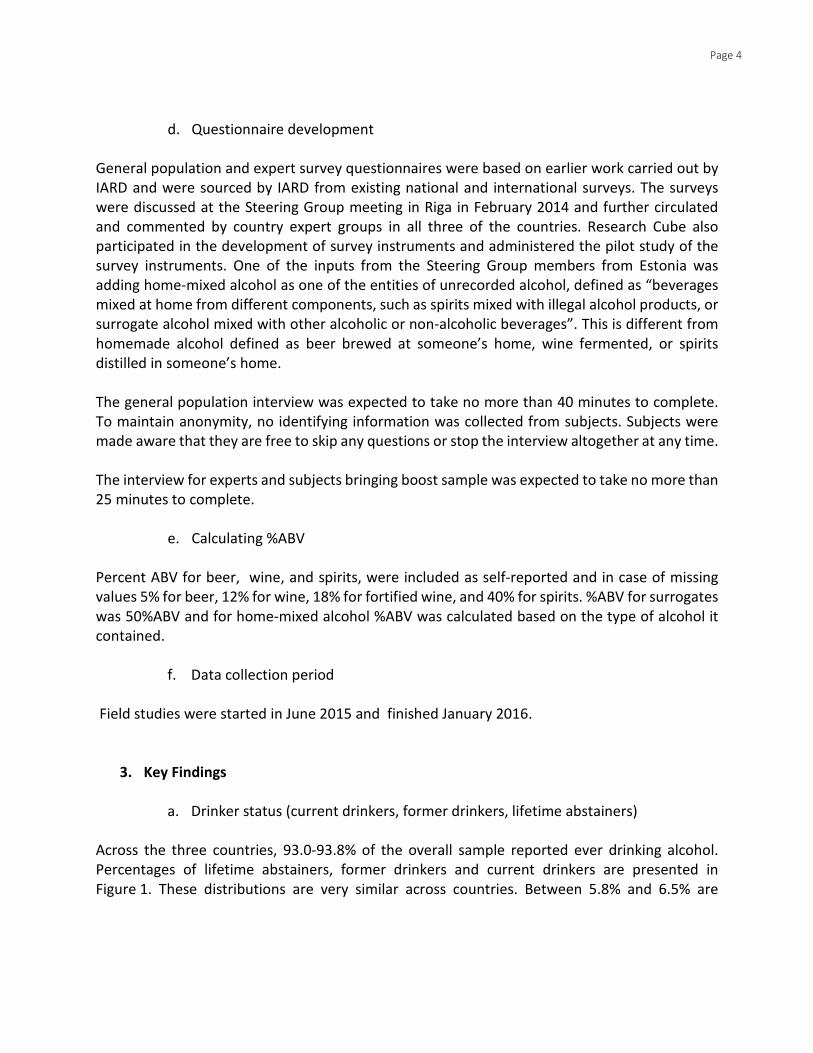
Across the three countries, 93.0-93.8% of the overall sample reported ever drinking alcohol. Percentages of lifetime abstainers, former drinkers and current drinkers are presented in Figure 1. These distributions are very similar across countries. Between 5.8% and 6.5% are
Page 5
lifetime abstainers. Former drinkers form 8.5% of the sample population in Estonia, 9.5% in Latvia and 4.5% in Lithuania, and current drinkers make up between 83% and 89% of all respondents.
Figure 1. Percentages of lifetime abstainers, former drinkers and current drinkers
Respondents were asked, based on their own judgements, if they consider themselves as light, moderate, or heavy drinkers. The majority of current drinkers consider themselves light drinkers – from 57.8% in Lithuania to 64.7% in Latvia (Figure 2). Between 25.4% and 30.5% consider themselves as moderate drinkers and between 4.1–6.0% of current drinkers report that they are heavy drinkers. At the same time 4.2–7.8% of current drinkers estimate themselves as non-drinkers (in fact a quarter of them drank alcohol once during the past 12 months, around 90% drank alcohol once a month or more rarely).
Figure 2. Percentages of self-described drinking status among current drinkers (n=3243)
6.5
6.5
5.8
8.5
9.5
4.5
84.8
83.4
89.4
0.2
0.6
0.4
0% 10% 20% 30% 40% 50% 60% 70% 80% 90% 100%
Estonia
Latvia
Lithuania
lifetime abstainer former drinker current drinker missing
5.3
4.2
7.8
58.6
64.7
57.8
30.5
25.4
28.3
5.1
4.1
6.0
0.6
1.7
0.1
0% 10% 20% 30% 40% 50% 60% 70% 80% 90% 100%
Estonia
Latvia
Lithuania
a non-drinker a light drinker a moderate drinker a heavy drinker don't know/refused

Page 6
b. Sample characteristics Across the three countries, 3,777 interviews were obtained; 52.8% of respondents were female. Distribution by age group is shown in Figure 3. Age groups were evenly distributed by countries, with somewhat smaller groups for the youngest (18-24 years old) and the oldest (65-74 years old) age groups.
Figure 3. Age group distribution by countries.
Countries were relatively similar across marital status (43.5-55.1% married), education (23.0-29.4% higher education), language (64.0-87.0% native), occupation, employment (unemployment 4.3-8.9%) (lower % of unemployment in Estonia but this could be a seasonal difference) and age groups. Income is higher in Estonia as compared to other countries. Health conditions were self-reported. Hypertension was reported rather frequently (26.5-30.8%). The prevalence of liver disease ranged between 4.0 -5.7% and the prevalence of coronary problems between 17.7 -21.5%. In Estonia higher rates of depression (12.6%) were reported than in the rest of the countries (5.5-6.3%). As for self-rated overall health, 42.7-55.7% of respondents rated their health as “good” or “very good”.
c. Past year alcohol consumption in total and by beverage type
Average alcohol consumption per person is calculated by beverage type including all respondents without missing values (i.e non-drinkers and those drinkers who did not have missing values for beverage type or frequency questions) (Table 2). Due to that, the number of respondents taken into account differs slightly between different beverages. Total average consumption is the sum
7.6
11.4
10.4
21.7
18.2
19.8
18.4
17.4
18.4
20.6
19.6
20.1
16.2
18.7
17.6
15.5
14.8
13.7
0% 20% 40% 60% 80% 100%
Estonia
Latvia
Lithuania
age group
18-24 25-34 35-44 45-54 55-64 65-74
Page 7
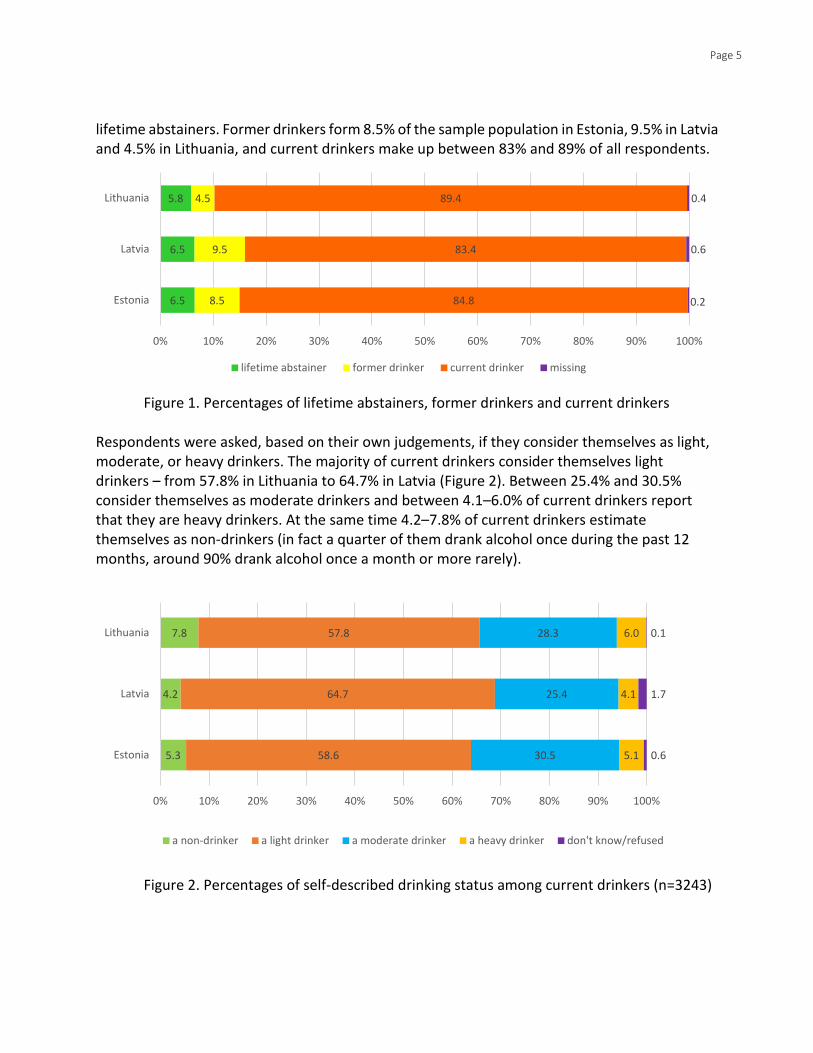
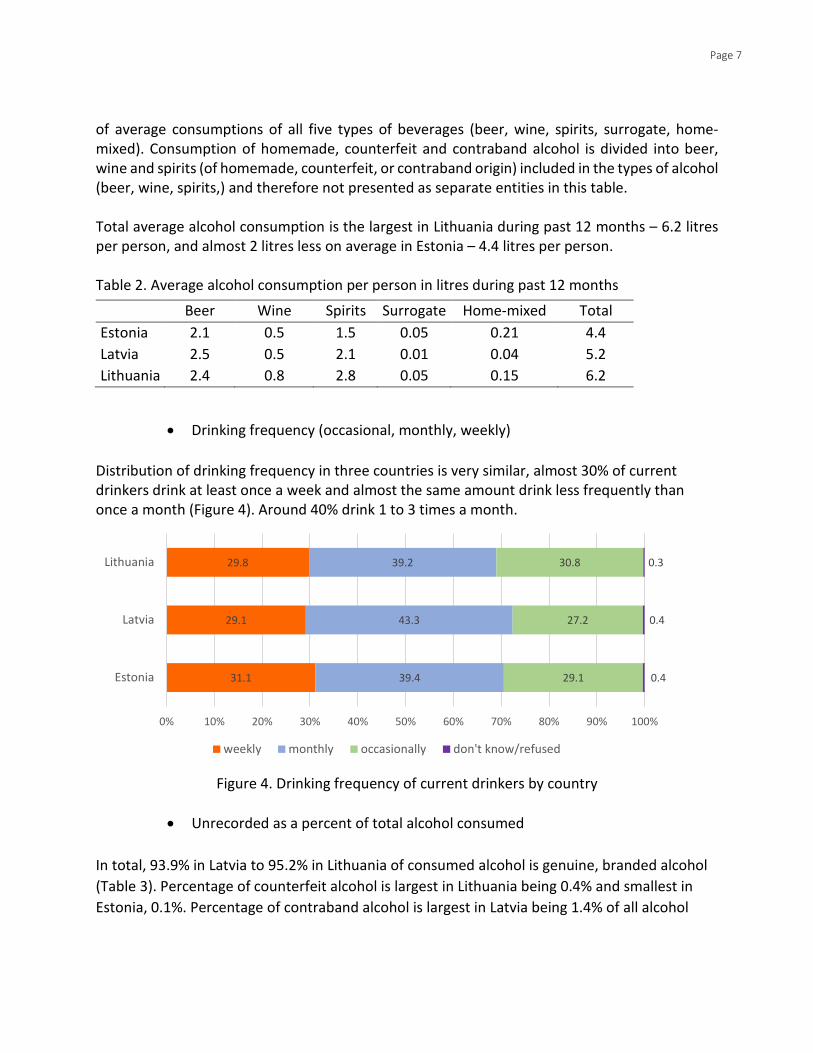
of average consumptions of all five types of beverages (beer, wine, spirits, surrogate, home-mixed). Consumption of homemade, counterfeit and contraband alcohol is divided into beer, wine and spirits (of homemade, counterfeit, or contraband origin) included in the types of alcohol (beer, wine, spirits,) and therefore not presented as separate entities in this table. Total average alcohol consumption is the largest in Lithuania during past 12 months – 6.2 litres per person, and almost 2 litres less on average in Estonia – 4.4 litres per person. Table 2. Average alcohol consumption per person in litres during past 12 months
Beer Wine Spirits Surrogate Home-mixed Total Estonia 2.1 0.5 1.5 0.05 0.21 4.4 Latvia 2.5 0.5 2.1 0.01 0.04 5.2 Lithuania 2.4 0.8 2.8 0.05 0.15 6.2
• Drinking frequency (occasional, monthly, weekly) Distribution of drinking frequency in three countries is very similar, almost 30% of current drinkers drink at least once a week and almost the same amount drink less frequently than once a month (Figure 4). Around 40% drink 1 to 3 times a month.
Figure 4. Drinking frequency of current drinkers by country
• Unrecorded as a percent of total alcohol consumed
In total, 93.9% in Latvia to 95.2% in Lithuania of consumed alcohol is genuine, branded alcohol (Table 3). Percentage of counterfeit alcohol is largest in Lithuania being 0.4% and smallest in Estonia, 0.1%. Percentage of contraband alcohol is largest in Latvia being 1.4% of all alcohol
31.1
29.1
29.8
39.4
43.3
39.2
29.1
27.2
30.8
0.4
0.4
0.3
0% 10% 20% 30% 40% 50% 60% 70% 80% 90% 100%
Estonia
Latvia
Lithuania
weekly monthly occasionally don't know/refused
Page 8
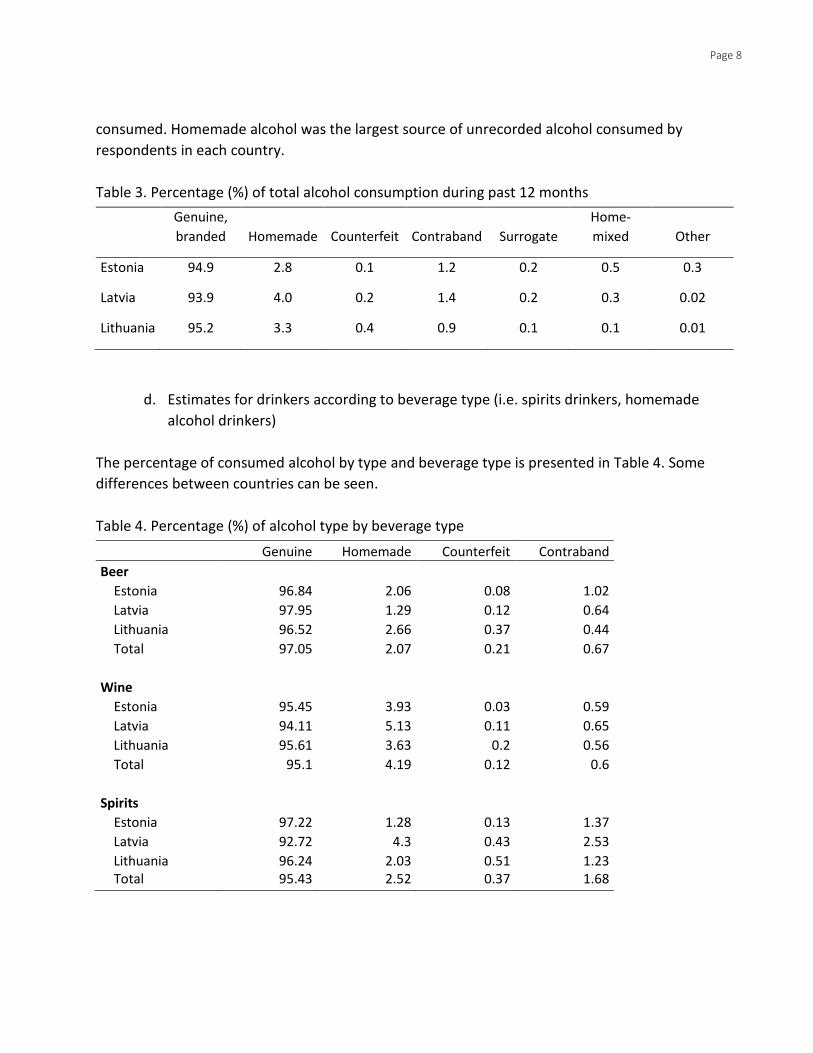
consumed. Homemade alcohol was the largest source of unrecorded alcohol consumed by respondents in each country. Table 3. Percentage (%) of total alcohol consumption during past 12 months
Genuine, branded Homemade Counterfeit Contraband Surrogate
Home-mixed Other
Estonia 94.9 2.8 0.1 1.2 0.2 0.5 0.3
Latvia 93.9 4.0 0.2 1.4 0.2 0.3 0.02
Lithuania 95.2 3.3 0.4 0.9 0.1 0.1 0.01
d. Estimates for drinkers according to beverage type (i.e. spirits drinkers, homemade
alcohol drinkers)
The percentage of consumed alcohol by type and beverage type is presented in Table 4. Some differences between countries can be seen.
Table 4. Percentage (%) of alcohol type by beverage type
Genuine Homemade Counterfeit Contraband Beer Estonia 96.84 2.06 0.08 1.02 Latvia 97.95 1.29 0.12 0.64 Lithuania 96.52 2.66 0.37 0.44 Total 97.05 2.07 0.21 0.67
Wine Estonia 95.45 3.93 0.03 0.59 Latvia 94.11 5.13 0.11 0.65 Lithuania 95.61 3.63 0.2 0.56 Total 95.1 4.19 0.12 0.6
Spirits Estonia 97.22 1.28 0.13 1.37 Latvia 92.72 4.3 0.43 2.53 Lithuania 96.24 2.03 0.51 1.23 Total 95.43 2.52 0.37 1.68
Page 9
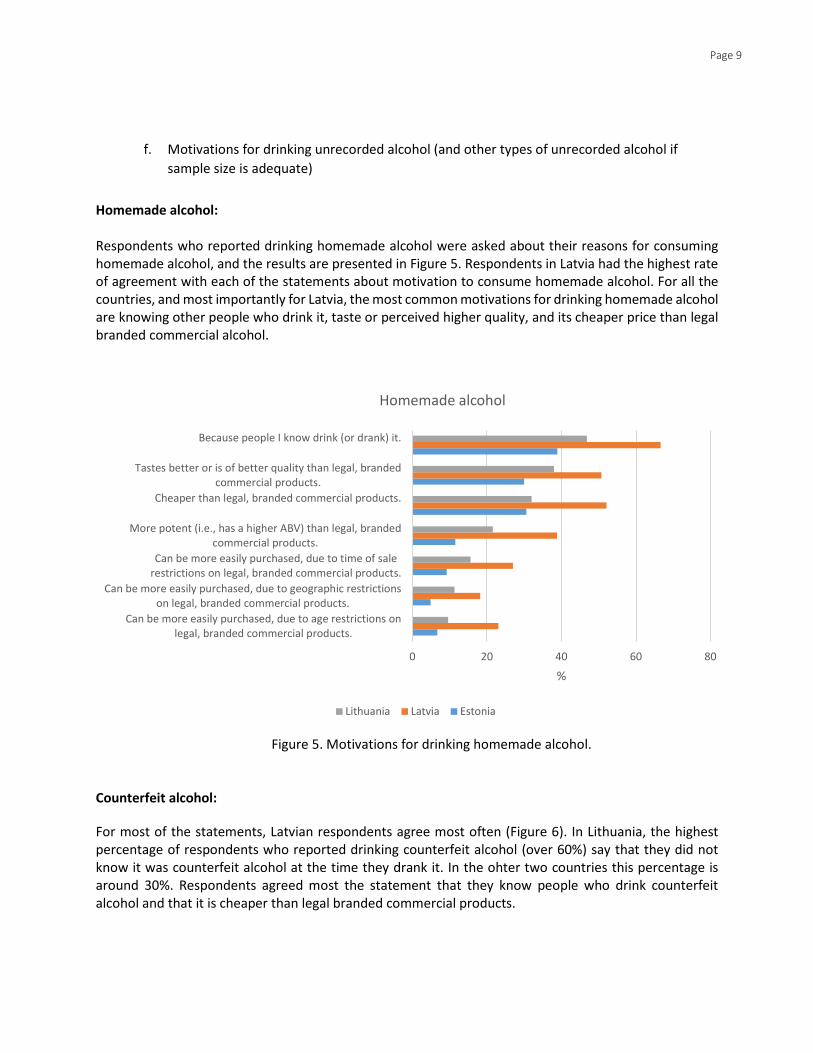
f. Motivations for drinking unrecorded alcohol (and other types of unrecorded alcohol if
sample size is adequate)
Homemade alcohol:
Respondents who reported drinking homemade alcohol were asked about their reasons for consuming homemade alcohol, and the results are presented in Figure 5. Respondents in Latvia had the highest rate of agreement with each of the statements about motivation to consume homemade alcohol. For all the countries, and most importantly for Latvia, the most common motivations for drinking homemade alcohol are knowing other people who drink it, taste or perceived higher quality, and its cheaper price than legal branded commercial alcohol.
Figure 5. Motivations for drinking homemade alcohol.
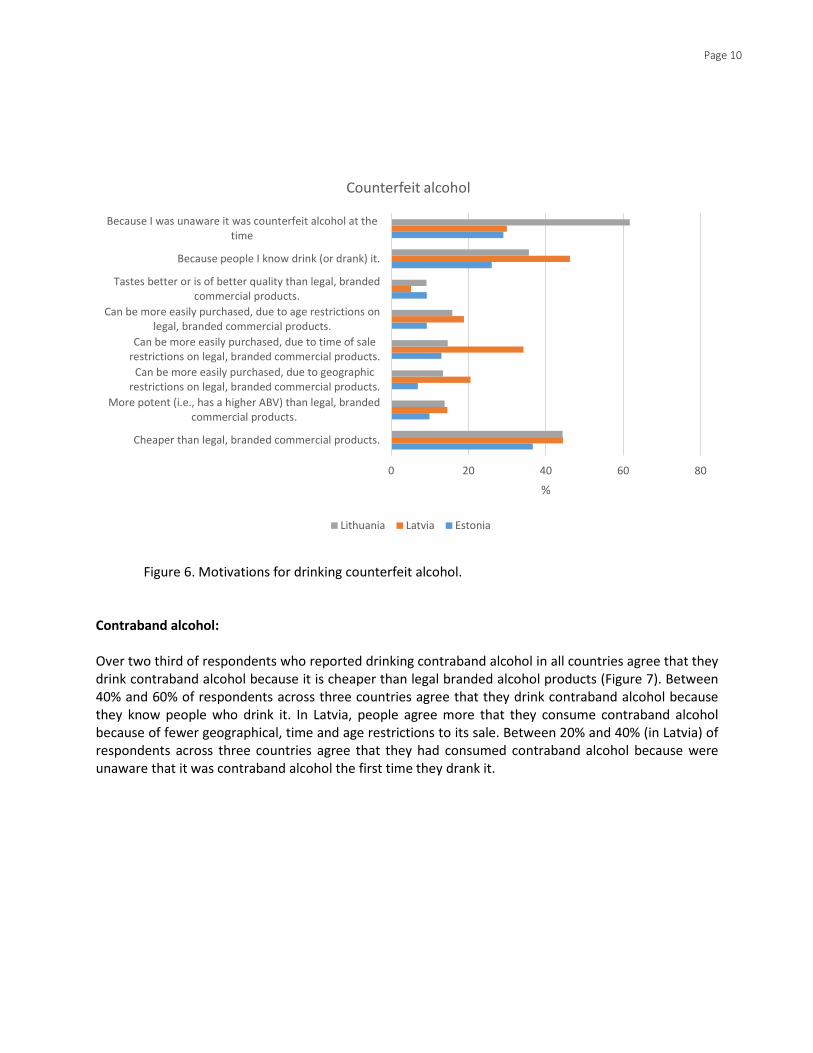
Counterfeit alcohol:
For most of the statements, Latvian respondents agree most often (Figure 6). In Lithuania, the highest percentage of respondents who reported drinking counterfeit alcohol (over 60%) say that they did not know it was counterfeit alcohol at the time they drank it. In the ohter two countries this percentage is around 30%. Respondents agreed most the statement that they know people who drink counterfeit alcohol and that it is cheaper than legal branded commercial products.
0 20 40 60 80
Can be more easily purchased, due to age restrictions onlegal, branded commercial products.
Can be more easily purchased, due to geographic restrictionson legal, branded commercial products.
Can be more easily purchased, due to time of salerestrictions on legal, branded commercial products.
More potent (i.e., has a higher ABV) than legal, brandedcommercial products.
Cheaper than legal, branded commercial products.
Tastes better or is of better quality than legal, brandedcommercial products.
Because people I know drink (or drank) it.
%
Homemade alcohol
Lithuania Latvia Estonia
Page 10
Figure 6. Motivations for drinking counterfeit alcohol.
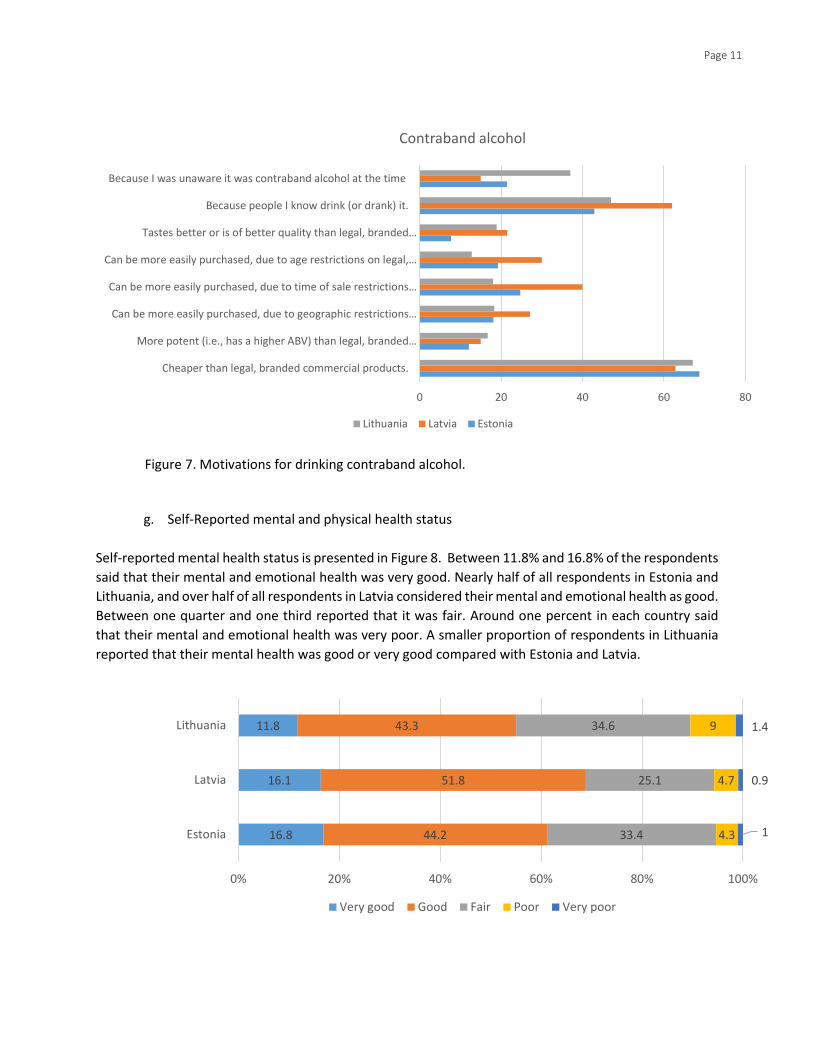
Contraband alcohol: Over two third of respondents who reported drinking contraband alcohol in all countries agree that they drink contraband alcohol because it is cheaper than legal branded alcohol products (Figure 7). Between 40% and 60% of respondents across three countries agree that they drink contraband alcohol because they know people who drink it. In Latvia, people agree more that they consume contraband alcohol because of fewer geographical, time and age restrictions to its sale. Between 20% and 40% (in Latvia) of respondents across three countries agree that they had consumed contraband alcohol because were unaware that it was contraband alcohol the first time they drank it.
0 20 40 60 80
Cheaper than legal, branded commercial products.
More potent (i.e., has a higher ABV) than legal, brandedcommercial products.
Can be more easily purchased, due to geographicrestrictions on legal, branded commercial products.
Can be more easily purchased, due to time of salerestrictions on legal, branded commercial products.
Can be more easily purchased, due to age restrictions onlegal, branded commercial products.
Tastes better or is of better quality than legal, brandedcommercial products.
Because people I know drink (or drank) it.
Because I was unaware it was counterfeit alcohol at thetime
%
Counterfeit alcohol
Lithuania Latvia Estonia
Page 11
Figure 7. Motivations for drinking contraband alcohol.
g. Self-Reported mental and physical health status
Self-reported mental health status is presented in Figure 8. Between 11.8% and 16.8% of the respondents said that their mental and emotional health was very good. Nearly half of all respondents in Estonia and Lithuania, and over half of all respondents in Latvia considered their mental and emotional health as good. Between one quarter and one third reported that it was fair. Around one percent in each country said that their mental and emotional health was very poor. A smaller proportion of respondents in Lithuania reported that their mental health was good or very good compared with Estonia and Latvia.
0 20 40 60 80
Cheaper than legal, branded commercial products.
More potent (i.e., has a higher ABV) than legal, branded…
Can be more easily purchased, due to geographic restrictions…
Can be more easily purchased, due to time of sale restrictions…
Can be more easily purchased, due to age restrictions on legal,…
Tastes better or is of better quality than legal, branded…
Because people I know drink (or drank) it.
Because I was unaware it was contraband alcohol at the time
Contraband alcohol
Lithuania Latvia Estonia
16.8
16.1
11.8
44.2
51.8
43.3
33.4
25.1
34.6
4.3
4.7
9
1
0.9
1.4
0% 20% 40% 60% 80% 100%
Estonia
Latvia
Lithuania
Very good Good Fair Poor Very poor

Page 12
Figure 8. Self-rated mental health status by countries (%). Self-reported physical health status is presented in Figure 9. Similar to the findings for mental and emotional health status, a smaller percentage of respondents in Lithuania reported that their physical health was good or very good compared with Estonia and Latvia. Regarding people who said that their physical health was very good, their numbers were higher in Latvia and Estonia (14.4% and 14.6% respectively) when compared with Lithuania (7.3%). The proportion of people reporting good physical health was smaller in Lithuania (36.4%) compared with Latvia and Estonia (40.7% and 41.1%). The proportion of people reporting fair physical health was higher in Lithuania (43.9%) compared with Latvia and Estonia (34.6% and 35.4%). About 8-10% of respondents in each country reported their physical health as poor and between 1-2% in each country said their physical health was very poor.
Figure 9. Self-reported physical health status by countries (%).
14.6
14.4
7.3
41.1
40.7
36.4
35.4
34.6
43.9
7.8
8.9
10.1
0.8
1.1
2.2
0% 20% 40% 60% 80% 100%
Estonia
Latvia
Lithuania
Very good Good Fair Poor Very poor

Page 13
h. Response to changes in price, by drinker type
Figure 10. Responses to changes in price.
i. Alcohol policy attitudes
Advertising of alcohol should be banned. Results are presented in Figure 11. In total over a half of respondents in all countries strongly agreed or agreed that advertising of alcohol should be banned. The proportion of these respondents was slightly higher in Estonia compared to Latvia and Lithuania. The respondents from Latvia differ from the rest in that the proportion who strongly agree with this statement is lower and the proportion who disagree is higher in Latvia.
0
10
20
30
40
50
60
70
80
90
100
Increase by 10%
0
10
20
30
40
50
60
70
80
90
100
Estonia Latvia Lithuania
Increase by 20%
0
10
20
30
40
50
60
70
80
90
100
Estonia Latvia Lithuania
Increase by 50%
Do nothing Reduce consumption Stop drinking Don't know/refused

Page 14
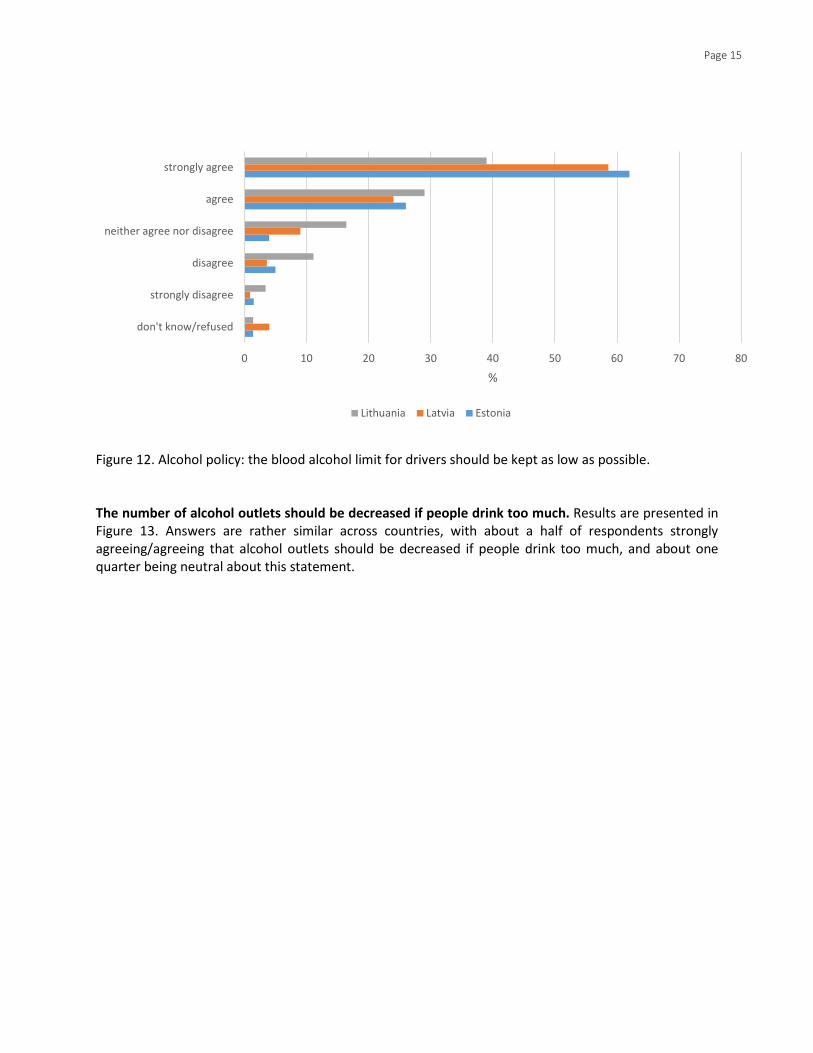
Figure 11. Alcohol policy: advertising of alcohol should be banned. The blood alcohol limit for drivers should be kept as low as possible. Results are presented in Figure 12. Nearly all respondents in all countries either strongly agree or agree that the blood alcohol limit for drivers should be kept as low as possible. The percentage of repondents who strongly agree with this statement is soemwhat lower in Lithuania and also the percentage who disagree or are neutral is higher in Lithuania. This statement should be viewed in context with the alcohol liimits set for drivers in each country: Estonia 0.02; Latvia 0.05; and Lithuania 0.04.
0 10 20 30 40 50 60 70 80
don't know/refused
strongly disagree
disagree
neither agree nor disagree
agree
strongly agree
%
Lithuania Latvia Estonia
Page 15
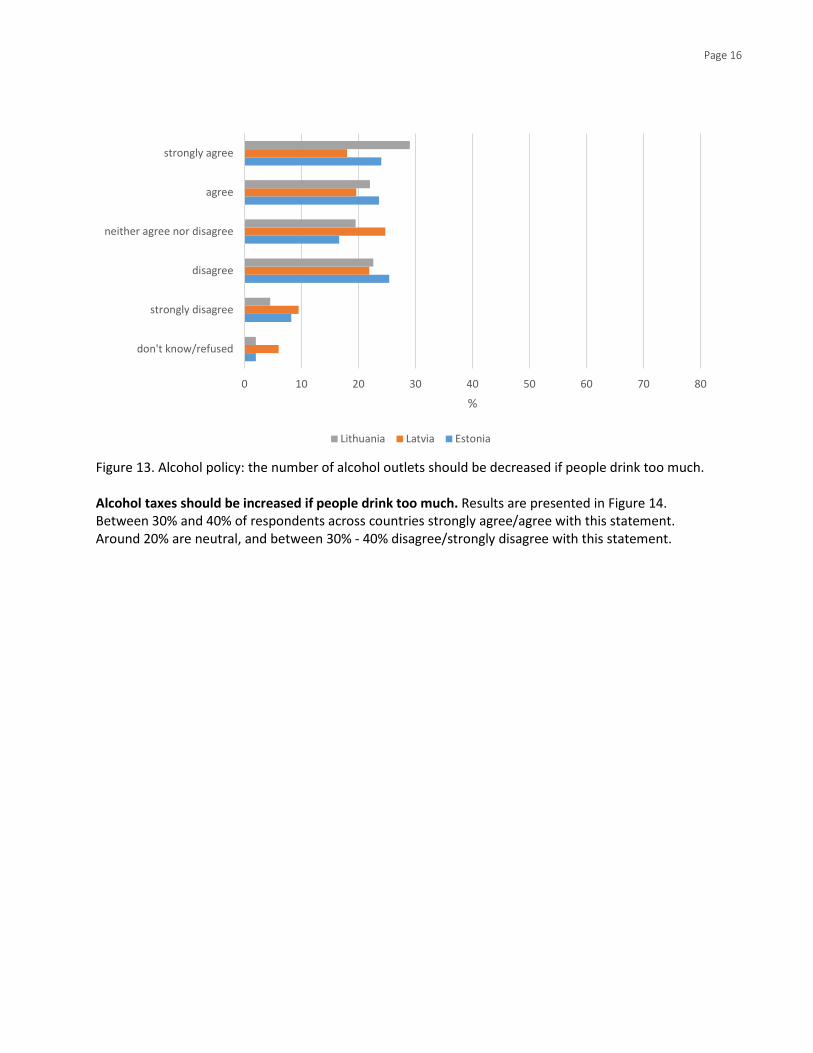
Figure 12. Alcohol policy: the blood alcohol limit for drivers should be kept as low as possible. The number of alcohol outlets should be decreased if people drink too much. Results are presented in Figure 13. Answers are rather similar across countries, with about a half of respondents strongly agreeing/agreeing that alcohol outlets should be decreased if people drink too much, and about one quarter being neutral about this statement.
0 10 20 30 40 50 60 70 80
don't know/refused
strongly disagree
disagree
neither agree nor disagree
agree
strongly agree
%
Lithuania Latvia Estonia
Page 16
Figure 13. Alcohol policy: the number of alcohol outlets should be decreased if people drink too much. Alcohol taxes should be increased if people drink too much. Results are presented in Figure 14. Between 30% and 40% of respondents across countries strongly agree/agree with this statement. Around 20% are neutral, and between 30% - 40% disagree/strongly disagree with this statement.
0 10 20 30 40 50 60 70 80
don't know/refused
strongly disagree
disagree
neither agree nor disagree
agree
strongly agree
%
Lithuania Latvia Estonia

Page 17
Figure 14. Alcohol policy: alcohol taxes should be increased if people drink too much.
j. Perceptions of alcohol availability
Genuine, branded commercial alcohol. Results are presented in Figure 15. It is seen that compared to Latvia, in Estonia and Lithuania there are more people who find it very easy to obtain genuine, branded commercial alcohol. Compared to Estonia and Lithuania, in Latvia there are more people who find it somewhat easy or somewhat difficult to obtain genuine, branded commercial alcohol. So it can be concluded that in Latvia people feel it is more difficult to buy genuine, branded commercial alcohol.
0 10 20 30 40 50 60 70 80
don't know/refused
strongly disagree
disagree
neither agree nor disagree
agree
strongly agree
%
Lithuania Latvia Estonia

Page 18
Figure 15. Perceptions of alcohol availability: Genuine, branded commercial alcohol.
Homemade alcohol: Results are presented in Figure 16. It is seen that there are differences between countries regarding this question. In Lithuania, people find it easiest to obtain homemade alcohol. In Latvia, this is less easy and in Estonia it is most difficult, with about a half of the respondents in Estonia answering, “don’t know/refused”.
Figure 16. Perceptions of alcohol availability: Homemade alcohol.
0 20 40 60 80
don't know refused
very difficult
somewhat difficult
somewhat easy
very easy
%
Lithuania Latvia Estonia
0 20 40 60 80
don't know refused
very difficult
somewhat difficult
somewhat easy
very easy
%
Lithuania Latvia Estonia

Page 19
Counterfeit alcohol: Results are presented in Figure 17. These results are similar to the ones about homemade alcohol. It is seen once again that there are differences between countries regarding this question. In Lithuania, people find it easiest to obtain counterfeit alcohol. In Latvia, this is less easy and in Estonia it is most difficult, with about 40% of the respondents in Latvia and around 60% in Estonia answering, “don’t know/refused”.
Figure 17. Perceptions of alcohol availability: Counterfeit alcohol Contraband alcohol: Results are presented in Figure 18. These results for all the countries are rather similar to the ones about homemade and counterfeit alcohol. It is seen once again that there are differences between countries regarding this question. In Lithuania, people find it easiest to obtain contraband alcohol. In Latvia, this is less easy and in Estonia it is most difficult, with about 30% of the respondents in Latvia and close to 60% in Estonia answering, “don’t know/refused”.
0 20 40 60 80
don't know refused
very difficult
somewhat difficult
somewhat easy
very easy
%
Lithuania Latvia Estonia

Page 20
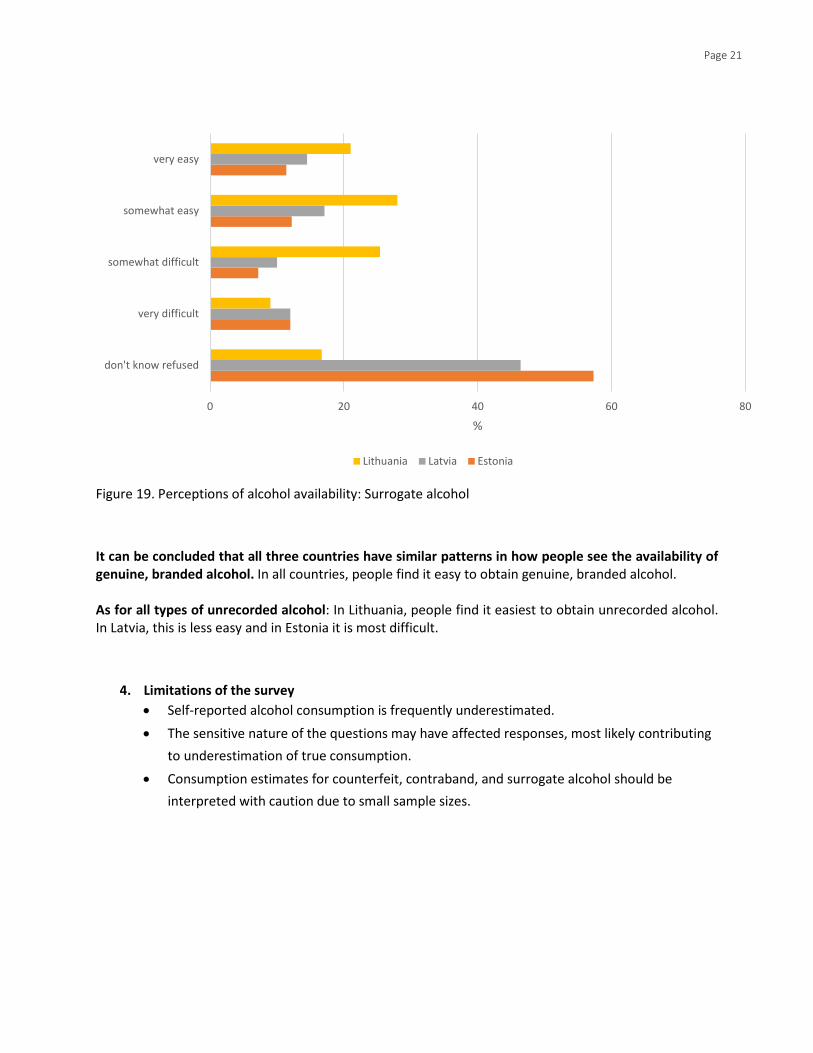
Figure 18. Perceptions of alcohol availability: Contraband alcohol Surrogate alcohol: Results are presented in Figure 19. These results are similar to the ones about other kinds of unrecorded alcohol types surveyed. It is seen once again that there are differences between countries regarding this question. In Lithuania, people find it easiest to obtain surrogate alcohol. In Latvia, this is less easy and in Estonia it is most difficult, with over 40% of the respondents in Latvia and close to 60% in Estonia answering, “don’t know/refused”. In Latvia, only a small proportion of people do not know or refused to answer.
0 20 40 60 80
don't know refused
very difficult
somewhat difficult
somewhat easy
very easy
%
Lithuania Latvia Estonia
Page 21
Figure 19. Perceptions of alcohol availability: Surrogate alcohol It can be concluded that all three countries have similar patterns in how people see the availability of genuine, branded alcohol. In all countries, people find it easy to obtain genuine, branded alcohol. As for all types of unrecorded alcohol: In Lithuania, people find it easiest to obtain unrecorded alcohol. In Latvia, this is less easy and in Estonia it is most difficult.
4. Limitations of the survey • Self-reported alcohol consumption is frequently underestimated. • The sensitive nature of the questions may have affected responses, most likely contributing
to underestimation of true consumption. • Consumption estimates for counterfeit, contraband, and surrogate alcohol should be
interpreted with caution due to small sample sizes.
0 20 40 60 80
don't know refused
very difficult
somewhat difficult
somewhat easy
very easy
%
Lithuania Latvia Estonia

Page 22
5. Implications
This is the first large survey providing estimates of both recorded and unrecorded alcohol consumption, by type, based on representative samples in each of three Baltic countries, and can provide evidence of wide variation in alcohol drinking measures including:
• Frequency of drinking • Average alcohol consumed per day and per year • Percent abstainers • Prevalence of women drinkers • Prevalence and estimates of unrecorded alcohol consumption • Provides some evidence of the price elasticity of demand for alcohol
References
1. Nugawela MD, Langley T, Szatkowski L, Lewis S. Measuring Alcohol Consumption in Population Surveys: A Review of International Guidelines and Comparison with Surveys in England. Alcohol Alcohol [Internet]. 2015;51(1):1–9. Available from: http://www.alcalc.oxfordjournals.org/cgi/doi/10.1093/alcalc/agv073
2. Dawson DA, Ph D. Methodological Issues in Measuring Alcohol Use. 1994; 3. Boniface S, Shelton N. How is alcohol consumption affected if we account for under-
reporting? A hypothetical scenario. Eur J Public Health. 2013;23(6):1076–81. 4. WHO. WHO Health for All Database [Internet]. 2016. Available from:
http://data.euro.who.int/hfadb/ 5. WHO. Global Information System on Alcohol and Health (GISAH) [Internet]. [cited 2016
Nov 8]. Available from: http://www.who.int/substance_abuse/activities/gisah/en/