unsing non financial measures to assess fraud
TRANSCRIPT

DOI: 10.1111/j.1475-679X.2009.00349.xJournal of Accounting ResearchVol. 47 No. 5 December 2009
Printed in U.S.A.
Using Nonfinancial Measuresto Assess Fraud Risk
J O S E P H F . B R A Z E L , ∗ K E I T H L . J O N E S , †A N D M A R K F . Z I M B E L M A N ‡
Received 8 June 2006; accepted 1 July 2009
ABSTRACT
This study examines whether auditors can effectively use nonfinancial mea-sures (NFMs) to assess the reasonableness of financial performance and,thereby, help detect financial statement fraud (hereafter, fraud). If auditorsor other interested parties (e.g., directors, lenders, investors, or regulators)can identify NFMs (e.g., facilities growth) that are correlated with financialmeasures (e.g., revenue growth), inconsistent patterns between the NFMsand financial measures can be used to detect firms with high fraud risk.We find that the difference between financial and nonfinancial performanceis significantly greater for firms that committed fraud than for their non-fraud competitors. We also find that this difference is a significant fraud in-dicator when included in a model containing variables that have previouslybeen linked to the likelihood of fraud. Overall, our results provide empiricalevidence suggesting that NFMs can be effectively used to assess fraud risk.
∗North Carolina State University; †George Mason University; ‡Brigham Young University.We especially thank Abbie Smith (editor) and the referee for their invaluable guidance. We aregrateful for helpful comments from Mark Beasley, Brian Cloyd, Andrew Felo, Glen Gray, DanaHermanson, Diane Matson, Kevin Melendrez, Mitch Oler, Mark Peecher, and workshop partic-ipants at Indiana University, Virginia Tech University, Lehigh University, Utah State University,the 2005 Brigham Young University Research Symposium, the 2006 AAA Annual Meeting,the 2006 International Symposium on Audit Research, the 2007 Auditing Section MidyearConference, the 2008 Conference on Corporate Governance and Fraud Prevention at GeorgeMason University, the 2008 Corporate Governance and Ethics Symposium at George MasonUniversity, the North Carolina Association of Government Accountants, the North CarolinaOffice of the State Controller, and First Citizens Bank. Finally, we appreciate the many studentswho gathered data for our sample of firms. This study was funded by research grants fromthe Institute of Internal Auditors Research Foundation and the Financial Industry RegulatoryAuthority Investor Education Foundation.
1135
Copyright C©, University of Chicago on behalf of the Accounting Research Center, 2009

1136 J. F. BRAZEL, K. L. JONES, AND M. F. ZIMBELMAN
1. Introduction
This paper investigates whether publicly available nonfinancial measures(NFMs), such as the number of retail outlets, warehouse space, or employeehead counts, can be used to assess the likelihood of fraud. During the trialof former HealthSouth CEO Richard Scrushy, federal prosecutors arguedthat Scrushy must have known something was amiss with HealthSouth’s fi-nancial statements since there was a discrepancy between the company’sfinancial and nonfinancial performance. The prosecution noted that, twiceduring the seven-year fraud, revenues and assets increased even though thenumber of HealthSouth facilities decreased. “And that’s not a red flag toyou?” asked prosecutor Colleen Conry during the trial (Florida Times-Union[2005]). Conry’s question implied that HealthSouth’s financial informationwas inconsistent with its nonfinancial information and thus, the risk of fi-nancial statement fraud (hereafter, fraud) at HealthSouth should have beena concern. The defense witness responded that the inconsistency was notapparent at the time and that HealthSouth’s external auditors also failed tonote the inconsistency.
We frame our discussion of using NFMs to detect fraud from the perspec-tive of the external auditor who is charged with the responsibility to detectmaterial fraud in Statement on Auditing Standards (SAS) no. 99 (AICPA[2002]).1 Audit standards (e.g., AICPA [1988, 2002]) require external audi-tors to perform analytical procedures (such as ratio analysis) and to considerthe results when assessing fraud risk. Although audit guidance recognizesthat NFMs may be valuable for performing analytical procedures and as-sessing fraud risk (AICPA [1988, 2002], Bell, Peecher, and Solomon [2005],Messier, Glover, and Prawitt [2006]), auditors are not required to considerthem. The Public Company Accounting Oversight Board (PCAOB) is con-sidering whether auditors should be required to use NFMs to help detectfraud (PCAOB [2004], Hogan et al. [2008]). The PCAOB has concludedthat analytical procedures using only financial data are likely to be ineffec-tive for detecting fraud because management can make fictitious entries tofinancial data in order to create an expected pattern (PCAOB [2004]).
Importantly, managers may attempt to conceal a fraud by manipulatingtheir NFM data to make it consistent with their fraudulent financial data.For example, Royal Dutch Shell allegedly misled investors for years by over-stating their oil and gas reserves (Times Newspapers [2008]).2 If such NFM
1 Many other parties, including internal auditors, boards of directors, investors, creditors,and regulators, have incentives for detecting fraud. Our discussion could be adapted to theseparties as well.
2 The evidence does not suggest that Royal Dutch Shell was manipulating reserves in order toconceal financial statement fraud. It is more likely that Royal Dutch Shell was simply overzealousin moving “probable” oil reserves to “proved” oil reserves, which reflected favorably on futurefinancial performance (Carey, Palmeri, and Reed [2004]). However, this example does show

USING NONFINANCIAL MEASURES TO ASSESS FRAUD RISK 1137
manipulations are commonplace, then inconsistencies between financialand NFM data should be no more pronounced for fraud firms than fornonfraud firms. On the other hand, manipulating other NFMs can be dif-ficult to conceal because (unlike oil and gas reserves) NFM verification isoften straightforward. For example, auditors can effectively verify the num-ber of facilities, retail outlets, or employees. Still, there are several exam-ples, such as HealthSouth, where the reported financial performance wasnot supported by NFM data and the inconsistency was not noted by auditorsor regulators. This study provides the first empirical test of whether incon-sistencies between financial and NFM data can be used to detect fraud. Bydoing so, we also implicitly provide evidence on whether systematic NFMmanipulation is occurring at fraud firms.
Although there is a vast amount of fraud research that looks at numerousexplanatory variables (see Nieschweitz, Schultz, and Zimbelman [2000]), noprior study examines the potential for NFMs to help distinguish fraud firmsfrom nonfraud firms. Prior archival research on detecting fraud providesevidence of a link between fraud and financial statement variables (De-chow, Sloan, and Sweeney [1996], Beneish [1997], Summers and Sweeney[1998], Lee, Ingram, and Howard [1999]); corporate governance variables(Beasley [1996], Dechow, Sloan, and Sweeney [1996], Abbott, Park, andParker [2000], Beasley et al. [2000], Farber [2005]); suspicious accounting(Marquardt and Wiedman [2004], McVay [2006]); and other fraud indi-cators, such as weak internal controls (Bell and Carcello [2000]). We addto this literature by exploring whether a new category of variables—namely,NFMs—can add discriminatory power to fraud prediction models developedfrom prior research.
Our second research contribution is that we build on prior research thatexplores the relevance of NFMs for measuring firm performance (e.g., Amirand Lev [1996], Kaplan and Norton [1996], Ittner and Larcker [1998]).We extend this literature by empirically testing whether NFMs can be usedto detect when a firm’s reported financial performance does not accuratelyportray its economic performance. This study expands the NFM literature byproviding an empirical test of its potential to verify current financial results,whereas the extant NFM research looks at the ability of NFMs to predictfuture firm performance. We believe both roles of NFMs are valuable—oneto validate and the other to forecast.
We find that the relation between reported financial performance andNFMs can distinguish fraud from nonfraud firms. Using a matched-pair sam-ple of fraud firms and nonfraud competitors, we document that fraud firmsare more likely than nonfraud firms to report inconsistent revenue growthrelative to their growth in NFMs. We analyze the growth from the year prior
that the manipulation of NFMs is possible. It also illustrates that empirical tests of the abilityof NFMs to detect fraud are needed to test claims made by regulators and standard setters thatNFMs can be used to effectively assess fraud risk.

1138 J. F. BRAZEL, K. L. JONES, AND M. F. ZIMBELMAN
to the fraud to the first year of the fraud for each matched-pair. When weinclude a variable that measures the difference between a firm’s financialperformance and its NFM performance in a model that includes other fac-tors that have been found to be indicative of fraud, we find the differenceis a significant discriminator between fraud and nonfraud firms. Thus, weprovide evidence showing that comparisons between financial measures andNFMs can be effectively used to assess fraud risk.
This paper is organized as follows: section 2 develops our hypotheses,section 3 explains our sample selection and research method, section 4presents the results, and section 5 concludes the paper.
2. Development of Hypotheses
2.1 PRIOR RESEARCH
Academic research suggests that auditors’ analytical procedures are inef-fective at detecting fraud for at least three reasons. First, auditors may notrecognize unusual trends and ratios within the financial statements becausethey lack a sufficient understanding of their client’s business (Erickson, May-hew, and Felix [2000]). Second, auditors tend to rely on management’s ex-planations without adequately testing their validity (Anderson and Koonce[1995], Hirst and Koonce [1996], Bierstaker, Bedard, and Biggs [1999]).Third, traditional analytical procedures using financial statement data leadto high rates of misclassification and, therefore, yield limited success inidentifying fraud (Beneish [1999], Kaminski and Wetzel [2004], Hoganet al. [2008]). If NFMs can be used to detect fraud, requiring auditors touse them could help address these challenges. For example, NFMs could beused to help auditors understand a client’s business by pointing them to thedrivers of economic performance (Ittner and Larcker [1998]). Similarly, ifNFMs exist that are easily verified and are not being manipulated by man-agement (Bell, Peecher, and Solomon [2005]), then using them will providean avenue for auditors to both generate reliable expectations for their an-alytical procedures and test the validity of management’s explanations totheir inquiries.
The ability to use NFMs to validate financial performance implies thata correlation exists between NFMs and underlying firm performance. Theuse of NFMs in evaluating underlying firm performance has garnered muchattention since Kaplan and Norton [1996] published The Balanced Scorecard.NFM proponents claim that NFMs are not subject to the limitations of tradi-tional financial measures (i.e., short-term focus, emphasis on narrow groupsof stakeholders, and limited guidance for future actions; see Langfield-Smith[2003]). In auditing, SAS no. 56 (AICPA [1988]) suggests that auditorsmay want to consider NFMs when determining the reasonableness of theirclients’ financial statements.

USING NONFINANCIAL MEASURES TO ASSESS FRAUD RISK 1139
Prior research investigates the relations between NFMs and financialperformance measures. Amir and Lev [1996] and Riley, Preason, andTrompeter [2003] study the cell-phone and airline industries, respectively,and conclude that investors overwhelmingly value nonfinancial informationover traditional, financial statement variables. The former study also stressesthe importance of significantly expanding the use of nonfinancial informa-tion in both practice and research. Ittner and Larcker [1998] find one formof NFM, customer satisfaction, is significantly related to future accountingperformance and is partially reflected in current accounting book values.
Two additional studies investigate associations between NFMs and finan-cial statement data in the airline industry. Liedtka [2002] uses factor anal-yses to show that 19 NFMs disclosed by the airline industry represent 7constructs not measured by 18 common financial measures. Behn and Ri-ley [1999] find that airline industry NFMs are useful for predicting quar-terly revenue, expense, and net income numbers. Last, in a study of theretail industry, Lundholm and McVay [2008] illustrate that growth in re-tail outlets and same-store sales data can be modeled to provide salesforecasts that rival IBES analysts’ forecasts. Consistent with this research,audit guidance suggests that NFMs, such as production capacity, shouldbe correlated with revenue reported on the income statement (AICPA[2002]).
In addition to this research, anecdotal evidence suggests that consideringNFMs in conjunction with financial results may, in some cases, help auditorsidentify fraudulent financial statements. For example, Delphi Corporationappears to have boosted net income through sham sales during a periodwhen Delphi and its competitors were laying off workers and experiencingproduction cuts (Lundegaard [2005]). Similar to the HealthSouth prose-cutor’s comments noted previously, it appears that Delphi’s auditors mighthave detected this fraud if they had noted the inconsistency between Del-phi’s reported financial performance and its NFMs. In addition, both short-sellers and fraud examiners appear to consider NFMs when evaluating thereasonableness of sales growth that exceeds expectations (WSJ [2005a]).
Interestingly, internal and external stakeholders are pressuring businessesto report more NFMs (Ballou, Heitger, and Landes [2006], Holder-Webbet al. [2008, 2009]). As businesses respond to this pressure, it may becomemore difficult to conceal inconsistencies between financial performanceand NFMs. We explore whether fraud firms’ financial results are incon-sistent with publicly available NFMs such that the financial results suggestsignificantly stronger performance than the NFMs. For example, a retailerthat is closing outlets is not likely to achieve substantial revenue growth.Such an inconsistency suggests a higher likelihood of fraud.
The PCAOB recognizes the potential for NFMs to be a powerful, indepen-dent benchmark for evaluating the validity of financial statement data, andrecently endorsed their usage to improve fraud detection (PCAOB [2007]).In addition, Bell, Peecher, and Solomon [2005] claim that NFMs are less

1140 J. F. BRAZEL, K. L. JONES, AND M. F. ZIMBELMAN
vulnerable to manipulation and are often more easily verified than financialdata.3 However, cases do exist where fraud firms have manipulated NFMs.For example, The New York Times [2002] reports that WorldCom inflated itsInternet traffic growth while committing fraud. The article explains thatwhen investors discovered that WorldCom’s Internet data strategy was notprofitable, they were shocked because they “had come to believe the boastsof (WorldCom) executives that Internet traffic was doubling about everythree months.” Regarding WorldCom’s NFM fraud, Scott Cleland, CEO ofPrecursor Group (a Washington DC research firm), stated: “The $4 billionaccounting fraud is baby stuff compared to the fraud of data traffic growth,which allowed WorldCom’s stock to appreciate tenfold” (NYT [2002]).
Despite the cases where NFMs have been misstated, several factors suggestthat many NFMs are difficult to manipulate, or at least that such manipu-lations may be difficult to conceal. First, while financial controls can beoverridden by management and while financial statements are producedinternally, some NFMs are produced and reported by independent sources(e.g., customer satisfaction ratings produced by J.D. Power and Associates).Second, many NFMs are not difficult for auditors to verify (e.g., numberof acquisitions, production facilities, or employees), whereas many finan-cial results are difficult to verify (e.g., the estimation of the allowance fordoubtful accounts). Third, if management attempts to manipulate its NFMsto conceal a fraud, it will need to expand the perpetrator pool in orderto conceal the misstated NFM (e.g., involve human resource employees tomanipulate head counts). Thus, a fraud involving both misstated financialdata and NFMs will require a greater degree of collusion to conceal. Finally,the manipulation of NFMs involves another set of data that managementwill need to falsify, which adds complexity to the act of fraud. To summarize,NFM manipulations may not be commonplace for fraud firms. We do nottest whether NFMs are more difficult to manipulate than financial data. Webelieve such a test would be difficult, if not impossible, to perform. However,if fraud firms have manipulated NFMs to be consistent with their fraudulentfinancial statements, our empirical tests will likely not detect differencesbetween fraud and nonfraud firms with respect to inconsistencies betweenfinancial data and NFMs.
Our goal is to explore whether NFMs can be used to detect fraud. Impor-tantly, our study does not provide auditors or other interested parties witha specific model or variable for detecting fraud. We use publicly availableempirical data to test the validity of claims by regulators (AICPA [2002],PCAOB [2004]) and educators (Messier, Glover, and Prawitt [2006]) thatNFMs provide valuable incremental information for assessing fraud risk. Weassume that because auditors have access to a larger pool of firm-specific datathan what is publicly available, empirical tests using publicly available NFM
3 Bell, Peecher, and Solomon [2005] recognize that some NFMs are more easily manipulatedthan others. For example, it may be easier for management to distort (and conceal) spoilagerates than to distort square footage of operations or number of retail outlets.
USING NONFINANCIAL MEASURES TO ASSESS FRAUD RISK 1141
data will be no more (and probably less) likely to detect fraud than theNFM data available to auditors. Thus, tests using publicly available data thatsuggest NFMs can detect fraud will provide strong evidence that auditorscan effectively use NFMs as part of their forensic procedures.4 Our findingscan be used by policymakers to determine whether benefits to the auditprofession would accrue if auditors were required to use NFM data whenassessing fraud risk. We offer two anecdotal examples suggesting that suchbenefits would accrue.
2.2 EXAMPLES
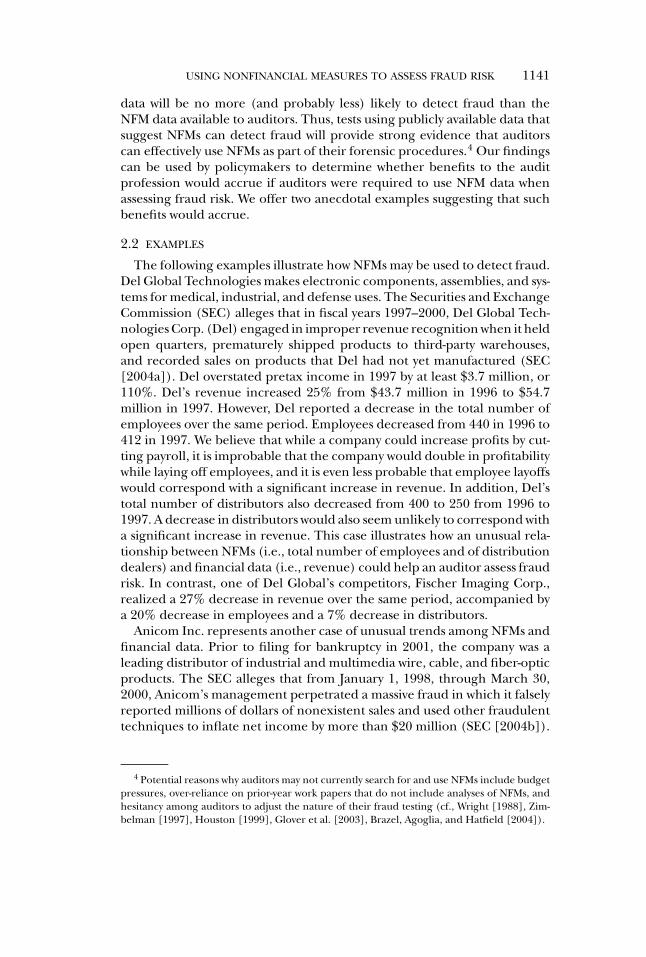
The following examples illustrate how NFMs may be used to detect fraud.Del Global Technologies makes electronic components, assemblies, and sys-tems for medical, industrial, and defense uses. The Securities and ExchangeCommission (SEC) alleges that in fiscal years 1997–2000, Del Global Tech-nologies Corp. (Del) engaged in improper revenue recognition when it heldopen quarters, prematurely shipped products to third-party warehouses,and recorded sales on products that Del had not yet manufactured (SEC[2004a]). Del overstated pretax income in 1997 by at least $3.7 million, or110%. Del’s revenue increased 25% from $43.7 million in 1996 to $54.7million in 1997. However, Del reported a decrease in the total number ofemployees over the same period. Employees decreased from 440 in 1996 to412 in 1997. We believe that while a company could increase profits by cut-ting payroll, it is improbable that the company would double in profitabilitywhile laying off employees, and it is even less probable that employee layoffswould correspond with a significant increase in revenue. In addition, Del’stotal number of distributors also decreased from 400 to 250 from 1996 to1997. A decrease in distributors would also seem unlikely to correspond witha significant increase in revenue. This case illustrates how an unusual rela-tionship between NFMs (i.e., total number of employees and of distributiondealers) and financial data (i.e., revenue) could help an auditor assess fraudrisk. In contrast, one of Del Global’s competitors, Fischer Imaging Corp.,realized a 27% decrease in revenue over the same period, accompanied bya 20% decrease in employees and a 7% decrease in distributors.
Anicom Inc. represents another case of unusual trends among NFMs andfinancial data. Prior to filing for bankruptcy in 2001, the company was aleading distributor of industrial and multimedia wire, cable, and fiber-opticproducts. The SEC alleges that from January 1, 1998, through March 30,2000, Anicom’s management perpetrated a massive fraud in which it falselyreported millions of dollars of nonexistent sales and used other fraudulenttechniques to inflate net income by more than $20 million (SEC [2004b]).
4 Potential reasons why auditors may not currently search for and use NFMs include budgetpressures, over-reliance on prior-year work papers that do not include analyses of NFMs, andhesitancy among auditors to adjust the nature of their fraud testing (cf., Wright [1988], Zim-belman [1997], Houston [1999], Glover et al. [2003], Brazel, Agoglia, and Hatfield [2004]).

1142 J. F. BRAZEL, K. L. JONES, AND M. F. ZIMBELMAN
During the first year of the fraud, 1998, Anicom reported a substantial in-crease in employees (46%), in the number of facilities (55%), and in squarefeet of operations (29%). However, the company’s revenue growth was 93%over the same period. Anicom’s revenue increased from $244 million in1997 to $470 million in 1998. Anicom’s growth in NFMs (i.e., employeesand facilities), while robust, did not keep pace with its enormous revenuegrowth. In contrast, one of Anicom’s closest competitors, Graybar ElectricCompany Inc., reported more modest sales growth (11%) from 1997 to1998. Graybar’s growth in NFMs was consistent with its revenue growth: To-tal employees increased 10%, total number of facilities increased 3%, andsquare feet of operations increased 6%. While we recognize that factorsother than fraud can cause unusual relationships between NFMs and finan-cial data, we test whether firms that are committing fraud are more likely toexhibit these relationships.
2.3 HYPOTHESES
Levitt and Dubner [2005] posit that one reason academics know very lit-tle about the practicalities of fraud is the paucity of good data. Ideally, astudy of NFMs would focus on common, industry-specific NFMs. Compilinga reasonable database of fraud firms in one industry is problematic becausepublicized fraud cases are rare. To overcome this limitation, we construct ameasure that is consistent across firms in different industries with differentNFMs. We do so by using NFMs with an expected positive correlation withrevenue and determine whether inconsistencies between revenue growthand NFM growth discriminate between fraud and nonfraud firms.5 For ex-ample, we select the number of retail outlet stores as an NFM for a firm inthe retail industry. Then, we examine the difference between an identifiedfraud firm’s percentage change in revenue and the percentage change inretail outlets from the year prior to the fraud to the year of the fraud. Wethen compare this difference with that of an industry competitor with theexpectation that the difference between revenue growth and NFM growthwill be larger for fraud firms than for their nonfraud competitors. Thus, wetest the following hypothesis:
H1: Fraud firms have greater differences between their percent changein revenue growth and their percent change in NFMs than theirnonfraud competitors.
When performing analytical procedures, auditors commonly rely ontrends in prior-year financial data to develop expectations for the
5 We concentrate our analyses on revenues due to the concentration of frauds and restate-ments related to improper revenue recognition. SAS no. 99 explicitly advises auditors thatrevenue recognition should be considered a high-fraud-risk area, and, consequently, auditorsshould compare recorded revenue amounts with relevant NFMs. In addition, any future PCAOBguidance on fraud is likely to include required procedures related to revenue recognition (e.g.,Beasley, Carcello, Hermanson [1999], AICPA [2002], PCAOB [2004], WSJ [2005b]).

USING NONFINANCIAL MEASURES TO ASSESS FRAUD RISK 1143
current-year’s financial performance (Anderson and Koonce [1995], Hirstand Koonce [1996], Bierstaker, Bedard, and Biggs [1999], POB [2000]). Asmentioned previously, audit guidance suggests that auditors should incor-porate the results of analytical procedures into their fraud risk assessments.SAS no. 99 (AICPA [2002], ¶28) specifically states:
In performing analytical procedures . . . the auditor develops expectationsabout plausible relationships that are reasonably expected to exist, basedon the auditor’s understanding of the entity and its environment. Whencomparison of those expectations with recorded amounts yields unusualor unexpected relationships, the auditor should consider those results inidentifying the risk of material misstatement due to fraud.
The PCAOB [2004] contends that comparing financial data to NFMs ismore likely to help auditors detect fraud than performing analytical proce-dures based solely on financial data that has also been subject to manipula-tion or fraud. To test this claim, we explore whether the consistency betweenfinancial measures and NFMs is associated with fraudulent financial report-ing when controlling for other financial variables (e.g., leverage) knownto discriminate fraud from nonfraud firms. We also control for nonoper-ational/nonfinancial data (e.g., corporate governance variables, auditortype, age of the firm, etc.) that have been linked to fraud. In a fraudu-lent financial reporting model, the explanatory power of these nonopera-tional/nonfinancial factors should be complemented by including NFMsthat serve as a reliable benchmark for financial reporting accuracy.
Prior research and audit guidance identifies three factors—collectivelyknown as the fraud triangle—that lead to fraud: incentive, opportunity, andattitude (Loebbecke, Eining, and Willingham [1989], Albrecht, Wernz, andWilliams [1995], AICPA [2002]). Incentive factors include inducement fromcapital markets and compensation schemes that result in a perceived ben-efit from committing fraud. Opportunity factors include weak corporategovernance and other working conditions that result in circumstances thatallow management to commit fraud. Attitude factors are items that revealmanagement’s propensity to rationalize fraudulent behavior. Archival re-search shows that factors related to both incentive and opportunity are re-lated to fraud (e.g., Beasley [1996]). However, we are not aware of priorarchival research that measures and controls for management’s attitude,a finding confirmed by Hogan et al. [2008] in their review of the fraudliterature.6
Prior archival studies and educators identify variables related to suspi-cious accounting (e.g., special items) that are useful in detecting fraud or
6 As noted earlier, several parties are calling on businesses to report more NFM information.Some of these NFMs may be useful for measuring managements’ attitude toward fraud. Forexample, NFMs that measure a firm’s social and environmental performance may be correlatedwith managements’ attitude. We believe that future research exploring this relationship maybe fruitful.

1144 J. F. BRAZEL, K. L. JONES, AND M. F. ZIMBELMAN
earnings management (Albrecht et al. [2008], Marquardt and Wiedman[2004], McVay [2006]). Thus, three categories of factors found in priorarchival research to be associated with fraud are: incentive, opportunity,and suspicious accounting. To determine if inconsistencies between finan-cial measures and NFMs discriminate fraud firms from nonfraud firms, weincorporate our variable of interest into a model containing financial andnonoperational proxies for incentive, opportunity, and suspicious account-ing and measure its effects. Our expectation is formalized as follows:
H2: An independent variable that compares change in revenue growthand change in NFMs is positively associated with fraudulent finan-cial reporting after controlling for variables that have been previ-ously linked to fraudulent financial reporting.
3. Sample Selection and Research Method
3.1 SAMPLE
Our fraud sample includes firms charged by the SEC with having fraudu-lently reported revenue in at least one 10-K filing. We do not include fraudsthat involve quarterly data for several reasons: Prior studies restrict their sam-ples to annual data, quarterly disclosures provide little nonfinancial data,quarterly financial statements are not audited, and discrepancies betweenfinancial and nonfinancial data would be less likely in a shorter time frame.We also limit our sample to firms for which we were able to access the original10-K filing and subsequent filings of restated data (i.e., 10-K/As, 8-Ks, etc.).We do this for two reasons. First, 10-K filings are valuable sources of informa-tion to help identify NFMs. Second, Compustat is our primary financial datasource. We find that Compustat does not consistently report restated data.It appears that if the restated data is available when Compustat personnelenter the data in their database, the restated data is entered and the fraudu-lent numbers are discarded. It also appears that Compustat does not changethe data they originally entered when a restatement occurs at a later time.We therefore compare Compustat data with the original 10-K filing to verifythat the data reported in Compustat is the fraudulently reported numbersand not restated data. We find that Compustat reports restated data for nineof the fraud firms in our fraud sample. We hand-collect the fraudulent datafrom the original 10-K filing for those nine firms. SEC filings are availableon EDGAR from 1994 onward and on Lexis/Nexis for selected companiesfor years prior to 1994.
We identify our fraud sample from three sources. First, the Committeeof Sponsoring Organizations of the Treadway Commission (COSO) pub-lished a report, “Fraudulent Financial Reporting: 1987–1997, An Analysisof U.S. Public Companies” (Beasley, Carcello, Hermanson [1999]), whichinvestigates frauds identified in SEC Accounting and Auditing Enforcement

USING NONFINANCIAL MEASURES TO ASSESS FRAUD RISK 1145
Releases (AAERs) issued during the period of 1987–1997.7 Second, we per-form our own search for AAERs issued during the years 1998–2007. Finally,we search the popular press (e.g., The Wall Street Journal) for reports aboutfraud cases.
We exclude firms from our sample for one or more of the following rea-sons: Firms had missing or incomplete data (largely due to missing Compu-stat data required to measure many of our control variables), firms did notmisreport at least one 10-K (e.g., fraudulent reported quarterly data), firmswere in the financial services or insurance industries,8 firms perpetratedfrauds that did not involve fraudulent financial reporting (e.g., omitteddisclosures, insider trading, options backdating), firms did not manipulaterevenues (e.g., inventory/expense frauds), firms committed fraud prior to1993 (i.e., no 10-K or proxy statement available on EDGAR to verify fraud-ulent revenue data), or firms did not have similar NFMs for the firm anda competitor (nonfraud firm) that we could hand-collect. Our initial fraudsample consists of 50 fraud firms that, according to the SEC, intentionallymanipulated revenues. This sample size is comparable to the sample sizes ofprevious fraud studies (e.g., Beasley [1996], Erickson, Hanlon, and Maydew[2006]). For our analysis of only one NFM available on Compustat, num-ber of employees, our sample size expands to 110 fraud firms. Panel A oftable 1 reports our sample selection method.
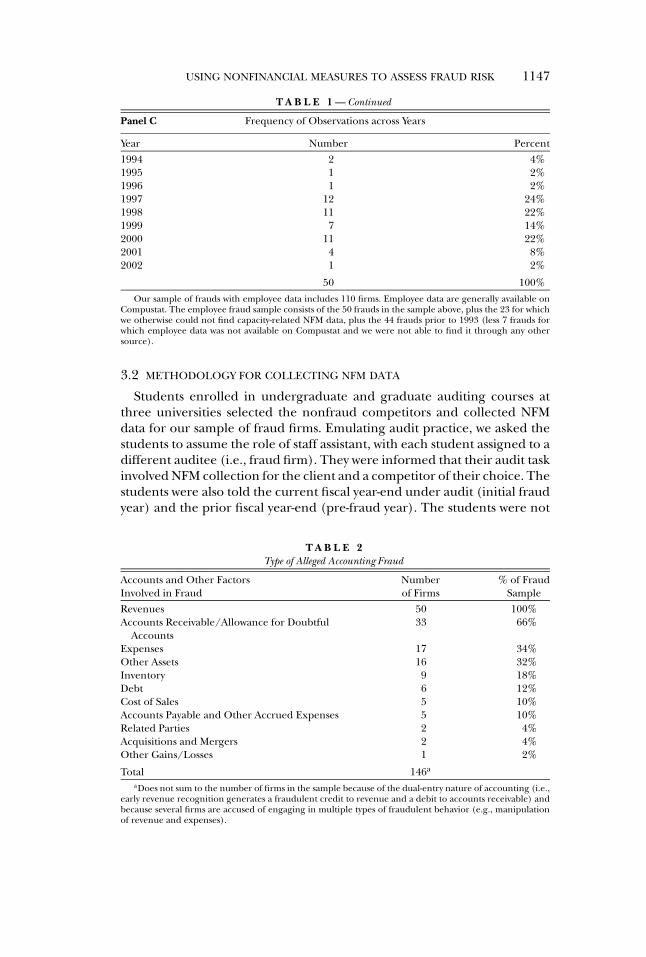
Several of our fraud firms misreported revenues for more than one year.Our sample includes only the first year of manipulation because we wantto compare a year that was accurately reported (i.e., the year prior to thefraud) to a year that was manipulated (i.e., the first year of the fraud). Forour initial sample of 50 fraud firms, panels B and C of table 1 present thenumber of frauds by industry and year, respectively. The 50 firms accusedof fraud reside in 22 different two-digit SIC codes. The 7300–7399 BusinessServices classification code has the largest percentage (24%) of fraud firms.The frauds in our sample occurred during a nine-year period between 1994and 2002, with 82% of the alleged frauds in the sample taking place in theyears 1997–2000.
Table 2 presents the types of alleged accounting fraud in our sample firmsas obtained from the AAERs. We were also able to hand-collect informationon the size of the restatement for 39 of the 50 firms in our sample. For eachfraud firm, we searched the AAER and subsequent 10-Ks, 10-K/As, and 8-Ksto find the restated earnings number. The average earnings restatement forall firms was 11% of total revenue.
7 Prior studies (Pincus, Holder, and Mock [1987], Feroz, Park, and Pastena [1991], De-chow, Sloan, and Sweeney [1996]) provide more detail on AAERs and the SEC’s process ininvestigating firms.
8 We exclude firms in these industries because they generally lack the control variables (e.g.,financing) used in our models and to be consistent with prior fraud research (e.g., Lee, Ingram,and Howard [1999], Erickson, Hanlon, and Maydew [2006]).

1146 J. F. BRAZEL, K. L. JONES, AND M. F. ZIMBELMAN
T A B L E 1Sample Information
Selection MethodPanel A
Frauds from COSO’s Report on Fraudulent Financial Reporting from 1987 to 1997(Beasley, Carcello, Hermanson [1999]).
204
Total Accounting and Auditing Enforcement Releases (AAERs) attributable to allegedor actual accounting fraud from January 1998 to September 2007 (nonduplicates ofthe COSO report).
268
Additional frauds identified through other sources (e.g., popular press search andAAA monograph on litigation involving Big Four auditors).
6
Firms with missing or incomplete data on Compustat, Edgar, or Lexis/Nexis(including missing data from prior year).
(162)
Frauds related to quarterly (10-Qs), but not annual data (10-Ks). (75)Frauds dropped for other reasons (i.e., financial services or insurance firm or fraud
was nonfinancial in nature (e.g., omitted disclosure, insider trading)).(70)
Frauds unrelated to revenue (e.g., inventory and expense frauds). (54)Frauds prior to 1993 (no proxy or 10-K available on Edgar). (44)Frauds for which we could not find similar capacity-related NFM data for the fraud
firm and competitor for the year before the fraud and the first year of the fraud.(23)
Total sample 50
Frequency of Observations across IndustriesPanel BSIC Code Industry Number Percent
1300–1399 Oil and gas extraction 1 2%1600–1699 Heavy construction 1 2%2000–2099 Food and kindred products 1 2%2300–2399 Apparel and other finished products 3 6%2600–2699 Paper and allied products 1 2%2800–2899 Chemicals and allied products 1 2%3100–3199 Leather and leather products 1 2%3300–3399 Primary metal industries 1 2%3400–3499 Fabricated metal products 1 2%3500–3599 Industrial and commercial machinery and computer
equipment5 10%
3600–3699 Electronic and other electrical equipment andcomponents
4 8%
3800–3899 Measuring, analyzing, and controlling instruments 5 10%4800–4899 Communications 1 2%4900–4999 Electric, gas, and sanitary services 3 6%5000–5099 Wholesale trade—durable goods 2 4%5100–5199 Wholesale trade—nondurable goods 1 2%5300–5399 General merchandise stores 1 2%5600–5699 Apparel and accessory stores 1 2%5900–5999 Miscellaneous retail 2 4%7300–7399 Business services 12 24%7900–7999 Amusement and recreation services 1 2%8000–8099 Health services 1 2%
50 100%
(Continued)
USING NONFINANCIAL MEASURES TO ASSESS FRAUD RISK 1147
T A B L E 1 — Continued
Frequency of Observations across YearsPanel C
Year Number Percent
1994 2 4%1995 1 2%1996 1 2%1997 12 24%1998 11 22%1999 7 14%2000 11 22%2001 4 8%2002 1 2%
50 100%
Our sample of frauds with employee data includes 110 firms. Employee data are generally available onCompustat. The employee fraud sample consists of the 50 frauds in the sample above, plus the 23 for whichwe otherwise could not find capacity-related NFM data, plus the 44 frauds prior to 1993 (less 7 frauds forwhich employee data was not available on Compustat and we were not able to find it through any othersource).
3.2 METHODOLOGY FOR COLLECTING NFM DATA
Students enrolled in undergraduate and graduate auditing courses atthree universities selected the nonfraud competitors and collected NFMdata for our sample of fraud firms. Emulating audit practice, we asked thestudents to assume the role of staff assistant, with each student assigned to adifferent auditee (i.e., fraud firm). They were informed that their audit taskinvolved NFM collection for the client and a competitor of their choice. Thestudents were also told the current fiscal year-end under audit (initial fraudyear) and the prior fiscal year-end (pre-fraud year). The students were not
T A B L E 2Type of Alleged Accounting Fraud
Accounts and Other Factors Number % of FraudInvolved in Fraud of Firms Sample
Revenues 50 100%Accounts Receivable/Allowance for Doubtful
Accounts33 66%
Expenses 17 34%Other Assets 16 32%Inventory 9 18%Debt 6 12%Cost of Sales 5 10%Accounts Payable and Other Accrued Expenses 5 10%Related Parties 2 4%Acquisitions and Mergers 2 4%Other Gains/Losses 1 2%
Total 146a
aDoes not sum to the number of firms in the sample because of the dual-entry nature of accounting (i.e.,early revenue recognition generates a fraudulent credit to revenue and a debit to accounts receivable) andbecause several firms are accused of engaging in multiple types of fraudulent behavior (e.g., manipulationof revenue and expenses).

1148 J. F. BRAZEL, K. L. JONES, AND M. F. ZIMBELMAN
aware of the study’s hypotheses, they did not collect revenue data, and theywere not evaluated on whether the data was consistent with the hypotheses.They were evaluated solely on their ability to collect NFM data.
We also provided the students with three of the client’s closest competitors(nonfraud firms) as identified by Hoover’s Online database. We did not per-form a simple match based on SIC code and size because we require identicalNFMs for both the fraud firm and its competitor. We conclude that simplymatching by SIC code and size would be less likely to yield correspondingNFM data for both the fraud firm and the matched-pair and that we weremore likely to find corresponding NFM data by matching fraud firms withtheir competitors. More importantly, discussions with practicing auditorsreveal that our matching procedure was more likely to be performed byindependent auditors rather than a simple SIC code match.9
Students were instructed to collect up to four quantitative NFMs that wereidentical for both the client and one competitor of their choosing for theinitial fraud year and the prior fiscal year-end (noting source references).We told the students to target NFMs that have positive contemporaneouscorrelations with revenue. The students were asked to perform an exhaus-tive search of 10-Ks, Hoover’s Online, Proquest, ABI-Inform, Lexis/Nexis,Standard and Poor’s Market Insight, and Google for NFMs for each fraudfirm and one competitor of their choosing. The students were told to becreative in finding new sources of NFM data and to share information aboutpossible new data sources with other students. Students reported that collect-ing the NFM data took between two to five hours for each firm-competitorcombination.
Our sample includes NFMs that are quantitative, nonfinancial, nonem-ployee related, and relate to firm capacity.10 For example, several NFMsinvolve the capacity of the firm’s operational space, including square feetof operations, manufacturing space, floor space, and warehousing space.Other measures involve the number of facilities available to the firm, suchas the number of retail outlets, number of facilities, and number of stores.Some measures were explicitly given the label of capacity by the firm, in-cluding annual capacity in tons and energy-producing capacity. Others weredeemed to reflect capacity, such as gas reserves, distribution dealers, and
9 Some prior fraud research matches on SIC code, year, and size (e.g., Beasley [1996], Sum-mers and Sweeney [1998], Erickson, Hanlon, and Maydew [2006]). Our matching processdiffers but yields similar results, since only 18 of our 50 fraud firms were matched with com-petitors in a different two-digit SIC code. However, we find some competitors were in entirelydifferent SIC codes from the fraud firms. For example, Genesco allegedly committed fraudin 2001 (SEC [2003]). Compustat lists Genesco’s SIC code as 5661 (Apparel and AccessoryStores: Shoe Stores). Hoover’s lists Stride Rite as one of Genesco’s closest competitors, butStride Rite’s SIC code is 3140 (Leather and Leather Products: Footwear). We had similar ex-periences matching other fraud firms with their competitors and conclude that matching onSIC code does not necessarily include the firm’s competitors as listed by Hoover’s Online.
10 As an alternative test of H1 and H2, we separately examine whether our hypotheses aresupported using one type of NFM—total number of employees (Compustat data #29).

USING NONFINANCIAL MEASURES TO ASSESS FRAUD RISK 1149
number of product lines. From the NFMs submitted by students, we identifya total of 115 common NFMs for 50 fraud firms and their competitors.
Some NFMs collected by the students do not fit our requirements as quan-titative, nonfinancial, nonemployee-related measures of capacity; therefore,we exclude those NFMs from our sample. Examples of data that we excludeare bond ratings and number of litigation cases. We include NFMs in ouranalysis only if we could make a relatively strong argument for their correla-tion with capacity. Importantly, our objective is not to find the best method-ology for collecting NFM data. Rather, our goal is to test whether NFMs havethe potential to be effectively utilized for assessing fraud risk. Because webelieve auditors have access to client NFMs that are not publicly available(and perhaps more predictive of financial data), we view our tests as lackingstrong power to reject the null. Therefore, finding statistical support forour hypotheses using this methodology suggests that NFMs have significantpotential for assessing fraud risk.
3.3 STATISTICAL MODELS
We create a variable that measures the difference between the percentchange in revenue and the percent change in NFMs for each fraud firmand competitor. We measure the difference for each firm from the yearprior to the fraud to the year of the fraud as follows:
CAPACITY DIFF t = REVENUE GROWTH t − NFM GROWTH t
where,
REVENUE GROWTH = (Revenuet − Revenuet −1)/Revenuet −1
NFM GROWTH = (NFM t − NFM t−1)/NFM t−1
REVENUE = total revenueNFM = nonfinancial measuret = initial year of the fraud
H1 posits that fraud firms will have, on average, a greater value for CAPAC-ITY DIFF than nonfraud firms (i.e., competitors).11 When we have multiple
11 We winsorize both our DIFF measures at 1 and –1, which means the difference betweenREVENUE GROWTH and NFM GROWTH could not be greater than 100% or less than –100%.We did this because the majority of our sample had values for DIFF between 100% and −100%.However, some firms had extreme values of DIFF , which are primarily driven by years of extremeREVENUE GROWTH . For example, M&A West allegedly committed fraud in 2000 (SEC [2001]).M&A’s revenues increased from $602,000 in 1999 to $7.5 million in 2000 for an increase of1,145%. M&A’s NFM GROWTH was still substantial (491%); however, M&A’s DIFF value is654%. Financial ratios often “blow up” at the tails, and the problems with using accounting-based financial ratios are well documented (Kane and Meade [1998]). Both our measures ofDIFF are especially sensitive to these problems because they are the difference of two ratios.In the case of M&A West, it is unlikely that an auditor attempting to assess fraud risk wouldattach six and a half times more weight to M&A’s difference in REVENUE GROWTH and NFMGROWTH than a firm that has a 100% difference. The differences for both are simply very

1150 J. F. BRAZEL, K. L. JONES, AND M. F. ZIMBELMAN
NFMs for a matched-pair, we use the average change in NFMs to calculateCAPACITY DIFF . For example, as noted previously, Anicom reported a sub-stantial increase in square feet of operations (29%) and in the number offacilities (55%) during the year of the fraud. In Anicom’s case, the aver-age change in NFM is 42%. During the same period, Anicom’s sales grew93% for a CAPACITY DIFF of 51%. As an alternative test of H1 and H2,we examine whether our hypotheses are supported using one NFM, totalnumber of employees (Compustat data #29).12 We refer to this variableas EMPLOYEE DIFF . We calculate EMPLOYEE DIFF for 110 matched-pairs(220 observations) as opposed to the 50 matched-pairs (100 observations)for CAPACITY DIFF .
We test whether EMPLOYEE GROWTH is typically correlated with REV-ENUE GROWTH by performing the following regression on all firms inCompustat during our sample period (1993–2002):
REVENUE GROWTH t = β0 + β1 EMPLOYEE GROWTH t
where,
REVENUE GROWTH = (Revenuet − Revenuet −1)/Revenuet −1
EMPLOYEE GROWTH = (Employeest − Employeest −1)/Employeest −1
In nontabulated results, the coefficient on EMPLOYEE GROWTH is positive(0.597) and highly significant (p < 0.01). The R2 is high (0.28), suggesting astrong correlation between employee growth and revenue growth reportedby companies. Thus, at least for nonfraud firms, one would expect a relativelylow EMPLOYEE DIFF .
To test H2, we examine CAPACITY DIFF and EMPLOYEE DIFF in mul-tivariate regressions with control variables for incentive, opportunity, andsuspicious accounting, and an indicator for fraud as the dependent vari-able. We examine the effects of our variables of interest in these regressionsto determine whether they are positively associated with fraudulent financialreporting. Our selection and measurement of control variables is reflectiveof variables that have been examined in prior studies of fraud, earnings
high and abnormal. Therefore, we cap the value of our DIFF measures at 100% and –100%.As a sensitivity test, we also replace both DIFF measures with a dummy variable that equals 1 ifNFM GROWTH is greater than REVENUE GROWTH and generate qualitatively similar results(see the Robustness Tests section). Finally, deleting firms (and their corresponding matchedpair) with DIFF s in excess of 100% and −100% generates qualitatively similar results, as doesranking the DIFF s and using the ranking as our dependent variable (Cheng, Hopwood, andMcKeown [1992], Ireland and Lennox [2002]).
12 See Berenson [2003] for a description of how substantial discrepancies between revenuegrowth and employee growth were present at Computer Associates while the company wascommitting fraud. Also, using two variables to test for our hypotheses provides a robustnesstest to ensure some systematic variation in a business practice, such as employee outsourcing,is not driving our results. Outsourcing is also addressed in the Robustness Tests section laterin the paper.

USING NONFINANCIAL MEASURES TO ASSESS FRAUD RISK 1151
management, and accounting restatements (e.g., Erickson, Hanlon, andMaydew [2006], McVay [2006], Richardson, Tuna, and Wu [2007]). Ourmodels are as follows:
P (FRAUDt ) = β0 + β1Capacity Difft + βi Control Variables
P (FRAUDt ) = β0 + β1Employee Difft + βi Control Variables
P (FRAUDt ) = A dummy variable coded 1 for fraud firms and 0 for nonfraud
firms
t = year of the fraud
We define the control variables as follows:
3.3.1. Incentive Factors.
FINANCING = an indicator variable coded 1 ifFREECASHt is less than −0.5, andcoded 0 otherwise
FREECASH = (Cash Flow from Operationst − Av-erage Capital Expenditurest −3 to t−1)/Current Assetst −1
LEVERAGE = (Short-Term Debtt + Long-TermDebtt)/Total Assetst
ALTMAN’S Z SCORE = 1.2X 1 + 1.4X 2 + 3.3X 3 + 0.6X 4 +1.0X 5
X 1 = (Current Assetst − Current Liabil-itiest)/Total Assetst
X 2 = Retained Earningst/Total Assetst
X 3 = Earnings Before Interest andTaxest/ Total Assetst
X 4 = MARKET VALUE OF EQUITYt/Book Value of Total Liabilitiest
X 5 = Revenuet/Total Assetst
MARKET VALUE OF EQUITY = End-of-Year Share Pricet × Total Com-mon Shares Outstandingt
BOOK TO MARKET = (Total Assetst − Total Liabilitiest)/MARKET VALUE OF EQUITY t
EARNINGS TO PRICE = Net Income (Compustat data #18) perShare/End-of-Year Share Pricet
RETURN ON ASSETS = Net Income Before ExtraordinaryItemst/Total Assetst −1
AGE OF FIRM = the length of time in years the firm hasbeen publicly traded (from the Centerfor Research in Security Prices)
M&A IN YEAR OF FRAUD = An indicator variable set equal to 1if the firm had an acquisition thatcontributed to sales in the prior year

1152 J. F. BRAZEL, K. L. JONES, AND M. F. ZIMBELMAN
(acquisition in the first year of fraud forfraud firms). (Variable set equal to 1 ifCompustat data #249 > 0. Otherwise,variable is set to 0.)
3.3.2. Opportunity Factors.
BIG FOUR = an indicator variable set equal to 1 if thefirm had a Big Four Auditor at t, and setto 0 otherwise
INSIDERS ON THE BOARD = the percentage of insiders (companyemployees) on the Board of Directors
CEO = COB = an indicator variable coded 1 if thefirm’s CEO was also Chairman of theBoard, and coded 0 otherwise
3.3.3. Suspicious Accounting Factors.
TOTAL ACCRUALS = (Net Income Before ExtraordinaryItemst + Depreciationt − Cash Flowfrom Operationst)/Total Assetst
SPECIAL ITEMS = An indicator variable set equal to 1if the firm reported a special item(Compustat #17). Otherwise, variable isset to 0
REVENUE GROWTH = (Revenuet − Revenuet −1)/Revenuet −1
3.3.4. Other Controls.
TOTAL ASSETS = Total Assetst
NEGATIVE CHANGE IN NFM = An indicator variable set equal to 1 ifthe firm had a negative change in NFM .Otherwise, variable is set to 0
FINANCING captures the extent to which the firm may need external fi-nancing. Consistent with Dechow, Sloan, and Sweeney [1996], we create anindicator variable set equal to 1 if the firm will likely need external financingin the next two years. Firms closer to exhausting their internal funds mayhave incentives to manipulate revenues in anticipation of accessing the capi-tal markets. Following Erickson, Hanlon, and Maydew [2006], if FREECASHis less than or equal to –0.5, then FINANCING is set equal to 1; otherwise,FINANCING is set to equal 0. This cutoff implies that if a firm will need ex-ternal financing in the coming years it will need to start raising the desiredfunds now.
Both LEVERAGE and ALTMAN’S Z SCORE control for financial distress.Financially distressed firms may have a greater incentive to commit fraudthan those that are not distressed (Begley, Ming, and Watts [1996]). We also
USING NONFINANCIAL MEASURES TO ASSESS FRAUD RISK 1153
include several variables that measure market and financial performance.Above average financial or stock performance may indicate that the firmis achieving abnormally high performance through fraudulent reporting,or that the firm may have incentives to commit fraud in order to sustaintheir performance. We use MARKET VALUE OF EQUITY, BOOK TO MAR-KET, EARNINGS TO PRICE , and RETURN ON ASSETS to control for stockand financial performance and to be consistent with prior fraud studies(e.g., Dechow, Sloan, and Sweeney [1996], Beneish [1997], Summers andSweeney [1998], Lee, Ingram, and Howard [1999], Erickson, Hanlon, andMaydew [2006]). AGE OF THE FIRM controls for the fact that fraud firmstend to be younger (Beneish [1997]), which may be due to a greater incen-tive to commit fraud as a result of an initial public offering or other newlyissued stock. M&A IN YEAR OF FRAUD is an indicator variable set equal to 1if a portion of firm revenues is from an acquisition. Firms have incentives tomanage earnings prior to an acquisition in order to raise their stock price(Erickson and Wang [1999], Louis [2004]).13
BIG FOUR is a measure of audit quality and opportunity. We use the termBig Four to represent the four largest international accounting firms, theirpredecessor firms, and Arthur Andersen. Teoh and Wong [1993] find ev-idence consistent with the hypothesis that larger auditors generate moreprecise earnings. Palmrose [1988] concludes that Big Four auditors expe-rience less litigation than non-Big Four auditors, despite having deeperpockets. Based on this research, employing a Big Four auditor may lead tohigher audit quality and reduce a firm’s opportunity to engage in fraud.
Weak corporate governance may lead to less monitoring of financialand nonfinancial information and greater opportunities to commit fraud(Beasley [1996], Deloitte LLP [2004]). Dechow, Sloan, and Sweeney [1996]show that several corporate governance variables are correlated with fraud-ulent reporting. They classify the variables into two groups; one group mea-sures low management oversight and the other measures the power of theCEO over the board. To control for low management oversight, we includeINSIDERS ON BOARD, which is the percentage of company employees thatsit on the board of directors. To control for the power of the CEO overthe board, we select a dummy variable that is set to 1 if the CEO is alsothe chairman of the board (CEO = COB), and 0 otherwise. We hand-collectcorporate governance data from proxy statements.
Our model controls for three specific forms of suspicious accounting.TOTAL ACCRUALS controls for the difference between earnings and cashflow from operations. Lee, Ingram, and Howard [1999] find this differ-ence to be an indicator of fraudulent financial reporting. If earnings are
13 We do not include a control variable for equity-based compensation in our model for tworeasons. First, in their study of the link between executive equity incentives and accountingfraud, Erickson, Hanlon, and Maydew [2006] do not find consistent evidence that equity-basedcompensation is associated with fraud. Second, for the majority of the firms in our sample, wewere unable to obtain equity-based compensation data from ExecuComp.
1154 J. F. BRAZEL, K. L. JONES, AND M. F. ZIMBELMAN
fraudulent, there will be no corresponding cash inflow. We include theexistence of SPECIAL ITEMS as a control variable because prior researchsuggests that special items have been used as an earnings managementtool (Marquardt and Wiedman [2004], McVay [2006]). REVENUE GROWTHcontrols for the possibility that high growth firms may have high values forour two DIFF measures and that fraud firms are simply high growth firmsneeding to sustain their growth (Erickson, Hanlon, and Maydew [2006]),rather than firms for which there are inconsistencies between their financialdata and NFMs.
TOTAL ASSETS proxies for size; including this variable controls for thepossibility that size is driving our results. Similarly, NEGATIVE CHANGE INNFM controls for the possibility that our results are driven by firms in crisis.Firms with a negative change in their NFMs may be downsizing or in turmoil,causing a large value for our two DIFF measures. We include this variable tocontrol for this possibility.
3.4 METHODOLOGY RELATED TO MISSING DATA
In order to maximize the size of our sample (in terms of total sample sizeand total control variables) in our multivariate analyses (H2 testing), weemploy Rubin’s [1987] multiple imputation procedure to control for miss-ing data. Our primary data constraint with respect to control variables washand-collecting the corporate governance variables from proxy statements.We were able to collect INSIDERS ON BOARD and CEO = COB for only 42fraud firms. The multiple imputation procedure replaces the missing val-ues with a set of plausible values that represent the uncertainty about thecorrect value to impute. The imputed data sets are analyzed using standardprocedures (e.g., standard logistic regression) and the results are combined(Yuan [2007]).14
4. Results
4.1 DESCRIPTIVE STATISTICS
Table 3 provides descriptive statistics for our study’s main variable of in-terest (CAPACITY DIFF ), the alternative variable of interest (EMPLOYEEDIFF ), and control variables. For the fraud sample, we include a variablethat measures fraud size (i.e., the size of the earning restatement as a per-centage of revenue) to provide an estimate of the extent of the earningsmanipulation.
14 Three methods have been used for imputing missing data. Our results use the MarkovChain Monte Carlo method developed by Schafer [1997], which assumes that the missing datafollow an arbitrary pattern. Two other methods, the parametric regression method and thepropensity scores method, are used when the missing data follow a monotone pattern (Yuan[2007]). We do not report results using these methods because we have no evidence to assumeour missing data follow a monotone pattern. However, models using these two other methodsproduce results that are qualitatively similar.

USING NONFINANCIAL MEASURES TO ASSESS FRAUD RISK 1155
T A B L E 3Descriptive Statistics and Comparison of Means for Fraud and Control Samples (H1 Testing)
Variable Mean Difference Median Std DevCAPACITY DIFF Fraud = F 0.30 0.28 0.48
No Fraud = NF 0.11 0.19∗∗ 0.09 0.41EMPLOYEE DIFF F 0.20 0.14 0.40
NF 0.04 0.16∗∗∗ 0.03 0.29FINANCING F 0.12 0.00 0.33
NF 0.02 0.10∗ 0.00 0.14LEVERAGE F 0.43 0.33 0.48
NF 0.28 0.16∗∗ 0.22 0.25ALTMAN’S Z SCORE F 4.60 3.30 3.79
NF 7.09 −2.49 4.22 9.69MARKET VALUE OF EQUITY (000s) F 4,131.55 561.18 6,445.41
NF 7,535.91 −3,404.36∗∗ 2,907.94 8,250.87BOOK TO MARKET F 0.50 0.42 0.44
NF 0.50 0.00 0.38 0.44EARNINGS TO PRICE F 0.001 0.03 0.13
NF 0.002 −0.001 0.04 0.20RETURN ON ASSETS F 0.03 0.05 0.18
NF 0.07 −0.04 0.06 0.09AGE OF FIRM F 13.46 7.50 13.79
NF 22.02 −8.56∗∗∗ 15.50 17.82M&A IN YEAR OF FRAUD F 0.28 0.00 0.45
NF 0.12 0.16∗∗ 0.00 0.33BIG FOUR F 0.90 1.00 0.30
NF 0.90 0.00 1.00 0.30INSIDERS ON BOARD F 0.36 0.35 0.16
NF 0.30 0.06 0.00 0.24CEO = COB F 0.74 1.00 0.44
NF 0.70 0.04 0.00 0.47TOTAL ACCRUALS F 0.07 0.04 0.22
NF 0.00 0.07∗ 0.00 0.11SPECIAL ITEMS F 0.54 1.00 0.50
NF 0.48 0.06 0.00 0.50REVENUE GROWTH F 0.55 0.35 0.92
NF 0.27 0.28∗ 0.12 0.55TOTAL ASSETS (000s) F 5,247.90 426.14 12,577.53
NF 13,844.89 −8,596.99 1,650.05 35,970.57NEGATIVE CHANGE IN NFM F 0.24 0.00 0.43
NF 0.34 −0.10 0.00 0.48FRAUD SIZE / REVENUE F 0.11 0.05 0.18
All variables are defined as follows: t = year of the fraud. CAPACITY DIFFt = REVENUE GROWTH − NFM GROWTH .REVENUE GROWTH = ((Revenue t − Revenue t −1)/Revenue t −1) and NFM GROWTH = ((NFMt − NFMt −1)/NFMt −1). NFMis nonfinancial measure. If a firm has more than one capacity NFM , then we use the average NFM GROWTH to calculateCAPACITY DIFF. EMPLOYEE DIFF = REVENUE GROWTH − EMPLOYEE GROWTH. EMPLOYEE GROWTH = (Employees t− Employees t −1)/Employees t −1. FINANCING = An indicator variable coded 1 if the firm’s FREECASH is less than −0.5and coded 0 otherwise. FREECASHt = (Cash Flow from Operations t − Average Capital Expenditures t −3 to t−1)/CurrentAssets t −1. LEVERAGE = (Short-Term Debt t + Long-Term Debt t ) / Total Assets t . ALTMAN’S Z SCORE = 1.2X 1 + 1.4X 2+ 3.3X 3 + 0.6X 4 + 1.0X 5. X 1 = (Current Assets t − Current Liabilities t )/Total Assets t . X 2 = Retained Earnings t /TotalAssets t . X 3 = Earnings before interest and taxes t /Total Assets t . X 4 = Market Value of Equity t /Book Value of TotalLiabilities t . X 5 = Revenue t /Total Assets t . MARKET VALUE OF EQUITY = End-of-Year Share Price t × Total CommonShares Outstanding t . BOOK TO MARKET = (Total Assets t − Total Liabilities t )/Market Value of Equity t . EARNINGS TOPRICE = Net income (Compustat #18) per share/End-of-Year Share Price t . RETURN ON ASSETS = Net Income beforeextraordinary items t /Total Assets t −1. AGE OF FIRM = The length of time in years the firm has been publicly traded (from theCenter for Research in Security Prices). M&A IN YEAR OF FRAUD = An indicator variable set equal to 1 if the firm had anacquisition that contributed to sales in the prior year (acquisition in the first year of fraud for fraud firms). (Variable set equalto 1 if Compustat data #249 > 0, otherwise variable is set to 0.) BIG FOUR = An indicator variable set equal to 1 if the firm hada Big Four auditor during the year of the fraud and set to 0 otherwise. INSIDERS ON BOARD = The percentage of insiders(company employees) on the board of directors. CEO = COB = An indicator variable coded 1 if the firm’s CEO was also chairmanof the board and coded 0 otherwise. TOTAL ASSETS = Total Assets t . ACCRUALS = (Net Income before extraordinary items t+ Depreciation t − Cash Flow from Operations t ) / Total Assets t . SPECIAL ITEMS = An indicator variable set equal to 1 if thefirm reported a special item (Compustat #17) and set equal to 0 otherwise. REVENUE GROWTH = (Sales t − Sales t −1)/Sales t −1.NEGATIVE CHANGE IN NFM = An indicator variable set equal to 1 if the firm had a negative change in NFM , otherwise variable isset to 0. FRAUD SIZE/REVENUE = the size of the earnings restatement as a percentage of revenue after the fraud was discovered.All control variables are winzorized at the 99th and 1st percentile.
Significance levels: ∗∗∗ < 0.01, ∗∗ < 0.05, ∗ < 0.1.

1156 J. F. BRAZEL, K. L. JONES, AND M. F. ZIMBELMAN
On average, the fraud firms are smaller and have a smaller return onassets than nonfraud firms; however, the differences in means for TOTALASSETS and RETURN ON ASSETS were not significant. Several control vari-ables are significantly different between the two groups, including controlvariables from two of the three fraud factors: incentive (FINANCING, LEVER-AGE, MARKET VALUE OF EQUITY, AGE OF FIRM, M&A IN YEAR OF FRAUD)and suspicious accounting (TOTAL ACCRUALS, REVENUE GROWTH ). Theaverage earnings manipulation for the fraud firms equals 11% of totalrevenue.
4.2 TESTS OF HYPOTHESES
H1 predicts a greater difference between revenue growth and NFMgrowth (CAPACITY DIFF ) for the fraud sample than for the nonfraud sam-ple. The results in table 3 support H1 as CAPACITY DIFF is significantlygreater (p < 0.05) for the fraud sample relative to the sample of nonfraudcompetitor firms.15 Thus, for fraud firms, there appears to be a greaterinconsistency between the performance portrayed by their financial state-ments and that portrayed by their NFMs. For their competitors we observea mean CAPACITY DIFF of 0.11. For nonfraud competitors, revenue ap-pears to grow faster than their NFMs, but the percentage difference appearsreasonable given the expected noise between financial statement data andNFMs. However, for the fraud firms, we observe a much larger mean CAPAC-ITY DIFF of 0.30. A greater CAPACITY DIFF may therefore be indicative ofgreater fraud risk. For auditors, investors, regulators, or other parties exam-ining CAPACITY DIFF in future applications, our descriptive results providea benchmark for a reasonable CAPACITY DIFF (0.11) and what might beconsidered unreasonable (0.30), and would therefore require investigation.
The results are stronger for EMPLOYEE DIFF (p < 0.01), which providesslightly less variance than CAPACITY DIFF , as evidenced by smaller standarddeviations. While CAPACITY DIFF represents the change in revenue lessthe average change of multiple, industry-specific NFMs, EMPLOYEE DIFFrepresents the change in revenue less the change in one consistent NFM.It is interesting to note the close relationship between revenue growth andemployee growth for nonfraud firms (mean EMPLOYEE DIFF = 0.04). Assuch, H1 is also supported with EMPLOYEE DIFF .
Table 4 provides a correlation matrix that shows NFM GROWTH andEMPLOYEE GROWTH are significantly correlated with REVENUE GROWTH(at 61% and 62%, respectively). This provides support for using NFMs asa benchmark for revenue growth. These correlations exist despite the factthat half of the firms in the sample committed revenue fraud (i.e., rev-enue growth is likely to be materially misstated for fraud firms). It is likelythat the strong relation between NFMs and revenue for nonfraud firmsis driving this correlation. Our tests of H1 support this premise. As ex-pected, our variables of interest, CAPACITY DIFF and EMPLOYEE DIFF , are
15 Our tests of hypotheses are one-tailed. All other tests are two-tailed.

USING NONFINANCIAL MEASURES TO ASSESS FRAUD RISK 1157
TA
BL
E4
Cor
rela
tion
Mat
rix
1.2.
3.4.
5.6.
7.8.
9.10
.11
.12
.13
.14
.15
.16
.17
.18
.19
.20
.C
DIF
FE
DIF
FFI
NL
EV
ALT
ZM
VE
BM
EP
RO
AA
GE
M&
AB
IG4
INSI
DC
EO
AC
CSP
EC
RE
VG
ASS
TN
EG
CN
FMG
1C
APA
CIT
YD
IFF
12
EMPL
OYE
ED
IFF
0.50
∗∗∗
13
FIN
AN
CIN
G0.
010.
011
4L
EVER
AG
E0.
20∗∗
0.08
0.21
∗∗∗
15
ALT
MA
N’S
ZSC
OR
E0.
040.
03−0
.02
−0.2
1∗∗∗
1
6M
VE−0
.02
0.01
−0.1
5∗∗−0
.05
0.16
∗∗1
7B
OO
KT
OM
AR
KET
0.02
−0.0
5−0
.01
−0.1
2∗−0
.32∗∗
∗−0
.14∗∗
1
8EA
RN
ING
ST
OPR
ICE
−0.0
40.
06−0
.11
0.08
0.30
∗∗∗
0.29
∗∗∗
−0.5
6∗∗∗
1
9R
ETU
RN
ON
ASS
ETS
0.14
0.13
∗∗−0
.43∗∗
∗−0
.04
0.42
∗∗∗
0.12
∗−0
.35∗∗
∗0.
48∗∗
∗1
10A
GE
OF
FIR
M−0
.13
−0.0
2−0
.22∗∗
∗0.
00−0
.10
0.47
∗∗∗
0.00
0.21
∗∗∗
0.12
∗1
11M
&A
0.30
∗∗∗
0.04
0.10
0.13
∗∗0.
080.
01−0
.05
−0.0
4−0
.08
−0.1
5∗∗1
12B
IGFO
UR
−0.0
2−0
.13∗∗
−0.1
5∗∗−0
.15∗∗
0.05
0.20
∗∗∗
0.00
−0.0
1−0
.03
0.19
∗∗∗
0.00
113
INSI
DER
SO
NB
OA
RD
0.06
0.06
0.05
0.11
0.00
−0.2
4∗∗−0
.09
−0.1
6−0
.06
−0.4
3∗∗∗
0.09
−0.2
8∗∗∗
1
14C
EO=C
OB
−0.0
7−0
.07
0.01
−0.0
50.
140.
15−0
.16
0.27
∗∗∗
0.17
∗0.
17∗
−0.0
3−0
.04
−0.0
91
15T
OTA
LA
CC
RU
AL
S0.
090.
23∗∗
∗0.
20∗∗
∗0.
22∗∗
∗0.
23∗∗
∗−0
.14∗∗
−0.3
5∗∗∗
0.33
∗∗∗
0.44
∗∗∗
−0.0
9−0
.07
−0.2
0∗∗∗
0.20
∗∗0.
131
16SP
ECIA
LIT
EMS
0.10
−0.0
5−0
.14∗∗
−0.0
3−0
.09
0.06
0.06
−0.0
8−0
.14∗∗
0.08
0.16
∗∗0.
11∗
−0.1
2−0
.04
−0.2
0∗∗∗
117
REV
ENU
EG
RO
WT
H0.
56∗∗
∗0.
59∗∗
∗0.
12∗
0.22
∗∗∗
0.13
∗−0
.09
−0.1
2∗0.
050.
09−0
.13∗∗
0.17
∗∗∗
−0.2
5∗∗∗
0.15
−0.1
60.
34∗∗
∗−0
.01
1
18T
OTA
LA
SSET
S−0
.11
−0.0
3−0
.07
0.04
−0.0
10.
54∗∗
∗0.
090.
12∗
0.02
0.33
∗∗∗
−0.0
10.
10−0
.17∗
−0.0
2−0
.06
0.07
−0.0
61
19N
EGC
HA
NG
EIN
NFM
0.16
−0.0
30.
16−0
.01
0.04
0.02
0.08
−0.0
9−0
.04
0.04
−0.0
4−0
.01
−0.0
6−0
.01
−0.0
7−0
.08
−0.1
1−0
.04
1
20N
FMG
RO
WT
H−0
.21∗∗
0.12
0.10
0.35
∗∗∗
−0.0
5−0
.12
−0.1
0−0
.02
−0.0
2−0
.01
−0.0
1−0
.23∗∗
0.14
−0.1
50.
35∗∗
∗−0
.16∗
0.61
∗∗∗
−0.0
4−0
.24∗∗
121
EMPL
OYE
EG
RO
WT
H0.
37∗∗
∗−0
.05
0.22
∗∗∗
0.30
∗∗∗
0.33
∗∗∗
−0.0
9−0
.18∗∗
0.04
0.07
−0.1
9∗∗∗
0.27
∗∗∗
−0.1
6∗∗0.
09−0
.14
0.24
∗∗∗
−0.0
40.
62∗∗
∗−0
.09
−0.2
2∗0.
41∗∗
∗
Vari
able
sde
fin
edin
tabl
e3
exce
ptfo
rN
FMG
RO
WT
Han
dEM
PLO
YEE
GR
OW
TH
.N
FMG
RO
WT
H=
(NFM
t−
NFM
t−1)/
NFM
t−1.
EMPL
OYE
EG
RO
WT
H=
(Em
ploy
ees t
−E
mpl
oyee
s t−1
)/E
mpl
oyee
s t−1
.Si
gnifi
can
cele
vels
:∗∗∗
<0.
01,∗∗
<0.
05,∗
<0.
1.
1158 J. F. BRAZEL, K. L. JONES, AND M. F. ZIMBELMAN
highly correlated with REVENUE GROWTH (at 56% and 59%, respectively).This correlation is expected because both DIFF variables are a function ofREVENUE GROWTH (e.g., CAPACITY DIFF = REVENUE GROWTH – NFMGROWTH ).16
Table 5 presents the results of a multivariate logistic regression for CA-PACITY DIFF and our control variables on P(FRAUD). H2 is supported by apositive and significant coefficient (p = 0.04) for CAPACITY DIFF . The ad-dition of CAPACITY DIFF improves the fit of the model—the max rescaledR2 improves from 0.36 to 0.39 and the likelihood ratio improves from 31 to34.2. A likelihood ratio test shows this improvement is statistically significant(p < 0.10). Interestingly, CAPACITY DIFF is significant despite the inclusionof M&A IN YEAR OF FRAUD, TOTAL ACCRUALS, and REVENUE GROWTHin our regression model. All three of these control variables can be consid-ered indicators of firm growth. Thus, the positive and significant coefficientfor CAPACITY DIFF suggests that the large CAPACITY DIFF for fraud firmspresented in table 4 is not simply a function of fraud firms being high-growthfirms. Our results indicate that comparing revenue growth to NFM growthprovides additional information about the likelihood of fraudulent report-ing not contained in variables identified in prior research, which supportsH2.
Table 6 presents the results of a multivariate logistic regression for EM-PLOYEE DIFF and our control variables on P(FRAUD). H2 is further sup-ported by a positive and significant coefficient (p < 0.01) for EMPLOYEEDIFF . The addition of EMPLOYEE DIFF improves the fit of the model—themax rescaled R2 improves from 0.35 to 0.40 and the likelihood ratio im-proves from 67.6 to 77.8. A likelihood ratio test shows this improvementis statistically significant (p < 0.01). These findings are consistent, and
16 The high correlation between CAPACITY DIFF and REVENUE GROWTH raises the ques-tion of multicollinearity. However, when we perform the multivariate regressions in tables 5and 6 with and without CAPACITY DIFF (and EMPLOYEE DIFF ) we find (not tabulated) thatthe coefficient on REVENUE GROWTH is not significant (p > 0.05) in either case. This is notsurprising because REVENUE GROWTH (or derivations thereon) has not traditionally beena significant variable in the multivariate settings of prior fraud research (e.g., Lee, Ingram,and Howard [1999], Summers and Sweeney [1998], Beneish [1997]). One exception is oneof the two multivariate regressions in Erickson, Hanlon, and Maydew [2006]. We also performour multivariate regressions with and without REVENUE GROWTH and find (not tabulated)that the coefficients on CAPACITY DIFF and EMPLOYEE DIFF are significant (p < 0.05) inboth cases. Additionally, for analyses in tables 5 and 6, the variance inflation factors (VIFs) forboth DIFF measures and REVENUE GROWTH are substantially below (VIFs < 3.0) the standardthreshold of 10 (e.g., Neter et al. [1996], Kennedy [1998]). Thus, multicollinearity with REV-ENUE GROWTH does not appear to be affecting the statistical significance of the coefficientson CAPACITY DIFF and EMPLOYEE DIFF . In addition, REVENUE GROWTH by itself does notappear to yield as much information as it does when anchored on NFM growth. As a practicalmatter, anchoring on NFM growth is useful to auditors (or others) because it provides auditorsa frame of reference to assess when revenue growth (which may or may not be a fraud risk)appears abnormally high.

USING NONFINANCIAL MEASURES TO ASSESS FRAUD RISK 1159
T A B L E 5Logistic Regression Comparing 50 Fraud Firms with 50 Matched Competitors (H2 Testing for
CAPACITY DIFF)
Variables Predicted Sign Parameter Estimate p-value
INTERCEPT −0.96 0.63CAPACITY DIFF + 1.43 0.04FINANCING + 0.09 0.96LEVERAGE + 1.58 0.18ALTMAN’S Z SCORE + 0.01 0.89MARKET VALUE OF EQUITY ? 0.00 0.82BOOK TO MARKET ? 0.01 0.99EARNINGS TO PRICE ? 1.40 0.44RETURN ON ASSETS ? −5.58 0.08AGE OF FIRM − −0.04 0.06M&A IN YEAR OF FRAUD + 0.76 0.35BIG FOUR − 1.37 0.16INSIDERS ON BOARD + −1.10 0.64CEO = COB + 0.57 0.47TOTAL ACCRUALS + 6.00 0.07SPECIAL ITEMS + 0.19 0.75REVENUE GROWTH + −0.36 0.60TOTAL ASSETS ? 0.00 0.73NEGATIVE CHANGE IN NFM + −0.86 0.18
Sample Size 100
This table presents the results of a logistic regression where the dependent variable is an indicatorvariable set equal to 1 for fraud firms accused of financial statement fraud and set equal to 0 otherwise.All variables are defined in table 3. Predicted signs are adopted from the prior literature on fraud (e.g.,Erickson, Hanlon, and Maydew [2006]) or posited in the paper (e.g., CAPACITY DIFF ). Our tests ofhypotheses are one-tailed. All other tests are two-tailed.
slightly better, than those presented in table 5. Using one NFM may pro-vide greater discriminatory power because some of the student-collected,capacity-related NFM data may not have been ideally suited for a comparisonwith revenue. In practice, auditors, investors, and other interested partieswould be much more familiar with specific industries and the NFMs thatdrive revenue. As such, these parties could determine whether they shoulduse multiple NFMs or concentrate their efforts on one single NFM. In sum-mary, these results provide evidence that using NFMs can improve fraud riskassessment.
4.3 ROBUSTNESS TESTS
We provide a simple robustness test that considers a dummy variable ver-sion of CAPACITY DIFF such that CAPACITY DIFF is set to 1 if REVENUEGROWTH > MEAN NFM GROWTH ; otherwise, it equals 0. This dummyvariable has a positive (2.29) and significant (p = 0.01) coefficient in ourmultivariate model and the max-rescaled R2 is 42% (not tabulated). Wealso perform this analysis with a dummy variable version of EMPLOYEE DIFF(i.e., the dummy variable equals 1 if REVENUE GROWTH > EMPLOYEEGROWTH ; otherwise, it equals 0) and find it is also positive (1.75) andsignificant (p < 0.04) and the max-rescaled R2 is 37% (not tabulated).

1160 J. F. BRAZEL, K. L. JONES, AND M. F. ZIMBELMAN
T A B L E 6Logistic Regression Comparing 110 Fraud Firms with 110 Matched Competitors (H2 Testing for
EMPLOYEE DIFF)
Variables Predicted Sign Parameter Estimate p-value
INTERCEPT −1.01 0.29EMPLOYEE DIFF + 1.92 <0.01FINANCING + −0.14 0.89LEVERAGE + 2.20 <0.01ALTMAN’S Z SCORE + 0.02 0.68MARKET VALUE OF EQUITY ? 0.00 0.51BOOK TO MARKET ? −0.38 0.27EARNINGS TO PRICE ? 0.00 0.77RETURN ON ASSETS ? −0.94 0.55AGE OF FIRM − −0.03 0.04M&A IN YEAR OF FRAUD + 1.20 0.02BIG FOUR − −0.08 0.88INSIDERS ON BOARD + 0.65 0.61CEO = COB + 0.41 0.41TOTAL ACCRUALS + 5.20 <0.01SPECIAL ITEMS + −0.13 0.71REVENUE GROWTH + −0.47 0.06TOTAL ASSETS ? 0.00 0.84NEGATIVE CHANGE IN EMPLOYEES + 0.53 0.28
Sample Size 220
This table presents the results of a logistic regression where the dependent variable is an indicatorvariable that is equal to 1 for fraud firms and equal to 0 otherwise. All variables are defined in table3. Predicted signs are adopted from the prior literature on fraud (e.g., Erickson, Hanlon, and Maydew[2006]) or posited in the paper (e.g., EMPLOYEE DIFF ). Our tests of hypotheses are one-tailed. All othertests are two-tailed.
We recognize the possibility that outsourcing may be more prevalent inthe fraud sample than in the control sample and, therefore, may be driv-ing our results related to EMPLOYEE DIFF . If fraud firms are more likelythan their competitors to be outsourcing during the year of the fraud, thentheir larger-than-average EMPLOYEE DIFF could be driven by a decreasein the number of people directly employed by the company rather than byan unsubstantiated revenue increase. We take several measures to controlfor this possibility. For each fraud firm and competitor in the EMPLOYEEDIFF sample, we search its 10-K for evidence of outsourcing in the year priorto the fraud and the year of the fraud.17 We find 10 instances (6 competi-tors and 4 fraud firms) where a firm appears to be outsourcing during thetwo-year period. None of the 10-Ks provide specific information about thenumber of jobs outsourced. As such, we are unable to incorporate outsourcedemployee numbers into our analyses. However, when we delete those firmsand their corresponding matched-pair from the sample, our multivariateresults are qualitatively the same as those reported in table 6 (untabulatedcoefficient = 1.93; p < 0.01). In addition, we match our fraud firms with
17 We used the following search terms: outsource, outsourcing , layoff(s), service contract(s), sub-contract(s), subcontracting , and offshore.

USING NONFINANCIAL MEASURES TO ASSESS FRAUD RISK 1161
competitors in the same industry to ensure that industry-wide differencesare most likely randomized between the fraud firms and control firms. Fi-nally, our tests using CAPACITY DIFF (where outsourcing is not an issue)are consistent with the model using EMPLOYEE DIFF , making it less likelythat outsourcing is driving the EMPLOYEE DIFF results.
5. Concluding Comments
The current regulatory environment places increased scrutiny on audi-tors’ ability to detect fraud. Additionally, SAS no. 99 (AICPA 2002) requiresauditors to document a separate fraud risk assessment for each engagement.In this study we investigate whether comparing financial data to nonfinan-cial measures (NFMs) can aid auditors and others in assessing fraud risk. Wepredict and find that fraud firms have greater differences in percent changein revenue growth and percent change in NFMs than their nonfraud com-petitors. These differences are positively associated with fraudulent financialreporting after controlling for variables that have been previously linked tofraud.
Our findings have implications for auditors, other parties interested in as-sessing fraud risk, and future research. First, the prior literature suggests thatfraud goes undetected when auditors fail to understand the environmentsin which their clients operate (Erickson, Mayhew, and Felix [2000]). Fraudrisk assessment models that incorporate NFMs should help prevent thesefailures. Substantial differences between financial statement data and NFMsshould serve as a red flag to auditors and lead them to ask pointed ques-tions of client management, corroborate and test management’s responses,and, if necessary, serve as a tipping point for assigning forensic specialists tothe engagement. Second, our study supplies empirical evidence to policy-makers who are currently considering requiring the use of NFMs in audit-ing (e.g., PCAOB [2004]). Third, our descriptive results provide auditorsand other parties (e.g., investors, directors, regulators) with benchmarksfor what might be reasonable and unreasonable inconsistencies betweenfinancial data and NFMs.
Future research questions include whether our results, using annual data,can be replicated with quarterly data. Such research would show whetherauditors could use the analysis contained herein to detect fraud prior to per-forming fiscal year-end audit procedures. Other fruitful areas of researchinclude evaluating whether the discriminatory power of our analyses couldbe improved by using more than one competitor or determining whethervalues for DIFF for nonfraud firms are consistently low. Future studies couldalso investigate if and how auditors and investors use NFMs in practice. Forexample, researchers could examine the degree to which auditors chooseto use NFMs and what mechanisms might promote their usage (e.g., higherfraud risk assessments, more explicit guidance, and greater industry ex-pertise). Such research could also determine the extent to which NFMusage improves auditors’ performance. Researchers could also investigate

1162 J. F. BRAZEL, K. L. JONES, AND M. F. ZIMBELMAN
whether investors (e.g., short-sellers) benefit from identifying inconsisten-cies between financial measures and NFMs. Finally, exploring the ability ofspecific NFMs to measure the fraud risk construct of attitude (e.g., NFMsthat attempt to measure social or environmental performance) would alsobe interesting.
Several limitations of this study should be noted. First, it is possible thatfraud perpetrators have manipulated NFMs in the past and will manipulateNFMs in the future to make them consistent with reported financial results.Although we provide reasons why NFM manipulation may be difficult toperpetrate or conceal, we are unable to conclude that this did not occur inour sample or will not occur in the future. We are also unable to incorporatecontrols for potential NFM manipulations in our analyses. To the extentthat perpetrators have manipulated NFMs in the past, such manipulationsbias against our finding support for H1 and H2. Like any fraud research,perpetrators may change their methods in the future to avoid the latestforensic accounting tools. Future research could explicitly examine ways inwhich NFMs are manipulated and the likely forms of these manipulations.
Second, because of the issue of NFM manipulation, those who chooseto use NFMs for fraud risk assessment would be wise to complement firm-provided NFMs in the 10-K with NFMs from independent sources (e.g.,customer satisfaction and product quality ratings). In general, the studentsthat collected the NFMs for this study did not collect NFMs from indepen-dent sources. This was primarily due to the fact that, from 2005 to 2007,these students were collecting NFMs for frauds that occurred mostly in the1990s (see table 1, panel C). Thus, online access to older, independent NFMdata was not readily available to the students. A question for future researchis whether such contemporaneous, independent NFMs can be used by in-terested parties to perform the analyses described in this paper.
Third, because the availability of NFMs varies by firm, users of NFMs mayneed to develop different approaches for using NFMs to detect fraud. Forexample, if contemporaneous competitor NFM data is not available, an au-ditor or investor may need to analyze fluctuations in DIFF measures overtime for a particular company. An audit firm could develop a database ofcontemporaneous NFM data from its portfolio of clients. Hoitash, Kogan,and Vasarhelyi [2006] find that audit firms do this with industry financialdata. Websites that promote investor protection could automate the calcula-tion of DIFF measures through the use of webscraping software. Also, thosewho combine or standardize different forms of NFMs to create one CAPAC-ITY DIFF measure will need to make certain that each of the NFMs used isan accurate predictor of revenue growth and is measured on the same scale(e.g., levels, changes).
Fourth, we recognize that it is difficult to determine if the change in ourNFMs should lead, lag, or mirror changes in revenue. For example, does anincrease in employees lead to an increase in revenue in the same year or infuture years? It should be noted that we find the highest R2 when we regresscurrent revenue on current employee levels (versus prior year or next year

USING NONFINANCIAL MEASURES TO ASSESS FRAUD RISK 1163
employee levels). However, that may not be the case for all NFM measures.We hope that future research in this area will provide more insight into thetime frame for effectively using NFMs to verify financial data. Finally, ourfindings are limited in that we examine only revenue frauds. Future studiescould examine other fraud schemes (e.g. expense frauds) and determinespecific NFMs that might be useful in their detection.
REFERENCES
ABBOTT, L.; Y. PARK; AND S. PARKER. “The Effects of Audit Committee Activity and Independenceon Corporate Fraud.” Managerial Finance 26 (2000): 55–67.
ALBRECHT, W.; G. WERNZ; AND T. WILLIAMS. Fraud: Bringing Light to the Dark Side of Business. NewYork: McGraw-Hill, 1995.
ALBRECHT, W. S.; C. C. ALBRECHT; C. O. ALBRECHT; AND M. F. ZIMBELMAN. Fraud Examination.Mason, Ohio: Thompson-Southwestern, 2008.
AMERICAN INSTITUTE OF CERTIFIED PUBLIC ACCOUNTANTS (AICPA). Analytical Procedures. State-ment on Auditing Standards No. 56. New York: AICPA, 1988.
AMERICAN INSTITUTE OF CERTIFIED PUBLIC ACCOUNTANTS (AICPA). Consideration of Fraud in aFinancial Statement Audit. Statement on Auditing Standards No. 99. New York: AICPA, 2002.
AMIR, E., AND B. LEV. “Value-Relevance of Nonfinancial Information: The Wireless Communi-cations Industry.” Journal of Accounting and Economics 22 (Supplement 1996): 3–30.
ANDERSON, U., AND L. KOONCE. “Explanation as a Method for Evaluating Client-SuggestedCauses in Analytical Procedures.” Auditing, A Journal of Practice and Theory 14 (1995): 124–32.
BALLOU, B.; D. HEITGER; AND C. LANDES. “The Future of Corporate Sustainability Reporting.”Journal of Accountancy 202 (2006): 65–74.
BEASLEY, M. “An Empirical Analysis of the Relation between Board of Director Compositionand Financial Statement Fraud.” The Accounting Review 71 (1996): 443–65.
BEASLEY, M.; J. CARCELLO; AND D. HERMANSON. Fraudulent Financial Reporting: 1987–1997, AnAnalysis of U.S. Public Companies. Committee of Sponsoring Organizations of the TreadwayCommission, 1999.
BEASLEY, M.; J. CARCELLO; D. HERMANSON; AND P. LAPIDES. “Fraudulent Financial Reporting:Consideration of Industry Traits and Corporate Governance Mechanisms.” Accounting Hori-zons 14 (2000): 441–54.
BEGLEY, J.; J. MING; AND S. WATTS. “Bankruptcy Classification Errors in the 1980s: An EmpiricalAnalysis of Altman’s and Ohlson’s Models.” Review of Accounting Studies 1 (1996): 267–84.
BEHN, B., AND R. RILEY. “Using Nonfinancial Information to Predict Financial Performance:The Case of the U.S. Airline Industry.” Journal of Accounting, Auditing & Finance 14 (1999):29–56.
BELL, T. B., AND J. V. CARCELLO. “A Decision Aid for Assessing the Likelihood of FraudulentFinancial Reporting.” Auditing: A Journal of Practice & Theory 19 (2000): 169–84.
BELL, T. B.; M. PEECHER; AND I. SOLOMON. The 21st Century Public-Company Audit: ConceptualElements of KPMG’s Global Audit Methodology. Montvale, NJ: KPMG, 2005.
BENEISH, M. “Detecting GAAP Violations: Implications for Assessing Earnings Managementamong Firms with Extreme Financial Performance.” Journal of Accounting and Public Policy 16(1997): 271–309.
BENEISH, M. “The Detection of Earnings Manipulation.” Financial Analysts’ Journal 55 (1999):24–36.
BERENSON, A. The Number: How the Drive for Quarterly Earnings Corrupted Wall Street. New York:Random House, 2003.
BIERSTAKER, J.; J. BEDARD; AND S. BIGGS. “The Role of Problem Representation Shifts in AuditorDecision Processes in Analytical Procedures.” Auditing: A Journal of Practice & Theory 18(1999): 19–36.

1164 J. F. BRAZEL, K. L. JONES, AND M. F. ZIMBELMAN
BRAZEL, J. F.; C. P. AGOGLIA; AND R. C. HATFIELD. “Electronic versus Face-to-Face Review: TheEffects of Alternative Forms of Review on Auditors’ Performance.” The Accounting Review 79(2004): 949–66.
CAREY, J.; C. PALMERI; AND S. REED. “Shell: The Case of the Missing Oil.” Business Week (January26, 2004).
CHENG, C.; W. HOPWOOD; AND J. MCKEOWN. “Non-linearity and Specification Problems inUnexpected Earnings Response Regression Model.” The Accounting Review 67 (1992): 579–98.
DECHOW, P. M.; R. G. SLOAN; AND A. P. SWEENEY. “Causes and Consequences of EarningsManipulation: An Analysis of Firms Subject to Enforcement Actions by the SEC.” ContemporaryAccounting Research 13 (1996): 1–36.
DELOITTE LLP. In the Dark: What Boards and Executives Don’t Know about the Health of TheirBusinesses. New York: Deloitte LLP, 2004.
ERICKSON, M.; M. HANLON; AND E. L. MAYDEW. “Is There a Link between Executive EquityIncentives and Accounting Fraud?” Journal of Accounting Research 44 (2006): 113–43.
ERICKSON, M.; B. MAYHEW; AND W. FELIX. “Why Do Audits Fail? Evidence from Lincoln Savingsand Loan.” Journal of Accounting Research 38 (2000): 165–94.
ERICKSON, M., AND S. WANG. “Earnings Management by Acquiring Firms in Stock for StockMergers.” Journal of Accounting and Economics 27 (1999): 149–76.
FARBER, D. “Restoring Trust after Fraud: Does Corporate Governance Matter?” The AccountingReview 80 (2005): 539–61.
FEROZ, E. H.; K. PARK; AND V. S. PASTENA. “The Financial and Market Effects of the SEC’sAccounting and Enforcement Releases.” Journal of Accounting Research 29 (Supplement 1991):107–42.
FLORIDA TIMES-UNION. “Defense Expert: Healthsouth Fraud Too Complex for Detec-tion.” Jacksonville.com (May 6, 2005). Web site, http://jacksonville.com/apnews/stories/050605/D89TR5P01.shtml (accessed August 13, 2009).
GLOVER, S. M.; D. F. PRAWITT; J. J. SCHULTZ, JR.; AND M.F. ZIMBELMAN. “A Test of Changes inAuditors’ Fraud-Related Planning Judgments since the Issuance of SAS No. 82.” Auditing: AJournal of Practice and Theory 22 (2003): 237–52.
HIRST, D. E., AND L. KOONCE. “Audit Analytical Procedures: A Field Investigation.” ContemporaryAccounting Research 13 (1996): 457–86.
HOGAN, C. E.; Z. REZAEE; R. A. RILEY; AND U. VELURY. “Financial Statement Fraud: Insightsfrom the Academic Literature.” Auditing: A Journal of Practice and Theory 27 (2008).
HOITASH, R.; A. KOGAN; AND M. VASARHELYI. “Peer-Based Approach for Analytical Procedures.”Auditing: A Journal of Practice and Theory 25 (2006): 53–84.
HOLDER-WEBB, L.; J. COHEN; L. NATH; AND D. WOOD. “A Survey of Governance Disclosuresamong U.S. Firms.” Journal of Business Ethics 83 (2008).
HOLDER-WEBB, L.; J. COHEN; L. NATH; AND D. WOOD. “The Supply of Corporate Social Respon-sibility Disclosure among U.S. Firms.” Journal of Business Ethics 84 (2009).
HOUSTON, R. W. “The Effects of Fee Pressure and Client Risk on Audit Seniors’ Time BudgetDecisions.” Auditing: A Journal of Practice and Theory 18 (1999): 70–86.
IRELAND, J., AND C. LENNOX. “The Large Audit Fee Premium: A Case of Selectivity Bias.” Journalof Accounting, Auditing and Finance 17 (2002): 73–91.
ITTNER, C., AND D. LARCKER. “Are Nonfinancial Measures Leading Indicators of FinancialPerformance? An Analysis of Customer Satisfaction.” Journal of Accounting Research 36 (Sup-plement 1998): 1–35.
KAMINSKI, K. A., AND T. S. WETZEL. “Financial Ratios and Fraud: An Exploratory Study UsingChaos Theory.” Journal of Forensic Accounting 5 (2004): 147–72.
KANE, G., AND N. MEADE. “Ratio Analysis Using Rank Transformation.” Review of QuantitativeFinance and Accounting 10 (1998): 59–74.
KAPLAN, R., AND D. NORTON. The Balanced Scorecard. Boston, MA: Harvard Business SchoolPress, 1996.
KENNEDY, P. A Guide to Econometrics. Cambridge, MA: MIT Press, 1998.LANGFIELD-SMITH, K. Management Accounting , Third edition. New York: McGraw-Hill, 2003.

USING NONFINANCIAL MEASURES TO ASSESS FRAUD RISK 1165
LEE, T. A.; R. W. INGRAM; AND T. P. HOWARD. “The Difference between Earnings and OperatingCash Flow as an Indicator of Financial Reporting Fraud.” Contemporary Accounting Research16 (1999): 749–86.
LEVITT, S. D., AND S. J. DUBNER. Freakonomics: A Rogue Economist Explores the Hidden Side ofEverything . New York: HarperCollins, 2005.
LIEDTKA, S. “The Information Content of Nonfinancial Measures in the Airline Industry.”Journal of Business Finance & Accounting 29 (2002): 1105–21.
LOEBBECKE, J. K.; M. M. EINING; AND J. J. WILLINGHAM. “Auditors’ Experience with MaterialIrregularities: Frequency, Nature, and Detectability.” Auditing: A Journal of Practice and Theory9 (1989): 1–28.
LOUIS, H. “Earnings Management and the Market Performance of Acquiring Firms.” Journal ofFinancial Economics 74 (2004): 121–48.
LUNDEGAARD, K. “Delphi Discloses Accounting Problems.” Wall Street Journal (March 7, 2005).LUNDHOLM, R., AND S. MCVAY. “Forecasting Sales: A Model and Some Evidence from the Retail
Industry.” Working paper, University of Michigan, 2008.MARQUARDT, C., AND C. WIEDMAN. “How Are Earnings Managed? An Examination of Specific
Accruals.” Contemporary Accounting Research 21 (2004): 461–89.MCVAY, S. “Earnings Management Using Classification Shifting: An Examination of Core and
Special Items.” The Accounting Review 81 (2006): 501–31.MESSIER, W.; S. GLOVER; AND D. PRAWITT. Auditing and Assurance Services: A Systematic Approach,
Fourth edition. New York: McGraw-Hill Irwin, 2006.NETER, J.; M. H. KUTNER; C. J. NACHTSHEIM; AND W. WASSERMAN. Applied Linear Statistical Models,
Fourth edition. New York: McGraw-Hill, 1996.NEW YORK TIMES (NYT). “For WorldCom, Acquisitions Were Behind Its Rise and Fall.”
(August 8, 2002). Web site, http://www.nytimes.com/2002/08/08/business/for-worldcom-acquisitions-were-behind-its-rise-and-fall.html.
NIESCHWEITZ, R.; J. J. SCHULTZ, JR.; AND M. ZIMBELMAN. “Empirical Research on External Au-ditors’ Detection of Financial Statement Fraud.” Journal of Accounting Literature 19 (2000):190–246.
PALMROSE, Z. “An Analysis of Auditor Litigation and Audit Service Quality.” The AccountingReview 63 (1988): 55–73.
PINCUS, K.; W. HOLDER; AND T. MOCK. Reducing the Incidence of Fraudulent Financial Reporting: TheRole of the Securities and Exchange Commission. Los Angeles: SEC Financial Reporting Instituteof the University of California, 1987.
PUBLIC COMPANY ACCOUNTING OVERSIGHT BOARD (PCAOB). PCAOB Standing AdvisoryGroup Meeting: Meeting Agenda (September 8–9, 2004). Web site, http://pcaobus.org/News and Events/Events/2004/09-08-09.aspx.
PUBLIC COMPANY ACCOUNTING OVERSIGHT BOARD (PCAOB). Observations on Auditors’ Im-plementation of PCAOB Standards Relating to Auditors’ Responsibilities with Respect toFraud. 2007. Web site, http://pcaob.org/inspections/other/01-22 release 2007-001.pdf.
PUBLIC OVERSIGHT BOARD (POB). The Panel on Audit Effectiveness: Report and Recommendations.Stamford, CT: POB, 2000.
RICHARDSON, S.; I. TUNA; AND M. WU. “Predicting Earnings Management: The Case of EarningsRestatements.” Working paper, University of Pennsylvania, 2007.
RILEY, R. A.; T. PREASON; AND G. TROMPETER. “The Value Relevance of Non-Financial Perfor-mance Variables: The Case Of The Airline Industry.” Journal of Accounting and Public Policy22 (2003): 231–54.
RUBIN, D. Multiple Imputation for Nonresponse in Surveys. New York: John Wiley & Sons Inc,1987.
SCHAFER, J. Analysis of Incomplete Multivariate Data. New York: Chapman and Hall, 1997.SECURITY AND EXCHANGE COMMISSION (SEC). Accounting and Auditing Enforcement Release
No. 1440, 2001. Web site, http://www.sec.gov/litigation/litreleases/lr17118.htm.SECURITY AND EXCHANGE COMMISSION (SEC). Accounting and Auditing Enforcement Release
No. 1930, 2003. Web site, http://www.sec.gov/litigation/admin/34-48962.htm.

1166 J. F. BRAZEL, K. L. JONES, AND M. F. ZIMBELMAN
SECURITY AND EXCHANGE COMMISSION (SEC). Accounting and Auditing Enforcement ReleaseNo. 2027, 2004a. Web site, http://www.sec.gov/litigation/litreleases/lr18732.htm.
SECURITY AND EXCHANGE COMMISSION (SEC). Accounting and Auditing Enforcement ReleaseNo. 1741, 2004b. Web site, http://www.sec.gov/litigation/litreleases/lr18037.htm.
SUMMERS, S. L., AND J. T. SWEENEY. “Fraudulent Misstated Financial Statements and InsiderTrading: An Empirical Analysis.” The Accounting Review 73 (1998): 131–46.
TEOH, S. H., AND T. J. WONG. “Perceived Auditor Quality and the Earnings Response Coeffi-cient.” The Accounting Review 68 (1993): 346–66.
TIMES NEWSPAPERS, LTD. “Shell Settles Oil Reserve Action with $80m Payout.” TimesOnline (March 7, 2008). Web site, http://business.timesonline.co.uk/tol/business/industry sectors/natural resources/article3499000.ece (accessed August 13, 2009).
WALL STREET JOURNAL (WSJ). “Cerner’s Growth Has Been Healthy, But Its Ac-counting Could Be Ailing.” (December 14, 2005a). Web site, http://interactivo.wsj.com/article/SB113452929283022042.html.
WALL STREET JOURNAL (WSJ). “To Err Is Human, to Restate Financials, Divine: Companies RedoReports in Record Numbers, Partly Due to Sarbanes-Oxley.” (January 20, 2005b): C3.
WRIGHT, A. M. “The Impact of Prior Year Workpapers on Auditor Evidential Planning Judg-ments.” Accounting, Organizations, and Society 13 (1988): 595–606.
YUAN, Y. C. Multiple Imputation for Missing Data: Concepts and New Development. Rockville, MD:SAS Institute, 2007.
ZIMBELMAN, M. F. “The Effects of SAS No. 82 on Auditors’ Attention to Fraud Risk Factors andAudit Planning Decisions.” Journal of Accounting Research 35 (Supplement 1997): 75–97.