unsupervised learning framework for customer requisition
TRANSCRIPT
Modern Applied Science; Vol. 11, No. 9; 2017 ISSN 1913-1844 E-ISSN 1913-1852
Published by Canadian Center of Science and Education
151
Unsupervised Learning Framework for Customer Requisition and Behavioral Pattern Classification
Udoinyang G. Inyang1, Okure O. Obot1, Moses E. Ekpenyong1 & Aliu M. Bolanle1 1 Department of Computer Science, University of Uyo, Akwa Ibom State, Nigeria Correspondence: Moses E. Ekpenyong, Department of Computer Science, University of Uyo, P.M.B. 1017, 520003, Uyo, Akwa Ibom State, Nigeria. E-mail: [email protected]; [email protected] Received: August 8, 2017 Accepted: August 17, 2017 Online Published: August 30, 2017 doi:10.5539/mas.v11n9p151 URL: https://doi.org/10.5539/mas.v11n9p151 Abstract Maintaining healthy organization-customers relationship has positive influence on customers’ behavioral tendencies as regards preference to products and services, buying behavior, loyalty, satisfaction, and so on. To achieve this, an in-depth analysis of customers’ characteristics and purchasing behavioral trend is required. This paper proposes a hybrid unsupervised learning framework consisting of k-means algorithm and self-organizing maps (SOMs) for customer segmentation and behavior analysis. K-means algorithm was used to partition the entire input space of customers’ transaction dataset into 3 and 4 disjoint segments based on customers’ frequency (F) and monetary value (MV). SOM provided visualization of the underlying clusters and discovered customers’ relationships in the dataset. Interaction of F and MV clusters resulted in 12 sub-clusters. An in-depth analysis of each sub-cluster was also performed and appropriate customer relationship management (CRM) strategies established for each sub-cluster. Discovered knowledge will guide effective allocation of resources to each customer cluster and other organizational decision support functions much required by CRM systems. Keywords: customer relationship, data mining, k-means, pattern recognition, self organizing map 1. Introduction Customer Relationship Management (CRM) is at the core of any organization’s business strategy. It describes the process of acquiring, retaining and cooperating with selected consumers to create superior value for the organization and customers. CRM involves the cross-functional integration of processes, people, services, operations and marketing capabilities, enabled through information technology (IT) and applications. Customer acquisition targets prospective customers or the most profitable ones, and includes for instance, churned customers – those lost to competition and the possibility of winning them back. Improving customer retention is therefore important in CRM implementations (Mehregan and Samizadeh, 2012; Buttle and S. Maklan, 2014). The fundamental purpose of focusing CRM efforts on customers’ retention is to ensure that the organization maintains relationship with value-adding customers. CRM functions basically include, operational, analytical and collaborative CRMs (Jelonek, 2006). Operational CRM involves aspects where contacts are made with the customers and aims at harnessing IT techniques and resources for organizational business decision support. Analytical CRM concentrates on an in-depth study of customers’ characteristics and purchasing behavioral patterns. Collaborative CRM guarantees that customer related information/knowledge acquired and stored within the organization are available to every unit/department of the organization. Innovative companies and sectors have therefore found CRM useful in addressing and improving their interaction with customers. They achieve these by exploiting the four major dimensions of CRM: identification, attraction, retention and satisfaction (Kazemi, Babaei and Javad, 2015). Investing in customers satisfaction – developing skills and methodologies to identify the needs and expectations of customers, and strengthening customers relationship – by providing them with more and more benefits, are key indicators to gaining competitive advantage in the market. The outcome is the generation of huge revenue and return on investments. CRM systems have evolved from classical solutions – through electronic-CRM (e-CRM), to social-CRM (s-CRM). Enterprises have also developed long-term relationships with customers by leveraging latest IT achievements, as the model and functionality of CRM have greatly shifted towards the use of IT and internet services. However, the popularity of the social media has provided effective support to CRM, and has made
mas.ccsenet.org Modern Applied Science Vol. 11, No. 9; 2017
152
s-CRM (the use of social media to manage and sustain efficient transaction between customers and the organization/business) a current trend for customers’ communication and information management. Customers’ behavioral pattern is a conduit towards the search, purchase, utility, evaluation and disposition of products and services aimed at satisfying customers’ specific needs. Some of the most favorable behavioral intentions include loyalty, switching, willingness to pay more, internal and external responses (Kuruuzum and Koksal, 2010). A number of studies measure behavioral intentions using positive verbal commitments, goodwill, and willingness to recommend a repurchase (Theodorakis, Koustelios, Robinson and Barlas, 2009). Consequently, customer behavior analysis includes the analysis of buying behavior, loyalty and satisfaction, and constitutes the customer’s behaviorial profile. Understanding the behavioral profile of customers creates the possibility of placing those exhibiting similar behavioral profile in the same customer segment, and the higher the knowledge about the customers’ behavioral profile, the more effective and accurate the measure (e.g., churn rate) become. From here, individual customers or customer segments can be targeted according to their specific needs and preferences, thereby achieving greater customer satisfaction which in turn decreases customers’ churn rate. In this paper, an unsupervised learning approach to customer segmentation and behavior analysis is proposed. We adopt hybridized unsupervised learning tools – k-means algorithm and self-organizing maps (SOM), in the development of a CRM framework for discovery and visualization of underlying clusters and customers’ behavioral analysis. The remainder of the paper is organized as follows. Section 2 describes the application of data mining (DM) tasks in the CRM domain with emphasis on clustering. A review of related literation is presented in section 3. The adopted methodology to customers’ segmentation is presented in Section 4, while results obtained from the segmentation experiment are discussed in Section 5, with detailed customers cluster analysis and recommended CRM strategies. Section 6 concludes the study with pointers to future research directions. 2. Data Mining Tasks and CRM The most critical aspect of customers’ behavior analysis is the identification of hidden and useful customers’ behavioral patterns. This process requires historic and transactional data. Increased business activities and competition, affordability and ever increasing reliance on IT (operational CRM) assist organizations to generate huge transaction data repositories (TDRs). Data mining (DM) enables organizations/companies to discover useful knowledge for providing customer oriented services. It exploits well-established statistical and machine learning techniques to construct models that predict customers’ behavior patterns. The application of DM techniques in CRM has assumed prominence in the industry, thereby, attracting attention of practitioners as well as academicians. Today, the knowledge discovery process constitutes automated technologies that integrates the process with commercial data warehouses, and presents the outputs in the desired format for easy comprehensibility by users. Hence, the key dimensions of CRM are supported by different DM models namely, association, segmentation, forecasting, regression, sequence discovery and visualization. DM is therefore a multidisciplinary approach that unifies several methods (statistics, mathematics and machine learning) to translate the desired knowledge into rules and models, useful for problem solving and decision making. The process of knowledge discovery begins with the acquisition of customers’ information to form a data warehouse. The data warehouse inturn provides a foundation for the customer information. DM can then be used to automate the process of knowledge discovery. Firstly, through the application of algorithms, aimed at extracting models and behavior rules from the data, and secondly, for correct interpretation and evaluation of the results. The knowledge discovery process is a repetitive and iterative process and involves sequence of stages before the knowledge is finally discovered. This process is summarized as follows:
• define and understand the application domain and desired business objectives; • create a target dataset – selection of a subset of variables and data samples to be mined; • clean and pre-process the data in order to reduce the presence of noise or outliers (as the case may be),
and select information required for model creation, decision on missing or incomplete fields as well as data history dimension;
• reduce and project the data for meaningful discovery; • deploy data mining tools and systems for classification, regression, clustering, etc.; • select the data mining tool/methods for pattern research; • mine data; • present and interpret identified models, possibly retroact at previous points for future iterations; • consolidate discovered knowledge.
mas.ccsenet.org Modern Applied Science Vol. 11, No. 9; 2017
153
Several DM techniques and tools are available in the literature (Bhatnagar, 2014), but the notable ones include visualization, neural networks, genetic algorithms, fuzzy logic, rules induction, decision trees, and clustering. However, DM techniques cannot substitute the significant role of domain experts and their business knowledge. Useful results can be gained by combining data mining techniques and business expertise. The ability of data clustering techniques to discover and reveal natural groupings of data makes it a widely used approach for customer segmentation and analysis (Yao, Sarlin, Eklund and Back, 2014). This paper adopts clustering and visualization techniques for efficient investigation of customer segmentation and target customer analysis. 2.1 SOM Clustering SOM is a fully connected single-layer linear network, where the output is generally organized in a two-dimensional arrangement of nodes. It is a popular and widely used visual clustering tool capable of performing clustering and projection simultaneously (Kohonen, 2013). SOMs have rich visualization properties required for efficient exploration and configuration of highly dimensional data. They are useful tool for dimension reduction while preserving the vital data structure patterns, relationships, trend and topology of the dataset during visualization. In addition, SOM is data driven and requires little or no a-priori knowledge about the input data and is very suitable for segmentation tasks. The SOM algorithm is outlined as follows:
• randomly initialize each weight of the neurons in the output layer; • randomly choose an input vector from the training dataset and send it to the SOM network; • for each node in the SOM, calculate the similarity between the input vector and all neurons using the
distance metric ( = − ℎ ) and find the winning neuron (ℎ ) – i.e. the neuron with the highest similarity or best match;
• update each neuron using the rule: ℎ = ℎ + (ℎ , ℎ ) − ℎ , where, is the learning rate; • repeat the above steps until a stopping criterion is met. The stopping criterion is fixed at 200 epochs in this
paper. 2.2 K-means Clustering Segmentation is achieved through the acquisition of products in right quantity and in real time – for the right customer at optimum cost. To meet these requirements, the k-means clustering technique can be applied to segment the customers for efficient forecasting and planning decisions. K-means clustering is an iterative crisp clustering technique which aims at partitioning n data points ( : = 1, 2, … , ) into k disjoint clusters ( : = 1, … , ; 2 ≤ ≤ ). The objective of k-means is to generate k cluster centers that minimize the sum of squared distances between each point and its nearest cluster center. The k-means algorithm is summarized as follows (Gayathri and Mohanavalli, 2011):
• select randomized k initial centroids (k denotes the initial number of clusters); • assign every point in the data to the closest centroid (every group of data points linked to a centroid form a
cluster). • update the centroid of each cluster based on the new cluster, and repeat this process until no further change
in cluster point is observed; • repeat the steps above until a stopping criterion is met (no further point changes in cluster assignment is
adopted as the stopping criterion in this paper) K-means represents one of the simplest but efficient (unsupervised) learning algorithms, frequently used today for the design of both academic and industrial applications. Within the domain of CRM, k-means algorithm has been applied individually or in conjunction with other tools. In (Gayathri and Mohanavalli, 2011), the accuracy and ease of estimating customers’ products (services) usage level rate of an organization via k-means have been affirmed. 3. Related Works CRM segmentation is fundamental to many organizations’ strategic marketing plan – as goods and services can no longer be produced and retailed without considering variations in the customers’ needs, wishes and preferences (Anchalia, Koundinya and Srinath, 2013). Indeed, the concept of segmentation allows for the grouping of customers according to common behavioral characteristics and needs – to obtain a homogenous response to marketing actions (Swift, 2001), at both strategic and operational levels. At the strategic level,
mas.ccsenet.org Modern Applied Science Vol. 11, No. 9; 2017
154
segmentation permits profitable customers identification, market decisions stability (considering the various market segments), and product and service delivery (placing them in the market). At the operational level, segmentation drives organizations to emphasize more on enhanced customer understanding and relationship development (McCarty and Hastak, 2007). In Swift (2001), CRM implementation can benefit the organization in several ways including reduced cost, market value stability, high customer profitability, and, increased customer retention and loyalty. The impact of CRM segmentation has become more pronounced in recent years due to the introduction of consumers and market profiling. Profiling techniques provide marketers with superior tools for customer segmentation and market adaptation strategies aimed at studying the specific needs of each consumer (McDonalds and Dunbar, 2004). Criteria relating to geographical, demographical, psycho-graphical, socio-economic, behavioral characteristics and psychological attitudes toward the respective product or service are mostly explored (Dibb and Simkin, 2010). However, the most commonly used characteristic is demographics, but demographics may not be sufficient to segment or cluster highly competitive markets. Organizations also need to consider information related to the consumers’ needs, behavior, preference and perception of product, service or payment, growth potential, migration, and churn rate – due to poor service or unavailability of product. In Arumawadu, Rathnayaka and Illangarathne (2015), a k-means clustering method was proposed to evaluate customers’ profitability in a telecomm industry in Sri Lanka. They exploited recency (recent purchase statistics), frequency and monetary measures as input to the k-means clustering and distortion curve – to identify the optimal number of initial clusters. Their results revealed the customers’ profitability were mainly categorized into three levels. The role of customer-to-customer (C2C) interaction is shaping service experience and has been recognized the literature, but empirical evidence rmains limited. Huang and Hsu (2010) examined interaction between tourists on cruise vacations and its impact on the cruise experience and vacation satisfaction. They conducted an online survey with an American online panel, and found that the quality of C2C interaction positive impacts on the cruise experience as well as indirect effects on vacation satisfaction, mediated by cruise experience. Their results call for the incorporation of C2C interaction as a component of relationship marketing theory. Recently, both supervised and unsupervised techniques have been combined to gain high classification accuracy. Unsupervised classification classicaly plays a major role in hybrid learning techniques. In Sivasankar and Vijaya (2017), various unsupervised learning techniques were comparatively studied. Algorithms such as fuzzy C-means (FCM), possibilistic fuzzy C-means (PFCM), k-means clustering (k-means) were used to group customers’ similarity patterns within a cluster for efficient customer segmentation. They divided the clusters into training and testing using Holdout method. Their results showed that, combining k-means clustering with decision tree helps to improve the result of churn prediction problem. As organizations increase their efforts to retain customers, accurate early prediction of whether a customer will churn in the foreseeable future constitute a powerful tool for any marketing team. Spanoudes and Nguyen (2017) described the application of Deep Learning in the problem of churn prediction. They abstracted feature vectors, generated from user event logs and demonstrated the intrinsic property of DNNs: deep neural networks: DNN (to learn secondary features in an unsupervised manner). The DNN system is adaptable to any subscription based company with extremely good churn predictive performance. Support Vector Machines (SVMs) have also been used in the context of churn prediction, but the use of SVMs has not been well documented in the literature, as previous implementations used unrealistic data with small sample size. Motivated by these deficiencies, Coussement and Van den Poel (2008) applied SVM to real data gathered from a newspaper company and compared its performance to logistic regression and random forest techniques. The results of their approach showed that SVMs performed extremely well in the application of churn prediction even on realistic, noisy datasets; and performed better than logistic regression; but performed poorly when compared to random forest. In the next section, we propose a hybrid framework that utilizes two unsupervized techniques: k-means and self-organizing map (SOM), to deal with the issues in customers’ segmentation. Segmentation is achieved through k-menas clustering, while visualization/analysis of the discovered segment patterns is achieved using SOM. 4. Methodology The proposed framework as shown in Figure 1, is driven by two unsupervised algorithms namely, k-means and SOM. Our methodological workflow consists of six major stages: customers’ transaction dataset acquisition, transaction selection and pre-processing, customer clustering, clusters validity analysis, clusters visualization and, target customer behavior analysis.
mas.ccsenet.org Modern Applied Science Vol. 11, No. 9; 2017
155
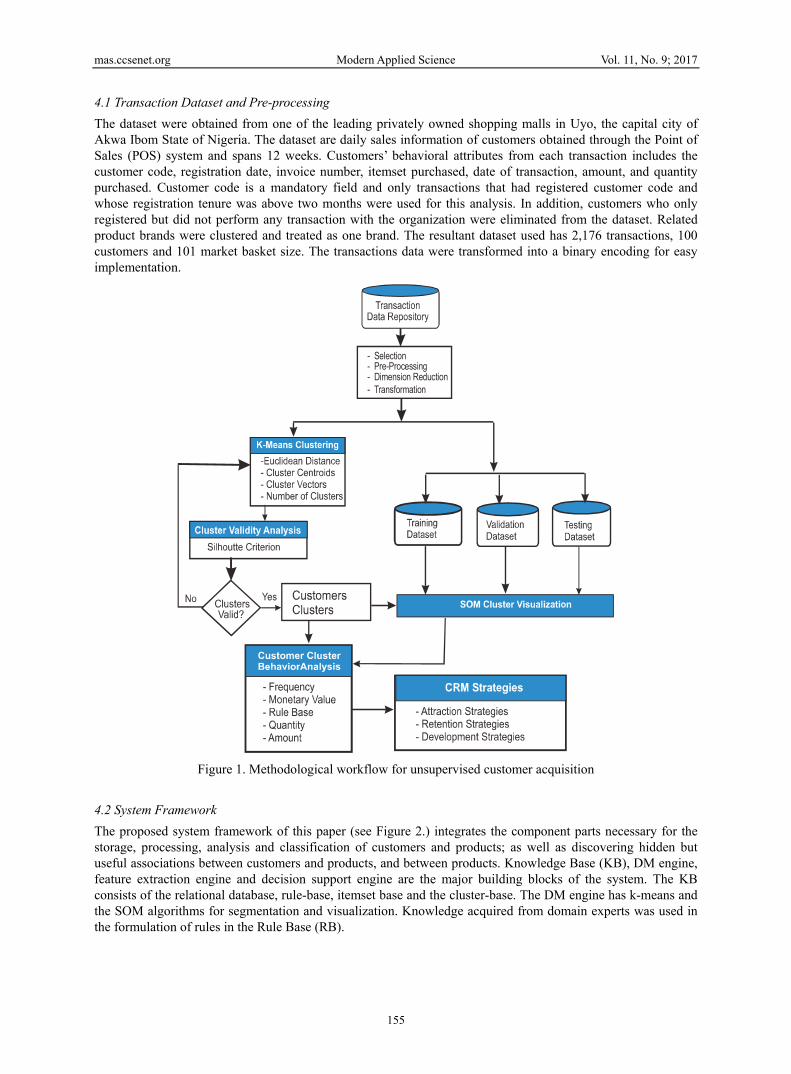
4.1 Transaction Dataset and Pre-processing The dataset were obtained from one of the leading privately owned shopping malls in Uyo, the capital city of Akwa Ibom State of Nigeria. The dataset are daily sales information of customers obtained through the Point of Sales (POS) system and spans 12 weeks. Customers’ behavioral attributes from each transaction includes the customer code, registration date, invoice number, itemset purchased, date of transaction, amount, and quantity purchased. Customer code is a mandatory field and only transactions that had registered customer code and whose registration tenure was above two months were used for this analysis. In addition, customers who only registered but did not perform any transaction with the organization were eliminated from the dataset. Related product brands were clustered and treated as one brand. The resultant dataset used has 2,176 transactions, 100 customers and 101 market basket size. The transactions data were transformed into a binary encoding for easy implementation.
Figure 1. Methodological workflow for unsupervised customer acquisition
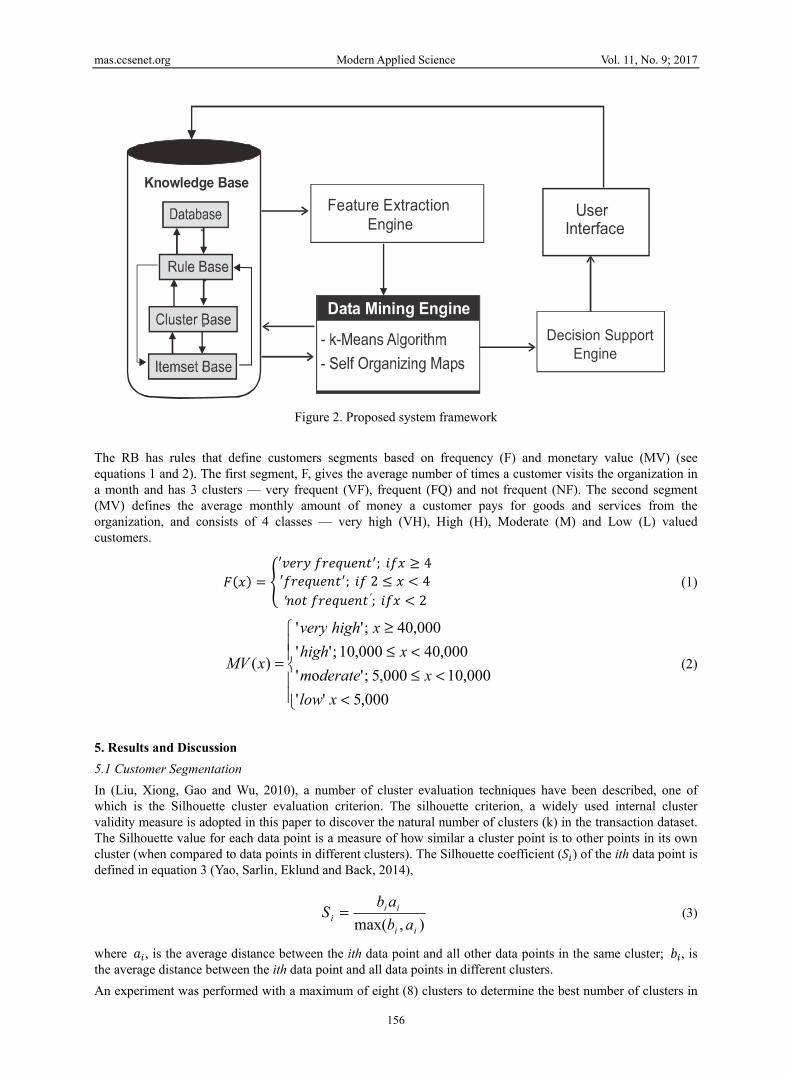
4.2 System Framework The proposed system framework of this paper (see Figure 2.) integrates the component parts necessary for the storage, processing, analysis and classification of customers and products; as well as discovering hidden but useful associations between customers and products, and between products. Knowledge Base (KB), DM engine, feature extraction engine and decision support engine are the major building blocks of the system. The KB consists of the relational database, rule-base, itemset base and the cluster-base. The DM engine has k-means and the SOM algorithms for segmentation and visualization. Knowledge acquired from domain experts was used in the formulation of rules in the Rule Base (RB).
- Pre-Processing
- Transformation- Dimension Reduction
- Selection
mas.ccsenet.org Modern Applied Science Vol. 11, No. 9; 2017
156
Figure 2. Proposed system framework
The RB has rules that define customers segments based on frequency (F) and monetary value (MV) (see equations 1 and 2). The first segment, F, gives the average number of times a customer visits the organization in a month and has 3 clusters — very frequent (VF), frequent (FQ) and not frequent (NF). The second segment (MV) defines the average monthly amount of money a customer pays for goods and services from the organization, and consists of 4 classes — very high (VH), High (H), Moderate (M) and Low (L) valued customers.
( ) = ′ ; ≥ 4′ ; 2 ≤ < 4′ ′; < 2 (1)
<<≤
<≤≥
=
000,5''000,10000,5;'o'
000,40000,10;''000,40;''
)(
xlowxderatem
xhighxhighvery
xMV (2)
5. Results and Discussion 5.1 Customer Segmentation In (Liu, Xiong, Gao and Wu, 2010), a number of cluster evaluation techniques have been described, one of which is the Silhouette cluster evaluation criterion. The silhouette criterion, a widely used internal cluster validity measure is adopted in this paper to discover the natural number of clusters (k) in the transaction dataset. The Silhouette value for each data point is a measure of how similar a cluster point is to other points in its own cluster (when compared to data points in different clusters). The Silhouette coefficient ( ) of the ith data point is defined in equation 3 (Yao, Sarlin, Eklund and Back, 2014),
),max( ii
iii ab
abS = (3)
where , is the average distance between the ith data point and all other data points in the same cluster; , is the average distance between the ith data point and all data points in different clusters. An experiment was performed with a maximum of eight (8) clusters to determine the best number of clusters in
Knowledge BaseFeature Extraction
Engine
Data Mining Engine
User Interface
Decision Support Engine
mas.ccsenet.org Modern Applied Science Vol. 11, No. 9; 2017
157
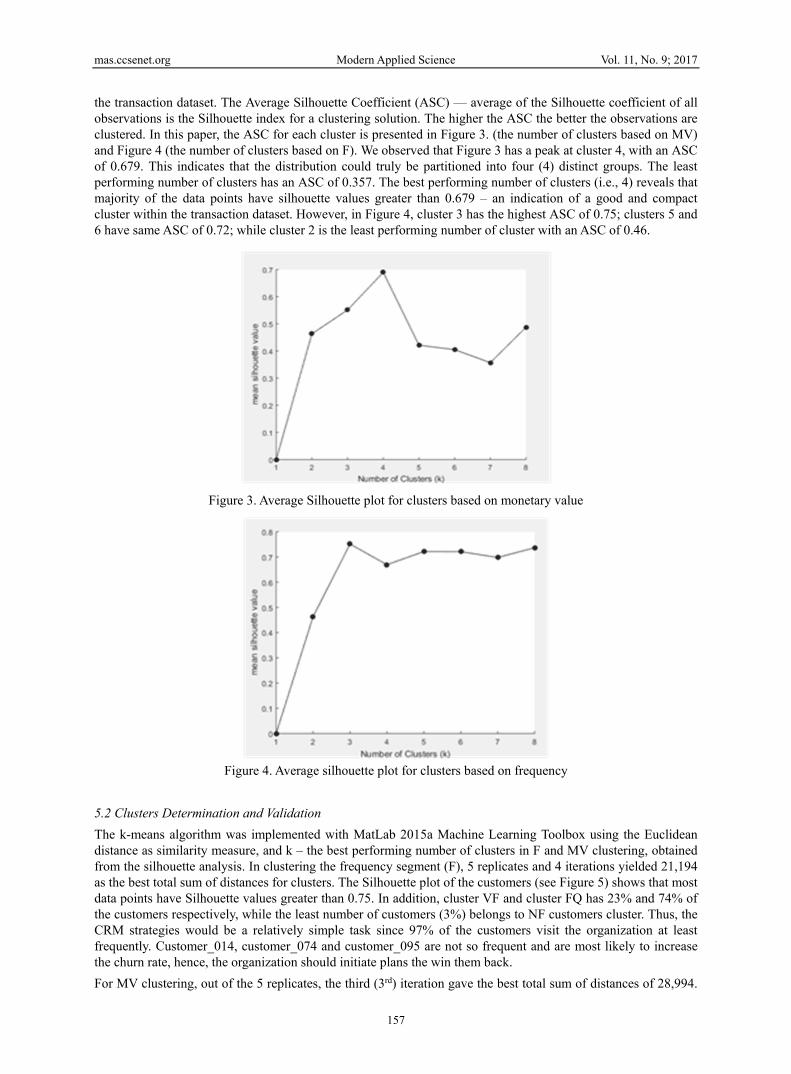
the transaction dataset. The Average Silhouette Coefficient (ASC) — average of the Silhouette coefficient of all observations is the Silhouette index for a clustering solution. The higher the ASC the better the observations are clustered. In this paper, the ASC for each cluster is presented in Figure 3. (the number of clusters based on MV) and Figure 4 (the number of clusters based on F). We observed that Figure 3 has a peak at cluster 4, with an ASC of 0.679. This indicates that the distribution could truly be partitioned into four (4) distinct groups. The least performing number of clusters has an ASC of 0.357. The best performing number of clusters (i.e., 4) reveals that majority of the data points have silhouette values greater than 0.679 – an indication of a good and compact cluster within the transaction dataset. However, in Figure 4, cluster 3 has the highest ASC of 0.75; clusters 5 and 6 have same ASC of 0.72; while cluster 2 is the least performing number of cluster with an ASC of 0.46.
Figure 3. Average Silhouette plot for clusters based on monetary value
Figure 4. Average silhouette plot for clusters based on frequency
5.2 Clusters Determination and Validation The k-means algorithm was implemented with MatLab 2015a Machine Learning Toolbox using the Euclidean distance as similarity measure, and k – the best performing number of clusters in F and MV clustering, obtained from the silhouette analysis. In clustering the frequency segment (F), 5 replicates and 4 iterations yielded 21,194 as the best total sum of distances for clusters. The Silhouette plot of the customers (see Figure 5) shows that most data points have Silhouette values greater than 0.75. In addition, cluster VF and cluster FQ has 23% and 74% of the customers respectively, while the least number of customers (3%) belongs to NF customers cluster. Thus, the CRM strategies would be a relatively simple task since 97% of the customers visit the organization at least frequently. Customer_014, customer_074 and customer_095 are not so frequent and are most likely to increase the churn rate, hence, the organization should initiate plans the win them back. For MV clustering, out of the 5 replicates, the third (3rd) iteration gave the best total sum of distances of 28,994.

mas.ccsenet.org Modern Applied Science Vol. 11, No. 9; 2017
158
The distribution of customers shows VF cluster is 18% while 11% of the customers belong to H cluster. M valued customers are 43% while 28% of customers belong to the L cluster. The Silhouette plot based on MV clustering (Figure 6) shows that the clusters are well separated and appropriate.
Figure 5. Silhouette cluster plots based on frequency
Figure 6. Silhouette cluster plots based on monitory value
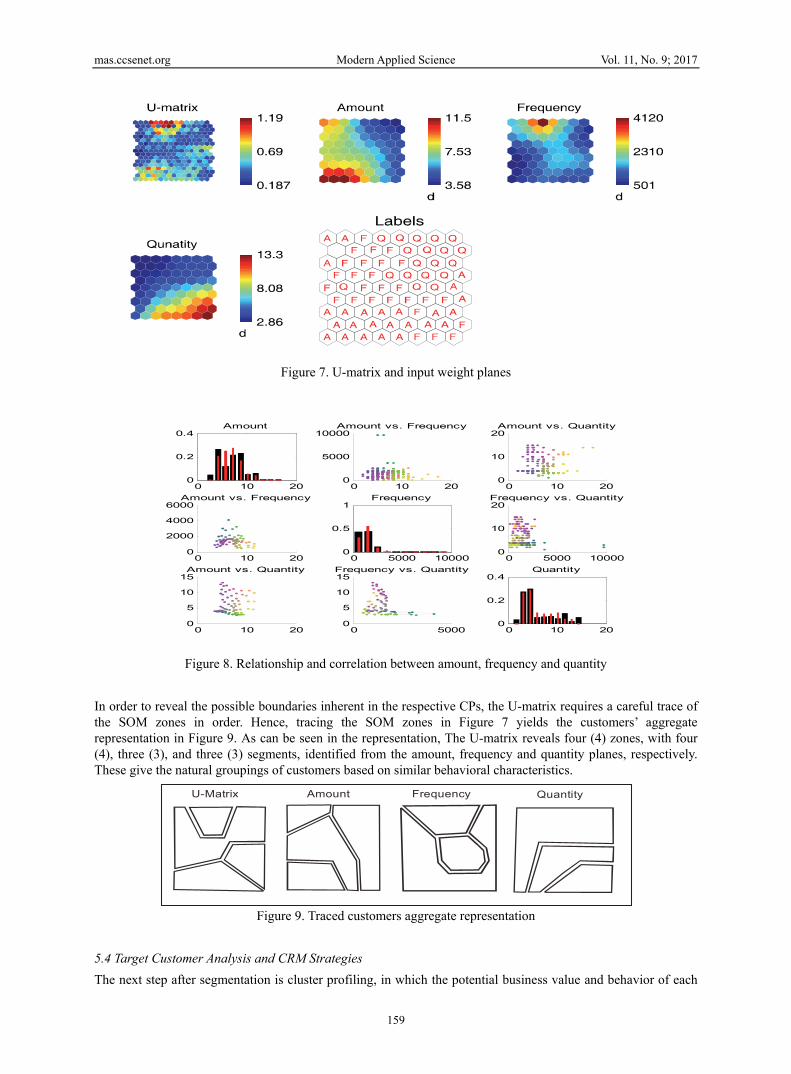
5.3 SOM Training and Visualization Figure 7. Shows the customer transactions data set in a 9×8 SOM grid based on each of the variables (Amount, Frequency and Quantity) and it’s U-matrix. The individual component plane (CP) maps as seen in Figure 7, provide clear visualization of the different input variables, and are displayed in grayscale color shades. Each CP represents an input variable measured based on the average monthly operations performed by customers visiting the shopping mall. The component values are normalized in the process, such that the various color bars are within the preferred sequence value range. The level of similarity of the operation sequence of customers visiting and transacting with the shopping mall can then be studied from the density of the color shades in the hexagonal grid nodes for each CP of the SOM. Darker shades correspond to larger ordinal values while gray color shades represent medium ordinal value, and the lighter shades represent smaller ordinal values of operation sequence. In Figure 8, we present possible relationship and correlation between the input variables. Even the partial correlates can be obtained through further inspection of the grayscale representation of the CP in Figure 7. We observed in Figs. 7 and 8, that there exists no similarity patterns between the input components, indicating that there is no influence of one variable(s) on the other variable(s). The top left corner of Figure 7 shows a visualization of the U-matrix and reveals the relative distance measure between the SOM grid nodes, with various color extraction. The darker shades represent larger distance between adjacent nodes indicating cluster boundaries, and regions similar to each other have lighter shades showing within cluster relationships.
0 0.2 0.4 0.6 0.8
Silhouette Value
1
2
3
q y
1
0 0.2 0.4 0.6 0.8
Silhouette Value
1
2
4
y
1
3
mas.ccsenet.org Modern Applied Science Vol. 11, No. 9; 2017
159
Figure 7. U-matrix and input weight planes
Figure 8. Relationship and correlation between amount, frequency and quantity
In order to reveal the possible boundaries inherent in the respective CPs, the U-matrix requires a careful trace of the SOM zones in order. Hence, tracing the SOM zones in Figure 7 yields the customers’ aggregate representation in Figure 9. As can be seen in the representation, The U-matrix reveals four (4) zones, with four (4), three (3), and three (3) segments, identified from the amount, frequency and quantity planes, respectively. These give the natural groupings of customers based on similar behavioral characteristics.
Figure 9. Traced customers aggregate representation
5.4 Target Customer Analysis and CRM Strategies The next step after segmentation is cluster profiling, in which the potential business value and behavior of each
0 10 200
0.2
0.4Amount
0 10 200
5000
10000Amount vs. Frequency
0 10 200
10
20Amount vs. Quantity
0 10 200
2000
4000
6000Amount vs. Frequency
0 5000 100000
0.5
1Frequency
0 5000 100000
10
20Frequency vs. Quantity
0 10 200
5
10
15Amount vs. Quantity
0 50000
5
10
15Frequency vs. Quantity
0 10 200
0.2
0.4Quantity
Amount Frequency QuantityU-Matrix
mas.ccsenet.org Modern Applied Science Vol. 11, No. 9; 2017
160
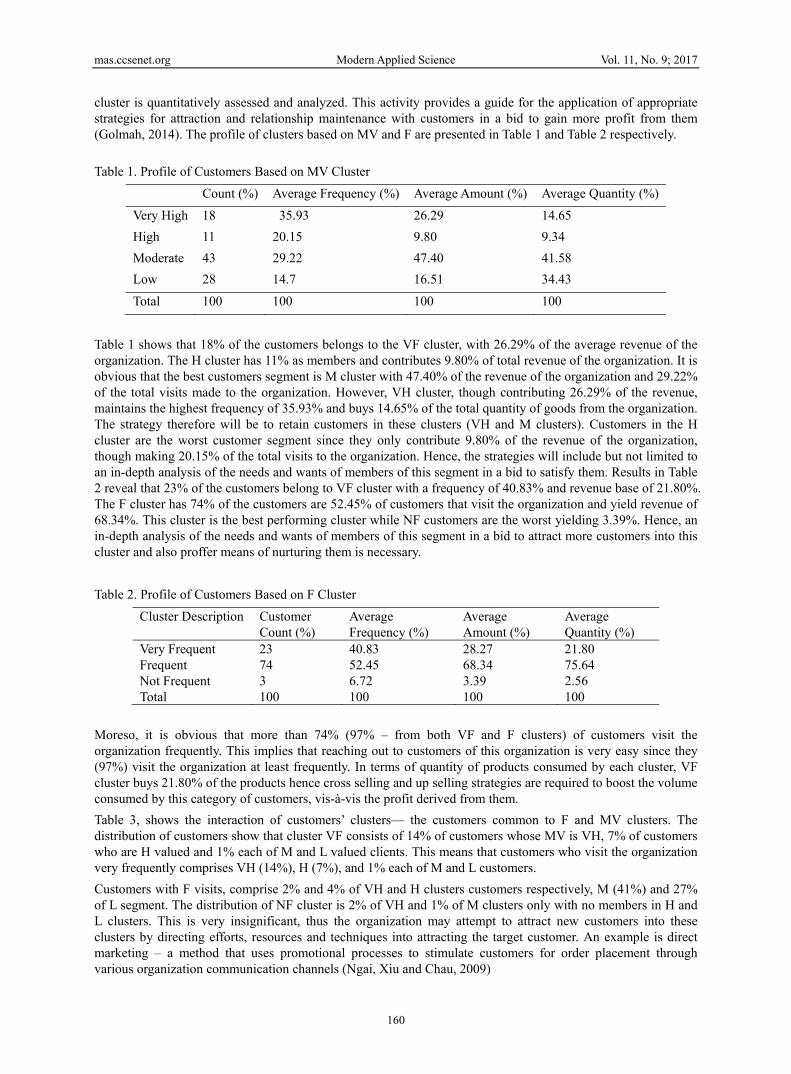
cluster is quantitatively assessed and analyzed. This activity provides a guide for the application of appropriate strategies for attraction and relationship maintenance with customers in a bid to gain more profit from them (Golmah, 2014). The profile of clusters based on MV and F are presented in Table 1 and Table 2 respectively. Table 1. Profile of Customers Based on MV Cluster
Count (%) Average Frequency (%) Average Amount (%) Average Quantity (%)Very High 18 35.93 26.29 14.65 High 11 20.15 9.80 9.34 Moderate 43 29.22 47.40 41.58 Low 28 14.7 16.51 34.43 Total 100 100 100 100
Table 1 shows that 18% of the customers belongs to the VF cluster, with 26.29% of the average revenue of the organization. The H cluster has 11% as members and contributes 9.80% of total revenue of the organization. It is obvious that the best customers segment is M cluster with 47.40% of the revenue of the organization and 29.22% of the total visits made to the organization. However, VH cluster, though contributing 26.29% of the revenue, maintains the highest frequency of 35.93% and buys 14.65% of the total quantity of goods from the organization. The strategy therefore will be to retain customers in these clusters (VH and M clusters). Customers in the H cluster are the worst customer segment since they only contribute 9.80% of the revenue of the organization, though making 20.15% of the total visits to the organization. Hence, the strategies will include but not limited to an in-depth analysis of the needs and wants of members of this segment in a bid to satisfy them. Results in Table 2 reveal that 23% of the customers belong to VF cluster with a frequency of 40.83% and revenue base of 21.80%. The F cluster has 74% of the customers are 52.45% of customers that visit the organization and yield revenue of 68.34%. This cluster is the best performing cluster while NF customers are the worst yielding 3.39%. Hence, an in-depth analysis of the needs and wants of members of this segment in a bid to attract more customers into this cluster and also proffer means of nurturing them is necessary. Table 2. Profile of Customers Based on F Cluster
Cluster Description Customer Count (%)
Average Frequency (%)
Average Amount (%)
Average Quantity (%)
Very Frequent 23 40.83 28.27 21.80 Frequent 74 52.45 68.34 75.64 Not Frequent 3 6.72 3.39 2.56 Total 100 100 100 100
Moreso, it is obvious that more than 74% (97% – from both VF and F clusters) of customers visit the organization frequently. This implies that reaching out to customers of this organization is very easy since they (97%) visit the organization at least frequently. In terms of quantity of products consumed by each cluster, VF cluster buys 21.80% of the products hence cross selling and up selling strategies are required to boost the volume consumed by this category of customers, vis-à-vis the profit derived from them. Table 3, shows the interaction of customers’ clusters— the customers common to F and MV clusters. The distribution of customers show that cluster VF consists of 14% of customers whose MV is VH, 7% of customers who are H valued and 1% each of M and L valued clients. This means that customers who visit the organization very frequently comprises VH (14%), H (7%), and 1% each of M and L customers. Customers with F visits, comprise 2% and 4% of VH and H clusters customers respectively, M (41%) and 27% of L segment. The distribution of NF cluster is 2% of VH and 1% of M clusters only with no members in H and L clusters. This is very insignificant, thus the organization may attempt to attract new customers into these clusters by directing efforts, resources and techniques into attracting the target customer. An example is direct marketing – a method that uses promotional processes to stimulate customers for order placement through various organization communication channels (Ngai, Xiu and Chau, 2009)
mas.ccsenet.org Modern Applied Science Vol. 11, No. 9; 2017
161
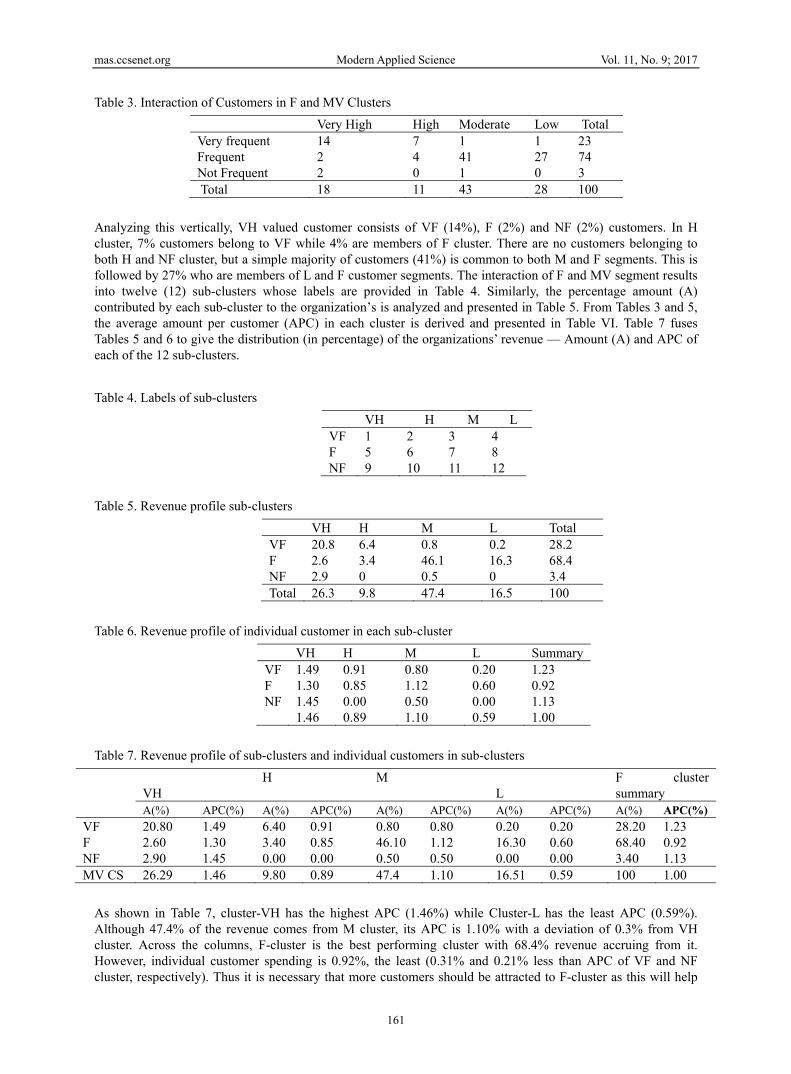
Table 3. Interaction of Customers in F and MV Clusters Very High High Moderate Low Total Very frequent 14 7 1 1 23 Frequent 2 4 41 27 74 Not Frequent 2 0 1 0 3 Total 18 11 43 28 100
Analyzing this vertically, VH valued customer consists of VF (14%), F (2%) and NF (2%) customers. In H cluster, 7% customers belong to VF while 4% are members of F cluster. There are no customers belonging to both H and NF cluster, but a simple majority of customers (41%) is common to both M and F segments. This is followed by 27% who are members of L and F customer segments. The interaction of F and MV segment results into twelve (12) sub-clusters whose labels are provided in Table 4. Similarly, the percentage amount (A) contributed by each sub-cluster to the organization’s is analyzed and presented in Table 5. From Tables 3 and 5, the average amount per customer (APC) in each cluster is derived and presented in Table VI. Table 7 fuses Tables 5 and 6 to give the distribution (in percentage) of the organizations’ revenue — Amount (A) and APC of each of the 12 sub-clusters. Table 4. Labels of sub-clusters
VH H M L VF 1 2 3 4 F 5 6 7 8 NF 9 10 11 12
Table 5. Revenue profile sub-clusters
VH H M L Total VF 20.8 6.4 0.8 0.2 28.2 F 2.6 3.4 46.1 16.3 68.4 NF 2.9 0 0.5 0 3.4 Total 26.3 9.8 47.4 16.5 100
Table 6. Revenue profile of individual customer in each sub-cluster
VH H M L Summary VF 1.49 0.91 0.80 0.20 1.23 F 1.30 0.85 1.12 0.60 0.92 NF 1.45 0.00 0.50 0.00 1.13 1.46 0.89 1.10 0.59 1.00
Table 7. Revenue profile of sub-clusters and individual customers in sub-clusters
VH
H M L
F cluster summary
A(%) APC(%) A(%) APC(%) A(%) APC(%) A(%) APC(%) A(%) APC(%)VF 20.80 1.49 6.40 0.91 0.80 0.80 0.20 0.20 28.20 1.23 F 2.60 1.30 3.40 0.85 46.10 1.12 16.30 0.60 68.40 0.92 NF 2.90 1.45 0.00 0.00 0.50 0.50 0.00 0.00 3.40 1.13 MV CS 26.29 1.46 9.80 0.89 47.4 1.10 16.51 0.59 100 1.00
As shown in Table 7, cluster-VH has the highest APC (1.46%) while Cluster-L has the least APC (0.59%). Although 47.4% of the revenue comes from M cluster, its APC is 1.10% with a deviation of 0.3% from VH cluster. Across the columns, F-cluster is the best performing cluster with 68.4% revenue accruing from it. However, individual customer spending is 0.92%, the least (0.31% and 0.21% less than APC of VF and NF cluster, respectively). Thus it is necessary that more customers should be attracted to F-cluster as this will help
mas.ccsenet.org Modern Applied Science Vol. 11, No. 9; 2017
162
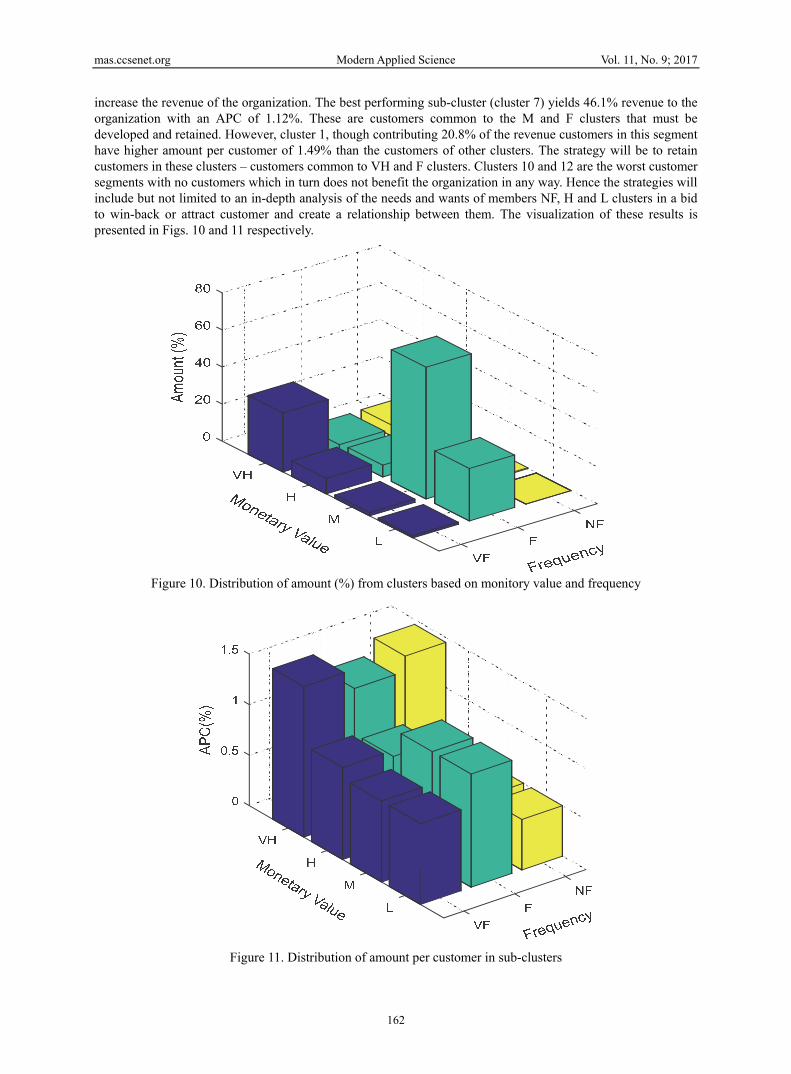
increase the revenue of the organization. The best performing sub-cluster (cluster 7) yields 46.1% revenue to the organization with an APC of 1.12%. These are customers common to the M and F clusters that must be developed and retained. However, cluster 1, though contributing 20.8% of the revenue customers in this segment have higher amount per customer of 1.49% than the customers of other clusters. The strategy will be to retain customers in these clusters – customers common to VH and F clusters. Clusters 10 and 12 are the worst customer segments with no customers which in turn does not benefit the organization in any way. Hence the strategies will include but not limited to an in-depth analysis of the needs and wants of members NF, H and L clusters in a bid to win-back or attract customer and create a relationship between them. The visualization of these results is presented in Figs. 10 and 11 respectively.
Figure 10. Distribution of amount (%) from clusters based on monitory value and frequency
Figure 11. Distribution of amount per customer in sub-clusters

mas.ccsenet.org Modern Applied Science Vol. 11, No. 9; 2017
163
6. Conclusion and Future Research Work One of the main challenges in any competitive environment is responding to users’ demands and the building trust and satisfaction within the shortest possible time, while improving on quality and productivity. In today's highly competitive market, organizations should maintain positive relationship with their customers. CRM technology therefore becomes a necessity and pointer to make this happen. It enables orngnizations/companies to realize the best consumer behavior, predict their future behavior, to know what products would suit their preferences. It also sustains long-term relationships with customers. The strategic integration of CRM philosophy in the processes and culture of an organization provides services with superior customers' value and loyal customers - as customers' loyalty constitutes the most important asset of organizations. This paper has provided a qualitative solution to customers’ segmentation (a major CRM methodology), using a hybid techniques. We studied the customers’ behaviorial pattern characteristics, and provided avenues to improving the quality of the organization’s services. In the future, a comparative study of other CRM methodologies is expected, with full scale investigation into their viability in solving CRM problems. Acknowledgments This research was supported by the Tertiary Education Trust Fund (TETFund) grant. References Anchalia, P. P., Koundinya, A. K., & Srinath, N. K. (2013). Map Reduce design of K-means clustering algorithm.
In Proceedings of International Conference on Information Science and Applications (ICISA), 1-5. https://doi.org/10.1109/ICISA.2013.6579448
Arumawadu, H. I., Rathnayaka, R. K. T., & Illangarathne, S. K. (2015). Mining Profitability of Telecommunication Customers Using K-Means Clustering. Journal of Data Analysis and Information Processing, 3(3), 63-71. https://doi.org/10.4236/jdaip.2015.33008.
Bhatnagar, V. (2014). Data Mining and Analysis in The Engineering Field. Information Science Reference, USA. Buttle, F., & S. Maklan (2014). Customer Relationship Management: Concepts and Technologies, 3rd Edition,
Routledge. Coussement, K., & Van den Poel, D. (2008). Churn prediction in subscription services: An application of support
vector machines while comparing two parameter-selection techniques. Expert systems with applications, 34(1), 313-327.
Dibb, S., & Simkin, L. (2010) Judging the Quality of Customer Segments: Segmentation Effectiveness. Journal of Strategic Marketing, 18, 113-131. https://doi.org/10.1080/09652540903537048
Gayathri, A. S. and Mohanavalli, S. (2011). Enhanced Customer Relationship Management Using Fuzzy Clustering, IJCSET, 1(4), 163-167.
Golmah, V. (2014). A Case Study of Applying SOM in Market Segmentation of Automobile Insurance Customers. International Journal of Database Theory and Application, 7(1), 25-36.
Huang, J., & Hsu, C. H. (2010). The impact of customer-to-customer interaction on cruise experience and vacation satisfaction. Journal of Travel Research, 49(1), 79-92. Retrieved from http://journals.sagepub.com/doi/pdf/10.1177/0047287509336466.
Jelonek, D. (2006). The Evolution of Customer Relationship Management System. Recent Advances in Computer Science, 29-33.
Kazemi, A., Babaei, M. E., & Javad, M. O. M. (2015). A Data Mining Approach for Turning Potential Customers into Real Ones in Basket Purchase Analysis. International Journal of Business Information Systems, 19(2), 139-158. Retrieved from http://www.inderscienceonline.com/doi/abs/10.1504/IJBIS.2015.069427
Kohonen, T. (2013). Essentials of Self-organizing Maps. Neural Networks, 37(2013), 52-65. https://doi.org/10.1016/j.neunet.2012.09.018
Kuruuzum, A., & Koksal C. D. (2010). The Impact of Service Quality on Behavioral Intention in Hospitality Industry. International Journal of Business and Management Studies, 2(1), 9-15.
Liu, Y., Li, Z., Xiong, H., Gao, X., & Wu, J. (2010). Understanding of Internal Clustering Validation Measures. In Proceedings of 2010 IEEE International Conference on Data Mining, Sydney: 211-216.
McCarty, J. A., & Hastak, M. (2007). Segmentation approaches in data-mining: A comparison of RFM, CHAID, and logistic regression. Journal of business research, 60(6), 656-662.

mas.ccsenet.org Modern Applied Science Vol. 11, No. 9; 2017
164
McDonalds, M., & Dunbar, I. (2004). Marketing Segmentation: How to Do It, How to Profit from It. Elsevier Butterworth-Heinemann, Oxford.
Mehregan, S., & Samizadeh, R. (2012). Customer Retention Based on the Number of Purchase: A Data Mining Approach. Int. J. Mang. Bus. Res., 2(1), 41-50.
Ngai, E. W. T., Xiu, L., & Chau, D. C. K. (2009). Application of Data mining Techniques in Customer Relationship Management: A literature Review and Classification. Expert Systems and Applications, 36(2-2), 2592-2602. https://doi.org/10.1016/j.eswa.2008.02.021.
Sivasankar, E., & Vijaya, J. (2017). Customer Segmentation by Various Clustering Approaches and Building an Effective Hybrid Learning System on Churn Prediction Dataset. In Computational Intelligence in Data Mining, Springer, Singapore: 181-191.
Spanoudes, P., & Nguyen, T. (2017). Deep Learning in Customer Churn Prediction: Unsupervised Feature Learning on Abstract Company Independent Feature Vectors. arXiv preprint arXiv:1703.03869.
Swift, R. S. (2001). Accelerating customer relationships: Using CRM and relationship technologies. Prentice Hall Inc, New York.
Theodorakis, N. D., Koustelios, A., Robinson, L., & Barlas, A. (2009). Moderating Role of Team Identification on the Relationship between Service Quality and Repurchase Intentions Among Spectators of Professional Sports. Managing Service Quality: An International Journal, 19(4), 456-473. Retrieved from http://www.emeraldinsight.com/doi/pdfplus/10.1108/09604520910971557
Yao, Z., Sarlin, P., Eklund, T., & Back, B. (2014). Combining Visual Customer Segmentation and Response Modeling. Neural Computing and Applications, 25(1), 123-134. Retrieved from https://link.springer.com/article/10.1007/s00521-013-1454-3.
Copyrights Copyright for this article is retained by the author(s), with first publication rights granted to the journal. This is an open-access article distributed under the terms and conditions of the Creative Commons Attribution license (http://creativecommons.org/licenses/by/4.0/).