untitled
TRANSCRIPT

Public health spending and return on investment
These infographics from The King’s Fund and the Local Government Association set out key facts about the public health system and the return on investment for some public health interventions. You are welcome to use them in your office, in documents or presentations but please credit The King’s Fund and Local Government Association wherever you do this.
Making the case for public health interventions

The importance of public health
Our health is determined by our genetics, lifestyle, the health care we receive and our wider economic, physical and social environment. Although estimates vary, the wider environment has the largest impact.
McGiniss et al (2002)Canadian Institute of
Advanced Research (2012)Bunker et al (1995)
Health care(15%)
Health behaviourpatterns (40%)
Social circumstancesand environmental
exposure (45%)
Health care(25%)
Socio-economic(50%)Environmental
(15%)
Genetics(15%)
Health care(43%) Other factors
(57%)

£51£1,742
NHS spending
Local authority
Spending and costs
In 2013/14 the Department of Health spent more than £106 billion on health, social care and public health in England. Average NHS spending per head was £1,742, while grants to local authorities for public health averaged £51 per head.

£5.48BILLION
Spending and costs
In 2013/14, the Department of Health spent around £5.48 billion on public health – around 5.1 per cent of their total spending. Almost half of this – £2.66 billion – was given to local authorities as grants.
£2.66BILLION

Blackpool
Westminster
Redbridge
SurreyPortsmouth
£126
£22
£38£133
£77
Cornwall
£33
Norfolk
£35
NorthTyneside
£53
£66
Leicester
Spending and costs
In 2014/15 the Department of Health allocated £2.79 billion to local authorities in public health grants. These ranged from £185 per head to £22 per head.

2014 2034people aged 65-84
2014 2034people aged 85+
Life expectancy
Over the next 20 years the number of people in England aged 65-84 will increase by more than a third, and the number aged 85 and above will more than double.

76.9years70.9
years
83.3years
79.4years
Life expectancy
The average life expectancy in England has been increasing. In 1981 it was 70.9 years for men and 76.9 years for women. In 2014, it is expected to be 79.4 years for men and 83.3 years for women.
1981 2014

Highest region(south west)
Lowest region(north east)
Lowest LA(Manchester)
Highest LA(Purbeck)
Least deprived 10% in
Westminster
Most deprived 10% in
Westminister
81.6years
83.9years
79.5years
86.6years
81.4years
90years
Life expectancy
There are wide variations in life expectancy between different populations. For women, the difference between the regions with the highest and the lowest life expectancy is 2.3 years. Across local authorities that difference is 7.1 years. Within a single local authority the variation based on deprivation can be as much as 8.6 years.

51.6
Guildford and Waverley
Bradford
19.7
years71.3years
Healthy life expectancy
People living south and west of London have a far higher healthy life expectancy than people in the north, Midlands and parts of east London. In 2010–12, the healthy life expectancy for women ranged from 52.6 years within Bradford Clinical Commissioning Group to 71.3 years within Guildford and Waverley Clinical Commissioning Group.
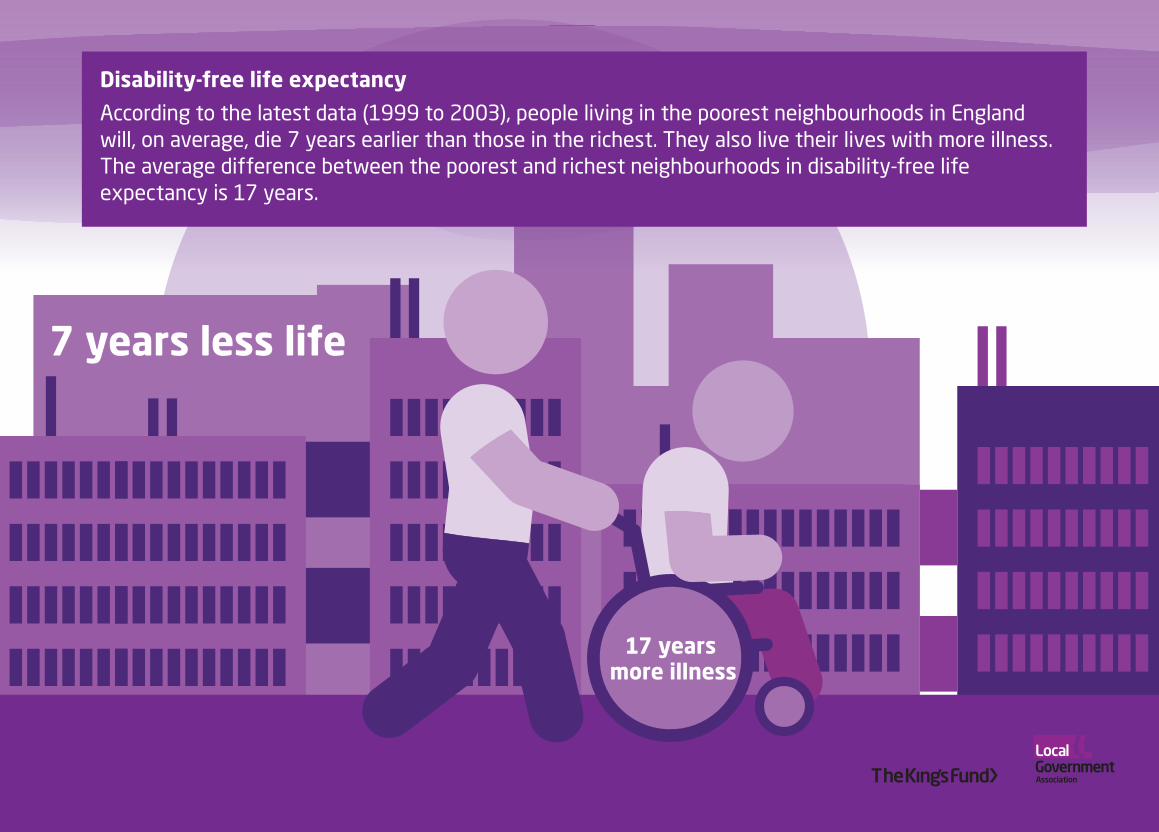
7 years less life
17 years more illness
Disability-free life expectancy
According to the latest data (1999 to 2003), people living in the poorest neighbourhoods in England will, on average, die 7 years earlier than those in the richest. They also live their lives with more illness. The average difference between the poorest and richest neighbourhoods in disability-free life expectancy is 17 years.

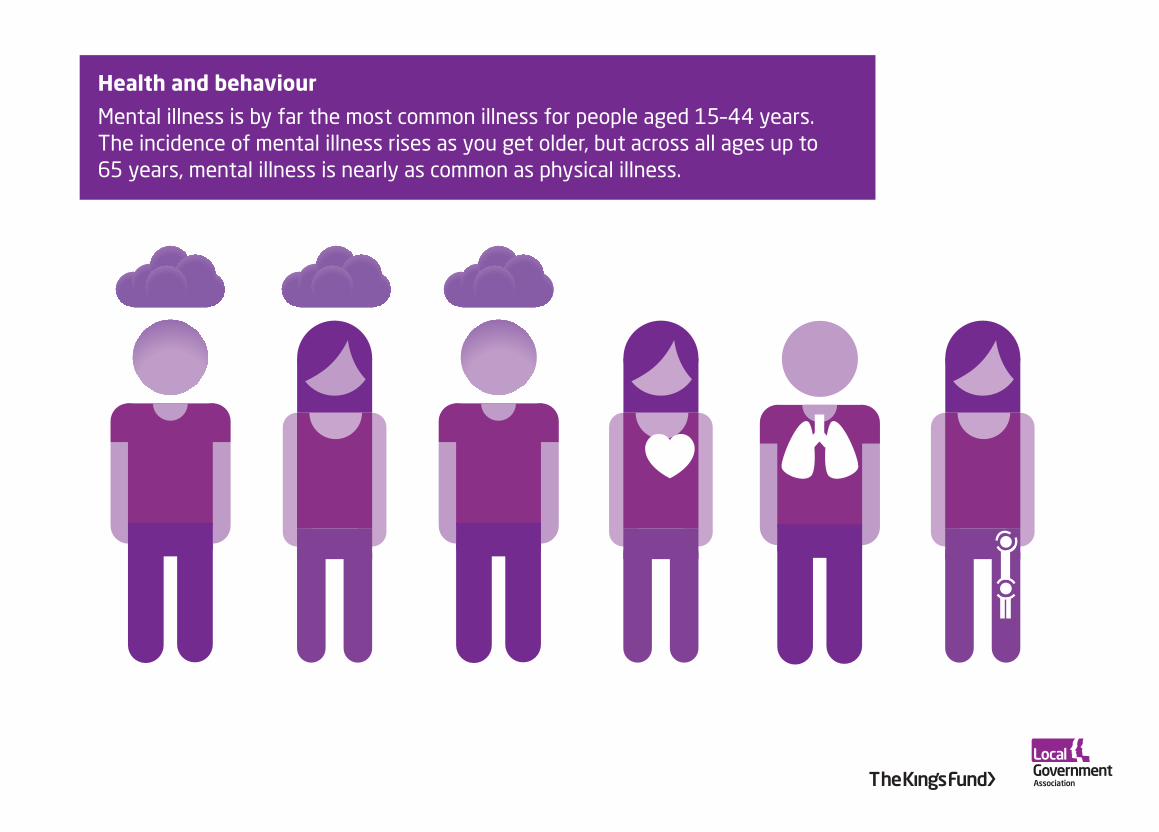
Health and behaviour
Latest figures show that 2 in 10 adults are smokers. 7 in 10 men and 6 in 10 women are overweight or obese. A third of people have drinking patterns that could be harmful. Half of women and a third of men do not get enough exercise.

Health and behaviour
Multiple unhealthy behaviours have a cumulative effect on health. Someone in mid-life who smokes, drinks too much, exercises too little and eats poorly is four times as likely to die over the next 10 years than someone who does none of those things. Inequality in this area has increased: the rate of multiple unhealthy behaviours has decreased overall but not within the poorest parts of society.
4VS

40% of disability-adjusted life years lost
Health and behaviour
Forty per cent of the UK’s overall disability-adjusted life years lost are caused by tobacco, high blood pressure, overweight and obesity and low physical activity (2010 figures). This is through their contribution to diseases such as heart disease, stroke and lung cancer.

£3.5 billion
Health and behaviour
Unhealthy lifestyles cost the NHS across the UK billions of pounds every year. Smoking costs £5.2 billion, obesity £4.2 billion, alcohol £3.5 billion and physical inactivity £1.1 billion.
£1.1billion
£5.2billion
£4.2billion
Health and behaviour
Mental illness is by far the most common illness for people aged 15–44 years. The incidence of mental illness rises as you get older, but across all ages up to 65 years, mental illness is nearly as common as physical illness.

8.3 million adults
Health and behaviour
As of 2010, musculo-skeletal problems – such as back pain and arthritis – are the most common conditions to limit people’s daily activities and the largest single cause of years lived with disability. They affect 8.3 million adults and 10,000 children in England.
and 10,000 children

2003 2013
Ever taken drugs
Ever smoked at least once
Ever taken drugs
Ever smoked at least once
Children aged 11–15 years Children aged 11–15 years
Health and behaviour
Children’s health behaviours have improved dramatically over time. Reported use of drugs, smoking and alcohol have all roughly halved over the past 10 years.
Drank alcohol in the last week Drank alcohol in the last week
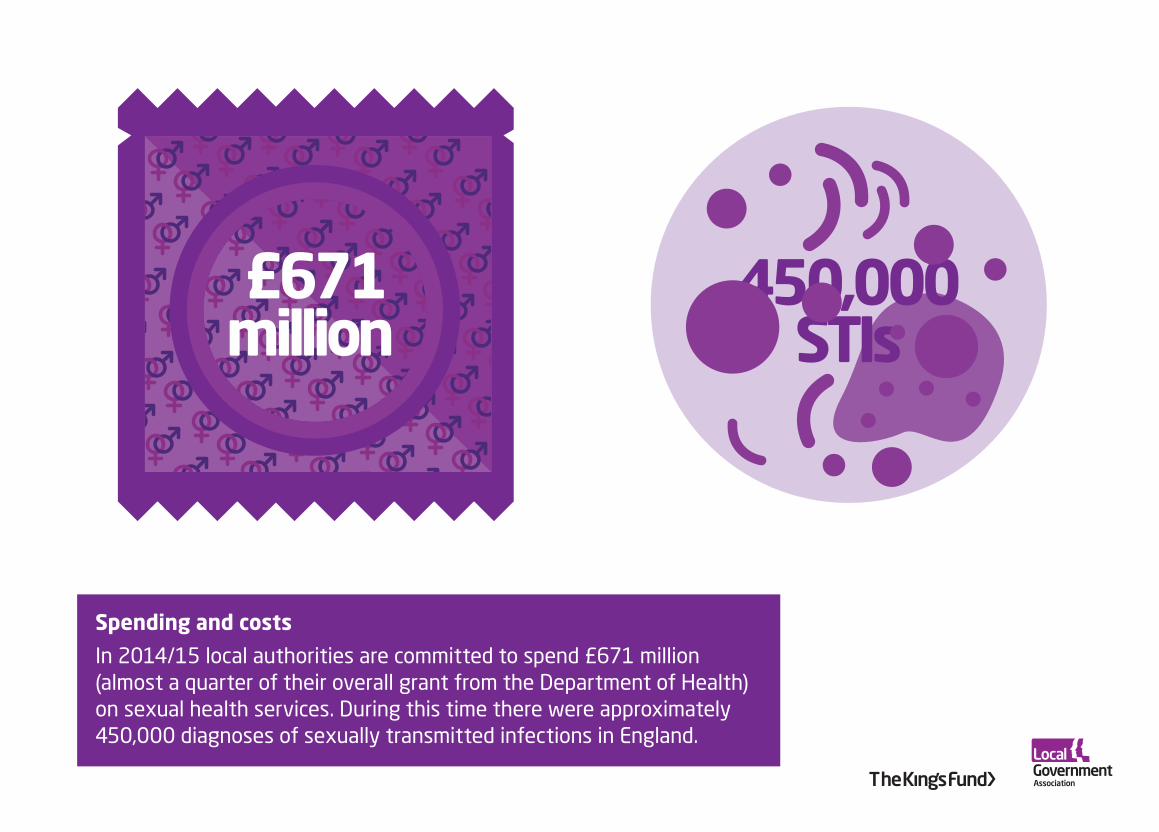
£671million
Spending and costs
In 2014/15 local authorities are committed to spend £671 million (almost a quarter of their overall grant from the Department of Health) on sexual health services. During this time there were approximately 450,000 diagnoses of sexually transmitted infections in England.
450,000STIs

£792Year of telecare
£10,425Final year
of life
£235Ambulance journey
to hospital
£3,283Inpatient stay in
hospital
Spending and costs
The costs of health and care services are not widely known. Some costs can be avoided or reduced through cost-effective public health interventions.
£3110 minuteswith a GP
£114A&E attendance

+£768
Return on investment
The costs to society of transport-induced poor air quality, ill-health and road accidents exceed £40 billion per year. Getting one more child to walk or cycle to school could pay back as much as £768 or £539 respectively in health benefits, NHS costs, productivity gains and reductions in air pollution and congestion.
+£539

Teenagepregnancy
Return on investment
Every £1 spent preventing teenage pregnancy saves £11 in health
care costs.
£11

£15
Return on investment
School-based public health interventions can be good investments. For example, smoking prevention programmes in schools can return as much as £15 for every £1 spent, as can anti-bullying interventions.
No smoking
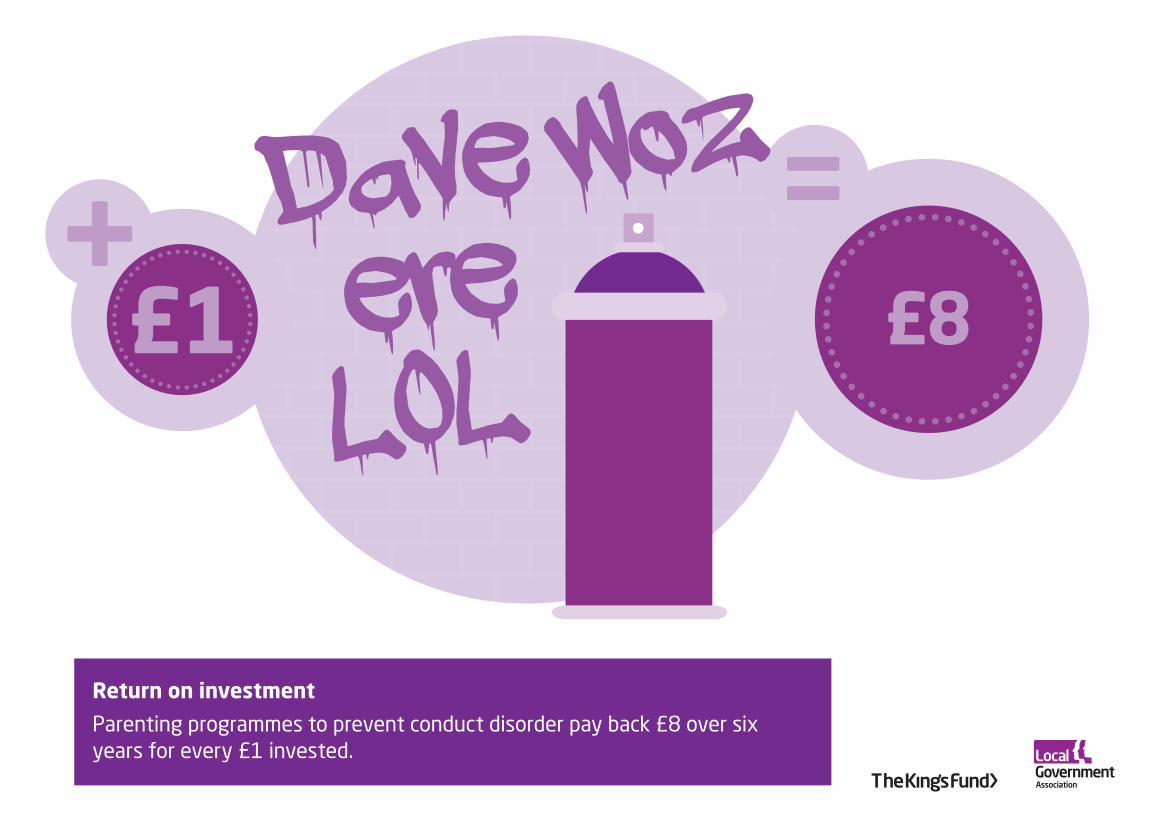
£8
Return on investment
Parenting programmes to prevent conduct disorder pay back £8 over six years for every £1 invested.
Dave woz ere LOL

£23
Return on investment
Birmingham’s Be Active programme of free use of leisure centres and other initiatives returned an estimated £23 in quality of life, reduced NHS use and other gains for every £1 spent.
Gym

Return on investment
Housing interventions to keep people warm, safe and free from cold and damp are an efficient use of resources. Every £1 spent on improving homes saves the NHS £70 over 10 years.
£70

£3
Return on investment
Worklessness costs the economy more than £100 billion every year. Business in the Community estimates that its programmes getting disadvantaged groups back into work return £3 in reduced costs of homelessness, crime, benefits and NHS care for every £1 spent.
Job centre
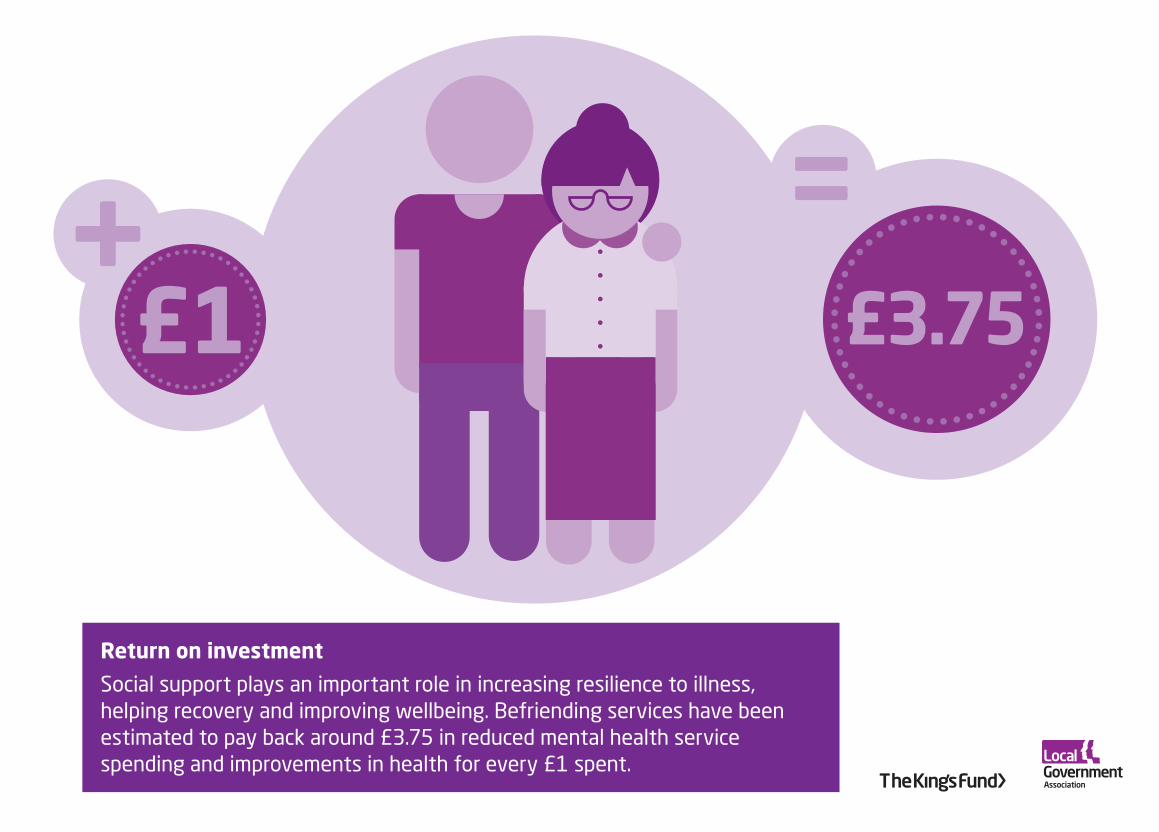
£3.75
Return on investment
Social support plays an important role in increasing resilience to illness, helping recovery and improving wellbeing. Befriending services have been estimated to pay back around £3.75 in reduced mental health service spending and improvements in health for every £1 spent.

£5
Return on investment
Every £1 spent on motivational interviewing and developing supportive networks for people with alcohol or drug addiction returns £5 to the public sector in reduced health care, social care and criminal justice costs.

£2.50
Return on investment
Every £1 spent on drugs treatment saves society £2.50 in reduced NHS and social care costs and reduced crime.
We hope you found these slides useful.
You are welcome to use them in your office, in documents or presentations but please credit The King’s Fund and Local Government Association wherever you do so.
For more information on this topic visit www.kingsfund.org.uk/publichealth or www.local.gov.uk/health.
Making the case for public health interventions