unusual july 10, 1996, rock fall at happy isles,yosemite national
TRANSCRIPT

ABSTRACT
Effects of the July 10, 1996, rock fall at Happy Isles in Yosemite Na-tional Park, California, were unusual compared to most rock falls. Twomain rock masses fell about 14 s apart from a 665-m-high cliff south-east of Glacier Point onto a talus slope above Happy Isles in the easternpart of Yosemite Valley. The two impacts were recorded by seismo-graphs as much as 200 km away. Although the impact area of the rockfalls was not particularly large, the falls generated an airblast and anabrasive dense sandy cloud that devastated a larger area downslope ofthe impact sites toward the Happy Isles Nature Center. Immediatelydownslope of the impacts, the airblast had velocities exceeding 110 m/sand toppled or snapped about 1000 trees. Even at distances of 0.5 kmfrom impact, wind velocities snapped or toppled large trees, causingone fatality and several serious injuries beyond the Happy Isles NatureCenter. A dense sandy cloud trailed the airblast and abraded fallentrunks and trees left standing. The Happy Isles rock fall is one of thefew known worldwide to have generated an airblast and abrasive densesandy cloud. The relatively high velocity of the rock fall at impact, esti-mated to be 110–120 m/s, influenced the severity and areal extent of theairblast at Happy Isles. Specific geologic and topographic conditions,typical of steep glaciated valleys and mountainous terrain, contributedto the rock-fall release and determined its travel path, resulting in ahigh velocity at impact that generated the devastating airblast andsandy cloud. The unusual effects of this rock fall emphasize the impor-tance of considering collateral geologic hazards, such as airblasts fromrock falls, in hazard assessment and planning development of moun-tainous areas.
INTRODUCTION
At 6:52 p.m. July 10, 1996, two large rock falls with a combined volumeof between 23000 and 38000 m3 broke loose from cliffs about 1 km south-east of Glacier Point and fell just seconds apart to the floor of Yosemite Val-ley, near Happy Isles,Yosemite National Park, California (Fig. 1). The tim-ing of the impacts of the rock falls was recorded by seismographic stationsas much as 200 km away in central California and western Nevada. We es-timated the volume of the rock fall from visual estimates of the dimensionsof the rock-fall release area calibrated by Global Positioning Satellite read-ings made from a helicopter by National Park Service observers. The sourceof the rock fall was an arch of exfoliating rock about 150 m long, rangingfrom 10 to 40 m high, and estimated to be between 6 and 9 m thick, the ma-jority of which detached in two large blocks. These two blocks slid down asteeply inclined ramp or shelf and then fell on a ballistic trajectory about500 m (vertical) before hitting the northern part of a talus slope at the baseof a cliff above the Nature Center at Happy Isles. The remaining southernparts of the arch, which fell later that night and next morning (Snyder, 1996)slid down a chute and landed on the southern part of the talus (Fig. 2).
The impacts of the blocks generated atmospheric pressure waves result-ing in a wind (hereafter, airblast) comparable in velocity to that of a tornadoor hurricane. The airblast uprooted and snapped about a thousand treeswithin an area of ~0.13 km2 extending from the impacts on preexisting talusout to a bridge over the Merced River at Happy Isles 540 m away. Fallingtrees damaged the Happy Isles Nature Center, crushed a snack bar, destroyeda bridge, killed a hiker, and seriously injured several others. Just after the air-blast a billowy dense sandy cloud of pulverized rock descended from the im-pact site toward the nature center, abrading trees and depositing gravellycoarse sand. Dust from the cloud rose rapidly into the air and plunged thearea near Happy Isles into darkness for some minutes.
75
Unusual July 10, 1996, rock fall at Happy Isles,Yosemite National Park,California
Gerald F. Wieczorek* U.S. Geological Survey, M.S. 955, National Center, Reston, Virginia 20192
James B. Snyder National Park Service, P.O. Box 577, Yosemite National Park, California 95389
Richard B. Waitt Cascades Volcano Observatory, U.S. Geological Survey, Vancouver, Washington 98661
Meghan M. Morrissey Department of Geology and Geological Engineering, Colorado School of Mines,Golden, Colorado 80401
Robert A. Uhrhammer Berkeley Seismological Laboratory, University of California, Berkeley, California 94720
Edwin L. Harp U.S. Geological Survey, M.S. 966, Box 25046, Denver Federal Center, Denver, Colorado 80225
Robert D. Norris U.S. Geological Survey, Department of Geophysics, Box 351650, University of Washington,Seattle, Washington 98195
Marcus I. Bursik Department of Geology, State University of New York, Buffalo, New York 14260Lee G. Finewood
GSA Bulletin; January 2000; v. 112; no. 1; p.75–85; 11 figures; 2 tables.
*E-mail: [email protected].
}

WIECZOREK ET AL.
76 Geological Society of America Bulletin, January 2000
GEOLOGIC SETTING
Yosemite Valley is in the glaciated headward segment of the MercedRiver canyon in the central Sierra Nevada. Pleistocene glaciers deepenedand broadened the valley. The source or release of the Happy Isles rock fall(1920–2000 m) was above the ~1767 m level of the ice at the maximum ex-tent of the most recent (Tioga) major glaciation (Fig. 1; Matthes, 1930),ca. 20 ka (Alpha et al., 1987; Huber, 1987). Below this level of glaciation,the cliff is very steep and nearly devoid of vegetation. Above this level, thecliff is less steep and there is extensive root penetration into the jointed,weathered rock.
Extensive historic and prehistoric rock-fall deposits have accumulated atthe base of the steep glaciated walls of the Yosemite Valley (Wieczoreket al., 1992). Earthquakes, rain storms, snowmelt, and freeze-thaw effectshave historically caused rock falls in Yosemite, but more than half of theabout 400 documented historical rock falls have occurred without a recog-nized or reported triggering event (Wieczorek and Jäger, 1996).
The Happy Isles rock fall occurred on a sunny day without an apparenttriggering event such as an earthquake or storm. The preceding period hadbeen relatively dry; only 16 mm of rain had fallen within the preceding 47days. Heavy late melting winter snows supplied subsurface water drainingtoward the release well into the summer. A small amount of water contin-ued to drain from joints in the release area during the day(s) following therock fall. Even a small amount of water forming a column in a narrow crackor joint that does not freely drain can exert cleft pressure, reducing the sta-bility of a rock mass. Black streaks of staining on the rock face indicatepaths where water has historically seeped through the jointed rock mass.Seasonal discharge from a septic field upslope of the release possibly con-tributed to recharging ground water, but infiltration from rainfall andsnowmelt creates natural seeps at many locations along the valley’s cliffs.Seeps at the rock-fall release were draining at the end of the normally drysummer period in September 1998, even though the septic field had ceasedoperation by August 1997. Because the magnitude of pore-water pressuresis difficult to assess at the release, the timing of the rock fall during a rela-tively dry period suggests that the role of pore-water pressure as a trigger ofthis rock fall is equivocal.
A combination of repeated cycles of freeze-thaw of water in joints, rootpenetration and wedging, or stress relief following deglaciation likely led tothe gradual weakening and failure of the arch. The release of the arch prob-ably initiated by sliding down the intersection of steeply inclined joints(Gilliam, 1998). A stand of pine and oak trees in earlier photos had grownalong the joints defining the back of the arch; roots as thick as 20 cm hadgrown down into the joints. The roots may have wedged the arch apart asthey penetrated deeper.
The arch-like rock mass involved in the Happy Isles rock fall event wascomposed of granodioritic and tonalitic rocks from a unit included in theSentinel Granodiorite by Calkins (in Matthes, 1930), later mapped as thegranodiorite of Glacier Point by D. L. Peck (1997, written commun.). Be-low the source area this granodiorite overlies the Half Dome Granodioritealong a sharp contact that dips steeply west.
Arches along the steep walls of Yosemite Valley develop as joint-boundedblocks break loose from beneath more massive, less jointed rock. Mostarches collapse before becoming completely free standing. Collapse of de-
veloping arches on the valley walls produces large talus piles, as existedabove Happy Isles before this rock-fall event. Historical photographs docu-ment several of the rock-fall events during the development of the archabove Happy Isles. The August 2, 1938, rock fall created much noise anddust and added considerably to the talus pile, yet caused no damage. A lowridge topped by large boulders near the Happy Isles Nature Center probablyformed by a prehistoric rock fall (Fig. 2).
DYNAMICS OF ROCK FALL
Although the entire rock-fall event from release to impact was not ob-served, the process can be partially reconstructed from eyewitness accounts,seismographic recordings, field evidence, and calculations. The north wingof the arch collapsed first, breaking into two blocks (hereafter, blocks A andB) that slid about 235 m (slope distance) along a shelf before falling off thecliff (Fig. 3). Park Service interpreter Geoff Green saw two blocks fallingwithin several seconds of each other from the rim southeast of Glacier Point.The mechanism of failure of the arch or the type(s) of movement the rockmass constituting the arch underwent as it collapsed before reaching theramp are not known. Subsequent measurement of joint orientations in therelease area combined with stereographic slope stability analyses indicatethat toppling was not as likely to be the initial type of movement involved incollapse of the arch as sliding of blocks or wedges controlled by steeply dip-ping joint planes and/or joint intersections (Gilliam, 1998).
Rock falls have previously been recorded and recognized using seismicequipment (Norris, 1994); the impacts of blocks A and B at Happy Isles wererecorded at 6:52 pm by seismographic stations as much as 200 km away.The second and larger impact had a local magnitude (ML) of 2.15, deter-mined from Wood-Anderson seismographs synthesized from recordings atthe three closest broadband stations, which were within 80 km of HappyIsles (Uhrhammer, 1996). The prominent phases recorded on the record(Fig. 4) are consistent with two impacts 13.6 s apart, the amplitude of the sec-ond event about four times the amplitude of the first event.
Merced
River
JOH
N
MUIRTRAIL
Yosemite Valley
Glacier Point Grizzly
Peak
Sierra Point
Royal Arches
N
RI
Happy IslesNature Center
Figure 6
37º45' N119º34' W
0 0.5 Km
CALIFORNIA
YosemiteNational Park
Figure 1. Location of Happy Isles rock fall in the east part of theYosemite Valley, California. Rock-fall release (R) is shown by dashesand impact area (I) southeast of Glacier Point. Dark pattern indicatesarea that was above the most recent (Tioga) glaciation. Inset is map ofCalifornia showing location of Yosemite National Park.

ROCK FALL, HAPPY ISLES,YOSEMITE NATIONAL PARK, CALIFORNIA
Geological Society of America Bulletin, January 2000 77
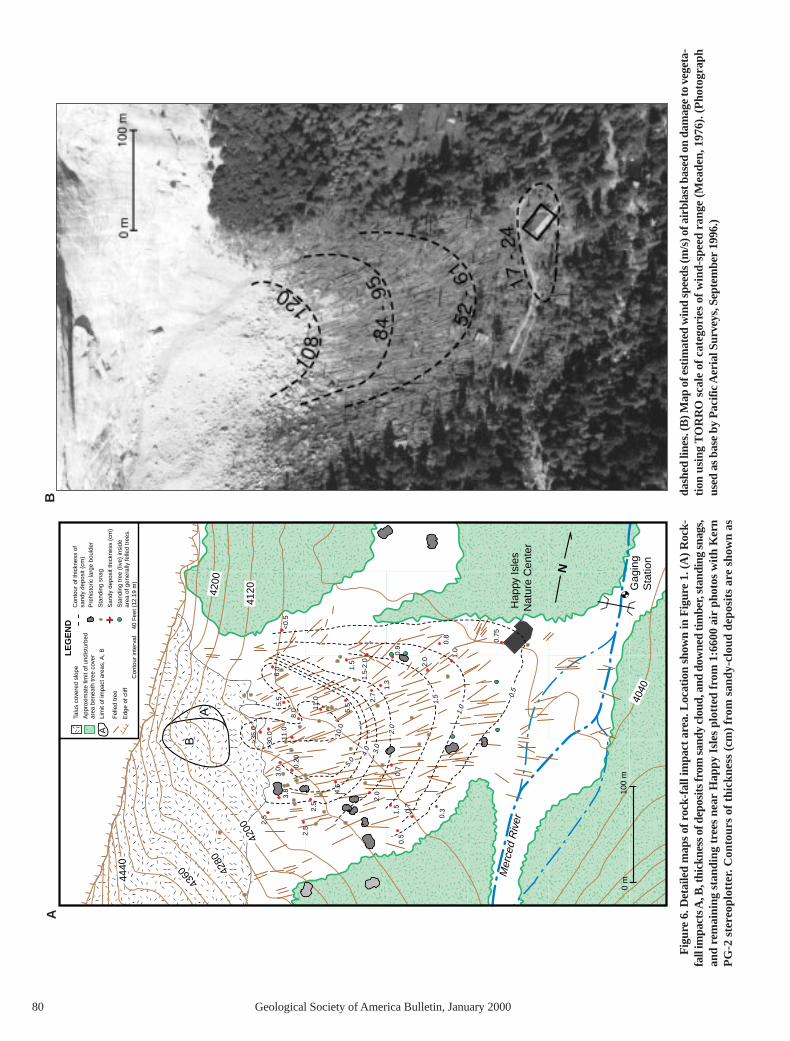
During travel down the steep ramp, which averaged about 47º, the blocksgained sufficient horizontal velocity to clear the base of the steep cliff by30–60 m (Fig. 5), which we measured by pacing in the field and locating onaerial photographs. The sequence and relative size of these two falling blockswas confirmed by inspection of the impact-area talus beyond the foot of thecliff. A low mound of freshly crushed and broken rock at the north edge ofthe talus indicates the impact of the first smaller block A. A larger disaggre-gated mass of rocks from the impact of the second, much larger, block Boverlies the mound of rocky debris from block A to the southeast (Fig. 6A).
We calculated the velocity of the rock fall using the algorithm in the Ap-pendix. The algorithm requires as input the cliff profile, the release eleva-tion, the beginning of free fall elevation, and the valley floor elevation at im-pact. The algorithm numerically integrates the equations of motion in twodimensions (x, z) and it gives the position and related parameters of the cen-ter of mass every 10 ms. The release elevation of the approximate center ofmass of block B (1940 m) was used in conjunction with a digitized profilealong the path from release to impact taken from the contours of the1:24,000-scale U.S. Geological Survey Half Dome topographic map. In or-der to simplify the algorithm, it is assumed that the block went ballistic at
an elevation of about 1770 m, a break in slope corresponding to the formerlevel of Tioga glaciation. From field and air photo observation, the center ofimpact B on the valley floor was about 480 m (±15 m) from the release,which corresponds to a position of x = 500 m (Fig. 5) because the profile be-gins 20 m west of the release. The impact occurred at an elevation of about1275 m. If we assumed a frictionless surface for motion along the shelf withno air drag, the velocity at impact on the talus would be about 120 m/s witha total transit time (sliding and projectile) of about 12.4 s. An example of theoutput from the algorithm is given in Table A1.
The relatively high calculated velocity (70 m/s) of the block by the endof the ramp suggests that either the coefficient of friction must have beenvery low and/or that the block had an initial velocity. A short free fall of thecollapsing arch onto the ramp might have imparted an initial velocity to theblock before it commenced traveling down the steep ramp. The block couldhave moved down the ramp by sliding, rolling, bouncing, or by a combina-tion thereof, resulting in a range of friction values. We evaluated the effectof introducing friction on the shelf by using a relatively low coefficient ofsliding friction of 0.1 in the algorithm, which reduced the impact velocityby about 2 m/s and the impact range by about 9 m. The block probablymoved over rocky debris or logs on the ramp that acted as rollers or ballbearings, effectively reducing the frictional resistance. The effects of airdrag are not as significant as those of friction on the velocity. Dependingupon the shape of the block air drag will reduce the impact velocity by about1 m/s and the impact range will be decreased about 5 m.
Other techniques for calculating the velocity of the block (Haneberg andBauer, 1993; Pfeiffer et al., 1993) yielded slightly lower results of about110 m/s at impact. Considering the differences in these various methodolo-gies, including different basic assumptions and data necessary for perform-ing each calculation, and possible, but unknown initial velocity conditionsof the block at release, the difference in calculated results of between 110and 120 m/s are probably not significant.
The length of time between the two impacts from the seismograph record(13.6 s) suggests that the impact of blockA could have seismically triggeredthe failure of block B. If the travel time from release to impact is 12.4 s, ascalculated in the algorithm, then the first impact occurred about 1.2 s beforethe release of block B. If compression (P) and shear (S) waves travel at 6 and4 km/s, respectively, in granite, and the distance from release to impact isabout 850 m (the actual wave path through rock is slightly longer than thepoint to point travel distance of 820 m partially through the air), then thewaves reached the release in about 0.1 and 0.2 s, respectively, about 1 s be-fore the failure of block B. Without knowing prefailure geometry and geo-logic site conditions, it is not possible to perform a slope stability analysis todetermine if the waves were sufficiently strong to have triggered the failureof block B. The postfailure geologic conditions near the release, includingmultiple (six) major joint sets, joint alteration, and the presence of joint wa-ter (Gilliam, 1998), suggest an increased probability of failure during shak-ing according to a method of assessing regional seismic rock-fall suscepti-bility by Harp and Noble (1993).
Smaller pieces of the arch fell later that evening and early the next morning(blocks C and D), but these blocks from the southern, thinner end of the archtook a different path than the blocks that had fallen earlier. Instead of slidingon the ramp and then free falling, blocks C and D disaggregated as they fol-lowed a chute to the southeast that funneled onto the apex of the talus (Fig. 2).
NatureCenter
Low Ridge
Limit ofDisturbance
Talus
Figure 2. Rock-fall release (blocks A, B, C, and D), steeply inclinedshelf, impact areas (A, B) (C, D) on talus, limit of disturbance by air-blast and dense sandy cloud, low ridge of prehistoric rock fall, and na-ture center. Scale is approximate. Locations of release, impact area, andnature center shown in Figure 1. (Photograph by Pacific Aerial Sur-veys, September, 1996.)

Smaller pieces of the arch continued to collapse, slide, and fall during the fol-lowing days and weeks, continuing until at least early August. A similar pe-riod of extended small rock falls continued for about one month after a largerock fall at Middle Brother in the Yosemite Valley (Wieczorek et al., 1995).
AIRBLAST
Ernie Milan, while working on the John Muir Trail, was 360 m east of theimpact: he heard a roaring sound, like a jet engine, close overhead, then sawa dark billowy cloud moving slowly and quietly from the impact area on thetalus toward the Happy Isles Nature Center. According to a park visitor“there were two big booms, then the cloud started forming.” The dust camequickly, enveloping Happy Isles “like a tornado” according to another visitor(Snyder, 1996). Ernie Milan noted that the sky went black for six minutesas the dust raised by the cloud blocked out the late afternoon light. The twobooms probably corresponded to impacts A and B, the roaring sound like ajet engine probably the airblast(s) the impact(s) generated.
Impacts A and B generated pressure waves (with compressional and ex-pansion phases) that propagated through the atmosphere away from thesource at a rate of at least that of the local atmospheric speed of sound. Theleading compression wave was likely a weak shock wave (Anderson, 1984).Trailing the first initial compression wave were expansion and compressionwaves. These waves created a wind, or airblast, that was comparable in in-tensity to that of a tornado or hurricane. Like a tornado or hurricane, the air-blast intensity is manifested in the type and extent of damage done to struc-tures and vegetation.
The velocity of the airblast was estimated from downed trees using theTORRO Tornado Intensity Scale (Meaden, 1976). The TORRO intensityscale estimates the wind speed of a tornado from the type of damage it causedto buildings and trees. For example, tornadoes with speeds of 120–130 m/swill levitate a house and uproot large trees.
In the seconds before impact B, the local atmosphere may have containeddust from the pulverized rock of impact A. The addition of dust into the at-mosphere lowers the speed of sound for pure air (340 m/s). Within 10–20 m
from impact B, where trees are completely destroyed, the airblast probablytraveled at velocities approaching the speed of sound of the local dusty at-mosphere (120–130 m/s). These velocities are consistent with those calcu-lated by a numerical model of the atmospheric dynamic response (velocity,pressure, internal energy, and dust concentration) to the impact (Morrisseyet al., 1997). Results of this modeling, more vigorous than that of Kieffer(1981), account for turbulence, heat, and drag effects between the dust andair and suggest that the atmosphere may have contained up to 50% byweight dust prior to impact B.
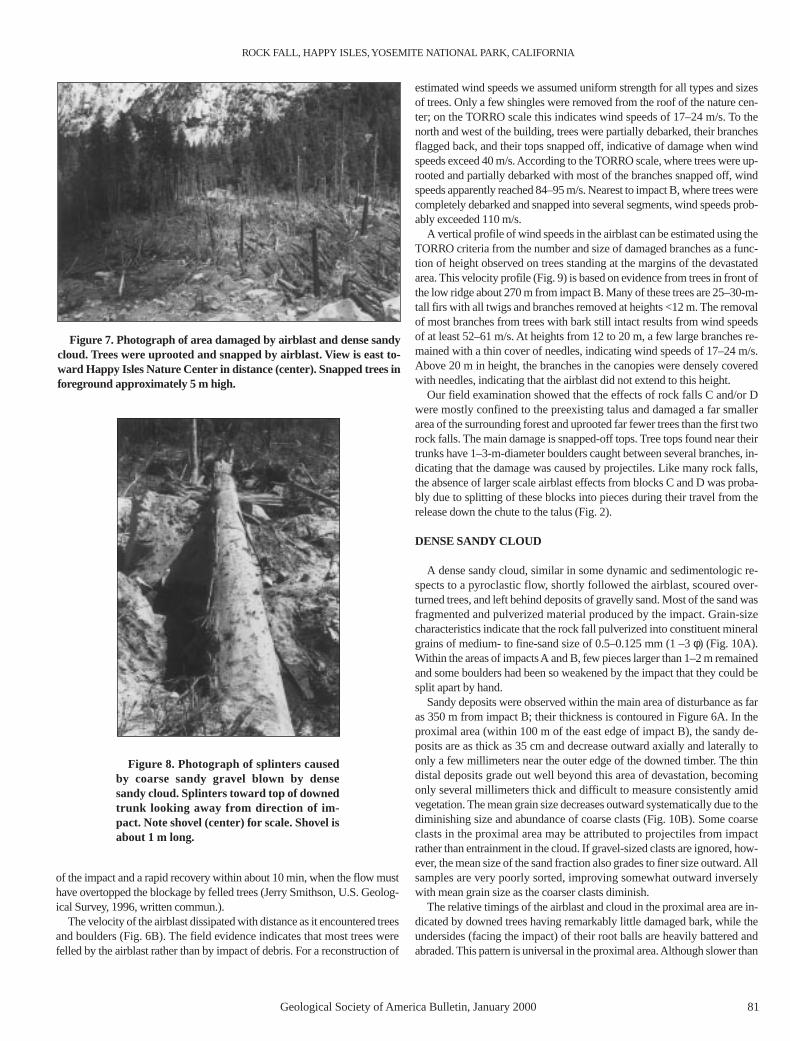
The most obvious damage inflicted on the forest was uprooting and snap-ping of about 1000 trees within a 350–500 m radius of the impacts, a processdescribed as windthrow (Fig. 7). The forest is composed of mixed conifers(Douglas fir, incense cedar, yellow [ponderosa] pine, red fir) and broadleaftrees (bigleaf maple, white alder, black oak) ranging from saplings to maturetrees 1.5 m in diameter and 40 m tall. Almost all the larger trees toppled in aneastward direction, their roots pulled out.
The major pattern of downed trees formed a radiating, bilaterally sym-metrical fan with a central azimuth of 055º–060º, consistent with an airblastfrom impact B (Fig. 6A). Minor variations on this major pattern along thenorth edge of downed timber include a few trees downed toward azimuth080º, which are overlapped by trees of the major pattern (055º–060º). Thesefew trees may have fallen toward azimuth 080º prior to the airblast from im-pact B. Another variation to the major trend was observed near the southmargin where large trees downed toward azimuth 100º are overlain by smalltrees downed toward 040º. These variations in the patterns of downed trees,which are not particularly well distinguished in Figure 6A, could indicate
WIECZOREK ET AL.
78 Geological Society of America Bulletin, January 2000
Figure 3. Rock-fall release (center) and steeply inclined ramp alongwhich blocks slid from left to right before beginning free fall beyondright edge of photograph. Yosemite Valley and Royal Arches are inbackground. Approximate length of ramp from release (center) tolower right edge of photo is 235 m. (Photograph by Doug Roe, NationalPark Service.)
S1 S2T
R
ZP1 Lr1
Lr2
4030 50 60 70 80
Time (s)
–800
–400
0
400
800
–800
–400
0
400
800
–800
–400
0
400
800
Vel
ocity
(
10–9
m/s
)x
Figure 4. Broadband recordings from a Berkeley Digital SeismicNetwork station 50 km southeast of the Happy Isles rock-fall impact(from Uhrhammer, 1996). The records have been band-pass filteredfrom 0.55 to 5.0 Hz, and the horizontal components have been rotatedto radial (R) and transverse (T). The top figure shows the vertical com-ponent (Z). The prominent phases of the compression wave, P, theshear wave, S, and the Rayleigh wave, Lr recorded on the record areconsistent with two impacts A and B, separated in time by 13.6 s. ThusS1 indicates the time of arrival of the shear wave from the first impactA, and S2 signifies the shear wave from the second impact B.
ROCK FALL, HAPPY ISLES,YOSEMITE NATIONAL PARK, CALIFORNIA
Geological Society of America Bulletin, January 2000 79
some nonuniformity in response with respect to the timing or direction offalling trees. Alternatively, the combination of downed tree patterns suggestsa possible sequence of events: (1) a relatively small airblast on the northfrom impact A felled trees eastward (080º); (2) the main blast that radiatedfrom impact B (055º–060º) felled most trees; and (3) a small blast on thesouth felled trees northeastward (040º) perhaps from later events or rock fallD, or waves redeflected (100º) from impact B by a line of large boulderstrending east-west along the southern edge of affected area. These minorvariations in the pattern of downed trees are probably not significant in lightof the extent and severity of the effects from the major pattern of downedtrees from the airblast from impact B.
The effects of the airblast on vegetation varied with direction and distancefrom the impacts. Near the north edge of the impact B moist soil fromsprings may have aided the toppling of trees. Near impact A, fallen trees thatwere either snapped or uprooted lay across one another. In areas near the cliffsome of the trees fell by collision with falling or deflected rock: both downedand standing trees are bruised, and many boulder-sized fragments are amongthem. In contrast, nearly all trees proximal to impact B are uprooted and arealigned in a fan shape in the direction of the Happy Isles Nature Center. Theregion damaged by the airblast from impact B is roughly triangular with a50º–60º divergence angle and extends ~500 m downslope from the impactarea. Within 20 m of impact, downed trees are found broken into 10–40 cmsections with much bark removed, branches snapped off, and some surfacesimpregnated with rock fragments. Timber in this area is discontinuously sur-rounded by a >35 cm depth of debris composed of rock fragments and sandydust. At distances of 20–100 m from impact, trunks of fallen trees are in onepiece and covered by sandy dust; branches are removed from the upward-
facing side and those trees that remain standing have branches that are bentaround the trunk.
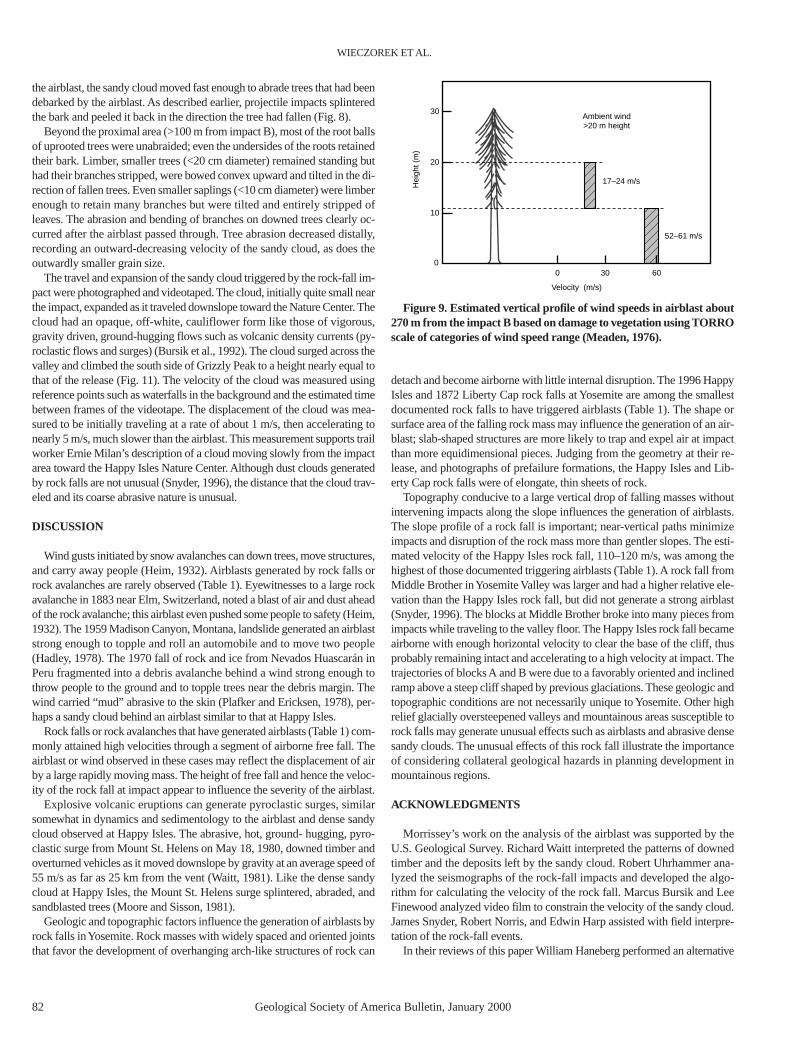
On surfaces where branches have been snapped off, strips of bark havebeen removed and sandy debris is wedged beneath the edges of intact bark.On fallen trunks the debarking process apparently occurred after the treesfell, and may have been initiated by ballistic projectiles of rock fragmentsthat splintered patches of bark and were later sheared off by the coarse ma-terial in the sandy cloud that followed (Fig. 8). At distances of 100–200 mfrom impact, fallen trees were uprooted; only a few remained standing, andthose had the upper 10–15 m snapped off. Most of the bark remained intact,but the bark was in places splintered, with embedded fragments of rock andtree branches.
At the nature center, about 340 m from impact B, many trees remainedstanding, a few with their top 10–15 m snapped off at heights roughly equalto that of the roof. The building and adjacent trees may have been somewhatprotected from the airblast by a low ridge 70 m upslope with a height at aboutthe same elevation as the roof (Fig. 5). The ridge, created by a prehistoricrock slide, apparently helped to deflect the blast upward, in the process shad-owing the nature center. As the blast moved over the ridge, flow separationprobably occurred, forming an eddy behind the ridge (Finnigan and Brunet,1995). Beyond the ridge some of the energy in the airblast dissipated and thefew fallen trees crossed each other. Branches and even leaves on low trees upto the height of the ridge were largely intact. Beyond the nature center largefallen trees crushed the snack bar (where the fatality and injuries occurred).A pedestrian bridge about 400 m from impact was also crushed and theMerced River temporarily dammed by a fallen tree. A recording streamgauge showed an instantaneous drop of 10 cm in river level at about the time
0 100 200 300 400 500 600 700 800 900 1000 1100
Distance (m)
1200
1300
1400
1500
1600
1700
1800
1900
2000
Ele
vatio
n (
m a
bove
msl
)Release
Merced River
Shelf
Impact
Happy IslesNature Center
Low Ridge
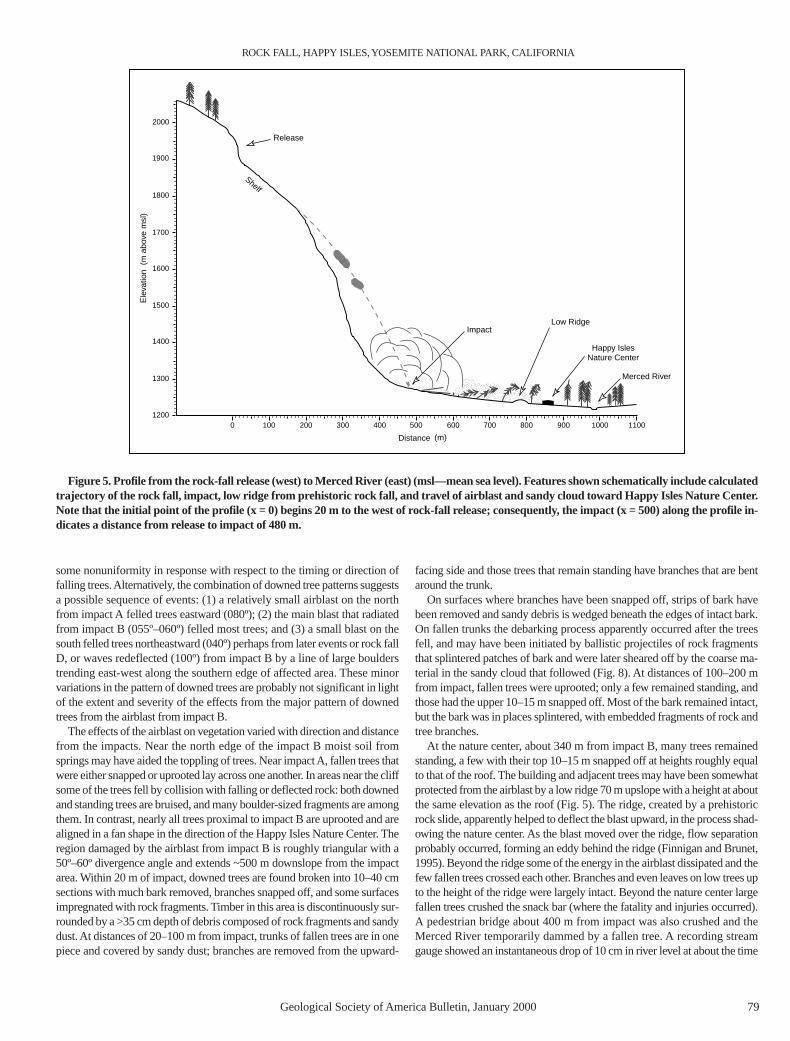
Figure 5. Profile from the rock-fall release (west) to Merced River (east) (msl—mean sea level). Features shown schematically include calculatedtrajectory of the rock fall, impact, low ridge from prehistoric rock fall, and travel of airblast and sandy cloud toward Happy Isles Nature Center.Note that the initial point of the profile (x = 0) begins 20 m to the west of rock-fall release; consequently, the impact (x = 500) along the profile in-dicates a distance from release to impact of 480 m.
80 Geological Society of America Bulletin, January 2000
BA
<0.
56.
0
11.05.5
8.0
10.0
0.20
>35
.0
>30
.0 11.0
5.5
2.7
1.3
1.5
1.5-
2.0
0.9
0.8
2.0
0.5
1.0
1.5
2.0
4.0 3.0
5.0
0.75
1.0
0.7
1.5
2.04.
5
2.5
2.5
2.5
3.8
0.3
0.7
0.5
3.0
Mer
ced
Riv
er
LEG
EN
D
Con
tour
inte
rval
4
0 F
eet (
12.1
9 m
)
Edg
e of
clif
f
AF
elle
d tr
ee
App
roxi
mat
e lim
it of
und
istu
rbed
area
ben
eath
tree
cov
er
Talu
s co
vere
d sl
ope
Lim
it of
impa
ct a
reas
, A, B
San
dy d
epos
it th
ickn
ess
(cm
)
Pre
hist
oric
larg
e bo
ulde
r
Sta
ndin
g sn
ag
Sta
ndin
g tr
ee (
live)
insi
dear
ea o
f gen
eral
ly fe
lled
tree
s.
Con
tour
of t
hick
ness
of
sand
y de
posi
t (cm
)
100
m0
m
N
A
4040
4120
4200
4280
4360
4440
4200 Gag
ing
Sta
tion
Hap
py Is
les
Nat
ure
Cen
ter
B
Fig
ure
6. D
etai
led
map
s of
roc
k-fa
ll im
pact
are
a. L
ocat
ion
show
n in
Fig
ure
1. (
A)R
ock-
fall
impa
cts
A,B
,thi
ckne
ss o
f dep
osits
from
san
dy c
loud
,and
dow
ned
timbe
r,st
andi
ng s
nags
,an
d re
mai
ning
sta
ndin
g tr
ees
near
Hap
py Is
les
plot
ted
from
1:6
600
air
phot
os w
ith K
ern
PG
-2 s
tere
oplo
tter.
Con
tour
s of
thic
knes
s (c
m)
from
san
dy-c
loud
dep
osits
are
sho
wn
as
dash
ed li
nes.
(B)M
ap o
f est
imat
ed w
ind
spee
ds (m
/s) o
f airb
last
bas
ed o
n da
mag
e to
veg
eta-
tion
usin
g T
OR
RO
sca
le o
f cat
egor
ies
of w
ind-
spee
d ra
nge
(Mea
den,
1976
). (
Pho
togr
aph
used
as
base
by
Pac
ific
Aer
ial S
urve
ys,S
epte
mbe
r 199
6.)
ROCK FALL, HAPPY ISLES,YOSEMITE NATIONAL PARK, CALIFORNIA
Geological Society of America Bulletin, January 2000 81
of the impact and a rapid recovery within about 10 min, when the flow musthave overtopped the blockage by felled trees (Jerry Smithson, U.S. Geolog-ical Survey, 1996, written commun.).
The velocity of the airblast dissipated with distance as it encountered treesand boulders (Fig. 6B). The field evidence indicates that most trees werefelled by the airblast rather than by impact of debris. For a reconstruction of
estimated wind speeds we assumed uniform strength for all types and sizesof trees. Only a few shingles were removed from the roof of the nature cen-ter; on the TORRO scale this indicates wind speeds of 17–24 m/s. To thenorth and west of the building, trees were partially debarked, their branchesflagged back, and their tops snapped off, indicative of damage when windspeeds exceed 40 m/s. According to the TORRO scale, where trees were up-rooted and partially debarked with most of the branches snapped off, windspeeds apparently reached 84–95 m/s. Nearest to impact B, where trees werecompletely debarked and snapped into several segments, wind speeds prob-ably exceeded 110 m/s.
A vertical profile of wind speeds in the airblast can be estimated using theTORRO criteria from the number and size of damaged branches as a func-tion of height observed on trees standing at the margins of the devastatedarea. This velocity profile (Fig. 9) is based on evidence from trees in front ofthe low ridge about 270 m from impact B. Many of these trees are 25–30-m-tall firs with all twigs and branches removed at heights <12 m. The removalof most branches from trees with bark still intact results from wind speedsof at least 52–61 m/s. At heights from 12 to 20 m, a few large branches re-mained with a thin cover of needles, indicating wind speeds of 17–24 m/s.Above 20 m in height, the branches in the canopies were densely coveredwith needles, indicating that the airblast did not extend to this height.
Our field examination showed that the effects of rock falls C and/or Dwere mostly confined to the preexisting talus and damaged a far smallerarea of the surrounding forest and uprooted far fewer trees than the first tworock falls. The main damage is snapped-off tops. Tree tops found near theirtrunks have 1–3-m-diameter boulders caught between several branches, in-dicating that the damage was caused by projectiles. Like many rock falls,the absence of larger scale airblast effects from blocks C and D was proba-bly due to splitting of these blocks into pieces during their travel from therelease down the chute to the talus (Fig. 2).
DENSE SANDY CLOUD
A dense sandy cloud, similar in some dynamic and sedimentologic re-spects to a pyroclastic flow, shortly followed the airblast, scoured over-turned trees, and left behind deposits of gravelly sand. Most of the sand wasfragmented and pulverized material produced by the impact. Grain-sizecharacteristics indicate that the rock fall pulverized into constituent mineralgrains of medium- to fine-sand size of 0.5–0.125 mm (1 –3 φ) (Fig. 10A).Within the areas of impacts A and B, few pieces larger than 1–2 m remainedand some boulders had been so weakened by the impact that they could besplit apart by hand.
Sandy deposits were observed within the main area of disturbance as faras 350 m from impact B; their thickness is contoured in Figure 6A. In theproximal area (within 100 m of the east edge of impact B), the sandy de-posits are as thick as 35 cm and decrease outward axially and laterally toonly a few millimeters near the outer edge of the downed timber. The thindistal deposits grade out well beyond this area of devastation, becomingonly several millimeters thick and difficult to measure consistently amidvegetation. The mean grain size decreases outward systematically due to thediminishing size and abundance of coarse clasts (Fig. 10B). Some coarseclasts in the proximal area may be attributed to projectiles from impactrather than entrainment in the cloud. If gravel-sized clasts are ignored, how-ever, the mean size of the sand fraction also grades to finer size outward. Allsamples are very poorly sorted, improving somewhat outward inverselywith mean grain size as the coarser clasts diminish.
The relative timings of the airblast and cloud in the proximal area are in-dicated by downed trees having remarkably little damaged bark, while theundersides (facing the impact) of their root balls are heavily battered andabraded. This pattern is universal in the proximal area. Although slower than
Figure 7. Photograph of area damaged by airblast and dense sandycloud. Trees were uprooted and snapped by airblast. View is east to-ward Happy Isles Nature Center in distance (center). Snapped trees inforeground approximately 5 m high.
Figure 8. Photograph of splinters causedby coarse sandy gravel blown by densesandy cloud. Splinters toward top of downedtrunk looking away from direction of im-pact. Note shovel (center) for scale. Shovel isabout 1 m long.
WIECZOREK ET AL.
82 Geological Society of America Bulletin, January 2000
the airblast, the sandy cloud moved fast enough to abrade trees that had beendebarked by the airblast. As described earlier, projectile impacts splinteredthe bark and peeled it back in the direction the tree had fallen (Fig. 8).
Beyond the proximal area (>100 m from impact B), most of the root ballsof uprooted trees were unabraided; even the undersides of the roots retainedtheir bark. Limber, smaller trees (<20 cm diameter) remained standing buthad their branches stripped, were bowed convex upward and tilted in the di-rection of fallen trees. Even smaller saplings (<10 cm diameter) were limberenough to retain many branches but were tilted and entirely stripped ofleaves. The abrasion and bending of branches on downed trees clearly oc-curred after the airblast passed through. Tree abrasion decreased distally,recording an outward-decreasing velocity of the sandy cloud, as does theoutwardly smaller grain size.
The travel and expansion of the sandy cloud triggered by the rock-fall im-pact were photographed and videotaped. The cloud, initially quite small nearthe impact, expanded as it traveled downslope toward the Nature Center. Thecloud had an opaque, off-white, cauliflower form like those of vigorous,gravity driven, ground-hugging flows such as volcanic density currents (py-roclastic flows and surges) (Bursik et al., 1992). The cloud surged across thevalley and climbed the south side of Grizzly Peak to a height nearly equal tothat of the release (Fig. 11). The velocity of the cloud was measured usingreference points such as waterfalls in the background and the estimated timebetween frames of the videotape. The displacement of the cloud was mea-sured to be initially traveling at a rate of about 1 m/s, then accelerating tonearly 5 m/s, much slower than the airblast. This measurement supports trailworker Ernie Milan’s description of a cloud moving slowly from the impactarea toward the Happy Isles Nature Center. Although dust clouds generatedby rock falls are not unusual (Snyder, 1996), the distance that the cloud trav-eled and its coarse abrasive nature is unusual.
DISCUSSION
Wind gusts initiated by snow avalanches can down trees, move structures,and carry away people (Heim, 1932). Airblasts generated by rock falls orrock avalanches are rarely observed (Table 1). Eyewitnesses to a large rockavalanche in 1883 near Elm, Switzerland, noted a blast of air and dust aheadof the rock avalanche; this airblast even pushed some people to safety (Heim,1932). The 1959 Madison Canyon, Montana, landslide generated an airblaststrong enough to topple and roll an automobile and to move two people(Hadley, 1978). The 1970 fall of rock and ice from Nevados Huascarán inPeru fragmented into a debris avalanche behind a wind strong enough tothrow people to the ground and to topple trees near the debris margin. Thewind carried “mud” abrasive to the skin (Plafker and Ericksen, 1978), per-haps a sandy cloud behind an airblast similar to that at Happy Isles.
Rock falls or rock avalanches that have generated airblasts (Table 1) com-monly attained high velocities through a segment of airborne free fall. Theairblast or wind observed in these cases may reflect the displacement of airby a large rapidly moving mass. The height of free fall and hence the veloc-ity of the rock fall at impact appear to influence the severity of the airblast.
Explosive volcanic eruptions can generate pyroclastic surges, similarsomewhat in dynamics and sedimentology to the airblast and dense sandycloud observed at Happy Isles. The abrasive, hot, ground- hugging, pyro-clastic surge from Mount St. Helens on May 18, 1980, downed timber andoverturned vehicles as it moved downslope by gravity at an average speed of55 m/s as far as 25 km from the vent (Waitt, 1981). Like the dense sandycloud at Happy Isles, the Mount St. Helens surge splintered, abraded, andsandblasted trees (Moore and Sisson, 1981).
Geologic and topographic factors influence the generation of airblasts byrock falls in Yosemite. Rock masses with widely spaced and oriented jointsthat favor the development of overhanging arch-like structures of rock can
detach and become airborne with little internal disruption. The 1996 HappyIsles and 1872 Liberty Cap rock falls at Yosemite are among the smallestdocumented rock falls to have triggered airblasts (Table 1). The shape orsurface area of the falling rock mass may influence the generation of an air-blast; slab-shaped structures are more likely to trap and expel air at impactthan more equidimensional pieces. Judging from the geometry at their re-lease, and photographs of prefailure formations, the Happy Isles and Lib-erty Cap rock falls were of elongate, thin sheets of rock.
Topography conducive to a large vertical drop of falling masses withoutintervening impacts along the slope influences the generation of airblasts.The slope profile of a rock fall is important; near-vertical paths minimizeimpacts and disruption of the rock mass more than gentler slopes. The esti-mated velocity of the Happy Isles rock fall, 110–120 m/s, was among thehighest of those documented triggering airblasts (Table 1). A rock fall fromMiddle Brother in Yosemite Valley was larger and had a higher relative ele-vation than the Happy Isles rock fall, but did not generate a strong airblast(Snyder, 1996). The blocks at Middle Brother broke into many pieces fromimpacts while traveling to the valley floor. The Happy Isles rock fall becameairborne with enough horizontal velocity to clear the base of the cliff, thusprobably remaining intact and accelerating to a high velocity at impact. Thetrajectories of blocks A and B were due to a favorably oriented and inclinedramp above a steep cliff shaped by previous glaciations. These geologic andtopographic conditions are not necessarily unique to Yosemite. Other highrelief glacially oversteepened valleys and mountainous areas susceptible torock falls may generate unusual effects such as airblasts and abrasive densesandy clouds. The unusual effects of this rock fall illustrate the importanceof considering collateral geological hazards in planning development inmountainous regions.
ACKNOWLEDGMENTS
Morrissey’s work on the analysis of the airblast was supported by theU.S. Geological Survey. Richard Waitt interpreted the patterns of downedtimber and the deposits left by the sandy cloud. Robert Uhrhammer ana-lyzed the seismographs of the rock-fall impacts and developed the algo-rithm for calculating the velocity of the rock fall. Marcus Bursik and LeeFinewood analyzed video film to constrain the velocity of the sandy cloud.James Snyder, Robert Norris, and Edwin Harp assisted with field interpre-tation of the rock-fall events.
In their reviews of this paper William Haneberg performed an alternative
Ambient wind>20 m height
17–24 m/s
52–61 m/s
Velocity (m/s)
0 30 60
Hei
ght (
m)
0
10
20
30
Figure 9. Estimated vertical profile of wind speeds in airblast about270 m from the impact B based on damage to vegetation using TORROscale of categories of wind speed range (Meaden, 1976).

ROCK FALL, HAPPY ISLES,YOSEMITE NATIONAL PARK, CALIFORNIA
Geological Society of America Bulletin, January 2000 83
analysis to determine the velocity of the rock fall and Richard Iverson madeworthwhile comments that resulted in significant improvements. SarinaLambert and Jack Phinney of the National Park Service assisted with the col-lection of samples of sandy deposits. David Walter provided his series ofphotographs of the cloud following impact. Dan Gilliam, graduate student atRadford University, conducted studies of the rock-fall release area. Severalcolleagues at the U.S. Geological Survey assisted with this study: Rex Baumsupervised the geotechnical laboratory work, Chris Catherman preparedgraphic imagery, Lou Thompson developed photography, and John Unger,George Plafker, and King Huber reviewed early versions of the paper.
APPENDIX. ALGORITHM FOR VELOCITY OF ROCK FALL
Trajectory Program
cc.…. calculate rock trajectory assuming frictionless shelfc and no air drag
cimplicit noneinteger*4 I, nreal*8 xx(10000), zz(10000)real*8 g, dt, z, x, vz, vx, t, gz, gx, v, theta, angle
copen(10,file=‘YRF_prof_meters.data’,status=‘old’)I=0
1 I=I+1read(10,’(2f10.3)’,end=2) xx(I),zz(I)
cc.…. assume that release is centered at 1940 m elevationc
if(zz(I).gt.1940.d0) thenI=I-1endifgo to 1
2 n=I-1close(10)
0
10
20
30
40
50
60
70
80
90
100
–6 –5 –4 –3 –2 –1 0 1 2 3 4 5 6
Cum
ulat
ive
perc
ent
coar
ser
Grain size
phi
Gravel Sand Silt
32 16 8 4 2 1 0.5 0.25 0.125 0.063 0.031 0.016 mm64
YOS 96.1 (A)YOS 96.1 (B)YOS 96.1 (C)YOS 96.1 (D)YOS 96.1 (E)YOS 96.1 (F)YOS 96.1 (G)YOS 96.1 (H)YOS 96.1 (I)YOS 96.1 (S)
A
-1
0
1
2
3
4
Mean sizeSorting
Gra
in s
ize
(ph
i)
Distance from impact (m)
0 100 200 30050 150 250
(A)
(B)
(C)(D)
(E)
(F)
(G) (H) (I) (S)
2
1
0.5
0.25
0.125
0.063
Gra
in s
ize
(m
m)
B
Figure 10. Grain-size characteristics ofsandy cloud. (A) Summary of grain-size dis-tribution of deposits from samples takenalong approximate central flow path fromedge of impact B to Happy Isles Nature Cen-ter. Pan fraction (finer than 4φ) is unanalyzedand arbitrarily plotted at 5 φ for all samples.(B) Mean particle size and sorting as a func-tion of distance from impact. Mean is Folk’s(1974) graphic mean (Mz), sorting Folk’s in-clusive graphic standard deviation (σI).

84 Geological Society of America Bulletin, January 2000
Figure 11. Series of photographs (first 5 of 12) showing the evolutionof the sandy cloud produced by the Happy Isles rock-fall impact. Thebillowing flow front expands both laterally and vertically as it movesout into the valley. The path of the rock fall is denoted by the rising dustcolumn along the cliffs on the right side in each photo. The photos weretaken by David F. Walter (used with permission) while climbing atRoyal Arches, ~1.8 km northeast of the Happy Isles Nature Center.
TABLE 1. ROCK FALL CHARACTERISTICS AND AIRBLAST EFFECTS
Rock fall Volume Height of fall Velocity Airblast effects Source(106 m3) (m) (m/s)
Goldau, Switzerland (1806) 30–40 1040 40*–70* Herdsman and goats picked up and whirled into the air; Heim (1932)four children picked up into the air
Nevados Huascarán, 50–100 600† 78*–>200 People knocked down; many wind-toppled large trees, Plafker and Ericksen Peru (1970) leaves stripped from trees and brush; airblast with (1978)
abrasive mud stripped vegetation and abraded skinElm, Switzerland (1882) 10 570 50*–100 Several people lifted into the air and carried; well- Heim (1932)
constructed wooden houses lifted; trees bentHappy Isles, California (1996) 0.03 550 110–120 About 1000 trees toppled and snapped; branches bent; This report
abrasive sandy cloud stripped bark and vegetationLiberty Cap, California (1872) 0.04 275 70 Collapsed weak structure; slightly moved another well- Wieczorek et al. (1992)
constructed building; knocked man to groundLos Chocoyos, Guatemala (1976) 1.2 100 >28 Bent a few small trees, moved blocks of adobe and Harp et al. (1981)
road pavementMadison Canyon, Montana (1959) 21 90 50 Tumbled car, lifted and carried two people into the air Hadley (1978)
Note: Rock-fall velocities are estimated by several methods, hence comparisons are only approximate.*These reported values should be considered as average velocities.†Distance of initial free fall of rock and ice from west face of Nevados Huascarán. From below the west face the debris accelerated down Glacier 511 for a slope distance of
2.4 km with a vertical drop of nearly 1 km, with parts of the debris becoming air launched near the base of the glacier (Plafker and Ericksen, 1978).
1 4
2
3
5

ROCK FALL, HAPPY ISLES,YOSEMITE NATIONAL PARK, CALIFORNIA
Geological Society of America Bulletin, January 2000 85
cg=9.8d0dt=0.001d0z=zz(1)x=xx(1)vz=0.d0vx=0.d0t=0.d0I=1
3 I=I+1if(i.gt.n) go to 5
cc.…. assume that rock goes ballistic at 1768 m elevationc
if(z.gt.1768.0d0) thentheta=datand((xx(I)-xx(I-1))/(zz(I-1)-zz(I)))gz=-g*0.90d0*dcosd(theta)gx= g*0.90d0*dsind(theta)elsegz=-ggx=0.d0endif
4 t=t+dtcc.…. assume impact occurs above 1270 m elevationc
if(z.lt.1270.d0) go to 5vz=vz+gz*dtz=z+vz*dtif(z.gt.1768.d0) thenvx =-vz*dtand(theta)endifx=x+vx*dtv=dsqrt(vx*vx+vz*vz)angle=datan2d(-vz,vx)write(*,’(9f10.3)’) x, vx, gx, z, vz, gz, angle, v, tif(z.lt.1270.d0) go to 5if(z.lt.zz(I+1)) go to 3go to 4
5 continuec
stopend
Where:x = range in meters
vx = x velocityax = x accelerationz = elevation in metersvz = z velocityaz = z accelerationangle = trajectory angle from horizontal
REFERENCES CITED
Alpha, T. R., Wahrhaftig, C., and Huber, N. K., 1987, Oblique map showing maximum extent of20,000-year-old (Tioga) glaciers,Yosemite National Park, Central Sierra Nevada, California:U.S. Geological Survey Miscellaneous Investigations Series Map I-1885, 1 sheet.
Anderson, J. D., 1984, Fundamentals of aerodynamics: New York, McGraw-Hill, 563 p.Bursik, M. I., Sparks, R. J. S., Carey, S. N., and Gilbert, J. S., 1992, Sedimentation of tephra by vol-
canic plumes, I. Theory and its comparison with a study of the Fogo A Plinian deposit SaoMiguel (Azores): Bulletin of Volcanology, v. 54, p. 329–344.
Finnigan, J. J., and Brunet,Y., 1995, Turbulent airflow in forests on flat and hilly terrain,in Coutts,M. P., and Grace, J., eds., Wind and trees: Cambridge, Cambridge University Press, p. 3–39.
Folk, R. L., 1974, Petrology of sedimentary rocks:Austin, Texas, Hemphill Publishing Co., 182 p.Gilliam, D. R., 1998,A structural and mechanical analysis of the Happy Isles rockfall, July 10, 1996,
Yosemite National Park, Mariposa County, California [Master’s thesis]: Radford, Virginia,Radford University, 172 p.
Hadley, J. B., 1978, Madison Canyon rockslide, Montana, U.S.A.,inVoight, B., ed., Rockslides andavalanches, 1 Natural phenomena: New York, Elsevier, p. 167–180.
Haneberg, W. C., and Bauer, P. W., 1993, Geologic setting and dynamics of a rockslide alongNM 68, Rio Grande Gorge, New Mexico: Association of Engineering Geologists Bulletin,v. 30, p. 7–16.
Harp, E. L., and Noble, M. A., 1993,An engineering rock classification to evaluate seismic rock-fallsusceptibility and its application to the Wasatch Front:Association of Engineering GeologistsBulletin, v. 30, p. 293–319.
Harp, E. L., Wilson, R. C., and Wieczorek, G. F., 1981, Landslides from the February 4, 1976,Guatemala earthquake: U.S. Geological Survey Professional Paper 1204-A, 35 p.
Heim,A., 1932, Landslides and human lives (Bergsturz und Menschenleben: Skermer, N., trans-lator, 1989): Vancouver, B.C., BiTech Publishers Ltd., 195 p.
Huber, N. K., 1987, The geologic story of Yosemite National Park: U.S. Geological SurveyBulletin 1595, 64 p.
Kieffer, S. W., 1981, Fluid dynamics of the May 18 blast at Mount St. Helens,in Lipman, P.W., andMullineaux, D. R., eds., The 1980 eruptions of Mount St. Helens, Washington: U.S. Geolog-ical Survey Professional Paper 1250, p. 379–400.
Matthes, F. E., 1930, Geologic history of the Yosemite Valley: U.S. Geological Survey ProfessionalPaper 160, 137 p.
Meaden, G. T., 1976, Tornadoes in Britain: Their intensities and distribution in space and time:Journal of Meteorology, v. 1, p. 242–251.
Moore, J. G., and Sisson, T. W., 1981, Deposits and effects of the May 18 pyroclastic surge,inLipman, P. W., and Mullineaux, D. R., eds., The 1980 eruptions of Mount St. Helens, Wash-ington: U.S. Geological Survey Professional Paper 1250, p. 421–438.
Morrissey, M. M., Wieczorek, G. F., and Savage, W. Z., 1997, Airblasts generated from rock-fallimpacts: The 1996 Happy Isles rock fall,Yosemite National Park [abs.]: Eos (Transactions,American Geophysical Union), v. 78, p. 46, p. F137.
Norris, R. D., 1994, Seismicity of rockfalls and avalanches at three Cascade Range volcanoes; im-plications for seismic detection of hazardous mass movements: Seismological Society ofAmerica Bulletin, v. 84, p. 1425–1939.
Pfeiffer, T. J., Higgins, J. D., Andrew, R. D., Barrett, R. K., and Beck, R. B., 1993, Colorado rock-fall simulation program—Users manual for version 3.0: Colorado Department of Transporta-tion Report CDOT-DTD-ED3-CS-2B, 66 p.
Plafker, G., and Ericksen, G. E., 1978, Nevados Huascarán avalanches, Peru,in Voight, B., ed.,Rockslides and avalanches, 1 Natural phenomena: New York, Elsevier, p. 277–314.
Snyder, J., 1996, The ground shook and the sky fell:Yosemite Association, Fall 1996, v. 58, no. 4,p. 2–9.
Uhrhammer, R. A., 1996, Yosemite rock fall of July 10, 1996: Seismological Research Letters,v. 67, p. 47–48.
Waitt, R. B., 1981, Devastating pyroclastic density flow and attendant air fall of May 18—Stratig-raphy and sedimentology of deposits,in Lipman, P. W., and Mullineaux, D. R., eds.,The 1980eruptions of Mount St. Helens,Washington: U.S. Geological Survey Professional Paper 1250,p. 439–458.
Wieczorek, G. F., and Jäger, S., 1996, Triggering mechanisms and depositional rates of post-glacial slope-movement processes in the Yosemite Valley, California: Geomorphology,v. 15, p. 17–31.
Wieczorek, G. F., Snyder, J. B., Alger, C. S., and Isaacson, K. A., 1992, Rock falls in YosemiteValley, California: U.S. Geological Survey Open-File Report 92–387, 38 p.
Wieczorek, G. F., Nishenko, S. P., and Varnes, D. J., 1995, Analysis of rock falls in the YosemiteValley, California,in Daemen, J. J., and Schultz, R. A., eds., Proceedings, Rock MechanicsSymposium, 35th, Reno, Nevada: Rotterdam, Balkema, p. 85–89.
MANUSCRIPTRECEIVED BY THESOCIETY OCTOBER16, 1997REVISEDMANUSCRIPTRECEIVEDNOVEMBER24, 1998MANUSCRIPTACCEPTEDFEBRUARY 12, 1999
TABLE A1. RESULTS OF VELOCITY ALGORITHM
X* VX AX Z VZ AZ Angle† V T(m) (m/s) (m/s2) (m) (m/s) (m/s2) (°) (m/s) (s)
20.5 0.0 2.5 1940 –0.0 –9.5 75.4 0.0 0.00184.8 46.9 7.6 1850 –37.8 –6.2 38.9 60.2 4.412180.8 52.2 7.1 1768 –49.8 –6.8 43.6 72.1 6.285180.9 52.2 0.0 1767 –49.8 –9.8 43.6 72.2 6.286244.5 52.2 0.0 1700 –61.7 –9.8 49.7 80.9 7.504320.4 52.2 0.0 1600 –75.9 –9.8 55.5 92.2 8.957384.2 52.2 0.0 1500 –87.9 –9.8 59.3 102.3 10.177440.3 52.2 0.0 1400 –98.4 –9.8 62.0 111.4 11.251490.9 52.2 0.0 1300 –107.9 –9.8 64.2 119.9 12.220500.5 52.2 0.0 1280 –109.7 –9.8 64.5 121.5 12.404502.9 52.2 0.0 1275 –110.2 –9.8 64.6 121.9 12.449
Note: See Appendix for definition of variables.*The range of the rock fall starting from the release.†The trajectory angle measured from horizontal.
Printed in U.S.A.