upa’s promises and priorities: is there a mismatch?€¦ · upa’s promises and priorities: is...
TRANSCRIPT
UPA’s Promises and Priorities: Is There a Mismatch?
Response to Union Budget 2011-12
2011
Centre for Budget and Governance Accountability
This document is for private circulation and is not a priced publication.
Copyright @ 2011 Centre for Budget and Governance Accountability
Reproduction of this publication for educational or other non-commercial purposes is authorized, without prior written permission, provided the source is fully acknowledged.
Cover Illustration: Vikram NayakDesign: SHIVAM SUNDARAMPrinted by: Kriti Creative Studio
For any queries, please contact:
Centre for Budget and Governance AccountabilityA-11, Second FloorNiti Bagh, New Delhi-110049Tel.: 011-41741284/86/87Fax: 011-26537603Email: [email protected]
Website: www.cbgainida.org
Centre for Budget and Governance Accountability, 2011 iii
Contents
S. No. Section
A Who Does the FM Meet? 1
B Promises in the Election Manifesto vs. Budget Commitmets 2
C Summary 9
1 Education 13
2 Health 18
3 Water Supply & Sanitation 22
4 Rural Development 27
5 Agriculture 31
6 Food Security 39
7 Adaptation to Climate Change 45
8 Women 48
9 Children 56
10 Scheduled Castes 61
11 Scheduled Tribes 65
12 Minorities 70
13 Resource Mobilisation 76
14 Understanding the Budget Jargon 83


Centre for Budget and Governance Accountability, 2011 1
A. Who Does the FM Meet?
The Finance Minister began to meet various stakeholders in January. He initiated the process in the first week of January by meeting lobby groups of agriculture sector. This was followed by the meeting with Industry Groups (which included FICCI, CII and ASSOCHAM). Later, the Finance Minister met with trade union groups, economists, Finance Ministers of different states and union territories. This time round, the Finance Minister also met with representatives of the film industry and financial sector. Like last year, the Finance Minister met with representatives of civil society that included delegates from SEWA Academy, Jaipur Foot, Bandhua Mukti Morcha, PRADAN, ASHA, Care India and Ramakrishna Mission.
The People’s Budget Initiative (PBI) also got an appointment with the Finance Minister when they presented their Charter of Demands that listed out their key expectations from the Union Budget 2011-12. It is felt that pre-budget consultations should start earlier rather than in the month of January. While tax related matters might be influenced even if consultations are held closer to the budget presentation, the desired changes in expenditure programmes and policies can be influenced only if the Finance Minister holds consultations earlier, preferably beginning in the month of December.
Centre for Budget and Governance Accountability, 20112
B. P
rom
ises
in th
e E
lect
ion
Man
ifest
o vs
. Bud
get
Com
mitm
ents
Sect
ors
Prom
ises
mad
e in
the
Con
gres
s M
anife
sto
2009
Prom
ises
add
ress
ed in
Uni
on B
udge
t 200
9-10
Prom
ises
add
ress
ed in
Uni
on B
udge
t 201
0-11
Prom
ises
add
ress
ed in
U
nion
Bud
get 2
011-
12
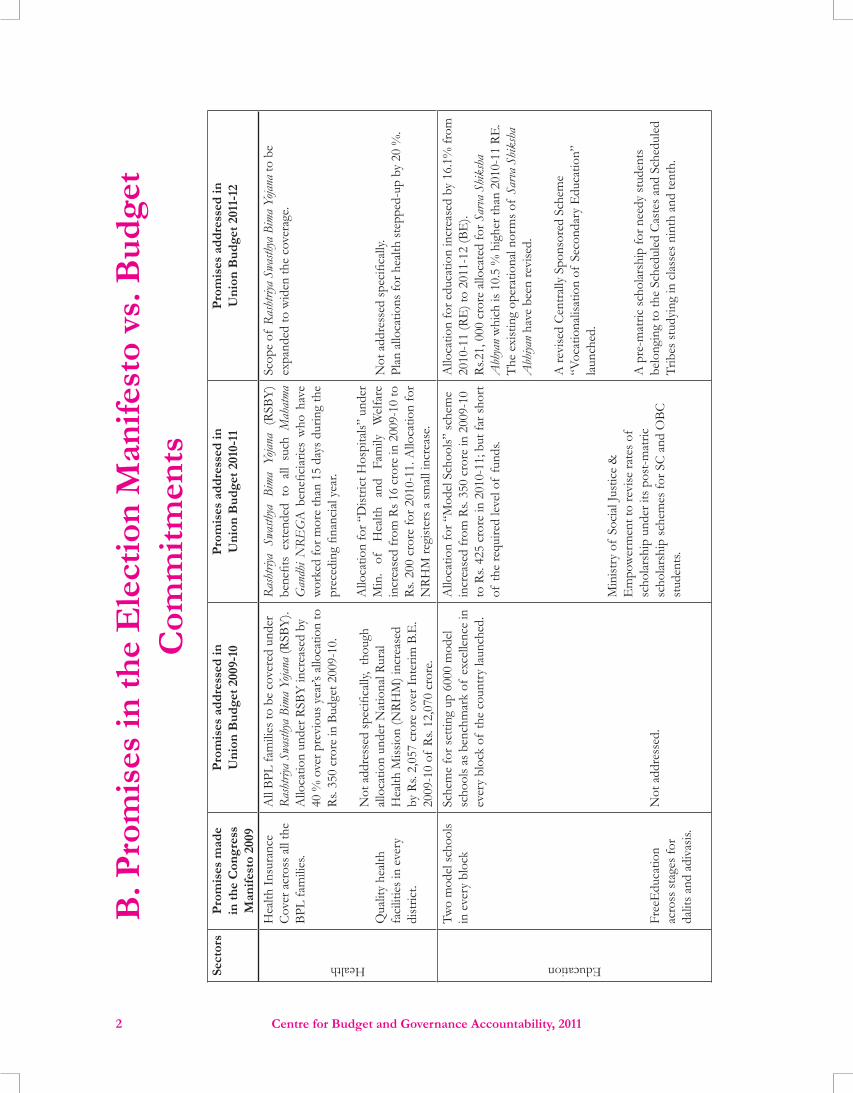
Health
Hea
lth In
sura
nce
Cov
er a
cros
s all
the
BPL
fam
ilies
.
Qua
lity
heal
th
faci
litie
s in
ever
y di
stric
t.
All
BPL
fam
ilies
to b
e co
vere
d un
der
Rash
triya
Swa
sthya
Bim
a Yo
jana
(RSB
Y).
Allo
catio
n un
der R
SBY
incr
ease
d by
40
% o
ver p
revi
ous y
ear’s
allo
catio
n to
Rs
. 350
cro
re in
Bud
get 2
009-
10.
Not
add
ress
ed sp
ecifi
cally
, th
ough
al
loca
tion
unde
r Nat
iona
l Rur
al
Hea
lth M
issio
n (N
RHM
) inc
reas
ed
by R
s. 2,
057
cror
e ov
er In
terim
B.E
. 20
09-1
0 of
Rs.
12,0
70 c
rore
.
Rash
triya
Swa
sthya
Bim
a Yo
jana
(RSB
Y)
bene
fits
exte
nded
to
all
such
Mah
atma
G
andh
i NRE
GA
ben
efici
arie
s w
ho h
ave
wor
ked
for m
ore
than
15
days
dur
ing
the
prec
edin
g fin
anci
al y
ear.
Allo
catio
n fo
r “D
istric
t Hos
pita
ls” u
nder
M
in.
of
Hea
lth
and
Fam
ily
Wel
fare
in
crea
sed
from
Rs 1
6 cr
ore
in 2
009-
10 to
Rs
. 200
cro
re fo
r 201
0-11
. Allo
catio
n fo
r N
RHM
regi
ster
s a sm
all i
ncre
ase.
Scop
e of
Ras
htriy
a Sw
asth
ya B
ima
Yojan
a to
be
expa
nded
to w
iden
the
cove
rage
.
Not
add
ress
ed sp
ecifi
cally
. Pl
an a
lloca
tions
for h
ealth
step
ped-
up b
y 20
%.
Education
Two
mod
el sc
hool
s in
eve
ry b
lock
Free
Edu
catio
n ac
ross
stag
es fo
r da
lits a
nd a
diva
sis.
Sche
me
for s
ettin
g up
600
0 m
odel
sc
hool
s as b
ench
mar
k of
exc
elle
nce
in
ever
y bl
ock
of th
e co
untr
y la
unch
ed.
Not
add
ress
ed.
Allo
catio
n fo
r “M
odel
Sch
ools”
sche
me
incr
ease
d fr
om R
s. 35
0 cr
ore
in 2
009-
10
to R
s. 42
5 cr
ore
in 2
010-
11; b
ut fa
r sho
rt
of th
e re
quire
d le
vel o
f fu
nds.
Min
istry
of
Soci
al Ju
stic
e &
E
mpo
wer
men
t to
revi
se ra
tes o
f sc
hola
rshi
p un
der i
ts p
ost-m
atric
sc
hola
rshi
p sc
hem
es fo
r SC
and
OBC
st
uden
ts.
Allo
catio
n fo
r edu
catio
n in
crea
sed
by 1
6.1%
from
20
10-1
1 (R
E) t
o 20
11-1
2 (B
E).
Rs.2
1, 0
00 c
rore
allo
cate
d fo
r Sar
va S
hiks
ha
Abh
yan
whi
ch is
10.
5 %
hig
her t
han
2010
-11
RE.
The
exi
stin
g op
erat
iona
l nor
ms o
f Sa
rva
Shik
sha
Abh
iyan
have
bee
n re
vise
d.
A re
vise
d C
entra
lly S
pons
ored
Sch
eme
“Voc
atio
nalis
atio
n of
Sec
onda
ry E
duca
tion”
la
unch
ed.
A p
re-m
atric
scho
lars
hip
for n
eedy
stud
ents
be
long
ing
to th
e Sc
hedu
led
Cas
tes a
nd S
ched
uled
Tr
ibes
stud
ying
in c
lass
es n
inth
and
tent
h.

Centre for Budget and Governance Accountability, 2011 3
Sect
ors
Prom
ises
mad
e in
the
Con
gres
s M
anife
sto
2009
Prom
ises
add
ress
ed in
Uni
on B
udge
t 200
9-10
Prom
ises
add
ress
ed in
Uni
on B
udge
t 201
0-11
Prom
ises
add
ress
ed in
U
nion
Bud
get 2
011-
12Work and Social Security
100
days
of
wor
k at
Rs.
100
a da
y fo
r ev
eryo
ne
Allo
catio
n un
der N
REG
S in
crea
sed
by 3
0 %
to R
s. 39
,100
cro
re in
200
9-10
(BE
) ove
r 200
8-09
(RE
).
Allo
catio
n fo
r the
NRE
GS
incr
ease
d fr
om R
s. 39
,100
cro
re in
200
9-10
to R
s. 40
,100
cro
re in
201
0-11
.
Gov
ernm
ent h
as d
ecid
ed to
inde
x th
e w
age
rate
s no
tified
und
er th
e M
GN
REG
A to
the
Con
sum
er
Pric
e In
dex
for A
gric
ultu
ral L
abou
r.
Rem
uner
atio
n of
Ang
anw
adi w
orke
rs in
crea
sed
from
Rs.1
, 500
p.m
. to
Rs.3
, 000
p.m
. and
for
Ang
anw
adi h
elpe
rs fr
om R
s.750
p.m
. to
Rs.1
, 500
p.
m.
Work and Social Security
Pref
eren
tial p
olic
ies
in g
ovt.
cont
ract
s fo
r SC
/ S
T an
d w
omen
’s gr
oups
, 50
% o
f rur
al w
omen
lin
ked
to S
HG
s and
Ba
nks
Soci
al se
curit
y fo
r hi
gh ri
sk g
roup
s
FM, i
n hi
s Bud
get S
peec
h sa
id th
at 5
0 %
of
rura
l wom
en w
ill b
e lin
ked
to
SHG
s ove
r nex
t five
yea
rs. H
owev
er,
allo
catio
n fo
r all
SHG
-bas
ed
prog
ram
mes
und
er M
WC
D h
ave
gone
dow
n in
clud
ing
Rash
triya
Mah
ila
Kosh
, Swa
yams
iddha
, STE
P, P
riyad
arsh
ini
amon
g ot
hers
.
Act
ion
initi
ated
to e
nsur
e im
plem
enta
tion
of so
cial
secu
rity
sche
mes
und
er o
ccup
atio
ns li
ke
wea
vers
, fish
erm
en a
nd w
omen
, to
ddy
tapp
ers,
leat
her a
nd h
andi
craf
t w
orke
rs, p
lant
atio
n la
bour
, co
nstr
uctio
n la
bour
, min
e w
orke
rs,
bidi w
orke
rs a
nd ri
cksh
aw p
ulle
rs.
Nec
essa
ry fi
nanc
ial a
lloca
tion
will
be
mad
e fo
r the
se sc
hem
es.
The
fund
cor
pus f
or th
e ‘M
icro
-Fin
ance
D
evel
opm
ent a
nd E
quity
Fun
d is
bein
g do
uble
d to
Rs.
400
cror
e in
201
0-11
.
Nat
iona
l Soc
ial S
ecur
ity F
und
for
unor
gani
sed
sect
or w
orke
rs to
be
set u
p w
ith a
n in
itial
allo
catio
n of
Rs.
1,00
0 cr
ore.
To e
ncou
rage
peo
ple
from
the
unor
gani
sed
sect
or to
vol
unta
rily
save
fo
r the
ir re
tirem
ent a
nd to
low
er th
e co
st o
f op
erat
ions
of
the
New
Pen
sion
Sche
me
(NPS
) for
such
subs
crib
ers,
Gov
ernm
ent w
ill c
ontri
bute
Rs.
1,00
0 pe
r yea
r to
each
NPS
acc
ount
ope
ned
in
the
year
201
0-11
. Thi
s ini
tiativ
e is
calle
d “S
wava
lamba
n”.
“Wom
en’s
SHG
’s D
evel
opm
ent F
und”
to b
e cr
eate
d w
ith a
cor
pus o
f Rs
500
cro
re.
Rs 3
,000
cro
re to
be
prov
ided
to N
ABA
RD
to p
rovi
de su
ppor
t to
hand
loom
wea
vers
’ co-
oper
ativ
e so
ciet
ies.
Exi
t nor
ms u
nder
con
tribu
tory
pen
sion
sche
me
“Swa
valam
ban”
to b
e re
laxe
d.
Elig
ibili
ty fo
r pen
sion
unde
r Ind
ira G
andh
i Nat
ional
Old
Age
Pens
ion S
chem
e for
BPL
ben
efici
arie
s re
duce
d fr
om 6
5 ye
ars o
f ag
e to
60
year
s. T
hose
ab
ove
80 y
ears
of
age
will
get
pen
sion
of R
s. 50
0 pe
r mon
th in
stea
d of
Rs.
200
at p
rese
nt.

Centre for Budget and Governance Accountability, 20114
Sect
ors
Prom
ises
mad
e in
the
Con
gres
s M
anife
sto
2009
Prom
ises
add
ress
ed in
Uni
on B
udge
t 200
9-10
Prom
ises
add
ress
ed in
Uni
on B
udge
t 201
0-11
Prom
ises
add
ress
ed in
U
nion
Bud
get 2
011-
12Food Security
Nat
iona
l Foo
d Se
curit
y A
ct a
ndU
nive
rsal
ICD
S by
20
1225
kgs
of
rice/
whe
at a
mon
th a
t Rs
. 3 p
er k
g fo
r BPL
fa
mili
es
Nat
iona
l Foo
d Se
curit
y A
ct to
be
brou
ght i
n to
ens
ure
entit
lem
ent o
f 25
ki
lo o
f ric
e or
whe
at p
er m
onth
at R
s. 3
per k
ilo to
eve
ry fa
mily
livi
ng b
elow
th
e po
vert
y lin
e in
rura
l or u
rban
ar
eas.
How
ever
, no
allo
catio
n ha
s bee
n m
ade
for t
his y
et.
Uni
on B
udge
t out
lay fo
r “Fo
od
Subs
idy”
redu
ced
from
Rs.
56,0
00 c
rore
in
200
9-10
(RE
) to
Rs. 5
5,57
8 cr
ore
in
2010
-11
(BE
).
Allo
catio
n fo
r IC
DS
incr
ease
d fr
om R
s. 6,
705
cror
e in
200
9-10
(BE
) to
Rs. 8
,700
cr
ore
in 2
010-
11 (B
E);
but e
ven
this
incr
ease
d bu
dget
allo
catio
n is
gros
sly
inad
equa
te fo
r uni
vers
alisa
tion
of IC
DS
with
qua
lity.
Nat
iona
l Foo
d Se
curit
y Bi
ll (N
FSB)
to b
e in
trodu
ced
in P
arlia
men
t with
in 2
011-
12.
Nat
iona
l Miss
ion
for P
rote
in S
uppl
emen
ts
laun
ched
in 2
011-
12 w
ith o
utlay
s of
Rs. 3
00
cror
e. It
will
take
up
activ
ities
to p
rom
ote
anim
al-
base
d pr
otei
n pr
oduc
tion
thro
ugh
lives
tock
de
velo
pmen
t, da
iry fa
rmin
g, p
igge
ry, g
oat r
earin
g an
d fis
herie
s in
sele
cted
blo
cks.
A p
rovi
sion
of R
s. 30
0 cr
ore
is be
ing
mad
e to
pr
omot
e hi
gher
pro
duct
ion
of n
utri-
cere
als
like
ragi,
bajr
a, ce
real
s; up
grad
e th
eir p
roce
ssin
g te
chno
logi
es; a
nd c
reat
e aw
aren
ess r
egar
ding
thei
r he
alth
ben
efits

Centre for Budget and Governance Accountability, 2011 5
Sect
ors
Prom
ises
mad
e in
the
Con
gres
s M
anife
sto
2009
Prom
ises
add
ress
ed in
Uni
on B
udge
t 200
9-10
Prom
ises
add
ress
ed in
Uni
on B
udge
t 201
0-11
Prom
ises
add
ress
ed in
U
nion
Bud
get 2
011-
12Agriculture
Inte
rest
relie
f fo
r fa
rmer
s on
timel
y re
paym
ent o
f lo
ans
Supp
ort t
o th
e fa
rmer
s and
ec
onom
ical
ly
vuln
erab
le re
gion
s
Inte
rest
subv
entio
n sc
hem
e fo
r sho
rt
term
cro
p lo
ans u
pto
Rs. 3
lakh
per
fa
rmer
at 7
% p
.a. in
tere
st ra
te to
be
cont
inue
d. A
dditi
onal
subv
entio
n of
1 %
to b
e pa
id fr
om 2
009-
10
as in
cent
ive
to fa
rmer
s who
repa
y sh
ort t
erm
cro
p lo
ans o
n sc
hedu
le.
Add
ition
al a
lloca
tion
of R
s. 41
1 cr
ore
over
Inte
rim B
.E. 2
009-
10 m
ade.
Tim
e gi
ven
to fa
rmer
s hav
ing
mor
e th
an tw
o he
ctar
es o
f la
nd to
pay
75
% o
f th
eir o
verd
ue u
nder
Deb
t W
aiver
and
Deb
t Rel
ief
Sche
me
exte
nded
from
30th
June
, 200
9 to
31st
D
ecem
ber,
2009
.
Targ
et fo
r agr
icul
ture
cre
dit fl
ow se
t at
Rs.
3,25
,000
cro
re fo
r 200
9-10
. In
2008
-09,
agr
icul
ture
cre
dit fl
ow w
as a
t Rs
. 2,8
7,00
0 cr
ore.
Allo
catio
n un
der A
ccel
erat
ed
Irrig
atio
n Be
nefit
Pro
gram
me
(AIB
P)
incr
ease
d by
75
% o
ver 2
008-
09 (B
E).
Allo
catio
n un
der R
asht
riya
Krish
i Vik
as
Yojan
a (R
KV
Y) s
tepp
ed u
p by
30
%
in. 2
009-
10 (B
E) o
ver 2
008-
09 (B
E).
Perio
d of
repa
ymen
t of
loan
am
ount
by
farm
ers e
xten
ded
by si
x m
onth
s fr
om D
ecem
ber 3
1, 2
009
to Ju
ne 3
0,
2010
und
er D
ebt w
aiver
and
Deb
t rel
ief
sche
me
for f
arm
ers.
Ince
ntiv
e of
add
ition
al 1
% in
tere
st
subv
entio
n to
farm
ers w
ho re
pay
shor
t-ter
m c
rop
loan
s as p
er sc
hedu
le,
incr
ease
d to
2 %
for 2
010-
11.
Prov
ision
of
furt
her c
apita
l to
stre
ngth
en R
egio
nal R
ural
Ban
ks
(RRB
s) to
ens
ure
adeq
uate
cap
ital b
ase
to su
ppor
t inc
reas
ed le
ndin
g to
rura
l ec
onom
y.
Allo
catio
n fo
r Nat
iona
l Agr
icul
tura
l In
sura
nce
Sche
me
(NA
IS) r
educ
ed fr
om
Rs. 1
,219
cro
re in
200
9-10
(RE
) to
Rs.
950
cror
e in
201
0-11
(BE
).
The
agr
icul
ture
cre
dit fl
ow ta
rget
for t
he
year
Rs.
3,75
,000
cro
re. R
s. 40
0 cr
ore
prov
ided
to e
xten
d th
e gr
een
revo
lutio
n to
the
east
ern
regi
on o
f th
e co
untr
y; R
s. 30
0 cr
ore
prov
ided
to 6
0,00
0 “p
ulse
s an
d oi
l see
ds v
illag
es”
in ra
in-f
ed a
reas
du
ring
2010
-11
and
Rs. 2
00 c
rore
pr
ovid
ed fo
r sus
tain
ing
the
gain
s alre
ady
mad
e in
the
gree
n re
volu
tion
area
s th
roug
h co
nser
vatio
n fa
rmin
g.A
Mah
ila k
isan
Sash
aktik
aran
Par
iyojan
a to
mee
t the
spec
ific
need
s of
wom
en fa
rmer
s to
be re
laun
ced
as
subc
ompo
nent
of
NRL
M
Cre
dit fl
ow fo
r far
mer
s rai
sed
from
Rs
3, 7
5,00
0 cr
ore
to R
s 4, 7
5,00
0 cr
ore
in 2
011-
12 (B
E).
Inte
rest
subv
entio
n pr
opos
ed to
be
enha
nced
from
2 %
to 3
% fo
r pro
vidi
ng sh
ort-
term
cro
p lo
ans t
o fa
rmer
s who
repa
y th
eir c
rop
loan
on
time.
In v
iew
of
enha
nced
targ
et fo
r flow
of
agric
ultu
re c
redi
t, ca
pita
l bas
e of
NA
BARD
to b
e st
reng
then
ed b
y Rs
3,0
00 c
rore
in p
hase
d m
anne
r.Rs
10,
000
cror
e to
be
cont
ribut
ed to
NA
BARD
’s Sh
ort-t
erm
Rur
al C
redi
t fun
d fo
r 201
1-12
.
Nut
rient
Bas
ed S
ubsid
y (N
BS) h
as im
prov
ed th
e av
aila
bilit
y of
fert
ilise
r; co
uld
exte
nd N
BS re
gim
e to
cov
er u
rea.
Mov
e to
war
ds d
irect
tran
sfer
of
cash
subs
idy
to p
eopl
e liv
ing
belo
w p
over
ty li
ne in
a p
hase
d m
anne
r for
bet
ter d
eliv
ery
of k
eros
ene,
LPG
an
d fe
rtili
sers
. Tas
k fo
rce
set u
p to
wor
k ou
t m
odal
ities
for p
ropo
sed
syst
em.
Allo
catio
n un
der R
asht
riya
Kris
hi V
ikas
Yoj
ana
(RK
VY
) inc
reas
ed fr
om 6
,755
cro
re to
Rs 7
,860
cr
ore.
Brin
ging
Gre
en R
evol
utio
n to
Eas
tern
Reg
ion
400
cror
e ha
s bee
n m
ade.
Inte
grat
ed D
evel
opm
ent o
f 60
,000
pul
ses v
illag
es in
rain
fed
area
s. A
lloca
tion
of R
s. 30
0 cr
ore
to p
rom
ote
60,0
00 p
ulse
s vi
llage
s in
rain
fed
area
s. A
lloca
tion
of R
s. 30
0 cr
ore
for i
mpl
emen
tatio
n of
veg
etab
le in
itiat
ive
to p
rovi
de q
ualit
y ve
geta
ble
at c
ompe
titiv
e pr
ices
. Gov
ernm
ent t
o pr
omot
e or
gani
c fa
rmin
g m
etho
ds, c
ombi
ning
mod
ern
tech
nolo
gy w
ith
tradi
tiona
l far
min
g pr
actic
es.

Centre for Budget and Governance Accountability, 20116
Sect
ors
Prom
ises
mad
e in
the
Con
gres
s M
anife
sto
2009
Prom
ises
add
ress
ed in
Uni
on B
udge
t 200
9-10
Prom
ises
add
ress
ed in
Uni
on B
udge
t 201
0-11
Prom
ises
add
ress
ed in
U
nion
Bud
get 2
011-
12
InfrastructureW
ater
secu
rity,
IT fo
r rur
al
trans
form
atio
n,
Rura
l ele
ctrifi
catio
n an
d ho
usin
g
Urb
an h
ousin
g an
d sa
nita
tion
Allo
catio
ns fo
r Rur
al W
ater
Sup
ply
has s
how
n a
very
mar
gina
l inc
reas
e bu
t not
suffi
cien
t to
ensu
re ‘w
ater
secur
ity’.
IT is
sue
not a
ddre
ssed
spec
ifica
lly.
Allo
catio
n fo
r Bha
rat N
irman
incr
ease
d by
45
% in
200
9-10
ove
r 200
8-09
(B
E).
Allo
catio
ns u
nder
Pra
dhan
Man
tri G
ram
Sada
k Yo
jana
(PM
GSY
) inc
reas
ed b
y 59
% o
ver 2
008-
09 (B
E) t
o Rs
. 12,
000
cror
e in
200
9-10
(BE
).
Und
er R
ajiv G
andh
i Gra
meen
V
idyut
ikar
an Y
ojana
(RG
GV
Y),
allo
catio
n in
crea
sed
by 2
7 %
to R
s. 7,
000
cror
e.
Allo
catio
n un
der I
ndira
Awa
as Y
ojana
(I
AY) i
ncre
ased
by
63 %
to R
s. 8,
800
cror
e in
200
9-10
(BE
). A
lloca
tion
of R
s. 2,
000
cror
e m
ade
for R
ural
H
ousin
g Fu
nd (R
HF)
in N
atio
nal
Hou
sing
Bank
(NH
B) to
boo
st th
e re
sour
ce b
ase
of N
HB
for r
efina
nce
oper
atio
ns in
rura
l hou
sing
sect
or.
Allo
catio
n un
der J
awah
arla
l Neh
ru
Nat
iona
l Urb
an R
enew
al M
issio
n (JN
NU
RM) s
tepp
ed u
p by
87
% to
Rs
. 12,
887
cror
e in
200
9-10
(BE
) ove
r 20
08-0
9 (B
E).
Allo
catio
n fo
r hou
sing
and
prov
ision
of
basic
am
eniti
es to
ur
ban
poor
enh
ance
d to
Rs.
3,97
3 cr
ore
in 2
009-
10 (B
E).
This
incl
udes
pr
ovisi
on fo
r Raji
v Awa
s Yoja
na (R
AY),
a ne
w sc
hem
e an
noun
ced.
Not
add
ress
ed
Not
add
ress
ed sp
ecifi
cally
but
a si
zabl
e ch
unk
of th
e pl
an a
lloca
tions
are
de
vote
d to
the
deve
lopm
ent o
f ru
ral
infr
astr
uctu
re.
Prov
ision
of
Rs. 6
6,10
0 cr
ore
for R
ural
D
evel
opm
ent.
Allo
catio
n of
Rs.
48,0
00 c
rore
for
prog
ram
mes
und
er B
hara
t Nirm
an
prop
osed
.
Allo
catio
n fo
r Ind
ira A
was Y
ojana
in
crea
sed
to R
s. 10
,000
cro
re. P
ropo
sal
to e
nhan
ce a
lloca
tion
to B
ackw
ard
Regi
on G
rant
Fun
d by
26
% fr
om R
s. 5,
800
cror
e in
200
9-10
to R
s. 7,
300
cror
e in
201
0-11
.
Prop
osal
to in
crea
se th
e al
loca
tion
for
urba
n de
velo
pmen
t by
mor
e th
an 7
5 %
fr
om R
s. 3,
060
cro
re to
Rs.
5,40
0 cr
ore.
In
add
ition
, allo
catio
n fo
r Hou
sing
and
Urb
an P
over
ty A
llevi
atio
n is
also
bei
ng
raise
d fr
om R
s. 85
0 cr
ore
to R
s. 1,
000
cror
e in
201
0-11
.
Out
lays f
or B
hara
t Nirm
an p
ropo
sed
to b
e in
crea
sed
by R
s 10,
000
cror
e in
the
curr
ent
year
to R
s 58,
000
cror
e in
201
1-12
. Bha
rat
Nirm
an, i
nclu
des P
radh
an M
antri
Gra
m Sa
dak
Yojna
(PM
GSY
), A
ccel
erat
ed Ir
rigat
ion
Bene
fit
Prog
ram
me,
Rajiv
Gan
dhi G
rame
en V
idyut
ikar
an
Yojna
, Ind
ira A
was Y
ojana
, Nat
iona
l Rur
al D
rinki
ng
Wat
er P
rogr
amm
e an
d Ru
ral t
elep
hony
.
A C
orpu
s of
RID
F X
VII
to b
e ra
ised
from
Rs.
16,0
00 c
rore
to R
s. 18
,000
cro
re fo
r 201
1-12
.
Plan
to p
rovi
de R
ural
Bro
adba
nd C
onne
ctiv
ity to
al
l 2,5
0,00
0 Pa
ncha
yats
in th
e co
untr
y in
thre
e ye
ars
Prov
ision
und
er R
ural
Hou
sing
Fund
enh
ance
d to
Rs
3,0
00 c
rore
.
To e
nhan
ce c
redi
t wor
thin
ess o
f ec
onom
ical
ly
wea
ker s
ectio
ns a
nd L
IG h
ouse
hold
s , a
M
ortg
age
Risk
G
uara
ntee
Fun
d to
be
cre
ated
un
der R
ajiv A
was Y
ojana
.
Centre for Budget and Governance Accountability, 2011 7
Sect
ors
Prom
ises
mad
e in
the
Con
gres
s M
anife
sto
2009
Prom
ises
add
ress
ed in
Uni
on B
udge
t 200
9-10
Prom
ises
add
ress
ed in
Uni
on B
udge
t 201
0-11
Prom
ises
add
ress
ed in
U
nion
Bud
get 2
011-
12Economy
Goo
ds a
nd S
ervi
ces
Tax
(GST
)W
ill b
e im
plem
ente
d fr
om A
pril
2010
.T
he g
over
nmen
t is h
oldi
ng d
iscus
sions
w
ith th
e E
mpo
wer
ed C
omm
ittee
of
the
Stat
e Fi
nanc
e M
inist
ers t
o fin
alise
the
stru
ctur
e of
GST
as w
ell
as th
e m
odal
ities
of
its e
xped
itiou
s im
plem
enta
tion.
It sh
ould
be
intro
duce
d al
ong
with
the
Dire
ct T
ax C
ode
in A
pril,
20
11.
Are
as o
f di
verg
ence
with
Sta
tes o
n pr
opos
ed
Goo
ds a
nd S
ervi
ces T
ax (G
ST) h
ave
been
na
rrow
ed. A
s a st
ep to
war
ds ro
ll ou
t of
GST
, C
onst
itutio
n A
men
dmen
t Bill
pro
pose
d to
be
intro
duce
d in
the
budg
et se
ssio
n of
Par
liam
ent.
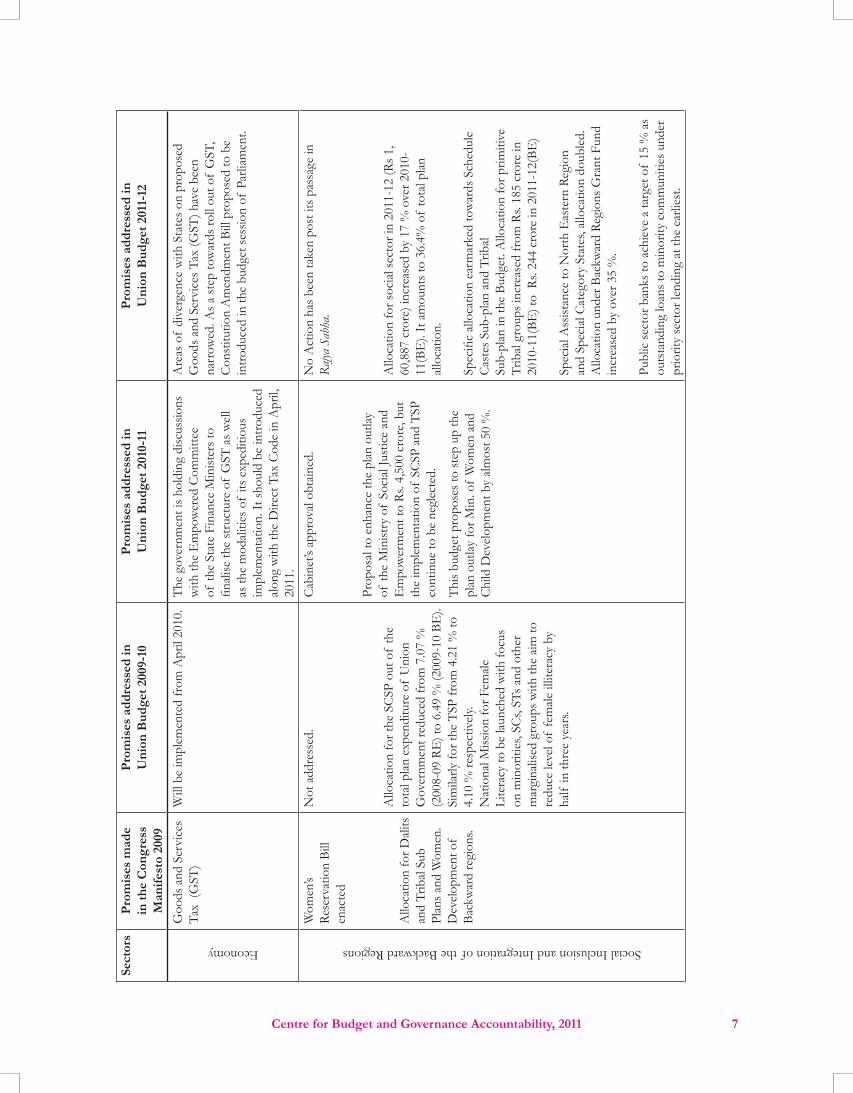
Social Inclusion and Integration of the Backward Regions
Wom
en’s
Rese
rvat
ion
Bill
enac
ted
Allo
catio
n fo
r Dal
its
and
Trib
al S
ub
Plan
s and
Wom
en.
Dev
elop
men
t of
Back
war
d re
gion
s.
Not
add
ress
ed.
Allo
catio
n fo
r the
SC
SP o
ut o
f th
e to
tal p
lan
expe
nditu
re o
f U
nion
G
over
nmen
t red
uced
from
7.0
7 %
(2
008-
09 R
E) t
o 6.
49 %
(200
9-10
BE
). Si
mila
rly fo
r the
TSP
from
4.2
1 %
to
4.10
% re
spec
tivel
y. N
atio
nal M
issio
n fo
r Fem
ale
Lite
racy
to b
e la
unch
ed w
ith fo
cus
on m
inor
ities
, SC
s, ST
s and
oth
er
mar
gina
lised
gro
ups w
ith th
e ai
m to
re
duce
leve
l of
fem
ale
illite
racy
by
half
in th
ree
year
s.
Cab
inet
’s ap
prov
al o
btai
ned.
Prop
osal
to e
nhan
ce th
e pl
an o
utlay
of
the
Min
istry
of
Soci
al Ju
stic
e an
d E
mpo
wer
men
t to
Rs. 4
,500
cro
re, b
ut
the
impl
emen
tatio
n of
SC
SP a
nd T
SP
cont
inue
to b
e ne
glec
ted.
Thi
s bud
get p
ropo
ses t
o st
ep u
p th
e pl
an o
utlay
for M
in. o
f W
omen
and
C
hild
Dev
elop
men
t by
alm
ost 5
0 %
.
No
Act
ion
has b
een
take
n po
st it
s pas
sage
in
Rajya
Sab
ha.
Allo
catio
n fo
r soc
ial s
ecto
r in
2011
-12
(Rs 1
, 60
,887
cro
re) i
ncre
ased
by
17 %
ove
r 201
0-11
(BE
). It
am
ount
s to
36.4
% o
f to
tal p
lan
allo
catio
n.
Spec
ific
allo
catio
n ea
rmar
ked
tow
ards
Sch
edul
e C
aste
s Sub
-pla
n an
d Tr
ibal
Sub-
plan
in th
e Bu
dget
. Allo
catio
n fo
r prim
itive
Tr
ibal
gro
ups i
ncre
ased
from
Rs.
185
cror
e in
20
10-1
1(BE
) to
Rs.
244
cror
e in
201
1-12
(BE
)
Spec
ial A
ssist
ance
to N
orth
Eas
tern
Reg
ion
and
Spec
ial C
ateg
ory
Stat
es, a
lloca
tion
doub
led.
A
lloca
tion
unde
r Bac
kwar
d Re
gion
s Gra
nt F
und
incr
ease
d by
ove
r 35
%.
Publ
ic se
ctor
ban
ks to
ach
ieve
a ta
rget
of
15 %
as
outs
tand
ing
loan
s to
min
ority
com
mun
ities
und
er
prio
rity
sect
or le
ndin
g at
the
earli
est.

Centre for Budget and Governance Accountability, 20118
Sect
ors
Prom
ises
mad
e in
the
Con
gres
s M
anife
sto
2009
Prom
ises
add
ress
ed in
Uni
on B
udge
t 200
9-10
Prom
ises
add
ress
ed in
Uni
on B
udge
t 201
0-11
Prom
ises
add
ress
ed in
U
nion
Bud
get 2
011-
12Peace & Security
Uni
que
Iden
tity
Car
d fo
r all
by 2
011
Wom
en a
nd D
alits
pr
otec
ted
from
at
roci
ties
Uni
que
Iden
tifica
tion
Aut
horit
y of
In
dia
(UID
AI)
to se
t up
onlin
e da
ta
base
with
iden
tity
and
biom
etric
de
tails
of
Indi
an re
siden
ts a
nd p
rovi
de
enro
lmen
t and
ver
ifica
tion
serv
ices
ac
ross
cou
ntry
. Pro
visio
n of
Rs.
120
cror
e m
ade
for t
his i
n th
e Bu
dget
.
Not
Add
ress
ed. N
o al
loca
tion
for t
he
Dom
estic
Vio
lenc
e A
ct y
et.
Sinc
e th
e U
IDA
I will
now
get
into
th
e op
erat
iona
l pha
se, t
his b
udge
t ha
s allo
cate
d Rs
. 1,9
00 c
rore
to th
e A
utho
rity
for 2
010-
11.
No
allo
catio
n in
Uni
on B
udge
t for
the
Dom
estic
Vio
lenc
e A
ct y
et.
From
1st O
ctob
er, 2
011,
10
lakh
Aad
haar
num
bers
w
ill b
e ge
nera
ted
per d
ay.
No
allo
catio
n fo
r im
plem
enta
tion
of th
e Pr
otec
tion
of W
omen
from
Dom
estic
Vio
lenc
e (P
WD
V) A
ct.

Centre for Budget and Governance Accountability, 2011 9
C. SummaryAgreeing with the Union Government that the year gone by presented us with several opportunities and challenges to address critical concerns pertaining to the social sector, the overall sense is that this Budget offers precious little in terms of firming up the intent of the government to ensure ‘inclusive’ growth. The Union Government’s Total Expenditure as a proportion of GDP is projected to fall from 15.4 % in 2010-11 (RE) to 14 % in 2011-12 (BE), which reflects that expenditure compression for reducing deficits is the overarching feature of this budget.
On the expenditure side, not much has changed since last year with the Union Government’s expenditure priorities remaining skewed against the social sectors. In fact the brunt of the conservative fiscal policy of the government is going to be borne mainly by the poor.
Table 1: Priority for Social Services in the Union BudgetYear Expenditure from the Union
Budget on Social Services*(in Rs. Crore)
Expenditure from the Union Budget on Social Services*
as % of Total Expenditure from the
Union Budgetas % of GDP
2004-05 39123 7.9 1.22005-06 49535 9.8 1.32006-07 55246 9.5 1.32007-08 78818 11.1 1.62008-09 110542 12.5 2.02009-10 122345 11.9 1.92010-11 (RE) 162501 13.4 2.12011-12 (BE) 165975 13.2 1.8
Notes: * (1) This includes the Plan Expenditure and Non-Plan Revenue Expenditure from the Union Budget on the following services: Education, Youth Affairs and Sports, Art & Culture; Health & Family Welfare: Water Supply & Sanitation; Housing & Urban Development; Information & Broadcasting; Welfare of SCs, STs and OBCs; Labour & Labour Welfare: Social Welfare & Nutrition; and Other Social Services. (2) This does not include Non-Plan Capital Expenditure from Union Budget on Social Services, if any. Non-Plan Capital Expenditure on Social Services is sporadic and usually of a very small magnitude. Hence, this figure captures almost the entire magnitude of expenditure on Social Services from the Union Budget. Source: Compiled by CBGA from Expenditure Budget Vol. I, Union Budget 2011-12, Govt. of India
While the Union Budget 2011-12 pays some attention to a few important concerns pertaining to agriculture, infrastructure and climate change, allocations for social sector do not give any cause for cheer. Total Union Budget outlay for social sectors (excluding only Non-Plan Capital Expenditure on such sectors, which is usually very small and sporadic), has gone down from 1.9 % of GDP in 2009-10 to 1.8 % of GDP in 2011-12 (BE). Moreover, with the Union Budget contributing funds worth only 2 % of GDP for social sectors (such as education, health, water and sanitation), the country’s total budgetary spending on these sectors would continue to be less than 7 % of GDP in 2009-10, whereas the average figure for social sector spending by the OECD countries is as high as 14 % of GDP.

Centre for Budget and Governance Accountability, 201110
Table 2: Combined Expenditure of Centre and States on Social Services
Year
A BA
as % of GDP
Bas % of GDP
Combined Expenditure of Centre and States*
(in Rs. Crore)
Combined Expenditure of Centre and States on –Social Services#
(in Rs. Crore)2004-05 824480 1769472005-06 933642 2090992006-07 1086592 247687 25.3 5.82007-08 1243598 289677 24.9 5.82008-09 (RE) 1600116 391892 28.7 7.02009-10 (BE) 1788195 450650 27.3 6.9
Notes: * This figure refers to the total expenditure from Union Budget and State Budgets combined; without any double counting of the inter-governmental transfers like Central grants and loans to the States. Source: Compiled by CBGA from Indian Public Finance Statistics 2009-10, Ministry of Finance; Economic Survey 2010-11; Budget at a Glance 2011-12, Govt. of India.
Before scrutinising spending in the social sectors, important economic sectors and interventions for the disadvantaged sections of population, it would be useful to highlight specific concerns emerging in the sphere of mobilisation of resources by the Union Government. The tax-GDP ratio (which is the gross tax revenues for the Centre as a proportion of the GDP) shows a small increase from 10 % in 2010-11 (RE) to 10.4 % 2011-12 (BE). The tax-GDP ratio for the Centre had reached the level of 12 % of GDP by 2007-08. It was a welcome trend given that India’s total tax-GDP ratio (i.e. combined for Centre and States) has been hovering around 16 %, which is significantly lower than that for several other countries. Moreover, the Medium Term Fiscal Policy Statement presented with this Budget indicates that the tax-GDP ratio for the Centre would increase only upto 11.3 % by the year 2013-14, which implies that the tax base of the economy is expected to be stagnant over the next three years. This raises serious concerns.
Although Income Tax exemption limit for the general category of individual tax payers has been raised, the exemption limit for women tax payers has been retained at the earlier level of Rs. 1,90,000. The government should have made an effort towards improving the gender responsiveness of the tax system by increasing the exemption limit for women tax payers as well. Several steps have been proposed both for the Central Board of Direct Taxes (CBDT) and the Central Board of Excise and Customs (CBEC) to improve tax administration under the Central Government Tax System. The government has paid attention to the problem of ‘black money’; a five-fold strategy has been put forward to deal with this problem. The government has also paid attention to the issues relating to tax avoidance that are affecting the mobilization of tax revenue; the steps taken, according to the Finance Minister, include discussions for 11 Tax Information Exchange Agreements, 13 new Double Taxation Avoidance Agreements (DTAAs) along with revision of 10 existing DTAAs, and steps to improve the effectiveness of Foreign Tax Division of CBDT to handle effectively the increase in tax information exchange and ‘transfer pricing’ issues.
In Education, while the outlays for Sarva Shiksha Abhiyan has been increased from Rs. 15,000 crore in 2010-11 (BE) to Rs. 21,000 crore in 2011-12 (BE), the scheme can hardly succeed in operationalising Right to Education Act with this magnitude of funds. Centre’s own estimation, a modest one from the point of view of quality, indicated that additional budget outlays for elementary education required for operationalising Right to Education Act would be Rs. 1.82 lakh crore over a period of five years. Hence, if just one-fifth of this had to be allocated in 2011-12 with the Union Budget contributing only half of it, the outlay for SSA should have been increased at least to a level of Rs. 33,000 crore.

Centre for Budget and Governance Accountability, 2011 11
The outlays for Health & Family Welfare have hardly increased since the last few years. When seen as a proportion of the country’s GDP, public spending on health has increased from 0.32 % in 2010-11 (RE) to 0.34 % in 2011-12 (BE). This, when seen as a share of the total Union Government’s expenditure comprises a mere 2.42 %. Allocations for National Rural Health Mission have shown a slight increase from Rs. 15,037 crore in 2010-11 (RE) to Rs. 17,924.76 crore in 2011-12 (BE). Critical human resource and infrastructural gaps in health warranted much greater focus in terms of outlays. For District Hospitals, allocations have been marginally increased from Rs. 200 crore in 2010-11 (RE) to Rs.260 crore in 2011-12 (BE). Albeit some increase has been made for the scheme on Human Resources for Health (outlays have increased from Rs. 187 crore in 2010-11 RE to Rs. 348 crore in 2011-12 BE).
Although the total budget for Department of Rural Development shows an increase from Rs. 66,138 crore in 2010-11 (BE) to Rs. 76,378 crore in 2010-11 (RE), the allocations have been brought down to Rs. 74,144 crore in 2011-12 (BE). Mahatma Gandhi National Rural Employment Guarantee Scheme (MGNREGS) has been provided Rs. 40,000 crore in 2011-12 (BE). Outlay for Swarnjayanti Gram Swarozgar Yojana (SGSY) (renamed the National Rural Livelihood Mission) has been brought down to Rs. 2,621 crore in 2011-12 (BE) from Rs. 2,683 crore in 2010-11 (RE). Allocations for Indira Awas Yojana (IAY) has declined from Rs. 9,333.5 crore in 2010-11 (RE) to Rs. 8,996 crore in 2011-12 (BE).
In Agriculture, annual average combined (Centre and States) expenditure towards agrarian sector (which includes expenditure on food subsidy, cooperation, fertiliser subsidy, agriculture and allied activities, rural development and irrigation) declined from 15.8 % in 1990-91 to 14.8 % during 2000-01 to 2009-10. Union Government’s total expenditure on the rural economy (which includes expenditure on Agriculture and Allied Activities, Rural Development, Special Area Programmes, Irrigation and Flood Control and Village and Small Industries) dropped from 3.3 % of GDP in 2008-09 (Actuals) to 2.3 % of the Gross Domestic Product (GDP) in 2011-12 (BE). Allocations for extending the “Green Revolution” to the eastern region of the country comprising six states and the eastern part of Uttar Pradesh, providing high yielding variety seeds, technology and irrigation to the farmers, and for pulses and oilseeds in 60,000 rain-fed villages have been made.
With regard to Food Security, despite a growing recognition of the need for significantly expanding the coverage of Public Distribution System for foodgrains and the persistence of price rise in food articles, Union Budget outlay for Food Subsidy has been curtailed from Rs. 60,600 crore in 2010-11 (RE) to Rs. 60,573 crore in 2011-12 (BE). Further, the Union Budget outlay for Petroleum Subsidy has been reduced significantly from Rs. 38,386 crore in 2010-11 (RE) to Rs. 23,640 crore in 2011-12 (BE). Given the predictions that international crude oil prices are going to rise further in the coming months, reduced subsidy in 2011-12 could result in further rise in prices of petroleum products and hence a persistence of the problem of price rise.
Specific to Climate Change, customs duty and certain concessional excise duty for imported batteries for electrical vehicle to promote clean and green technologies in the existing public transportation system have been fully exempted. Concessional excise duty of 10 % has been waived for vehicles using fuel cell technology. Rs 200 crore has been allocated for Green India Mission from the corpus of National Clean Energy Fund (NCEF) towards enhancing forest coverage. Besides, National Water Mission has been provided Rs. 200 crore from NCEF for arresting and cleaning pollution in rivers and lakes other than river Ganga. The budget, however, neglects key climate sensitive sectors such as protection and conservation of wildlife, biospheres, mangroves and coral reefs in the country. Allocations for Centrally Sponsored Schemes (CSS) such as Project Tiger and Project Elephant have registered a downward slump as compared to last year’s budget.
Related to Women, sporadic measures are seen. A welcome step has been increase in the remuneration of the Anganwadi Workers and Anganwadi Helpers within Integrated Child Development Services which has been doubled to Rs. 3000 and Rs. 1500 respectively. A Women’s SHG Development Fund with an initial

Centre for Budget and Governance Accountability, 201112
allocation of Rs. 500 crore has been introduced. However, the number of Ministries/departments reporting in the Gender Budgeting Statement has remained 33 with no significant revision in the format of the Gender Budgeting Statement. Allocations for several women-specific schemes such as Swadhar, Priyadarshini, Support for Training and Employment Programme have declined as compared to the previous year’s outlays.
Union Government’s total allocation earmarked for Children has registered a small increase from 4.1 % of the total Union Budget in 2010-11 (RE) to 4.5 % in 2011-12 (BE). In the ‘Child Budget’ (i.e. the total allocation for all child-specific schemes) in 2011-12 (BE), which stands at Rs. 56748.6 crore, the share of Child Education is 76.4 %, the share of Child Development 18.6 %, interventions in Child Health account for 3.6 % and those pertaining to Child Protection account for 1.33 %. The increase in the share of interventions pertaining to Child Protection in the total ‘Child Budget’ from 0.60 % in 2010-11 (RE) to 1.33 % in 2011-12 (BE) is a welcome development. Outlays for Integrated Child Protection Scheme witness a sharp cut from Rs. 300 crore in 2010-11 (BE) to Rs. 100 crore in 2010-11 (RE).
In the context of Scheduled Castes and Scheduled Tribes, some encouraging steps have been taken in this Budget. Union Government Ministries/departments like Animal Husbandry, Dairying and Fisheries, New and Renewable Energy are now allocating funds for the welfare of Scheduled Castes while Ministries/departments like Industrial Policy and Promotion, Environment and Forest, AIDS Control, Housing and Urban Poverty Alleviation, Land Resources and Drinking Water and Sanitation have begun to report outlays for the welfare of Scheduled Tribes. As per the statement 21 and 21 A, allocations under Scheduled Caste Sub Plan have increased to Rs. 30,551 crore in 2011-12 BE from Rs. 23,795 crore in 2010-11; while under Tribal Sub Plan, the allocation has increased to Rs. 17,371 crore in 2011-12 BE from Rs. 5445 crore in 2010-11. There is increase in outlays for primitive tribal groups from Rs. 185 crore in 2010-11 (BE) to Rs. 244 crore in 2011-12 (BE). Minorities have not given much attention in this year’s Union Budget except with regard to achieving 15 % target under Priority Sector Lending and increase in allocation of Maulana Azad Education Foundation.
Clearly, the Union Budget 2011-12 that could have fortified several provisions made in the last few years and given a thrust to social sector spending has missed the mark yet again. While the budget has some positives for the social sector, critical shortfalls persist. The outlays for education, health and food security are inadequate when seen in the light of the deficits in development outcomes. Outlays for the marginalised sections of population hardly reflect the intent of the Government to ensure ‘inclusive’ growth. While the Budget outlines “a chosen path of fiscal consolidation and high economic growth”, it disregards the persistent development deficits in the social sector, more specifically for the poor and the marginalised. Despite having made note of the fact that “India stands at the threshold of a decade which presents immense possibilities”, the Union Government seems to have turned a blind eye to most of these critical concerns.

Centre for Budget and Governance Accountability, 2011 13
• The UPA promise reiterating the Kothari Commission recommendation of 1966 remains unfulfilled even in 2010; India’s total public spending on Education at 3.39 % of GDP (2008-09) is nowhere near the promised level of 6 % of GDP.
• Union Government’s total allocation for Education in 2011-12 (BE) stands at 0.71 % of GDP, which is slightly better than the 0.69 % of GDP recorded for 2010-11 (RE).
• Union Government’s spending on Education as a proportion of its total budget outlay has increased marginally from 4.48 % in 2010-11 (RE) to 5.04 % in 2011-12 (BE).
• With just a 10.5 % increase in allocations for SSA in 2011-12 (BE) as compared to 2010-11 (RE), the Government has hardly addressed concerns relating to financing of the Right to Education Act.
• A new scheme introduced for students belonging to the SC community is the Pre-Matric Scholarship for SC Students for students in Classes IX and X with an outlay of Rs. 196 crore.
• The outlays for Rashtriya Madhyamik Shiksha Abhiyan (RMSA) have been stepped up from Rs. 1,500 crore in 2010-11 (RE) to Rs. 2,423 crore in 2010-11 (BE).
• Schemes showing increases in their outlay include Scheme for Providing Quality Education in Madrassas (SPQEM), Scheme for Infrastructure Development in Minority Institutions (IDMI), Information and Communication Technology in Schools, Scheme for Construction and Running of Girls Hostels for Students of Secondary & Higher Secondary Schools.
• Outlays for National Means-cum-Merit Scholarship Scheme have been reduced from Rs. 81.45 crore in 2010-11 (BE) to Rs. 54 crore in 2011-12 (BE)
Brevity, some people would say, is the soul of wit. The Union Government considers this quite seriously as is clear from the scant words on the budgetary priority to education in the Union Budget Speech 2011-12. The Union Budget 2011-12 presents a set of contradictions in terms of its focus on education. It begins by calling the country’s “demographic dividend” an opportunity as well as a challenge! It then sidesteps the elementary level completely by failing to chart out the roadmap for implementation of Right to Education Act 2009, and points to the need for universalising secondary education. As compared to the magnitude of funds recommended by the Planning Commission, the lowest budgetary outlays have been towards secondary education in the five years of the 11th Plan period. This again contradicts the observation made by the government.
Budgetary Allocation
To look at the numbers pertaining to education, it becomes clear that we are nowhere near the Kothari Commission recommendations of 1966 which sought to step up public spending on education to 6 percent of the GDP. While this was reiterated by the UPA I when it promised to allocate resources worth 6 percent of GDP on education, the present total public spending on education (taking the spending by not just Education Departments in the Centre and States but also the other departments that spend on education) works out to a mere 3.39 percent of the GDP (2008-09).

Centre for Budget and Governance Accountability, 201114
A decline in the size of public spending on education in proportion to the GDP indicates the progressively decreasing priority of education for the Union Government (Table 1.a). Another worrisome development in the past few years is the onset of privatisation in education – yet another indicator of the government’s adherence to a neoliberal policy paradigm.
Table 1.a: Total Expenditure on Education in the Country
Year
Total Expenditure on Education by Education Department and Other Departments
(Centre and States combined)(in Rs. Crore)
Total Public Expenditure on Education as % of GDP
2000-01 82879.2 3.942001-02 80506 3.532002-03 85889.4 3.502003-04 89731.6 3.262004-05 97374.8 3.002005-06 114388.8 3.102006-07 138727 3.23
2007-08 (RE) 164418.2 3.302008-09 (BE) 189324.7 3.39
Note: GDP figures that have been used up to 2003-04 are of the 1999-2000 series. Source: Compiled by CBGA from “Analysis of Budgeted Expenditure on Education”, Ministry of HRD, Govt. of India - various issues; Economic Survey 2010-11
As is presented in Figures 1.a and 1.b, the Union Government’s total allocation for Education in 2011-12 (BE) stands at 0.71 percent of GDP, which is slightly better than the 0.69 percent of GDP recorded for 2010-11 (RE). As a proportion of its total budget outlay, there is an increase in outlays for education by 16.1 percent from 2010-11 (RE) to 2011-12 (BE).
Figure 1.a: Union Govt. Spending on Education as a Share of Total Union Govt. Budget (in %)
Source: Compiled by CBGA from Union Budget documents for various years.
Figure 1.b: Union Govt. Spending on Education as a Share of GDP (in %)
Source: Compiled by CBGA from Union Budget documents for various years; GDP figures from Economic Survey 2010.

Centre for Budget and Governance Accountability, 2011 15
To briefly outline the key provisions of the budget, a welcome measure is introduction of a scheme for students belonging to the SC community - Pre-Matric Scholarship for SC Students for Classes IX and X with an outlay of Rs. 196 crore. The outlays for Rashtriya Madhyamik Shiksha Abhiyan (RMSA) have been stepped up from Rs. 1500 crore in 2010-11 (RE) to Rs. 2423 crore in 2010-11 (BE). Schemes showing increases in their outlay include Scheme for Providing Quality Education in Madrassas (SPQEM), Scheme for Infrastructure Development in Minority Institutions (IDMI), Information and Communication Technology in Schools, Scheme for Construction and Running of Girls Hostels for Students of Secondary & Higher Secondary Schools.
Outlays for National Means-cum-Merit Scholarship Scheme have been reduced from Rs. 81.45 crore in 2010-11 (BE) to Rs. 54 crore in 2011-12 (BE). When comparing the outlays in the Union Budget for the five years of the 11th Plan period (2007-08 to 2011-12), budget outlays fall far short of what was proposed by the Planning Commission (Table 1.b). This is true for RMSA that has been allocated a mere 22 percent of the total recommended 11th Plan outlays. Some other instances are Teacher Training (45 percent) and University Grants Commission (68 percent).
Table 1.b: Recommended 11th Plan Outlay vs. Budgetary Allocations in Education
Plan / Scheme
Outlay for 11th Plan (in Rs. Crore) [at Current
Prices]
Union Budget Allocations Union Budget Outlays
corresponding the 11th Plan
period
% Outlay 2007-08 RE
2008-09 RE
2009-10 RE
2010-11 RE
2011-12 BE
SSA 71000 13171 13100 13100 19000 21000 79371 111.8MDM 48000 6678 8000 7359 9440 10380 41857 87.2Teacher Training 4000 312 307 325 375 500 1819 45.5
SUCCESS / RMSA 22620 1 511 550 1500 2424 4985.9 22.0
Navodaya Vidyalaya 4600 1055 1421 1170 1655.4 1609 6910.2 150.2
UGC 25012 1633 2762 3244 4119.6 5250 17008.7 68.0Technical Education 23654 1103 2885 3686 4220.9 5660 17554.8 74.2
Source: Compiled by CBGA from 11th Plan Document and Union Budget documents, various years
While the Government has enacted the Right to Education for children in the age group of 6 to 14 years, the increase in the budget for Sarva Shiksha Abhiyan (SSA) by 10.5 percent in 2011-12 (BE) as compared to 2010-11 RE) is hardly sufficient to foot the cost of universalising quality education. Related to this is the increasing reliance on education cess to finance schemes like SSA and Mid Day Meal (Figure 1.c).
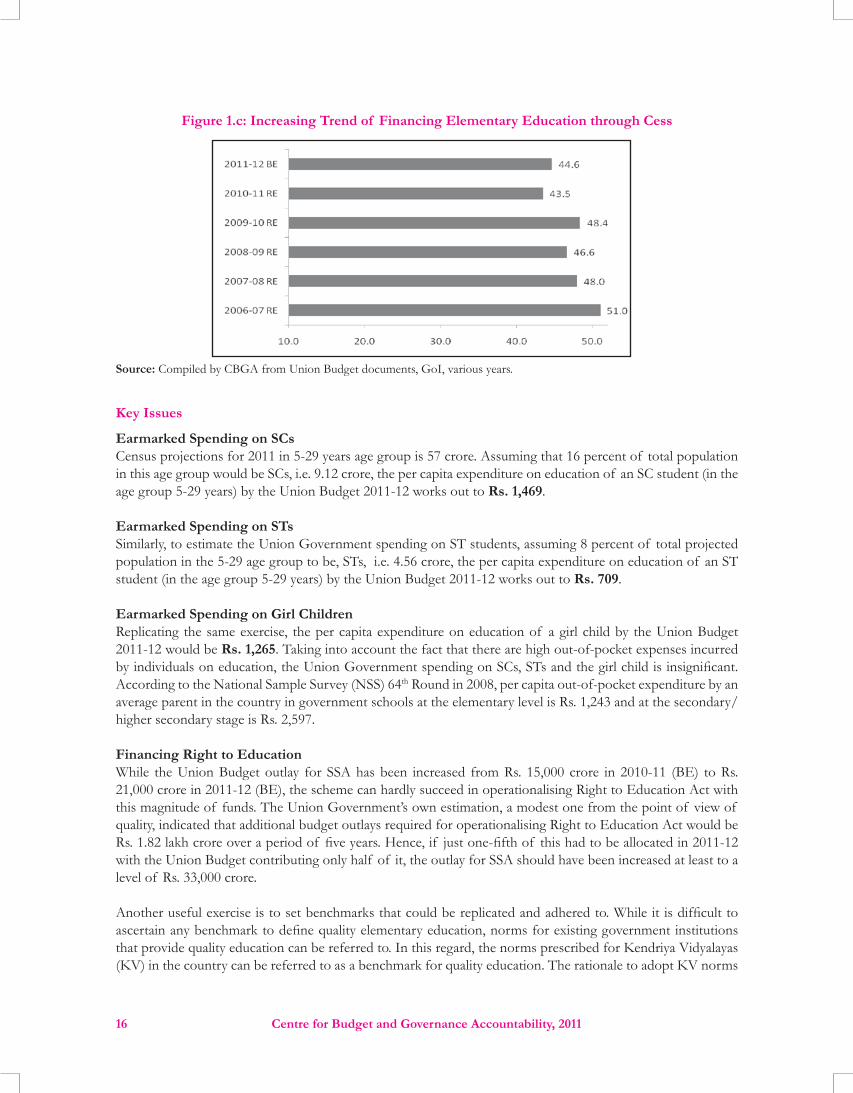
Centre for Budget and Governance Accountability, 201116
Figure 1.c: Increasing Trend of Financing Elementary Education through Cess
Source: Compiled by CBGA from Union Budget documents, GoI, various years.
Key Issues
Earmarked Spending on SCs Census projections for 2011 in 5-29 years age group is 57 crore. Assuming that 16 percent of total population in this age group would be SCs, i.e. 9.12 crore, the per capita expenditure on education of an SC student (in the age group 5-29 years) by the Union Budget 2011-12 works out to Rs. 1,469.
Earmarked Spending on STsSimilarly, to estimate the Union Government spending on ST students, assuming 8 percent of total projected population in the 5-29 age group to be, STs, i.e. 4.56 crore, the per capita expenditure on education of an ST student (in the age group 5-29 years) by the Union Budget 2011-12 works out to Rs. 709.
Earmarked Spending on Girl ChildrenReplicating the same exercise, the per capita expenditure on education of a girl child by the Union Budget 2011-12 would be Rs. 1,265. Taking into account the fact that there are high out-of-pocket expenses incurred by individuals on education, the Union Government spending on SCs, STs and the girl child is insignificant. According to the National Sample Survey (NSS) 64th Round in 2008, per capita out-of-pocket expenditure by an average parent in the country in government schools at the elementary level is Rs. 1,243 and at the secondary/higher secondary stage is Rs. 2,597.
Financing Right to EducationWhile the Union Budget outlay for SSA has been increased from Rs. 15,000 crore in 2010-11 (BE) to Rs. 21,000 crore in 2011-12 (BE), the scheme can hardly succeed in operationalising Right to Education Act with this magnitude of funds. The Union Government’s own estimation, a modest one from the point of view of quality, indicated that additional budget outlays required for operationalising Right to Education Act would be Rs. 1.82 lakh crore over a period of five years. Hence, if just one-fifth of this had to be allocated in 2011-12 with the Union Budget contributing only half of it, the outlay for SSA should have been increased at least to a level of Rs. 33,000 crore.
Another useful exercise is to set benchmarks that could be replicated and adhered to. While it is difficult to ascertain any benchmark to define quality elementary education, norms for existing government institutions that provide quality education can be referred to. In this regard, the norms prescribed for Kendriya Vidyalayas (KV) in the country can be referred to as a benchmark for quality education. The rationale to adopt KV norms

Centre for Budget and Governance Accountability, 2011 17
is in recognition of the fact that KVs are the most satisfactory model of schools that are financed by the Union Government, but these schools are catering only to a small section of population. Given that the government is already spending at least Rs.1 crore per KV (at the elementary level) in a year, it is but a matter of ‘intent’ mirroring the outlays (Table 1.c).
Table 1.c: Benchmarks to Assess Adequacy of Government Spending on Education
Union Budget outlay for Kendriya Vidyalayas in 2011-12 Rs. 2235 crore
Number of Kendriya Vidyalayas 981
Government spending per Kendriya VidyalayaRs. 2235 crore / 981
KVs
Thus, government spending per Kendriya Vidyalaya in 2011-12 Rs.2.27 croreAssuming that at least half of this outlay is for elementary education (Classes I to VIII) Rs. 2.27 crore / 2Thus, government spending per Kendriya Vidyalaya in 2011-12 at elementary level in one year Rs. 1.13 crore
Source: Exercise of cost estimation based on database from Union Budget 2011-12
Encouraging Private Sector in Education One of the three priorities listed by the government for this year is improving the institutions, public delivery and governance practices (Budget Speech 2011-12). It seems the government’s solution to address this concern is to encourage private sector as is revealed by the government’s “exploring effective delivery of services through Public-Private-Partnership with more accountability and transparency”, even with regard to the programmes implemented for the welfare and development of the marginalised sections of population (Economic Survey 2010-11).
The Economic Survey 2010-11 also goes on to highlight the scope for meeting the resource gap to finance higher education through ‘a tailor-made Public-Private-Partnership, also calling it as public-social-private partnership (PSPP)’. For this, the government also cautions on the need to assess ‘the risks and returns associated with such high cost projects to ensure that there are takers for these PSPPs’ (Economic Survey 2010-11). While on the one hand, the Union Government continues to dole out tax exemptions to the corporate sector, on the other, it pleads of a resource crunch!
Concluding Remarks
Several critical concerns remain in the provisioning for education: inadequate outlays, unclear prioritisation of the sectors within education, and under-utilisation of allocated funds. The key to the problem lies in bringing about changes in the approach adopted towards planning, streamlining the institutional and budgetary processes, and addressing systemic weaknesses in the social sector. Most of all, the government’s withdrawal from provisioning for a basic entitlement, such as education, needs to be checked. That alone would be able to ensure the elusive ‘inclusive growth’.

Centre for Budget and Governance Accountability, 201118
• Union Government’s allocation for Health and Family Welfare (the budget for the Ministry of Health and Family Welfare) as a proportion of total Union Budget has increased marginally from 2.1 percent in 2010-11 (Revised Estimates) to 2.4 percent in 2011-12 (Budget Estimates). The total allocation of the Union Government for Health & Family Welfare shows a negligible increase from 0.32 percent of GDP in 2010-11 (RE) to 0.34 percent of GDP in 2011-12 (BE).
• As a proportion of GDP, the combined expenditure of Centre and States on Health, which was around 1.02 percent in 2008-09, is around 1 percent in 2009-10. Thus, the government is far short of the National Common Minimum Programme (NCMP) target of raising total public spending on Health in the country to 2 to 3 percent of the GDP.
• The Finance Minister has proposed to extend the Rashtriya Swasthya Bima Yojana to cover unorganised sector workers in hazardous mining and associated industries like slate and slate pencil, dolomite, mica and asbestos etc. However, the budgetary allocation for this scheme has been reduced substantially from Rs. 446 crore in 2010-11 (RE) to Rs. 280 crore in 2011-12 (BE).
• With the cascading effect of the 1 % increase in excise duty from the existing level of 4 %, prices of allopathic medicines are predicted to rise by 2 to 3 %. Ayurvedic, unani and homeopathic preparations will be taxed for the first time.
• Union Budget allocations, during 2007-08 to 2011-12, for a number of important schemes in health sector fall far short of the benchmarks suggested by the Planning Commission for the 11th Plan period.
Adequacy of Public Resources for Health
UPA I had made a commitment in the NCMP in 2004 that total public spending on Health would be raised to the level of 2 to 3 percent of GDP. This was also reiterated in the 11th Five Year Plan. However, the combined budgetary allocation (the total outlays from both Union and State Budgets) for Health stands at a meagre 1 percent of GDP for 2009-10 (BE).
In 2004-05, only 1.62 percent of the total Union Budget was spent on Health. The share of the Health sector in the total spending of the Union government has gradually gone up to 2.4 percent by 2011-12 (BE). However, as a proportion of the GDP, the spending on Health by the Central Government shows a less perceptible increase from 0.25 percent in 2003-04 to 0.34 percent in 2011-12 (BE).
Table 2.a: Combined Expenditure of Centre and States on Health and Family WelfareCentre’s
Expenditure $
(in Rs. Crore)
States’ Expenditure(in Rs. Crore)
Centre’s Exp. as % of GDP
Total Exp. (Centre + States) as % of GDP @
2004-05 8085.95 18771 0.25 0.832005-06 9649.24 22031 0.26 0.862006-07 11757.74 25375 0.27 0.862007-08 14410.37 28907.7 0.29 0.87
Centre for Budget and Governance Accountability, 2011 19
2008-09 18476 38578.8 0.33 1.022009-10 21680 43848.18 0.33 1.002010-11 (RE) 25055 - 0.32 -2011-12 (BE) 30456 - 0.34 -
Notes: * Figures for States’ Expenditure are Revised Estimates (RE) for 2008-09 and Budget Estimates (BE) for 2009-10. $ Centre’s expenditure on Health and Family Welfare refers to the expenditure by Ministry of Health and Family Welfare only. It doesn’t include the expenditure of other Ministries.@ These figures may involve double counting of the grants-in-aid from Centre to States under Health and Family Welfare.Source: Compiled by CBGA from Union Budget, various years, GoI and RBI: State Finances – A Study of Budgets, various years.
Chart 2.a: Share of Health Sector in Union Budget (in %)
Share of Health Sector in Union Budget (in %)
1.62
1.912.02 2.02 2.09 2.12 2.06
2.42
0.00
0.50
1.00
1.50
2.00
2.50
3.00
2004-05 2005-06 2006-07 2007-08 2008-09 2009-10 2010-11 2011-12BEYear
Perc
enta
ge (%
)
Note: The figures for 2004-05 to 2010-11 are RE, while 2011-12 is BE. Source: Compiled by CBGA from Expenditure Budget Vol. I, Union Budget, various years, GoI.
While significant outlays were recommended for some major schemes in the 11th Plan, only a fraction of the proposed outlays have been reflected in the Union Budget in the entire Plan period. Two major schemes — District Hospitals and Human Resources for Health — paint a gloomy picture with only 19.6 and 18.6 percent of recommended outlays in the entiree Plan period (see Table 2.b). Even in important programmes like NRHM, only 77 percent of the recommended outlays have been reflected so far in the Union Budgets from 2007-08 to 2011-12.
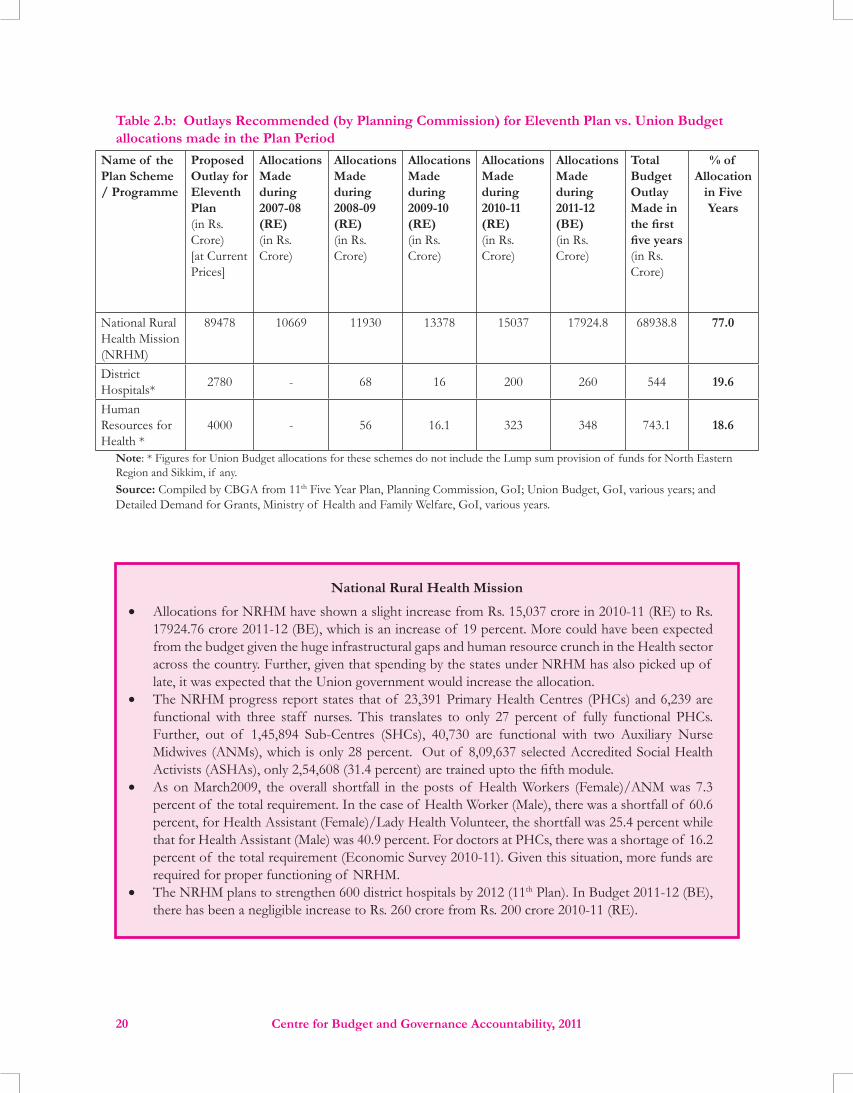
Centre for Budget and Governance Accountability, 201120
Table 2.b: Outlays Recommended (by Planning Commission) for Eleventh Plan vs. Union Budget allocations made in the Plan Period
Name of the Plan Scheme / Programme
Proposed Outlay for Eleventh Plan(in Rs. Crore)[at Current Prices]
Allocations Made during 2007-08 (RE)(in Rs. Crore)
Allocations Made during 2008-09 (RE)(in Rs. Crore)
Allocations Made during 2009-10 (RE)(in Rs. Crore)
Allocations Made during 2010-11 (RE)(in Rs. Crore)
Allocations Made during 2011-12 (BE)(in Rs. Crore)
Total Budget Outlay Made in the first five years(in Rs. Crore)
% of Allocation
in Five Years
National Rural Health Mission (NRHM)
89478 10669 11930 13378 15037 17924.8 68938.8 77.0
District Hospitals* 2780 - 68 16 200 260 544 19.6
Human Resources for Health *
4000 - 56 16.1 323 348 743.1 18.6
Note: * Figures for Union Budget allocations for these schemes do not include the Lump sum provision of funds for North Eastern Region and Sikkim, if any. Source: Compiled by CBGA from 11th Five Year Plan, Planning Commission, GoI; Union Budget, GoI, various years; and Detailed Demand for Grants, Ministry of Health and Family Welfare, GoI, various years.
National Rural Health Mission
• Allocations for NRHM have shown a slight increase from Rs. 15,037 crore in 2010-11 (RE) to Rs. 17924.76 crore 2011-12 (BE), which is an increase of 19 percent. More could have been expected from the budget given the huge infrastructural gaps and human resource crunch in the Health sector across the country. Further, given that spending by the states under NRHM has also picked up of late, it was expected that the Union government would increase the allocation.
• The NRHM progress report states that of 23,391 Primary Health Centres (PHCs) and 6,239 are functional with three staff nurses. This translates to only 27 percent of fully functional PHCs. Further, out of 1,45,894 Sub-Centres (SHCs), 40,730 are functional with two Auxiliary Nurse Midwives (ANMs), which is only 28 percent. Out of 8,09,637 selected Accredited Social Health Activists (ASHAs), only 2,54,608 (31.4 percent) are trained upto the fifth module.
• As on March2009, the overall shortfall in the posts of Health Workers (Female)/ANM was 7.3 percent of the total requirement. In the case of Health Worker (Male), there was a shortfall of 60.6 percent, for Health Assistant (Female)/Lady Health Volunteer, the shortfall was 25.4 percent while that for Health Assistant (Male) was 40.9 percent. For doctors at PHCs, there was a shortage of 16.2 percent of the total requirement (Economic Survey 2010-11). Given this situation, more funds are required for proper functioning of NRHM.
• The NRHM plans to strengthen 600 district hospitals by 2012 (11th Plan). In Budget 2011-12 (BE), there has been a negligible increase to Rs. 260 crore from Rs. 200 crore 2010-11 (RE).

Centre for Budget and Governance Accountability, 2011 21
Areas of Concern:
• Combined expenditure by the Centre and States in 2009-10 (BE) stills hovers at around 1 percent of the GDP, which is far short of the promised 2 to 3 percent of the GDP. Allocation of the Union government on Health has increased to Rs. 30,456 crore in 2011-12 (BE) from Rs. 25,055 crore in 2010-11 (RE).
• Allocation on NRHM has increased only by 19 percent. Given the requirement of additional funds to augment the rural health infrastructure, fill in vacancies of doctors, ANMs, and paramedics, this seems to an insignificant increase. And, considering that the spending by the states under NRHM has also picked up in recent years, the government should increase the allocation further.
• The ruling Congress had made a commitment in its 2009 Election Manifesto that: every district headquarters hospital would be upgraded to provide quality health facilities to all. This would be a critical measure in view of the fact that district hospitals play a key role in providing health services to the poor; and, substantial improvements in infrastructure and other facilities are required so that they can function more effectively. Hence, the present Union government should pay attention to the specific Union Budget allocations which pertain to strengthening of district hospitals.
• Shortfalls in rural health infrastructure are a major problem in the primary health care system of the country. According to the 2001 Census, the deficit in the rural health infrastructure comes out to be of 20,534 Sub Centres, 4504 PHCs and 2135 Community Health Centres (CHCs). With regard to location, 54.3 percent of Sub Centres, 86 percent of PHCs and 89.8 percent of CHCs are located in government buildings. The rest are located either in rented buildings or rent-free Panchayat/ Voluntary Society buildings (Rural Health Statistics Bulletin, 2009), underlining the need for increased allocations for the primary health infrastructure, particularly in rural areas.
• In his Budget Speech, the Finance Minister has proposed to extend the Rashtriya Swasthya Bima Yojana (RSBY) to cover unorganised sector workers in hazardous mining and associated industries like slate and slate pencil, dolomite, mica and asbestos etc. Undoubtedly, this is a welcome development. But it appears to be rhetoric, as the budgetary allocation for this purpose has been reduced substantially to Rs. 279.94 crore in 2011-12 (BE) whereas it was Rs. 445.89 crore in 2010-11 (RE). Further, there are several concerns pertaining to the implementation of RSBY (relating to the role of private health insurance companies and the private healthcare institutions), which need to be addressed.

Centre for Budget and Governance Accountability, 201122
• The Union Budget allocations for rural water supply have increased by a small margin from Rs. 8100 crore in 2010-11 (RE) to Rs. 8415 crore in 2011-12 (BE). For rural sanitation, the budget allocations have shown only a negligible increase from Rs. 1422 crore in 2010-11 (RE) to Rs. 1485 crore in 2011-12 (BE). A less than 5 percent increase in the budget for rural water and sanitation is perhaps a reflection of the waning commitment of the government for this sector.
• In urban water supply and sanitation, the allocation for the ‘Integrated Low Cost Sanitation Programme’ has been reduced from Rs. 80 crore in 2010-11 (RE) to Rs. 71 crore in 2011-12 (BE).
• Despite water and sanitation affecting women’s lives so significantly, the Department of Drinking Water Supply does not yet report in the Gender Budget (GB) Statement in the Union Budget.
Budgetary Allocations and Expenditure
This year’s budget does not promise much for the water supply and sanitation sector. A look at the expenditure trends in rural water supply and sanitation has shown that from last year’s allocation of Rs. 9512 crore in 2010-11 (RE), allocations have only marginally increased to Rs. 9900 crore in 2011-12 (BE). In fact, expenditure on rural water supply and sanitation as a proportion of total expenditure from Union Budget is only 0.79 percent in 2011-12 (BE) (Table 3.a). While open defecation and manual scavenging persists, one wonders when the government will wake up to the severe crisis in providing access to water supply and sanitation services.
Table 3.a: Expenditure on Rural Water Supply and Sanitation
YearRural Drinking Water
Supply and Sanitation*(in Rs.Crore)
Union Govt. Expenditure on Water Supply and Sanitationas % of Total Expenditure from Union Budget
2004-05 RE 3301.39 0.662005-06 RE 4761.52 0.942006-07 RE 5301.63 0.912007-08 RE 7461.82 1.052008-09 RE 8502.27 0.962009-10 RE 8269.00 0.812010-11 RE 9512.00 0.782011-12 BE 9900.00 0.79
Source: Expenditure Budget Volume I&II –Union Budget for various years, www.indiabudget.nic.inNote: * Union Budget Outlay for Dept. of Drinking Water Supply under Ministry of Rural Development
Trends in Allocation for Schemes
Since 2011 is the last year of the 11th Five Year Plan, it is crucial to assess to what extent the Plan allocations laid out by the Union government measure up to the proposed outlay for the 11th Plan. A look at Table 3.b shows that Union government allocations for Rural Water Supply is around 102 percent while for Rural Sanitation, it is around 89.5 percent in comparison to what was proposed in the Plan.

Centre for Budget and Governance Accountability, 2011 23
Table 3.b: Recommended Outlays vs. Actual Allocations (11th Plan)Name of Plan Scheme / Programme
Proposed Outlay for 11th Plan in Rs. crore (at Current Prices)
Allocations made during 2007-08 (RE)
Allocations made during 2008-09 (RE)
Allocations made during 2009-10 (RE)
Allocations made during 2010-11 (RE)
Allocations made during 2011-12 (BE)
Total Budget Outlay made in the first five years
% of Allocation Till Now
Ministry of Rural Development National Rural Drinking Water Programme (NRDWP)erstwhile Rural Water Supply Programme)
34916 4601.5# 7300 7199* 8100* 8415* 35,615.5 102
Total Sanitation Campaign
6910 996# 1200 1080* 1422* 1485* 6,183 89.5
Source: Expenditure Budget Vol-II, Various Years, Government of India; Detailed Demands for Grants, Ministry of Rural Development, 11th Five Year Plan (2007-2012) Note: * Figure does not include the Lumpsum Provision of funds for North Eastern Region and Sikkim (if any). #-Denotes actual expenditure
However, increased allocations do not necessarily translate into enhanced expenditure. The Mid Year Analysis for 2010-11 brought out by the Ministry of Finance shows that the Department of Drinking Water Supply had utilised only 37 percent of the allocated funds in 2009-10 and 43 percent of the proposed outlay in 2010-11.
Some Important Schemes:
Bharat Nirman / National Rural Drinking Water Programme:‘The UPA Government’s flagship programmes have been the principal instrument for implementing its agenda for inclusive development. For the year 2011-12, Bharat Nirman, which includes Pradhan Mantri Gram Sadak Yojana (PMGSY), Accelerated Irrigation Benefit Programme, Rajiv Gandhi Grameen Vidyutikaran Yojana, Indira Awas Yojana, National Rural Drinking Water Programme and Rural Telephony have together been allocated Rs.58,000 crore. This is an increase of Rs.10,000 crore from the current year’ (Finance Minister’s Budget Speech 2011)
Although the overall allocation for Bharat Nirman has witnessed an increase of Rs. 10,000 crore, the NRDWP has barely got an increase of 3.9 percentage points. (Table 3.b)
Rural drinking water is one of the six components of Bharat Nirman. Bharat Nirman Phase I was implemented in the period 2005-06 to 2008-09. Phase II is being implemented from 2009-10 to 2011-12. The NRDWP had a budgetary provision of Rs. 9000 crore for 2010-11 against which Rs.7,103.56 crore has been utilized so far. The implementation status of the NRDWP under Bharat Nirman Phase II shows that against a physical target of 76,316 habitations that were to be covered up to 2010-11, a total of 43,193 habitations have been covered as on 31 December 2010 (Table 3.c). The programme aims to cover all the uncovered and quality-affected habitations during 2011-12. However, since this is the last year of Bharat Nirman, one has to assess how much can be covered since only 56 percent of targeted habitations have been covered so far.

Centre for Budget and Governance Accountability, 201124
Table 3.c: Status of NRDWP under Bharat Nirman Phase II till December 31, 2010Components Total Rural
HabitationsBalance remaining
as on 1st AprilTarget (2009-10
and 2010-11)Cumulative Achievement
during Bharat Nirman Phase II (2009 and 10 till 31
Dec.2010)Uncovered habitations
627 627 544
Quality affected habitations
1,79,999 75,689 43,193
Total 16,61,073 1,80,626 76,316 43,737Source: Economic Survey, 2010-11
Total Sanitation Campaign (TSC):
It has been over a decade since the TSC was launched. A total of 607 TSC projects have been sanctioned so far in rural districts of the country with a total outlay of Rs.20,024 crore, with the Central share being Rs.13,026 crore. (Economic Survey 2010-11). As per government data, there has been a substantial increase in rural sanitation coverage from 21.9 percent in 2001 to about 67.86 percent as on November 2010 which has been attributed to the scaling up of the TSC, combined with higher resource allocation. The Nirmal Gram Puraskar (NGP) incentive scheme which was initiated to encourage Panchayati Raj Institutions (PRIs) to take up sanitation promotion has an award that is given to those PRIs which attain 100 percent open-defecation-free environment. Under the NGP, a total of 22,443 gram panchayats, 165 intermediate panchayats, and 10 district panchayats have received the award in the last five years (Economic Survey 2010-11). Surely, these are encouraging figures. However, due to the scheme being incentivized, there is a danger of it becoming target-driven and not actually ensuring open defecation-free villages.
In this year’s budget, the allocation for TSC has increased only marginally from Rs.1422 crore in 2010-11 (BE) to Rs.1485 crore in 2011-12 (BE). This is a negligible increase of 4 percent. To ensure effective implementation of the programme, TSC has come out with Annual Implementation Plans. This is a positive step towards realizing the objectives of the programme and one can only hope that the states implement it effectively.
Jawaharlal Nehru National Urban Renewal Mission (JNNURM):
The JNNURM, a seven year programme launched in December 2005, provides financial assistance to cities for infrastructure, housing development, and capacity development.
The Government’s flagship JNNURM has two key components for up gradation and development of urban infrastructure in the country, namely Urban Infrastructure and Governance (UIG) and Urban Infrastructure Development Scheme for Small and Medium Towns (UIDSSMT). This apart, JNNURM comprises of two sub-missions, namely:
(i) Sub-Mission for Urban Infrastructure and Governance, including water supply, sewerage and sanitation, solid waste management, urban transport, redevelopment of core areas, development of heritage, and environment.(ii) Sub-Mission for Basic Services to the Urban Poor, including shelter, infrastructure services and related civic amenities.
Under UIG, in terms of number of projects, water supply projects top the list with 151 and the sewerage segment comes next with 111 projects. In terms of value, water supply projects top the chart followed by

Centre for Budget and Governance Accountability, 2011 25
sewerage and storm water drainage. So far, 83 projects have been completed. During the current financial year till 31 October 2010, about Rs. 6,556.12 crore has been released out of Rs. 12,978.93 provided in 2010-11 (BE). Under the UIDSSMT, from inception till 31 October 2010, 764 projects with a value of Rs.12, 928.93 crore have been approved. Here too, water supply projects (65 percent) top the list with sewerage (19 percent) as the second most important sub-component. So far, 123 projects have been completed (Mid–Year Analysis, 2010-11, Dept. of Economic Affairs, Ministry of Finance).
Two of its four components, Basic Services to the Urban Poor (BSUP) for 65 select cities and Integrated Housing and Slum Development Programme (IHSDP) for other cities and towns, are devoted to shelter and basic service needs of the poor. The implementation of JNNURM shows that decentralization as envisaged has not reached out to the urban local bodies (ULBs); urban poverty alleviation activities continue to be in the domain of the higher tiers of government. Most ULBs function without any autonomy in terms of designing urban poverty alleviation programmes and activities or in term of determining their tax policies. This has a direct impact on delivery of essential services such as water and sanitation to the urban poor (India Urban Poverty Report 2009, Ministry of Housing and Poverty Alleviation and UNDP).
Gender Concerns:
The burden of water collection and management usually falls on women. It has been proved that lack of proper and safe sanitation facilities is one of the major reasons for increase in the drop-out rate of girl children from schools once they attain puberty. The lack of water and sanitation facilities impacts the lives of women and girls much more adversely as compared to that of men and boys. Despite water and sanitation affecting women’s time use so significantly, the Department does not report in the GB Statement even now. Most of the water and sanitation schemes do not specifically talk about gender which needs to be backed up by adequate allocations. Provisioning and budgeting for gender sensitive services and measures in the Water supply and Sanitation schemes will ensure an integrated and inclusive approach in attaining equity in the sector.
Public-Private Partnership (PPP)
PPP in water supply and sanitation is here to stay. Many water supply and sanitation projects have been implemented in a PPP mode. Even the government has been emphasising on the projects entailing PPP. The government has said that there is an urgent need to create an enabling environment for private investment and improve delivery of public-sector projects at sub-national level.
‘The gap in available resources could possibly be met by a tailor-made Public-Private Partnership (PPP) mode of funding without diluting the regulatory oversight of the Government. Private-sector participation in social sectors, such as health and education, sometimes referred to as public-social private partnership (PSPP), could be one of the possible alternatives for supplementing the ongoing efforts of the Government’ (Economic Survey 2010-11).
It remains a matter of grave concern that essential services that impact the day-to-day lives of the people is to be provided through involvement of the private sector. The logic offered by the government on promoting private sector to deliver basic water supply and sanitation services due to poor public sector capacity is flawed, if not incongruous. What is needed is addressing the systemic weaknesses in the public sector and strengthening their capacity rather than allowing the private sector to run amok.

Centre for Budget and Governance Accountability, 201126
Concluding Remarks:
Public provisioning for water supply and sanitation in Union Budget 2011-12 needs to be looked at carefully keeping in mind the fact that this is the last year of the 11th Five Year Plan and that we have crossed the halfway mark to meet the MDG Goal of halving the proportion of people without sustainable access to safe drinking water and sanitation (by 2015). A close look at the allocations and expenditure clearly reveals the extent to which these goals meet the desired outcomes.
In the current context, with the focus on GDP-led growth being primary, there has been a stress on up scaling investments on infrastructure. In its Mid Term Appraisal of the 11th Plan, the Planning Commission estimated that total investment in infrastructure sectors which included water supply and sewerage was about Rs.20,54,205 crore. This would raise the level of investment in infrastructure to about 8.37 percent of the GDP in the last year of the Plan period. The Planning Commission has also projected the investment required for infrastructure to be 9.95 percent of the GDP (at the projected 9 percent rate of growth of the GDP) in the 12th Five year Plan. (Economic Survey 2011-12). This brings us to the very critical question of whether the government intends to focus primarily on growth or on increasing investments in the social sector of which water supply and sanitation is a part.

Centre for Budget and Governance Accountability, 2011 27
• Although the total budget for Department of Rural Development shows an increase from Rs. 66138 crore in 2010-11 (BE) to Rs. 76378 crore in 2010-11 (RE), the allocations have been brought down to Rs. 74144 crore in 2011-12 (BE).
• The outlays for Mahatma Gandhi National Rural Employment Guarantee Scheme (MGNREGS) has been restricted to Rs. 40000 crore in 2011-12 (Budget Estimates); it was Rs. 40100 crore in 2010-11 (Budget Estimates) and the same amount has been allocated in 2010-11 (Revised Estimates).
• The wages under MGNREGS have been linked to Consumer Price Index for Agricultural Labour (CPI-AL)
• The outlay for Swarnajayanti Gram Swarozgar Yojana (SGSY) too has been checked at Rs. 2951.3 crore in 2011-12 (BE); the same amount has been allocated in 2010-11 (RE).
• The outlay for Indira Awas Yojana (IAY) has been reduced from Rs. 10267 crore in 2010-11 (RE) to Rs. 9896 crore in 2011-12 (BE).
• No significant provision has been made to strengthen PRIs through financial devolution.
The initiation of the Mahatma Gandhi National Rural Employment Guarantee Scheme (MGNREGS) has been one of the most significant interventions made by the United Progressive Alliance (UPA) government in 2005-06. The budget for 2011 saw some significant developments with regard to this scheme. In pursuance of last year’s budget announcement to provide a real wage of 100 per day, the Finance Minister announced the government’s decision to index the wage rates notified under the MGNREGA to the Consumer Price Index for Agricultural Labour. However, the outlay for MGNREGS has been restricted to Rs. 40000 crore in 2011-12 (BE); it was Rs. 40100 crore in 2010-11 (BE) and the same amount has been allocated in 2010-11 (RE). Also, this is the first time, the government has kept Rs. 39000 crore out of Rs. 40100 as capital expenditure for MGNREGS.
The Finance Minister also announced an increase in the corpus fund for Rural Infrastructure Development Fund (RIDF XVII) from Rs.16,000 crore to Rs.18,000 crore (2011-12 BE), and an increase in the Backward Regions Grant Fund from Rs. 5170. 6 crore (2010-11 RE) to Rs. 5250 crore (2011-12 BE).
Assessment of Outlays for Rural Development Programmes in 11th Plan
With regard to assessing the actual allocation over outlays during the 11th Plan, there are some major rural development programmes which are listed in table 4.a. Although the budgetary allocations for few schemes have been satisfactory with regard to the proposed outlay in the 11th Plan outlay, the actual performance can only be gauged by assessing the physical performance of these schemes. In this regard, we have looked at actual allocations of eight major rural development schemes as compared to the Plan outlays. An assessment of the 11th Plan budgetary outlays and actual allocation for schemes such as MGNREGS, IAY and Pradhan Mantri Gram Sadak Yojana (PGMSY) reveals that budgetary allocations for all these schemes exceeds the proposed outlays by the Planning Commission. However, schemes like Swarnajayanti Gram Swarozgar Yojana (SGSY),

Centre for Budget and Governance Accountability, 201128
Total Sanitation Campaign (TSC) and Accelerated Rural Water Supply Programme (ARWSP) have not received the desired allocation. The assessment of schemes reveals that the focus of the government has been very uneven in terms of overall implementation of rural development programmes and also indicates some kind of saturation for the same (Table 4.a).
Table 4. a: Recommended 11th Plan Outlays vs. Budgetary Allocations in Rural Development
S.N Name of Scheme
(Figures in Rs. Crore)% of Total
Outlay
11th Plan Outlay recommended by the Planning Commission
2007-08 RE
2008-09 RE
2009-10 RE
2010-11 RE
2011-12 BE
Total till 2011-12
BE
1
National Rural Employment Guarantee Scheme (NREGS)
100000 10800 30000.19 39100 40100 40000 160000.2 160.0
2Swarnajayanti Gram Swarozgar Yojana (SGSY)
17803 1782 2324.3 2325.4 2951.3 2951.3 12334.3 69.3
3 Indira Awas Yojana (IAY) 26882.2 3999.6 8710.9 8709.8 10266.85 9895.6 41582.75 154.7
4
Integrated Watershed Management Programme (IWMP)
17372 1053.55 1440.5 1819.8 2458 2548.1 9319.95 53.6
5
Total Sanitation Campaign (formerly Rural Sanitation)
7815.66 954 1080 1200 1580 1650 6464 82.7
6
National Rural Drinking Water Programme (formerly Accelerated Rural Water Supply Programme)
39490.5 5750 6570 7999 9000 9350 38669 97.9
7Pradhan Mantri Gram Sadak Yojna
43251 10928.5 12398.54 15914.94 22000 20000 81241.98 187.8
8
Rajiv Gandhi Grameen Vidyutikaran Yojana
26503 3674.09 5500 8100 5000 6000 28274.09 106.7
Source: Compiled by CBGA from 11th Plan and Union Budget documents.
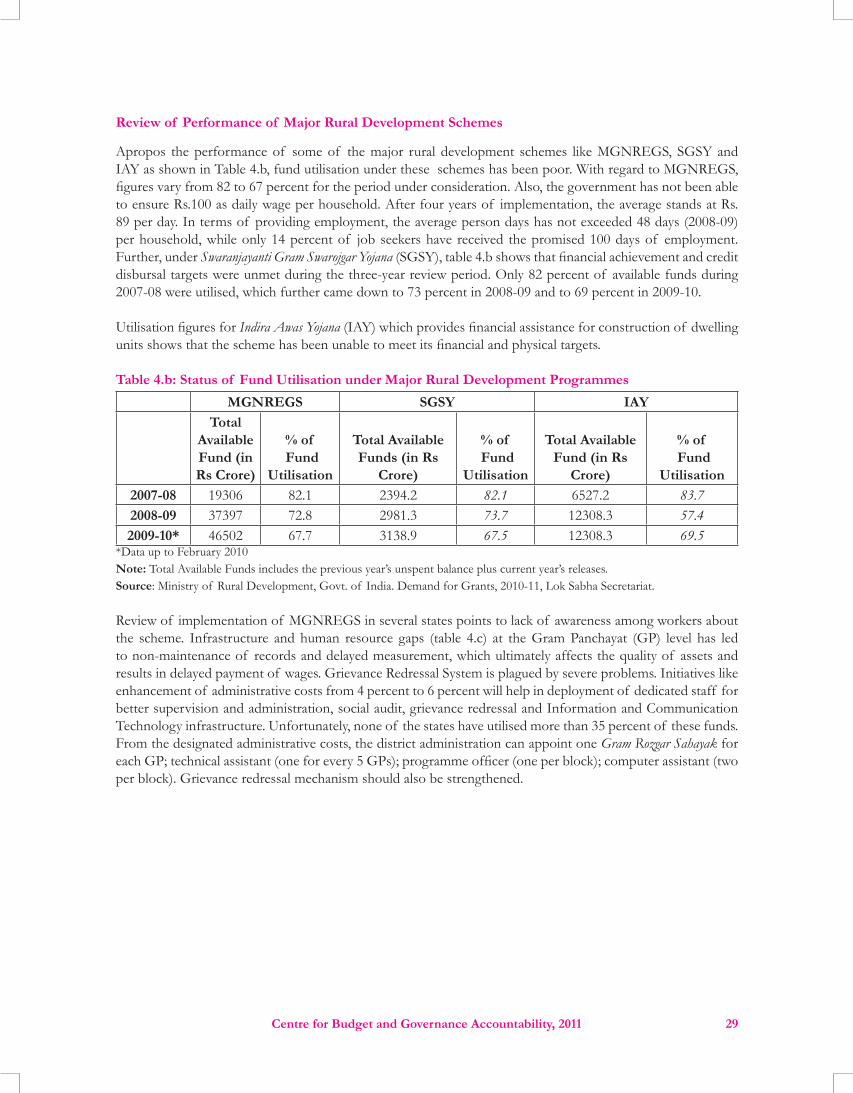
Centre for Budget and Governance Accountability, 2011 29
Review of Performance of Major Rural Development Schemes
Apropos the performance of some of the major rural development schemes like MGNREGS, SGSY and IAY as shown in Table 4.b, fund utilisation under these schemes has been poor. With regard to MGNREGS, figures vary from 82 to 67 percent for the period under consideration. Also, the government has not been able to ensure Rs.100 as daily wage per household. After four years of implementation, the average stands at Rs. 89 per day. In terms of providing employment, the average person days has not exceeded 48 days (2008-09) per household, while only 14 percent of job seekers have received the promised 100 days of employment. Further, under Swaranjayanti Gram Swarojgar Yojana (SGSY), table 4.b shows that financial achievement and credit disbursal targets were unmet during the three-year review period. Only 82 percent of available funds during 2007-08 were utilised, which further came down to 73 percent in 2008-09 and to 69 percent in 2009-10.
Utilisation figures for Indira Awas Yojana (IAY) which provides financial assistance for construction of dwelling units shows that the scheme has been unable to meet its financial and physical targets.
Table 4.b: Status of Fund Utilisation under Major Rural Development Programmes MGNREGS SGSY IAY
Total Available Fund (in Rs Crore)
% of Fund
Utilisation
Total Available Funds (in Rs
Crore)
% of Fund
Utilisation
Total Available Fund (in Rs
Crore)
% of Fund
Utilisation2007-08 19306 82.1 2394.2 82.1 6527.2 83.72008-09 37397 72.8 2981.3 73.7 12308.3 57.42009-10* 46502 67.7 3138.9 67.5 12308.3 69.5
*Data up to February 2010Note: Total Available Funds includes the previous year’s unspent balance plus current year’s releases.Source: Ministry of Rural Development, Govt. of India. Demand for Grants, 2010-11, Lok Sabha Secretariat.
Review of implementation of MGNREGS in several states points to lack of awareness among workers about the scheme. Infrastructure and human resource gaps (table 4.c) at the Gram Panchayat (GP) level has led to non-maintenance of records and delayed measurement, which ultimately affects the quality of assets and results in delayed payment of wages. Grievance Redressal System is plagued by severe problems. Initiatives like enhancement of administrative costs from 4 percent to 6 percent will help in deployment of dedicated staff for better supervision and administration, social audit, grievance redressal and Information and Communication Technology infrastructure. Unfortunately, none of the states have utilised more than 35 percent of these funds. From the designated administrative costs, the district administration can appoint one Gram Rozgar Sahayak for each GP; technical assistant (one for every 5 GPs); programme officer (one per block); computer assistant (two per block). Grievance redressal mechanism should also be strengthened.

Centre for Budget and Governance Accountability, 201130
Table 4.c: Status of Vacancies in MGNREGSVacancies at the National Level Norm (if any) States where the situation is acute
(Shortfall in %)Gram Rozgar Sahayaks: 21% One per Gram
PanchayatMadhya Pradesh: 83%Uttarakhand: 63%Punjab: 51%
Accountants: 28%Punjab: 80%Arunachal Pradesh: 44%
Engineers/Technical Assistants: 34% Punjab & West Bengal: 70%Chhattisgarh: 56%Jharkhand: 51%Uttar Pradesh: 50%
Programme Officers: 13% One per Block Rajasthan & MP: 30%Computer Assistants: 23% Uttarakhand: 44%
Bihar: 36%Source: Ministry of Rural Development, GoI
Programmes like SGSY and IAY, which are implemented through panchayats, are also plagued by inaccurate or fudged beneficiary/ BPL lists, insufficient funds for beneficiaries to explore meaningful livelihood options, lack of markets and infrastructure and consequently increased indebtedness of beneficiaries. In the case of SGSY, major problems such as target-driven SHG formation, subsidy-driven corruption, obsession with asset formation without proper marketing mechanism were observed by the Demands for Grants (2010-11) of the Ministry of Rural Development. Poor administration and management of the scheme and inadequate banking staff leading to non-repayment of loans was also noted.
Concluding Remarks
Several issues relating to budgetary provisioning and governance reforms for strengthening rural development programmes need to be addressed by the government. During its first term in the government, the UPA I had stepped up resources for various rural development schemes but this has dwindled in the subsequent years. On the programme implementation front, the government has shown little sense of urgency to address the bottlenecks. Various reasons have been identified for poor implementation of rural development schemes/programmes which include low level of community participation, inadequate devolution of powers and functions to PRIs besides an acute shortage of trained staff mostly at the level of PRIs.
Centre for Budget and Governance Accountability, 2011 31
• Union Government’s total expenditure on the rural economy (which includes expenditure on Agriculture and Allied Activities, Rural Development, Special Area Programmes, Irrigation and Flood Control and Village and Small Industries) has declined from 3.3 percent of GDP in 2008-09 (Actuals) to 2.3 percent of GDP in 2011-12 (Budget Estimates).
• As a proportion of total expenditure from the Union Budget, the expenditure on Agriculture and Allied Activities showed a marked decline from 15.7 percent in 2008-09 (Actuals) to 10.3 percent in 2011-12 (BE). The Union Government’s expenditure on Agriculture and Allied Activities, as a proportion of the GDP, also dipped from 2.5 percent in 2008-09 (Actuals) to 1.4 percent in 2011-12 (BE).
• If the total allocations made in the Union Budgets from 2007-08 to 2011-12 for major schemes in agriculture are compared with the allocations recommended by the Planning Commission for the 11th Five Year Plan period (2007-08 to 2011-12), there is a shortfall of allocation of 10 to 40 percent across various schemes in this sector.
• An allocation of Rs. 400 crore has been made in Union Budget 2011-12 for extending the “Green Revolution” to the eastern region of the country comprising six States and the eastern part of Uttar Pradesh. The government intends to provide high yielding variety seeds, technology and irrigation etc. to the farmers (as these are essential elements of the Green Revolution). However, the allocation per farmer household in the target region comes to a meagre Rs. 120 per annum.
• Again, an allocation of Rs. 300 crore has been made for pulses in 60,000 rain-fed villages with the average allocation per village amounting to a mere Rs. 50,000 per annum.
• An outlay of Rs. 300 crore has been earmarked to bring 60,000 hectares under oil palm plantation, by integrating the farmers with the markets, which would mean an allocation of just Rs. 50,000 per hectare.
• There is also a provision of Rs. 300 crore for increasing the production of millets in 25,000 villages with an estimated Rs. 1.2 lakh per village for the purpose.
It is well established that sustained growth of the Indian economy depends on growth of its farm sector. For achieving sustained growth in the agriculture and allied sector, especially to become self-reliant in foodgrains production to feed the 115 crore-plus population, targeted interventions with adequate public investment are required. However, the share of this sector in the country’s GDP has registered a continuous decline over the years to 14.2 percent as per 2010-11 (advance estimates) at constant 2004-05 prices, compared to 19 percent in 2004-05.
The decline in its growth rate compared to other sectors is due to many reasons, prominent among them being the shrinking share of public investment on this sector. Low budget priorities coupled with a steady rise in input prices have, in recent times, resulted in low farm incomes; limited purchasing power of the rural masses, especially the farming community; high rate of farmer suicides; and, rural unrest. It was expected that the budget would try to address the crisis in the agricultural sector but the low priority accorded to it indicates otherwise.
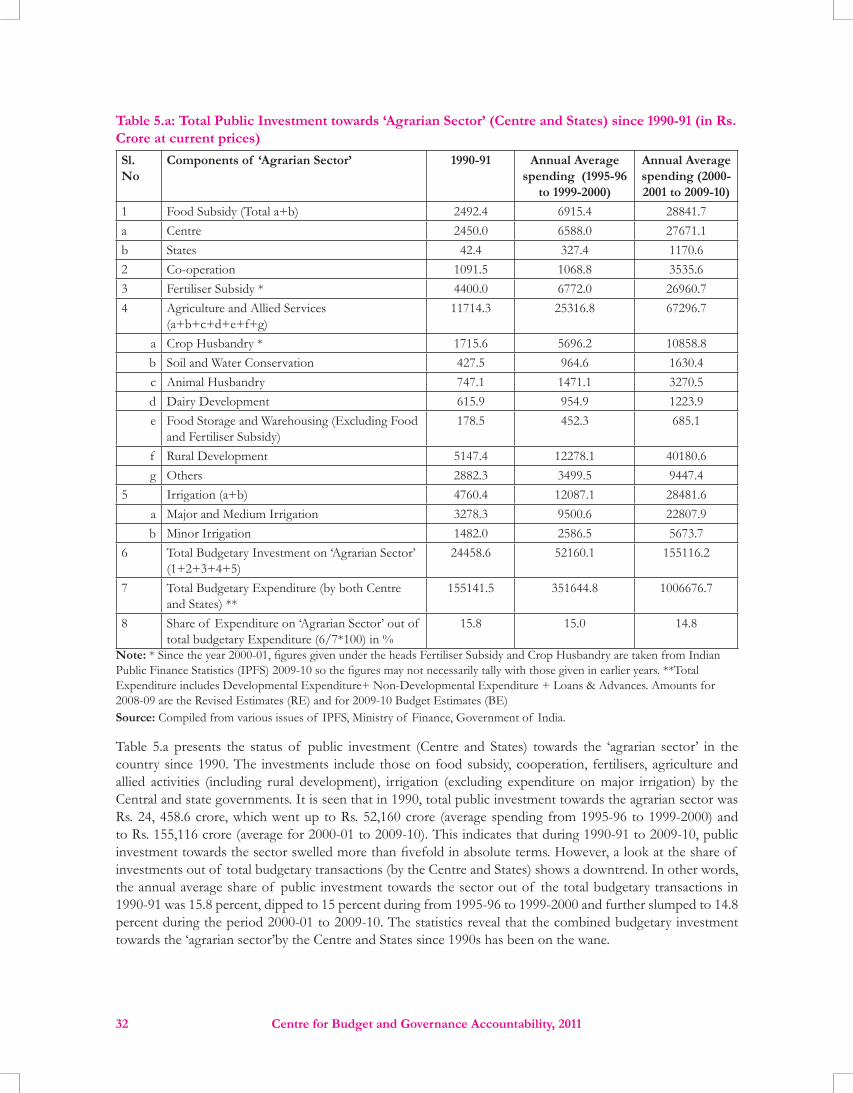
Centre for Budget and Governance Accountability, 201132
Table 5.a: Total Public Investment towards ‘Agrarian Sector’ (Centre and States) since 1990-91 (in Rs. Crore at current prices)Sl. No
Components of ‘Agrarian Sector’ 1990-91 Annual Average spending (1995-96
to 1999-2000)
Annual Average spending (2000-2001 to 2009-10)
1 Food Subsidy (Total a+b) 2492.4 6915.4 28841.7a Centre 2450.0 6588.0 27671.1b States 42.4 327.4 1170.62 Co-operation 1091.5 1068.8 3535.63 Fertiliser Subsidy * 4400.0 6772.0 26960.74 Agriculture and Allied Services
(a+b+c+d+e+f+g)11714.3 25316.8 67296.7
a Crop Husbandry * 1715.6 5696.2 10858.8b Soil and Water Conservation 427.5 964.6 1630.4c Animal Husbandry 747.1 1471.1 3270.5d Dairy Development 615.9 954.9 1223.9e Food Storage and Warehousing (Excluding Food
and Fertiliser Subsidy)178.5 452.3 685.1
f Rural Development 5147.4 12278.1 40180.6g Others 2882.3 3499.5 9447.4
5 Irrigation (a+b) 4760.4 12087.1 28481.6a Major and Medium Irrigation 3278.3 9500.6 22807.9b Minor Irrigation 1482.0 2586.5 5673.7
6 Total Budgetary Investment on ‘Agrarian Sector’ (1+2+3+4+5)
24458.6 52160.1 155116.2
7 Total Budgetary Expenditure (by both Centre and States) **
155141.5 351644.8 1006676.7
8 Share of Expenditure on ‘Agrarian Sector’ out of total budgetary Expenditure (6/7*100) in %
15.8 15.0 14.8
Note: * Since the year 2000-01, figures given under the heads Fertiliser Subsidy and Crop Husbandry are taken from Indian Public Finance Statistics (IPFS) 2009-10 so the figures may not necessarily tally with those given in earlier years. **Total Expenditure includes Developmental Expenditure+ Non-Developmental Expenditure + Loans & Advances. Amounts for 2008-09 are the Revised Estimates (RE) and for 2009-10 Budget Estimates (BE)Source: Compiled from various issues of IPFS, Ministry of Finance, Government of India.
Table 5.a presents the status of public investment (Centre and States) towards the ‘agrarian sector’ in the country since 1990. The investments include those on food subsidy, cooperation, fertilisers, agriculture and allied activities (including rural development), irrigation (excluding expenditure on major irrigation) by the Central and state governments. It is seen that in 1990, total public investment towards the agrarian sector was Rs. 24, 458.6 crore, which went up to Rs. 52,160 crore (average spending from 1995-96 to 1999-2000) and to Rs. 155,116 crore (average for 2000-01 to 2009-10). This indicates that during 1990-91 to 2009-10, public investment towards the sector swelled more than fivefold in absolute terms. However, a look at the share of investments out of total budgetary transactions (by the Centre and States) shows a downtrend. In other words, the annual average share of public investment towards the sector out of the total budgetary transactions in 1990-91 was 15.8 percent, dipped to 15 percent during from 1995-96 to 1999-2000 and further slumped to 14.8 percent during the period 2000-01 to 2009-10. The statistics reveal that the combined budgetary investment towards the ‘agrarian sector’by the Centre and States since 1990s has been on the wane.

Centre for Budget and Governance Accountability, 2011 33
It is observed that the overall GDP of the country has grown at an average of 8.62 percent per annum from 2004-05 to 2010-11 whereas agricultural GDP has increased by only 3.46 percent per annum during the period. As per the second advance estimates released by the Ministry of Agriculture, food grains production in 2010-11 is estimated at 232.07 million tonnes, which is less than the record grains production in 2008-09 at 234.37 million tonnes. This is despite the Finance Minister’s Budget Speech 2010-11 and the recent Economic Survey calling for a “Second Green Revolution” to boost food grains production and productivity. Stressing on development of infrastructure support in the Agriculture and Allied Activities sector, the Economic Survey reports that the relative weak supply responses to price hike in agriculture commodities, specially food articles, brings into focus the question of efficient supply management and more investment in agriculture and allied sectors with the right strategies, policies and intervention.
Investments in Union Budget on Rural Economy and Agriculture & Allied Activities
The prices of most essential commodities in the country have more than trebled in the past few months. This calls for much higher budgetary investment in the agricultural sector to boost production and productivity. In last year’s Budget Speech, Finance Minister Pranab Mukherjee spoke of a four-pronged strategy to breathe life into the sector. However, if the trends in budgetary investment are taken, it is clear that allocations towards this sector in the current budget are far from satisfactory.
Table 5.b: Spending on Rural Economy*as a proportion of Total Union Budget Expenditure and GDP
Year Expenditure on Rural Economy Expenditure on Agriculture and Allied Activities
As % of Total Union Budget Expenditure
As % of GDP at current market
prices
As % of Total Union Budget Expenditure
As % of GDP at current market
prices2004-05 9.9 1.5 7.3 1.12005-06 11.3 1.6 7.4 1.02006-07 14.6 2.0 8.3 1.12007-08 13.1 1.9 9.6 1.42008-09 21.1 3.3 15.7 2.52009-10 15.7 2.5 11.4 1.82010-11 RE 17.9 2.8 11.9 1.82011-12 BE 16.4 2.3 10.3 1.4Note: Expenditure on Rural Economy*includes (i) Agriculture and Allied Activities, (ii) Rural Development, (iii) Special Area Programmes, (iv) Irrigation and Flood Control and (v) Village and Small Industries.Source: Compiled from data in Annual Financial Statement (AFS) and Budget at a Glance, Union Budget, various years.
The Union government’s total expenditure on the Rural Economy (which includes expenditure on Agriculture and Allied Activities, Rural Development, Special Area Programmes, Irrigation and Flood Control, and Village and Small Industries) decreased from 3.3 percent of the GDP in 2008-09 (Actuals) to 2.3 percent in 2011-12 (BE). A similar picture emerges for the expenditure priority towards Agriculture and Allied Activities as a share from the GDP, which declined from 2.5 percent in 2008-09 to 1.4 percent in 2011-12 (BE). As a proportion of the total expenditure from the Union Budget, the expenditure on Rural Economy shows a continuous decline from 21.1 percent in 2008-09 (Actuals) to 16.4 percent in 2011-12 (BE). The government expenditure on Agriculture and Allied Activities as a proportion of total expenditure from the Union Budget also shows a sharp decline from 15.7 percent in 2008-09 (Actuals) to 10.3 percent in 2011-12 (BE).

Centre for Budget and Governance Accountability, 201134
In absolute figures, the allocation for the Ministry of Agriculture in 2011-12 (BE) is lower than last year’s Revised Estimates. This decline is evident under the departments of Agriculture and Cooperation as well as under Agriculture Research and Education. However, the departments of Animal Husbandry, Dairying and Fisheries have been earmarked higher outlays compared to last year’s RE. Moreover, this year’s budget also ignores the Mid-Term Appraisal of the 11th Five Year Plan recommending an increased allocation (at least 1 percent of Agri-GDP, which comes around Rs. 6,570 crore) for Agriculture Research and Education.
Table 5.c: Allocations Under three Depts. of Ministry of Agriculture since 2009-10 (in Rs. Crore) Ministry of Agriculture
2009-10 Actuals 2010-11 RE 2011-12 BE
Plan Non-Plan Total Plan Non-
Plan Total Plan Non-Plan Total
Dept. of Agriculture and Cooperation
10623 1051 11675 17254 441 17695 17123 400 17523
Dept. of Agricultural Research and Education
1707 1503 3210 2300 2865 5165 2800 2158 4958
Dept. of Animal Husbandry Dairying and Fisheries
871 100 971 1257 99 1356 1600 96 1696
Total allocation under the Ministry
13201 2655 15856 20811 3405 24216 21523 2654 24177
Total allocation of the Ministry as proportion of total Union Budget 1.55 1.99 1.92
Total allocation of the Ministry as proportion of GDP 0.24 0.31 0.27
Source: Compiled from Expenditure Budget Vol. II, Union Budget 2011-12, GoI
Union Government Expenditure on Special Interventions for Rainfed/Dryland Agriculture
Agricultural activities in rainfed areas are critical for performance of the sector in the sense that nearly 65 percent of the cultivated area in the country is rainfed. This implies that rainfed agriculture is a better option than irrigated agriculture, which is borne out by studies highlighting the practice as being less prone to climatic shocks. Rainfed agriculture also provides a wide range of livelihood opportunities to millions of livestock-dependent households, those living in hilly and difficult terrains, forest dwellers and so on. Hence, any sort of public interventions should aim at addressing the core issues and concerns of such agricultural practices. It is also crucial to prioritise investment on rainfed agriculture within the ambit of agricultural investment.
Perhaps with these concerns in mind, the Finance Minister has announced schemes targeting dryland/rainfed agriculture. Before going into the details, it is necessary to look at allocations under the Department for Land Resources within the Ministry of Rural Development, the administrative unit responsible for development of dryland/rainfed agriculture in the country. The purpose and functions of this administrative department pertain to implementing programmes and schemes for dryland/rainfed agriculture. Table 5. d details the allocative priorities of the Union government through this department since 2004-05.

Centre for Budget and Governance Accountability, 2011 35
Table 5.d: Expenditure by Department of Land Resources since 2004-05 (Rs. in Crore)
Year
s 2004
-05
RE
2005
-06
RE
2006
-07
A
2007
-08
A
2008
-09
A*
2009
-10
A
2010
-11
RE
2011
-12
BE
Total exp. under Department of Land Resources 1014 1399 1422 1406 1793 2025 2666 2706
As % of Total Union Government’s Exp. 0.20 0.28 0.24 0.20 0.20 0.20 0.22 0.22
As % of GDP at Market Prices 0.03 0.04 0.03 0.03 0.03 0.03 0.03 0.03
Source: Compiled from Expenditure Budget Vol.I, Budget at A Glance, Economic Survey, Ministry of Finance, GOI, Various YearsNote: RE-Revised Estimate; BE-Budget Estimate; A- Actuals; * Provisional Actuals
The Union Budget allocations for the special land development programmes (total allocation under the Department for Land Resources) has increased from Rs.1,014 crore in 2004-05 (RE) to Rs.2,706 crore in 2009-10 (BE). But as a share of the total government expenditure as well as GDP, this constitutes a meagre amount. For instance, its share from Union Budget expenditure was 0.20 percent in 2004-05 (RE) and increased slightly to 0.22 percent in 2011-12 (BE).
Planning Commission Recommended Outlay vs. Union Budget Allocations during 11th Plan
For growth to be “inclusive”, a targeted average growth rate of 4 percent per annum for the agriculture sector was proposed during the 11th Plan period. However, the growth rate has been an estimated 2.87 percent during the first four years of the Plan period (from 2007-08 to 2010-11). In order to achieve 4 percent growth rate per annum, the agriculture sector needs to grow at 8.5 percent during 2011-12. Given that this sector provides more than 58 percent (as per 2001 census) of employment in the country particularly to the rural masses, the lack of public policy support in terms of investment would pose a serious threat to the means of livelihood of millions of people across the country. Table 5.e takes a look at the status of the proposed allocations under different schemes during 11th Five Year Plan and the level of realisation.

Centre for Budget and Governance Accountability, 201136
Table 5.e: Proposed Outlay vs. Allocations in Major Schemes/Programmes in First Four Years of 11thPlan: A Reality Check
Name of the Plan Scheme / Programme
Proposed Outlay for Eleventh Plan in Rs. Crore (at Current Prices)
Expenditure during 2007-08
Allocations Made during 2008-09 (RE)
Expenditure during 2009-10
Allocations Made during 2010-11 (RE)
Allocations Made during 2011-12 (BE)
Total Budget Outlay/ Expenditure during Eleventh Five Year Plan
% of Allocation /Expenditure
National Food Security Mission
4883 396 1023 1017 1158 1250 4844 99
Integrated Scheme of Oilseeds, Pulses, Oil palm, and Maize (ISOPOM)
1500 343 397 155 258 185 1338 89
Micro Irrigation
3400 409 430 480 970 1130 3419 101
National Horticulture Mission
8809 919 1000 800 986 1200 4905 56
Agriculture Census
80 15 20 13 14 16 78 98
Macro Management of Agriculture (MMA) Scheme
5500 1001 776 921 722 650 4070 74
Rashtriya Krishi Vikas Yojana (RKVY)
25000 1249 2892 3758 6722 7811 22432 90
Integrated Watershed Management Programme (IWMP)
17372 1175 1591 1820 2458 2549 9593 55
Source: Expenditure Budget Vol-II, Various Years, Government of India; Detailed Demand For Grants, Ministry of Rural Development and Ministry of Agriculture, Appendix Eleventh Five Year Plan (2007-2012) Note: (1) Budget Figures for the year 2007-08 and 2009-10 are actuals. Figures for the year 2008-09 and 2010-11 are Revised Estimates and figures for 2011-12 are Budget Estimates.(2) Allocation for the year 2009-10, 2010-11and 2011-12 excludes allocation towards North East states and Sikkim.
The fiscal 2011-12 is the last year of the 11thPlan period. If the total allocations in the Union Budgets from 2007-08 to 2011-12 for major schemes in agriculture and land development are compared with the outlay recommended by the Planning Commission for the period (2007-08 to 2011-12), the total allocation/expenditure in the budgets is nowhere close to the Plan target.
This is the case for most of the schemes under the Ministry of Agriculture including Macro Management of Agriculture, National Horticulture Mission, Rashtriya Krishi Vikas Yojana (RKVY), and Integrated Watershed

Centre for Budget and Governance Accountability, 2011 37
Management Programme. There is a fund shortfall of 44 percent under National Horticulture Mission, 26 percent under the Macro Management of Agriculture scheme, 10 percent under RKVY and 45 percent under IWMP.
Other Proposals in the Current Budget
An allocation of Rs. 400 crore has been made in this year’s budget again in continuation of last year’s announcement of extending the Green Revolution to the eastern region. Likewise, an outlay of Rs 300 crore has been earmarked for organising pulses and oilseeds in 60,000 rain-fed villages. The Budget Speech of the Finance Minister also mentioned a few new programmes and schemes in the agriculture sector with allocations of Rs. 300 crore each. However, in the real sense, there are no new schemes and programmes since these are components of RKVY. Table 5.f micro-examines the new initiatives aimed at agricultural development.
Table 5.f: Important Announcements made in Budget Speech 2011-12 Sl. No
Continuation of Last Years Budget announcement
Schemes/Programmes (New announcements during the Budget 2011-12)
Proposed allocation (In Rs. Crore)
Coverage/Objectives Per Unit Allocation
1 Green Revolution in Eastern Region of the Country
Continue as part of RKVY 400 Assam, West Bengal, Odisha, Bihar, Jharkhand, Chhattisgarh and Eastern Uttar Pradesh
Rs. 120 per farmer household
2 Integrated development of 60,000 pulsesvillages in rainfed areas as a supplementary programme
300 60, 000 villages in rainfed areas
Rs. 50,000 per village
3
As part of Rashtriya Krishi Vikas Yojana (RKVY)
Promotion of Oil palm 300 Bring 60000 hectares under oil palm plantation, by integrating the farmers with the markets. Expected outcome is 3 lakh metric tonnes of palm oil annually in 5 years
Rs. 50,000 per hectares of land
4 Nutri-cereals 300 Increase production of millets: 10 lakh millet farmers in the arid and semi-arid regions of the country covering 25000 villages.
Rs. 1,20,000 per village/ 30,00,000 Per Compact Block
5 Accelerated Fodder Development Programme
300 25,000 villages Rs. 1,20,000 per village
6 Initiative on Vegetable Clusters
300 Near major urban centers
7 The National Mission for Protein Supplements
300 Selected BlocksTo promote livestock development, dairy farming, piggery, goat rearing and fisheries
Source: Compiled from the Budget Speech of the Finance Minister, 2011-12
Centre for Budget and Governance Accountability, 201138
Since the schemes/programmes mentioned above are already components of RKVY, there are in reality no fresh allocations as claimed by the government. The proposed allocation under RKVY during the 11th Plan was Rs. 25,000 crore and the yojana is a full-fledged State Plan Scheme entailing 100 percent assistance from the Centre. With the cumulative allocation made under these components amounting to Rs. 22,432 crore, only 90 percent of the outlay proposed for the Plan period has been met.
Further, the per unit allocations for the components are meagre and likely to have little impact. The unit costs for different components of RKVY, as announced in the budget, are also very low. For instance, the government intends to provide high-yielding varieties of seeds, technology and irrigation to farmers of the eastern region, as these are essential elements of the Green Revolution. However, the allocation per farmer household in the target region comes to approximately Rs. 120. Likewise, establishing 60,000 pulses and oilseed villages in rainfed areas, with the budget allocation of Rs. 300 crore would mean Rs. 50,000 per village, which is a very small amount even for the smallest of villages. Unless there are additional allocations for these interventions from the states, a second Green Revolution would be very difficult to accomplish.
Concluding Remarks:
Development and sustainability of agriculture in India critically depends on public investment in the sector. In the context of the spiralling food prices due to the mismatch between demand and supply of agricultural outputs, it was hoped that Union Budget 2011-12 would accord greater priority to this sector than in the past. However, the allocations under different schemes and programmes of the Ministry of Agriculture have fallen far short of expectations. No significant policy pronouncements have been made in the budget, barring the lowering of interest to 3 percent for the financial year 2011-12 and fixing higher target of rural credit at Rs. 4,75,000 crore - endeavors that would really benefit the farming community. In order to achieve inclusive and green growth for the sector, a big push investment is required at this juncture.

Centre for Budget and Governance Accountability, 2011 39
• There has been a substantial decline in total subsidy in the Union Budget from Rs. 1,64,153 crore
in 2010-11 (RE) to Rs 1,43,570 crore in 2011-12 (BE).• Given that inflation in food articles has been as high as 15.8 percent (during the week ending February
12, 2011), a substantially higher budget allocation for food subsidy was expected. However, despite the growing recognition of the need for expanding the coverage of Public Distribution System for food grains and the persistence of price rise in food articles, Food Subsidy has been pegged at Rs. 60,573 crore in 2011-12 (BE), which is less than the amount provisioned during 2010-11 (RE).
• Further, the Union Budget outlay for Petroleum Subsidy has been reduced significantly from Rs. 38,386 crore in 2010-11 (RE) to Rs. 23,640 crore in 2011-12 (BE). Given the predictions that international crude oil prices are going to rise further in the coming months, reduced subsidy in 2011-12 could result in further rise in prices of petroleum products and hence a persistence of the problem of price rise.
• Universal distribution of rice and wheat under Public Distribution System in the country calls for additional funds to the tune of Rs. 98,355 crore over and above the present provision of food subsidy.
India has one of the poorest records in the world as far as mitigating hunger and securing food forits citizens is concerned. The country ranked 67 out of 122 countries in the Global Hunger Index (GHI), 2010. Furthermore the consumption expenditure of approximately 77 percent of the total rural population is less than or equal to Rs. 20 per day. This highlights the widespread misery of the rural masses and the prevalence of malnutrition and food deprivationin the country. The severity of the situation is also reflected in the data on child malnutrition and women who are anaemic. As has been widely reported, around 50 percent children are undernourished and more than 75 percent women are anaemic in rural India. Similarly, if one looks at the country’s poverty statistics, the recent Tendulkar Committee puts the All-India figure at around 37.2 percent, i.e. 41.8 percent for rural areas and 25.7 percent for urban areas. The NC Saxena Committee reportsthat the poverty estimate for rural Indiais 50 percent.
The Union Government has made several commitments to ensure food to all its citizens. However, the Prime Minister’s Expert Committee headed by C Rangarajan ruled out the recent recommendations of the National Advisory Council (NAC) on the proposed Food Security Bill. Rejection of the proposal to distribute foodgrains to the Above Poverty Line (APL) category clearly points tothe intentions of the government to not universalise the distribution of cereals under Public Distribution System (PDS). It is worth noting here that the proposal on food security put forth by the NAC endorses near universalisation of PDS in the country. Rejection of this proposal by the expert committee and/orthe reluctance of the government to universalise the distribution of food grains in the country are based on three primary arguments. These are a) insufficiency of food grains or supply constraint; b) leakages in the system; and c) lack of adequate resources to finance the subsidy bill. However, a closerlook atthe reasons cited, negate the government’s apparent apprehension over universalizing the distribution of rice and wheatunder PDS in the country.

Centre for Budget and Governance Accountability, 201140
The argument relating to insufficient foodgrains does not hold well in the current scenario if one looks at the latest procurement trends of foodgrains. In 2008-09, the Union Government procured 22.68 million tonnes of wheat and 33.69 million tonnes of rice (probably one of the highest levels of wheat and rice procurement in the country ever) which accounted for only 23 percent of the total foodgrains production. Furthermore, if one looks at the trend of foodgrains production in the country (as per the second advance estimates released by the Ministry of Agriculture, production of foodgrains during 2010-11 is estimated at 232.07 million tonnes), one can safely conclude thatfoodgrain production is adequate for distribution under PDS, even though we are yet to be self-reliant.
The second argument relating to the issue of governance also does not seem tenable. Although there are systemic weaknesses in PDS, the response to this can only be systemic. Steps need to be taken to make the system corruption-free, efficient and accountable through better infrastructure, fixing accountability ofkey functionaries and introduction of systemic reforms to ensure that financial and institutional constraints that mar effective implementation of PDS areaddressed.
Universalising availability of foodgrains and making the requisite amount of funds available is not an impossible task for the government. In any case, financial constraints can never be an excuse for denying the basic needs of the masses, and even less so when the government is prepared to forego tax revenue (as exemptions and deductions in both direct and indirect taxes) to the extent of Rs.5,11,630 crore ina single fiscal year (2010-11). The amount required for universalisation of PDS is miniscule when compared tothe amount doled out in tax sops by the Centre.
This calls for immediate action in the form of increased public investment towards food subsidy in order to achieve food security for all. Although, there has been significant improvement in allocation towards food subsidy over the years, its share of the total expenditure as well as of the country’s GDP seems to only reflect the governments’ unwillingness to ensure food for all. Before getting into the details of the budgetary provisions for food subsidy, it is important to look at the trends of major subsidies provided in the Union Budget across various fiscal years.
Table 6.a: Subsidies given in the Union Budget since 2004-05 (In Rs. Crore)Heads of Subsidy
2004-05 2005-06 2006-07 2007-08 2008-09 2009-10 2010-11 (RE) 2011-12 (BE)
Food Subsidy 25798 23077 24014 31328 43751 58443 60600 60573
Indigenous (Urea) Subsidies
10243 10653 12650 12950 17696 17580 15080 13308
Imported (Urea) Subsidies
494 1211 3274 6606 10079 4603 6396 6983
Sale of decontrolled fertilizer with concession to farmers
5142 6596 10298 12934 48555 39081 33500 29707
Total Fertiliser Subsidy
15879 18460 26222 32490 76330 61264 54976 49998
Petroleum Subsidy
2956 2683 2699 2820 2852 14951 38386 23640

Centre for Budget and Governance Accountability, 2011 41
Grants to NAFED for MIS/PPS
120 260 560 860 375 850 250 200
Other Subsidies 1204 3042 3630 3428 6127 5843 9941 9159Import/Export of sugar, Edible Oils etc.
0 0 0 0 0 198 918 366
Interest Subsidies
564 2177 2809 2311 3493 2687 5223 6869
Other Subsidies 640 865 821 1117 2634 2958 3800 1924Total Subsidies
45957 47522 57125 70926 129708 141351 164153 143570
Total Expenditure
498252 505738 583387 712671 883956 1024487 1216576 1257729
GDP at Market Prices
3242209 3692485 4293672 4986426 5582623 6550271 7877947 8980860
Total Subsidies as proportion to GDP (%)
1.42 1.29 1.33 1.42 2.32 2.16 2.08 1.60
Total Subsidies as Proportion to Total Government Expenditure (%)
9.22 9.40 9.79 9.95 14.67 13.80 13.49 11.42
Source: Compiled from Expenditure Budget Vol. I, Union Budget, GoI.
It has been observed that in absolute terms, there has been a drastic decline in allocation towards total subsidy in the current budget compared to the allocations in the previous budget. There has been a decline in total subsidies as a proportion of the Gross Domestic Product (GDP) since 2008-09. During 2008-09, total subsidies as a share of GDP were 2.32 percent, which declined to 1.6 percent in 2011-12(BE). Similarly, total subsidies as a proportion of the total Union Budget declined to 11.42 percent in 2011-12 (BE) from 14.67 percent in 2008-09. There has been a major cutback in the totalamount of fertilizer subsidy since 2008-09. Moreover, the amount of subsidies given to manufacturers/agencies for concessional sale of decontrolled fertilisers and subsidy on indigenous fertilizers has declined.
The Finance Minister in his budget speech this year, mentioned a four pronged strategy that was adopted in the last fiscal year, covering agricultural production, reduction in wastage of produce, credit support to farmers and a thrust to the food processing units. However, in real terms no such outcomes are visible with regard to declining rates of hunger and malnutrition in the country. The allocation under food subsidy in 2011-12 budget does not show any such significant hike so as to ensure food for all. Though there has been an increase in food subsidy in absolute terms in the current budget compared to the previous year’s Budget Estimates (BE) i.e. 2010-11, food subsidy as a proportion of GDP and the total Union Budget has declined drastically since 2009-10.
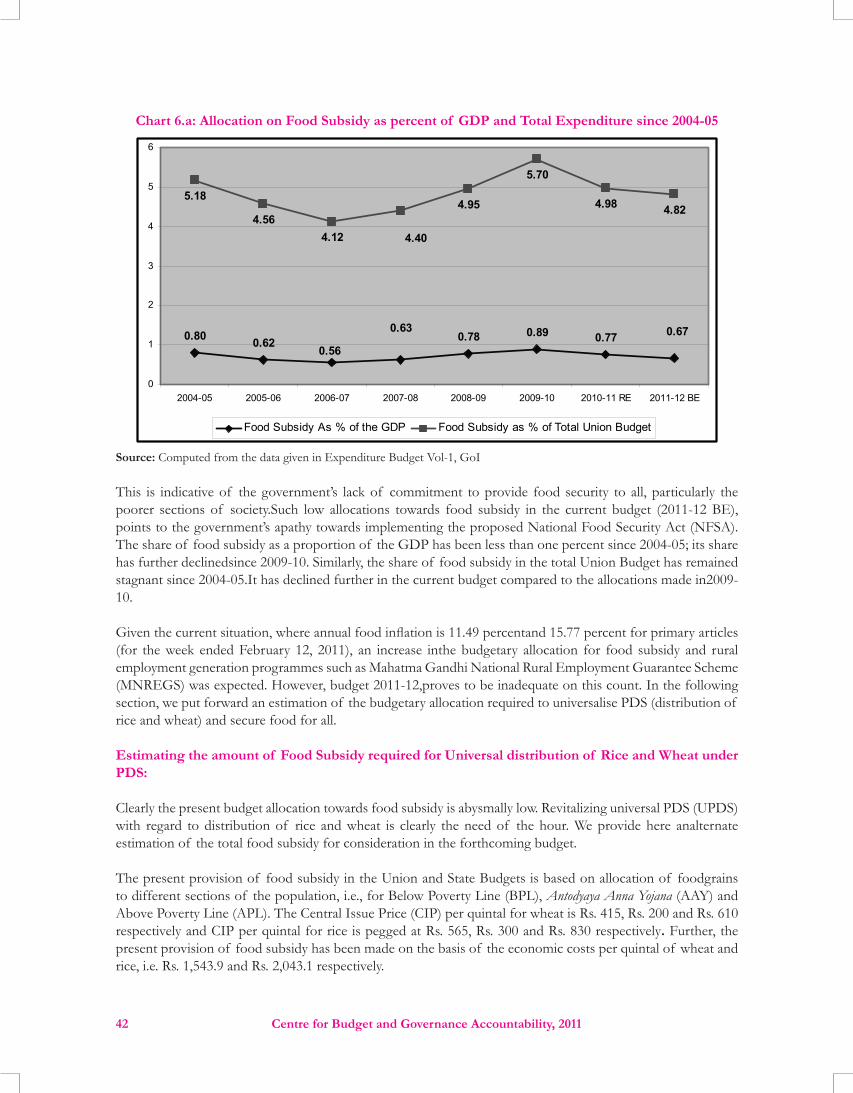
Centre for Budget and Governance Accountability, 201142
Chart 6.a: Allocation on Food Subsidy as percent of GDP and Total Expenditure since 2004-05
0.80 0.62 0.78 0.89 0.77
5.18
4.564.12
4.95
5.70
4.98 4.82
0.670.56
0.63
4.40
0
1
2
3
4
5
6
2004-05 2005-06 2006-07 2007-08 2008-09 2009-10 2010-11 RE 2011-12 BE
Food Subsidy As % of the GDP Food Subsidy as % of Total Union Budget
Source: Computed from the data given in Expenditure Budget Vol-1, GoI
This is indicative of the government’s lack of commitment to provide food security to all, particularly the poorer sections of society.Such low allocations towards food subsidy in the current budget (2011-12 BE), points to the government’s apathy towards implementing the proposed National Food Security Act (NFSA). The share of food subsidy as a proportion of the GDP has been less than one percent since 2004-05; its share has further declinedsince 2009-10. Similarly, the share of food subsidy in the total Union Budget has remained stagnant since 2004-05.It has declined further in the current budget compared to the allocations made in2009-10.
Given the current situation, where annual food inflation is 11.49 percentand 15.77 percent for primary articles (for the week ended February 12, 2011), an increase inthe budgetary allocation for food subsidy and rural employment generation programmes such as Mahatma Gandhi National Rural Employment Guarantee Scheme (MNREGS) was expected. However, budget 2011-12,proves to be inadequate on this count. In the following section, we put forward an estimation of the budgetary allocation required to universalise PDS (distribution of rice and wheat) and secure food for all.
Estimating the amount of Food Subsidy required for Universal distribution of Rice and Wheat under PDS:
Clearly the present budget allocation towards food subsidy is abysmally low. Revitalizing universal PDS (UPDS) with regard to distribution of rice and wheat is clearly the need of the hour. We provide here analternate estimation of the total food subsidy for consideration in the forthcoming budget.
The present provision of food subsidy in the Union and State Budgets is based on allocation of foodgrains to different sections of the population, i.e., for Below Poverty Line (BPL), Antodyaya Anna Yojana (AAY) and Above Poverty Line (APL). The Central Issue Price (CIP) per quintal for wheat is Rs. 415, Rs. 200 and Rs. 610 respectively and CIP per quintal for rice is pegged at Rs. 565, Rs. 300 and Rs. 830 respectively. Further, the present provision of food subsidy has been made on the basis of the economic costs per quintal of wheat and rice, i.e. Rs. 1,543.9 and Rs. 2,043.1 respectively.

Centre for Budget and Governance Accountability, 2011 43
Given that there is a shortfall with regard to the provision of food subsidy, an estimation ofthe additional requirementwas carried out based on the following assumptions:
• Total number of households at present is 23.96 crore (approx. 24 crore) based on the size of household as 4.8 (as reported in NFHS-3) with the projected population of the country at 115 crore (Registrar General of India).
• Extending the provision of distribution of rice and wheat under PDS to all households would require subsidised foodgrains at 35 kg per month per household at CIP of Rs.3 per kg.
• Minimum Support Price (MSP) as well as the Economic Cost (EC) of wheat and rice does not increase from the present levels of Rs.1, 543.9 per quintal of wheat and Rs.2, 043.1 per quintal of rice.
• Distribution of rice and wheat is in the ratio of 2:1
Based on these assumptions, the total amount of foodgrains (rice and wheat) needed for distribution through PDS would be around 100.8 million tonnes. Out of this, the amount of rice and wheat needed for distribution would be around 67.2 million tonnes and 33.6 million tonnes respectively. Of this, the total amount of food subsidy per annum would be Rs.1, 58,928 crore. At present, the provision of food subsidy accounts for Rs.60, 573 crore (2011-12BE). Therefore, an additional outlay of Rs. 98,355 crore willbe needed for universal distribution of rice and wheat under PDS.
Table 6.b: Required Amount of Food grains and Food Subsidy (per annum)Sl. No Description Units Amount
A Total amount of food grains (rice/wheat) to be distributed (per annum) at 35 kg per month per household Million tonnes 100.8
B Proposed CIP for food grains per tonne (Rs. 3 per kg X 1,000 kg) In Rs. 3,000
i Total amount of rice need to be distributed (per annum) Million tonnes 67.2
ii Total amount of wheat need to be distributed (per annum) Million tonnes 33.6
C Total amount which would be recovered through CIP (Rs. 3,000 X 100.8 million tonnes) Rs. in crore 30,240
D Economic costs per tonne of rice (Rs. 2,043X 10) In Rs. 20,430a Total economic costs for the distribution of proposed amount of rice Rs. in crore 1,37,290
E Economic costs per tonne of wheat (Rs. 1,544 X 10) In Rs. 15,440b Total economic costs for the distribution of proposed amount of wheat Rs. in crore 51,878
F Total economic cost for the distribution of food grain (rice/wheat) (F=a+b) Rs. in crore 1,89,168
G Amount of Food Subsidy required per annum (F-C) Rs. in crore 1,58,928H Present Budgetary Provision as Food Subsidy Rs. in crore 60,573
I Estimated Food subsidy required over and above the existing provision (I=G-H) Rs. in crore 98,355
Source: Computed by CBGA based on the data provided in the Economy Survey, 2010-11 and Budget Documents.
It must be remembered that this estimate applies only to the distribution of rice and wheat for all. Much more needs to be done. Firstly, it is imperative to change the norms of targeting households as is the case in PDS at present. Secondly, in addition to rice and wheat, other cereals like millets and pulses, edible and cooking oils should also be included in the ambit of PDS. Thirdly, there is a need for special provisions in the PDS for sections of the population that are affected by disaster, drought and other natural calamities.
Concluding ObservationsGiven the situation of mass deprivation and hunger in the country, the provision of food subsidy in the budgets appears quite inadequate. Hence, there is a need for increased budgetary allocation towards food subsidy in

Centre for Budget and Governance Accountability, 201144
the next budget. Not universalizing PDS and merely dividing the total number of households in the country into ‘priority’ and ‘general’ categories is simply not acceptable. Targeting the poorest of the poor instead of universalising PDS in its various forms reveals lack of commitment on the part of government to fulfill its promise of feeding the hungry.
Moreover, the allocation for food subsidy in Union Budget 2011-12 does not foretell the government’s intention to implement the promised NFSA. The government would be well advised to revert to the earlier scheme of universal PDS by implementing the promised NFSA with necessary modifications at the earliest.
The cost associated with implementation of the revised NFSA and universalising PDS must not be exaggerated citing the plea of financial constraints. Hence, an additional Rs. 98,355 crore is needed as outlays for food subsidy if the government intends to ensure universal distribution of rice and wheat under PDS in the country.
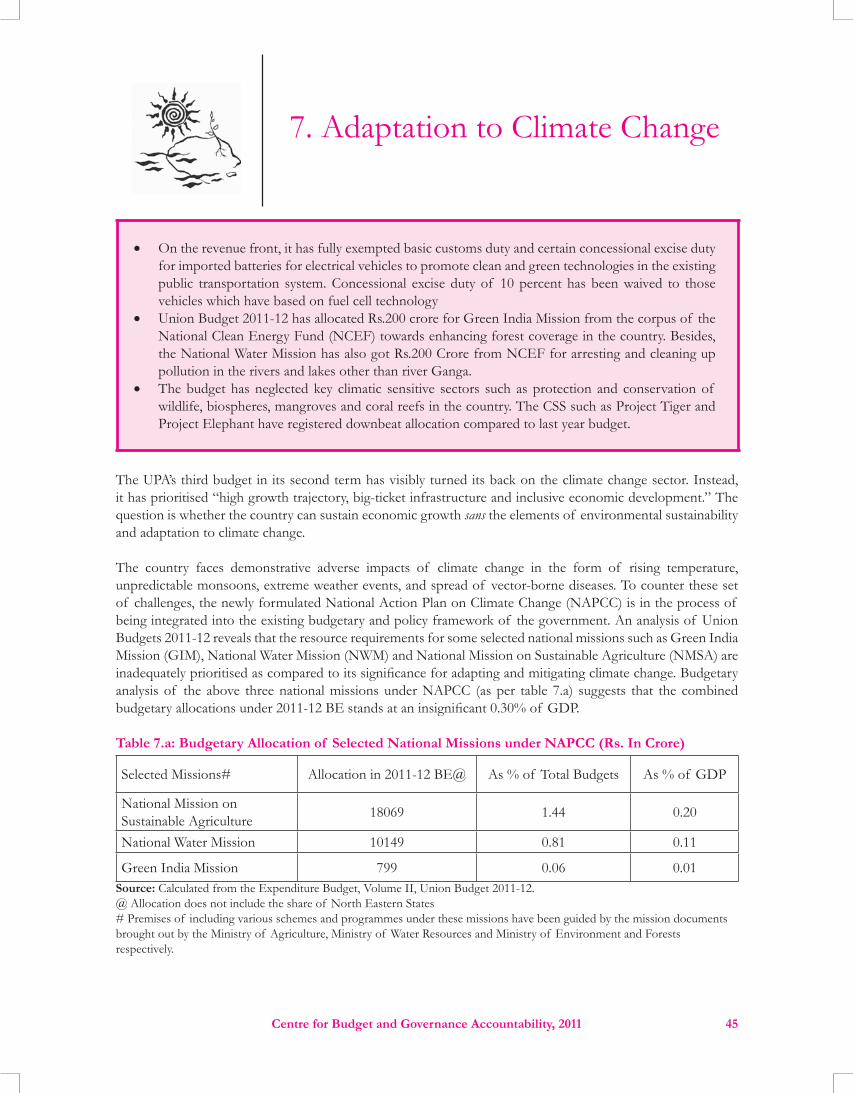
Centre for Budget and Governance Accountability, 2011 45
• On the revenue front, it has fully exempted basic customs duty and certain concessional excise duty for imported batteries for electrical vehicles to promote clean and green technologies in the existing public transportation system. Concessional excise duty of 10 percent has been waived to those vehicles which have based on fuel cell technology
• Union Budget 2011-12 has allocated Rs.200 crore for Green India Mission from the corpus of the National Clean Energy Fund (NCEF) towards enhancing forest coverage in the country. Besides, the National Water Mission has also got Rs.200 Crore from NCEF for arresting and cleaning up pollution in the rivers and lakes other than river Ganga.
• The budget has neglected key climatic sensitive sectors such as protection and conservation of wildlife, biospheres, mangroves and coral reefs in the country. The CSS such as Project Tiger and Project Elephant have registered downbeat allocation compared to last year budget.
The UPA’s third budget in its second term has visibly turned its back on the climate change sector. Instead, it has prioritised “high growth trajectory, big-ticket infrastructure and inclusive economic development.” The question is whether the country can sustain economic growth sans the elements of environmental sustainability and adaptation to climate change.
The country faces demonstrative adverse impacts of climate change in the form of rising temperature, unpredictable monsoons, extreme weather events, and spread of vector-borne diseases. To counter these set of challenges, the newly formulated National Action Plan on Climate Change (NAPCC) is in the process of being integrated into the existing budgetary and policy framework of the government. An analysis of Union Budgets 2011-12 reveals that the resource requirements for some selected national missions such as Green India Mission (GIM), National Water Mission (NWM) and National Mission on Sustainable Agriculture (NMSA) are inadequately prioritised as compared to its significance for adapting and mitigating climate change. Budgetary analysis of the above three national missions under NAPCC (as per table 7.a) suggests that the combined budgetary allocations under 2011-12 BE stands at an insignificant 0.30% of GDP.
Table 7.a: Budgetary Allocation of Selected National Missions under NAPCC (Rs. In Crore)
Selected Missions# Allocation in 2011-12 BE@ As % of Total Budgets As % of GDP
National Mission on Sustainable Agriculture 18069 1.44 0.20
National Water Mission 10149 0.81 0.11
Green India Mission 799 0.06 0.01Source: Calculated from the Expenditure Budget, Volume II, Union Budget 2011-12.@ Allocation does not include the share of North Eastern States# Premises of including various schemes and programmes under these missions have been guided by the mission documents brought out by the Ministry of Agriculture, Ministry of Water Resources and Ministry of Environment and Forests respectively.

Centre for Budget and Governance Accountability, 201146
The priorities under NMSA constitute: enhancing rainfed agriculture, managing risk due to failures of agriculture during pre-harvest and post harvest session, accessibilities of information for farmers for agro-climatic sharing and dissemination, and enabling farmer community to invest in and adapt relevant technologies to overcome climate related stress. The sectoral budgetary analysis pertaining to National Mission on Sustainable Agriculture reveals that except certain big-ticket programmes like NFSM and RKVY, many significant schemes have not been duly prioritized. The allocations for programmes relating to soil health such as the National Project on Management of Soil and Health Facility, National Project on Organic Farming, Integrated Pest Management Programmes have not received adequate allocation compared to last year’s budget. Besides the National Agriculture Insurance Scheme, the other two budgetary heads such as Weather based Crop Insurance and the Grant to NAFED under MIS/PSS have either stagnated or registered fewer allocations. The allied agriculture sector like cattle development, marine and inland fisheries however been given high priority in Union Budget 2011-12.
The present budget has exposed the government’s apathy towards protection and conservation of wildlife, forests and bio-diversity. The nodal ministry for the implementation of Green India Mission continues to be poorly prioritized in this year’s budget. Crucial sectors such as forestry, wildlife and ecology have registered no growth compared to last year’s budget. Crucial schemes like National Afforestation Programme (NAP), Integrated Forest Protection Scheme (currently known as Intensification of Forest Management), Biosphere Reserve Conservation Programme, Mangroves Eco-systems and Wetlands Conservation Programme, Natural Resources Management Programme, and Biodiversity Conservation Programme have not received adequate allocation. Less priority signifies less government intervention in ecological restoration and eco-developmental activities in the country. Such insignificant allocation will hamper efforts to strengthen species conservation, creating basic infrastructure for management, habitat development, augmenting water resources, compensatory ameliorative measures for habitat restoration, eco-development, village relocation, use of technology for monitoring and evaluation. Besides, it will fail to secure people’s participation in planning and regeneration efforts to ensure sustainability and equitable distribution of forest products from the regenerated lands and in promoting partnerships in the management and administration of forests and common property resources. There is also evidence that many programmes in the 11th Plan period have not received due prioritization (Table 7.b).
Table 7.b: Proposed Outlays and Actual Outlays made for Selected Centrally Sector Schemes (CSS) under the 11th Five Year Plan
Name of the Plan Scheme / Programme
Proposed Outlay for Eleventh Plan Rs. in crore (at Current Prices)
Annual Budgetary Allocation in the 11th Five Year Plan Period Total Budget
Outlay Made in 11th Five Year Plan
% of Allocation in the 11th Five Year
Plan
2007-08 (RE)
2008-09 (RE)
2009-10 (RE)
2010-11 (RE)
2011-12 (BE)
Integrated Forest Protection Scheme
600.00 48.15 55.7 47.2 44.20 44.20 239.00 40%
National Afforestation Programme
2000.00 337.95 290.62 253.17 234.50 228.00 1344.00 57%
Panchayat Van Yojana(Social Forestry with communities)
900.00 0.01 0 0 0 0 0.01 00
Source of basic data: Expenditure Budget Vol. II (various years), GoI.
Conservation of water resources are critical areas of policy intervention in the wake of climate change. Major identified implications of climate change on water resources are significant in the context of rapid decline of glaciers and the snowfields in the Himalayan regions which may cause increased flood events in the short

Centre for Budget and Governance Accountability, 2011 47
term to drought-like situations in the long run. This requires comprehensive water budgeting for the country. The budget 2011-12 has allocated Rs 10149 crore for the National Water Mission which is 0.81 percent of the total budgetary expenditure and 0.11 percent of GDP. The sectoral allocation for most of the important programmes such as the Ground Water Management and Regulation, the National River Conservation Plan, major and medium irrigations, and Flood Control have increased considerably. So also is the case of operational aspect of providing safe drinking water to rural areas in which the flagship scheme, ARWSP, has registered significant allocation in this year’s budget. However, the programme like Common Effluent Treatment Plants (CTEPs), which treats sewage water, have not received adequate attention in this year’s budget.
Concluding Remarks:
NAPCC constitutes the core policy framework for adapting and mitigating climate change. While this year’s budget has some marked policy departure with regard to prioritising selected national missions while allocating resources, its early prioritisation in the planning and budgetary framework would be crucial in bringing up the agenda of climate change in terms of inclusive growth and sustainable development.

Centre for Budget and Governance Accountability, 201148
• With the stated objective of empowering women and promoting their Self Help Groups (SHGs), the Union Government has proposed the creation of a “Women’s SHGs’ Development Fund” with a corpus of Rs. 500 crore.
• Allocations for some of the women-specific schemes have been increased in this Budget, which include RCH Flexible Pool, Rural Family Welfare Services, Girls Hostels in Secondary and Higher Secondary Schools, Rashtriya Mahila Kosh, Relief and Rehabilitation of Rape Victims and Indira Gandhi Matritva Sahayog Yojana.
• The budget allocation for the Ministry of Women and Child Development has been increased from Rs. 11070.5 crore in 2010-11 (Budget Estimates) to Rs. 12733 crore in 2011-12 (Budget Estimates), an increase of 15 percent at current prices.
• In ICDS, the long overdue demand of increasing the remuneration of Anganwadi Workers and Anganwadi Helpers has been recognized in this Budget, with the monthly remuneration being doubled from Rs. 1500 to Rs. 3000 for Anganwadi Workers and from Rs. 750 to Rs. 1500 for Anganwadi Helpers. However, what raises a concern is that the Union Budget outlay for ICDS shows a relatively inadequate increase from Rs. 9370 crore in 2010-11 (Revised Estimates) to Rs. 10330 crore in 2011-12 (Budget Estimates).
• Allocations for some of the important women-specific schemes such as National Scheme for Incentive to the Girl Child for Secondary Education, Hostels for Working Women, Support to Training and Employment Programme, Swayamsidha Phase-II, Swadhar, Priyadarshini,, and Rajiv Gandhi Scheme for Empowerment of Adolescent Girls (SABLA) have been reduced in 2011-12 (BE) as compared to 2010-11 (BE).
• The coverage of the “Gender Budgeting Statement”, in terms of the number of Union Government ministries/departments reporting in this Statement, has remained stagnant at 33 since 2007-08.
• The total magnitude of the Gender Budget has increased marginally from 6.1 percent (2010-11 BE) to 6.2 percent this year.
• The methodology of preparation of the “Gender Budgeting Statement” too appears to have had no further deepening since 2007-08.
The Finance Minister has given many women’s groups some reason to cheer by announcing an increase in the monthly remuneration of the frontline service providers of the Integrated Child Development Scheme (ICDS). The remuneration for Anganwadi Workers (AWW) has been increased from Rs. 1500 to Rs. 3000, and for Anganwadi Helpers (AWHs) has been increased from Rs. 750 to Rs. 1500. This is slated to benefit more than 22 lakh workers and helpers across the country.
Apart from this, however, the Union Budget does not offer any more reasons to rejoice. Apart from AWWs and AWHs, no such benefits have been extended to other cadres of women service providers such as Accredited Social Health Activists (ASHAs) under the National Rural Health Mission and Mid-day Meal Cooks and Helpers under the Mid Day Meal Scheme, who continue to be grossly underpaid.

Centre for Budget and Governance Accountability, 2011 49
The Gender Budgeting exercise, adopted by the Union Government of India, has resulted in the preparation of a Gender Budgeting Statement every year since 2005-06. This exercise requires all Union ministries/departments to segregate those schemes from all development schemes, in which at least 30 percent of the funds or benefits are earmarked for women and girls. The schemes with 100 percent funds meant for women and girls are reported in Part A of the Gender Budgeting Statement, while the remaining schemes (i.e. those with at least 30 percent funds, but not the entire amount of funds, earmarked for women and girls) are reported in Part B of the Statement. In both the Parts of this Statement, the magnitudes of funds earmarked for women are also reported along with the respective schemes.
However, many issues remain with regard to the Gender Budgeting Statement.
Scope of Gender Budgeting Statement
The Gender Budgeting Statement (GBS) witnessed some improvements in the initial years after its introduction in 2005-06. These included improvements in the methodology as well as extension of this exercise beyond the so-called ‘women related sectors’ to include ministries/departments such as Biotechnology, Information Technology, Telecommunications, Police, and Micro, Small and Medium Enterprises.
Since the last four years, however, the exercise seems to have hit a roadblock. The coverage of the GB Statement has remained stagnant at 33 Demands for Grants for the fifth year in a row. Several ministries/departments dealing with critical sectors such as, Drinking Water and Sanitation, Urban Development, Information and Broadcasting, Law and Justice, Road Transport and Highways and Industrial Policy and Promotion do not yet have any intervention worth being reported in the GB Statement, while ministries/departments of Food and Public Distribution and Labour and Employment are reporting very small magnitudes of funds in the GB Statement. This is indicative of a larger problem which mars the process of Gender Budgeting — i.e. the failure to recognise that government interventions in almost all sectors have a bearing on women’s gender-based disadvantages, both the ‘divisible’ sectors in which the government interventions are beneficiary-oriented as well as the so-called ‘indivisible’ sectors in which the government cannot count the individual beneficiaries of its programmes/schemes.
Table 8.a: Summary of Allocations for Women as Presented in the GBS No. of
Demands*Total Allocations under
Part A of the Statement**Total Allocations under
Part B of the Statement***Total magnitude of
Gender Budget
2007-08 33 Rs. 8,428.66 crore (RE) Rs. 13,919.43 crore (RE) Rs. 22,348.09 crore (RE)(3.3%)
2008-09 33 Rs. 14,875.15 crore (RE) Rs. 34,748.20 crore (RE) Rs. 49,623.35 crore (RE)(5.5%)
2009-10 33 Rs. 15,480.85 crore (RE) Rs. 40,813.27 crore (RE) Rs. 56,294.22 crore (RE)(5.5%)
2010-11 33 Rs. 18473. 30 crore (RE) Rs. 48601.38 crore (RE) Rs. 67074.68 crore (RE)(5.5%)
2011-12 33 Rs. 20548.53 crore (BE) Rs. 57702.67 crore (BE) Rs. 78251.02 crore (BE)(6.2%)
Notes: *Those that report in the Gender Budgeting Statement.** Part A presents women specific provisions where 100% provisions are for women. ***Part B presents women specific provisions under schemes with at least 30% provisions for women. **** Proportion of total Union Government Expenditure, shown in brackets. Source: Gender Budgeting Statement, Expenditure Budget Vol. I, Union Budget - various years
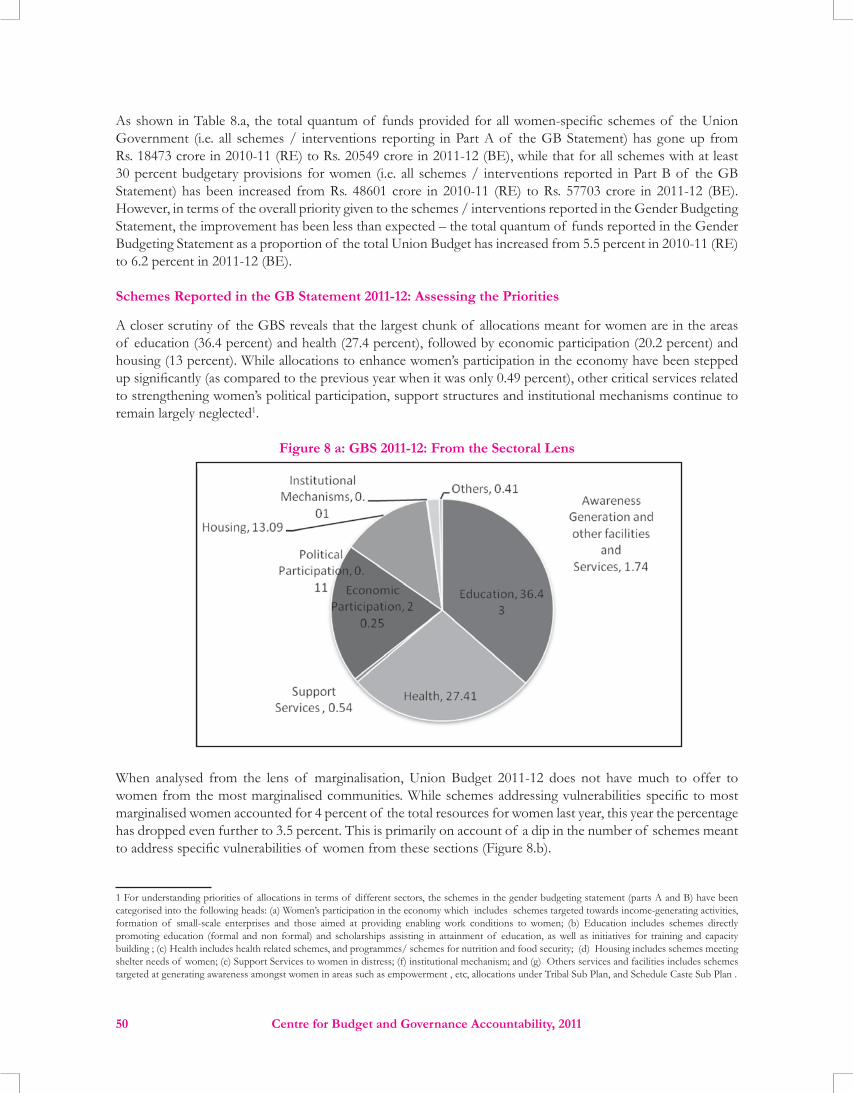
Centre for Budget and Governance Accountability, 201150
As shown in Table 8.a, the total quantum of funds provided for all women-specific schemes of the Union Government (i.e. all schemes / interventions reporting in Part A of the GB Statement) has gone up from Rs. 18473 crore in 2010-11 (RE) to Rs. 20549 crore in 2011-12 (BE), while that for all schemes with at least 30 percent budgetary provisions for women (i.e. all schemes / interventions reported in Part B of the GB Statement) has been increased from Rs. 48601 crore in 2010-11 (RE) to Rs. 57703 crore in 2011-12 (BE). However, in terms of the overall priority given to the schemes / interventions reported in the Gender Budgeting Statement, the improvement has been less than expected – the total quantum of funds reported in the Gender Budgeting Statement as a proportion of the total Union Budget has increased from 5.5 percent in 2010-11 (RE) to 6.2 percent in 2011-12 (BE).
Schemes Reported in the GB Statement 2011-12: Assessing the Priorities
A closer scrutiny of the GBS reveals that the largest chunk of allocations meant for women are in the areas of education (36.4 percent) and health (27.4 percent), followed by economic participation (20.2 percent) and housing (13 percent). While allocations to enhance women’s participation in the economy have been stepped up significantly (as compared to the previous year when it was only 0.49 percent), other critical services related to strengthening women’s political participation, support structures and institutional mechanisms continue to remain largely neglected1.
Figure 8 a: GBS 2011-12: From the Sectoral Lens
When analysed from the lens of marginalisation, Union Budget 2011-12 does not have much to offer to women from the most marginalised communities. While schemes addressing vulnerabilities specific to most marginalised women accounted for 4 percent of the total resources for women last year, this year the percentage has dropped even further to 3.5 percent. This is primarily on account of a dip in the number of schemes meant to address specific vulnerabilities of women from these sections (Figure 8.b).
1 For understanding priorities of allocations in terms of different sectors, the schemes in the gender budgeting statement (parts A and B) have been categorised into the following heads: (a) Women’s participation in the economy which includes schemes targeted towards income-generating activities, formation of small-scale enterprises and those aimed at providing enabling work conditions to women; (b) Education includes schemes directly promoting education (formal and non formal) and scholarships assisting in attainment of education, as well as initiatives for training and capacity building ; (c) Health includes health related schemes, and programmes/ schemes for nutrition and food security; (d) Housing includes schemes meeting shelter needs of women; (e) Support Services to women in distress; (f) institutional mechanism; and (g) Others services and facilities includes schemes targeted at generating awareness amongst women in areas such as empowerment , etc, allocations under Tribal Sub Plan, and Schedule Caste Sub Plan .

Centre for Budget and Governance Accountability, 2011 51
Figure 8 b: GBS 2011-12: From the Lens of the Most Marginalised Women
Quality of Information Reported in the Gender Budgeting Statement
The methodology of preparation of the Gender Budgeting Statement appears to have had no further deepening since 2007-08. The assumptions behind reporting allocations in Part B of the GB Statement remain questionable for several ministries/departments. For instance, for most of the schemes of Ministry of Minority Affairs, Ministry of Earth Sciences and Ministry of Labour and Employment, which are reporting in Part B of the GB Statement, 100 percent allocations for the schemes have been reported. The problem of incorrect reporting persists even in Part A of the Statement. For instance, Indira Awas Yojana continues to figure in Part A, despite the fact that the entire allocations for the scheme are not earmarked exclusively for women.
More importantly, it appears from the Budget Circular for 2011-12 issued by the Union Finance Ministry last year (September 2010) that the GB Statement is being developed as an ex-post exercise after the departmental budgets have been finalized. In other words, the various ministries/departments might be first finalizing their budgets for the next fiscal year without paying attention to the process of Gender Budgeting; and they are culling out the figures pertaining to budgetary provisions for women for reporting in the GB Statement subsequently. What this implies is: the Gender Budgeting exercise being carried out in the Union Government is not really affecting the process of formulation of its budget; it is only generating information on allocations earmarked for women (or perceived to be benefitting women) after the budgets of all ministries/departments have been formulated.
Need to Assess the Gender Responsiveness of All Major Schemes
Although many of the Union Government schemes are being reported in the Gender Budgeting Statement, few of them seem to have been designed taking into account the gender-based disadvantages of women in our country. Hence, there is a need to make the objectives, operational guidelines, financial norms and unit costs of the existing schemes across various ministries/departments more gender responsive.
Need to Introduce Gender Responsive Schemes in the ‘Indivisible’ Sectors
No major schemes/interventions have been announced by the Finance Minister this year barring the proposal to create a Women’s SHG Development Fund to promote women’s Self Help Groups (SHGs); an initial allocation of Rs. 500 crore has been made to this effect.
Many of the sectors covered by various ministries/departments of the Union Government, such as Agriculture, Commerce and Industry, Communications and Information Technology, Power, Road Transport and Highways, and Environment and Forests etc. are claimed (by some of our policymakers) to be ‘indivisible’. What this
Centre for Budget and Governance Accountability, 201152
means is – in these sectors, the government cannot count the beneficiaries of its programmes / schemes; hence, it is difficult for some of the ministries departments to report the funds or benefits earmarked for women beneficiaries in their programmes / schemes. We must note here that, in case of each of these ‘indivisible’ sectors, it is imperative to formulate new interventions focusing on women. In fact, Kerala has already started taking such initiatives under Gender Budgeting since more than a year now.
Review of Schemes for Women Introduced in Last Year’s Union Budget
Last year, the Finance Minister in his budget speech announced some major schemes/programmes for women. This included a special scheme for women engaged in agriculture titled Mahila Kisan Sashaktikaran Pariyojana (MKSP) as part of the National Rural Livelihood Mission. An initial allocation of Rs. 100 crore was also made. This was an extremely significant step since it recognized the centrality of women in the agricultural sector. It must be highlighted that this year’s GBS makes no mention of it, raising serious doubts about the government’s commitment to implement the same. All that is known about this scheme is that the Ministry of Rural Development has issued guidelines for its implementation as recently as in January 2011.
Another programme that was launched with much fanfare was the National Mission for Empowerment of Women with an allocation of Rs. 40 crore. Similar to MKSP, the initial excitement over the National Mission seems to have withered with no significant follow up reported on the ground. As per the Summary of Expenditure released by the Ministry of Women and Child Development, no money has so far been spent. The allocation this year remains unchanged.
Another critical scheme, Indira Gandhi Matritva Sahayog Yojana presents a similar picture. Apart from zero utilisation as shown in table 8.b, the scheme itself has elicited severe criticism for imposing conditionalities on beneficiaries such as registration in Anganwadi centres that need to be fulfilled in order to derive these benefits. Furthermore as noted by many health activists, the scheme neglects the crucial first three months of pregnancy, and stresses on attitudinal and behavioural change of women leading suggestive of what a prominent health activist labels “infantilisation of the target population”.
Rajiv Gandhi Scheme for Empowerment of Adolescent Girls too was introduced last year with the objective of empowering adolescent girls in the age group 11-18 years by bringing improvement in their nutritional and health status and upgrading various life skills. The scheme is currently being implemented through ICDS centres in 200 selected districts across the country on a pilot basis. As per the Summary of Expenditure released by the Ministry of Women and Child Development, against an allocation of Rs. 1000 crore in 2010-11, actual expenditure incurred till January 15, 2011 is 124 crore which is a mere 12.4 percent of the total allocated amount.
Assessment of Expenditure of Major Schemes Meant for Women
Not only the new interventions, but even some of the ongoing schemes have not been effectively implemented. For instance, as table 8 b shows, Rashtriya Mahila Kosh – the nodal agency for SHGs in India has not registered any expenditure in the last financial year. After substantially reducing the allocation for Swayamsiddha from Rs 180 crore in 2008-09 (BE) to Rs 20 crore in 2009-10 (BE) and further down to Rs 5 crore (BE) last year, the government failed to incur any expenditure till January 2011, thereby completely failing to kick start the second phase of the project.

Centre for Budget and Governance Accountability, 2011 53
Table 8 b: Expenditure of Major Schemes Meant for WomenScheme 2010-11 BE (in Rs.
Crore)Actual Expenditure Upto 15/1/2011 in Rs. Crore)
Percentage of Expenditure over
BEConditional Cash Transfer Scheme for the Girl Child with Insurance Cover
10 1.46 14.5
Hostels for Working Women 15 5.8 38.67STEP 25 10.79 43.15Rashtriya Mahila Kosh 15 0 0Swayamsiddha 5 0 0Scheme for Rescue Victims of Trafficking
10 5.26 52.5
Gender Budgeting 2 .33 16.38Swadhar 34.2 24.62 69.04Relief to and rehabilitation of Rape Victims
40 0 0
Priyadarshini 29.79 5.88 19.73Conditional Maternity Benefit Scheme
390 0 0
Source: Summary Statement of Expenditure, Ministry of Women and Child Development. Available at www.wcd.nic.in
The story of underutilisation continues when we look at the schemes meant for women from the most marginalised communities. As shown in Figure 8.b, of the total allocations meant for women, only 3.5 percent is targeted specifically at women from these sections of the population such as minorities, SCs, STs and the Disabled. This is primarily on account of the sparse number of schemes designed for addressing their specific vulnerabilities. Furthermore, a closer scrutiny of the allocation reveals that in three out of four schemes (as shown in table 8c) perhaps even the first steps towards implementation have not been taken.
Table 8 c: Schemes aimed at the Most Marginalised Women Ministry/
DepartmentScheme 2007-08 2008-09 2009-10 2010-11
BE Actual BE Actual BE RE BEMinority Affairs Scheme for Leadership
Development of Minority Women*
0 0.2 5 0 8 8 15
Tribal Affairs Strengthening of Education among ST girls in Low literacy Districts (Educational Complex in Low Literacy Districts)
0 0 0 0 50 33.5 40
Social Justice & Empowerment
Girls Hostel for SCs 32 27 55 5.9 60 60 80
Social Justice & Empowerment
Financial Assistance to Women with Disabilities to look after their children after birth
0 0 5 0 5 5
Notes: *Earlier with Ministry of Women and Child DevelopmentSource: Detailed Demand for Grants, various years, Government of India, Mid Term Appraisal of the 11th Five Year Plan

Centre for Budget and Governance Accountability, 201154
Unfulfilled Promises
Apart from low allocations for critical interventions, the Mid Term Appraisal of the 11th Five Year Plan reveals that many promises made at the beginning of the Plan period remain unfulfilled. These include a comprehensive scheme on single women, a national task force for women in conflict areas, scheme for internally displaced women and a High Level Committee to review SHG policies and programmes. In addition, there has been no allocation for implementation of Protection of Women from Domestic Violence Act which was introduced five years back.
Table 8.d: 11th Five Year Plan Recommended Outlays vis-à-vis Union Budget AllocationsName of the Plan Scheme / Programme
Proposed Outlay for
Eleventh Plan in Rs. Crore (at Current
Prices)
Allocations (in Rs. Crore) Total Budget Outlay
Made in the five years
% ofAllocation
Against proposed
Outlay
2007-08 (RE)
2008-09 (RE)
2009-10 (RE)
2010-11 (RE)
2011-12 (BE)
Swayamsidha 500 25 50.08 .05 0 3 78.13 15.6Rashtriya Mahila Kosh 108 12 31 16 0 100 159 147.2Gender Budgeting 20 1 1.3 .05 1 1 4.35 21.8Conditional Cash Transfer for girl child with insurance cover
80 0 10 5 10 10 35 43.8
Comprehensive scheme for combating trafficking of women and children (Ujjwala)
30 5 6 5 7 10 33 110
Support to Training and Employment Programme for Women (STEP)
100 20 27 15 25 20 107 107
Hostels for Working Women 75 5 11 10 15 10 51 68
Priyadarshini 95 10 23 1.22 29.79 26.1 90.11 94.9Swadhar 108 15 15 15 34.2 30 109.2 101Relief and Rehabilitation of Rape Victims
25 1 5 .01 10 140 156.01 624
Rajiv Gandhi National Crèche Scheme
550 100 50.94 50.3 35 42.5 278.74 50.7
Source: Expenditure Budget Volume II, Various Years, Government of India; Detailed Demand for Grants, Ministry of Rural Development and Ministry of Agriculture, Appendix Eleventh Five Year Plan (2007-2012)
It is also imperative to compare the funds allocated from 2007-08 to 2011-12 vis-à-vis the outlay proposed in the 11th Five Year Plan since the year 2011-12 marks the end of the Plan period. The comparison reveals that the proportion of funds allocated vs. the amount proposed for the 11th Plan period is less than 50 percent in

Centre for Budget and Governance Accountability, 2011 55
case of Gender Budgeting and Conditional Cash Transfer for girl child with insurance cover. This proportion is lowest for Swayamsiddha (15 percent) which was supposed to be the main vehicle for women’s empowerment in the 11th Plan.
Concluding Remarks:
As reflected through various outcome indicators, the situation of women and girls in our country remains dismal. It goes without saying that the budget can play an extremely critical role in improving the quality of life of millions of women. For this, not only do we need higher allocations based on a deeper understanding of gender differentials across sectors, but a stronger commitment to implement these programmes and schemes so that allocations eventually lead to better outcomes.

Centre for Budget and Governance Accountability, 201156
• Union Government’s total allocation earmarked for children has registered a small increase from 4.1 percent of the total Union Budget in 2010-11 (RE) to 4.5 percent of the Budget in 2011-12 (BE).
• In the ‘Child Budget’ (i.e. the total allocation for all child-specific schemes)which stands at Rs. 56,748.6 crore in 2011-12 (BE), the share of Child Education is 76.4 percent, the share of Child Development 18.6 percent, interventions in Child Health account for 3.6 percent and those pertaining to Child Protection account for 1.33 percent.
• The increase in the share of interventions pertaining to Child Protection in the total ‘Child Budget’ from 0.60 percent in 2010-11 (RE) to 1.33 percent in 2011-12 (BE) is a welcome development. This is based on a noticeable hike in the allocation for National Child Labour Project from Rs. 108.5 crore in 2010-11 (RE) to Rs. 373 crore in 2011-12 (BE).
• Allocation for the Integrated Child Protection Scheme witnesses a sharp cut from Rs. 300 crore in 2010-11 (BE) to Rs. 100 crore in 2010-11 (RE), which reflects the delay in actual implementation of this important intervention in the current fiscal. It has got an allocation of Rs. 270 crore for the next fiscal.
• In Integrated Child Development Services (ICDS), the long overdue demand of increasing the remuneration of Anganwadi Workers and Anganwadi Helpers has been recognized in this Budget, with the monthly remuneration being doubled from Rs. 1500 to Rs. 3000 for Anganwadi Workers and from Rs. 750 to Rs. 1,500 for Anganwadi Helpers. However, what raises a concern here is that Union Budget outlay for ICDS shows a comparatively much smaller increase from Rs. 9,370 crore in 2010-11 (RE) to Rs. 10,330 crore in 2011-12 (BE).
• While the Union Budget outlay for Sarva Shiksha Abhiyan has been increased from Rs. 15000 crore in 2010-11 (BE) to Rs. 21,000 crore in 2011-12 (BE), the scheme can hardly succeed in operationalising Right to Education Act with this magnitude of funds.
One of the major development paradoxes in India is the persistence of acute deficits in development of children amidst high levels of economic growth achieved over the last decade. Over the years, although India has succeeded in improving a few of the child development indicators, attainment of the 11th Five Year Plan targets and the Millennium Development Goals remains a distant dream. India’s performance on these counts remains poor compared not only to developed countries but also many developing countries. Moreover, huge disparities exist across states within the country. Like the high levels of Infant Mortality Rate (IMR) in the country, several outcome indicators for children can be cited to highlight the urgent need to prioritise the rights of children in the development process of the country. In this context, it is pertinent to ask: how responsive is the Union Budget 2011-12 to the rights of children? To assess the magnitude of ‘Child Budget’ (i.e. the total allocation for all child-specific schemes) within the Union Budget, we refer to Statement 22 (BUDGET PROVISIONS FOR SCHEMES FOR THE WELFARE OF CHILDREN) in Expenditure Budget Vol. I of the Union Budget 2011-12. This Statement was introduced by the Union Government in the Budget for 2008-09, and has been continued since in every Union Budget. This Statement reflects “provisions for expenditure on schemes that are meant substantially for the welfare of children”.

Centre for Budget and Governance Accountability, 2011 57
Magnitude of ‘Child Budget’ in Union Budget 2011-12
The magnitude of ‘Child Budget’ (i.e. the aggregate outlay for child specific schemes) stands at Rs. 56748.6 crore in 2011-12 (BE). The ‘Child Budget’ as a proportion of total budget outlay by the Union Government shows a small increase from 4.1 percent in 2010-11 (RE) to 4.5 percent in 2011-12 (BE).
Figure 9.a: Outlays for Child Specific Schemes as a Proportion of Union Budget (in %)
Outlays for Child Specific Schemes as a Proportion of Union Budget (in %)
4.0 3.9 3.74.1
4.5
0.0
0.5
1.0
1.5
2.0
2.5
3.0
3.5
4.0
4.5
5.0
2007-08 RE 2008-09 RE 2009-10 RE 2010-11 RE 2011-12 BE
Year
Per
cent
age
( %)
Child Budget as % of TotalUnion Budget
Source: Compiled by CBGA from Expenditure Budget Vol. I, Union Budget, GoI, various years.
As regards the question of adequacy of this level of priority accorded to children in the Budget, we need to remember that children (i.e. all persons up to the age of 18 years) constitute more than 40 percent of the country’s population. Also, the persistence of acute deficits in development of children in our country calls for a significant expansion of the coverage as well as strengthening of all government interventions focused on children. Most of the interventions by the Union Government, which are usually in the nature of Plan schemes, are rooted in an approach that promotes low cost ad hoc provisioning for children. All these child-focused programmes and schemes of the Union Government need to be redesigned fundamentally so as to promote entitlements for children and enable them to achieve their potential. Such a reorientation of the child focused interventions of the Union Government would certainly require a much higher magnitude of funds than what is being allocated currently.
Sector-wise Prioritisation of the ‘Child Budget’
Taking into account the different needs of children, all child focused programmes and schemes of the Union Government can be categorised into four sectors, viz.• Child Development (interventions for early childhood care and nutrition);• Child Health (interventions for child survival and health);• Child Education (education related interventions up to secondary level); and • Child Protection (i.e. government interventions for protection of children in various kinds of difficult
circumstances).

Centre for Budget and Governance Accountability, 201158
Figure 9.b: Sector-wise Composition of the Total Outlay for Children
The sector-wise prioritisation of the ‘Child Budget’ continues to be skewed against Child Health and Child Protection. Out of the total resources earmarked for children in Union Budget 2011-12 (BE):• 76.4 percent is meant for Child Education (which includes funds for SSA, Mid Day Meal, Rashtriya
Madhyamik Shiksha Abhiyan, Kendriya Vidyalays, Navodaya Vidyalayas etc.) • 18.6 percent for Child Development (which includes funds for schemes like ICDS, National Crèche Scheme
etc.)• only 3.6 percent for Child Health (which includes funds for schemes like Immunization Programmes, RCH
programme, Children’s Hospital etc.)• and just 1.3 percent is meant for Child Protection (which includes funds for National Child Labour Project
and Integrated Child Protection Scheme, among others).
The increase in the share of interventions pertaining to Child Protection in the total ‘Child Budget’ from 0.60 percent in 2010-11 (RE) to 1.33 percent in 2011-12 (BE) is a welcome development. This increase is primarily due toa noticeable hike in the allocation for National Child Labour Project from Rs. 108.5 crore in 2010-11 (RE) to Rs. 373 crore in 2011-12 (BE). Allocation for the Integrated Child Protection Scheme witnesses a sharp cut from Rs. 300 crore in 2010-11 (BE) to Rs. 100 crore in 2010-11 (RE), which reflects the delay in actual implementation of this important intervention in the current fiscal. It has got an allocation of Rs. 270 crore for the next fiscal.
In Integrated Child Development Services (ICDS), the long overdue demand of increasing the remuneration of Anganwadi Workers and Anganwadi Helpers has been recognized in this Budget, with the monthly remuneration being doubled from Rs. 1500 to Rs. 3,000 for Anganwadi Workers and from Rs. 750 to Rs. 1,500 for Anganwadi Helpers. However, what raises a concern here is that Union Budget outlay for ICDS shows a comparatively much smaller increase from Rs. 9,370 crore in 2010-11 (RE) to Rs. 10,330 crore in 2011-12 (BE).

Centre for Budget and Governance Accountability, 2011 59
While the Union Budget outlay for Sarva Shiksha Abhiyan has been increased from Rs. 15,000 crore in 2010-11 (BE) to Rs. 21000 crore in 2011-12 (BE), the scheme can hardly succeed in operationalising Right to Education Act with this magnitude of funds. Centre’s own estimation, a modest one from the point of view of quality, indicated that additional budget outlays for elementary education required for operationalising Right to Education Act would be Rs. 1.82 lakh crore over a period of five years. Hence, if just one-fifth of this had to be allocated in 2011-12 with the Union Budget contributing only half of it, the outlay for SSA should have been increased at least to a level of Rs. 33,000 crore.
Budget Allocations for Children during the 11th Five Year Plan Period In the 11th Five year Plan, some ambitious targets were set for the overall development of children. At the end of the 11th Five Year Plan period (2007-08 to 2011-12), it is expected that the total funds allocated in the five Union Budgets from 2007-08 to 2011-12 would mirror the Planning Commission’s recommended outlays for the child focused schemes. However, that has not been the case.
As shown in Table 9.a, the total provisioning in the five Union Budgets during 2007-08 to 2011-12 has been only 22 percent of the recommended outlay for Rashtriya Madhyamik Shiksha Abhiyan (RMSA), and 45.5 percent for Teacher Training.
ICDSand Mid Day Meal (MDM) schemes have fared better with 90.5 and 87.2 percent respectively. In this context, the progress made under Sarva Shiksha Abhiyan (SSA) is noticeable with 111.8 percent allocation made so far, thereby exceeding the allocation target set by the Planning Commission. However, as we have observed earlier, the allocation for SSA needs to be increased substantially if it has to be the vehicle for operationalising Right to Education Act throughout the country.
The mismatch between the outlays recommended by the Planning Commission and the allocations made in the Union Budgets (from 2007-08 to 2011-12) is quite pronounced in the case of important schemes in the health sector. In the National Rural Health Mission (NRHM), the total plan allocation made in Union Budgets for 2007-08 to 2011-12 stands at 77 percent of the quantum of funds recommended by the Planning Commission for the entire 11th Plan period.

Centre for Budget and Governance Accountability, 201160
Table 9.a Outlays Recommended (by Planning Commission) for Eleventh Plan vs. Union Budget allocations made in the Plan Period
Programme / Scheme
Outlay Recommended
for 11th Plan(in Rs. Crore)
[at current prices] *
Plan Allocationmade in the Union Budget
(in Rs. Crore)
Total Union Budget
allocation made in
the first 4 years of 11th Plan(in Rs. Crore)
Union Budget Allocation
made during 2007-08 to
2010-11as % of Outlay Recommended
for 11th Plan
2007-08(RE)
2008-09(RE)
2009-10(RE)
2010-11 (RE)
2011-12 (BE)
Sarva Siksha Abhiyan (SSA)
71000 13171 13100 13100 19000 21000 79371 111.8
MDM 48000 6678 8000 7359 9440 10380 10380 87.2Teacher Training 4000 312 307 325 375 500 1819 45.5
Rashtriya Madhyamik Shiksha Abhiyan (RMSA)
22620 1 511 550 1500 2424 4985.9 22.0
National Rural Health Mission (NRHM)
89478 10669 11930 13378 15037 17925 68939 77.0
Integrated Child Development Services (ICDS)
42400 4857 5665 8162 9370 10330 38384 90.5
Note: * Figures for Union Budget allocations for these schemes do not include the Lumpsum provision of funds for North Eastern Region and Sikkim, if any. Source: Compiled by CBGA from 11th Five Year Plan, Planning Commission, Govt. of India; and Union Budget, Govt. of India, various years.
It is evident from the brief discussion presented above that there has been no significant increase in the overall priority for children in the Union Budget for 2011-12. Although allocations for some of the programmes related to Child Protection have been increased in absolute terms, these amounts appear meagre vis-à-vis the magnitude of the problems. Further, a major chunk of funds in some of these schemes is remaining unutilised.

Centre for Budget and Governance Accountability, 2011 61
• In the Union Budget 2011-12, the government has introduced two separate Statements to report allocations earmarked for Scheduled Castes and for Scheduled Tribes separately.
• Further, the funds allocated under Scheduled Caste Sub Plan (SCSP) and Tribal Sub Plan (TSP) will be shown in the detailed budget documents of the relevant Ministries and Departments under separate minor heads of account, which is Minor Head 789 for Scheduled Caste Sub Plan.
• In Union Budget 2011-12, Statement 21 (Expenditure Budget Vol. I) provides allocations earmarked for SCs. This Statement, however, still does not report actual spending on SCs.
• New Ministries/Departments like Animal Husbandry, Dairying and Fisheries, New and Renewable Energy, which are allocating funds for the welfare of Scheduled Castes, have begun reporting in Statement 21.
• Six new Ministries/Departments namely, Industrial Policy and Promotion, Environment and Forest, Department of AIDS Control, Housing and Urban Poverty Alleviation, Land Resources and Department of Drinking Water and Sanitation have been added in Statement 21 which are allocating at least 20 % of its funds for the welfare of Scheduled Castes.
• As per Statement 21, Union Government’s allocation under Scheduled Caste Sub Plan (SCSP) has increased to Rs. 30551 crore in 2011-12 from Rs. 23795 crore in 2010-11 (BE).
• In the Union Budget 2011-12, out of 105 Demands for Grants for the Union Government, only 24 have allocated funds under Scheduled Caste Sub Plan (SCSP). Out of the remaining 81, as many as 43 ministries and departments have attributed their inability to do so on the grounds of the problem of ‘indivisibility’ of their programmes and schemes.
• The Union Government has not ensured that the Plan allocation earmarked for Scheduled Castes is at least 16 percent of its Plan Budget, as is required under the Scheduled Caste Sub Plan (SCSP) guidelines. The allocation made under SCSP in 2011-12 (BE) is 8.98 percent of the Plan Budget for the Union Ministries.
• Under the funds earmarked for SCSP, a large chunk is meant for essential services and employment generation programmes, with no emphasis on providing funds for long-term development and empowerment of the SCs.
Scheduled Castes (SCs) or dalits have historically been disadvantaged and vulnerable. They have been at the lower rung of the caste system and suffered from the dual discrimination of economic exploitation and social exclusion since ages. The SCs constitute 16.23 percent of India’s population (as per Census 2001). All the five year plans since 1951 have tried to focus on the development of dalits. The Union government and many state governments have introduced development schemes focussing on SCs. The most important initiative in this regard was the creation of Scheduled Caste Sub Plan (SCSP) recognising the special need of making a distinction between ‘incidental’ benefits for SCs from the usual government interventions and ‘direct policy-driven’ benefits. SCSP is a major planning strategy through which developmental needs of these groups are addressed. The allocation towards SCSP is required to be in proportion to the respective shares of SCs in the population (i.e., 16 percent at the national level).
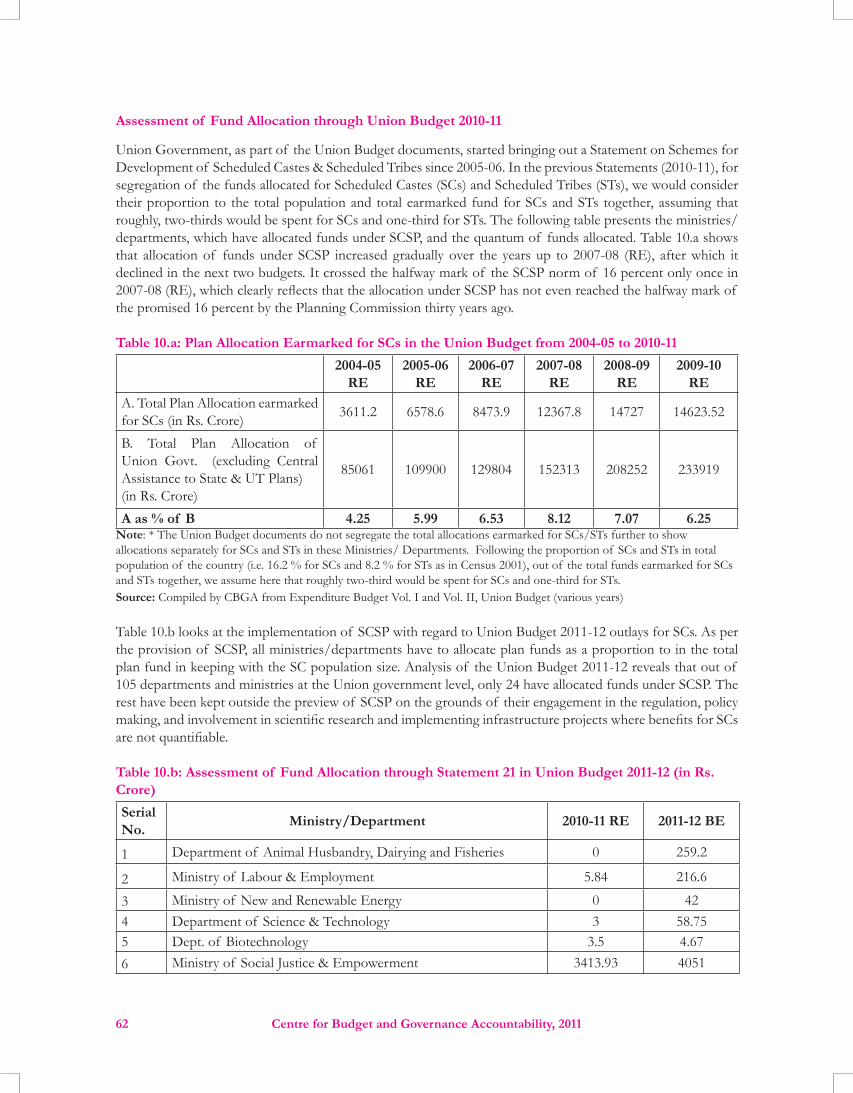
Centre for Budget and Governance Accountability, 201162
Assessment of Fund Allocation through Union Budget 2010-11
Union Government, as part of the Union Budget documents, started bringing out a Statement on Schemes for Development of Scheduled Castes & Scheduled Tribes since 2005-06. In the previous Statements (2010-11), for segregation of the funds allocated for Scheduled Castes (SCs) and Scheduled Tribes (STs), we would consider their proportion to the total population and total earmarked fund for SCs and STs together, assuming that roughly, two-thirds would be spent for SCs and one-third for STs. The following table presents the ministries/ departments, which have allocated funds under SCSP, and the quantum of funds allocated. Table 10.a shows that allocation of funds under SCSP increased gradually over the years up to 2007-08 (RE), after which it declined in the next two budgets. It crossed the halfway mark of the SCSP norm of 16 percent only once in 2007-08 (RE), which clearly reflects that the allocation under SCSP has not even reached the halfway mark of the promised 16 percent by the Planning Commission thirty years ago.
Table 10.a: Plan Allocation Earmarked for SCs in the Union Budget from 2004-05 to 2010-112004-05
RE2005-06
RE2006-07
RE2007-08
RE2008-09
RE2009-10
REA. Total Plan Allocation earmarked for SCs (in Rs. Crore) 3611.2 6578.6 8473.9 12367.8 14727 14623.52
B. Total Plan Allocation of Union Govt. (excluding Central Assistance to State & UT Plans) (in Rs. Crore)
85061 109900 129804 152313 208252 233919
A as % of B 4.25 5.99 6.53 8.12 7.07 6.25Note: * The Union Budget documents do not segregate the total allocations earmarked for SCs/STs further to show allocations separately for SCs and STs in these Ministries/ Departments. Following the proportion of SCs and STs in total population of the country (i.e. 16.2 % for SCs and 8.2 % for STs as in Census 2001), out of the total funds earmarked for SCs and STs together, we assume here that roughly two-third would be spent for SCs and one-third for STs.Source: Compiled by CBGA from Expenditure Budget Vol. I and Vol. II, Union Budget (various years)
Table 10.b looks at the implementation of SCSP with regard to Union Budget 2011-12 outlays for SCs. As per the provision of SCSP, all ministries/departments have to allocate plan funds as a proportion to in the total plan fund in keeping with the SC population size. Analysis of the Union Budget 2011-12 reveals that out of 105 departments and ministries at the Union government level, only 24 have allocated funds under SCSP. The rest have been kept outside the preview of SCSP on the grounds of their engagement in the regulation, policy making, and involvement in scientific research and implementing infrastructure projects where benefits for SCs are not quantifiable.
Table 10.b: Assessment of Fund Allocation through Statement 21 in Union Budget 2011-12 (in Rs. Crore)Serial No. Ministry/Department 2010-11 RE 2011-12 BE
1 Department of Animal Husbandry, Dairying and Fisheries 0 259.2
2 Ministry of Labour & Employment 5.84 216.6
3 Ministry of New and Renewable Energy 0 424 Department of Science & Technology 3 58.755 Dept. of Biotechnology 3.5 4.676 Ministry of Social Justice & Empowerment 3413.93 4051

Centre for Budget and Governance Accountability, 2011 63
7 UTs of Chandigarh and Daman & Diu 10.97 13.74
8 Ministry of Agriculture 272.5 1500.44
9 Department of Industrial Policy & Promotion 30.73 30.0110 Department of Information Technology 53.2 60
11 Ministry of Environment & Forest 0 1
12 Department of Health & Family Welfare 2163 3582
13 Department of AIDS Control 0 258.4
14 Ministry of Housing & Urban Poverty Alleviation 0 247.5
15 Department of School Education & Literacy 5509.38 7791.4
16 Department of Higher Education 1242.59 1956.38
17 Ministry of Micro, Small & Medium Enterprises 276.26 324.218 Ministry of Panchayati Raj 11 14.5919 Department of Rural Development 7492 4375.06
20 Department of Land Resources 0 445.37
21 Department of Drinking Water & Sanitation 0 2420
22 Ministry of Textiles 139.2 25023 Ministry of Women and Child Development 2349 253024 Ministry of Youth Affairs and Sports 177.09 118.69 Total Plan Exp. for SCs from Union Budget 23153.2 30551
Source: Compiled by CBGA from Statement 21, Vol- 1 from Union Budget 2011-12
Table 10.c clearly shows the allocations earmarked for the SCs in the Union Budget 2011-12. The recommended percentage of allocation for SCSP has not been fulfilled in the Union Budget 2011-12 also: it is only 9 percent of the total plan allocation.
Table 10.c: Plan Allocation Earmarked for SCs in Union Budget 2011-12 2010-11 BE 2010-11 RE 2011-12 BE
A. Total Plan Allocation earmarked for SCs (in Rs.Crore) 23795.61 23153.19 30551
B. Total Plan Allocation of Union Govt. (excluding Central Assistance to State & UT Plans) (in Rs Crore) 284284 302500 340255
A as % of B 8.37 7.65 8.98Source: Compiled by CBGA from Statement 21, Vol- 1 from Union Budget 2011-12
Assessment of Fund Allocation through Detailed Demands for Grants (DDGs)
Further comparing the plan allocation of Union budget in Statement 21 with DDGs (that are the detailed budget books of each department), we find a huge gap in the allocations reported. As per the analysis of Statement 21, out of 100 ministries/departments, 17 have allocated funds for SCs, but the analysis of DDGs show that allocation for SCs has been made by only 4 ministries namely, Ministry of Labour and Employment, Ministry of Social Justice and Empowerment, Ministry of Home Affairs, Ministry of Micro, Small and Medium Enterprises. Moreover, at the Union Ministry level, there is a gap in the allocation of funds for SCs as per Statement 21 (table 10.d) and DDGs. The proportion of total plan allocation for SCs as per Statement 21 is

Centre for Budget and Governance Accountability, 201164
8.37 percent while as per DDGs, it is 1.28 percent (Table 10.d).
Table 10.d: Fund Flow to SCs - Comparison between Statement 21 and DDGs in 2010-2011 Statement 21 DDGs
Total Plan Exp. from Union Budget Earmarked for SCs (in Rs.Crore) 23795.61 3629.88
Total Plan Exp. of Union Govt. Ministries (excluding Central Assistance to State & UT Plans) (in Rs. Crore) 284284 284284
Proportion of total Plan Allocation earmarked for SCs (in %) 8.37 1.28
Source: Compiled by CBGA from Statement 21, Vol-1 from Union Budget 2011-12 and DDGs from various ministries and departments of Union Budget 2010-11
Concluding Remarks:
In the Union Budget 2011-12, an appreciable step has been the introduction of a new Pre-Matric Scholarship scheme for needy students belonging to SCs and STs studying in classes IX and X. It would benefit about 40 lakh SC and ST students. In the Union Budget 2011-12, separate allocations have been earmarked towards SCSP as per the recommendations of the Task Force on SCSP. These allocations will be shown in the Budget of the relevant Ministries and Departments under separate Minor Heads. Analysis of Union Budget 2011-12 shows that the percentage share of allocations for SCSP at 9 percent of the total plan allocation is still far short of the recommended allocations by the Task Force.
Centre for Budget and Governance Accountability, 2011 65
• In the Union Budget 2011-12, the government has introduced two separate Statements to report allocations earmarked for Scheduled Castes and for Scheduled Tribes separately.
• Further, the funds allocated under Scheduled Caste Sub Plan (SCSP) and Tribal Sub Plan (TSP) will be shown in the detailed budget documents of the relevant Ministries and Departments under separate minor heads of account, which is Minor Head 796 for Tribal Sub Plan.
• In Union Budget 2011-12, Statement 21A (in Expenditure Budget Vol. I) provides allocations earmarked for STs. This Statement, however, still does not report actual spending on STs.
• New Ministries/Departments like Civil Aviation, AYUSH, AIDS Control, Housing and Urban Poverty Alleviation, Land Resources and Drinking Water and Sanitation, Tourism, which are allocating funds for the welfare of STs, have begun reporting in Statement 21A.
• As per Statement 21A, Union Government’s allocation under Tribal Sub Plan (TSP) has been increased to Rs. 17371 crore in 2011-12 from Rs. 8990 crore in 2010-11 (BE).
• Allocations under Ministry of Tribal Affairs has increased from Rs 3206 crore in 2010-11 (BE) to Rs.3674 crore in 2011-12 (BE).
• There is an increase in the Budget allocation for primitive tribal groups from Rs.185 crore in 2010-11 (BE) to Rs.244 crore in 2011-12 (BE).
Among the socially marginalised groups in India, Scheduled Tribes (STs) are among the most disadvantaged. The population of STs in India stands at 8.4 crore, which constitutes 8.2 percent of the total population of the country as per the census of 2001. Ever since Independence, the Government of India has adopted various developmental schemes focussing on STs.
Even after six decades of development planning in the country, developmental deficits among STs have persisted. Most of the outcome indicators point to the fact that STs have not been included in the growth and development process witnessed in the country over the last three and a half decades after introduction of Tribal Sub Plan (TSP). The TSP was introduced in 1974 as a plan strategy to allocate the plan fund by ministries and departments in proportion to the Scheduled Tribe population.
Box 1Targeted Policies Status of Implementation
Tribal Sub-Plan (TSP) Focus is on earmarking population-proportionate funds from the general development sectors for the overall development of ST population
1) In 2011-12, only 5.42 % of the total plan budget of the Union ministries was earmarked for STs, which is way below the level required (i.e. at least 8%) as per Task Force on SCSP/TSP ,2010. 2) In Union Budget 2010-11, only 27 ministries/ departments out of 105 showed allocations earmarked for STs.3) Minor head 796 has been opened in the Detailed Demands for Grants (DDGs) of only five Union Government Ministries/Departments.

Centre for Budget and Governance Accountability, 201166
Panchayat (Extension to the Scheduled Areas) Act, (PESA, 1996)PESA was introduced with an objective of endowing Panchayats in Scheduled Areas with such powers and authority as to enable them to function as institutions of self-government.
1) Not a single State has notified rules of PESA 2) Irregularity of elections at three tiers of Panchayati Raj Institutions as per the provision of PESA Act.3) PESA has been enforced in nine States, but not uniformly.4) The prevailing unrest in Tribal areas has adversely affected the functioning of the Gram Sabhas/Panchayats.5) There are some practical issues with the implementation of the PESA Act, particularly with respect to land acquisition and mining.
Tribal Forest RightsThe Scheduled Tribes and Other Forest Dwellers (Recognition of Forest Rights) Act, 2006 and its Rules have been notified in 2007
1) Its implementation was made affective from January 2008.2) In 2009, out of the 27 States, only 16 States had filed claims for the title deed under the Act, whereas the titles have been distributed in 11 States.3) The total number of claims received were 25, 05,120 against which, 5, 73,227 titles have been distributed.
Assessment of Fund Allocation through Statement 21 up to Union Budget 2010-11
As per the old guidelines of TSP, all ministries/departments had to allocate plan funds as a share of the total plan funds proportionate to the ST population in the country, i.e. 8 percent. Analysis of Statement 21 from 2004-05 to 2009-10 reveals that out of 108 ministries and departments at the Union government level, only 18 allocated funds under TSP. The rest attributed their inability to do so to the problem of indivisibility of funds. Until 2010-11, to segregate the fund allocation for Scheduled Castes (SCs) and Scheduled Tribes, the proportion of funds allocated to STs was assumed as roughly two-thirds of the total funds reported under Statement 21 being spent for SCs and one-third for STs. The following table shows the ministries/departments allocating funds under TSP and their respective quantum. Table 11.a shows the proportion of total Plan Outlay of the Union Government earmarked for STs, which increased during 2004-05 (RE) to 2007-08 (RE), but declined during 2008-09 (RE) and 2009-10 (RE). This was inadequate considering the proportion of STs in the total population of the country (roughly 8 percent).
Table 11.a: Plan Allocation Earmarked for STs in the Union Budget up to 2010-112004-05
RE2005-06
RE2006-07
RE2007-08
RE2008-09
RE2009-10
RE
A. Total Plan Allocation earmarked for STs (in Rs. crore) 2382 4175.5 5564.9 7447 8771 8600.63
B. Total Plan Allocation of Union Govt. (excluding Central Assistance to State & UT Plans) (in Rs. crore)
85061 109900 129804 152313 208252 233919
A as % of B 2.8 3.8 4.29 4.89 4.21 3.67Note: *The Union Budget documents were not segregating the total allocations earmarked for SCs/STs further to show allocations separately for SCs and STs in these Ministries/ Departments till 2010-11. We assume here that following the proportion of SCs and STs in total population of the country (i.e. 16.2 percent for SCs and 8.2 percent for STs as in Census 2001), out of the total funds earmarked for SCs and STs together, roughly one-third would be spent for STs.Source: Compiled from Expenditure Budget Vol. I and Vol. II, Union Budget (various years)
Assessment of Fund Allocation through Statement 21 A
Further, looking at the implementation of TSP with regard to Union Budget 2011-12 outlays (Table 11.b.), as per the provision of Task Force on TSP, 2010 , out of 105 departments/ ministries, only 27 have allocated funds under TSP. The Task Force cites the problem of indivisibility of funds as the primary reason for other

Centre for Budget and Governance Accountability, 2011 67
departments and ministries failing to allocate funds under TSP. This is because these are either regulatory departments or ministries addressing only specific target groups other than STs or alternatively are engaged in basic scientific research and implementation of infrastructure projects benefit of which are difficult to quantify.
Table 11.b: Assessment of Fund Allocation through Statement 21 modified in Union Budget 2011-12Serial No.
Ministry/Department 2010-11 RE (in Rs. Crore)
2011-12 BE (in Rs. Crore)
1 Ministry of Civil Aviation 0.05 0.052 Ministry of Labour & Employment 0 106.6
3 Department of Science & Technology 3 58.75
4 Dept. of Biotechnology 1.75 2.335 Ministry of Tribal Affairs 3203.3 3674.51
6 UTs of Andaman and Nicobar Islands, Dadra and Nagar Haveli, Daman & Diu and Lakshadweep 367.13 542.16
7 Ministry of Agriculture 139.3 665.968 Department of Telecommunications 0 8.579 Department of Information Technology 0 20110 Department of Food & Public Distribution 0 1.411 Ministry of Culture 7.4 1612 Department of Health & Family Welfare 1167 193213 Department of AYUSH 8.21 1814 Department of AIDS Control 0 139.4
15 Ministry of Housing & Urban Poverty Alleviation 0 26.416 Department of School Education & Literacy 3441.06 4168.4317 Department of Higher Education 621.29 974.6718 Ministry of Micro, Small & Medium Enterprises 147.32 221.719 Ministry of Panchayati Raj 11 7.3620 Department of Rural Development 0 3081.9421 Department of Land Resources 0 269.9222 Department of Drinking Water & Sanitation 0 110023 Ministry of Textiles 27.6 6024 Ministry of Tourism 0 27.525 Ministry of Water Resources 0 11.626 Ministry of Women and Child Development 0 1037.327 Ministry of Youth Affairs and Sports 75.9 82.6
Total Plan Exp. for STs from Union Budget 9221.31 18436.15** This amount does not match with allocations, which is mentioned in the Statement 21A due to some error in the document. Statement 21A shows Rs. 17371.35 crore as total plan allocation for STs. However, on summing up all 27 entries in the table, the total we get is Rs. 18436.15 crore, making it a difference of Rs 1064.8 crore. Sources: Compiled by CBGA from Statement 21A, 2011-12, Expenditure Budget Volume-I, Ministry of Finance, Government of India

Centre for Budget and Governance Accountability, 201168
Table 11.c shows the allocations earmarked for the STs in the Union Budget 2011-12. In 2010-11 (BE) and 2010-11 (RE), the allocation made was just 3 percent of the total budgetary outlay. The Task Force on TSP, 2010 recommended that the allocation under TSP should be made around 8 percent in 2011-12. An assessment of statement 21 A shows, however, that it is just 5 percent indicating clearly the government’s inability to implement the recommendations of the Task Force on TSP which mandates that budgetary allocations be commensurate with the proportion of STs in population.
Table 11.c: Plan Allocation Earmarked for STs from the Union Budget 2011-12 2010-11 BE 2010-11 RE 2011-12 BE
A. Total Plan Allocation earmarked for STs (in Rs. crore) 8989.91 9221.31 18436.15
B. Total Plan Allocation of Union Govt. (excluding Central Assistance to State & UT Plans) (in Rs. crore)
284284 302500 340255
A as % of B 3.16 3.05 5.42Source: Compiled by CBGA from Statement 21, Expenditure Budget of Vol-1 of Union Budget, 2011-12
Assessment of Fund Allocation through Detailed Demand from Grants
In the Union Budget 2010-11, out of 105 ministries/departments, as per Statement 21, 17 were allocating the funds for STs. An analysis of Detailed Demands for Grants (DDGs) on the other hand shows that allocations for STs were made by only 6 ministries namely: Ministry of Labour and Employment, Ministry of Food and Public Distribution, Ministry of Tribal Affairs, Ministry of Social Justice and Empowerment, Ministry of Home Affairs, Ministry of Micro, Small and Medium Enterprises. Moreover, at the Union Ministry level, a gap in the allocation of funds for STs is visible when one compares Statement 21 and the DDGs. The proportion of total plan allocation for STs as per Statement 21 is 3.16 percent while the Detailed Demands for Grants shows a smaller percentage of 1.17 percent. (Table 11.d)
Table 11.d: Analysis of Fund Flow to STs: A Comparison between Statement 21 and DDGs
Statement 21 A DDGs
2010-11 (BE) 2010-11 (BE)Total Plan Exp. from Union Budget Earmarked for STs (in Rs. crore) 8989.91 3317.544Total Plan Exp. of Union Govt. Ministries (excluding Central Assistance to State & UT Plans) (in Rs. crore) 284284 284284Proportion of total Plan Allocation earmarked for STs (in %) 3.16 1.17
Source: Compiled by CBGA and DAAA (NCDHR), from Statement 21 and Union Budget, 2010-11
Assessment of Fund Utilisation
From table 11.e, we can see the status of fund utilisation during the 11th Plan period under Ministry of Tribal Affairs (MoTA), which is the nodal Ministry that deals with the welfare of STs. The actual fund allocation for four years (2007-10) by MoTA has been Rs. 10252.71 crore. This is high compared to the total 11th Plan budgetary outlays. The year-wise utilisation of funds as percentage of Budget Estimates (BE) does not seem encouraging during the first three years (2007-10) of implementation.

Centre for Budget and Governance Accountability, 2011 69
Table 11.e: Utilisation of Plan Allocations under MoTA
Year Budget Estimate(BE)(In Rs. Crore)
Actual Expenditure(AE)In Rs. Crore) AE as % of BE
2007-08 1719.71 1524.32 88.642008-09 2121 1805.27 85.112009-10 3205.5 1996.75 62.292010-11 3206.52011-12 3674.51
Source: Compiled by CBGA from Ministry of Tribal Affairs
Concluding Remarks:
From the analysis of the budgetary allocation and processes under TSP, it is clear that there exists a huge gap in the budgetary allocation for STs even after thirty years of its implementation. In 2011-12, certain reforms have been introduced in the budgetary process; for instance, for the first time, the Union Budget has brought out a separate budget statement called 21 A specifically providing information on allocations earmarked for STs, which would henceforth be made under a separate minor head 796. A new pre-matric scholarship scheme has been introduced for needy students belonging to the SCs and STs studying in classes IX and X, which would benefit about 40 lakh SC and ST students.

Centre for Budget and Governance Accountability, 201170
• The minorities have not been given due attention in this Budget. • The Ministry of Minority Affairs has been allocated Rs. 2850 crore in 2011-12 (BE) as compared to
Rs. 2600 crore in 2010-11 (BE). • The Budget does not pay attention to issues relating to operationalisation of the Prime Minister’s
new 15-Point Programme even though there is a growing demand among civil society organisations to increase the ambit of the programme and to bring out a Special Budget Statement on the funds earmarked for minorities in different schemes under this programme
• The special attention paid to minorities in Union Budget 2011-12 has been confined mainly to a push for achieving the 15 percent target for minorities under Priority Sector Lending and increase in the allocation of Maulana Azad Education Foundation.
According to Census 2001, religious minority groups constituted around 19 percent of the total population of India. Muslims constitute 73 percent of the total minority population. The socio-economic conditions of Muslims reflect poorly as compared to other religious minority groups. The major reason for the continued exclusion of the minorities (particularly Muslims) has been the gaps in government interventions made for their development. In fact, no concrete policy measures were taken until 2005 for improving the conditions of the minorities.
The Sachar Committee Report 2006 established that the socio-economic status of most of the Muslims in India was comparable in many indicators to the deprived sections such as the dalits and adivasis. The Sachar panel advocated special attention to the Muslims in the areas of education, economic development and basic public amenities to reduce their levels of backwardness. Subsequently, 90 Minority Concentration Districts (MCDs) across the country which are falling behind the national average in terms of eight socio-economic and basic amenities indicators were identified. However, only 30 percent of the Muslims are covered under this approach.
To address the developmental deficits of minorities, particularly Muslims, Government of India has adopted a two-pronged strategy in terms of policy initiatives since 2006. Firstly, the central government selected few flagship programmes / schemes related to education, livelihood and public services under the new PM’s 15 point programme and, secondly, under the aegis of Ministry of Minority Affairs (MMA), some new development schemes and programmes were devised, the most important being the Multi Sectoral Development Programme (MSDP).
Even after five years of supposed policy initiatives in this direction, there is still a huge gap in budgetary allocation, utilisation of funds and programme implementation specific to the development of minorities.

Centre for Budget and Governance Accountability, 2011 71
Polices and Budgetary Allocation for Minorities
Under the PM’s 15-Point Programme, there are nearly eleven schemes /programmes. Among them, three are being run by Ministry of Rural Development (MoRD), four Programmes by Ministry of Housing and Urban Poverty Alleviation. The urban development programmes like Integrated Housing and Slum Development Programme (IHSDP), Urban Infrastructure Development Scheme for Small & Medium Towns (UIDSSMT), Basic Services to the Urban Poor (BSUP) and Urban Infrastructure and Governance (UIG) are covered under JNNURM. Other three programmes like Industrial Training Institutes (ITIs), Sarva Shiskha Abhiyan (SSA) and Integrated Child Development Services (ICDS) are under the Ministry of Labour and Employment, Department of School Education (within Ministry of Human Resource Development) and Ministry of Women and Child Development respectively.
Under the 15-Point Programme, major allocations are made through the three JNNURM projects for urban development which constituted 62 percent and 56 percent of the total allocation meant for minorities in 2009-10 and 2010-11 respectively. But the operationalisation of JNNURM is found to be non-existent at the state and district levels under the programme. The allocation under rural development programmes like Indira Awas Yojana (IAY) and National Demonstration Water Project (NDWP) comes roughly around 22 percent. The programmes like Industrial Training Institutes (ITIs) and Swarna Jayanti Shahari Rozgar Yojana (SJSRY) have been allocated a very minuscule fund in the total allocation. The share of MMA in total allocation for minorities is around 17 percent, which is very insignificant, keeping in mind the fact that MMA is the nodal ministry for the development of minorities. The same can be seen in Table 12.a.
Table 12.a: Resource Allocation by Union Government for Minorities under PM’s 15 Point Programme & MMA (in Rs. Crore)
S.N Scheme 2009-10 2010-111 Indira Awas Yojana (IAY) 2147.31 (14.3) 1961 (12.95)2 National Drinking Water Programme (NDWP) 1087 (7.24) 1781 (11.76)3 Industrial Training Institutes (ITIs) 25.98 (0.17) 42 (0.28)
4 Integrated Housing Slum Development Programme (IHSDP) 1770.83 (11.79) 0
5 Urban Infrastructure Development for Small and Medium Towns (UIDSSMT)* 2533 (16.87) 0
6 Basic Services to Urban Poor* 5578 (37.15) 07 Urban Infrastructure and Governance 8624 (56.94)8 Swarna Jayanti Shahari Rojgar Yojana (SJSRY) 33.47 (0.22) 37 (0.24)9 Ministry of Minority Affairs (MoMA) 1740 (11.59) 2600 (17.17)10 Some other schemes 100 (0.67) 100 (0.66)11 Total 15,015.59 15,145
Source: Compiled by CBGA from Ministry of Ministry Affairs, Government of India (GOI)* Cumulative amount of approved projects under JNNURM Figures in brackets are share to total for the year.
In 2009-10, the total quantum of funds for minorities was only 6 percent of total plan funds while their population share was 19 percent of the total population as per census 2001. In 2010-11, funds allocation for minorities had further declined up to 5.3 percent (Table 12.b)

Centre for Budget and Governance Accountability, 201172
Table 12.b: Share of Resource Allocation by Union Government for Minorities under PM’s 15 Point Programme & MMA (in Rs. Crore)
2009-10 2010-11A. Total Plan Allocation earmarked for Minorities 15,016 15,145B. Total Plan Allocation of Union Govt. (excluding Central Assistance to States) 233,919 284,284A as % of B 6.42 5.33
Source: Compiled by CBGA from Ministry of Minority Affairs, GoI
When one looks at the actual implementation of the various programmes, it was found that even the State Secretaries were not aware about the implementation of an important programme like 15-point programme in Bihar, West Bengal and Haryana. Such a scenario is not restricted to these States. In fact, most of the government officials and beneficiaries are not aware about the schemes and programmes run by MMA as well as the PM’s 15 point programme in many states. This indicates a need for sustained policy interventions in terms of awareness generation and sensitisation about the various programmes.
Ministry of Minority Affairs (MMA)
Being the nodal ministry for the development of minorities, the proposed budgetary outlays for MMA was Rs.7, 000 crore during the 11th Plan which constituted a minuscule 0.32 percent of the total Plan outlay, an amount extremely insufficient to address the developmental deficits. The Plan allocation for MMA as a share of the total Plan allocation is a meagre 0.64 percent in 2011-12. Moreover, the utilisation of funds accounts for only about 57 percent of the total proposed outlay of 11th Plan for MMA during the first four years of the Plan period - which could be attributed to existing bottlenecks in the implementation of programmes meant for minorities.
Table 12.c: Status of Fund Utilisation under MMA (in Rs. Crore)
YearAllocation
Expenditure Utilization % (in B.E. Figure)B.E R.E
2007-08 500 350 196.65 39.332008-09 1000 650 619.09 61.862009-10 1740 1740 1709.42 98.242010-11 2600 2500 1470.29* 56.552011-12 2850
Cumulative Outlays in the Eleventh Plan (BE) 8690Source: Compiled by CBGA from Ministry of Minority Affairs, GoI* Figure as on 31st December, 2010
Performance of Scholarship Schemes
With regard to the scholarships run by the MMA, there are three schemes which have witnessed an increase in their Budget Estimates, highest being in the case of Post-matric Scholarship Scheme. The fund utilisation under all the three schemes has improved in the last few years, especially in the year 2009-10, as can be seen from table 12.d. However, the actual performance may be more clearly judged by the achievement of the physical targets achieved under the scholarship schemes. Though the funds allocated in the schemes have increased over the last four years, these funds are inadequate to provide quality services to a large number of beneficiaries. As per the 11th Plan target, the Government has provided 5 lakh pre-matric scholarships annually for minorities. According to DISE data on enrolment, around 2 crore students from the Muslim community were enrolled up to upper primary level in 2009-10, which reveals that per student availability of pre-matric scholarships is

Centre for Budget and Governance Accountability, 2011 73
highly uneven. The Mid-Term Appraisal report noted that the states have been falling behind in sending good proposals on free coaching schemes seeking support from the Ministry. It is thus imperative that the State governments take up the scheme seriously and identify good coaching institutes. States like Bihar, West Bengal and Haryana contend that they have not been given any responsibility under the free coaching scheme.
Table 12.d: Fund Utilisation under Education related schemes (in Rs.Crore) Merit-cum-Means
Scholarship Post-Matric Scholarship
Scheme Pre-Matric Scholarship
SchemeYear BE Actual % of
UtilisationBE Actual % of
UtilisationBE Actual % of
Utilisation2007-08 48.6 40.8 83.95 90 9.63 10.7 72 - -2008-09 112.4 64.79 57.64 89.9 70.7 78.64 71.9 62.31 86.662009-10 90 97.43 108.26 135 148.67 110.13 180 202.74 112.632010-11 121.5 97.22 80.02 238.5 184.24 77.25 405 343.54 84.822011-12 126 - - 405 - - 540 - -
Source: Compiled by CBGA from Union Budget various years for BE figures and Ministry of Minority Affairs, GOI for Actual as on December 2010.
The scheme of free coaching and Pre-matric Scholarship has done relatively better in terms of fund allocation but not well in terms of the targets set and achievements made in the 11th Plan. In terms of percentage allocation, free Coaching and Allied Assistance Scholarship scheme has performed the best, but is countered by the fact that in terms of physical achievement, it fares the worst. The uptake of Scholarship Scheme has been slow except Pre-matric Scholarship. The Mid Term Appraisal Report noted that this is partly because some states are not disbursing the stipends on time. There is also the problem of low awareness generation among the parents about the various schemes. Besides that, there is a cumbersome procedure of form application which requires opening of bank accounts, income, and religion certificates. Moreover, many states lack proper institutional mechanisms at district and state level as is the case of Bihar and Haryana. Further, very low unit costs are reimbursed for scholarships (only Rs. 1000 per annum under Pre-matric scholarship) and no administrative costs are being earmarked for implementing the schemes, even to hire contractual staff to manage the scheme.
Table 12.e: Status of Physical Performance and Fund Allocation during 11th Plan
Scholarship
Physical Target
for the XI FYP*
Physical Achievement till
2010-11 (31st Dec 2010)*
Total XI Plan Budgetary
outlay (Rs. In Crore)
Total Allocation till 2011-12 BE (Rs. In
Crore)
Allocation as a % of
Total 11th Plan Outlay (till 2011-12 BE)
Pre-Matric Scholarship Scheme 25 34 1400 1268.9 90.64
Post-Matric Scholarship Scheme 15 4.2 1150 958.4 83.34
Merit-cum-Means Scholarship Scheme 2.55 0.37 600 498.5 83.08
Free Coaching and Allied Assistance Scholarship Scheme
0.25 0.0475 45 56.8 126.22
Source: Compiled by CBGA from Union Budget, Expenditure Budget Volume II, various years; and Ministry of Minority Affairs, GoINote: *No. of students in Lakh

Centre for Budget and Governance Accountability, 201174
Performance of Multi Sectoral Development Programme (MSDP)
MSDP being the largest programme to address the deficit in socio economic sphere was allocated 39 percent of the total MMA budget in the 11th Plan. The total allocation of Rs.2750 crore (total 11th Plan outlay for MMA is Rs 7000 crore) was made in the 11th Plan for MSDP, which was later raised to Rs. 3780.30 crore. The proportion of expenditure of total projects approved has been around 23.5 percent at the national level after almost four years of implementation, which reflects poor performance.
Table 12.f: Financial Performance of MSDPs in Major Muslim Concentrated States as on December 2010 (in Rs. crore)State No. of
MCDsNo. of MCDs
with Plans approved by
the MMA
Total Cost of Projects approved for all MCDs in a
state
Total Expenditure
Percentage Expenditure(as a proportion of the Total Cost of Projects
approved)Uttar Pradesh 21 21 941.09 224.31 23.84
West Bengal 12 12 684.19 264.24 38.62
Assam 13 12 376.03 74.24 19.74Bihar 7 7 321.00 60.84 18.95All India 90 89 3056.98 724.62 23.70
Source: Compiled by CBGA from Ministry of Minority Affairs, GoI
Table 12.g shows the percentage of physical achievements under MSDP till the end of the year 2010. The targets for provisioning of major services have not been achieved even after more than four years of its implementation. West Bengal fares much better as compared to other three states in terms of achievement. On the other hand, Uttar Pradesh and Bihar perform very poorly in terms of physical achievement under the MSDP programme. The delay has occurred mainly due to lack of required institutional set up. Bihar and Haryana suffer from absence of Minority Welfare department at district level, poor planning capacity, delay in identifying implementing agencies and indifference of the line departments who are busy with their own projects.
Further, another problem that has been observed is the diversion of benefits of MSDP to non-minority beneficiaries, as has been found in the case of beneficiary schemes and infrastructure-related projects in Bihar, Uttar Pradesh and Haryana. From the data analysis, it is found that under MSDP, top priority has been accorded to sectors like housing (Indira Awas Yojana); Integrated Child Development Services (ICDS) centre, primary/secondary education, drinking water supply, electricity, health, sanitation, skill development and income generating activities. However, with respect to selection of activities, more focus has been given to construction of Anganwadi Centres (AWCs), school buildings and health sub-centres which are meant for the common populace and not exclusive to the minorities. Activities related to ensuring skill development, technical education and income generation, which are essential for improving the educational and economic conditions of the minority community, have been neglected by the district administration in many MCDs.
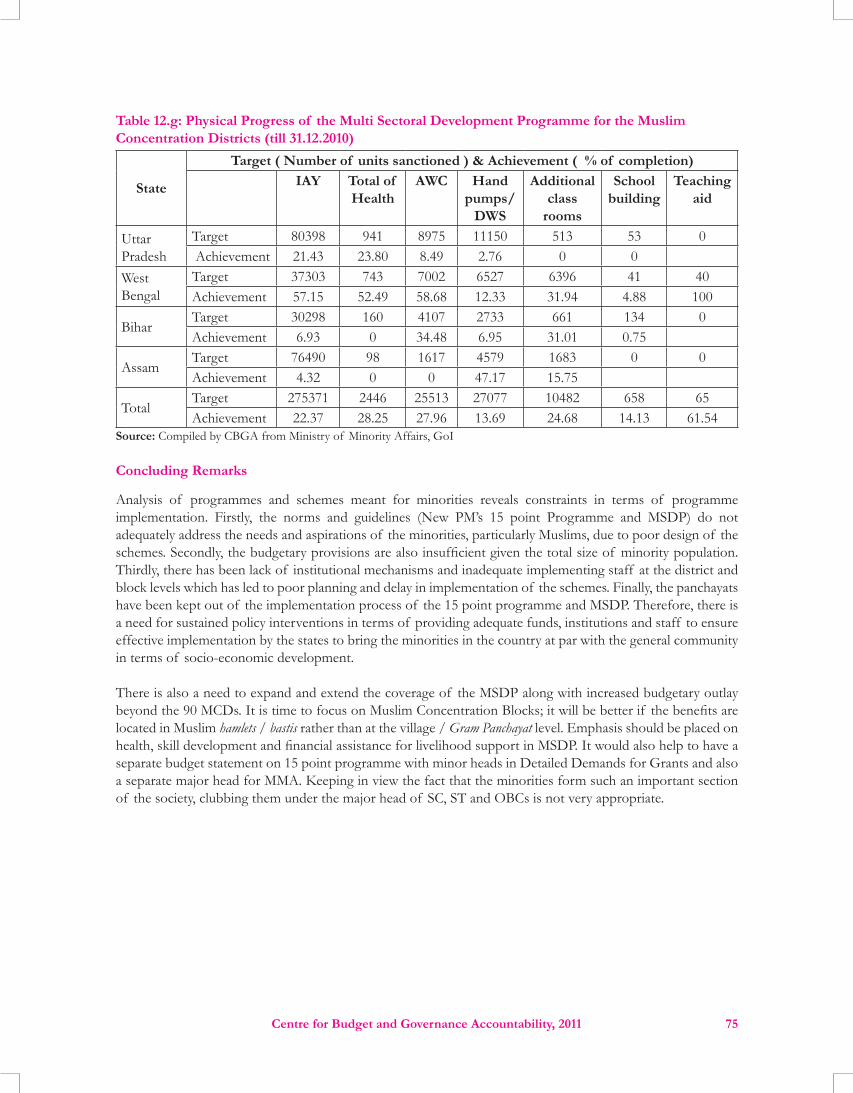
Centre for Budget and Governance Accountability, 2011 75
Table 12.g: Physical Progress of the Multi Sectoral Development Programme for the Muslim Concentration Districts (till 31.12.2010)
State
Target ( Number of units sanctioned ) & Achievement ( % of completion) IAY Total of
HealthAWC Hand
pumps/ DWS
Additional class
rooms
School building
Teaching aid
Uttar Pradesh
Target 80398 941 8975 11150 513 53 0 Achievement 21.43 23.80 8.49 2.76 0 0
West Bengal
Target 37303 743 7002 6527 6396 41 40Achievement 57.15 52.49 58.68 12.33 31.94 4.88 100
BiharTarget 30298 160 4107 2733 661 134 0Achievement 6.93 0 34.48 6.95 31.01 0.75
AssamTarget 76490 98 1617 4579 1683 0 0Achievement 4.32 0 0 47.17 15.75
TotalTarget 275371 2446 25513 27077 10482 658 65Achievement 22.37 28.25 27.96 13.69 24.68 14.13 61.54
Source: Compiled by CBGA from Ministry of Minority Affairs, GoI
Concluding Remarks
Analysis of programmes and schemes meant for minorities reveals constraints in terms of programme implementation. Firstly, the norms and guidelines (New PM’s 15 point Programme and MSDP) do not adequately address the needs and aspirations of the minorities, particularly Muslims, due to poor design of the schemes. Secondly, the budgetary provisions are also insufficient given the total size of minority population. Thirdly, there has been lack of institutional mechanisms and inadequate implementing staff at the district and block levels which has led to poor planning and delay in implementation of the schemes. Finally, the panchayats have been kept out of the implementation process of the 15 point programme and MSDP. Therefore, there is a need for sustained policy interventions in terms of providing adequate funds, institutions and staff to ensure effective implementation by the states to bring the minorities in the country at par with the general community in terms of socio-economic development.
There is also a need to expand and extend the coverage of the MSDP along with increased budgetary outlay beyond the 90 MCDs. It is time to focus on Muslim Concentration Blocks; it will be better if the benefits are located in Muslim hamlets / bastis rather than at the village / Gram Panchayat level. Emphasis should be placed on health, skill development and financial assistance for livelihood support in MSDP. It would also help to have a separate budget statement on 15 point programme with minor heads in Detailed Demands for Grants and also a separate major head for MMA. Keeping in view the fact that the minorities form such an important section of the society, clubbing them under the major head of SC, ST and OBCs is not very appropriate.

Centre for Budget and Governance Accountability, 201176
• The Central Government’s Total Expenditure as a proportion of GDP is projected to fall from 15.4 % in 2010-11 (RE) to 14 % in 2011-12 (BE),which reflects that expenditure compression for reducing deficits is the overarching feature of this budget.
• As regards the Gross Tax Revenue collected by the Centre, the tax-GDP Ratioshows a small increase from 10 % in 2010-11 (RE) to 10.4 % 2011-12 (BE). Even in 2011-12, therefore, the tax-GDP ratio for the Centre would be way below the 12 % of GDP level attained in 2007-08.
• Moreover, the Medium Term Fiscal Policy Statement presented with this Budget indicates that the tax-GDP ratio for the Centre would increase only up to 11.3 % by the year 2013-14, which implies that the tax base of the economy is expected to be stagnant over the next three years. This raises serious concerns.
• The Income Tax exemption limit for the general category of individual tax payers has been raised from Rs 1,60,000 to Rs 1,80,000 in this Budget. However, the exemption limit for women tax payers has been retained at the earlier level of Rs. 1,90,000. The government should have made an effort towards improving the gender responsiveness of the tax system by increasing the exemption limit for women tax payers as well.
• As regards the Income Tax exemption limit for senior citizens, the qualifying age has been reduced from 65 years to 60 years; the exemption limit has been enhanced from Rs. 2,40,000 to Rs. 2,50,000; and, a new category of Very Senior Citizens, eighty years and above, has been created who will be eligible for a higher exemption limit of Rs. 5,00,000.
• Several steps have been proposed both for the Central Board of Direct Taxes (CBDT) and the Central Board of Excise and Customs (CBEC) to improve tax administration under the Central Government Tax System.
• The government has paid attention to the problem of ‘black money’; a five-fold strategy has been put forward to deal with this problem.
• The government has also paid attention to the issues relating to tax avoidance that are affecting the mobilization of tax revenue; the steps taken, according to the Finance Minister, include discussions for 11 Tax Information Exchange Agreements, 13 new Double Taxation Avoidance Agreements (DTAAs) along with revision of 10 existing DTAAs, and steps to improve the effectiveness of Foreign Tax Division of CBDT to handle effectively the increase in tax information exchange and ‘transfer pricing’ issues.
Overall Magnitude of the Union Budget
One would wonder why the Finance Minister, in his Budget Speech, compared almost all figures pertaining to the Budget Estimates for 2011-12 with only the Budget Estimates for last year (i.e. 2010-11) and not the Revised Estimates for 2010-11, despite the fact that Revised Estimates present a more realistic picture of what is being provided from the Budget in 2010-11 and hence should form the benchmark for comparing outlays for the next fiscal. The reason is that the Centre wants to reduce the scope of its budget (measured by Total Expenditure from the Union Budget) as compared to the size of India’s economy (measured by the Gross Domestic Product or GDP) – when the country’s GDP is projected to increase noticeably from Rs. 78.8 lakh crore in 2010-11 to Rs. 89.8 lakh crore in 2011-12, the Total Expenditure from Union Budget is going to register a much smaller

Centre for Budget and Governance Accountability, 2011 77
increase from Rs. 12.17 lakh crore to Rs. 12.58 lakh crore. Thus, the Total Expenditure from the Union Budget would shrink from 15.4 % of GDP in 2010-11 (RE) to 14 % of GDP in 2011-12 (BE).
Table 13.a: Total Magnitude of the Union BudgetYear GDP at market prices
(in Rs. Crore)
Total Expenditure from the Union Budget
(in Rs. Crore)
Total Expenditure from the Union Budget
as % of GDP2004-05 3242209 498252 15.42005-06 3692485 505738 13.72006-07 4293672 583387 13.62007-08 4986426 712679 14.32008-09 5582623 883956 15.82009-10 6550271 1024487 15.6
2010-11 (RE) 7877947 1216576 15.42011-12 (BE) 8980860* 1257729 14.0
Note: *Projected by Min. of Finance, GoI, assuming GDP (at current prices) growth at 14 % over previous year. Source: Compiled by CBGA from Economic Survey 2010-11, GoI, and Union Budget, GoI, various years.
The Centre seems to have been more than willing to follow the Fiscal Responsibility and Budget Management (FRBM) Act dictated path of fiscal consolidation, which was also mandated by the 13th Finance Commission last year. The FRBM Act requires the government to reduce its Fiscal Deficit (i.e. the amount of new borrowing to be made by the government in a fiscal year) to below 3 % of GDP and eliminate its Revenue Deficit (i.e. the gap between government’s expenditure and receipts in the Revenue Account) at any cost; if the government is unable to step up its receipts, it has to reduce its expenditure! And the Union Government has reduced its Fiscal Deficit from 5.1 % of GDP in 2010-11 (RE) to 4.6 % of GDP in 2011-12 (BE).
The Finance Minister also announced how the government has reduced its outstanding debt to a level far below what is required as per the 13thFinance Commission recommendations – the Central Government debt as a proportion of GDP is estimated at 44.2 % for 2011-12 as against 52.5 % of GDP recommended by the 13thFinance Commission.
Thus, the Union Budget for 2011-12 clearly adheres to a conservative fiscal policy, i.e. a fiscal policy that strongly discourages expansion of the scope of government interventions within the economy and particularly borrowing by the government. However, we should note here that there is no consensus among economists on what could be a level of public debt that would be sustainable for the country in the long run and what could be the implications of increased borrowing by the government even in the short run.
Table 13.b: Deficits in the Union BudgetYear Revenue Deficit as
% of GDPEffective Revenue Deficit*
as % of GDPFiscal Deficit as % of GDP
2004-05 2.5 - 42005-06 2.6 - 4.12006-07 1.9 - 3.52007-08 1.1 - 2.72008-09 4.5 - 6.02009-10 5.2 - 6.4
2010-11 (RE) 3.4 2.3 5.1

Centre for Budget and Governance Accountability, 201178
Year Revenue Deficit as % of GDP
Effective Revenue Deficit*as % of GDP
Fiscal Deficit as % of GDP
2011-12 (BE) 3.4 1.8 4.6Note:Effective Revenue Deficit refers to the gap between Revenue Expenditure and Revenue Receipts of the government, where Grants-in-Aid made by the Centre to States & UTs that get used for creation of capital assets by the latter are not included in the figure for Revenue Expenditure. Since such capital assets are not owned by the Centre, the funds provided by Centre to States and UTs for these cannot be reported in the Capital Account of the Union Budget. Source: Compiled by CBGA from Budget at a Glance, Union Budget, GoI, various years.
The targets for deficit reduction prescribed by the FRBM Act have been criticized by many progressive economists as arbitrary, i.e. as not being based on any sound economic logic. Moreover, now the Central Government itself has accepted in the latest Budget that the concept of Revenue Deficit needs to be revised fundamentally since a large part of the expenditure by the Centre reported in the Revenue Account (i.e. a large part of Centre’s Grants-in-Aid to States & UTs) is actually used in the States for creation of capital assets that are not owned by the Centre (and hence cannot be reported in its Capital Account of expenditure).
However, despite such fundamental problems with the deficit reduction targets prescribed by the FRBM Act, the Centre has resumed pursuing these targets zealously since the last Union Budget. And, in the absence of any substantial growth in the collection of government revenue, the reductions in deficits are being achieved mainly by checking the growth of budgetary expenditure.
Mobilisation of Tax Revenue
The fiscal policy space for the government in a country like India depends significantly on the overall magnitude of its tax revenue. The tax-GDP ratio for a country measures the total tax revenue collected as a proportion of the size of the country’s economy. India’s low level of tax-GDP ratio has been a cause for concern since long.
Union Budget for 2011-12 has revealed the inability of the Central Government to revive the magnitude of its Gross Tax Revenue (i.e. the overall collection in the Central Government tax system, including the share of States)even after the economy has recovered from the impact of the global economic recession of 2008-09 and 2009-10. Prior to the economic recession, the Gross Tax Revenue of the Centre had reached upto 12 % of GDP in 2007-08; it fell to 10.9 % of GDP in 2008-09 and further to 9.5 % of GDP in 2009-10 under the impact of the economic recession (as a result of both slowdown in economic growth and higher tax concessions by the government for promoting economic recovery). However, even after the economy has recovered from the impact of the recession, Centre’s Gross Tax Revenue has shown a very slow revival to 10 % of GDP in 2010-11 (RE) and upto 10.4 % of GDP in 2011-12 (BE).
Table 13.c: Tax-GDP Ratio for the CentreYear Gross Tax Revenue of the Centre
(in Rs. Crore)GDP at market prices
(in Rs. Crore)Tax-GDP Ratio
(in %)2004-05 304957 3242209 9.42005-06 366151 3692485 9.92006-07 473513 4293672 11.02007-08 593147 4986426 11.92008-09 605298 5582623 10.82009-10 624527 6550271 9.5
2010-11(RE) 786888 7877947 10.02011-12(BE) 932440 8980860* 10.4
Source: Compiled by CBGA from Economic Survey 2010-11, GoI, and Union Budget, GoI, various years.

Centre for Budget and Governance Accountability, 2011 79
Chart 13.a: Major Sources of Receipts for the Union Budget
Note: Non-Debt Capital Receipts mainly comprise proceeds from Disinvestment.Source: Compiled by CBGA from Receipts Budget, Union Budget 2011-12.
The magnitude of total tax revenue in India (as compared to the size of the country’s economy) continues to be far below the levels of tax revenue collected in several other countries, and it is inadequate from the point of view of the magnitude of public investment needed in the country.
Table 13.d presents a comparison of India’s overall tax-GDP ratio with that of a number of other countries.Social security contributions (SSCs) account for a sizeable chunk of the tax revenue in many of the OECD countries, although they do not exist in countries like India and Malaysia.
Table 13.d: Comparison of Tax-GDP Ratio (excluding Social Security Contributions) across Selected Countries
Country 1990 2000 2007Malaysia 17.8 13.2 14.9Mexico 13.7 14.1 15.2India 15.4 14.5 17.6Japan 21.4 17.5 18.0Korea 17.2 18.8 21.0
US 20.5 23.0 21.7Canada 31.5 30.8 28.5
UK 29.5 30.2 29.5Source: Compiled by CBGA from – Indian Public Finance Statistics (2008-09) and (2009-10), GoI; OECD Revenue Statistics (1965-2008); and the website of the Ministry of Finance, Government of Malaysia.
The SSCs are not included in the GDP calculation of the developed countries. Thus, for parity considerations, social security contributions in the tax-GDP calculation have been excluded in Table 13.d. Even after excluding SSCs from the tax base of the developed countries, the tax-GDP ratio in India is much lower compared to the selected developed countries. Hence, the Central Government in our country should have taken strong measures in Union Budget 2011-12 towards improving the country’s tax-GDP ratio.

Centre for Budget and Governance Accountability, 201180
Tax Structure of the Country
We may note here that, in the total budgetary expenditure in India (i.e. the expenditure from Union Budget and Budgets of all States and UTs taken together), the State Budgets account for around 60 % of the total expenditure with the remaining 40 % being contributed directly by the Centre.
Chart 13.b: Distribution of Budgetary Expenditure between Centre and States
Source: Compiled by CBGA from Indian Public Finance Statistics 2009-10, GoI, and State Finances: A Study of Budgets 2009-10, RBI.
However, the distribution of the authority of tax collection is skewed heavily in favour of the Centre. Hence, the slow revival of the tax-GDP ratio for the Centre would affect the total tax-GDP ratio for the country, which in turn would limit the overall budgetary expenditure by Centre as well as States.
Table 13.e: Centre-State Composition of India’s Total Tax-GDP Ratio (Figures in %)Year Central Tax-GDP Ratio States’ Tax-GDP Ratio Total Tax-GDP Ratio
2000-01 8.97 5.55 14.522001-02 8.21 5.59 13.802002-03 8.80 5.72 14.512003-04 9.23 5.80 15.032004-05 9.41 5.85 15.262005-06 9.88 5.98 15.862006-07 11.05 6.14 17.202007-08 11.99 5.60 17.59
2008-09(RE) 11.26 5.74 17.002009-10(BE) 10.29 5.71 16.00
Note: The tax-GDP figures presented here are based solely on Indian Public Finance Statistics 2009-10, GoI, Source: Compiled by CBGA from Indian Public Finance Statistics 2009-10, GoI.
Also, in the total tax revenue collected by the Centre and the States, Direct Taxes (like Income Tax, Corporation tax etc.) account for around 37 % of the revenue while Indirect Taxes (like Customs, Excise, Service Tax, VAT etc.) account for a much larger 63 % of the revenue (as of 2009-10). The Indirect Taxes, which affect the rich and the poor alike, are considered to be regressive while the Direct Taxes (which take into account the tax payer’s ability to pay) are considered widely to be progressive. Moreover, the extent to which India’s tax system is dependent on Indirect Taxes is much higher than that in several other countries (such as the OECD countries).

Centre for Budget and Governance Accountability, 2011 81
Table 13.f: Direct Taxes Vs. Indirect Taxes in India’s Total Tax-GDP Ratio (Figures in %)Year Direct Tax-GDP Ratio Indirect Tax-GDP Ratio Total Tax-GDP Ratio
2000-01 3.41 11.11 14.522001-02 3.21 10.59 13.802002-03 3.56 10.96 14.512003-04 3.98 11.06 15.032004-05 4.23 11.03 15.262005-06 4.52 11.33 15.862006-07 5.40 11.80 17.202007-08 6.44 11.15 17.59
2008-09(RE) 6.21 10.79 17.002009-10(BE) 5.97 10.03 16.00
Source: Indian Public Finance Statistics, 2009-10, Govt. of India.
A higher share of tax revenues of the Central Government is accrued from Direct Taxes (such as, corporation tax and income tax), which constitutes nearly 57 percent of the total tax collection by the Centre. However, in the total tax revenue collected by the Centre and the States, Indirect Taxes account for a much larger share than Direct Taxes. Hence, there is a need for improving the progressivity of the overall tax regime in India by further increasing the reliance on Direct Taxes.
Hence, we also need to think about the implications of the tax system reforms proposal of the Centre from the point of view of their implications for the distribution of the tax collection authority between the Centre and the States and also from the perspective of progressivity of the tax system.
In this context, the proposed move towards Goods and Services Tax (GST), which has not yet witnessed a consensus among all State Governments, deserves a lot more public debate and informed discussion in the coming months.
Exemptions in the Central Government Tax System
The Centre frequently claims that it does not have the resources to address the concerns pertaining to the social sectors and marginalised sections of population. However, there is a huge amount of tax revenue foregone due to the exemptions/deductions/incentives in the Central Government tax system. The Union Finance Minister had recognised in his 2009-10 Budget Speech that India’s tax base continues to be low compared to other countries, mainly due to a plethora of exemptions/deductions/incentives in the Central Government tax system. However, the Government had not taken any corrective measures in this regard in the last two Union Budgets.
It has started taking some corrective action in the Budget for 2011-12. There have been several reductions in the number of exemptions in the Central Excise rate structure. The total magnitude of tax revenue foregone due to exemptions/deductions/incentives in the Central Government tax system has (as estimated by the Union Finance Ministry) shows a rise from Rs. 4.82 lakh crore in 2009-10 to Rs. 5.11 lakh crore in 2009-10. What it implies is: a liberal estimate of the amount of additional tax revenue which could have been collected by the Central Government in 2010-11, if all exemptions/ deductions/ incentives (both in direct and indirect taxes) had been eliminated, stands at 6.5 % of GDP.

Centre for Budget and Governance Accountability, 201182
Table 13.e: Tax Revenue Forgone in the Central Govt. Tax System due to Tax Breaks
Items
Revenue Forgone in
2009-10(in Rs Crore)
RevenueForegone as %of Aggregate
TaxCollectionin 2009-10
RevenueForegone as % of GDP in 2009-10
RevenueForegone in
2010-11(in Rs Crore)
RevenueForegone as %of Aggregate
TaxCollectionin 2010-11
RevenueForegone as % of GDP in 2010-11
Corporate Income Tax 72881 11.7 1.1 88263 11.2 1.1
Personal Income Tax 45142 7.2 0.7 50658 6.4 0.6
Excise Duty 169121 27.1 2.6 198291 25.2 2.5
Customs Duty 195288 31.3 3.0 174418 22.2 2.2
Total 482432 77.2 7.4 511630 65 6.5
Source: Statement of Revenue Forgone, Union Budget 2011-12, Govt. of India.
The effective tax rate in the manufacturing sector has been roughly equal tothat of the service sector. But, both the sectors show an effective tax rate well below the statutory rate. Not all kinds of tax exemptions/deductions/incentives can be eliminated; however, there could be a strong case for removing those exemptions which are benefiting mainly the privileged sections of population.
The revenue loss due to the deduction of profits of companies in IT, ITES, telecom and SEZs is almost three-fourth of the total revenue forgone under corporate tax. In fact, it is evident from the Receipts Budget for 2011-12 that the lowest effective tax rate is still paid by the IT-enabled service providers, BPO service providers and software development agencies. Not all of them can be eliminated, but some of these exemptions can be removed which are not justified anymore.
Also, the tax revenue forgone on luxury items such as diamond and gold has been reduced from the previous year;but there could still be a lot of scope for reducing these exemptions further.
In this context, the effectiveness of the proposed Direct Taxes Code, slated to be applicable from April 2012, would depend on the extent to which it can eliminate the plethora of exemptions.

Centre for Budget and Governance Accountability, 2011 83
Every Budget broadly consists of two parts, viz. (i) Expenditure Budget and (ii) Receipts Budget. The Expenditure Budget presents the information on how much the Government intends to spend and on what, in the next fiscal year. On the other hand, the Receipts Budget presents the information on how much the Government intends to collect as its financial resources for meeting its expenditure requirements and from which sources, in the next fiscal year.
Union Budget 2011-12Budget at a Glance
(In Crore of Rupees)
2009-10 Actuals@
2010 -2011Budget Estimates
2010 - 2011 Revised Estimates
2011-2012 Budget Estimates
1. Revenue Receipts 572811 682212 783833 789892
2. Tax Revenue (net to Centre) 456536 534094 563685 664457
3. Non-Tax Revenue 116275 148118 220148 125435
4. Capital Receipts (5+6+7) $ 451676 426537 432743 467837
5. Recoveries of Loans 8613 5129 9001 15020
6. Other Receipts 24581 40000 22744 40000
7. Borrowings and other Liabilities* 418482 381408 400998 412817
8. Total Receipts (1+4) $ 1024487 1108749 1216576 1257729
9. Non-Plan Expenditure 721096 735657 821552 816182
10. On Revenue Account of which, 657925 643599 726749 733558
11. Interest Payments 213093 248664 240757 267986
12. On Capital Account 63171 92058 94803 82624
13. Plan Expenditure 303391 373092 395024 441547
14. On Revenue Account 253884 315125 326928 363604
15. On Capital Account 49507 57967 68096 77943
16. Total Expenditure (9+13) 1024487 1108749 1216576 1257729
17. Revenue Expenditure (10+14) 911809 958724 1053677 1097162
18. Capital Expenditure (12+15) 112678 150025 162899 160567
19. Revenue Deficit (17 - 1) 338998 276512 269844 307270
20. Fiscal Deficit {16 - (1+5+6)} 418482 381408 400998 412817
21. Primary Deficit (20 - 11) 205389 132744 160241 144831
@ Actuals for 2008-09 are provisional. $ Does not include receipts in respect of Market Stabilization Scheme.* Includes draw-down of Cash Balance.
Source: www.indiabudget.nic.in

Centre for Budget and Governance Accountability, 201184
Classification of Government Interventions / Services
Economic Services: These are government services / functions which usually lead to income generating activities for people and promote the expansion of economic activities in the country.
Social Services: These services usually refer to the interventions by the Government which are expected to promote social development. Although better outcomes in the social sector, like better education and better health, also contribute towards economic development, this effect would be indirect and take more time to be realized.
General Services: The term General is meant to distinguish these services from the other two kinds of services, i.e. Economic and Social.
CLASSIFICATION EXAMPLES OF GOVT. SERVICES/ FUNCTIONSGeneral Services Interest Payments
Repayment of Debt (taken in the past)DefenceLaw and Order (Police)Running of Different Organs of the State Pensions
Economic Services AgricultureIrrigationIndustry and MineralsEmployment Generation ProgrammesTransport
Social Services EducationHealth & Family WelfareWater Supply & SanitationWelfare of Marginalised SectionsWelfare of Handicapped and Destitute PeopleYouth Affairs & Sports
Grants to Sub-national Governments Grants in Aid to StatesGrants in Aid to Union Territories
Note: This table illustrates only some of the services/ functions under the various heads. Please refer to the budget documents for a comprehensive list.
Classification of Government Receipts
Receipts Budget can be divided into two distinct categories viz. Revenue Receipts and Capital Receipts.
Capital Receipts: Capital Receipts lead to a reduction in the assets or an increase in the liabilities of the government. Capital Receipts need not come periodically in every Budget. - Capital Receipts that lead to a reduction in assets are Recoveries of Loans given by the government in the past,
and Earnings from Disinvestment in government owned enterprises. Capital Receipts through Debt lead to an increase in government’s liabilities.
Revenue Receipts: With this kind of receipts, there is no change in the asset-liability position of the government, i.e. a Revenue Receipt neither reduces the assets of the government nor increases its liabilities. Revenue Receipts consist of proceeds of total Tax and Non-Tax Revenues of the government.

Centre for Budget and Governance Accountability, 2011 85
Some examples of Revenue Receipts:- Receipts from Fees/ User Charges imposed by government; Dividend & Profits from government owned
enterprises (no effect on the size of the original asset of government); Revenue earned from the various types of Taxes
Classification of Revenue Receipts
- Tax Revenue and Non-Tax Revenue: The receipts of the Government through different types of taxes are collectively referred to as Tax Revenue. On the other hand, Interest receipts, Fees/ User Charges, and Dividend & Profits from Government Enterprises together constitute the Non-Tax Revenue of the Government. However, Recoveries of Loans, Earnings from Disinvestment, and Debt are distinguished from Revenue Receipts and are referred to as Capital Receipts.
- Direct and Indirect Taxes
Direct Taxes: Those taxes for which the tax-burden cannot be shifted or passed on are called Direct Taxes. What this means is: any person, who directly pays this kind of a tax to the Government, bears the burden of that particular tax. Examples of Direct Taxes are: Corporation Tax, Personal Income tax and Wealth Tax etc.
Indirect Taxes: Those taxes for which the tax-burden can be shifted or passed on are called Indirect Taxes. What this implies is: any person, who directly pays this kind of a tax to the Government, need not bear the burden of that particular tax; he/she can ultimately shift the tax-burden to other persons later through business transactions of goods/ services. Examples of Indirect Taxes are: Customs Duties, Excise Duties, Sales Tax, Service Tax etc.
Classification of Government Expenditure
Revenue and Capital Expenditure:
The entire Expenditure Budget can be divided into two distinct categories called: Revenue Expenditure and Capital Expenditure.
Capital Expenditure is usually meant for increasing the government’s assets or reducing its liabilities. - It is, however, not necessary that the assets created should be productive or they should even be revenue
generating. - Once the government decides to spend for the creation of an asset, Capital Expenditure bears all charges
for the first construction of the asset, while Revenue Expenditure bears all subsequent charges for its maintenance and all working expenses.
- Capital Expenditure of any type is usually not incurred regularly from every Budget. Hence, most kinds of Capital Expenditure are seen as non-recurring expenditure.
Some examples of Capital Expenditure:
- Government spends for building a new Factory (increase in assets)- Government gives a Loan to someone (increase in assets)- Government repays the Principal amount of a debt it had taken from someone (reduction of a liability)

Centre for Budget and Governance Accountability, 201186
Revenue Expenditure generally does not have anything to do with creation of assets or reduction of liabilities of the government. Most kinds of Revenue Expenditure are seen as recurring expenditure, since the government incurs those expenditure periodically from every Budget. Some examples of Revenue Expenditure:- Government pays the Interest charges due on a loan from International Monetary Fund (no effect on the
size of the original liability of Government)- Government expenditure on Food Subsidy (no effect on assets/ liabilities)- Government spending on Salary of its employees - Government spending on procurement of medicines for its hospitals- Government gives Grants to a sub-national government, which spends it to build Schools/ Hospitals (This
would not be reported as a Capital Expenditure in the Budget of the national Government as the national Government would not own the Schools/ Hospitals built!)
Plan and Non-Plan Expenditure
Plan Expenditure is meant for financing the development schemes formulated under the given Five Year Plan or the unfinished tasks of the previous Plans. Once a programme or scheme pursued under a specific Plan completes its duration, the maintenance cost and future running expenditures on the assets created or staff recruited are not regarded as Plan Expenditure.
Any expenditure of the government that does not fall under the category of Plan Expenditure is referred to as Non-Plan Expenditure. Sectors like Defence, Interest Payments, Pensions, Subsidies, Police, Audits etc. have only Non-plan Expenditure since these services are completely outside the purview of the Planning Commission; while sectors like Agriculture, Education, Health, Water & Sanitation etc. have both Plan and Non-plan Expenditure.
Different Categories of Plan Schemes
There are three different kinds of Plan Schemes, which are implemented in any State, viz. State Plan Schemes, Central Sector Schemes and Centrally Sponsored Schemes.
State Plan Schemes – The funds for State Plan Schemes are provided only by the State Government, with no ‘direct contribution’ from the Centre. However, the Centre may provide, at the recommendation of Planning Commission, some assistance to the State Government for its State Plan schemes, which is known as ‘Central Assistance for State & UT Plans’. Unlike Centre’s grants to a State under central schemes, the ‘Central Assistance for State & UT Plans’ cannot be tied to any conditionalities of the central government ministries.
Central Sector Schemes (also known as Central Plan Schemes) – The entire amount of funds for a Central Sector Scheme/ Central Plan Scheme is provided by the Central Government from the Union Budget. The State Government implements the Scheme, but it does not provide any funds for such a Scheme from its State Budget.
Centrally Sponsored Schemes – In case of a Centrally Sponsored Scheme, the Central Government provides a part of the funds and the State Government provides a matching grant for the Scheme. The ratio of contributions by the Centre and a State is pre-decided through negotiations between the two.
Deficit and Debt
The excess of government’s expenditure over its income is known as ‘Deficit’. Thus, deficit refers to a gap, and the Govt. takes Debt to cover that gap. Until late 1990s, Govt. of India could ask RBI to print money to cover a part of this Fiscal Deficit (called, Monetisation of Fiscal Deficit). But that practice has been discontinued.

Centre for Budget and Governance Accountability, 2011 87
Fiscal Deficit: Fiscal Deficit is the gap between the government’s total expenditure (including loans net of repayments) and its sum total of non-debt receipts. Thus, fiscal deficit indicates the total borrowing to be made by the government in a particular year.
Revenue Deficit: The gap between Revenue Expenditure of the Govt. and its Revenue Receipts is called the Revenue Deficit.
Primary Deficit: It is obtained by deducting interest payments from the fiscal deficit in the budget.
Budget Estimates (BE) and Revised Estimates (RE)
Let’s consider a new Budget being presented in Parliament. The estimates presented in this Budget for the approaching fiscal year would be called Budget Estimates (BE). The estimates presented in this Budget for the current/ ongoing fiscal year based on the disbursements in the first two to three Quarters of the fiscal year would be called as Revised Estimates (RE). However, the figures (of receipts and expenditure) for the previous fiscal year would be referred to as Actuals or Accounts.
Centre for Budget and Governance Accountability, 201188
NOTES
Centre for Budget and Governance Accountability, 2011 89
NOTES

Centre for Budget and Governance Accountability, 201190
NOTES