***update page count = fm + pages *** tcrp · san francisco, california. transit cooperative...
TRANSCRIPT
Energy Savings Strategies For Transit Agencies
TCRP SYNTHESIS 106
A Synthesis of Transit Practice
TRANSIT COOPERATIVE RESEARCH PROGRAM
Sponsored by
the Federal
Transit Administration
65+ pages; Perfect Bind with SPINE COPY (can reduce type to 12 pts); 1–64 pages; Saddlewire (NO SPINE COPY***UPDATE PAGE COUNT = FM + PAGES ***

TCRP OVERSIGHT AND PROJECT SELECTION COMMITTEE*CHAIR
KEITH PARKERMetropolitan Atlanta Rapid Transit Authority
MEMBERS
MICHAEL ALLEGRAUtah Transit AuthorityJOHN BARTOSIEWICZMcDonald Transit AssociatesRAUL BRAVORaul V. Bravo & AssociatesALICE CANNONJacksonville Transportation AuthorityJOHN CATOEThe Catoe GroupGRACE CRUNICANSan Francisco Bay Area Rapid Transit DistrictCAROLYN FLOWERSCharlotte Area Transit SystemANGELA IANNUZZIELLOAECOMPAUL JABLONSKISan Diego Metropolitan Transit SystemIAN JARVISSouth Coast British Columbia Transportation
AuthorityRONALD KILCOYNELane Transit DistrictRALPH LARISONHERZOGJOHN LEWISLYNX-Central Florida RTASHERRY LITTLESpartan Solutions LLCJONATHAN H. McDONALDAtkins North AmericaE. SUSAN MEYERSpokane Transit AuthorityBRADFORD MILLERPinellas Suncoast Transit AuthorityPETER ROGOFFFTARICHARD SARLESWashington Metropolitan Area Transit AuthorityJAMES STEMUnited Transportation UnionGARY THOMASDallas Area Rapid TransitMATTHEW O. TUCKERNorth County Transit DistrictPHILLIP WASHINGTONDenver Regional Transit DistrictPATRICIA WEAVERUniversity of Kansas
EX OFFICIO MEMBERS
MICHAEL P. MELANIPHYAPTAROBERT E. SKINNER, JR.TRBFREDERICK G. (BUD) WRIGHTAASHTOVICTOR MENDEZFHWA
TDC EXECUTIVE DIRECTOR
LOUIS SANDERSAPTA
SECRETARYCHRISTOPHER W. JENKSTRB
TRANSPORTATION RESEARCH BOARD 2013 EXECUTIVE COMMITTEE*
OFFICERSChair: Deborah H. Butler, Executive Vice President, Planning, and CIO, Norfolk Southern
Corporation, Norfolk, VA Vice Chair: Kirk T. Steudle, Director, Michigan DOT, LansingExecutive Director: Robert E. Skinner, Jr., Transportation Research Board
MEMBERSVICTORIA A. ARROYO, Executive Director, Georgetown Climate Center, and Visiting Professor,
Georgetown University Law Center, Washington, DCSCOTT E. BENNETT, Director, Arkansas State Highway and Transportation Department, Little RockWILLIAM A. V. CLARK, Professor of Geography (emeritus) and Professor of Statistics (emeritus),
Department of Geography, University of California, Los AngelesJAMES M. CRITES, Executive Vice President of Operations, Dallas–Fort Worth International
Airport, TXMALCOLM DOUGHERTY, Director, California Department of Transportation, SacramentoJOHN S. HALIKOWSKI, Director, Arizona DOT, PhoenixMICHAEL W. HANCOCK, Secretary, Kentucky Transportation Cabinet, FrankfortSUSAN HANSON, Distinguished University Professor Emerita, School of Geography, Clark
University, Worcester, MA STEVE HEMINGER, Executive Director, Metropolitan Transportation Commission, Oakland, CACHRIS T. HENDRICKSON, Duquesne Light Professor of Engineering, Carnegie Mellon University,
Pittsburgh, PAJEFFREY D. HOLT, Managing Director, Bank of Montreal Capital Markets, and Chairman, Utah
Transportation Commission, Huntsville, UTGARY P. LaGRANGE, President and CEO, Port of New Orleans, LAMICHAEL P. LEWIS, Director, Rhode Island DOT, ProvidenceJOAN McDONALD, Commissioner, New York State DOT, AlbanyDONALD A. OSTERBERG, Senior Vice President, Safety and Security, Schneider National, Inc.,
Green Bay, WISTEVE PALMER, Vice President of Transportation, Lowe’s Companies, Inc., Mooresville, NCSANDRA ROSENBLOOM, Director, Innovation in Infrastructure, The Urban Institute,
Washington, DCHENRY G. (GERRY) SCHWARTZ, JR., Chairman (retired), Jacobs/Sverdrup Civil, Inc., St. Louis, MOKUMARES C. SINHA, Olson Distinguished Professor of Civil Engineering, Purdue University,
West Lafayette, INDANIEL SPERLING, Professor of Civil Engineering and Environmental Science and Policy;
Director, Institute of Transportation Studies; University of California, DavisGARY C. THOMAS, President and Executive Director, Dallas Area Rapid Transit, Dallas, TXPHILLIP A. WASHINGTON, General Manager, Regional Transportation District, Denver, CO
EX OFFICIO MEMBERSREBECCA M. BREWSTER, President and COO, American Transportation Research Institute,
Marietta, GA ANNE S. FERRO, Administrator, Federal Motor Carrier Safety Administration, U.S. DOT LeROY GISHI, Chief, Division of Transportation, Bureau of Indian Affairs, U.S. Department of the
Interior, Washington, DCJOHN T. GRAY II, Senior Vice President, Policy and Economics, Association of American
Railroads, Washington, DCMICHAEL P. HUERTA, Administrator, Federal Aviation Administration, U.S. DOT DAVID T. MATSUDA, Administrator, Maritime Administration, U.S. DOT MICHAEL P. MELANIPHY, President and CEO, American Public Transportation Association,
Washington, DCVICTOR M. MENDEZ, Administrator, Federal Highway Administration, U.S. DOT ROBERT J. PAPP (Adm., U.S. Coast Guard), Commandant, U.S. Coast Guard, U.S. Department of
Homeland SecurityLUCY PHILLIPS PRIDDY, Research Civil Engineer, U.S. Army Corps of Engineers, Vicksburg, MS,
and Chair, TRB Young Members Council, Washington, DCCYNTHIA L. QUARTERMAN, Administrator, Pipeline and Hazardous Materials Safety Administration,
U.S. DOTPETER M. ROGOFF, Administrator, Federal Transit Administration, U.S. DOTDAVID L. STRICKLAND, Administrator, National Highway Traffic Safety Administration, U.S. DOTJOSEPH C. SZABO, Administrator, Federal Railroad Administration, U.S. DOTPOLLY TROTTENBERG, Under Secretary for Policy, U.S. DOT ROBERT L. VAN ANTWERP (Lt. General, U.S. Army), Chief of Engineers and Commanding
General, U.S. Army Corps of Engineers, Washington, DCBARRY R. WALLERSTEIN, Executive Officer, South Coast Air Quality Management District,
Diamond Bar, CA GREGORY D. WINFREE, Acting Administrator, Research and Innovative Technology
Administration, U.S. DOTFREDERICK G. (BUD) WRIGHT, Executive Director, American Association of State Highway and
Transportation Officials, Washington, DC
*Membership as of April 2013.*Membership as of July 2013.

T R A N S I T C O O P E R A T I V E R E S E A R C H P R O G R A M
TCRP SYNTHESIS 106
TRANSPORTATION RESEARCH BOARDWASHINGTON, D.C.
2013www.TRB.org
Research Sponsored by the Federal Transit Administration in Cooperation with the Transit Development Corporation
SubScriber categorieS
Environment • Energy • Public Transportation
Energy Savings Strategies For Transit Agencies
A Synthesis of Transit Practice
conSultant
Frank Gallivan
ICF International
San Francisco, California

TRANSIT COOPERATIVE RESEARCH PROGRAM
The nation’s growth and the need to meet mobility, environmental, and energy objectives place demands on public transit systems. Current systems, some of which are old and in need of upgrading, must expand service area, increase service frequency, and improve efficiency to serve these demands. Research is necessary to solve operating problems, to adapt appropriate new technologies from other industries, and to introduce innovations into the transit industry. The Transit Cooperative Research Program (TCRP) serves as one of the principal means by which the transit industry can develop innovative nearterm solutions to meet demands placed on it.
The need for TCRP was originally identified in TRB Special Report 213—Research for Public Transit: New Directions, published in 1987 and based on a study sponsored by the Federal Transit Admin istration (FTA). A report by the American Public Transportation Association (APTA), Transportation 2000, also recognized the need for local, problemsolving research. TCRP, modeled after the longstanding and successful National Cooperative Highway Research Program, undertakes research and other technical activities in response to the needs of transit service providers. The scope of TCRP includes a variety of transit research fields including planning, service configuration, equipment, fa cilities, operations, human resources, maintenance, policy, and ad ministrative practices.
TCRP was established under FTA sponsorship in July 1992. Proposed by the U.S. Department of Transportation, TCRP was authorized as part of the Intermodal Surface Transportation Efficiency Act of 1991 (ISTEA). On May 13, 1992, a memorandum agreement outlining TCRP operating procedures was executed by the three cooperating organizations: FTA, the National Academy of Sciences, acting through the Transportation Research Board (TRB); and the Transit Development Corporation, Inc. (TDC), a nonprofit educational and research organization established by APTA. TDC is responsible for forming the independent governing board, designated as the TCRP Oversight and Project Selection (TOPS) Committee.
Research problem statements for TCRP are solicited periodically but may be submitted to TRB by anyone at any time. It is the responsibility of the TOPS Committee to formulate the re search program by identifying the highest priority projects. As part of the evaluation, the TOPS Committee defines funding levels and expected products.
Once selected, each project is assigned to an expert panel, ap pointed by TRB. The panels prepare project statements (requests for proposals), select contractors, and provide technical guidance and counsel throughout the life of the project. The process for developing research problem statements and selecting research agencies has been used by TRB in managing cooperative re search programs since 1962. As in other TRB activ ities, TCRP project panels serve voluntarily without com pensation.
Because research cannot have the desired impact if products fail to reach the intended audience, special emphasis is placed on disseminating TCRP results to the intended end users of the re search: transit agencies, service providers, and suppliers. TRB provides a series of research reports, syntheses of transit practice, and other supporting material developed by TCRP research. APTA will arrange for workshops, training aids, field visits, and other activities to ensure that results are implemented by urban and rural transit industry practitioners.
The TCRP provides a forum where transit agencies can cooperatively address common operational problems. The TCRP results support and complement other ongoing transit research and training programs.
TCRP SYNTHESIS 106
Project J7, Topic SA29ISSN 10734880ISBN 9780309270830Library of Congress Control Number 2013934450
© 2013 National Academy of Sciences. All rights reserved.
COPYRIGHT INFORMATION
Authors herein are responsible for the authenticity of their materials and for obtaining written permissions from publishers or persons who own the copyright to any previously published or copyrighted material used herein.
Cooperative Research Programs (CRP) grants permission to reproduce material in this publication for classroom and notforprofit purposes. Permission is given with the understanding that none of the material will be used to imply TRB, AASHTO, FAA, FHWA, FMCSA, FTA, or Transit Development Corporation endorsement of a particular product, method, or practice. It is expected that those reproducing the material in this document for educational and notforprofit uses will give appropriate acknowledgment of the source of any reprinted or reproduced material. For other uses of the material, request permission from CRP.
NOTICE
The project that is the subject of this report was a part of the Transit Co operative Research Program, conducted by the Transportation Research Board with the approval of the Governing Board of the National Research Council.
The members of the technical panel selected to monitor this project and to review this report were chosen for their special competencies and with regard for appropriate balance. The report was reviewed by the technical panel and accepted for publication according to procedures established and overseen by the Transportation Research Board and approved by the Governing Board of the National Research Council.
The opinions and conclusions expressed or implied in this report are those of the researchers who performed the research and are not necessarily those of the Transportation Research Board, the National Research Council, or the program sponsors.
The Transportation Research Board of the National Academies, the National Research Council, and the sponsors of the Transit Cooperative Research Program do not endorse products or manufacturers. Trade or manufacturers’ names appear herein solely because they are considered essential to the object of the report.
Published reports of the
TRANSIT COOPERATIVE RESEARCH PROGRAM
are available from:
Transportation Research BoardBusiness Office500 Fifth Street, NWWashington, DC 20001
and can be ordered through the Internet at http://www.nationalacademies.org/trb/bookstore
Printed in the United States of America
The National Academy of Sciences is a private, nonprofit, self-perpetuating society of distinguished schol-ars engaged in scientific and engineering research, dedicated to the furtherance of science and technology and to their use for the general welfare. On the authority of the charter granted to it by the Congress in 1863, the Academy has a mandate that requires it to advise the federal government on scientific and techni-cal matters. Dr. Ralph J. Cicerone is president of the National Academy of Sciences.
The National Academy of Engineering was established in 1964, under the charter of the National Acad-emy of Sciences, as a parallel organization of outstanding engineers. It is autonomous in its administration and in the selection of its members, sharing with the National Academy of Sciences the responsibility for advising the federal government. The National Academy of Engineering also sponsors engineering programs aimed at meeting national needs, encourages education and research, and recognizes the superior achieve-ments of engineers. Dr. Charles M. Vest is president of the National Academy of Engineering.
The Institute of Medicine was established in 1970 by the National Academy of Sciences to secure the services of eminent members of appropriate professions in the examination of policy matters pertaining to the health of the public. The Institute acts under the responsibility given to the National Academy of Sciences by its congressional charter to be an adviser to the federal government and, on its own initiative, to identify issues of medical care, research, and education. Dr. Harvey V. Fineberg is president of the Institute of Medicine.
The National Research Council was organized by the National Academy of Sciences in 1916 to associate the broad community of science and technology with the Academy’s purposes of furthering knowledge and advising the federal government. Functioning in accordance with general policies determined by the Acad-emy, the Council has become the principal operating agency of both the National Academy of Sciences and the National Academy of Engineering in providing services to the government, the public, and the scientific and engineering communities. The Council is administered jointly by both Academies and the Institute of Medicine. Dr. Ralph J. Cicerone and Dr. Charles M. Vest are chair and vice chair, respectively, of the National Research Council.
The Transportation Research Board is one of six major divisions of the National Research Council. The mission of the Transportation Research Board is to provide leadership in transportation innovation and progress through research and information exchange, conducted within a setting that is objective, interdisci-plinary, and multimodal. The Board’s varied activities annually engage about 7,000 engineers, scientists, and other transportation researchers and practitioners from the public and private sectors and academia, all of whom contribute their expertise in the public interest. The program is supported by state transportation departments, federal agencies including the component administrations of the U.S. Department of Transporta-tion, and other organizations and individuals interested in the development of transportation. www.TRB.org
www.national-academies.org
TOPIC PANEL SA-29EDWARD A. BEIMBORN, University of Wisconsin–MilwaukeeCHRISTINE GERENCHER, Transportation Research BoardTODD HEMINGSON, Capital Metropolitan Transportation Authority, Austin, TXWENDELL KRELL, San Joaquin Regional Transit District, Stockton, CADAVID A. LEE, Connecticut Transit, Hartford, CTBENNETT POWELL, KFH Group, Inc., Austin, TXMATTHEW SIBUL, Utah Transit Authority, Salt Lake CityMICHAEL WHITTEN, Manchester (NH) Transit AuthorityMATTHEW LESH, Federal Transit Administration (Liaison)DWIGHT A. FERRELL, Metropolitan Atlanta Rapid Transit Authority (Liaison)
SYNTHESIS STUDIES STAFFSTEPHEN R. GODWIN, Director for Studies and Special ProgramsJON M. WILLIAMS, Program Director, IDEA and Synthesis StudiesJO ALLEN GAUSE, Senior Program OfficerGAIL R. STABA, Senior Program OfficerDONNA L. VLASAK, Senior Program OfficerTANYA M. ZWAHLEN, ConsultantDON TIPPMAN, Senior EditorCHERYL KEITH, Senior Program AssistantDEMISHA WILLIAMS, Senior Program AssistantDEBBIE IRVIN, Program Associate
COOPERATIVE RESEARCH PROGRAMS STAFFCHRISTOPHER W. JENKS, Director, Cooperative Research ProgramsCRAWFORD F. JENCKS, Deputy Director, Cooperative Research ProgramsGWEN CHISHOLM SMITH, Senior Program OfficerEILEEN P. DELANEY, Director of Publications
TCRP COMMITTEE FOR PROJECT J-7
CHAIRDWIGHT A. FERRELL, Metropolitan Atlanta Rapid Transit Authority, Atlanta, GA
MEMBERSDEBRA W. ALEXANDER, Capital Area Transportation Authority, Lansing, MIDONNA DeMARTINO, San Joaquin Regional Transit District, Stockton, CAMICHAEL FORD, Ann Arbor Transportation AuthorityMARK W. FUHRMANN, Metro Transit–Minneapolis/St. Paul, MNBOBBY J. GRIFFIN, Griffin and Associates, Flower Mound, TXROBERT H. IRWIN, Consultant, Sooke, AB, CanadaJEANNE KRIEG, Eastern Contra Costa Transit Authority, Antioch, CAPAUL J. LARROUSSE, Rutgers, The State University of New Jersey, New BrunswickDAVID A. LEE, Connecticut Transit, Hartford, CTBRADFORD J. MILLER, Pinellas Suncoast Transit Authority, St. Petersburg, FLELIZABETH PRESUTTI, Des Moines Area Regional Transit Authority-DARTROBERT H. PRINCE, JR., AECOM Consulting Transportation Group, Inc., Boston, MA
FTA LIAISONJARRETT W. STOLTZFUS, Federal Transit Administration
APTA LIAISONSAMANTHA SMITH, American Public Transportation Association
TRB LIAISONJENNIFER A. ROSALES, Transportation Research Board
Cover Photo: Hybridelectric bus line, Minneapolis, Minnesota. Courtesy: www.shutterstock.com.
FOREWORD
PREFACEBy Donna L. Vlasak
Senior Program OfficerTransportation
Research Board
This synthesis describes how transit agencies in the United States and Canada are reducing their energy use. This is being done not only by providing alternatives to travel in personal vehicles but also in other categories of energy savings strategies such as those dealing with vehicle technologies; vehicle operations, maintenance, and service design; nonrevenue vehicles; stations and stops; building; indirect energy use; and renewable power generation. These strategies can reduce both an agency’s costs and its’ environmental footprint, and some can also improve service quality.
A review of the relevant literature of a variety of academic and professional publications was conducted for this effort. A selected survey of 51 respondents out of 74 transportation providers located in large metro, small urban, and rural areas yielded a 69% response rate. Four transit providers highlighted more indepth and additional details on successful practices, challenges, and lessons learned: Southeastern Pennsylvania Transportation Authority, Philadelphia, Pennsylvania; King County Metro Transit, Seattle, Washington; Foothill Transit, West Covina, California; and 9 Town Transit, Connecticut River Estuary, Connecticut.
Frank Gallivan, ICF International, San Francisco, California, collected and synthesized the information and wrote the report, under the guidance of a panel of experts in the subject area. The members of the topic panel are acknowledged on the preceding page. This synthesis is an immediately useful document that records the practices that were acceptable within the limitations of the knowledge available at the time of its preparation. As progress in research and practice continues, new knowledge will be added to that now at hand.
Transit administrators, engineers, and researchers often face problems for which information already exists, either in documented form or as undocumented experience and practice. This information may be fragmented, scattered, and unevaluated. As a consequence, full knowledge of what has been learned about a problem may not be brought to bear on its solution. Costly research findings may go unused, valuable experience may be overlooked, and due consideration may not be given to recommended practices for solving or alleviating the problem.
There is information on nearly every subject of concern to the transit industry. Much of it derives from research or from the work of practitioners faced with problems in their daytoday work. To provide a systematic means for assembling and evaluating such useful information and to make it available to the entire transit community, the Transit Cooperative Research Program Oversight and Project Selection (TOPS) Committee authorized the Transportation Research Board to undertake a continuing study. This study, TCRP Project J7, “Synthesis of Information Related to Transit Problems,” searches out and synthesizes useful knowledge from all available sources and prepares concise, documented reports on specific topics. Reports from this endeavor constitute a TCRP report series, Synthesis of Transit Practice.
This synthesis series reports on current knowledge and practice, in a compact format, without the detailed directions usually found in handbooks or design manuals. Each report in the series provides a compendium of the best knowledge available on those measures found to be the most successful in resolving specific problems.

CONTENTS
1 SUMMARY
3 CHAPTER ONE INTRODUCTION
Synthesis Purpose, 3
Study Methodology, 3
Organization of Synthesis, 4
5 CHAPTER TWO ENERGY USE AT TRANSIT AGENCIES
Energy Used for Vehicle Propulsion, 5
Measuring Energy Use in Vehicles, 5
Energy Used in Facilities, 6
Comparing Transit with Other Transportation Modes, 6
8 CHAPTER THREE PLANNING FOR ENERGY SAVINGS
AT TRANSIT AGENCIES
Strategic Planning for Energy Saving Strategies, 8
Evaluating and Selecting Strategies, 11
Financing Energy Savings, 14
Barriers to Strategy Implementation, 16
18 CHAPTER FOUR STRATEGIES THAT SAVE ENERGY
AT TRANSIT AGENCIES
Transit Vehicle Technologies, 18
Vehicle Operations, Maintenance, and Service Design, 26
NonRevenue Vehicle Strategies, 30
Energy at Stations and Stops, 31
Energy Savings in Other Facilities, 33
Strategies to Reduce Indirect Energy Use in Facilities, 38
Renewable Power Generation, 40
Summary of Energy Saving Strategies, 42
Opportunities to Save Energy at Different Types of Transit Agencies, 45
46 CHAPTER FIVE TRANSIT AGENCY SUCCESS STORIES (CASE EXAMPLES)
Southeastern Pennsylvania Transportation Authority, 46
King County Metro Transit, 49
Foothill Transit, 51
9 Town Transit, 53
Common Themes, 53
55 CHAPTER SIX CONCLUSIONS

57 REFERENCES
60 APPENDIX A SURVEY
67 APPENDIX B SURVEY PARTICIPANTS
Note: Many of the photographs, figures, and tables in this report have been converted from color to grayscale for printing. The electronic version of the report (posted on the Web at www.trb.org) retains the color versions.
ENERGY SAVINGS STRATEGIES FOR TRANSIT AGENCIES
Transit agencies can help individuals reduce energy use by providing alternatives to travel in personal vehicles. They also consume significant amounts of energy providing this ser-vice. Reducing energy consumed by transit agencies can lower costs, reduce environmental impacts, and improve customer service.
This study describes how transit agencies are reducing energy use and is based on survey responses from 51 diverse agencies across the country, a literature review of a variety of academic and professional publications, and case examples of four agencies.
Transit agencies use energy to power, clean, maintain, and repair their revenue and non-revenue vehicles. They also use energy to provide heating, cooling, and electricity to stations, stops, administrative buildings, garages, and other facilities. Finally, agencies indirectly con-sume energy embodied in construction materials, water, and waste. These different uses of energy represent opportunities for transit agencies to reduce their energy use and expenditures through strategies that range from the very simple (such as switching to more energy-efficient light bulbs) to more complicated (such as operating a wind farm on agency right-of-way). These strategies can reduce both an agency’s costs and its environmental footprint, and some can also improve service quality.
Agencies wishing to implement energy-saving strategies are also interested in how to strategically plan for energy savings, including how to measure energy savings and how to finance strategies that require significant upfront investment. More than half of agencies surveyed have developed or are developing policy statements related to energy, and many also have goals and objectives related to the reduction of energy use. Key findings related to strategy planning and implementation included:
• Instead of creating specific plans to reduce energy use a number of agencies have articu-lated their energy goals in the context of sustainability or climate action plans.
• Environmental management systems are helping some agencies improve performance across a variety of environmental indicators, including energy use. These systems, and the training that is available to help agencies implement them, help build sustainability concerns into the institutional structure of an agency. They also provide valuable data that helps agencies apply for funding and select effective strategies moving forward.
• Agencies vary in the degree to which they quantify energy savings from the various strat-egies and in the formality of these evaluation procedures. Some agencies have conducted comprehensive prospective evaluations of energy-saving options in order to select the most effective strategies, whereas others only analyze strategies on an ad hoc basis using readily available data. Additionally, some strategies better lend themselves to measure-ment and estimation than others—for example, projecting alternative energy generation is easier than estimating fuel savings from a transit signal prioritization project.
• Although some energy-saving strategies save money in the long term, agencies often find the upfront costs required for many strategies to be a significant challenge and that it can take a long time to realize savings for some strategies. Many have used funding from federal grant programs to purchase new or retrofit existing vehicles, install renewable energy projects, and improve energy efficiency at facilities.
SUMMARY

2
• Lack of staff expertise and information on strategy effectiveness are significant barriers to energy-saving strategies and need to be addressed through further research.
• In addition to grant funding, some agencies are able to form collaborative partnerships with utilities, renewable energy companies, or energy performance contractors to perform energy efficiency retrofits or install renewable energy at transit facilities. These partnerships allow agencies to pay back upfront costs using savings from energy efficiency measures.
• In many agencies that have successfully implemented energy-saving strategies, respon-sibility for developing and implementing energy conservation projects does not reside within a single department but with staff from different departments, a committee, or a sustainability coordinator who works across divisions. This arrangement helps identify synergies between strategies and engages all departments in sustainability efforts.
• A number of the most effective strategies for reducing emissions rely on technologies that have emerged relatively recently and may become accessible to more agencies in the future.
• Agencies are interested in resources to help them understand the impact of available strategies and in what strategies might best fit their particular context based on agency size, services operated, and geographic locations. Smaller agencies could benefit from resources that help them identify low-cost feasible options.
• Many agencies recognize the importance of energy to their operations, and two-thirds of those surveyed reported that their boards of directors consider reducing energy costs to be important.
All but one of the transit agencies that responded to the survey were implementing energy-saving strategies from one or more of the seven categories identified in this report. Table 1 summarizes these seven categories, with examples of strategies from each category.
Category Examples of Strategies
Transit Vehicle Technologies Hybrid-electric and battery-powered buses
Efficient heating and lighting systems
Regenerative braking for rail systems
Lightweighting vehicles
Vehicle Operations, Maintenance, and
Service Design
Idle reduction policies
Driver training
Route design
Signal prioritization
Non-Revenue Vehicle Efficiency Strategies Hybrid-electric vehicles
Driver training
Reducing fleet size
Energy Savings at Stations and Stops Energy-efficient lighting
Energy-efficient escalators
Solar energy generation
Energy Saving Strategies for Buildings Energy-efficient lighting
Green building certification
Energy management systems
Strategies to Reduce Indirect Energy Use Employee commute programs
Recycled construction materials
Low-flow water fixtures
Recycling programs
Renewable Power Generation Solar power installations
Wind power
Geothermal
TABLE 1CATEGORIES OF ENERGY SAVING STRATEGIES AND EXAMPLE STRATEGIES
3
STUDY METHODOLOGY
This synthesis is based on a literature review, a survey of tran-sit agencies, and four follow-up interviews with selected agen-cies, which were used to develop case examples. The literature review covered a broad range of publication types and sources, including national-level reports from TRB, APTA, and FTA, as well as academic papers, Department of Energy analyses of par-ticular technologies, awards from recent federal grant programs, and transit agency reports on sustainability and energy use.
The survey for this report was conducted in January and February 2012 and was distributed to 74 transit agencies across the United States, as well as to one Canadian agency. It was administered online and distributed by e-mail. Prior to dis-tribution, members of the TCRP synthesis panel tested the survey and it was updated to reflect their comments. Appen-dix A contains the full text of the survey. Survey recipients were selected based on panel member suggestions and on the consultant’s knowledge of transit agencies that are active in this field. The transit agencies that responded varied widely in terms of agency size, geographic location, and type of transit services that they provided.
The survey was sent to one contact at each agency. Con-tacts generally represented environmental departments, depart-ments of operations and maintenance, or agency management. Recipients were asked to supply the appropriate agency contact if they were not the correct individual to complete the survey. Agencies that did not initially respond received a follow-up e-mail and a follow-up phone call. In total, 51 agencies responded to the survey, a 69% response rate. Some agencies submitted responses that had been completed with input from multiple individuals or departments, whereas others submitted responses from a single person.
It should be noted that the survey likely overrepresents agencies with active energy-savings programs, because these agencies were targeted as survey recipients. Also, agencies with energy-savings programs were probably more inclined to com-plete the survey than agencies with little activity to report. Nev-ertheless, the survey and the large number of responses present an overall picture of the emerging energy-saving technologies and strategies used in the transit industry. Appendix B contains a complete list of survey respondents. Figure 1 shows the loca-tion and size of the agencies that responded to the survey.
SYNTHESIS PURPOSE
Rising energy prices, budget constraints, and concerns about energy independence, sustainability, and climate change have put pressure on all sectors of the economy to use energy as efficiently as possible. This is particularly true in the trans-portation sector, which accounts for approximately 28% of U.S. energy consumption (1). Frequent, unpredictable fluc-tuations in gasoline prices have compelled individuals, busi-nesses, and transportation agencies to conserve fuel in order to both save money in the short term and stabilize costs in the long term.
Individuals often seek to save money on fuel and reduce environmental impacts by taking transit instead of driving. It takes significant amounts of energy to construct, operate, and maintain transit systems; therefore, the degree to which this shift yields a net reduction in energy use and fuel costs depends on how efficient transit systems are. From a tran-sit agency’s perspective, using energy more efficiently not only lowers costs, but also enhances service and draws more users, increasing overall system efficiency as well as improv-ing public perception.
This synthesis provides information for transit agencies on the role that energy plays in all aspects of transit service, the strategies that are available to reduce energy consump-tion, the potential magnitude of those reductions, and how to strategically plan and implement energy-saving measures. Although some transit agencies may have sustainability or greenhouse gas (GHG) reduction goals that explicitly call for reducing energy use, other agencies may be interested solely in spending less on fueling vehicles and on operating maintenance facilities, transit stations, and office buildings. This latter set of concerns is ever more important as agency budgets become more constrained and transit agencies strive to avoid service cuts or fare increases.
This report draws on existing research and transit agency experience to provide a comprehensive look at energy-saving strategies related to vehicle propulsion, system maintenance, powering stations or stops, and administrative vehicles and buildings. Some of these strategies are specific to transit agen-cies, whereas others, particularly those related to administrative vehicles and buildings, draw on more general best practices in green building and energy efficiency.
chapter one
INTRODUCTION

4
The survey asked transit agencies to describe which energy-saving strategies they used, the extent to which each strategy had been successful, and any data that could be used to measure the impacts of strategies. In addition, the survey asked agen-cies about their strategic planning process in identifying and executing energy-saving strategies, challenges encountered in implementing these strategies, and motivations for select-ing particular strategies. The survey covered a broad range of topics, and some contacts were not fully knowledgeable about every aspect of their agency’s energy-saving activities; there-fore, it is possible that some agencies are engaged in activities that they did not report. Where survey contacts suggested other staff members for possible follow-up, these staff members were contacted and asked for additional information.
Four agencies that completed the survey were selected for interviews to develop case examples of how specific tran-sit agencies deploy and manage energy-saving strategies: the Southeastern Pennsylvania Transportation Authority (SEPTA) in Philadelphia, Pennsylvania: King County Metro Transit Authority (King County Metro) in Seattle, Washing-ton; Foothill Transit in California’s San Gabriel Valley; and 9 Town Transit (9TT) in the Connecticut River Estuary region. They were selected to represent a range of sizes, locations, and organizational structures. Each of the four case examples incorporated a review of any available agency documentation
about sustainability or energy savings and an approximate hour-long phone interview.
ORGANIZATION OF SYNTHESIS
The synthesis report is divided into the following chapters:
• Chapter two—introduces information and key concepts related to how transit agencies use energy, including the impacts of transit on the general public’s energy consumption.
• Chapter three—discusses how transit agencies plan for, implement, and finance energy-saving strategies. It addresses some of the common barriers that transit agen-cies face in implementing these strategies and identifies creative ways of overcoming them.
• Chapter four—describes seven categories of actions that transit agencies can take to save energy based on the literature review and survey of agencies, and provides information about the energy savings and costs of actions where available.
• Chapter five—presents case examples of four transit agencies that are developing and implementing strate-gies to save energy.
• Chapter six—provides conclusions and suggestions for further research.
Case Example: KingCounty Metro Transit,Seattle, WA
Case Example:SoutheasternPennsylvaniaTransportation Authority,Philadelphia, PA
Case Example: 9 TownTransit, EstuaryRegion, CT
Case Example: FoothillTransit, West Covina, CA
FIGURE 1 Location and size of transit agencies responding to the survey.
5
The types of fuels that transit vehicles use shape the opportunities for energy conservation. The U.S. transit fleet is powered by a combination of diesel fuel, electricity, natural gas, and gasoline, as shown Table 2, with each service mode using a different mix of fuels. Generally speaking, ferries and buses primarily use diesel fuel or gasoline, whereas most rail systems are powered by electricity. Together these fuel types account for 81% of the total energy consumed by transit. Compressed natural gas (CNG) accounts for another 12%.
MEASURING ENERGY USE IN VEHICLES
Transit agencies can measure energy used in transit vehicles in several ways. Typically, transit agencies measure energy in terms of the amount of fuel or electricity consumed by vehi-cles. Fuel and electricity consumption represent operational or pump-to-wheel energy use. A certain amount of additional energy, commonly called well-to-pump or upstream energy, is also required to extract, refine, and transport fuel used in vehi-cles or at power plants. Well-to-wheel energy consumption combines both well-to-pump and pump-to-wheel energy use. Although well-to-wheel energy consumption is not routinely measured, it is an important factor when considering some types of energy-saving strategies for transit agencies. For example, switching from diesel fuel to biodiesel has impacts on well-to-wheel energy consumption that will be of inter-est to transit agencies considering their total environmental impacts. This synthesis generally discusses simple fuel con-sumption or pump-to-wheel energy use; however, well-to-wheel impacts are referenced where data are available.
Transit agencies can also measure energy use in several types of units. Liquid fuels, including gasoline and diesel, are measured in gallons. Electricity is measured in kilowatt-hours (kWh). CNG is sometimes measured in cubic feet. However, using these units can make it difficult to compare energy use between transportation modes that use different fuel types. Therefore, it is useful to convert fuel consumption to standard units such as British Thermal Units (BTUs) or Gasoline Gallon Equivalents. Table 3 shows the conversion factors between var-ious fuel measurement units and both BTUs and Gasoline Gal-lon Equivalents. Although this synthesis makes an effort to use common units for energy use wherever possible, it is important that transit agencies be conversant in all types of units.
When tracking and reporting energy use, agencies some-times track both total energy use and energy use normalized per
Transit agencies in the United States operate hundreds of thousands of vehicles, as well as thousands of transit sta-tions and maintenance facilities, in order to take millions of passengers to their destinations each day. This is an energy-intensive undertaking every step of the way. As a result, tran-sit agencies have many opportunities to reduce their energy use or to increase their energy efficiency. They also have many incentives to do so. Reducing energy use saves money, reduces environmental impacts, and improves energy security for transit agencies. Promoting energy savings can also help transit agencies improve the public’s opinion of their services.
This chapter explores how transit agencies use energy for different purposes and discusses crucial concepts in transit energy use and energy savings.
ENERGY USED FOR VEHICLE PROPULSION
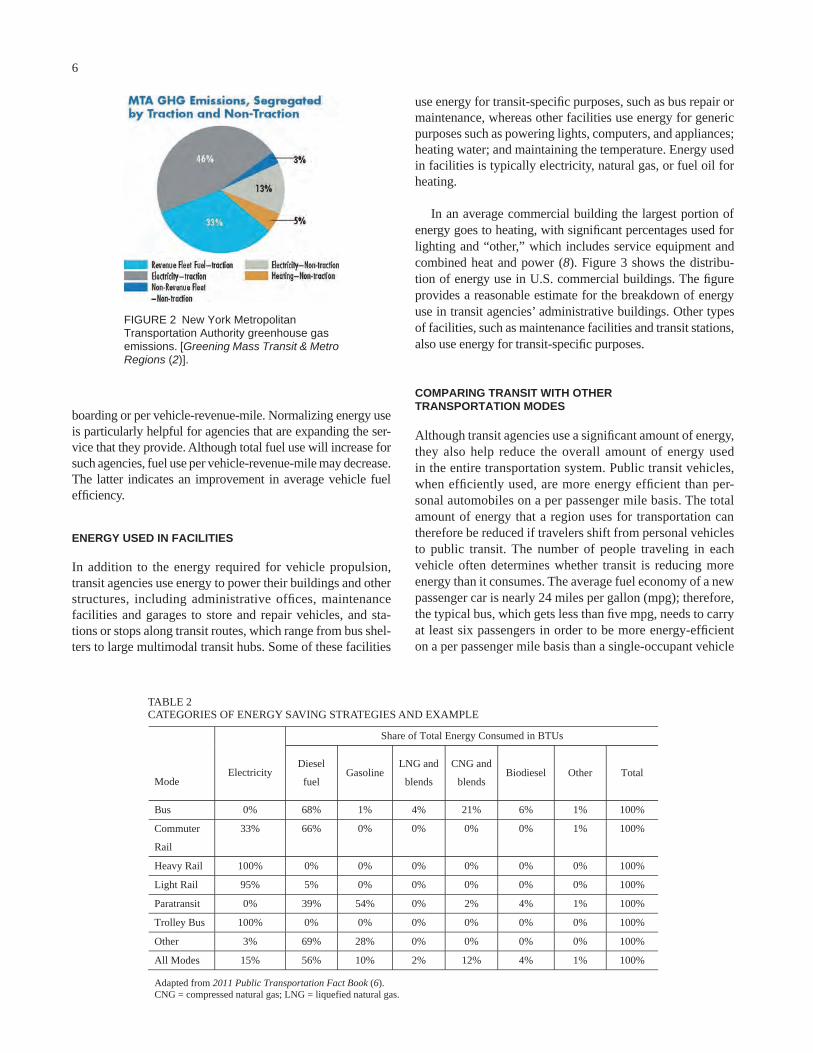
The vast majority of the energy that transit agencies consume is used to move vehicles. Figure 2 details the sources of GHG emissions produced by the New York Metropolitan Trans-portation Authority (NYMTA). Because GHG emissions are highly correlated with energy use, the chart is a reasonable proxy for the amount of NYMTA’s total energy use attributed to the use of vehicles (traction) and facilities (non-traction). In total, 79% of the GHG emissions produced—and a similar share of the energy consumed—is attributed to transit vehicles.
Although similar statistics are not widely available for other transit agencies, the proportion of total energy used for propul-sion may well be higher for other transit systems. Smaller agen-cies do not have as many non-traction energy users, including bus and rail stations, which consume energy for lighting, equip-ment, and climate control.
Energy purchases are also a significant item in transit agencies’ budgets. For example, the Los Angeles Metropoli-tan Transportation Authority (LA Metro) spends $21 million annually (almost 2% of the agency’s operating budget) on electricity to power rail lines (3). The agency spends a simi-lar amount each year to fuel its buses (4). For all of its tran-sit railcar propulsion needs, NYMTA spends approximately $237 million annually (about 3% of its operating budget) on electricity (5). Although these energy expenditures do not represent a large proportion of these agencies’ total operat-ing budgets, they nonetheless suggest opportunities to save millions of dollars a year through energy conservation.
chapter two
ENERGY USE AT TRANSIT AGENCIES
6
boarding or per vehicle-revenue-mile. Normalizing energy use is particularly helpful for agencies that are expanding the ser-vice that they provide. Although total fuel use will increase for such agencies, fuel use per vehicle-revenue-mile may decrease. The latter indicates an improvement in average vehicle fuel efficiency.
ENERGY USED IN FACILITIES
In addition to the energy required for vehicle propulsion, transit agencies use energy to power their buildings and other structures, including administrative offices, maintenance facilities and garages to store and repair vehicles, and sta-tions or stops along transit routes, which range from bus shel-ters to large multimodal transit hubs. Some of these facilities
use energy for transit-specific purposes, such as bus repair or maintenance, whereas other facilities use energy for generic purposes such as powering lights, computers, and appliances; heating water; and maintaining the temperature. Energy used in facilities is typically electricity, natural gas, or fuel oil for heating.
In an average commercial building the largest portion of energy goes to heating, with significant percentages used for lighting and “other,” which includes service equipment and combined heat and power (8). Figure 3 shows the distribu-tion of energy use in U.S. commercial buildings. The figure provides a reasonable estimate for the breakdown of energy use in transit agencies’ administrative buildings. Other types of facilities, such as maintenance facilities and transit stations, also use energy for transit-specific purposes.
COMPARING TRANSIT WITH OTHER TRANSPORTATION MODES
Although transit agencies use a significant amount of energy, they also help reduce the overall amount of energy used in the entire transportation system. Public transit vehicles, when efficiently used, are more energy efficient than per-sonal automobiles on a per passenger mile basis. The total amount of energy that a region uses for transportation can therefore be reduced if travelers shift from personal vehicles to public transit. The number of people traveling in each vehicle often determines whether transit is reducing more energy than it consumes. The average fuel economy of a new passenger car is nearly 24 miles per gallon (mpg); therefore, the typical bus, which gets less than five mpg, needs to carry at least six passengers in order to be more energy-efficient on a per passenger mile basis than a single-occupant vehicle
FIGURE 2 New York Metropolitan Transportation Authority greenhouse gas emissions. [Greening Mass Transit & Metro Regions (2)].
Mode Electricity
Share of Total Energy Consumed in BTUs
Diesel
fuel Gasoline
LNG and
blends
CNG and
blends Biodiesel Other Total
Bus 0% 68% 1% 4% 21% 6% 1% 100%
Commuter
Rail
33% 66% 0% 0% 0% 0% 1% 100%
Heavy Rail 100% 0% 0% 0% 0% 0% 0% 100%
Light Rail 95% 5% 0% 0% 0% 0% 0% 100%
Paratransit 0% 39% 54% 0% 2% 4% 1% 100%
Trolley Bus 100% 0% 0% 0% 0% 0% 0% 100%
Other 3% 69% 28% 0% 0% 0% 0% 100%
All Modes 15% 56% 10% 2% 12% 4% 1% 100%
Adapted from 2011 Public Transportation Fact Book (6). CNG = compressed natural gas; LNG = liquefied natural gas.
TABLE 2CATEGORIES OF ENERGY SAVING STRATEGIES AND EXAMPLE

7
(9, 10). Meanwhile, a bus filled to capacity uses less fuel per passenger mile than a personal car with four passengers (9). Although transit agencies can reduce energy use by imple-menting energy-efficient vehicle technologies, improving service to attract new riders or consolidating service to elimi-nate wasteful routes can also increase energy efficiency sub-stantially on a per passenger basis.
Transit also helps to reduce congestion, which in turn reduces energy use, because vehicles operate more efficiently in free-flowing conditions. Finally, transit service may encour-age more compact development patterns, which reduces aver-age trip lengths and can make alternative modes such as biking or walking more appealing.
Collectively known as displaced energy use, these effects are considered all-important when conducting a comprehen-sive assessment of transit’s impacts on energy use. However, several other research papers have explored the impacts of transit on mode shift, congestion, and compact development. This report focuses on the actions that transit agencies are taking to reduce their own energy consumption.
Fuel Type Unit of Measure BTU/Unit Gasoline Gallon
Equivalent (GGE)
Gasoline (regular) gallon 114,100 1.00 gallon
Diesel #2 gallon 129,500 0.88 gallon
Biodiesel (B100) gallon 118,300 0.96 gallon
Biodiesel (B20) gallon 127,250 0.90 gallon
Compressed Natural Gas (CNG) cubic foot 900 126.67 cu. ft.
Liquid Natural Gas (LNG) gallon 75,000 1.52 gallon
Propane (LPG) gallon 84,300 1.35 gallon
Ethanol (E100) gallon 76,100 1.50 gallon
Ethanol (E85) gallon 81,800 1.39 gallon
Methanol (M100) gallon 56,800 2.01 gallon
Methanol (M85) gallon 65,400 1.74 gallon
Electricity kilowatt hour (kWh)
3,400 33.56 kWh
“Gasoline Gallon Equivalent Definition” (7) [Online]. Available: https://www.afdc.energy.gov/afdc/prep/popups/gges.html [accessed May 7, 2012].
TABLE 3CONVERSION FACTORS AND ENERGY INTENSITY BY FUEL TYPE
Lighting20%
Space Heating16%
Space Cooling15%
Ventilation9%
Refrigeration7%
Water Heating4%
Electronics4%
Computers4%
Cooking1%
Other (5)15%
Unattributed5%
FIGURE 3 Energy use in commercial buildings (BTUs) 2010. (Adapted from “3.1.4—Commercial Sector Energy Consumption,” Buildings Energy Data Book (8) [Online]. Available: http://buildingsdatabook.eren.doe.gov/default.aspx.
8
Selecting and prioritizing actions to save energy is a challenge for transit agencies. These agencies must balance a number of considerations, including short-term and long-term cost impli-cations, impacts on operations, and—for all but the smallest agencies—achieving buy-in across multiple operating units. Strategic planning and dedicated management structures for energy and environmental issues can help. The following chapter discusses the ways that transit agencies can plan for energy savings, analyze and select strategies, and finance the investments required.
STRATEGIC PLANNING FOR ENERGY SAVING STRATEGIES
As sustainability becomes an increasing concern in the transit industry, more agencies are examining ways of organizing envi-ronmental and energy programs by creating new management structures or incorporating sustainability and energy concerns into existing ones. Some of the primary ways that agencies do this include internal policies, sustainability or energy plans, environmental management systems (EMS), and environmen-tal and sustainability management systems (ESMS).
Internal Policy Development
A number of agencies have created internal policy documents or plans related to sustainability, which generally incorporate a desire to improve energy efficiency or reduce energy use—over half of the survey respondents had developed or are developing an agency policy statement related to energy, and just under half have developed or are developing an energy or sustainability plan. Policy statements often include a general commitment to sustainability or to some element of sustain-ability such as resource conservation or improved energy efficiency. Sustainability plans take these statements one step further by outlining specific activities for the agency to pur-sue, with goals, performance measures, and accompanying performance targets. Such policies and plans have several benefits for the agency; they establish clear intentions related to energy and sustainability, lay out steps to achieve those intentions, and indicate some degree of internal agreement or support from decision makers. For example, the board of directors of Sound Transit, which serves King, Pierce, and Snohomish counties in Washington State, adopted a Sustain-ability Initiative in 2007. This initiative established focus areas to improve the sustainability of the agency. Building on the Initiative, Sound Transit’s 2011 Sustainability Plan defines a specific set of coordinated strategies in the cate-
gories of ridership, conservation, and operating efficiency. These categories were selected to reflect the triple bottom line of sustainability: equity, environment, and economy. The plan set out long-term (20-year) targets for performance, relative to baseline performance in 2010. Specific energy-related per-formance measures are provided in Table 4.
The plan includes a list of potential performance metrics, including percentage of construction contractors with energy or GHG reduction plans in place; energy use per depart-ment, facility, and mode; ENERGY STAR ratings for facili-ties; percentage of recycled materials used in construction projects; cost of recycled materials used for operations as a percentage of operations materials; and staff awareness of sustainability plan implementation.
Sound Transit’s plan also delineates a management struc-ture and responsibilities for achieving these targets in an organized and cost-effective way as indicated in Table 5. The plan identifies distinct roles for the agency’s Chief Executive Officer (CEO), executive directors, sustainability manager, and other staff.
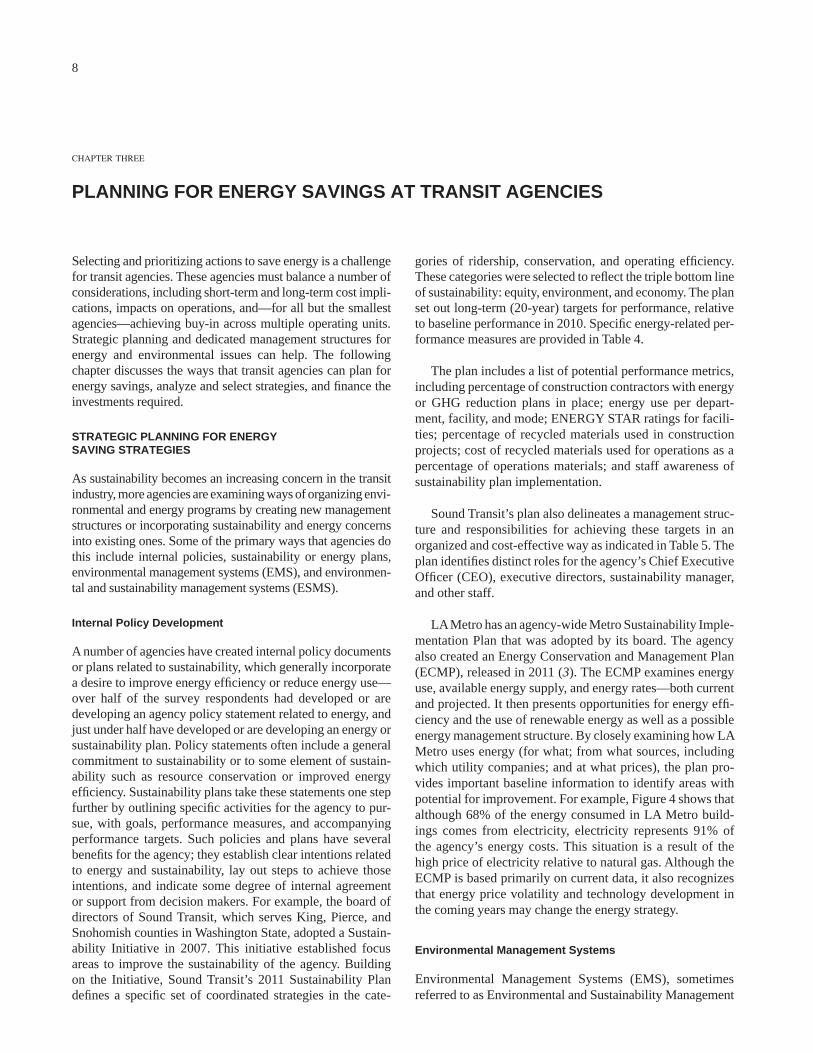
LA Metro has an agency-wide Metro Sustainability Imple-mentation Plan that was adopted by its board. The agency also created an Energy Conservation and Management Plan (ECMP), released in 2011 (3). The ECMP examines energy use, available energy supply, and energy rates—both current and projected. It then presents opportunities for energy effi-ciency and the use of renewable energy as well as a possible energy management structure. By closely examining how LA Metro uses energy (for what; from what sources, including which utility companies; and at what prices), the plan pro-vides important baseline information to identify areas with potential for improvement. For example, Figure 4 shows that although 68% of the energy consumed in LA Metro build-ings comes from electricity, electricity represents 91% of the agency’s energy costs. This situation is a result of the high price of electricity relative to natural gas. Although the ECMP is based primarily on current data, it also recognizes that energy price volatility and technology development in the coming years may change the energy strategy.
Environmental Management Systems
Environmental Management Systems (EMS), sometimes referred to as Environmental and Sustainability Management
chapter three
PLANNING FOR ENERGY SAVINGS AT TRANSIT AGENCIES

9
Goal Targets (long-term) Performance Measures
Save Energy
All fleets deploy the most fuel-efficient, clean, and cost-effective vehicles that optimize the use of proven technology.
40% of GHG emissions are reduced (per vehicle-revenue-mile).
Electricity use is carbon neutral.
Energy use
GHG emissions
Percent electricity from renewable sources
Criteria air pollutant emissions
Protect Ecosystems
One percent of indoor and outdoor water use is reduced (per vehicle-revenue-mile) on average per year.
Total ecosystem functions are improved.
Low impact development treats 100% of stormwater in new facilities.
Water use Number of native plantings
Use Less, Buy Green
100% of the waste stream is diverted from landfills.
100% of purchases are assessed for environmentally preferable products.
Sound Transit is a “paperless office.”
Waste to landfill Percent waste diverted to recycling/composting
Number of pesticides/harmful toxics used
Paper use
Sound Transit Sustainability Plan (11) [Online]. Available: http://www.soundtransit.org/Documents/pdf/about/environment/SustainabilityPlan.pdf.
TABLE 4SOUND TRANSIT SUSTAINABILITY TARGETS
TABLE 5LEADERSHIP STRUCTURE FOR SOUND TRANSIT SUSTAINABILITY PLAN
Position Role and Authority in Sustainability Plan Implementation
CEO Initiating Sponsor:
Ultimately ensures that Sustainability Initiative and Plan is implemented.
Executive Director, Planning,
Environment and Project
Development Department
Executive Sponsor:
Takes overall responsibility, as delegated by CEO.
Oversees plan implementation and integration.
Champions and empowers the Sustainability Committee.
Executive Leadership Team
Director, Office of Environmental
Affairs and Sustainability
Sustaining Sponsors:
Ensure staff are assigned responsibility and empowered to accomplish the
Sustainability Plan.
Address applicable sustainability priorities and initiatives in the three-year
business plan and scorecard.
Ensure departments meet annual sustainability targets.
Sustainability Manager,
Office of Environmental Affairs and
Sustainability
Single Point of Accountability:
Oversees plan development, management, and implementation.
Directs the work of the Sustainability Committee.
Manages the Environmental and Sustainability Management System.
Sustainability Steering Committee
Staff, Office of Environmental
Affairs and Sustainability
Implementers:
Advance the Sustainability Plan by making policy recommendations.
Work with departments to ensure that near-term initiatives are addressed
in three-year business plans and scorecards.
Develop and approve the annual sustainability targets.
Review and approve plans, procedures, and continual improvement actions
related to the environment.
CEO = chief executive officer. Sound Transit Sustainability Plan (11) [Online].Available: http://www.soundtransit.org/Documents/pdf/about/environment/SustainabilityPlan.pdf.
10
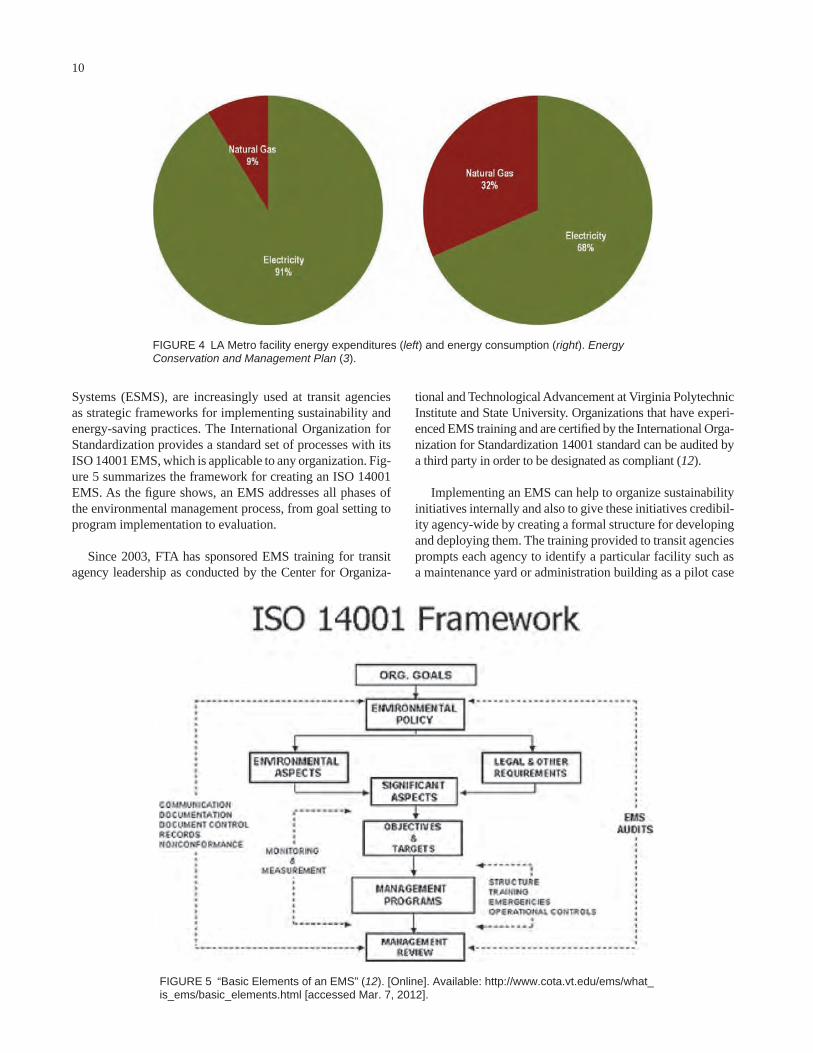
Systems (ESMS), are increasingly used at transit agencies as strategic frameworks for implementing sustainability and energy-saving practices. The International Organization for Standardization provides a standard set of processes with its ISO 14001 EMS, which is applicable to any organization. Fig-ure 5 summarizes the framework for creating an ISO 14001 EMS. As the figure shows, an EMS addresses all phases of the environmental management process, from goal setting to program implementation to evaluation.
Since 2003, FTA has sponsored EMS training for transit agency leadership as conducted by the Center for Organiza-
tional and Technological Advancement at Virginia Polytechnic Institute and State University. Organizations that have experi-enced EMS training and are certified by the International Orga-nization for Standardization 14001 standard can be audited by a third party in order to be designated as compliant (12).
Implementing an EMS can help to organize sustainability initiatives internally and also to give these initiatives credibil-ity agency-wide by creating a formal structure for developing and deploying them. The training provided to transit agencies prompts each agency to identify a particular facility such as a maintenance yard or administration building as a pilot case
FIGURE 4 LA Metro facility energy expenditures (left) and energy consumption (right). Energy Conservation and Management Plan (3).
FIGURE 5 “Basic Elements of an EMS” (12). [Online]. Available: http://www.cota.vt.edu/ems/what_is_ems/basic_elements.html [accessed Mar. 7, 2012].

11
of an energy audit and help pay for energy efficiency retrofits generally has few drawbacks for a transit agency. Absent any special funding opportunities, identifying a transit agency’s best strategies to save energy requires some research and analysis. Making informed decisions about energy-saving opportunities requires understanding the energy savings that are likely to result, the costs to implement the strategy, and the co-benefits of the strategy. Most methods for sav-ing energy involve some type of upfront investment that the agency will recoup over time. The upfront cost and the vol-ume of energy savings determine how short or long the pay-back period will be. (Specific examples of payback periods for various strategies appear in chapter four.) Ideally, transit agencies could conduct a comparison of multiple strategies to determine investment priorities.
Evaluating Energy Savings
For some strategies, evaluating energy savings is relatively straightforward. For example, more efficient lights or appli-ances that cost the same as conventional equipment but require less energy to operate will produce predictable sav-ings. For other strategies, estimation of energy savings is more complex. For example, the impact of improved vehicle maintenance on vehicle fuel economy may depend on the operator’s driving habits, the age of the vehicle, and the traf-fic conditions and topography of the route. Agencies can look to published literature and the experience of other agencies or conduct their own pilot studies to develop estimates of energy savings for such strategies.
Figure 6 shows the proportion of survey respondents implementing each type of strategy that have information about the impacts of those strategies. Half of respondents with power generation or vehicle technology strategies have evalu-ated their impacts in some way. Power generation strategies are generally implemented for the sole purpose of reducing the use of grid-based energy, and evaluating renewable power strategies is fairly straightforward, since energy saved is the same as energy generated. To evaluate the energy impacts of
to test and practice the management structure. Agencies then designate “environmental significant aspects” of the facility to manage, such as electricity use, fuel consumption, idling, or recycling. For these aspects, the EMS helps to set objec-tives, targets, an evaluation process, and designates responsi-bility for tasks. The structure also sets up documentation and evaluation systems to help agencies improve their EMS (13).
Of the agencies responding to the survey, two-fifths have or are establishing an EMS. Several agencies mentioned the importance of the FTA’s training program in improving man-agement of environmental systems. For example, the South-eastern Pennsylvania Transportation Authority (SEPTA) found that its EMS process was key to obtaining buy-in from other departments and to moving projects forward to save energy and reduce the agency’s environmental impact. SEPTA’s EMS has created a forum where projects can be vetted, and has helped to engage agency staff in developing solutions to energy and environment-related problems. Using the analytical process developed through EMS training, agency staff has been able to make a business case for projects that might otherwise have been ignored.
Utah Transit Authority (UTA) reports that achieving EMS certification has helped to open doors for the agency to other sustainability-related groups. The agency now participates in the Utah Clean Cities Coalition, reports to The Climate Regis-try, and has signed on to APTA’s Sustainability Commitment. Participation in these groups allows the agency to keep up to date on new developments that can help to improve its energy performance. Other agencies that have taken EMS training include the Washington Metropolitan Area Transit Author-ity (WMATA), Massachusetts Bay Transportation Authority, Miami–Dade Transit, and city of Asheville Transit (13).
EVALUATING AND SELECTING STRATEGIES
In some cases, transit agencies pursue isolated opportunities for energy savings that clearly fit agency goals. For example, taking advantage of a state rebate program to cover the cost
21
1316
9 107 6
3 3
05
10152025
Number of agencies using a strategy who have information onits impacts
FIGURE 6 Respondents with information about impacts by strategy category.
12
Payback Periods
Payback periods are defined as the amount of time it takes for money saved from reduced energy use to completely offset the upfront investment required to implement an energy-saving technology or strategy. Payback periods can be estimated prior to an investment based on an understanding of expected sav-ings; however, actual payback periods vary depending on the performance of the project and fluctuations in energy prices.
Life-Cycle Cost Analysis
Life-cycle analysis examines the net costs to the agency over the expected lifetime of an investment. For a bus technology, these costs include procurement, fuel use, maintenance, any related infrastructure upgrades, and perhaps decommission-ing and disposal costs at the end of the vehicle’s life. A new bus technology may also generate some new revenue or cost savings, such as savings on maintenance or grant funding to support clean bus technologies. Life-cycle costs are typi-cally calculated on an average annual basis and sometimes compare costs across competing investments that may have different lifespans.
Cost-Effectiveness
A cost-effectiveness analysis compares the net cost of an investment with the impact of the investment on energy sav-ings (or another goal). For example, strategies can be com-pared in terms of their total cost per BTU of energy saved. For agencies with specific goals to reduce energy consump-tion, a cost-effectiveness metric can help to prioritize invest-ments to meet those goals.
There are many different ways to structure analyses of costs. It is important that such an analyses be tailored to the specific purpose and financial and environmental goals of the agency and provide a consistent means to evaluate all com-peting strategies.
The San Mateo Transit Authority (SamTrans) calculated the NPV of the cost and savings streams of multiple potential GHG reduction strategies from 2010 to 2020. Many of these are also strategies designed to reduce energy consumption. Strategies that have positive NPVs are presented in Figure 7. These strategies would generate net cost savings for the agency by 2020.
Co-Benefits of Strategies
The primary benefit of reducing energy consumption for a transit agency is derived from the reduction in funds spent on energy in the form of fuel or electricity. However, agencies and the traveling public may realize other benefits from strat-egies to save energy. A few of these benefits are listed here.
vehicle technologies an agency can use fuel records or esti-mates of vehicle fuel efficiency. To evaluate strategies asso-ciated with energy used in buildings, agencies can rely on metered electricity records or industry estimates the energy consumption of individual technologies. Other types of strate-gies have been evaluated less frequently, probably because of the challenges of doing so and their relatively small impacts. A number of strategies can contribute minor improvements to vehicle fuel efficiency, including driver training and anti-idling (vehicle maintenance and operations strategies) and stop spacing and off-board fare payment (service design strat-egies); however, tracking the impacts of such strategies can be difficult. Some other types of strategies reduce an agency’s energy use only indirectly (for more information on the dis-tinction between direct and indirect energy use see “Strate-gies to Reduce Indirect Energy Use in Facilities”) and as such their specific energy impacts may be of lesser interest. These include recycling construction waste and sourcing materials locally (see chapter four, Construction Materials) and pro-moting teleworking (see chapter four, Employee Commute Programs).
Before evaluating the impact of specific strategies agen-cies can identify assets that are using energy inefficiently, as these are likely to be the most likely to yield the most savings. Comprehensive energy audits for facilities provide informa-tion about the energy intensity (expressed as energy use per square foot) of facilities. Comparing the energy intensity of various facilities highlights facilities that may be using more energy than necessary. An example of this type of evaluation is provided in this chapter (see “Internal Policy Develop-ment”); LA Metro’s evaluation of the energy intensity of all of its buildings revealed a considerable difference between different buildings with similar functions.
Although evaluating the energy savings from various strategies is important for strategic planning purposes, there remains a knowledge gap concerning the impacts of many strategies. Inadequate resources to conduct comprehensive evaluations is almost certainly a factor.
Evaluating Costs
There are a variety of closely related techniques for evaluating the costs of energy-saving investments. These include cost-benefit analysis, return on investment, sustainable return on investment, and life-cycle analysis. Many of these techniques make use of net present value (NPV), which allows for com-parisons of streams of costs and savings over multiple years. Some of the costs and benefits that might be evaluated for any strategy include costs of purchasing equipment, maintenance costs over the equipment lifetime (including labor), savings from reduced energy use, and available grants or incentive programs. This synthesis does not contain a comprehensive explanation of cost evaluation techniques, but does offer a summary of key concepts.

13
Energy Savings as a Co-Benefit
Some strategies undertaken primarily to improve service or reduce costs can generate energy savings as a co-benefit. For example, an agency may improve travel times on its routes by respacing stops and giving buses priority at traffic signals in order to improve customers’ experience. These changes will likely also save energy for the agency, because they will reduce the amount of fuel spent idling in traffic and at bus stops.
Comparing Strategies
Ideally, energy-saving transit agencies would compare multi-ple energy-saving strategies in terms of costs, energy savings, and co-benefits in order to select strategies for implementa-tion. At present only a few transit agencies have conducted this kind of analysis. There are a variety of metrics that can be used to compare strategies, such as total energy saved, pay-back period, dollars per unit of energy saved, and energy sav-ings per vehicle-revenue-mile. Again, agencies should select metrics that align with their own financial and environmental goals and decision-making processes.
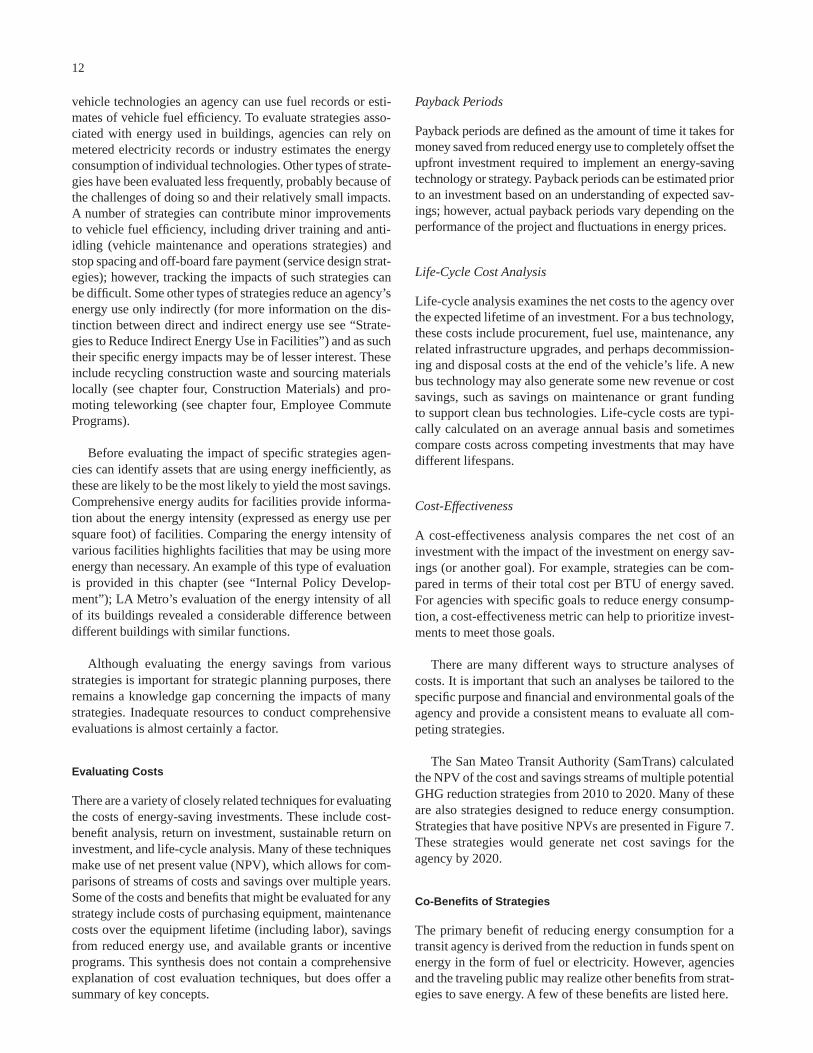
Bay Area Rapid Transit (BART) in San Francisco com-pared a series of possible retrofits with existing rail cars. Figure 8 shows the results of this analysis. BART’s results demonstrate the different possible rankings of strategies depending on the metric used. For example, ultracapacitors for regenerative braking energy storage would save the most energy for the agency; however, the payback period for this
Air Quality Improvements
Improvements in fuel economy will typically reduce tailpipe emissions that can affect local or regional air quality and consequently public health. In particular, alternative fuels such as CNG, liquefied petroleum gas (LPG or propane), and some biofuels burn cleaner than traditional diesel and emit fewer nitrogen oxides (NOx) and particulate matter. Hybrid vehicles of any kind will also reduce emissions through reduced fuel use.
GHG Emissions Reduction
Most energy used by transit agencies is derived from fossil fuels, which is consumed in vehicles, generators, and gas-fired boilers and furnaces, as well as in power plants supply-ing electricity to buildings and trains. Activities that reduce an agency’s use of energy generally also reduce its GHG emis-sions. Several agencies with sustainability plans that target energy use also have goals to reduce agency GHG emissions.
Improvement in Public Image
Transit agencies can enhance their public image by making energy-saving strategies visible to the public. Transit agen-cies already offer “green” transportation, since a highly occu-pied transit vehicle is a more energy efficient way to travel than a single-occupancy vehicle. Strategies to make transit agencies more energy efficient and environmentally friendly can be effective marketing tools to attract new customers.
$216,651
$196,085
$39,612
$24,799
$16,739
$7,730
$7,328
$5,342
$929
$125
$49
$0 $50,000 $100,000 $150,000 $200,000 $250,000
Enhance Recycling (50% Diversion)
Reduce Dead-Head Miles (8% reduction)
Building retrocommissioning
Occupancy Sensors Lighting Control
Efficient Non Revenue Vehicle Future
Desktop Computer Management
Efficient Non Revenue Vehicle Past
Energy Efficient lighting
Employer Outreach Compressed WW
Employer Outreach TDM Programs
Solar Thermal Installation
FIGURE 7 SamTrans’ identified strategies with a positive annualized net present value. TDM = Transportation Demand Management; WW = work week. [Draft Sustainable Return on Investment (SROI) Analysis for SamTrans: An Assessment of Building and Transportation Strategies (14)].
14
strategy is considerably longer than that for other strategies owing in part to the large upfront investment required (15). BART’s comparison of strategies highlights the tradeoff between smaller initial cost outlays and smaller eventual savings on one hand and larger initial cost outlays and larger savings on the other hand.
LA Metro performed a cost-effectiveness study of strate-gies to reduce GHG emissions, many of which would also save energy. This analysis looked at the cost per metric ton of carbon dioxide equivalent (MTCO2e) reduced over a range of options and organized them by both cost-effectiveness and total possible reduction in emissions (see Table 6). Some strategies that would generate cost savings for the agency reduce relatively small amounts of energy use, such as the Red Line Tunnel Lighting Retrofit. Strategies that would save large amounts of energy can generate cost savings on a life-cycle basis (such as on-board railcar energy storage) or require large net cost outlays (such as wayside energy stor-age substations).
FINANCING ENERGY SAVINGS
Many strategies that will ultimately reduce a transit agency’s energy use and save money have significant upfront costs. Given the limited budgets at many transit agencies, it is often critical to find creative ways of financing these improve-ments. Available funding sources include federal grants, as part of the 2009 stimulus program, as well as the continuing Transportation Investments Generating Economic Recovery (TIGER) and Transit Investments for Greenhouse Gas and Energy Reduction (TIGGER) programs, state and regional incentives programs, financing agreements with utilities, and partnerships with the private sector. Agencies can also make use of their own capital and operating funds to implement strategies.
Federal Grant Programs
In recent years, several federal programs have helped agen-cies deploy energy-saving technologies by covering all or
FIGURE 8 Savings and costs for retrofitted BART cars. Source: BASE Energy, Inc., Energy Efficiency Assessment of Bay Area Rapid Transit (BART) Train Cars (15).

15
buildings. FTA also allocates funds to transit agencies through the Federal Clean Fuels Grant Program. Grants under this program have helped transit agencies to purchase new hybrid and electric buses or to retrofit existing buses with new technologies.
State Funds and Incentives
Some states provide funding or incentive programs to assist public agencies and even individuals and private businesses in making energy efficiency improvements. For example, the Connecticut Energy Efficiency Fund, through small charges on utility bills, provides a variety of rebate opportunities for residents, businesses, and municipalities who purchase energy-efficient lighting, appliances, or other equipment (19). Similarly, the California Energy Commission provides a variety of rebates and loan programs that transit agencies can access to pay for upgrades and retrofits. Some agen-cies have also received grant money from state environmen-tal agencies. For example, SEPTA received partial funding for its Wayside Energy Storage System (WESS) through the Pennsylvania Department of Environmental Protection (see chapter five, Southeastern Pennsylvania Transportation Authority).
most of the costs of technology purchase and installation. Five of the agencies surveyed specifically mentioned using one or more of these grant programs.
The American Recovery and Reinvestment Act of 2009 (ARRA) provided funding for a wide variety of transpor-tation projects covering all modes. FTA alone awarded 1,072 grants for more than $8.78 billion (17). Similarly, the U.S.DOT has provided more than $2.5 billion in discretion-ary grants under multiple funding rounds of the TIGER pro-gram (18). Several transit agencies surveyed or covered in the literature review used ARRA or TIGER funds for energy-savings initiatives.
Another federal discretionary grant program—the TIGGER program—has more specifically targeted energy use in transit agencies. TIGGER has provided funding to transit agencies, state departments of transportation, and tribal governments for capital investments that help to reduce energy consump-tion or GHG emissions. TIGGER grants ($225 million over three funding rounds to date) have funded projects such as renewable energy installations, fuel cells, vehicle purchases and retrofits, technology upgrades to increase efficiency or allow for energy storage, and improvements to heating, ventilation, and air conditioning (HVAC) systems at agency
GHG Benefit Cost Savings/Cost Neutral Moderate Cost ($300–
$600 per ton) High Cost (>$1,000 per ton)
Large GHG Benefit
(>10,000
MTCO2e/year)
Ridesharing/transit
programs for employers
Transit-oriented
development
Vanpool subsidy
On-board railcar energy
storage
Expand rail and bus rapid
transit systems
Wayside energy storage
substations
Moderate GHG Benefit
(1,000–10,000
MTCO2e/year)
45-foot composite buses
Facility lighting
efficiency
Metro employee transit
subsidy
Bicycle paths along transit
corridors
Gasoline–electric hybrid
buses
Small GHG Benefit
(<1,000 MTCO2e/year)
Red Line Tunnel lighting
retrofit
Hybrid non-revenue cars
Recycled water for bus
washing
Low water sanitary
fixtures
Solar panels
Bike-to-transit
commuter incentives
Hybrid non-revenue light
trucks
Greenhouse Gas Emissions Cost Effectiveness Study (16, p. 2).
TABLE 6LA METRO SUMMARY OF STRATEGY COST-EFFECTIVENESS AND MAXIMUM ANNUAL EMISSION REDUCTION
16
BARRIERS TO STRATEGY IMPLEMENTATION
Transit agencies confront a variety of challenges to implement-ing energy-saving strategies. Analyzing, selecting, and imple-menting strategies requires staff time and sometimes support from consultants. The upfront costs of strategies can also be prohibitively high. The latter was cited most frequently as a barrier to implementation by respondents to the survey, as shown in Table 7. The length of time that it takes to realize benefits can also be a challenge, because benefit streams affect the payback period for the investment. Other challenges men-tioned by survey respondents included the difficulty of measur-ing actual energy savings after implementation and the limited control over the energy performance of leased buildings.
Agencies need staff resources to identify, research, and implement innovations. A separate study conducted in 2005 on service and management innovations at transit agencies provided some results that are also relevant to energy-saving innovations. This study included a survey of transit agencies focusing on their experiences with innovative practices. After initial cost and operating cost, internal leadership was the next most important factor for transit agencies when considering innovations. Agency staff probably provided the internal leadership referenced, as only 2% of respondents cited a sug-gestion from their board as the primary reason for change. Lack of personnel was the next most important concern (20).
Upfront Investment Costs
As explained previously, financing energy savings involves upfront investment costs. Some strategies have low upfront costs and quick payback periods. These include changing to more efficient light bulbs or implementing anti-idling policies. Such strategies are likely to be easy to justify to an agency’s management. Other strategies with significant benefits can cost millions of dollars to implement and take significant resources in terms of staff time to deploy. For example, BART identified the cost of using ultracapacitors of regenerative braking energy storage as $94.7 million dollars (15). Agencies
Financing Agreements with Utilities and Third Party Energy Companies
Utility companies increasingly offer programs to help transit agencies finance energy efficiency improvements by using energy savings to pay off an initial investment cost. With this model the utility, or a third party energy service company, provides the initial investment on behalf of the agency. The agency then pays back the money owed using the amount that they save on their energy bills. The agency’s energy bill does not decrease until the energy efficiency upgrade has been paid off. This type of arrangement is known as energy perfor-mance contracting or the Energy Service Company (ESCO) model. Some states have specific authorizing legislation or state sanctioned programs that allow for public agencies to engage in this type of contract. For example, the Pennsyl-vania Guaranteed Energy Savings Act allows for an agency to enter into an agreement with an ESCO, which provides technical expertise and performs energy efficiency upgrades, and a third-party lender, that provides upfront capital costs. The lender and the ESCO are paid back through the energy saved, and the ESCO guarantees the level of energy savings per year over a period of ten to 15 years. Maryland has a similar program, and NYMTA has financed projects through a similar agreement with the New York Power Authority.
Some transit agencies have similar partnerships with renew-able energy developers. For example, a renewable energy developer might construct and own a renewable energy instal-lation on property owned by a transit agency. The transit agency then purchases the electricity generated by the developer. This model allows developers to initiate new projects with guaran-teed demand from creditworthy, public sector entities, while the transit agencies are able to purchase renewable energy without shouldering the upfront installation costs. BART used this approach to install a 2.5 MW system on district property (Fred Schultz, BART, personal communication, 2012).
Use of Agency Funds
Agencies can also pay for strategies to save energy using their own capital and operating funds. Forty percent of sur-vey respondents who provided information about how they finance energy savings use capital funds for at least some of their energy-saving projects or programs. However, sev-eral noted that agency funds were only used for relatively inexpensive upgrades with short payback periods. Financing more expensive projects with an agency’s own funding is most likely only a viable option for larger agencies.
A final option for funding energy efficiency projects is for an agency to set up a revolving loan fund. Using this approach, seed money is invested in one or more energy-saving projects that generate cost savings over time. The money saved through these projects then goes back into the fund and can be used to finance a new set of projects.
What challenges has your agency experienced
with implementing energy saving strategies?
Please check all that apply.
Response
Count
Upfront costs required to implement strategies 35
Time required to realize benefits from strategies 26
Lack of internal expertise or staff time available 21
Lack of decision-maker/stakeholder support 10
Unsure of strategy effectiveness 13
No challenges 3
Other (please specify) 6
TABLE 7CHALLENGES IMPLEMENTING ENERGY SAVING STRATEGIES
17
agencies analyzing multiple strategies have used support from consultants to evaluate their options. Almost half of survey respondents cited a lack of internal expertise or available staff time as a barrier to implementing energy-saving strategies.
Achieving Buy-in from Stakeholders
Achieving buy-in from decision makers and stakeholders is key to moving forward any new practice at a transit agency; however, less than one-quarter of survey respondents cited a lack of stakeholder support as a barrier to implementing energy-saving strategies.
Although in the 2005 study referenced previously (21) only 2% of transit agencies mentioned their board as the primary reason for a change, support from the board is still important to the extent that boards have authority over budgeting and other decision making. Boards at some transit agencies play an active role in defining energy and environmental policies. For example, LA Metro’s board has enacted a Green Construc-tion Policy and a Renewable Energy Policy (22). The Board of 9 Town Transit in Connecticut helped to spur the purchase of hybrid buses for that agency (see chapter five, 9 Town Transit).
with large budgets are more likely to implement such strate-gies, with smaller agencies finding such upfront investment costs prohibitive.
As mentioned earlier, agencies typically rely on grant funding and other outside sources to finance upfront costs. However, it is important to recognize that opportunities such as discretionary federal grant programs are very competitive. The interest in these opportunities has far exceeded the funds available. For example, for the first round of TIGGER grants, the FTA received more than $2 billion worth of applications for $100 million in funding (21).
Staff Time and Expertise
Implementing a new policy, procuring a new technology, applying for a new funding source, and measuring benefits from a strategy all require staff time and resources. Appli-cations for grant funding can be time consuming, and may ultimately be unsuccessful. Thoroughly evaluating strategies either before or after their implementation requires research, data collection, and analytical expertise spanning many dif-ferent service areas within a transit agency. Many transit

18
563.8 million to 455.5 million), whereas consumption of non-diesel sources, which include CNG, gasoline, liquefied natural gas (LNG), and biodiesel, increased from a combined 26 million diesel gallon equivalents (DGEs) to 218.7 million DGEs. As of January 2010, a third of all transit buses were powered by something other than diesel fuel or gasoline (6).
It is important to note however that there are a number of alternative (i.e., non-diesel or non-gasoline) fuels that are nevertheless derived from fossil fuels and do not in all cases reduce energy use or improve efficiency. Some of these alter-native fuels have other benefits. For example, CNG burns more cleanly than diesel, emitting fewer criteria pollutants such as NOx or particulate matter.
Transit agencies have a wide variety of options when looking for ways to improve the energy efficiency of their operations. This chapter provides descriptions of types of strategies as well as specific examples. The strategies identified are drawn from an extensive literature review and the survey of transit agencies nationwide. Where available, information on cost-effectiveness, energy savings, and experiences from transit agencies are included. The strategies fall into the following categories:
• Transit vehicle technologies• Vehicle operations and service design• Non-revenue vehicle strategies• Energy at stations and stops• Energy savings in other facilities• Strategies to reduce indirect energy use
– Employee commute programs – Water use – Waste management – Construction materials
• Renewable power generation.
This report includes survey responses from 51 North Amer-ican transit agencies on the strategies that they have employed to reduce energy use. Nearly every respondent reported using at least one strategy, and many reported that they use multiple strategies. More than half of agencies surveyed have imple-mented at least one strategy in most of the categories of actions included in the survey, as shown in Figure 9.
TRANSIT VEHICLE TECHNOLOGIES
Transit agencies can significantly reduce their energy use by changing the fuel and/or technology used for vehicle pro-pulsion. Transit agencies can improve the fuel- or energy-efficiency of their existing vehicles, switch to an alternative vehicle technology such as diesel–electric hybrids, or per-form other retrofits and adjustments to existing vehicles to reduce energy use. This section describes strategies specific to bus and rail modes as well as retrofits that are applicable to multiple vehicle types.
Alternative Fuels for Buses
Transit agencies across the country are already changing the fuels and technologies used to power their buses. For exam-ple, between 1995 and 2009, diesel fuel consumption by tran-sit buses decreased by more than 100 million gallons (from
chapter four
STRATEGIES THAT SAVE ENERGY AT TRANSIT AGENCIES
Federal Corporate Average Fuel Economy (CAFÉ) Standards for Heavy-Duty Vehicles
In 2010, the U.S. Environmental Protection Agency and National Highway Traffic Safety Administration released a proposed rule affecting heavy duty vehicles in the model years 2014–2018. The standards released that apply to transit buses will require that model year 2017 buses achieve 21.8 gallons per 1,000 ton-miles—equivalent to a 6% to 9% reduction in fuel consumption compared with a 2010 model year vehicle (23).
Alternative bus fuels can be characterized as first genera-tion or second generation. The first generation fuels discussed here help transit agencies reduce consumption of petroleum, but do not necessarily reduce energy consumption. The second generation fuels and technologies discussed generally reduce energy consumption. The technologies for second generation fuels have emerged just in the last decade, while first genera-tion fuels have been available longer.
First Generation Alternative Fuels
Commonly used first generation alternative fuels for transit buses include:
• CNG,• LNG,• LPG, and• Biodiesel.
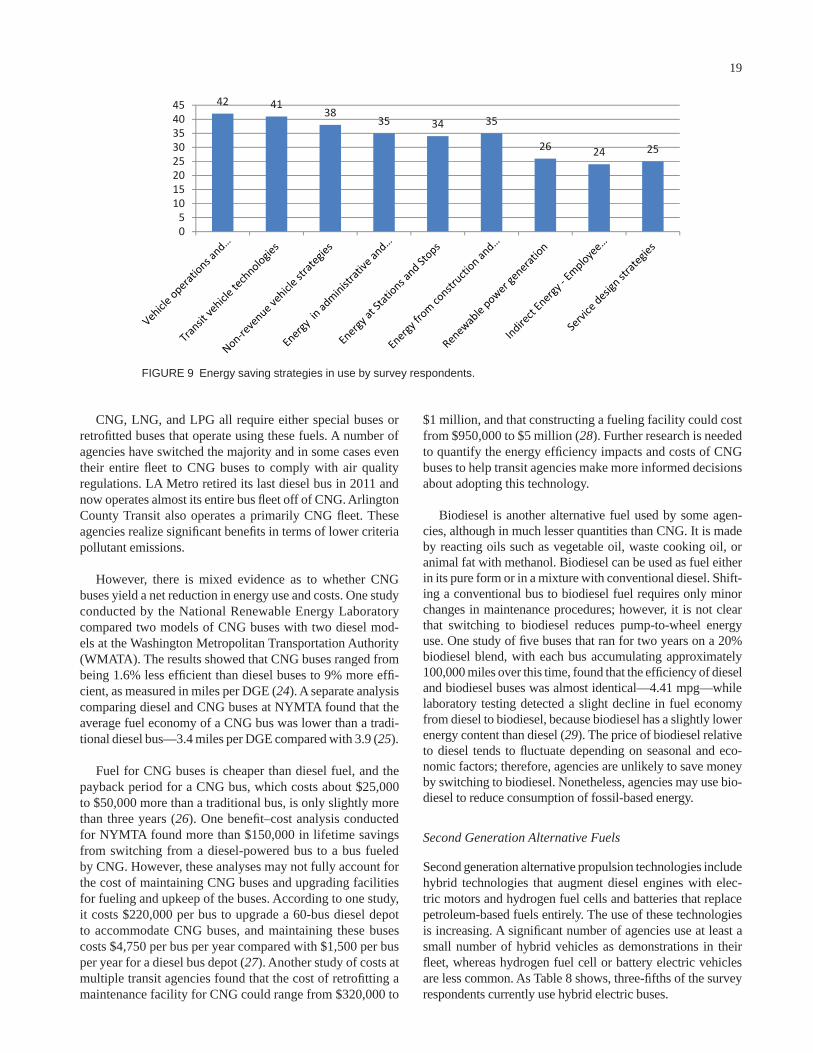
19
$1 million, and that constructing a fueling facility could cost from $950,000 to $5 million (28). Further research is needed to quantify the energy efficiency impacts and costs of CNG buses to help transit agencies make more informed decisions about adopting this technology.
Biodiesel is another alternative fuel used by some agen-cies, although in much lesser quantities than CNG. It is made by reacting oils such as vegetable oil, waste cooking oil, or animal fat with methanol. Biodiesel can be used as fuel either in its pure form or in a mixture with conventional diesel. Shift-ing a conventional bus to biodiesel fuel requires only minor changes in maintenance procedures; however, it is not clear that switching to biodiesel reduces pump-to-wheel energy use. One study of five buses that ran for two years on a 20% biodiesel blend, with each bus accumulating approximately 100,000 miles over this time, found that the efficiency of diesel and biodiesel buses was almost identical—4.41 mpg—while laboratory testing detected a slight decline in fuel economy from diesel to biodiesel, because biodiesel has a slightly lower energy content than diesel (29). The price of biodiesel relative to diesel tends to fluctuate depending on seasonal and eco-nomic factors; therefore, agencies are unlikely to save money by switching to biodiesel. Nonetheless, agencies may use bio-diesel to reduce consumption of fossil-based energy.
Second Generation Alternative Fuels
Second generation alternative propulsion technologies include hybrid technologies that augment diesel engines with elec-tric motors and hydrogen fuel cells and batteries that replace petroleum-based fuels entirely. The use of these technologies is increasing. A significant number of agencies use at least a small number of hybrid vehicles as demonstrations in their fleet, whereas hydrogen fuel cell or battery electric vehicles are less common. As Table 8 shows, three-fifths of the survey respondents currently use hybrid electric buses.
CNG, LNG, and LPG all require either special buses or retrofitted buses that operate using these fuels. A number of agencies have switched the majority and in some cases even their entire fleet to CNG buses to comply with air quality regulations. LA Metro retired its last diesel bus in 2011 and now operates almost its entire bus fleet off of CNG. Arlington County Transit also operates a primarily CNG fleet. These agencies realize significant benefits in terms of lower criteria pollutant emissions.
However, there is mixed evidence as to whether CNG buses yield a net reduction in energy use and costs. One study conducted by the National Renewable Energy Laboratory compared two models of CNG buses with two diesel mod-els at the Washington Metropolitan Transportation Authority (WMATA). The results showed that CNG buses ranged from being 1.6% less efficient than diesel buses to 9% more effi-cient, as measured in miles per DGE (24). A separate analysis comparing diesel and CNG buses at NYMTA found that the average fuel economy of a CNG bus was lower than a tradi-tional diesel bus—3.4 miles per DGE compared with 3.9 (25).
Fuel for CNG buses is cheaper than diesel fuel, and the payback period for a CNG bus, which costs about $25,000 to $50,000 more than a traditional bus, is only slightly more than three years (26). One benefit–cost analysis conducted for NYMTA found more than $150,000 in lifetime savings from switching from a diesel-powered bus to a bus fueled by CNG. However, these analyses may not fully account for the cost of maintaining CNG buses and upgrading facilities for fueling and upkeep of the buses. According to one study, it costs $220,000 per bus to upgrade a 60-bus diesel depot to accommodate CNG buses, and maintaining these buses costs $4,750 per bus per year compared with $1,500 per bus per year for a diesel bus depot (27). Another study of costs at multiple transit agencies found that the cost of retrofitting a maintenance facility for CNG could range from $320,000 to
42 4138
35 34 35
26 24 25
05
1015202530354045
FIGURE 9 Energy saving strategies in use by survey respondents.

20
for King County Metro Transit in the Seattle area over a one-year evaluation period (see Table 9). At Connecticut Tran-sit (CT Transit), hybrid buses operate at 16% to 39% higher fuel efficiency than comparable diesel buses, depending on the model year (33). Some agencies have reported smaller improvements; a study of multiple Florida transit agencies found only a 3% increase, from 3.94 mpg to 4.03 mpg (34). Similarly, a study of Long Beach Transit found only an 8.5% fuel economy improvement when switching from a diesel to gasoline hybrid (35). At least one projection of future tech-nology has forecasted that hybrid–electric buses will achieve between 4.3 and 8.6 mpg in 2030, with that number climbing to as much as 16 mpg in 2050 (36).
It is important to note that the fuel economy of hybrid vehicles depends upon driving speed and technique more so than with other vehicles. Because the electric battery is recharged through braking, hybrids can be much more fuel efficient than their conventional counterparts in stop-and-go traffic, while their fuel economy decreases on hills or when accelerating quickly (31, 37).
Potential challenges associated with hybrid electric buses include the initial purchase costs, the cost of maintenance, and, in some cases, the dependability of the buses. A hybrid electric bus is significantly more expensive than a conventional diesel bus, although the price gap has narrowed in recent years. In 2005, the typical price premium of a hybrid bus was $175,000 (27). Maintenance costs may also be greater for hybrid elec-tric vehicles, because parts are less widely available and tech-nicians may need additional training to maintain the buses. Research regarding costs for parts and maintenance of hybrid buses has produced mixed conclusions. One study found that on average parts and labor for a hybrid electric bus cost $1.36 per mile compared with $0.72 per mile for a conventional diesel bus, though it noted that these costs may eventually decline (27). A different study found the maintenance cost per mile to be $0.24 for a hybrid compared with $0.45 for a conven-tional diesel bus (28). Los Angeles Metro currently operates
Hybrid Electric Buses
A hybrid electric vehicle combines two energy converters, typically an internal combustion engine powered by fossil fuel and an electric drive powered by electricity stored on board in a battery. The balance between these two power sources varies. In “mild” hybrids, the bus operates primarily using its engine with additional power accessible using the electric motor; in “full” hybrids, the electric motor is more powerful and may be sufficient to power the bus on its own at low speeds. By deriving energy from an electric battery, hybrid vehicles typically experience improved fuel economy compared with conventional buses (30).
In recent years, hybrid electric buses have been increas-ing in popularity as the reliability of the technology has improved. In its 2010 report to Congress, U.S.DOT reported that hybrid diesel–electric and gas–electric vehicles can be between 10% and 50% more fuel efficient than conventional diesel buses (31). The San Francisco Metropolitan Trans-portation Authority (SFMTA) has seen a 25% improvement in fuel economy with its hybrids, and the Maryland Tran-sit Administration reports an average of 4.8 mpg for hybrid buses compared with 2.9 for conventional diesel-powered buses. NYMTA has experienced a 10% to 30% fuel economy improvement (25), and one study found a 27% improvement
TABLE 8AGENCY USE OF ALTERNATIVE VEHICLE TECHNOLOGY
Is your agency using any of the following alternative vehicle technologies to save energy in buses? (Check all that apply)
Response Count
Hybrid Electric Vehicles 32
Battery Electric Vehicles 6
Other (please specify) 6
Hydrogen Fuel Cell 4
None of the Above 13
TABLE 9COMPARISON OF HYBRID-ELECTRIC TO DIESEL BUSES—KING COUNTY, WASHINGTON
Evaluation Results (12-month evaluation period) Category
Diesel Ryerson Base (10 buses)
Hybrid Atlantic Base (10 buses)
Hybrid Difference
Monthly Average Mileage per Bus 2,949 3,096 +5%
Fuel Economy (mpg) 2.50 3.17 +27%
Fuel Cost per Mile ($) (@$1.98/gal) 0.79 0.62 22%
Total Maintenance Cost per Mile ($) 0.46 0.44 4%
Propulsion-Only Maintenance Cost per Mile ($) 0.12 0.13 +8%
Total Operating Cost per Mile ($) 1.25 1.06 15%
Miles Between All Road Calls 5,896 4,954 16%
Miles Between Propulsion Road Calls 12,199 10,616 13%
Chandler and Walkowicz, King County Metro Transit Hybrid Articulated Buses: Final Evaluation Results (32).
21
As of August 2010, 15 buses were in service at seven U.S. locations (39). One of the first agencies to deploy a hydrogen fuel cell bus was CT Transit’s Hartford division, which put its first fuel cell bus into operation in 2007. Between 2007 and 2009, the bus got an average fuel economy of 5.4 miles per diesel gallon equivalent, making it 47% more efficient than a baseline diesel average of 3.68 mpg of diesel (40). Although these numbers suggest that hydrogen vehicles are operationally more efficient, it is important to note that they do not take into account the well-to-pump energy used to produce hydrogen fuel. CT Transit is able to use fueling facilities at UTC Power in South Windsor that are only seven miles away, helping to solve potential infrastructure prob-lems associated with the bus. Since acquiring its first bus in 2007, CT Transit has added an additional four fuel cell buses.
As with other technologies that are in the experimental stage of development, hydrogen fuel cells present a number of barriers to adoption. Vehicles are expensive; BC Transit’s hydrogen buses cost almost three times as much as conven-tional diesel buses, although the agency expects these costs to decrease over time as demand for the buses grows (38). Fuels can also be difficult and expensive to procure, and mainte-nance can be costly. For example, the cost per mile associated with hydrogen fuel and maintenance at CT Transit is $1.11 per mile, not including labor time to drive to the fueling sta-tion, which brings the total to $1.29 per mile, whereas the cost per mile for diesel fuel at CT Transit is $0.70 (41). Fac-toring in the maintenance costs associated with deploying a new technology increases this figure significantly; however, this maintenance price premium has decreased over time at CT Transit. Additionally, hydrogen bus garages and mainte-nance facilities need to be equipped for safety to minimize any possible risk associated with a hydrogen leak. Although some agencies deploying this technology have built entirely new facilities at great expense, CT Transit managed to design a ventilation system and accompanying warning system as a retrofit solution for an existing diesel garage. The cost of the retrofit was $75,000 (34).
Several agencies in the San Francisco Bay area have teamed up to deploy hydrogen buses. Alameda–Contra Costa Tran-sit District (AC Transit), Santa Clara Valley Transportation Authority (VTA), Golden Gate Transit, SamTrans, and San Francisco Municipal Railway have partnered on the project, with AC Transit as the lead agency. The project was originally designed in response to the California Air Resources Board’s Zero Emissions Bus Rule, which calls for transit agencies to begin deploying zero-emissions technology. Beginning in 2002, AC Transit operated a prototype fuel cell bus, and VTA and SamTrans began operating three additional buses in 2004. The program has since expanded to 12 buses, and AC Transit is building two hydrogen fueling stations that will also have capacity to fuel light-duty vehicles. The fuel economy of seven of these hydrogen buses over a nine-month period was 6.05 mpg of diesel equivalent, compared with 3.99 mpg for the diesel fleet (41). The cost for these buses was approximately
four hybrid gasoline–electric buses, which have experienced frequent breakdowns and are often out of service (16).
Battery Electric Buses
Battery electric buses (BEBs) derive their power from the grid rather than from liquid fuel, and run using an electric motor powered by a rechargeable battery. These buses are limited in their range of travel by how much charge the battery can hold, although technological advances in coming years will likely increase their range. BEBs use their operational energy more efficiently than many other technologies. Whereas an engine in a CNG bus is typically less than 40% efficient in converting fuel to power, electric motors can be more than 80% efficient in converting stored energy to power to move the vehicle (16). The impact of BEBs on well-to-wheel energy use will vary somewhat based on the efficiency of the electricity gen-eration and transmission systems used to charge the battery.
At present, few transit agencies are using BEBs in rev-enue service. However, a number of agencies, including King County Metro, Monterey Salinas Transit, and LA Metro, are testing or have tested the technology and are consider-ing implementing it. Foothill Transit in Covina, California, has successfully deployed three BEBs along one of its routes, with funding through FTA and the local air quality manage-ment district. The buses have a fast-charge battery that can go from a 10% to 95% charge level in ten minutes. The bus is therefore able to be quickly charged along its route, allowing for continuous operation on the line throughout the day. For a more detailed description, see the case example on Foothill Transit in chapter five.
Hydrogen Fuel Cell Buses
Hydrogen fuel cell vehicles operate differently from most on-road vehicles. A fuel cell within the vehicle runs two variable motors that do not require a transmission. On-board batteries provide additional power when needed, and these batteries are recharged when less power is needed or when the brakes are applied. These buses require special fueling infrastructure to provide the hydrogen required.
At the moment, hydrogen fuel cells are in a relatively early stage of deployment because of the advanced nature of the technology and their specialized fueling requirements. The largest fleet of hydrogen fuel cell buses currently on the road is in Whistler, British Columbia, Canada, and is operated by BC Transit. BC Transit ordered 20 41-foot buses in 2010 to increase service during the 2010 Olympic Games, after which the buses entered regular service. So far, Whistler’s hydrogen fleet has logged more than one million service miles, and BC Transit estimates that the buses are roughly twice as energy efficient as conventional diesel buses (38). A hydrogen plant is currently under construction in the province, and when completed the buses will have a local source of fuel.
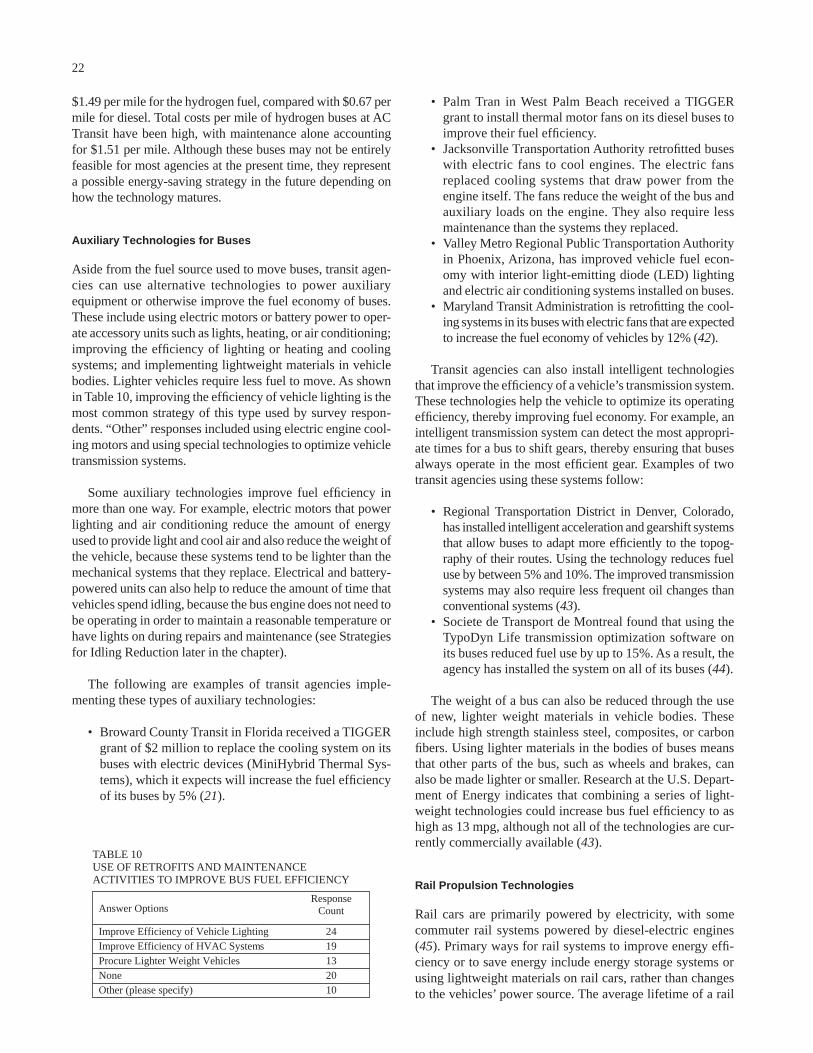
22
• Palm Tran in West Palm Beach received a TIGGER grant to install thermal motor fans on its diesel buses to improve their fuel efficiency.
• Jacksonville Transportation Authority retrofitted buses with electric fans to cool engines. The electric fans replaced cooling systems that draw power from the engine itself. The fans reduce the weight of the bus and auxiliary loads on the engine. They also require less maintenance than the systems they replaced.
• Valley Metro Regional Public Transportation Authority in Phoenix, Arizona, has improved vehicle fuel econ-omy with interior light-emitting diode (LED) lighting and electric air conditioning systems installed on buses.
• Maryland Transit Administration is retrofitting the cool-ing systems in its buses with electric fans that are expected to increase the fuel economy of vehicles by 12% (42).
Transit agencies can also install intelligent technologies that improve the efficiency of a vehicle’s transmission system. These technologies help the vehicle to optimize its operating efficiency, thereby improving fuel economy. For example, an intelligent transmission system can detect the most appropri-ate times for a bus to shift gears, thereby ensuring that buses always operate in the most efficient gear. Examples of two transit agencies using these systems follow:
• Regional Transportation District in Denver, Colorado, has installed intelligent acceleration and gearshift systems that allow buses to adapt more efficiently to the topog-raphy of their routes. Using the technology reduces fuel use by between 5% and 10%. The improved transmission systems may also require less frequent oil changes than conventional systems (43).
• Societe de Transport de Montreal found that using the TypoDyn Life transmission optimization software on its buses reduced fuel use by up to 15%. As a result, the agency has installed the system on all of its buses (44).
The weight of a bus can also be reduced through the use of new, lighter weight materials in vehicle bodies. These include high strength stainless steel, composites, or carbon fibers. Using lighter materials in the bodies of buses means that other parts of the bus, such as wheels and brakes, can also be made lighter or smaller. Research at the U.S. Depart-ment of Energy indicates that combining a series of light-weight technologies could increase bus fuel efficiency to as high as 13 mpg, although not all of the technologies are cur-rently commercially available (43).
Rail Propulsion Technologies
Rail cars are primarily powered by electricity, with some commuter rail systems powered by diesel-electric engines (45). Primary ways for rail systems to improve energy effi-ciency or to save energy include energy storage systems or using lightweight materials on rail cars, rather than changes to the vehicles’ power source. The average lifetime of a rail
$1.49 per mile for the hydrogen fuel, compared with $0.67 per mile for diesel. Total costs per mile of hydrogen buses at AC Transit have been high, with maintenance alone accounting for $1.51 per mile. Although these buses may not be entirely feasible for most agencies at the present time, they represent a possible energy-saving strategy in the future depending on how the technology matures.
Auxiliary Technologies for Buses
Aside from the fuel source used to move buses, transit agen-cies can use alternative technologies to power auxiliary equipment or otherwise improve the fuel economy of buses. These include using electric motors or battery power to oper-ate accessory units such as lights, heating, or air conditioning; improving the efficiency of lighting or heating and cooling systems; and implementing lightweight materials in vehicle bodies. Lighter vehicles require less fuel to move. As shown in Table 10, improving the efficiency of vehicle lighting is the most common strategy of this type used by survey respon-dents. “Other” responses included using electric engine cool-ing motors and using special technologies to optimize vehicle transmission systems.
Some auxiliary technologies improve fuel efficiency in more than one way. For example, electric motors that power lighting and air conditioning reduce the amount of energy used to provide light and cool air and also reduce the weight of the vehicle, because these systems tend to be lighter than the mechanical systems that they replace. Electrical and battery-powered units can also help to reduce the amount of time that vehicles spend idling, because the bus engine does not need to be operating in order to maintain a reasonable temperature or have lights on during repairs and maintenance (see Strategies for Idling Reduction later in the chapter).
The following are examples of transit agencies imple-menting these types of auxiliary technologies:
• Broward County Transit in Florida received a TIGGER grant of $2 million to replace the cooling system on its buses with electric devices (MiniHybrid Thermal Sys-tems), which it expects will increase the fuel efficiency of its buses by 5% (21).
Answer Options Response
Count
Improve Efficiency of Vehicle Lighting 24 Improve Efficiency of HVAC Systems 19 Procure Lighter Weight Vehicles 13 None 20 Other (please specify) 10
TABLE 10USE OF RETROFITS AND MAINTENANCE ACTIVITIES TO IMPROVE BUS FUEL EFFICIENCY
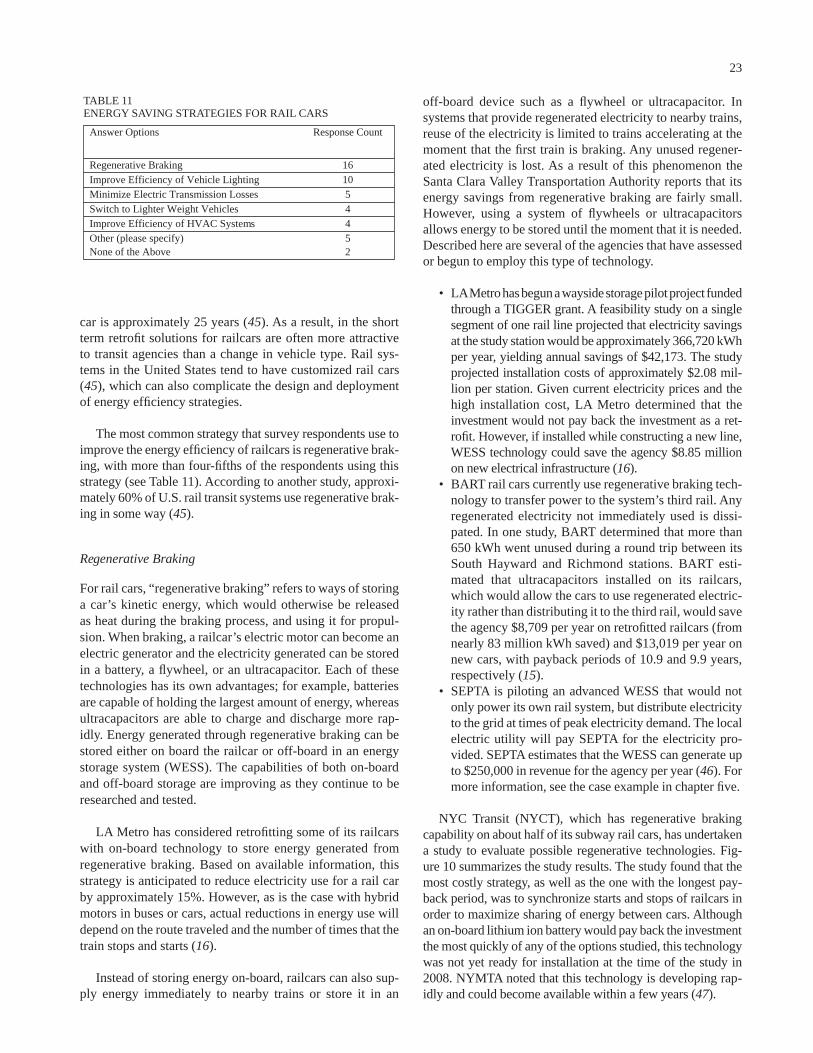
23
off-board device such as a flywheel or ultracapacitor. In systems that provide regenerated electricity to nearby trains, reuse of the electricity is limited to trains accelerating at the moment that the first train is braking. Any unused regener-ated electricity is lost. As a result of this phenomenon the Santa Clara Valley Transportation Authority reports that its energy savings from regenerative braking are fairly small. However, using a system of flywheels or ultracapacitors allows energy to be stored until the moment that it is needed. Described here are several of the agencies that have assessed or begun to employ this type of technology.
• LA Metro has begun a wayside storage pilot project funded through a TIGGER grant. A feasibility study on a single segment of one rail line projected that electricity savings at the study station would be approximately 366,720 kWh per year, yielding annual savings of $42,173. The study projected installation costs of approximately $2.08 mil-lion per station. Given current electricity prices and the high installation cost, LA Metro determined that the investment would not pay back the investment as a ret-rofit. However, if installed while constructing a new line, WESS technology could save the agency $8.85 million on new electrical infrastructure (16).
• BART rail cars currently use regenerative braking tech-nology to transfer power to the system’s third rail. Any regenerated electricity not immediately used is dissi-pated. In one study, BART determined that more than 650 kWh went unused during a round trip between its South Hayward and Richmond stations. BART esti-mated that ultracapacitors installed on its railcars, which would allow the cars to use regenerated electric-ity rather than distributing it to the third rail, would save the agency $8,709 per year on retrofitted railcars (from nearly 83 million kWh saved) and $13,019 per year on new cars, with payback periods of 10.9 and 9.9 years, respectively (15).
• SEPTA is piloting an advanced WESS that would not only power its own rail system, but distribute electricity to the grid at times of peak electricity demand. The local electric utility will pay SEPTA for the electricity pro-vided. SEPTA estimates that the WESS can generate up to $250,000 in revenue for the agency per year (46). For more information, see the case example in chapter five.
NYC Transit (NYCT), which has regenerative braking capability on about half of its subway rail cars, has undertaken a study to evaluate possible regenerative technologies. Fig-ure 10 summarizes the study results. The study found that the most costly strategy, as well as the one with the longest pay-back period, was to synchronize starts and stops of railcars in order to maximize sharing of energy between cars. Although an on-board lithium ion battery would pay back the investment the most quickly of any of the options studied, this technology was not yet ready for installation at the time of the study in 2008. NYMTA noted that this technology is developing rap-idly and could become available within a few years (47).
car is approximately 25 years (45). As a result, in the short term retrofit solutions for railcars are often more attractive to transit agencies than a change in vehicle type. Rail sys-tems in the United States tend to have customized rail cars (45), which can also complicate the design and deployment of energy efficiency strategies.
The most common strategy that survey respondents use to improve the energy efficiency of railcars is regenerative brak-ing, with more than four-fifths of the respondents using this strategy (see Table 11). According to another study, approxi-mately 60% of U.S. rail transit systems use regenerative brak-ing in some way (45).
Regenerative Braking
For rail cars, “regenerative braking” refers to ways of storing a car’s kinetic energy, which would otherwise be released as heat during the braking process, and using it for propul-sion. When braking, a railcar’s electric motor can become an electric generator and the electricity generated can be stored in a battery, a flywheel, or an ultracapacitor. Each of these technologies has its own advantages; for example, batteries are capable of holding the largest amount of energy, whereas ultracapacitors are able to charge and discharge more rap-idly. Energy generated through regenerative braking can be stored either on board the railcar or off-board in an energy storage system (WESS). The capabilities of both on-board and off-board storage are improving as they continue to be researched and tested.
LA Metro has considered retrofitting some of its railcars with on-board technology to store energy generated from regenerative braking. Based on available information, this strategy is anticipated to reduce electricity use for a rail car by approximately 15%. However, as is the case with hybrid motors in buses or cars, actual reductions in energy use will depend on the route traveled and the number of times that the train stops and starts (16).
Instead of storing energy on-board, railcars can also sup-ply energy immediately to nearby trains or store it in an
Answer Options Response Count
Regenerative Braking 16 Improve Efficiency of Vehicle Lighting 10 Minimize Electric Transmission Losses 5 Switch to Lighter Weight Vehicles 4 Improve Efficiency of HVAC Systems 4 Other (please specify) 5 None of the Above 2
TABLE 11ENERGY SAVING STRATEGIES FOR RAIL CARS

24
FIGURE 10 NYMTA evaluation of regenerative energy systems for NYC subway. Source: Traction Power Report (47 ).
Lightweighting Strategies for Railcars
A lighter railcar requires less energy to move and stop. Although such strategies generally cannot achieve the same degree of electricity savings as regenerative braking, reducing the weight of a railcar can be a very cost-effective approach to saving energy. Some lightweighting strategies have very short payback periods. Several transit agencies have studied
the specific strategies that would be available for their sys-tems. The results for each strategy vary depending on whether they are applied as retrofits or in new railcars and supporting infrastructure.
NYMTA identified 14 different ways to reduce the weight of its subway railcars (see Figure 11). Eight of these strate-gies are so simple and inexpensive to implement that they
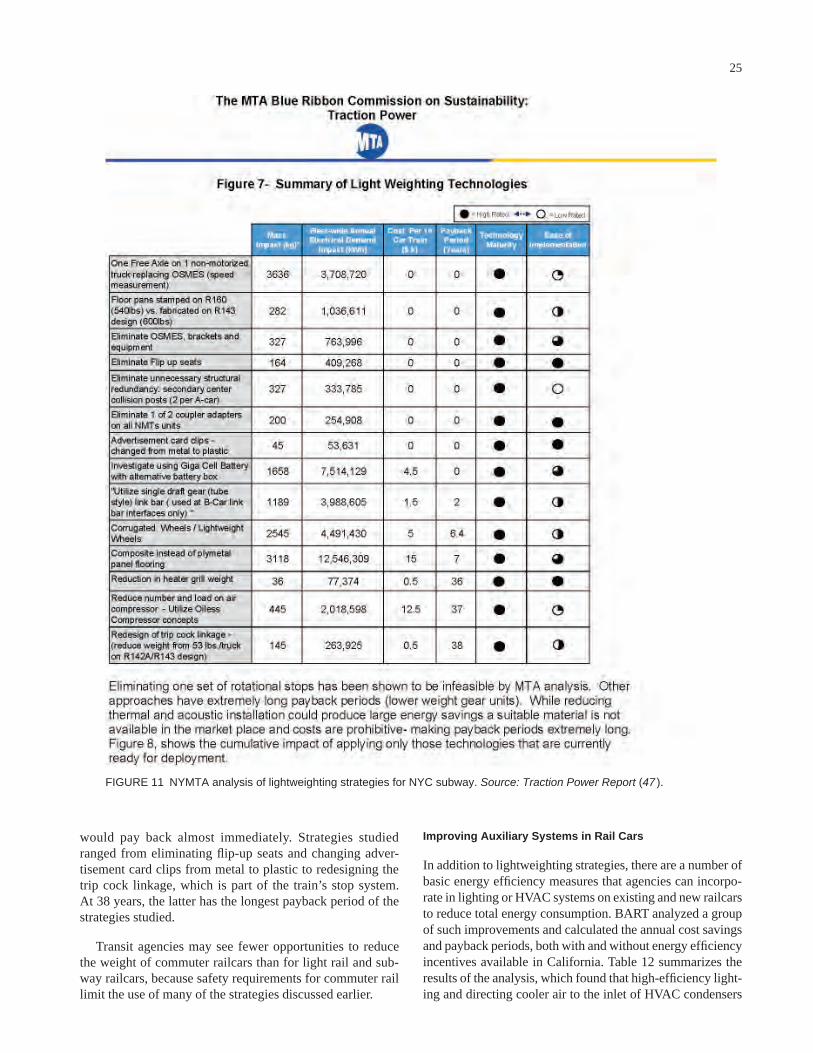
25
FIGURE 11 NYMTA analysis of lightweighting strategies for NYC subway. Source: Traction Power Report (47 ).
would pay back almost immediately. Strategies studied ranged from eliminating flip-up seats and changing adver-tisement card clips from metal to plastic to redesigning the trip cock linkage, which is part of the train’s stop system. At 38 years, the latter has the longest payback period of the strategies studied.
Transit agencies may see fewer opportunities to reduce the weight of commuter railcars than for light rail and sub-way railcars, because safety requirements for commuter rail limit the use of many of the strategies discussed earlier.
Improving Auxiliary Systems in Rail Cars
In addition to lightweighting strategies, there are a number of basic energy efficiency measures that agencies can incorpo-rate in lighting or HVAC systems on existing and new railcars to reduce total energy consumption. BART analyzed a group of such improvements and calculated the annual cost savings and payback periods, both with and without energy efficiency incentives available in California. Table 12 summarizes the results of the analysis, which found that high-efficiency light-ing and directing cooler air to the inlet of HVAC condensers

26
Improved vehicle maintenance can also save energy. Sim-ple activities such as maintaining lubrication and reducing friction throughout the vehicle and maintaining tires with the proper pressure can improve or preserve the fuel economy of buses without substantially increasing costs. For example, properly inflated tires can increase the fuel economy of buses by 3% (43). When lubricating engines, low-viscosity motor oils and lubricants may be able to improve fuel economy from 1% to 5% (44). TriMet in Portland, Oregon, found that adjusting transmissions, front-end alignment, steering con-trol, and maintaining tire pressure increased fuel efficiency by 10% on its bus fleet (49). The APTA Transit Sustainability Guidelines also suggest using rail lubricators to reduce friction, thereby improving the energy efficiency of railcars (50).
Table 13 shows the relative popularity of different types of vehicle operations and maintenance strategies among sur-vey respondents.
Strategies for Idling Reduction
Reducing unnecessary idling is a cost-effective way to reduce fuel use. In addition to reducing energy use during the opera-tion of the vehicle, anti-idling strategies can reduce wear
offered rapid payback periods—less than one year if the agency takes advantage of available incentives.
Other agencies pursuing or considering lighting retrofits for rail cars included:
• TransLink in Vancouver, British Columbia, which esti-mates that lighting retrofits to its rail cars could reduce energy use by 200,000 kWh over more than two years.
• WMATA is purchasing new rail cars that will include LED passenger information display signs, linear door motors that will not generate carbon dust (requiring less maintenance), and oil-less compressors that do not need an acid wash (48).
VEHICLE OPERATIONS, MAINTENANCE, AND SERVICE DESIGN
The most fuel-efficient way for any transit vehicle to oper-ate is at a relatively constant speed with few stops and starts and minimal time spent with the engine idling, which need-lessly burns fuel and releases emissions. Energy is lost when vehicles idle in maintenance yards, during repairs or layovers, and in congested conditions along service routes. Naturally, transit vehicles must make frequent stops as part of their ser-vice; however, transit agencies can employ a number of tech-niques to minimize operational energy lost through idling and unnecessary starts or stops. In the instance of idling, available technologies can turn off vehicles automatically and agency-wide policies can encourage behavior changes. Driver train-ing programs can help reduce vehicle idling, as well as teach other “eco-driving” practices. To address unnecessary starts and stops, agencies can make sure that routes are planned efficiently and effectively to minimize time and energy lost at traffic lights or at stops with low ridership, which may in the process also improve the quality of service provided.
Strategy
Energy Savings—
Fleet (kWh/year)
Cost Savings per Year
Payback Period
Payback Period with Incentives
1. High-efficiency lighting 156,872 $37,891
Included in 5
Included in 5
2. Direct cooler air to the inlet of HVAC condensers
1,717,819 $180,370 1.1 0.6
3. Higher-efficiency HVAC units 413,021 $43,367 15.9 14.6
4. Optimize outside air intake
1,444,334 $151,791 6.9 5.6
5. Daylight controls on fluorescent lamps
837,433 $87,930 32.6 22.4
6. Variable frequency drives on supply fans
3,206,292 $336,661 8.8 4.4
BASE Energy, Inc., Energy Efficiency Assessment of Bay Area Rapid Transit (BART) Train Cars (15).
TABLE 12ENERGY EFFICIENCY IMPROVEMENT ANALYSIS FOR BART CARS
Is Your Agency Saving Energy Through Transit Vehicle Operations and Maintenance Strategies?
ResponseCount
Use of anti-idling technologies or policies 38 Maintenance programs to improve fuel efficiency 24 Driver training for eco-driving/operation of vehicles 22 Other (please specify) 7 None of the above 9
TABLE 13USE OF OPERATIONS AND MAINTENANCE STRATEGIES FOR FUEL EFFICIENCY
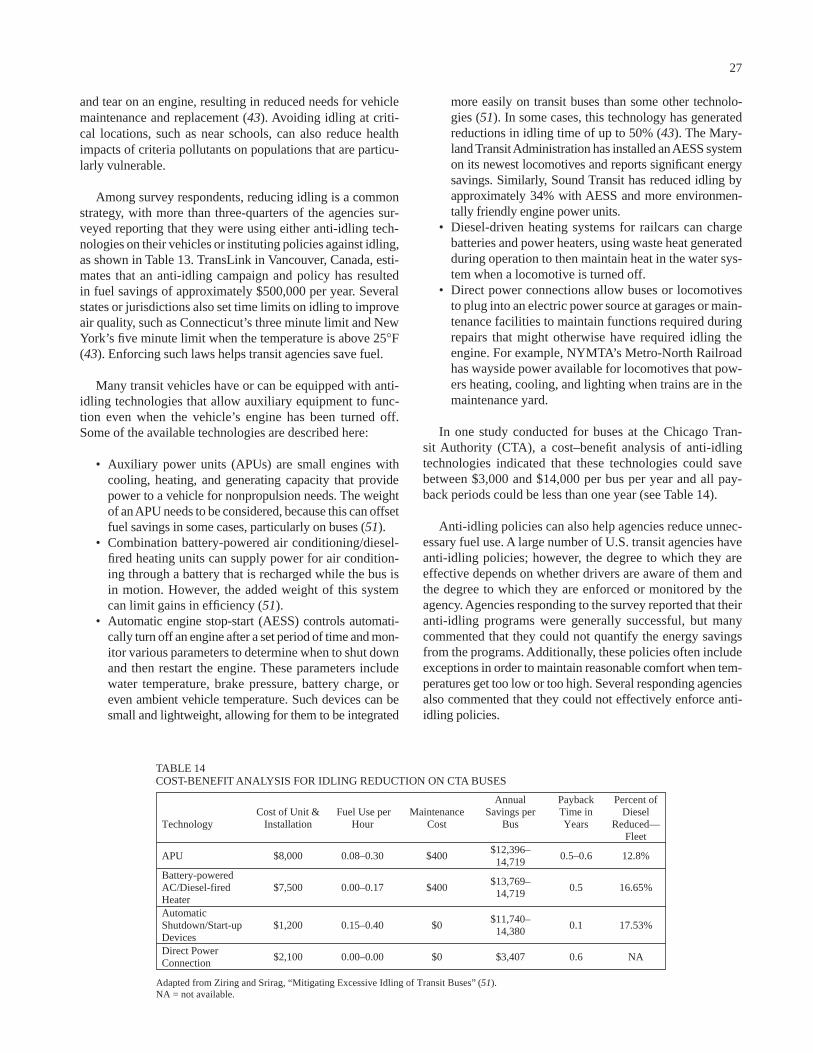
27
more easily on transit buses than some other technolo-gies (51). In some cases, this technology has generated reductions in idling time of up to 50% (43). The Mary-land Transit Administration has installed an AESS system on its newest locomotives and reports significant energy savings. Similarly, Sound Transit has reduced idling by approximately 34% with AESS and more environmen-tally friendly engine power units.
• Diesel-driven heating systems for railcars can charge batteries and power heaters, using waste heat generated during operation to then maintain heat in the water sys-tem when a locomotive is turned off.
• Direct power connections allow buses or locomotives to plug into an electric power source at garages or main-tenance facilities to maintain functions required during repairs that might otherwise have required idling the engine. For example, NYMTA’s Metro-North Railroad has wayside power available for locomotives that pow-ers heating, cooling, and lighting when trains are in the maintenance yard.
In one study conducted for buses at the Chicago Tran-sit Authority (CTA), a cost–benefit analysis of anti-idling technologies indicated that these technologies could save between $3,000 and $14,000 per bus per year and all pay-back periods could be less than one year (see Table 14).
Anti-idling policies can also help agencies reduce unnec-essary fuel use. A large number of U.S. transit agencies have anti-idling policies; however, the degree to which they are effective depends on whether drivers are aware of them and the degree to which they are enforced or monitored by the agency. Agencies responding to the survey reported that their anti-idling programs were generally successful, but many commented that they could not quantify the energy savings from the programs. Additionally, these policies often include exceptions in order to maintain reasonable comfort when tem-peratures get too low or too high. Several responding agencies also commented that they could not effectively enforce anti-idling policies.
and tear on an engine, resulting in reduced needs for vehicle maintenance and replacement (43). Avoiding idling at criti-cal locations, such as near schools, can also reduce health impacts of criteria pollutants on populations that are particu-larly vulnerable.
Among survey respondents, reducing idling is a common strategy, with more than three-quarters of the agencies sur-veyed reporting that they were using either anti-idling tech-nologies on their vehicles or instituting policies against idling, as shown in Table 13. TransLink in Vancouver, Canada, esti-mates that an anti-idling campaign and policy has resulted in fuel savings of approximately $500,000 per year. Several states or jurisdictions also set time limits on idling to improve air quality, such as Connecticut’s three minute limit and New York’s five minute limit when the temperature is above 25°F (43). Enforcing such laws helps transit agencies save fuel.
Many transit vehicles have or can be equipped with anti-idling technologies that allow auxiliary equipment to func-tion even when the vehicle’s engine has been turned off. Some of the available technologies are described here:
• Auxiliary power units (APUs) are small engines with cooling, heating, and generating capacity that provide power to a vehicle for nonpropulsion needs. The weight of an APU needs to be considered, because this can offset fuel savings in some cases, particularly on buses (51).
• Combination battery-powered air conditioning/diesel-fired heating units can supply power for air condition-ing through a battery that is recharged while the bus is in motion. However, the added weight of this system can limit gains in efficiency (51).
• Automatic engine stop-start (AESS) controls automati-cally turn off an engine after a set period of time and mon-itor various parameters to determine when to shut down and then restart the engine. These parameters include water temperature, brake pressure, battery charge, or even ambient vehicle temperature. Such devices can be small and lightweight, allowing for them to be integrated
Technology Cost of Unit &
Installation Fuel Use per
Hour Maintenance
Cost
Annual Savings per
Bus
Payback Time in Years
Percent of Diesel
Reduced—Fleet
APU $8,000 0.08–0.30 $400 $12,396–
14,719 0.5–0.6 12.8%
Battery-powered AC/Diesel-fired Heater
$7,500 0.00–0.17 $400 $13,769–
14,719 0.5 16.65%
Automatic Shutdown/Start-up Devices
$1,200 0.15–0.40 $0 $11,740–
14,380 0.1 17.53%
Direct Power Connection
$2,100 0.00–0.00 $0 $3,407 0.6 NA
Adapted from Ziring and Srirag, “Mitigating Excessive Idling of Transit Buses” (51). NA = not available.
TABLE 14COST-BENEFIT ANALYSIS FOR IDLING REDUCTION ON CTA BUSES

28
nificant improvements in fuel economy from training drivers in energy-efficient practices. More than two-fifths of survey respondents indicated that they provide some sort of eco-driving training to their vehicle operators. Although eco-driving strat-egies can be effective for improving the fuel economy of vehi-cles, they can also be a challenge for drivers concerned with maintaining on-time performance along their routes.
One of the best known programs available for transit oper-ators is the SmartDriver program developed by the Canadian Urban Transit Association. This program has been piloted and used at a variety of transit agencies both in Canada and the United States. Some of the techniques taught in this train-ing include:
1. Pulse and coast (also known as pulse and glide). This technique involves using the vehicle’s own momen-tum and coasting to reduce fuel consumption.
2. Extending the buffer space between cars from 1 s to 3 s.3. Anticipating traffic flow by keeping their eyes on the
horizon, coasting to gradual stops, and changing lanes to avoid upcoming obstacles.
4. Driving at fewer than 200 revolutions per minute, with smoother and slower acceleration and braking.
5. Driving uphill at 6 mph under the speed limit.6. Keeping tires properly inflated as per vehicle specifications.7. Driving 6 mph under the posted highway speed limit.8. Reducing aerodynamic drag by keeping windows
closed while driving (53).
CUTA’s pilot study in 2009 included five transit agen-cies (North Bay, Windsor, Nanaimo, Halifax, and Bramton). North Bay reduced fuel consumption during the course of the
Some agencies are able to enforce anti-idling policies using technologies that can monitor when a vehicle is turned on but not moving. UTA uses a Global Positioning System (GPS) to monitor and enforce its anti-idling policy, which it has recently made more rigorous. Similarly, Foothill Transit uses technology provided by Zonar to assess idling on its vehicles (see chapter five).
Anti-idling policies may also be externally enforced. For example, in 2010 the EPA helped to enforce a Massachu-setts anti-idling law in response to citizen complaints about idling commuter trains. As a result, the Massachusetts Bay Transportation Authority installed and upgraded electric plug-ins at layover stations, changed to ultra-low sulfur die-sel for commuter rail trains, installed new diesel engines on 14 of its locomotives, and paid a fine of $225,000 (52).
Other ways to improve the application of anti-idling poli-cies include education and incentives for drivers, and tech-nologies to improve the driver’s experience when switching off engines. One survey of bus operators in Chicago asked drivers what would encourage them to idle less. Table 15 summarizes the results (51), which indicate that reminders and reinforcement of anti-idling policies are the most effec-tive ways to encourage drivers to idle less.
Driver Training
Beyond idling, the operating techniques of drivers have impli-cations for a vehicle’s fuel economy, as well as the rate of wear and tear on the vehicle. Although driver training programs also depend on compliance and the degree to which techniques learned are applied in the field, many agencies have found sig-
TABLE 15EFFECTIVENESS OF TECHNIQUES TO ENCOURAGE REDUCED IDLING
Influence of Various Factors on Bus Operator Behavior Encourage Idle Less
No Effect
Awareness of amount of fuel consumed while idling 60% 40%
Awareness of cost of fuel consumed while idling 57% 43%
Awareness of added maintenance cost caused by idling 72% 28%
Awareness of health effects of fumes produced by my bus to me and to others 84% 16%
Awareness of amount of pollution produced while idling 81% 19%
Reassurance from management that bus will restart even if off for a few hours 62% 38%
Reassurance that shutting off engine is official policy 93% 7%
Visual reminder (on-board sign and/or signs posted around garage) of idling policy 93% 7%
Installed device that provides heat even when engine is off 93% 7%
Installed device that provides A/C even when engine is off 91% 9%
Installed device that automatically restarts engine when it hits a certain low
engine temperature
95% 5%
Incentives 88% 12%
Punishment for not following idling policy 83% 17%
Adapted from Ziring and Srirag, “Mitigating Excessive Idling of Transit Buses” (51).
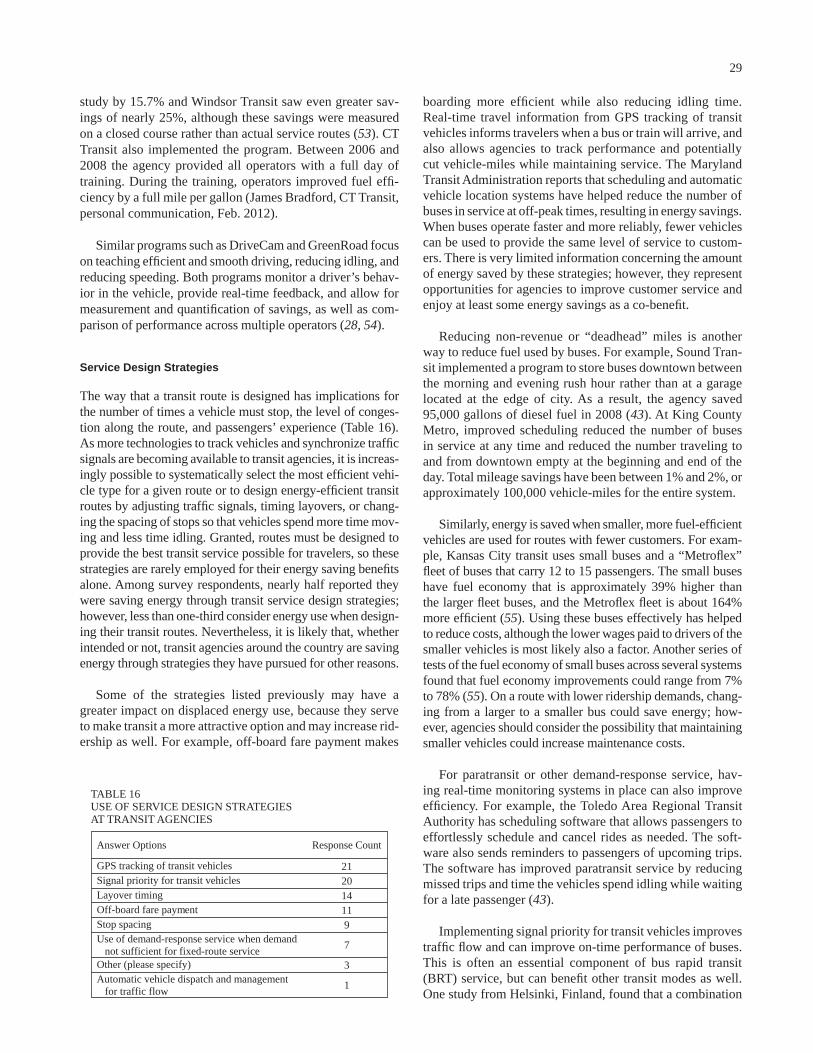
29
boarding more efficient while also reducing idling time. Real-time travel information from GPS tracking of transit vehicles informs travelers when a bus or train will arrive, and also allows agencies to track performance and potentially cut vehicle-miles while maintaining service. The Maryland Transit Administration reports that scheduling and automatic vehicle location systems have helped reduce the number of buses in service at off-peak times, resulting in energy savings. When buses operate faster and more reliably, fewer vehicles can be used to provide the same level of service to custom-ers. There is very limited information concerning the amount of energy saved by these strategies; however, they represent opportunities for agencies to improve customer service and enjoy at least some energy savings as a co-benefit.
Reducing non-revenue or “deadhead” miles is another way to reduce fuel used by buses. For example, Sound Tran-sit implemented a program to store buses downtown between the morning and evening rush hour rather than at a garage located at the edge of city. As a result, the agency saved 95,000 gallons of diesel fuel in 2008 (43). At King County Metro, improved scheduling reduced the number of buses in service at any time and reduced the number traveling to and from downtown empty at the beginning and end of the day. Total mileage savings have been between 1% and 2%, or approximately 100,000 vehicle-miles for the entire system.
Similarly, energy is saved when smaller, more fuel-efficient vehicles are used for routes with fewer customers. For exam-ple, Kansas City transit uses small buses and a “Metroflex” fleet of buses that carry 12 to 15 passengers. The small buses have fuel economy that is approximately 39% higher than the larger fleet buses, and the Metroflex fleet is about 164% more efficient (55). Using these buses effectively has helped to reduce costs, although the lower wages paid to drivers of the smaller vehicles is most likely also a factor. Another series of tests of the fuel economy of small buses across several systems found that fuel economy improvements could range from 7% to 78% (55). On a route with lower ridership demands, chang-ing from a larger to a smaller bus could save energy; how-ever, agencies should consider the possibility that maintaining smaller vehicles could increase maintenance costs.
For paratransit or other demand-response service, hav-ing real-time monitoring systems in place can also improve efficiency. For example, the Toledo Area Regional Transit Authority has scheduling software that allows passengers to effortlessly schedule and cancel rides as needed. The soft-ware also sends reminders to passengers of upcoming trips. The software has improved paratransit service by reducing missed trips and time the vehicles spend idling while waiting for a late passenger (43).
Implementing signal priority for transit vehicles improves traffic flow and can improve on-time performance of buses. This is often an essential component of bus rapid transit (BRT) service, but can benefit other transit modes as well. One study from Helsinki, Finland, found that a combination
study by 15.7% and Windsor Transit saw even greater sav-ings of nearly 25%, although these savings were measured on a closed course rather than actual service routes (53). CT Transit also implemented the program. Between 2006 and 2008 the agency provided all operators with a full day of training. During the training, operators improved fuel effi-ciency by a full mile per gallon (James Bradford, CT Transit, personal communication, Feb. 2012).
Similar programs such as DriveCam and GreenRoad focus on teaching efficient and smooth driving, reducing idling, and reducing speeding. Both programs monitor a driver’s behav-ior in the vehicle, provide real-time feedback, and allow for measurement and quantification of savings, as well as com-parison of performance across multiple operators (28, 54).
Service Design Strategies
The way that a transit route is designed has implications for the number of times a vehicle must stop, the level of conges-tion along the route, and passengers’ experience (Table 16). As more technologies to track vehicles and synchronize traffic signals are becoming available to transit agencies, it is increas-ingly possible to systematically select the most efficient vehi-cle type for a given route or to design energy-efficient transit routes by adjusting traffic signals, timing layovers, or chang-ing the spacing of stops so that vehicles spend more time mov-ing and less time idling. Granted, routes must be designed to provide the best transit service possible for travelers, so these strategies are rarely employed for their energy saving benefits alone. Among survey respondents, nearly half reported they were saving energy through transit service design strategies; however, less than one-third consider energy use when design-ing their transit routes. Nevertheless, it is likely that, whether intended or not, transit agencies around the country are saving energy through strategies they have pursued for other reasons.
Some of the strategies listed previously may have a greater impact on displaced energy use, because they serve to make transit a more attractive option and may increase rid-ership as well. For example, off-board fare payment makes
Answer Options Response Count
GPS tracking of transit vehicles 21 Signal priority for transit vehicles 20 Layover timing 14 Off-board fare payment 11 Stop spacing 9 Use of demand-response service when demand not sufficient for fixed-route service
7
Other (please specify) 3 Automatic vehicle dispatch and management for traffic flow
1
TABLE 16USE OF SERVICE DESIGN STRATEGIES AT TRANSIT AGENCIES
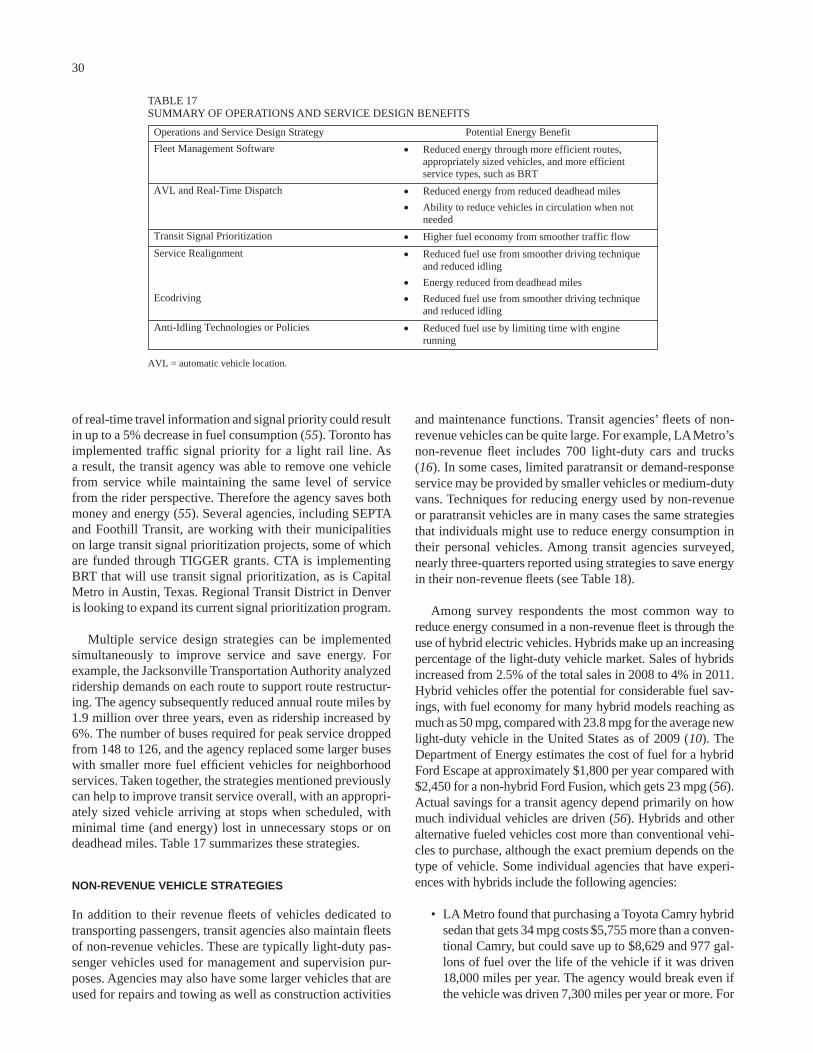
30
and maintenance functions. Transit agencies’ fleets of non-revenue vehicles can be quite large. For example, LA Metro’s non-revenue fleet includes 700 light-duty cars and trucks (16). In some cases, limited paratransit or demand-response service may be provided by smaller vehicles or medium-duty vans. Techniques for reducing energy used by non-revenue or paratransit vehicles are in many cases the same strategies that individuals might use to reduce energy consumption in their personal vehicles. Among transit agencies surveyed, nearly three-quarters reported using strategies to save energy in their non-revenue fleets (see Table 18).
Among survey respondents the most common way to reduce energy consumed in a non-revenue fleet is through the use of hybrid electric vehicles. Hybrids make up an increasing percentage of the light-duty vehicle market. Sales of hybrids increased from 2.5% of the total sales in 2008 to 4% in 2011. Hybrid vehicles offer the potential for considerable fuel sav-ings, with fuel economy for many hybrid models reaching as much as 50 mpg, compared with 23.8 mpg for the average new light-duty vehicle in the United States as of 2009 (10). The Department of Energy estimates the cost of fuel for a hybrid Ford Escape at approximately $1,800 per year compared with $2,450 for a non-hybrid Ford Fusion, which gets 23 mpg (56). Actual savings for a transit agency depend primarily on how much individual vehicles are driven (56). Hybrids and other alternative fueled vehicles cost more than conventional vehi-cles to purchase, although the exact premium depends on the type of vehicle. Some individual agencies that have experi-ences with hybrids include the following agencies:
• LA Metro found that purchasing a Toyota Camry hybrid sedan that gets 34 mpg costs $5,755 more than a conven-tional Camry, but could save up to $8,629 and 977 gal-lons of fuel over the life of the vehicle if it was driven 18,000 miles per year. The agency would break even if the vehicle was driven 7,300 miles per year or more. For
of real-time travel information and signal priority could result in up to a 5% decrease in fuel consumption (55). Toronto has implemented traffic signal priority for a light rail line. As a result, the transit agency was able to remove one vehicle from service while maintaining the same level of service from the rider perspective. Therefore the agency saves both money and energy (55). Several agencies, including SEPTA and Foothill Transit, are working with their municipalities on large transit signal prioritization projects, some of which are funded through TIGGER grants. CTA is implementing BRT that will use transit signal prioritization, as is Capital Metro in Austin, Texas. Regional Transit District in Denver is looking to expand its current signal prioritization program.
Multiple service design strategies can be implemented simultaneously to improve service and save energy. For example, the Jacksonville Transportation Authority analyzed ridership demands on each route to support route restructur-ing. The agency subsequently reduced annual route miles by 1.9 million over three years, even as ridership increased by 6%. The number of buses required for peak service dropped from 148 to 126, and the agency replaced some larger buses with smaller more fuel efficient vehicles for neighborhood services. Taken together, the strategies mentioned previously can help to improve transit service overall, with an appropri-ately sized vehicle arriving at stops when scheduled, with minimal time (and energy) lost in unnecessary stops or on deadhead miles. Table 17 summarizes these strategies.
NON-REVENUE VEHICLE STRATEGIES
In addition to their revenue fleets of vehicles dedicated to transporting passengers, transit agencies also maintain fleets of non-revenue vehicles. These are typically light-duty pas-senger vehicles used for management and supervision pur-poses. Agencies may also have some larger vehicles that are used for repairs and towing as well as construction activities
Operations and Service Design Strategy Potential Energy Benefit
Fleet Management Software Reduced energy through more efficient routes, appropriately sized vehicles, and more efficient service types, such as BRT
AVL and Real-Time Dispatch Reduced energy from reduced deadhead miles
Ability to reduce vehicles in circulation when not needed
Transit Signal Prioritization Higher fuel economy from smoother traffic flow
Service Realignment Reduced fuel use from smoother driving technique and reduced idling
Energy reduced from deadhead miles
Ecodriving Reduced fuel use from smoother driving technique and reduced idling
Anti-Idling Technologies or Policies Reduced fuel use by limiting time with engine running
AVL = automatic vehicle location.
TABLE 17SUMMARY OF OPERATIONS AND SERVICE DESIGN BENEFITS

31
refers to the electricity, natural gas, and other fuels that are used to heat, cool, and power buildings. Buildings also use some energy indirectly. Indirect energy is not consumed on site, but is inherent in other resources that buildings consume and waste that they generate. Examples of indirect energy include the energy that is required to manufacture construction materials and haul waste to landfills and the energy used to extract, treat, and distribute water to buildings.
This and the following two sections discuss ways of reduc-ing energy use in buildings. This section describes strategies to reduce direct energy use that apply to transit stops and other facilities that are unique to transit agencies. The next section describes more general green building strategies to reduce direct energy use that apply to administrative buildings and maintenance facilities, and the following section discusses strategies to reduce indirect energy use in buildings.
Although rail and bus stations, stops, and bus shelters may not be at the top of any agency’s list of energy consum-ers, they offer the opportunity for an agency to showcase its energy-saving initiatives to the public. There are opportuni-ties to save energy used to light, heat, cool, and operate sta-tion facilities. Approximately three-quarters of the agencies surveyed were in some way saving energy at their stations and stops, with the majority of respondents saving energy through lighting, as shown in Table 19. Those responding “other” primarily indicated other efficient lighting options.
light-duty trucks, the savings were less significant, with the possibility of saving $2,070 and 755 gallons of fuel over the life of the vehicle (16).
• Sound Transit reduced non-revenue fuel consumption by 15% in 2010, in part as a result of replacing nine non-revenue fleet vehicles with Toyota Priuses. In 2010, these vehicles saved the agency 1,800 gallons of fuel and about $5,600 (11).
• SamTrans identified a cost premium of $1,280 per hybrid vehicle purchased. The agency has purchased 21 Priuses and plans to replace an additional 51 vehicles with hybrids between 2012 and 2015. Payback periods are estimated to range from 2.7 to 2.9 years for past and future purchases, respectively (14).
• TriMet has added hybrid and plug-in hybrid vehicles to its non-revenue fleet and has worked with Zipcar to use shared vehicles to meet some of its non-revenue needs. Employees are able to reserve shared vehicles online for a few hours at a time when they are needed and pay for them by the hour.
Ecodriving and anti-idling measures also offer potential fuel savings for smaller vehicles. The Department of Energy estimates that the cost of idling is $0.02–0.04 per minute for a light-duty vehicle with the air conditioner running, and that aggressive driving can lower gas mileage by about 5% on down-town routes (57). At several transit agencies, anti-idling policies and driver training programs cover non-revenue vehicles as well as transit vehicles. Although not a transit agency, the city of Edmonton, Canada, has achieved significant fuel savings in its municipal fleet through its Fuel Sense program, which trains drivers in eco-driving practices. The city reports a 10% reduc-tion in fuel consumption as a result of the program (53).
ENERGY AT STATIONS AND STOPS
In addition to operating vehicles, transit agencies operate build-ings, including transit stations and stops, administrative offices, and maintenance facilities. Broadly speaking, there are two dif-ferent ways in which buildings use energy. Direct energy use
Non-Revenue Vehicle Strategies Response Count
Hybrid Electric Vehicles 29 Use of Anti-Idling Technologies or Policies 18 Driver Training for Eco-Driving/Operation of Vehicles 12 Reductions in Fleet Size 11 Maintenance Programs to Improve Fuel Efficiency 11 Trip Chaining or Other Trip Reduction Measures 6 Other (please specify) 5 Plug-in Hybrid Electric Vehicles 4 Battery Electric Vehicles 2 Hydrogen Vehicles 0 None 14
TABLE 18USE OF ENERGY SAVING STRATEGIES FOR NON-REVENUE VEHICLES
Energy Savings at Transit Stations and Stops
Response Count
LED Lighting at Stations or Stops 23 Solar-Powered Lighting at Stations or Stops 22 Other (please specify) 7 Efficient Heating or Cooling in Stations 4 None 14
TABLE 19ENERGY SAVING STRATEGIES AT STATIONS AND STOPS
32
• The Capital District Transportation Authority in Albany, New York, installed 25 solar-powered illuminated bus signs at bus stops without shelters, four solar shelter lighting systems on top of existing shelters, and 10 Big-Belly cordless compaction systems for trash disposal along a 2.5 mile corridor. In addition to the energy saved by these systems, the agency was interested in increas-ing ridership along this corridor before beginning BRT service. The project was implemented in partnership with an area business improvement district, which pro-vided $10,000 toward the project. The project found that small signs were subject to vandalism, but that the solar-powered bus shelters were effective and appreciated by users (60).
• SFMTA’s new “Wave” shelter has photovoltaic cells that generate up to 100 watts of energy. This is enough to power a fluorescent backlit information panel, rooftop lighting, and NextBus and Push to Talk technologies, which provide real-time travel information to passen-gers. In addition to powering the stop’s amenities, up to 40% of the energy generated can be supplied to the city’s power grid. SFMTA advertises these benefits to waiting customers through a sign displayed on the shelter.
• Pierce Transit in Tacoma, Washington, has 56 solar-powered stops, which do not need to be connected to the grid in order to power the lighting.
Although these strategies can reduce grid energy use, some agencies have reported reliability issues with solar-powered lighting at bus stops.
Energy-Efficient Station and Stop Design
Large transit stations and stops require energy for heating and cooling, and also for escalators and elevators. Escala-tors alone can use up to 25% of the energy at a station (2). Improved designs can reduce the energy used in each of these functions. Small design details or the use of recycled or alter-native construction materials can help to reduce energy used in construction as well as the embodied energy in the facil-ity. Stations in particular can follow many of the strategies associated with green building more generally, such as those associated with Leadership in Energy and Environmental Design (LEED) certification. More information on these types of improvements is provided in the next two sections.
SEPTA recently completed construction of a LEED-certified station funded through the ARRA. Fox Chase Station’s energy-saving elements include:
• Using light-colored surfaces to reflect sunlight and keep surfaces cool.
• Replacing 40% of cement with slag or fly ash, saving 33 tons of raw materials and 150 MBTUs (thousand BTUs) of energy, and 95% of construction waste was recycled.
LED and Other High-Efficiency Lighting
High-efficiency lighting provided either by LEDs, compact fluorescent bulbs, induction lighting, or other technologies can offer a relatively quick payback for a high degree of energy savings. Additionally, agencies can save money on labor, because a longer bulb life means less staff time spent replacing the bulbs. Efficient lighting technology comes in many variet-ies, including:
• Compact Fluorescents (CFLs): Easy replacements for incandescent bulbs, CFLs use approximately one-quarter of the energy of an incandescent bulb and last approxi-mately ten times longer. Although the purchase price of CFLs is higher, their life-cycle costs are estimated at $10 compared with $40 for an incandescent bulb.
• T-5 and T-8 Fluorescents: These fluorescent tube bulbs replace older traditional fluorescent tube lights (T-12 models) and are at least 25% more efficient than the traditional fluorescent tube bulbs. The payback period for a basic T-8 bulb is 5 years.
• LEDs are typically used for small signs such as exit lights and some street lighting. They can reduce energy use by up to 80% compared with incandescent lighting. The use of LEDs is expanding rapidly as the technology matures and becomes available in more applications.
• Induction lighting requires no electrodes and provides significant amounts of light with a long fixture lifetime. Because the costs of induction lighting remain high, they are most typically used in locations that are dif-ficult to access, making one-time installation more cost-effective (58).
Agencies will need to select the appropriate lighting replace-ment for each application based on the original lighting fix-ture and bulb and its purpose.
Numerous transit agencies have estimated energy savings associated with lighting upgrades at stations and stops. For example, in planning future upgrades, TransLink has esti-mated that lighting retrofits and controls at stations and sub-stations could result in more than 220,000 kWh saved in one year. NYCT has replaced tunnel lighting with CFLs, and LA Metro is using T-8 lights, achieving between 25% and 75% improvements in energy efficiency (3, 59).
Solar-Powered Lighting and Other Applications
Bus shelters and transit stations can be good locations for solar panels, particularly for rural systems or suburban por-tions of urban transit systems, where bus stops may be rela-tively isolated and composed of just a small shelter or sign. At such locations solar panels can completely replace any other source of power for lighting and eliminate the need to connect to the grid. Additionally, some agencies have used solar-powered lighting at stops as a public relations mecha-nism to encourage ridership. For example:
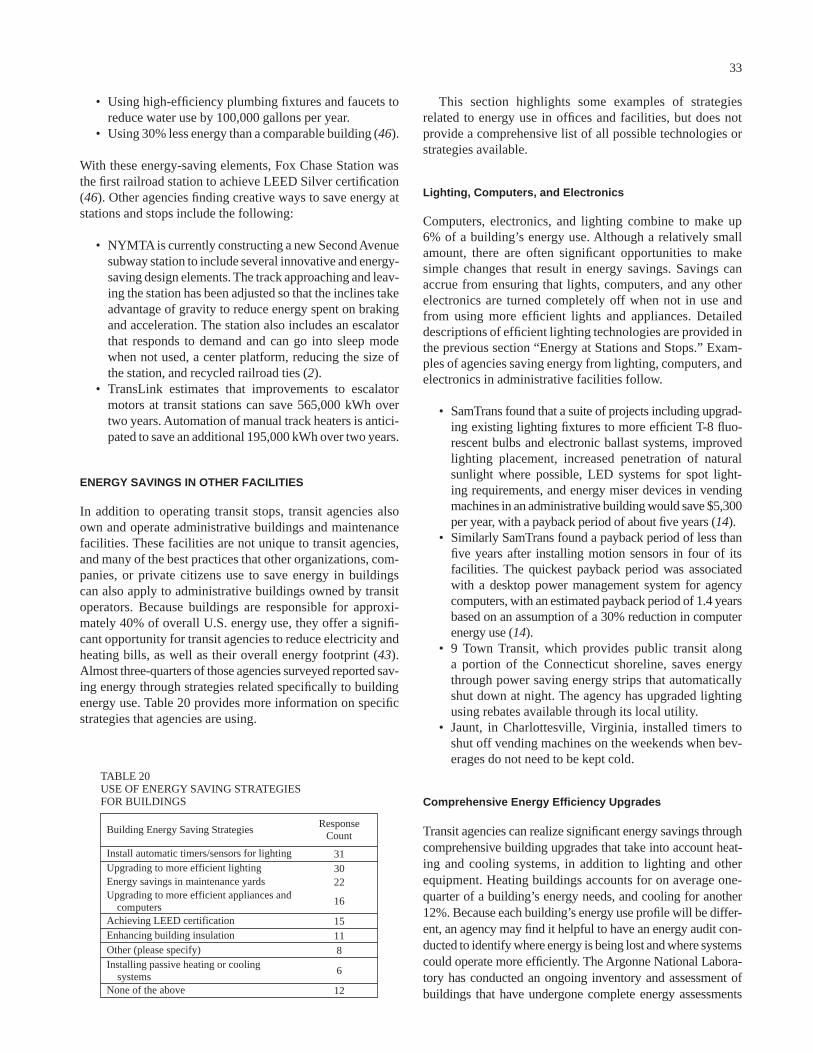
33
This section highlights some examples of strategies related to energy use in offices and facilities, but does not provide a comprehensive list of all possible technologies or strategies available.
Lighting, Computers, and Electronics
Computers, electronics, and lighting combine to make up 6% of a building’s energy use. Although a relatively small amount, there are often significant opportunities to make simple changes that result in energy savings. Savings can accrue from ensuring that lights, computers, and any other electronics are turned completely off when not in use and from using more efficient lights and appliances. Detailed descriptions of efficient lighting technologies are provided in the previous section “Energy at Stations and Stops.” Exam-ples of agencies saving energy from lighting, computers, and electronics in administrative facilities follow.
• SamTrans found that a suite of projects including upgrad-ing existing lighting fixtures to more efficient T-8 fluo-rescent bulbs and electronic ballast systems, improved lighting placement, increased penetration of natural sunlight where possible, LED systems for spot light-ing requirements, and energy miser devices in vending machines in an administrative building would save $5,300 per year, with a payback period of about five years (14).
• Similarly SamTrans found a payback period of less than five years after installing motion sensors in four of its facilities. The quickest payback period was associated with a desktop power management system for agency computers, with an estimated payback period of 1.4 years based on an assumption of a 30% reduction in computer energy use (14).
• 9 Town Transit, which provides public transit along a portion of the Connecticut shoreline, saves energy through power saving energy strips that automatically shut down at night. The agency has upgraded lighting using rebates available through its local utility.
• Jaunt, in Charlottesville, Virginia, installed timers to shut off vending machines on the weekends when bev-erages do not need to be kept cold.
Comprehensive Energy Efficiency Upgrades
Transit agencies can realize significant energy savings through comprehensive building upgrades that take into account heat-ing and cooling systems, in addition to lighting and other equipment. Heating buildings accounts for on average one-quarter of a building’s energy needs, and cooling for another 12%. Because each building’s energy use profile will be differ-ent, an agency may find it helpful to have an energy audit con-ducted to identify where energy is being lost and where systems could operate more efficiently. The Argonne National Labora-tory has conducted an ongoing inventory and assessment of buildings that have undergone complete energy assessments
• Using high-efficiency plumbing fixtures and faucets to reduce water use by 100,000 gallons per year.
• Using 30% less energy than a comparable building (46).
With these energy-saving elements, Fox Chase Station was the first railroad station to achieve LEED Silver certification (46). Other agencies finding creative ways to save energy at stations and stops include the following:
• NYMTA is currently constructing a new Second Avenue subway station to include several innovative and energy-saving design elements. The track approaching and leav-ing the station has been adjusted so that the inclines take advantage of gravity to reduce energy spent on braking and acceleration. The station also includes an escalator that responds to demand and can go into sleep mode when not used, a center platform, reducing the size of the station, and recycled railroad ties (2).
• TransLink estimates that improvements to escalator motors at transit stations can save 565,000 kWh over two years. Automation of manual track heaters is antici-pated to save an additional 195,000 kWh over two years.
ENERGY SAVINGS IN OTHER FACILITIES
In addition to operating transit stops, transit agencies also own and operate administrative buildings and maintenance facilities. These facilities are not unique to transit agencies, and many of the best practices that other organizations, com-panies, or private citizens use to save energy in buildings can also apply to administrative buildings owned by transit operators. Because buildings are responsible for approxi-mately 40% of overall U.S. energy use, they offer a signifi-cant opportunity for transit agencies to reduce electricity and heating bills, as well as their overall energy footprint (43). Almost three-quarters of those agencies surveyed reported sav-ing energy through strategies related specifically to building energy use. Table 20 provides more information on specific strategies that agencies are using.
Building Energy Saving Strategies Response
Count
Install automatic timers/sensors for lighting 31 Upgrading to more efficient lighting 30 Energy savings in maintenance yards 22 Upgrading to more efficient appliances and computers
16
Achieving LEED certification 15 Enhancing building insulation 11 Other (please specify) 8 Installing passive heating or cooling systems
6
None of the above 12
TABLE 20USE OF ENERGY SAVING STRATEGIES FOR BUILDINGS
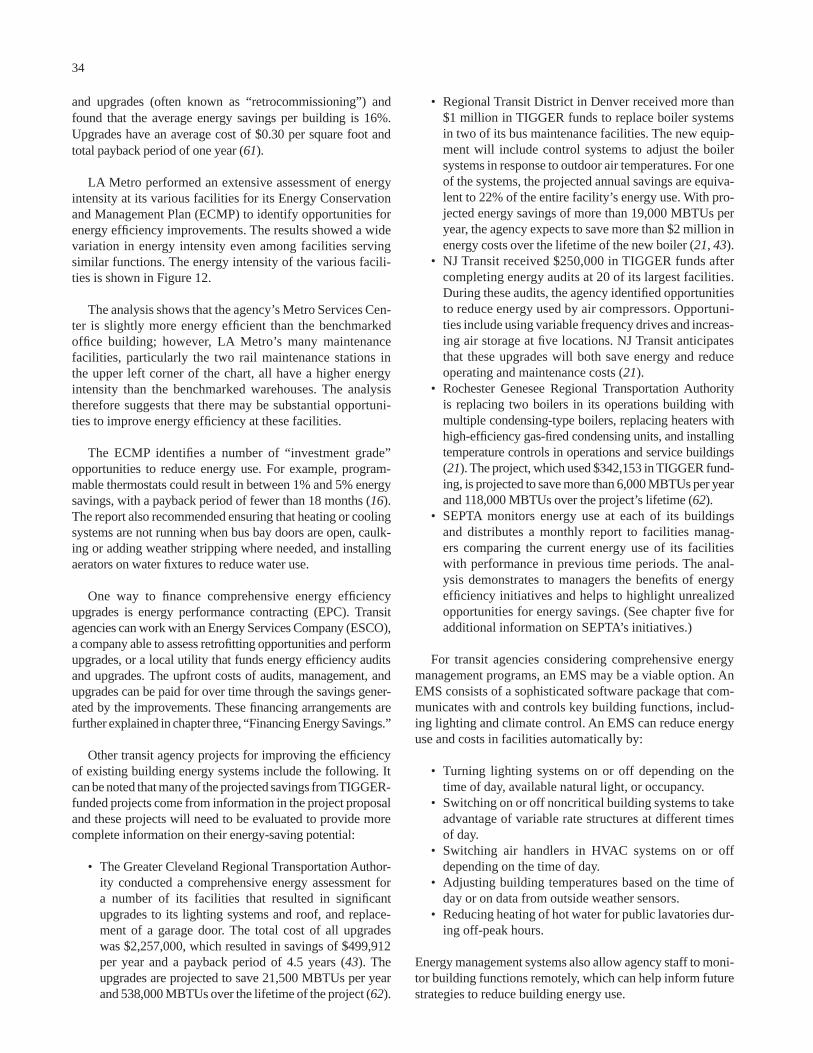
34
• Regional Transit District in Denver received more than $1 million in TIGGER funds to replace boiler systems in two of its bus maintenance facilities. The new equip-ment will include control systems to adjust the boiler systems in response to outdoor air temperatures. For one of the systems, the projected annual savings are equiva-lent to 22% of the entire facility’s energy use. With pro-jected energy savings of more than 19,000 MBTUs per year, the agency expects to save more than $2 million in energy costs over the lifetime of the new boiler (21, 43).
• NJ Transit received $250,000 in TIGGER funds after completing energy audits at 20 of its largest facilities. During these audits, the agency identified opportunities to reduce energy used by air compressors. Opportuni-ties include using variable frequency drives and increas-ing air storage at five locations. NJ Transit anticipates that these upgrades will both save energy and reduce operating and maintenance costs (21).
• Rochester Genesee Regional Transportation Authority is replacing two boilers in its operations building with multiple condensing-type boilers, replacing heaters with high-efficiency gas-fired condensing units, and installing temperature controls in operations and service buildings (21). The project, which used $342,153 in TIGGER fund-ing, is projected to save more than 6,000 MBTUs per year and 118,000 MBTUs over the project’s lifetime (62).
• SEPTA monitors energy use at each of its buildings and distributes a monthly report to facilities manag-ers comparing the current energy use of its facilities with performance in previous time periods. The anal-ysis demonstrates to managers the benefits of energy efficiency initiatives and helps to highlight unrealized opportunities for energy savings. (See chapter five for additional information on SEPTA’s initiatives.)
For transit agencies considering comprehensive energy management programs, an EMS may be a viable option. An EMS consists of a sophisticated software package that com-municates with and controls key building functions, includ-ing lighting and climate control. An EMS can reduce energy use and costs in facilities automatically by:
• Turning lighting systems on or off depending on the time of day, available natural light, or occupancy.
• Switching on or off noncritical building systems to take advantage of variable rate structures at different times of day.
• Switching air handlers in HVAC systems on or off depending on the time of day.
• Adjusting building temperatures based on the time of day or on data from outside weather sensors.
• Reducing heating of hot water for public lavatories dur-ing off-peak hours.
Energy management systems also allow agency staff to moni-tor building functions remotely, which can help inform future strategies to reduce building energy use.
and upgrades (often known as “retrocommissioning”) and found that the average energy savings per building is 16%. Upgrades have an average cost of $0.30 per square foot and total payback period of one year (61).
LA Metro performed an extensive assessment of energy intensity at its various facilities for its Energy Conservation and Management Plan (ECMP) to identify opportunities for energy efficiency improvements. The results showed a wide variation in energy intensity even among facilities serving similar functions. The energy intensity of the various facili-ties is shown in Figure 12.
The analysis shows that the agency’s Metro Services Cen-ter is slightly more energy efficient than the benchmarked office building; however, LA Metro’s many maintenance facilities, particularly the two rail maintenance stations in the upper left corner of the chart, all have a higher energy intensity than the benchmarked warehouses. The analysis therefore suggests that there may be substantial opportuni-ties to improve energy efficiency at these facilities.
The ECMP identifies a number of “investment grade” opportunities to reduce energy use. For example, program-mable thermostats could result in between 1% and 5% energy savings, with a payback period of fewer than 18 months (16). The report also recommended ensuring that heating or cooling systems are not running when bus bay doors are open, caulk-ing or adding weather stripping where needed, and installing aerators on water fixtures to reduce water use.
One way to finance comprehensive energy efficiency upgrades is energy performance contracting (EPC). Transit agencies can work with an Energy Services Company (ESCO), a company able to assess retrofitting opportunities and perform upgrades, or a local utility that funds energy efficiency audits and upgrades. The upfront costs of audits, management, and upgrades can be paid for over time through the savings gener-ated by the improvements. These financing arrangements are further explained in chapter three, “Financing Energy Savings.”
Other transit agency projects for improving the efficiency of existing building energy systems include the following. It can be noted that many of the projected savings from TIGGER-funded projects come from information in the project proposal and these projects will need to be evaluated to provide more complete information on their energy-saving potential:
• The Greater Cleveland Regional Transportation Author-ity conducted a comprehensive energy assessment for a number of its facilities that resulted in significant upgrades to its lighting systems and roof, and replace-ment of a garage door. The total cost of all upgrades was $2,257,000, which resulted in savings of $499,912 per year and a payback period of 4.5 years (43). The upgrades are projected to save 21,500 MBTUs per year and 538,000 MBTUs over the lifetime of the project (62).
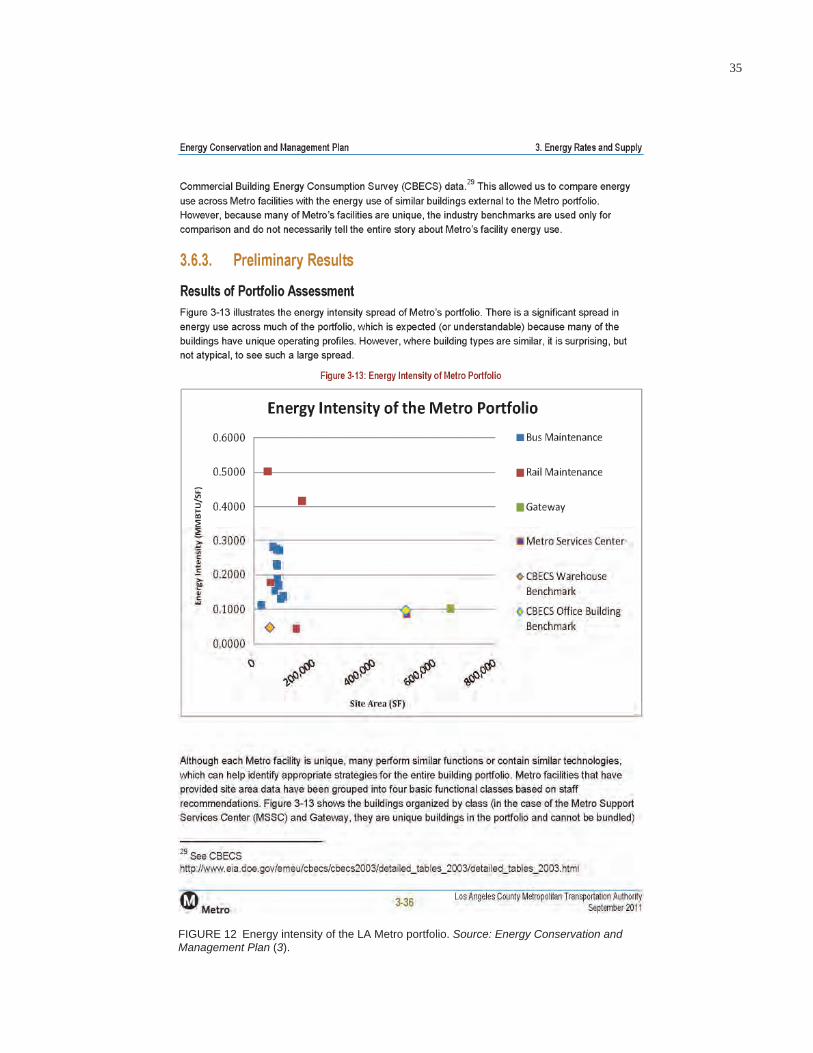
35
FIGURE 12 Energy intensity of the LA Metro portfolio. Source: Energy Conservation and Management Plan (3).
36
The total energy benefits of green buildings can be sub-stantial. Green buildings can use up to 50% less energy than conventional buildings. In addition, a General Services Admin-istration study found that overall maintenance costs are 13% lower for green buildings compared with traditional buildings (61). At least 14 U.S. transit agencies have constructed green buildings, and many of those that have done so report substan-tial energy savings compared with a conventional building.
The most commonly used system for buildings to dem-onstrate their energy efficiency is the U.S. Green Building Council’s LEED certification program, which provides differ-ent levels of certification for different levels of green building, ranging from “certified” to “platinum.” In addition, there are specific certification systems for different types of facilities. Those most relevant for transit agencies are LEED for New Construction, LEED for Existing Buildings: Operations and Maintenance, and LEED for Core & Shell. A sample of LEED certified projects at transit agencies across the country are pro-vided in Table 21.
Not all green buildings are the same; different climates, building sizes, building purposes, and available energy
Green Building Certification
Transit agencies needing to build new stations, maintenance facilities, or office buildings, or renovate existing structures have a host of cost-effective green building approaches to use that will reduce their energy bills over the long run. “Green” buildings use many of the energy efficiency strate-gies described in previous sections. Buildings are generally termed green when these strategies are integrated into the design of a new building or the retrofit of an existing building such that they meet certain criteria set out in a green building certification system.
Many different certification systems exist to help guide designers in constructing a green building. Although these certification systems cover a wide range of aspects of build-ing design, including many that affect indirect energy con-sumption through improved water fixtures, construction materials, and landscaping, one of their key benefits is to reduce direct energy consumption. This section discusses direct energy use reductions in certified green buildings; the following section will discuss strategies to reduce indirect energy use.
Rating Systems for Green Buildings
There are a number of certification systems available for green buildings. The following were recognized by FTA in its Transit Green Building Action Plan.
LEED—Leadership in Environmental Design
LEED measures a building’s performance in energy savings, water use, carbon dioxide emissions, indoor environmental quality, and stewardship of resources and sensitivity to their impacts. Projects can be certified as Certified, Silver, Gold, and Platinum. At present, 442 localities and 34 state governments have legislation, resolutions, policies, incentives, or similar mechanisms in place to encourage the use of the LEED system.
Available at: http://www.usgbc.org/leed
Energy Star® for Buildings and Manufacturing Plants
This self-rating system, which was developed by EPA and DOE, rates building energy efficiency on a 100 point rating scale, with buildings receiving a score of 50 considered to be average and more than 75 considered to be top performing. The sys-tem takes into account a building’s size, location, and source energy in determining what each building’s worst performing or best performing level of energy use would be.
Available at: http://www.energystar.gov/index.cfm?cbusiness.bus_bldgs
Green Globes Building Rating System
The Green Building Initiative developed two green building rating systems for new construction and existing buildings, which assesses management, the site, energy, water, resources, emissions, and the indoor environment. Projects can receive between one and four globes for their achievements. The system works in partnership with Energy Star and 18 states provide incentives or policies related to Green Globes.
Available at: http://www.thegbi.org/

37
resources mean that green building techniques that are promising in one area might not work in another. Gener-ally, green building strategies minimize the energy required for heating and cooling by adapting to the local climate through techniques such as passive solar heating in north-ern climates and white roofs in warmer climates. Insulat-ing elements such as green roofs (roofs with vegetation grown on top) help to keep a building warmer during cooler months and cooler during the warmer ones. Transit agen-cies both large and small have begun to take advantage of green construction and building practices. A sample of these appears here.
• Downeast Transportation in Bangor, Maine, recently completed a 22,000 square foot LEED-certified main-tenance facility, projected to use 50% less energy than a baseline facility. Some of the design elements included in the facility are solar panels, high energy-efficient con-densing gas boilers, radiant floor heating, four inches of insulation compared with a half inch for a baseline building, and high-efficiency windows.
• CTA renovated its administrative building in 2004 and has achieved a LEED-Gold rating for existing buildings.
Project Name Owner Location Type of Certification
East Valley Bus Administration Facility City of Tempe Tempe, AZ LEED® - Gold
East Valley Bus Operation and Maintenance Facility
City of Tempe Tempe, AZ LEED® - Gold
MTA Transportation Building Division 9 Los Angeles County Metropolitan
El Monte, CA LEED® - Gold
Santa Clarita Transit Maintenance Facility City of Santa Clarita Santa Clarita, CA LEED® - Gold
Lory Student Center Transit Center, Colorado State University
City of Fort Collins Fort Collins, CO LEED® - Gold
Chicago Transit Authority Headquarters Chicago Transit Authority
Chicago, IL LEED® - Gold
Bay Area Transportation Authority Bay Area Transportation Authority
Traverse City, MI LEED® - Gold
Apgar Transit Center, Glacier National Park National Park Service West Glacier, MT LEED® - Gold
Charlottesville Transit Station Charlottesville Transit Service
Charlottesville, VA LEED® - Gold
Interurban Transit Partnership Interurban Transit Partnership
Grand Rapids, MI LEED® - Certified
Wabash Station Reno City of Columbia, Public Works
Columbia, MO LEED® - Certified
Corona Maintenance Shop and Car Washer New York City Transit Queens, NY LEED® - Certified
Salt Lake City Intermodal Passenger Hub Utah Transit City Corporation
Salt Lake City, UT LEED® - Certified
Pentagon Metro Entrance Facility Pentagon Renovation Office
Arlington, VA LEED® - Certified
Report to Congress: Transit Green Building Action Plan [Online]. Available:http://www.fta.dot.gov/documents/Transit_Green_Building_Action_Plan.pdf (61).
TABLE 21EXAMPLES OF CERTIFIED GREEN BUILDINGS AT TRANSIT IT AGENCIES
The building’s energy saving features include a green roof covering 90% of the roof area, use of natural day-light that allows for some lights to be completely turned off from June through October, low-flow plumbing, and advanced heating and cooling controls (61).
Some transit agencies have explicit internal policies that commit to achieving green building certification for new buildings. These policies can mandate that newly constructed or renovated buildings achieve a certification standard or reduce energy consumption by a certain amount. Examples include:
• NYMTA is currently drafting its own MTA Green Build-ing Guidelines, which will incorporate LEED criteria in addition to MTA-specific criteria. The Guidelines are intended to serve as an industry model, as they will be more transit agency specific than existing guidelines.
• WMATA and King County Metro both have goals that all new buildings meet LEED Silver standards and Sound Transit plans to require that all new buildings constructed attain a LEED Silver certification level (11, 50).
38
TABLE 22USE OF EMPLOYEE COMMUTE STRATEGIES
Alternative Workforce Management
ResponseCount
Providing transit benefits 19 Providing bike benefits or bike amenities (bike racks or showers on site)
14
Encouraging ridesharing or vanpool participation
13
Allowing for compressed work weeks or telework 13
Other (please specify) 1 None of the above 25
APTA’s Transit Sustainability Guidelines (50)
APTA’s Sustainability Guidelines suggest a number of “green” construction principles for transit agencies that can reduce energy use.
1. Use heat recovery units (also known as energy recovery ventilators) to provide heating and cooling.2. Design fenestration and shading to avoid unwanted solar gain by using low-emissivity glass or external light shelves.3. Design facilities with increased wall and roof insulation, including vegetative roofs.4. Use motion sensors to minimize idle lighting.5. Use air-quality sensors and variable-frequency ventilators to adjust air exchange.6. Use rapid roll-up doors to minimize losses of conditioned air in maintenance and repair facilities.7. Consider process heat recovery for domestic hot water.8. Incorporate light and temperature controls at facilities’ offices.9. Minimize right-of-way electrical transmission losses through optimized substation spacing.
10. Minimize right-of-way transmission losses through use of a better conductive material for contact rail or catenaries (e.g., aluminum/aluminum composite third rail).
11. Ensure early dialogue with the local utility when exploring new approaches to energy efficiency, production and pur-chasing. Review scope of work with the utility and potential impacts, including challenges and benefits. Establish a general understanding of the extent of utility impact. Get support from the utility.
12. Leverage the utility’s expertise in energy production to produce and/or purchase renewable energy.13. Leverage the transit agency’s long-term facility ownership.14. Utilize energy efficiency and renewable energy pilot projects to study the effectiveness of possible improvements.
Select projects that fit transit capital goals, funding, and budgets.
STRATEGIES TO REDUCE INDIRECT ENERGY USE IN FACILITIES
The previous two sections discussed strategies that transpor-tation agencies are using to reduce the use of electricity and fuels that directly power, heat, and cool buildings. However, transit agencies can also take steps to reduce the energy that agency employees use to commute to work, that water utili-ties use to treat and distribute water for transit facilities, that waste management companies use to haul and process waste, and that manufacturers use to make and distribute materi-als needed to construct, maintain, and operate facilities. Although transit agencies are not billed for this energy, many have taken steps to reduce indirect energy use to meet agen-cies’ sustainability goals, save money on water or waste dis-posal, or raise public awareness about environmental issues and initiatives.
Employee Commute Programs
Although transit agencies typically work to provide the pub-lic with energy-efficient travel options, many also work to reduce the energy that their own employees use to travel to work by offering incentives and education designed to encourage employees to take public transit, carpool, ride bicycles, or work from home instead of driving. Table 22 shows the strategies that survey respondents use to reduce the energy used for employee commutes.
An employee commute program is one of the least-used strategies by the transit agencies surveyed, with just over half
reporting implementing any commute programs. However, all transit agencies provide free transit rides to their employ-ees as a standard benefit. Agencies that have more formal programs to encourage alternative commuting patterns often use multiple strategies in concert. Some even extend transit benefits to spouses of employees. Examples include:
• NYMTA provides tax-free transit benefits for employ-ees using NJ Transit. Some of the MTA agencies allow for telecommuting.
• In addition to transit passes for employees and spouses, TriMet also provides bike parking and showers for employees.
• SunTran provides transit passes for employees and their family members, a compressed work week for adminis-trative staff, and bike lockers and showers at bus main-tenance and storage facilities.

39
on water bills and on energy used for water heating, as well as reducing sewer discharge (65).
• Jacksonville Transit Authority recycles water at its bus washing facility and is planning on installing a solar-powered water heater in the future.
Waste Management
Transit agencies must manage significant amounts of waste generated by their agencies’ operations and by passengers. Some of the waste types specific to transit agencies include waste oil, hazardous substances, and even retired fleet vehi-cles, which may require creative solutions for proper dis-posal. Some of these materials can be reused by the agency, refurbished to prolong usefulness, or sold to recyclers instead of being thrown away. For example, agencies can retread their tires before recycling them to prolong life or monitor battery fluid levels to ensure that batteries have been fully discharged before disposal. All of these approaches reduce indirect energy use by limiting the amount of energy needed to manu-facture new materials. These strategies also help to reduce agency costs. Among survey respondents, about half noted that their agency engages in waste diversion and recycling.
Some examples of transit agencies recycling these types of materials are described here:
• NYMTA sold 21,305 tons of scrap material in 2011, bringing in more than $7.8 million. Between 2001 and 2010, the agency gave more than 2,500 obsolete rail-cars to states along the east coast for use as artificial reefs. The subway cars were cleaned of their residue and then lowered into the ocean, where they provide a reef habitat for an aquatic ecosystem (59). To the extent that these practices reduce the use of virgin materials, they also reduce indirect energy use.
• Denver’s RTD recycles mixed oil, coolant, filters, and tires. The agency also recycled 262 tons of metal (steel, aluminum, and copper) in 2009. Metal recycling yielded $19,189 from selling this material as scrap (64).
• Jaunt, Inc. in Charlottesville, Virginia, recycles waste oil by using it to heat its maintenance shop.
Transit agencies also generate mixed solid waste streams. Administrative buildings generate paper waste, and travel-ing passengers dispose of a wide variety of materials while passing through transit agency stations and stops. Providing recycling receptacles to employees and passengers helps to divert this waste from landfills. Recycling in turn reduces indirect energy use by reducing the amount of energy used to manufacture new materials. Recycling can also reduce waste hauling costs for transit agencies. Examples of general waste recycling programs at transit agencies include:
• SamTrans, which currently achieves a 28% diversion rate on waste overall, calculated the cost–benefit ratio of increasing its diversion rate to 50%. The agency estimated
Although many agencies run employee commute programs, few survey respondents had any information about the impacts of their programs on the agency’s indirect energy use. For many transit agencies, providing this type of benefit makes sense to encourage employees to “practice what they preach”; therefore, the indirect energy savings may be viewed as a co-benefit. Commute reduction strategies may also reduce the cost of building new facilities if they enable transit agencies to reduce the number of parking spaces provided.
Water Use
Transit agencies use significant amounts of potable water to wash buses and railcars. For example, LA Metro used 236 million gallons of water in 2010, and 90% of that went to bus and car washing (16). NYMTA draws between 1.2 and 1.4 billion gallons of potable water per year to cool subway transformers (63). These amounts are in addition to normal water use by employees and by heating and cooling systems.
Treating and distributing water is energy-intensive, partic-ularly in hot, dry climates. Although agencies are not billed directly for this energy, its cost is included in the rates that they pay for water; therefore, agencies have a direct incen-tive to reduce water consumption. Some agencies closely monitor water use at facilities to identify potential reductions or seek opportunities to recycle water. Approximately two-fifths of survey respondents reported using water conserva-tion measures. For example:
• LA Metro identified a series of steps to reduce its water use, including recycling runoff water from bus bays, replacing water fixtures in bus and rail stations and steam-ers with models that use less water, and using recycled water where possible. These steps combined would save $69,000 per year in water purchasing costs alone (16).
• NYMTA examined its water use and determined that it could achieve a 25% reduction in potable water use and thereby save up to $2 million per year. Strategies to reduce potable water use include recovering water used to cool subway transformers, providing water pumped from subway tunnels to other industrial users in the area, and using greywater for flushing. Currently, the LEED-certified Corona Maintenance shop uses harvested rain-water to wash subway cars (63).
• Utah Transit Authority began recycling its bus wash water in 2007. In the three years between 2007 and 2010, the agency reduced its water consumption by 37% across five divisions (13).
• Regional Transit District in Denver, Colorado, changed water fixtures in administration bathrooms in its admin-istrative buildings. The agency estimated that the new fixtures reduce water use by 67% (64).
• Houston Metro has a wastewater treatment system to recycle water from vehicle washing and cleaning oper-ations. The system removes solids from the water so that they can be disposed of at a landfill. It saves money

40
Examples of agencies using recycled materials in new construction include:
• While extending its light rail line, TriMet used 6,000 plastic rail ties made from recycled gas tanks, recycled plastic bollards instead of reinforced metal stanchions (saving more than $250,000 in purchase and installa-tion costs), and mixed existing road-base concrete with an added layer of asphalt, which reduced trucking and disposal fees by more than $2 million dollars (49).
• NYMTA has studied the use of engineered compos-ite plastic ties or recycled plastic ties on its rail lines instead of wooden rail ties. The agency’s analysis noted that plastic railroad ties also reduce problems associ-ated with leaching byproducts used to preserve wooden rail ties (47).
RENEWABLE POWER GENERATION
Transit agencies can reduce energy consumption from the grid (although not necessarily overall energy consumption) by generating renewable energy at their facilities. On-site renewable energy generation is often included in green build-ings; however, many transit agencies have unique opportu-nities for larger-scale renewable energy generation because they own so much property that is suitable for siting renew-able energy installations. The transit agencies surveyed have installed renewable energy projects in a variety of set-tings, including stations, maintenance yards, administrative buildings, and agency-owned rights-of-way. The FTA’s TIGGER program has funded 25 renewable energy installa-tions. Some agencies are also purchasing renewable energy credits for energy they do not generate on site to fulfill agency goals for GHG reductions. Although renewable energy may reduce an agency’s carbon footprint, it does not actually reduce the direct energy consumed. However, on-site energy generation facilities may lower indirect energy use by reducing the amount of energy lost in transmission.
The most common power generation strategies employed at transit agencies are solar installations, with some agencies gen-erating energy from stationary fuel cells, wind, and geothermal sources (see Table 24). The vast majority of the agencies that do generate renewable energy use solar facilities to do so.
savings with a NPV of $216,700 over multiple years, and a payback period of less than a year. Of 19 strategies ana-lyzed by SamTrans, enhanced recycling had the highest NPV. This is partly the result of the free recycling that is available to the agency (14).
• In 2010, Sound Transit recycled 15% and composted 9% of its waste. However, the agency has a goal to divert 100% of its waste stream from landfills. Sound Transit also managed to recycle or salvage 78% of the construc-tion materials from a recent light rail construction site (12).
• LA Metro has a contractor who separates recycling waste from a mixed waste stream. The contractor recycled 44% of the waste in 2010, and the agency managed to generate 531 fewer tons of solid waste than the previous year (6).
• Denver’s RTD recycles printer cartridges and has eval-uated the publications it receives to eliminate those it does not need or can receive electronically. The agency managed to reduce paper use by 12% in 2008, recy-cling 48.7 tons. Additionally, the agency has made a conscious effort to conduct as much business as pos-sible electronically, which reduces mailing, printing, copying, and waste disposal costs (64).
Beyond reducing the amount of waste that goes to landfills, transit agencies may also consider green purchasing practices that increase the amount of recycled products that they con-sume, thereby indirectly reducing the energy required to man-ufacture products. Green procurement practices range from purchasing recycled paper to purchasing railroad ties made of recycled materials. Whether these strategies produce cost savings or cost premiums depends on the specific product.
Construction Materials
When constructing new transit facilities, many transit agen-cies take steps to ensure that these facilities not only consume less energy in operation, but also reduce indirect energy used to manufacture and transport construction materials. Table 23 shows the various strategies that agencies responding to the survey employ. Note that, although not explored in depth in this synthesis, agencies also may have the opportunity to reduce their indirect energy use by seeking out contractors who use energy-efficient construction equipment.
Answer Options Response
Count
Use of Alternative (Recycled) Construction Materials
17
Recycling Construction Waste 17 Sourcing Materials Locally 16 Reuse of Building Materials to Reduce Waste 13 Other (please specify) 6 None 17
TABLE 23STRATEGIES TO REDUCE ENERGY USE FROM CONSTRUCTION AND MAINTENANCE TABLE 24
RENEWABLE ENERGY SAVING STRATEGIES
Renewable Energy Generated on Site Response
Count
Solar 24 Wind 3 Geothermal 1 Fuel cells 2 Other (please specify) 0 None 22

41
A number of other agencies have smaller projects or use solar energy to power stations and stops (see “Energy at Stations and Stops”). The emergence of power purchase agreements that allow an agency to avoid paying the up-front installation and maintenance costs for solar energy are mak-ing solar projects increasingly feasible. Financing strategies for renewable energy projects are examined in more detail in chapter three (“Financing Energy Savings”).
Wind
Generating wind energy is more of a challenge for transit agencies, as installing turbines can be controversial and require a large site with consistent wind patterns. Very few transit agencies have installed wind turbines, although a number are studying options for wind-based electricity gen-eration. Agencies using or considering wind energy include:
• Greater Lafayette Public Transportation Corporation (Lafayette, Indiana) has installed three turbines near its administrative and maintenance facilities. The system is expected to last about 30 years and to provide approxi-mately 90% of the total amount of electricity that the agency uses (11). Through the project’s installer (North-ern Power) the agency provides a website with real-time information on the system’s energy generation and statis-tics on the energy generated to date. Since July 2011, the system has generated 177,000 kWh and saved approxi-mately $16,700 (as of June 13, 2012) (69).
Currently, renewable energy generation at transit agencies is generally limited to small scale installations and demon-stration projects at individual facilities.
Solar
Solar energy is by far the most common form of alternative energy used by transit agencies. Solar panels can be installed on the roofs of a wide variety of agency-owned buildings such as maintenance facilities, administrative offices, or at stations or bus shelters, where they can fulfill the shelter’s lighting needs. However, maintenance facilities, which tend to have larger, flatter roofs, may offer the greatest opportu-nity for energy generation. A few examples of solar power in use at transit agencies are listed here. It can be noted that many of the projected savings from TIGGER-funded proj-ects come from information in the project proposal, and these projects will need to be evaluated in order to provide more complete information on their energy-saving potential:
• LA Metro has installed four photovoltaic projects that generate 2,700,000 AC kWh annually and help the agency to reduce its electricity bill by $300,000 and its overall electricity usage from the grid by 8% (3). By far the largest of these installations (1.2 MW) is located on the agency’s Central Maintenance Facility. LA Metro is also beginning to look at smaller scale installations at stations along the Blue Line (66).
• The Metropolitan Atlanta Regional Transit Authority (MARTA) recently installed a 1.2 MW system as a solar canopy in the parking lot of a bus maintenance facility, which will shade 220 bus parking stalls. The installa-tion, which was funded through the TIGGER program, is projected to halve the grid energy required at the garage (a savings of about $160,000 annually), and will further conserve energy by reducing temperatures inside the buses when they are parked, thus reducing air conditioning needs (67). MARTA estimates that the project will save approximately 4,000 MBTUs per year or 184,000 MBTUs over the project’s lifetime (62).
• CT Transit has installed a 2.3 MW system of 210 pho-tovoltaic panels on the roof of its Hartford maintenance shop (Figure 13). As a co-benefit to the energy produc-tion, the panels insulate the roof, decreasing the build-ing’s heating and cooling costs and extending the life of the roof. The panels are expected to last 30 years and will save CT Transit $85,000 annually. Because the sys-tem was financed entirely through grants from a variety of sources, the savings will accrue immediately.
• Santa Clara Valley Transportation Authority (San Jose, California) recently installed three solar installations on bus facilities. It estimates that the output of their solar systems will save the agency $1.5 million dol-lars (NPV) over more than 20 years. Because the agency is using a power purchase agreement, it does not have to finance the installation or maintenance of the systems (68).
FIGURE 13 CT Transit’s solar array.

42
Geothermal
Geothermal energy uses an underground heat source to pro-vide heating, cooling, or power to buildings. A geothermal heat pump uses underground heat directly in an HVAC system, and can significantly reduce the need to heat or cool buildings with other energy sources. In Illinois, the Champaign–Urbana Mass Transit District received a TIGGER grant to upgrade one of its facilities with a geothermal heat pump system. In addition, part of the Red Rose Transit Authority’s (Lancaster, Pennsylvania) upgrades to its primary operations facility will include geothermal energy for heating and air conditioning needs (21). It is also possible to generate electricity using geo-thermal energy.
SUMMARY OF ENERGY SAVING STRATEGIES
The previous sections describe a wide variety of strategies that transit agencies can use to save energy, and are summa-rized in Table 25. The following provides an overview of the strategies identified as well as a brief summary of the mag-nitude of energy savings that can be expected from various strategies, based on findings from the FTA’s TIGGER pro-gram. Not all strategies can be used to save energy at every agency. Agencies will need to consider individual strategies in the context of their particular systems.
It is not possible to draw detailed conclusions about which strategies are most and which are least effective at saving energy for transit agencies. Most of the energy that transit agencies consume is used to power vehicles. As a result, transit agencies have opportunities to save large amounts of energy in their fleets. However, building energy efficiency improvements can often be implemented relatively quickly and cheaply. These types of strategies may be more appeal-ing to transit agencies for those reasons.
More comparative analyses of energy-saving strategies are needed to draw further conclusions. Because the applica-tion of each strategy varies from agency to agency, individual transit agencies will benefit most from conducting their own analyses. At present only a few agencies, including BART, NYMTA, and LA Metro, have done so.
FTA’s TIGGER grant program offered one of the first opportunities to assess the performance of energy efficiency projects at transit agencies on a national scale. It can be noted that the energy savings provided is an estimate drawn from project proposals, and these projects will need to be evaluated to provide more complete information on their energy-saving potential. Also, cost figures are provided only for TIGGER grant funds and do not include any matching funds. Still, it can be informative to compare expected results across some broad categories of strategies, as in Table 26.
The highest average energy reductions both per project and per TIGGER dollar are for rail projects, with controls
• LA Metro is examining the possibility of using its Red Line subway tunnel to generate wind energy (66). The agency could potentially use the energy to power sta-tions or trains, or energy could be input to the grid (16).
• New York MTA is exploring entering a consortium with area utilities, the city, and other local governments to develop offshore wind sources that are estimated to generate 1,500 MW annually. The agency also analyzed sites in its ROW on Long Island for areas with compat-ible land uses, where it was possible to easily connect to transmission lines, and where permitting requirements and community sentiment might allow wind turbines to be installed. At the time of the analysis, the areas iden-tified would only account for about 0.2% of demand from the Long Island Railroad’s facilities (70).
Stationary Fuel Cells
Stationary fuel cells, similar to those used in hydrogen-powered vehicles, use hydrogen fuel and oxygen to produce electricity, heat, and water. Fuel cells can replace traditional diesel-powered generators. Technology for stationary fuel cells is relatively new; however, a few agencies have begun to deploy them successfully.
CT Transit recently installed a 400 kW fuel cell sys-tem that uses natural gas and is much more efficient than the previous diesel-powered system (Figure 14). Although the previous generator operated at approximately 35% effi-ciency, the new system is expected to operate at about 80% efficiency and reduce the facility’s energy needs by up to 59% (6,311 MBTUs per year) (62). The fuel cell system also generates hot water in a combined heat and power configura-tion. As a co-benefit, the system generates very few emis-sions, benefitting local air quality as well (71). NYMTA has also installed a stationary fuel cell system at its Corona Yard Maintenance Shop in cooperation with the New York Power Authority.
FIGURE 14 CT Transit’s stationary fuel cell. Courtesy: CT Transit.
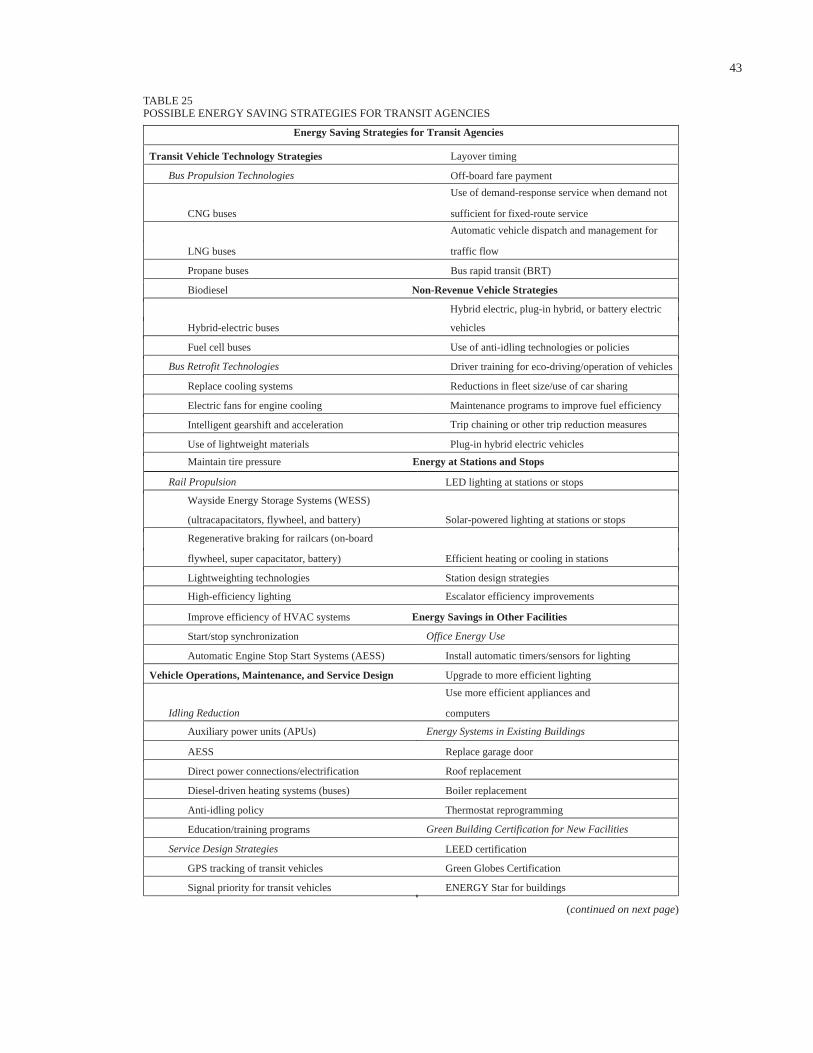
43
TABLE 25POSSIBLE ENERGY SAVING STRATEGIES FOR TRANSIT AGENCIES
Energy Saving Strategies for Transit Agencies
Transit Vehicle Technology Strategies
Bus Propulsion Technologies
CNG buses
LNG buses
Propane buses
Biodiesel
Hybrid-electric buses
Fuel cell buses
Bus Retrofit Technologies
Replace cooling systems
Electric fans for engine cooling
Intelligent gearshift and acceleration
Use of lightweight materials
Maintain tire pressure
Rail Propulsion
Wayside Energy Storage Systems (WESS)
(ultracapacitators, flywheel, and battery)
Regenerative braking for railcars (on-board
flywheel, super capacitator, battery)
Lightweighting technologies
High-efficiency lighting
Improve efficiency of HVAC systems
Start/stop synchronization
Automatic Engine Stop Start Systems (AESS)
Vehicle Operations, Maintenance, and Service Design
Idling Reduction
Auxiliary power units (APUs)
AESS
Direct power connections/electrification
Diesel-driven heating systems (buses)
Anti-idling policy
Education/training programs
Service Design Strategies
GPS tracking of transit vehicles
Signal priority for transit vehicles
Layover timing
Off-board fare payment
Use of demand-response service when demand not
sufficient for fixed-route service
Automatic vehicle dispatch and management for
traffic flow
Bus rapid transit (BRT)
Non-Revenue Vehicle Strategies
Hybrid electric, plug-in hybrid, or battery electric
vehicles
Use of anti-idling technologies or policies
Driver training for eco-driving/operation of vehicles
Reductions in fleet size/use of car sharing
Maintenance programs to improve fuel efficiency
Trip chaining or other trip reduction measures
Plug-in hybrid electric vehicles
Energy at Stations and Stops
LED lighting at stations or stops
Solar-powered lighting at stations or stops
Efficient heating or cooling in stations Station design strategies
Escalator efficiency improvements
Energy Savings in Other Facilities
Office Energy Use
Install automatic timers/sensors for lighting
Upgrade to more efficient lighting
Use more efficient appliances and
computers
Energy Systems in Existing Buildings
Replace garage door
Roof replacement
Boiler replacement
Thermostat reprogramming
Green Building Certification for New Facilities
LEED certification
Green Globes Certification
ENERGY Star for buildings
(continued on next page)

44
Although informative, it is important to note that Table 26 does not take into account total project costs, because many TIGGER grantees also draw funds from other sources. Addi-tionally, the cost-effectiveness of some types of projects may change as technology develops. For example, stationary fuel cells, WESS, and bus technologies may improve in the com-ing years or may become less expensive. For agency decision makers, understanding the likely magnitude of savings from
for track switches or rail heaters providing by far the greatest savings, although the analysis includes only two projects. Facility upgrades also appear to be highly cost-effective. On a per-project basis, wind projects and hybrid bus proj-ects funded by TIGGER are projected to save the smallest amounts of total energy. Newer technologies with high capi-tal costs, such as WESS and stationary fuel cells, produce the fewest savings per TIGGER dollar invested.
Technology Category
Sub-Category Number of
Projects
MBTU saved per
Project per Year (average)
Lifetime Energy Savings
per TIGGER $ (BTU/$)
Bus Efficiency Hybrid buses 19 1,857 10,607 Efficiency retrofit 5 4,893 41,607 Zero-emission buses 16 3,357 11,504
Total Bus Efficiency Projects 40 2,284 12,693
Rail
Wayside energy storage system
3 57,211 5,775
Locomotive upgrades 3 43,907 562,825 On-board energy storage 2 242,688 41,965 Controls for track switches or rail heaters
2 5,007,959 1,116,660
Total Rail Projects 10 40,466 296,736
Facility Efficiency
Facility upgrades (lighting, building envelope upgrades, etc.)
14 24,789 393,571
Solar 15 3,061 27,274
Wind 2 1,781 20,463
Stationary fuel cell 3 6,146 9,860
Geothermal 5 NA NA Total Facility Efficiency Projects 39 10,640 91,323
Adapted from Eudy et al. “Transit Investments for Greenhouse Gas and Energy Reduction Program: First Assessment Report [Draft]” (72). NA = not available.
TABLE 26ENERGY SAVINGS BY PROJECT TYPE FOR TIGGER GRANTEES
Enhancing building insulation
Recycling programs
Composting programs
Selling scrap metal and materials
Construction Materials
Use of alternative (recycled) construction materials
Sourcing materials locally
Reuse of building materials to reduce waste
Renewable Power Generation
Solar panels
Wind power
Geothermal
Fuel cells
Flexible work schedules
Water Use
Recycling bus bay runoff and wash water
Rainwater harvesting
Use of low-flow fixtures
Waste Management
Green roofs
Passive solar design
Strategies to Reduce Indirect Energy Use
Employee Commute Programs
Transit passes
Bike infrastructure for employees
Telework programs
TABLE 25(continued)
45
different strategies is important; however, which particular strategies are feasible and effective for a particular agency will depend on how the agency currently uses energy.
OPPORTUNITIES TO SAVE ENERGY AT DIFFERENT TYPES OF TRANSIT AGENCIES
As illustrated by the examples in this chapter, an agency’s size and operating characteristics will affect the type and range of energy-saving strategies that the agency can pursue. Larger transit agencies have a wide range of maintenance facilities, often provide rail service, and may engage in their own construction projects such as expanding rail lines or building new buildings. They have the opportunity to pursue a correspondingly large range of strategies to reduce energy use. With larger fleets they will likely have greater opportu-nities to reduce energy use through fleet optimization and energy-efficient vehicle specifications. Larger agencies also have larger operating budgets for relatively expensive strate-gies, such as generating renewable energy.
For smaller agencies providing only one or two modes of transit, such as bus or paratransit, the options for energy sav-ings are likely to be more limited. Some of these agencies do not own their own buildings. Smaller agencies may also con-tract out certain maintenance, cleaning, and repair activities. With less control over these functions and smaller budgets, a smaller agency typically will not have as many opportunities to implement energy-saving strategies.
Transit agencies will also see different opportunities to reduce energy consumption depending on the type of ser-vice that they offer. Most of the U.S. transit fleet is made up of buses and paratransit vehicles, which are most likely to operate on diesel fuel or gasoline. These fleets have oppor-tunities to use biofuels or to switch to more efficient vehicle types. Energy saving strategies for rail systems are some-what different. For example, rail agencies can increase the efficiency of the electricity distribution systems that serve rail cars.
Geography can also be a factor for agencies in select-ing energy-saving strategies. For example, many renewable energy sources, such as wind power or solar panels, are not viable in all locations. The performance of alternative-fueled vehicles can also vary based on terrain. For example, hybrid buses perform differently on flat versus hilly terrain. Transit agencies must take their operating routes into account when selecting new vehicle technologies.
Regardless of these differences, all transit agencies can find ways of reducing their energy use or increasing their energy efficiency. Although some of the energy efficiency measures discussed in this report have relatively small impacts on their own, many transit agencies have substan-tially lowered their energy bills by pursuing a suite of indi-vidual measures that add up to a greater change. The case examples of diverse agencies in the next chapter demonstrate the wide variety of options available.

46
Because transit has been present in Philadelphia for nearly a century, and much of SEPTA’s system was built in the early 20th century, the age of the system can pose challenges for energy efficiency efforts. Nevertheless, SEPTA has created a robust sustainability plan that strategically identifies improve-ments that can both reduce energy consumption and pay for themselves in the long term.
Strategic Planning
SEPTA’s current sustainability plan grew out of its 2009 board-adopted five-year strategic business plan. The business plan, developed with public and stakeholder outreach and titled Part-nering for Regional Sustainability, laid out sustainability as one of seven key objectives for strategic growth and improvement over the five-years. It identifies sustainability as part of the agency’s mission and as an area where the agency has a corpo-rate responsibility to lead. Following adoption of the business plan, SEPTA convened a cross-departmental working group to draft a sustainability program plan. This group looked to other large transit agencies that have been leaders in sustainability, such as NYMTA, to identify reasonable goals and learn what strategies might be most effective at meeting those goals. The agency also looked at private-sector, corporate, social respon-sibility plans for potential performance metrics.
In January 2011, SEPTA released its sustainability plan, Sep-Tainable: The Route to Regional Sustainability (73). The plan sets 12 goals related to environmental, social, and eco-nomic sustainability. Each goal is also linked to one of the six nonsustainability objectives laid out in the business plan. SEPTA’s goals for environmental sustainability are to:
• Improve GHG and criteria air pollutant emissions performance,
• Improve water use and pollutant discharge performance,• Improve energy intensity performance, and• Reduce and reuse waste.
SEPTA’s management structure has identified two key success factors that have been instrumental in implementing the plan. First, sustainability initiatives pass through the same decision-making process as all other projects. Before creat-ing the plan, SEPTA participated in EMS training through an FTA-funded program. The agency credits the program with integrating sustainability considerations into the corporate
This chapter provides case examples profiling four diverse tran-sit agencies that have successfully implemented a variety of the energy-saving strategies as discussed in the previous chapters. These case examples draw on survey responses, phone inter-views, and agency documents. The four agencies profiled are:
• Southeastern Pennsylvania Transportation Authority (SEPTA)—Philadelphia, Pennsylvania
• King County Metro Transit—Seattle, Washington• Foothill Transit—West Covina, California• 9 Town Transit (9TT)—Connecticut River Estuary,
Connecticut.
These four agencies vary in terms of their size, structure, and, as shown in Figure 15, their location. SEPTA and King County Metro are large agencies that offer a variety of service modes and own and operate extensive fleets and infrastruc-ture, whereas Foothill Transit and 9TT are small-to-medium-sized agencies with less diverse holdings. The organizational structures of these agencies also vary. Like most transit agen-cies, SEPTA and 9TT are independent public agencies. King County Metro is part of the larger county government. Foothill Transit, while overseen by a board of directors representing local governments, is owned and operated by a group of three private firms. These differences affect the scope of energy conservation strategies available to each agency, as well as the process by which the agency implements these strategies. Nonetheless, all four have successfully implemented a range of programs to reduce energy use both in fleets and facilities, and collectively provide all transit agencies with examples of how to reduce energy use, regardless of their size and structure.
SOUTHEASTERN PENNSYLVANIA TRANSPORTATION AUTHORITY
SEPTA is the sixth largest transit agency in the United States as determined by unlinked passenger trips, logging almost 350 million trips and more than 1.5 billion passenger miles traveled in 2009 (6). Its ridership has been increasing since 2002, and SEPTA projects that the number of passenger trips will continue to grow over the next several years. The agency operates heavy rail, light rail, commuter rail, buses, and trol-ley buses serving more than 2,200 square miles in the greater Philadelphia area. Maintaining this service requires extensive infrastructure, including nearly 1,000 miles of track, 280 sta-tions, eight bus garages, and 58 power substations.
chapter five
TRANSIT AGENCY SUCCESS STORIES (CASE EXAMPLES)

47
structure. Sustainability plans are often aspirational docu-ments; however, SEPTA applied the same level of analytical rigor to creating and implementing its plan as it would to any other capital project, an approach that has helped sustainabil-ity initiatives gain credibility across the agency.
Second, one of the plan’s fundamental principles, which was a key requirement for the board to approve the plan, is that all sustainability initiatives must be budget-neutral. To meet this goal, SEPTA’s financial division manages the implementation of the plan, which makes it easy to identify cost-saving opportunities and funding sources, including innovative community partnerships. This arrangement helps to make the business case for energy efficiency to other divi-sions within the agency, especially because cost savings from the energy efficiency measures identified in the plan have generated funds that can be invested elsewhere.
Implementation
SEPTA has implemented a variety of strategies to reduce the amount of energy used both by its fleet and its facili-ties. Some of the fleet-related energy-saving strategies that SEPTA has undertaken include:
• Hybrid electric buses: SEPTA’s 472 hybrid electric buses make up approximately one-third of the agency’s bus fleet. The agency reports that the hybrid buses are 38% more fuel efficient than conventional diesel buses. In 2011, SEPTA received $20 million in federal funding to continue pur-chasing hybrid buses through 2013 (see Figure 16).
FIGURE 15 Case example locations.
Case Example: KingCountry Metro Transit,Seattle, WA
Case Example:SoutheasternPennsylvaniaTransportation Authority,Philadelphia, PA
Case Example: 9 TownTransit, EstuaryRegion, CT
Case Example: FoothillTransit, West Covina, CA
FIGURE 16 SEPTA hybrid bus. Courtesy: SEPTA.
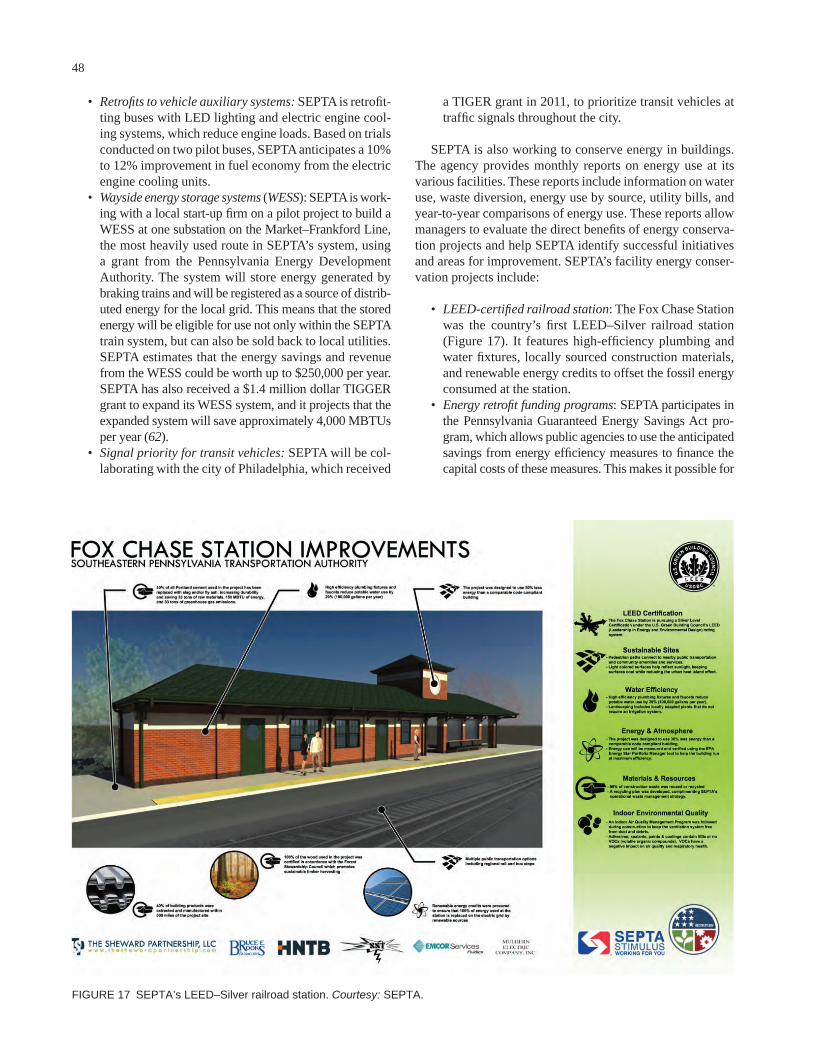
48
• Retrofits to vehicle auxiliary systems: SEPTA is retrofit-ting buses with LED lighting and electric engine cool-ing systems, which reduce engine loads. Based on trials conducted on two pilot buses, SEPTA anticipates a 10% to 12% improvement in fuel economy from the electric engine cooling units.
• Wayside energy storage systems (WESS): SEPTA is work-ing with a local start-up firm on a pilot project to build a WESS at one substation on the Market–Frankford Line, the most heavily used route in SEPTA’s system, using a grant from the Pennsylvania Energy Development Authority. The system will store energy generated by braking trains and will be registered as a source of distrib-uted energy for the local grid. This means that the stored energy will be eligible for use not only within the SEPTA train system, but can also be sold back to local utilities. SEPTA estimates that the energy savings and revenue from the WESS could be worth up to $250,000 per year. SEPTA has also received a $1.4 million dollar TIGGER grant to expand its WESS system, and it projects that the expanded system will save approximately 4,000 MBTUs per year (62).
• Signal priority for transit vehicles: SEPTA will be col-laborating with the city of Philadelphia, which received
a TIGER grant in 2011, to prioritize transit vehicles at traffic signals throughout the city.
SEPTA is also working to conserve energy in buildings. The agency provides monthly reports on energy use at its various facilities. These reports include information on water use, waste diversion, energy use by source, utility bills, and year-to-year comparisons of energy use. These reports allow managers to evaluate the direct benefits of energy conserva-tion projects and help SEPTA identify successful initiatives and areas for improvement. SEPTA’s facility energy conser-vation projects include:
• LEED-certified railroad station: The Fox Chase Station was the country’s first LEED–Silver railroad station (Figure 17). It features high-efficiency plumbing and water fixtures, locally sourced construction materials, and renewable energy credits to offset the fossil energy consumed at the station.
• Energy retrofit funding programs: SEPTA participates in the Pennsylvania Guaranteed Energy Savings Act pro-gram, which allows public agencies to use the anticipated savings from energy efficiency measures to finance the capital costs of these measures. This makes it possible for
FIGURE 17 SEPTA’s LEED–Silver railroad station. Courtesy: SEPTA.
49
to energy conservation, because King County is known for being a leader on energy and climate issues. The King County 2010 Energy Plan establishes three goals for reducing the county’s operational energy use (75):
1. Achieve a 10% normalized net reduction in energy use in county buildings and facilities by 2012 and 10% nor-malized net reduction in energy use by county vehicles by 2015;
2. Produce, use, or procure renewable energy equal to 50% of total county energy requirements by 2012; and
3. Maximize the cost-effective conversion of waste to energy.
King County Metro participated in setting these goals by providing input on what level of reductions might be reason-able in the transportation sector and what strategies might be used to achieve them. Table 27 summarizes the transit-related objectives and strategies in the plan,
These objectives and strategies will be further refined as the county completes its climate action plan, which will include both “specific objectives, strategies and priority actions for reducing emissions and mitigating climate change,” and “related strategies, program activities, and targets from the 2010 Energy Plan” (76).
Implementation
A county-wide interdepartmental energy task force and cli-mate change group, both of which include representatives from King County Metro, is responsible for implementing the Energy Plan, and individual departments within the county also have their own sustainability committees. Until recently, all decisions related to energy and sustainability were made by these two groups. However, in March 2012, the agency hired a sustainability coordinator, who is respon-sible for implementing the plan in collaboration with the two interdepartmental groups.
King County considers energy-saving proposals on an ad hoc basis rather than developing them through a strategic planning process. Individual departments may suggest proj-ects that are evaluated on the basis of energy impacts, costs, and payback periods; however, projects are rarely compared with one another in considering whether they should be implemented. Because the general manager has been chair of the transportation department’s sustainability committee, achieving both employee and management buy-in for energy-saving initiatives, particularly those related to transit, has not been a challenge.
To measure progress, the agency calculates GHG emis-sions and energy use associated with transit services using data on facility electricity use and fleet fuel consumption. It outlines this information in progress reports in the 2010 Energy Plan, and plans to begin reporting to the Climate
SEPTA to retrofit inefficient buildings and facilities at no upfront cost. SEPTA is using the free energy audits that are also provided by the program to target the least efficient facilities, where retrofits will have the shortest payback period. The agency also takes advantage of local utility programs that compensate consumers by the kilowatt-hour for energy-saving projects. The agency earned more than $22,000 through these programs in 2011.
• Agency-wide recycling program: In 2011, SEPTA began an agency-wide recycling program at pilot locations that kept 621 tons of waste from going to a landfill and achieved diversion rates of up to 22% at certain facilities. Later that year, SEPTA entered into a revenue-sharing agreement with its waste disposal contractor that will allow the agency to cost-effectively expand its recycling program, diverting more waste and creating a new rev-enue source. The program is projected to save SEPTA $103,000 in disposal costs and generate $67,000 per year through the revenue-sharing agreement.
These projects demonstrate ways to use existing financ-ing opportunities to both fund energy efficiency projects and generate additional revenue. SEPTA hopes to expand its energy conservation and sustainability work through innova-tive partnerships that further leverage resources from private companies, government partners, and the community.
KING COUNTY METRO TRANSIT
The Metro Transit division of King County’s Department of Transportation provides transit service throughout Washing-ton’s most populous county, which includes Seattle and the sur-rounding cities and towns. The division serves an area covering more than 2,100 square miles with a population of 1.7 million with buses, trolleybuses, light rail, and the nation’s largest pub-licly owned vanpool program (74). King County Metro’s elec-tric trolley system, which consists of 14 routes that account for one-fifth of the passenger miles, is one of only five such sys-tems in the United States. King County Metro is the tenth larg-est transit agency in the United States by unlinked passenger trips, with almost 114 million trips and more than 500 million passenger-miles traveled in 2009.
Unlike most large transit agencies, King County Metro is not an independent agency; it has been a part of the county government since 1995. This gives the agency access to a larger budget as well as the authority to levy taxes. A county sales tax funds 60% of the agency’s budget. The agency’s budget and direction is set by the elected county council instead of a separate board of directors.
Strategic Planning
King County Metro’s position within the county government means that it uses a different decision-making process than other transit agencies. This is particularly true with respect
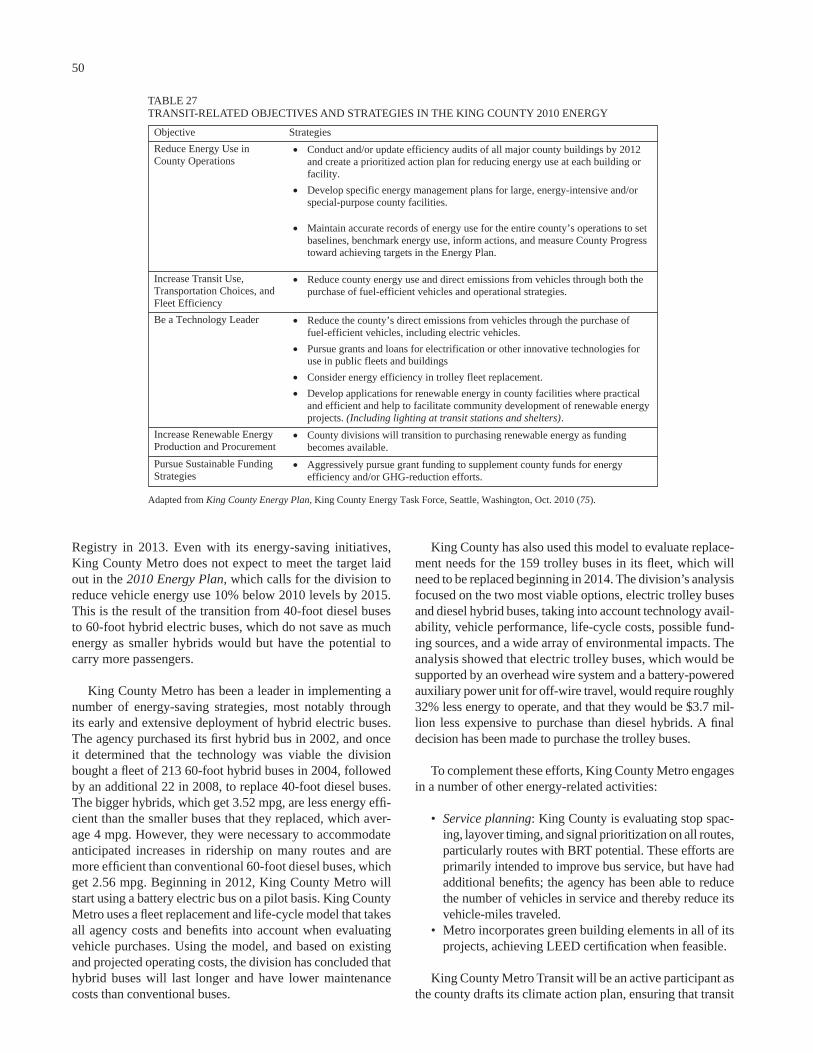
50
TABLE 27TRANSIT-RELATED OBJECTIVES AND STRATEGIES IN THE KING COUNTY 2010 ENERGY
Objective Strategies
Reduce Energy Use in County Operations
Conduct and/or update efficiency audits of all major county buildings by 2012 and create a prioritized action plan for reducing energy use at each building or facility.
Develop specific energy management plans for large, energy-intensive and/or special-purpose county facilities.
Maintain accurate records of energy use for the entire county’s operations to set baselines, benchmark energy use, inform actions, and measure County Progress toward achieving targets in the Energy Plan.
Increase Transit Use, Transportation Choices, and Fleet Efficiency
Reduce county energy use and direct emissions from vehicles through both the purchase of fuel-efficient vehicles and operational strategies.
Be a Technology Leader Reduce the county’s direct emissions from vehicles through the purchase of fuel-efficient vehicles, including electric vehicles.
Pursue grants and loans for electrification or other innovative technologies for use in public fleets and buildings
Consider energy efficiency in trolley fleet replacement.
Develop applications for renewable energy in county facilities where practical and efficient and help to facilitate community development of renewable energy projects. (Including lighting at transit stations and shelters).
Increase Renewable Energy Production and Procurement
County divisions will transition to purchasing renewable energy as funding becomes available.
Pursue Sustainable Funding Strategies
Aggressively pursue grant funding to supplement county funds for energy efficiency and/or GHG-reduction efforts.
Adapted from King County Energy Plan, King County Energy Task Force, Seattle, Washington, Oct. 2010 (75).
Registry in 2013. Even with its energy-saving initiatives, King County Metro does not expect to meet the target laid out in the 2010 Energy Plan, which calls for the division to reduce vehicle energy use 10% below 2010 levels by 2015. This is the result of the transition from 40-foot diesel buses to 60-foot hybrid electric buses, which do not save as much energy as smaller hybrids would but have the potential to carry more passengers.
King County Metro has been a leader in implementing a number of energy-saving strategies, most notably through its early and extensive deployment of hybrid electric buses. The agency purchased its first hybrid bus in 2002, and once it determined that the technology was viable the division bought a fleet of 213 60-foot hybrid buses in 2004, followed by an additional 22 in 2008, to replace 40-foot diesel buses. The bigger hybrids, which get 3.52 mpg, are less energy effi-cient than the smaller buses that they replaced, which aver-age 4 mpg. However, they were necessary to accommodate anticipated increases in ridership on many routes and are more efficient than conventional 60-foot diesel buses, which get 2.56 mpg. Beginning in 2012, King County Metro will start using a battery electric bus on a pilot basis. King County Metro uses a fleet replacement and life-cycle model that takes all agency costs and benefits into account when evaluating vehicle purchases. Using the model, and based on existing and projected operating costs, the division has concluded that hybrid buses will last longer and have lower maintenance costs than conventional buses.
King County has also used this model to evaluate replace-ment needs for the 159 trolley buses in its fleet, which will need to be replaced beginning in 2014. The division’s analysis focused on the two most viable options, electric trolley buses and diesel hybrid buses, taking into account technology avail-ability, vehicle performance, life-cycle costs, possible fund-ing sources, and a wide array of environmental impacts. The analysis showed that electric trolley buses, which would be supported by an overhead wire system and a battery-powered auxiliary power unit for off-wire travel, would require roughly 32% less energy to operate, and that they would be $3.7 mil-lion less expensive to purchase than diesel hybrids. A final decision has been made to purchase the trolley buses.
To complement these efforts, King County Metro engages in a number of other energy-related activities:
• Service planning: King County is evaluating stop spac-ing, layover timing, and signal prioritization on all routes, particularly routes with BRT potential. These efforts are primarily intended to improve bus service, but have had additional benefits; the agency has been able to reduce the number of vehicles in service and thereby reduce its vehicle-miles traveled.
• Metro incorporates green building elements in all of its projects, achieving LEED certification when feasible.
King County Metro Transit will be an active participant as the county drafts its climate action plan, ensuring that transit
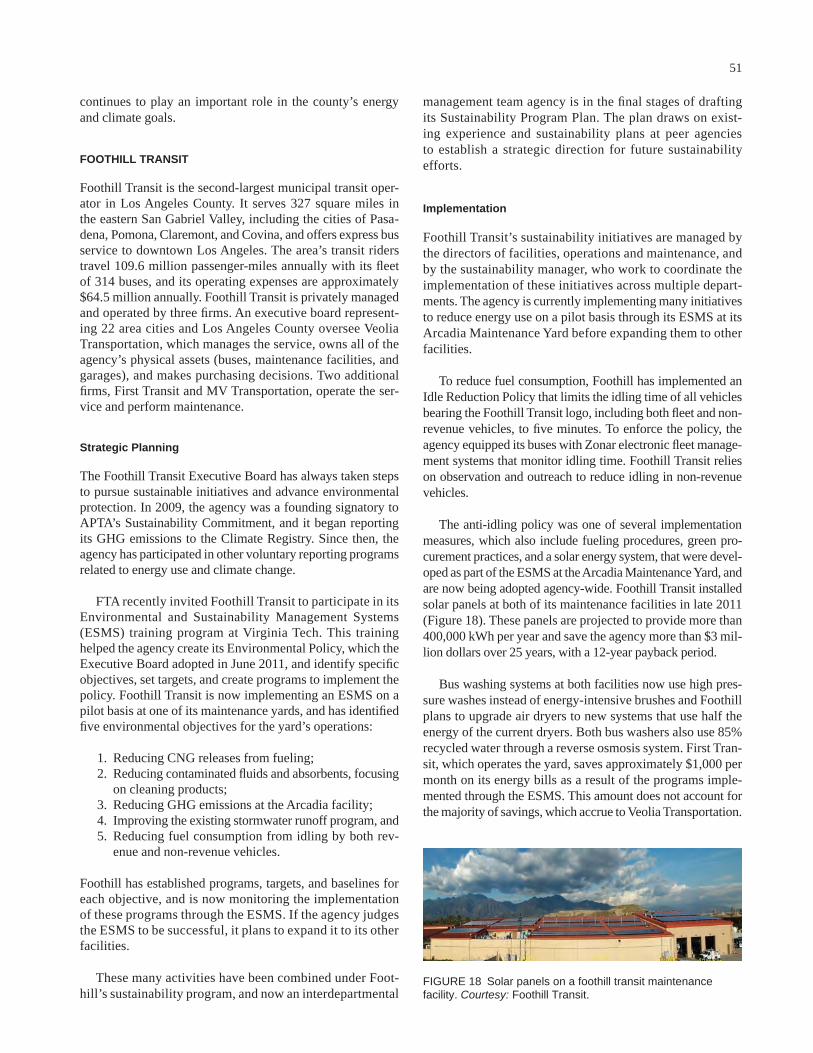
51
management team agency is in the final stages of drafting its Sustainability Program Plan. The plan draws on exist-ing experience and sustainability plans at peer agencies to establish a strategic direction for future sustainability efforts.
Implementation
Foothill Transit’s sustainability initiatives are managed by the directors of facilities, operations and maintenance, and by the sustainability manager, who work to coordinate the imple mentation of these initiatives across multiple depart-ments. The agency is currently implementing many initiatives to reduce energy use on a pilot basis through its ESMS at its Arcadia Maintenance Yard before expanding them to other facilities.
To reduce fuel consumption, Foothill has implemented an Idle Reduction Policy that limits the idling time of all vehicles bearing the Foothill Transit logo, including both fleet and non-revenue vehicles, to five minutes. To enforce the policy, the agency equipped its buses with Zonar electronic fleet manage-ment systems that monitor idling time. Foothill Transit relies on observation and outreach to reduce idling in non-revenue vehicles.
The anti-idling policy was one of several implementation measures, which also include fueling procedures, green pro-curement practices, and a solar energy system, that were devel-oped as part of the ESMS at the Arcadia Maintenance Yard, and are now being adopted agency-wide. Foothill Transit installed solar panels at both of its maintenance facilities in late 2011 (Figure 18). These panels are projected to provide more than 400,000 kWh per year and save the agency more than $3 mil-lion dollars over 25 years, with a 12-year payback period.
Bus washing systems at both facilities now use high pres-sure washes instead of energy-intensive brushes and Foothill plans to upgrade air dryers to new systems that use half the energy of the current dryers. Both bus washers also use 85% recycled water through a reverse osmosis system. First Tran-sit, which operates the yard, saves approximately $1,000 per month on its energy bills as a result of the programs imple-mented through the ESMS. This amount does not account for the majority of savings, which accrue to Veolia Transportation.
continues to play an important role in the county’s energy and climate goals.
FOOTHILL TRANSIT
Foothill Transit is the second-largest municipal transit oper-ator in Los Angeles County. It serves 327 square miles in the eastern San Gabriel Valley, including the cities of Pasa-dena, Pomona, Claremont, and Covina, and offers express bus service to downtown Los Angeles. The area’s transit riders travel 109.6 million passenger-miles annually with its fleet of 314 buses, and its operating expenses are approximately $64.5 million annually. Foothill Transit is privately managed and operated by three firms. An executive board represent-ing 22 area cities and Los Angeles County oversee Veolia Transportation, which manages the service, owns all of the agency’s physical assets (buses, maintenance facilities, and garages), and makes purchasing decisions. Two additional firms, First Transit and MV Transportation, operate the ser-vice and perform maintenance.
Strategic Planning
The Foothill Transit Executive Board has always taken steps to pursue sustainable initiatives and advance environmental protection. In 2009, the agency was a founding signatory to APTA’s Sustainability Commitment, and it began reporting its GHG emissions to the Climate Registry. Since then, the agency has participated in other voluntary reporting programs related to energy use and climate change.
FTA recently invited Foothill Transit to participate in its Environmental and Sustainability Management Systems (ESMS) training program at Virginia Tech. This training helped the agency create its Environmental Policy, which the Executive Board adopted in June 2011, and identify specific objectives, set targets, and create programs to implement the policy. Foothill Transit is now implementing an ESMS on a pilot basis at one of its maintenance yards, and has identified five environmental objectives for the yard’s operations:
1. Reducing CNG releases from fueling;2. Reducing contaminated fluids and absorbents, focusing
on cleaning products;3. Reducing GHG emissions at the Arcadia facility;4. Improving the existing stormwater runoff program, and5. Reducing fuel consumption from idling by both rev-
enue and non-revenue vehicles.
Foothill has established programs, targets, and baselines for each objective, and is now monitoring the implementation of these programs through the ESMS. If the agency judges the ESMS to be successful, it plans to expand it to its other facilities.
These many activities have been combined under Foot-hill’s sustainability program, and now an interdepartmental
FIGURE 18 Solar panels on a foothill transit maintenance facility. Courtesy: Foothill Transit.
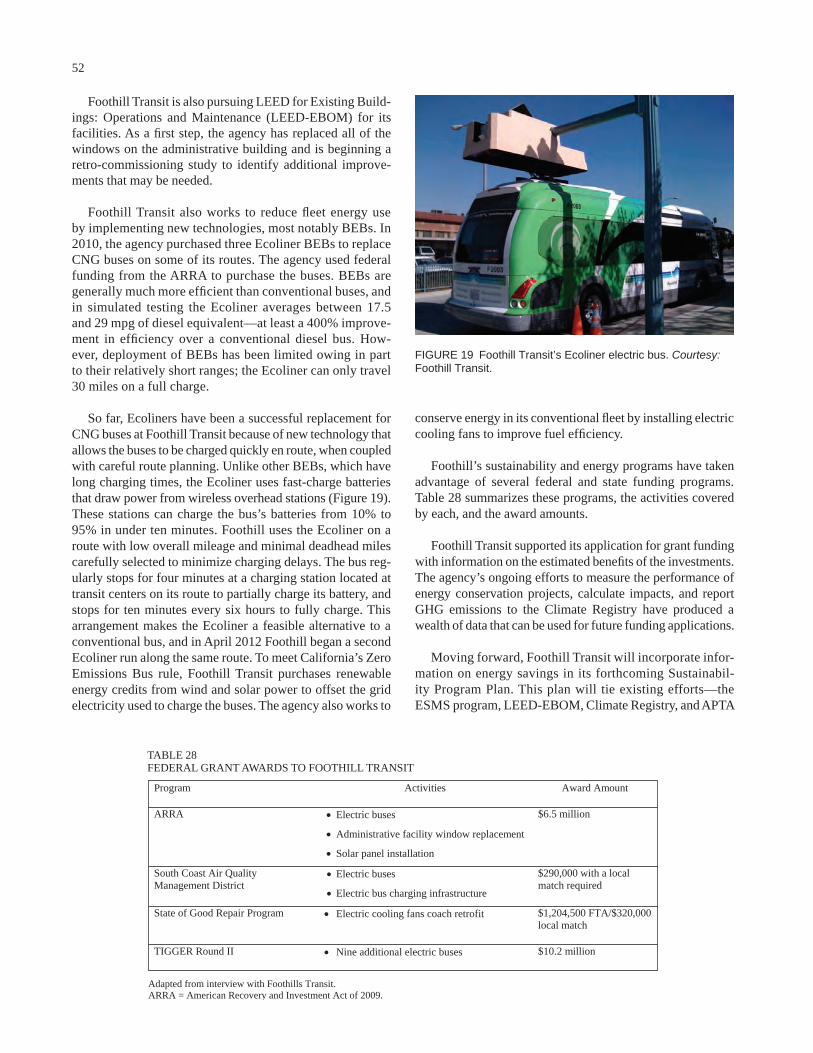
52
conserve energy in its conventional fleet by installing electric cooling fans to improve fuel efficiency.
Foothill’s sustainability and energy programs have taken advantage of several federal and state funding programs. Table 28 summarizes these programs, the activities covered by each, and the award amounts.
Foothill Transit supported its application for grant funding with information on the estimated benefits of the investments. The agency’s ongoing efforts to measure the performance of energy conservation projects, calculate impacts, and report GHG emissions to the Climate Registry have produced a wealth of data that can be used for future funding applications.
Moving forward, Foothill Transit will incorporate infor-mation on energy savings in its forthcoming Sustainabil-ity Program Plan. This plan will tie existing efforts—the ESMS program, LEED-EBOM, Climate Registry, and APTA
Foothill Transit is also pursuing LEED for Existing Build-ings: Operations and Maintenance (LEED-EBOM) for its facilities. As a first step, the agency has replaced all of the windows on the administrative building and is beginning a retro-commissioning study to identify additional improve-ments that may be needed.
Foothill Transit also works to reduce fleet energy use by implementing new technologies, most notably BEBs. In 2010, the agency purchased three Ecoliner BEBs to replace CNG buses on some of its routes. The agency used federal funding from the ARRA to purchase the buses. BEBs are generally much more efficient than conventional buses, and in simulated testing the Ecoliner averages between 17.5 and 29 mpg of diesel equivalent—at least a 400% improve-ment in efficiency over a conventional diesel bus. How-ever, deployment of BEBs has been limited owing in part to their relatively short ranges; the Ecoliner can only travel 30 miles on a full charge.
So far, Ecoliners have been a successful replacement for CNG buses at Foothill Transit because of new technology that allows the buses to be charged quickly en route, when coupled with careful route planning. Unlike other BEBs, which have long charging times, the Ecoliner uses fast-charge batteries that draw power from wireless overhead stations (Figure 19). These stations can charge the bus’s batteries from 10% to 95% in under ten minutes. Foothill uses the Ecoliner on a route with low overall mileage and minimal deadhead miles carefully selected to minimize charging delays. The bus reg-ularly stops for four minutes at a charging station located at transit centers on its route to partially charge its battery, and stops for ten minutes every six hours to fully charge. This arrangement makes the Ecoliner a feasible alternative to a conventional bus, and in April 2012 Foothill began a second Ecoliner run along the same route. To meet California’s Zero Emissions Bus rule, Foothill Transit purchases renewable energy credits from wind and solar power to offset the grid electricity used to charge the buses. The agency also works to
FIGURE 19 Foothill Transit’s Ecoliner electric bus. Courtesy: Foothill Transit.
Program Activities Award Amount
ARRA Electric buses
Administrative facility window replacement
Solar panel installation
$6.5 million
South Coast Air Quality Management District
Electric buses
Electric bus charging infrastructure
$290,000 with a local match required
State of Good Repair Program Electric cooling fans coach retrofit $1,204,500 FTA/$320,000 local match
TIGGER Round II Nine additional electric buses $10.2 million
Adapted from interview with Foothills Transit. ARRA = American Recovery and Investment Act of 2009.
TABLE 28FEDERAL GRANT AWARDS TO FOOTHILL TRANSIT
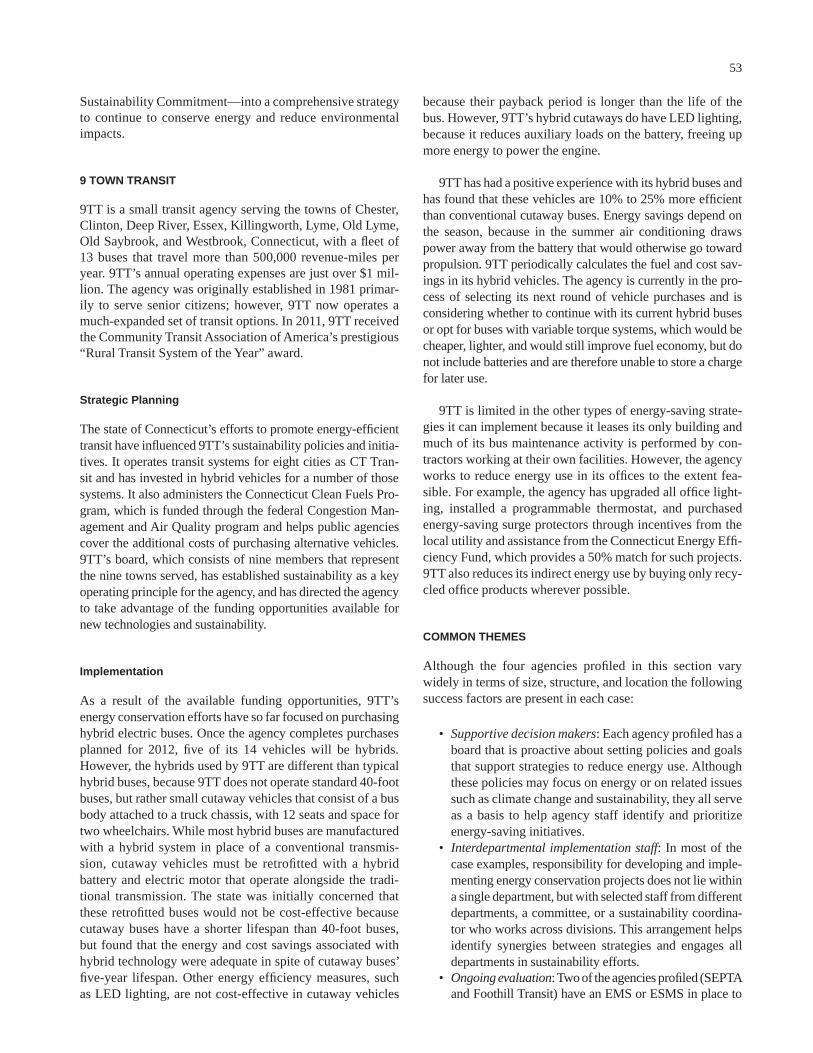
53
because their payback period is longer than the life of the bus. However, 9TT’s hybrid cutaways do have LED lighting, because it reduces auxiliary loads on the battery, freeing up more energy to power the engine.
9TT has had a positive experience with its hybrid buses and has found that these vehicles are 10% to 25% more efficient than conventional cutaway buses. Energy savings depend on the season, because in the summer air conditioning draws power away from the battery that would otherwise go toward propulsion. 9TT periodically calculates the fuel and cost sav-ings in its hybrid vehicles. The agency is currently in the pro-cess of selecting its next round of vehicle purchases and is considering whether to continue with its current hybrid buses or opt for buses with variable torque systems, which would be cheaper, lighter, and would still improve fuel economy, but do not include batteries and are therefore unable to store a charge for later use.
9TT is limited in the other types of energy-saving strate-gies it can implement because it leases its only building and much of its bus maintenance activity is performed by con-tractors working at their own facilities. However, the agency works to reduce energy use in its offices to the extent fea-sible. For example, the agency has upgraded all office light-ing, installed a programmable thermostat, and purchased energy-saving surge protectors through incentives from the local utility and assistance from the Connecticut Energy Effi-ciency Fund, which provides a 50% match for such projects. 9TT also reduces its indirect energy use by buying only recy-cled office products wherever possible.
COMMON THEMES
Although the four agencies profiled in this section vary widely in terms of size, structure, and location the following success factors are present in each case:
• Supportive decision makers: Each agency profiled has a board that is proactive about setting policies and goals that support strategies to reduce energy use. Although these policies may focus on energy or on related issues such as climate change and sustainability, they all serve as a basis to help agency staff identify and prioritize energy-saving initiatives.
• Interdepartmental implementation staff: In most of the case examples, responsibility for developing and imple-menting energy conservation projects does not lie within a single department, but with selected staff from different departments, a committee, or a sustainability coordina-tor who works across divisions. This arrangement helps identify synergies between strategies and engages all departments in sustainability efforts.
• Ongoing evaluation: Two of the agencies profiled (SEPTA and Foothill Transit) have an EMS or ESMS in place to
Sustainability Commitment—into a comprehensive strategy to continue to conserve energy and reduce environmental impacts.
9 TOWN TRANSIT
9TT is a small transit agency serving the towns of Chester, Clinton, Deep River, Essex, Killingworth, Lyme, Old Lyme, Old Saybrook, and Westbrook, Connecticut, with a fleet of 13 buses that travel more than 500,000 revenue-miles per year. 9TT’s annual operating expenses are just over $1 mil-lion. The agency was originally established in 1981 primar-ily to serve senior citizens; however, 9TT now operates a much-expanded set of transit options. In 2011, 9TT received the Community Transit Association of America’s prestigious “Rural Transit System of the Year” award.
Strategic Planning
The state of Connecticut’s efforts to promote energy-efficient transit have influenced 9TT’s sustainability policies and initia-tives. It operates transit systems for eight cities as CT Tran-sit and has invested in hybrid vehicles for a number of those systems. It also administers the Connecticut Clean Fuels Pro-gram, which is funded through the federal Congestion Man-agement and Air Quality program and helps public agencies cover the additional costs of purchasing alternative vehicles. 9TT’s board, which consists of nine members that represent the nine towns served, has established sustainability as a key operating principle for the agency, and has directed the agency to take advantage of the funding opportunities available for new technologies and sustainability.
Implementation
As a result of the available funding opportunities, 9TT’s energy conservation efforts have so far focused on purchasing hybrid electric buses. Once the agency completes purchases planned for 2012, five of its 14 vehicles will be hybrids. However, the hybrids used by 9TT are different than typical hybrid buses, because 9TT does not operate standard 40-foot buses, but rather small cutaway vehicles that consist of a bus body attached to a truck chassis, with 12 seats and space for two wheelchairs. While most hybrid buses are manufactured with a hybrid system in place of a conventional transmis-sion, cutaway vehicles must be retrofitted with a hybrid battery and electric motor that operate alongside the tradi-tional transmission. The state was initially concerned that these retrofitted buses would not be cost-effective because cutaway buses have a shorter lifespan than 40-foot buses, but found that the energy and cost savings associated with hybrid technology were adequate in spite of cutaway buses’ five-year lifespan. Other energy efficiency measures, such as LED lighting, are not cost-effective in cutaway vehicles

54
• Proactive pursuit of opportunities: All four transit agen-cies profiled are proactive about seeking funding and opportunities to collaborate with a broad variety of orga-nizations. The wide variety of federal and state programs that are available to fund energy conservation measures have provided crucial support to transit agencies; how-ever, the transit agencies have also partnered with local utilities, non-profits, private firms, and waste haulers to find innovative ways to reduce energy use.
monitor implementation of sustainability programs, and all actively collect data on the costs and impacts of energy conservation measures. These data are crucial to refining strategies and useful in applying for funding from out-side sources for future energy conservation measures. As SEPTA’s policy that all sustainability measures be bud-get neutral illustrates, cost data can also help convince agency staff and decision makers that strategies to reduce energy use are fiscally sound.

55
• Reducing building energy use—Transit agencies have adopted many of the strategies that have successfully been used to reduce energy use in commercial build-ings, including purchasing energy-efficient lighting, computers, and electronics; replacing heating, ventila-tion, and air conditioning systems, and implementing energy management systems to identify cost-effective improvements. Several agencies have undertaken these improvements to achieve green building certification for their facilities.
• Providing commute alternatives, reducing waste, and buying green—These diverse strategies all work to reduce indirect energy use—energy that transit agencies are responsible for but do not pay for out-of-pocket. A growing number of transit agencies have taken steps to reduce this energy use to meet sustainability goals and improve their public image by providing employee transit passes, encouraging carpooling, installing low-flow water fixtures, implementing workplace recycling programs, and using recycled construction materials.
• Generating renewable energy—Agencies have begun to take advantage of large rights-of-way or roofs on facilities to generate their own electricity and use it to power their own facilities or sell it back to the grid.
In addition to implementing individual strategies, agen-cies have begun to look at their entire energy portfolios to strategically consider how to manage their energy use. They are crafting sustainability plans with energy-related goals, implementing environmental management systems, and col-lecting and analyzing data on electricity use and fuel effi-ciency in order to understand their energy needs and identify areas for improvement. These comprehensive strategies can not only identify new opportunities and refine existing pro-grams, they can also engage all divisions within an agency in energy conservation efforts. Agencies can use resources such as APTA’s Sustainability Guidelines or reports from peer agencies for guidance in assessing energy use. Even at some agencies where a comprehensive assessment of energy use would be prohibitively expensive, staff has analyzed individual opportunities to assess payback periods incor-porating energy savings or the net present value of possible investments.
Nevertheless, agencies find the cost of some energy-saving techniques to be a barrier to implementation. With a large price premium for many alternative fuel vehicles and
As energy prices rise, budgets shrink, and governments adopt policies to address environmental issues and increase energy independence, transit agencies face pressure to provide exten-sive transit service to the public while also reducing energy use. Transit agencies use a significant amount of energy for vehicle propulsion—in 2009, transit agencies used more than one billion gallons of fuel and more than six billion kilowatt hours of electricity to power vehicles, and also consumed energy in their non-revenue fleets, at their maintenance facili-ties, for new construction, and in administration buildings and stations that require heating, cooling, and electricity. Transit agencies also use energy that is embodied in materials, such as the energy used to manufacture vehicles.
Transit agencies across the country, ranging from large agencies operating rail systems in major metropolitan areas to small agencies operating on-demand services in rural areas, are developing and implementing measures to reduce energy use. Nearly every survey respondent reported that their transit agency is working to save energy through a variety of strategies, including:
• Purchasing new vehicles or retrofitting the current fleet to improve fuel efficiency—Agencies are using or pilot-ing battery electric buses, hydrogen fuel cell buses, and hybrid electric buses, and finding new ways to reduce the weight and power requirements of these vehicles. Agencies operating rail are beginning to deploy wayside energy storage systems to reuse the energy generated through braking.
• Reducing idling—Whether through driver training, tech-nology, or through changing service design, reducing idling is a common aim of transit agencies, given that idling wastes fuel (and money) unnecessarily.
• Purchasing light-duty hybrid vehicles or reducing the size of non-revenue fleets—Administrative and maintenance vehicles also use substantial amounts of energy, and many of these vehicles are passenger vehicles for which hybrid replacements are both available and affordable.
• Increasing the efficiency of stations and stops—Transit agencies have unique opportunities to reduce energy use at stations and stops through energy-efficient lighting and escalators, solar panels on the roofs of bus stops that sup-ply electricity for lighting, and innovative station designs. Stations and stops also provide an opportunity to promote energy-efficient technologies to the many members of the public that use these facilities every day.
chapter six
CONCLUSIONS
56
green building strategies, transit agencies have to be creative in finding sources of funds or financing arrangements that either allow for a third party to provide some of the required upfront costs or that allow for those costs to be spread out over time and paid for by the energy savings themselves. Federal grant programs have played an important role in helping agen-cies to pilot new technologies or implement proven ones that may otherwise have been out of reach. Agencies profiled for the case examples further emphasized the importance of these types of funding sources. All four agencies have taken advan-tage of grant funding opportunities at the state and federal level, and many have also sought innovative partnerships with utility firms, waste haulers, non-profits, and the private sector. Survey respondents also mentioned as a barrier the long time period that it takes to realize benefits from energy-saving pro-grams. Some of these innovative partnerships can overcome this barrier by allowing transit agencies to pay the up-front costs of energy-saving strategies using long-term cost savings.
Agencies also cited as a barrier inadequate staff exper-tise and the lack of information about strategy effectiveness. Some agencies mentioned that they have overcome these barriers by learning from peer agencies in determining which strategies to pursue; however, it is clear that further research and better information on energy-saving strategies will help address these challenges. Specifically, transit agencies are interested in:
• Benchmarking their own activities and progress against other agencies to help determine what energy reduc-tions are reasonable and achievable.
• Tools to help evaluate energy savings and analyze ben-efits and costs from strategies over time. The actual amount of savings achieved through any one action can vary greatly depending on its context; therefore, tools that help agencies to identify and account for their sav-ings are important.
• Easy and inexpensive strategies, particularly for smaller transit agencies. These agencies may have less flexibility or ability to pursue new strategies because they operate limited services on smaller budgets and need guidance on affordable strategies that apply to on-demand and small bus services.
• Information about funding opportunities and the inno-vative ways that transit agencies (or other organiza-tions) are able to obtain funds for energy savings. This could include state and local level partnerships and partnerships with private-sector entities.
• Best management practices that encourage agency-wide buy-in to energy efficiency efforts, ensure effec-tive strategy implementation, foster champions, and reward innovation.
The agencies surveyed and profiled for this report have already devoted substantial effort and innovation toward reducing energy use, often with little in the way of research or best practices to guide them. The research described pre-viously will likely help transit agencies make the transition from pilot projects to standard operating procedures, so that the transit service of tomorrow will not only be an energy-efficient alternative to driving, but a substantial improvement on the transit of today.
57
REFERENCES
1. Davis, S.D., S.W. Diegel, and R.G. Boundy, “Chap-ter 2—Energy,” In Transportation Energy Data Book, U.S. Department of Energy, Washington, D.C., 2010, pp. 2-1–2-19.
2. Greening Mass Transit & Metro Regions: The Final Report of the Blue Ribbon Commission on Sustainabil-ity and the MTA, Metropolitan Transportation Authority, New York, 2009 [Online]. Available: http://www.mta.info/sustainability/pdf/SustRptFinal.pdf.
3. Energy Conservation and Management Plan, Los Ange-les County Metropolitan Transportation Authority, Los Angeles, Calif., Sep. 2011.
4. Moving Towards Sustainability: 2011 Metro Sustainability Report, Los Angeles County Metropolitan Transportation Authority, 2011.
5. Renewable Energy Task Report, The MTA Blue Ribbon Commission on Sustainability, New York Metropolitan Transportation Authority, Oct. 29, 2008.
6. 2011 Public Transportation Fact Book, American Public Transportation Association, Washington, D.C., Apr. 2011.
7. “Gasoline Gallon Equivalent Definition,” Alternative Fuels Data Center, U.S. Department of Energy, Washing-ton, D.C. [Online]. Available: https://www.afdc.energy.gov/afdc/prep/popups/gges.html [accessed May 7, 2012].
8. “Commercial Sector Energy Consumption,” Buildings Energy Data Book, U.S. Department of Energy, Wash-ington, D.C., 2010 [Online]. Available: http://buildings databook.eren.doe.gov/default.aspx.
9. Hodges, T., Public Transportation’s Role in Responding to Climate Change, Federal Transit Administration, Wash-ington, D.C., Jan. 2010, 16 pp. [Online]. Available: http://www.fta.dot.gov/documents/PublicTransportations RoleInRespondingToClimateChange2010.pdf.
10. “Average Fuel Efficiency of U.S. Light Duty Vehicles,” Table 4-23, National Transportation Statistics, Bureau of Transportation Statistics, Washington, D.C., 2011 [Online]. Available: http://www.bts.gov/publications/national_transportation_statistics/html/table_04_23.html [accessed Mar. 14, 2012].
11. Sound Transit Sustainability Plan, Sound Transit, Seat-tle, Wash., June 2011 [Online]. Available: http://www.soundtransit.org/Documents/pdf/about/environment/SustainabilityPlan.pdf.
12. “Basic Elements of an EMS,” Center for Organizational and Technological Advancement, Virginia Polytechnic Institute and State University, Blacksburg [Online]. Available: http://www.cota.vt.edu/ems/what_is_ems/basic_elements.html [accessed Mar. 7, 2012].
13. “EMS Management Review,” Utah Transit Authority, Salt Lake City, June 14, 2011.
14. Draft Sustainable Return on Investment (SROI) Analysis for SamTrans: An Assessment of Building and Trans-
portation Strategies, San Mateo County Transit District, Nov. 2010.
15. BASE Energy, Inc., Energy Efficiency Assessment of Bay Area Rapid Transit (BART) Train Cars, BASE-PGE-05-09, Pacific Gas & Electric Company, San Francisco, Calif., 2007.
16. Greenhouse Gas Emissions Cost Effectiveness Study, Los Angeles County Metropolitan Transportation Authority, June 2010.
17. The American Recovery and Reinvestment Act (ARRA), Federal Transit Administration, Washington, D.C. [Online]. Available: http://www.fta.dot.gov/about/12350.html [accessed Mar. 8, 2012].
18. “TIGER Grants,” U.S. Department of Transportation, Washington, D.C. [Online]. Available: http://www.dot.gov/tiger/index.html [accessed Mar. 12, 2012].
19. “Energy Programs,” Connecticut Energy Efficiency Fund, n.d. [Online]. Available: http://ctsavesenergy.org/programs/business.php [accessed Mar. 12, 2012].
20. Hikichi, L.K. and E. Beimborn, Innovation at Transit Systems, U.S. Department of Transportation, Washing-ton, D.C., Oct. 2005.
21. “$100 Million in Obama Administration Economic Recovery Act Funds Charts New Course for Green Transportation,” U.S. Department of Transportation, Washington, D.C., Sep. 21, 2009.
22. “Green Construction Policy,” Executive Management and Audit Committee, Los Angeles County Metropolitan Transportation Authority, July 21, 2011.
23. “Greenhouse Gas Emissions Standards and Fuel Effi-ciency Standards for Medium- and Heavy-Duty Engines and Vehicles,” Federal Register, Vol. 76, No. 179, Sep. 15, 2011 [Online]. Available: http://www.nhtsa.gov/fuel- economy.
24. Melendez, M., J. Taylor, J. Zuboy, W.S. Wayne, and D. Smith, Emission Testing of Washington Metropolitan Area Transit Authority (WMATA) Natural Gas and Diesel Transit Buses, NREL/TP-540-36355, National Renewable Energy Laboratory, Golden, Colo., Dec. 2005.
25. Lowell, D., W. Parsley, C. Bush, and D. Zupo, “Compar-ison of Clean Diesel Buses to CNG Buses,” Ninth Diesel Engine Emissions Reduction (DEER) Workshop, Aug. 24–28, Newport, R.I., Office of Energy Efficiency and Renewable Energy, U.S. Department of Energy, Wash-ington, D.C., 2003 [Online]. Available: http://www.osti.gov/bridge/servlets/purl/829622-k8LC2V/native/.
26. “Natural Gas Buses: Separating Myth from Fact,” U.S. Department of Energy, Washington, D.C., May 2000.
27. Ochoa, M.C., “New York City Fleet Upgrades: Conven-tional Diesel, Hybrid, or CNG? In Media Res Cost-Benefit Analysis,” 87th Annual Meeting of the Transportation Research Board, Compendium of Papers, Jan. 2008.

58
28. “GreenRoad Features,” GreenRoad [Online]. Avail-able: http://greenroad.com/tour/features/ [accessed May 8, 2012].
29. Proc, K., et al., “100,000-Mile Evaluation of Transit Buses Operated on Biodiesel Blends (B20),” presented at the Powertrain and Fluid Systems Conference and Exhibition, Oct. 2006, Toronto, ON, Canada.
30. Clark, N.N., et al., TCRP Report 132: Assessment of Hybrid-Electric Transit Bus Technology, Transportation Research Board of the National Academies, Washing-ton, D.C., 2009 [Online]. Available: http://onlinepubs.trb.org/onlinepubs/tcrp/tcrp_rpt_132.pdf.
31. Transportation’s Role in Reducing U.S. Greenhouse Gas Emissions Volume 1: Synthesis Report, Report to Congress of the U.S. Department of Transportation, Washington, D.C., Apr. 2010.
32. Chandler, K. and K. Walkowicz, King County Metro Transit Hybrid Articulated Buses: Final Evaluation Results, Technical Report NREL/TP-540-40585, National Renewable Energy Laboratory, Golden, Colo., Dec. 2006.
33. Reich, S.L. and S. Kolpakov, Tracking Costs of Alter-natively Fueled Buses in Florida, National Center for Transit Research, University of South Florida, Tampa, Nov. 2011 [Online]. Available: http://www.nctr.usf.edu/wp-content/uploads/2012/02/77927-final-report.pdf.
34. Polzin, S., S. Reich, and J. Davis, Exploration of Transit’s Sustainability Competitiveness, National Center for Tran-sit Research and Florida Department of Transportation, Tallahassee, Mar. 2011.
35. Lammert, M., Long Beach Transit: Two-Year Evalua-tion of Gasoline-Electric Hybrid Transit Buses, Techni-cal Report NREL/TP-540-42226, National Renewable Energy Laboratory, Goldon, Colo., June 2008 [Online]. Available: http://www.nrel.gov/docs/fy08osti/42226.pdf.
36. McGraw, J., S. Shull, and G. Mikhaitis, The Route to Car-bon and Energy Savings: Transit Efficiency in 2030 and 2050, Center for Neighborhood Technology, Chicago, Ill. and San Francisco, Calif., Nov. 2010.
37. Barnitt, R., Case Study: Ebus Hybrid Electric Buses and Trolleys, Technical Report NREL/TP-540-38749, National Renewable Energy Laboratory, Golden, Colo., July 2006.
38. Mitchell, A., “Hydrogen Bus Fleet Improving, BC Transit President Says,” Pique, May 27, 2011 [Online]. Available: http://www.piquenewsmagazine.com/gyrobase/ hydrogen-bus-fleet-improving-bc-transit-president-says/Content?oid=2174878&showFullText=true [accessed Aug. 17, 2012].
39. Eudy, L., K. Chandler, and C. Gikakis, Fuel Cell Buses in U.S. Transit Fleets: Current Status 2010, NREL/TP-5600-49379, National Renewable Energy Labora-tory, Golden, Colo., Nov. 2010.
40. Chandler, K. and L. Eudy, Connecticut Transit (CT Transit) Fuel Cell Transit Bus: Third Evaluation Report, NREL/TP-560-47334-1, National Renewable Energy Laboratory, Golden, Colo., Jan. 2010.
41. Chandler, K. and L. Eudy, Zero Emission Bay Area (ZEBA) Fuel Cell Bus Demonstration: First Results Report, NREL/TP-5600-52015, National Renewable Energy Laboratory, Golden, Colo., Aug. 2011, 44 pp.
42. “Leading by Example,” Maryland Department of Trans-portation, n.d. [Online]. Available: http://www.mdot.maryland.gov/Office%20of%20Planning%20and%20Capital%20Programming/Smart%20Green%20and%20Growing/LeadingByExample.html [accessed Mar. 15, 2012].
43. Southworth, F., M.D. Meyer, and B.A. Weigel, Transit Greenhouse Gas Emissions Management Compendium, FTA-GA-26-7006.2011.01, Federal Transit Adminis-tration, Washington, D.C., Jan. 12, 2011.
44. Greening and Energy Strategies for the Canadian Public Transit Industry: Industry Research and Trends Report—Draft, Canadian Urban Transportation Association, Toronto, ON, Mar. 16, 2012
45. “Transit Rail: Potential Rail Car Cost-Saving Strategies Exist,” GAO-10-730, U.S. Government Accountability Office, Washington, D.C., June 2010.
46. “SEP-TAINABLE: Going Beyond Green,” Southeastern Pennsylvania Transportation Authority, Philadelphia, Pa., Feb. 2012 [Online]. Available: http://www.septa.org/sustain/pdf/septainable12.pdf [accessed Feb. 20, 2012].
47. Traction Power Report, Blue Ribbon Commission on Sus-tainability for the New York Metropolitan Transportation Authority, New York, Feb. 25, 2009.
48. “Board Action/Information Summary: Sustainability Ini-tiatives,” Washington Metropolitan Area Transit Author-ity, Washington, D.C., Mar. 8, 2012.
49. Grant, M. and F. Gallivan, TCRP Synthesis 84: Current Practices in Greenhouse Gas Emissions Savings from Transit, Transportation Research Board of the National Academies, Washington, D.C., 2010, 77 pp.
50. Transit Sustainability Guidelines, APTA SUDS-UD-RP-004-11, American Public Transportation Association, Washington, D.C., Mar. 31, 2011.
51. Ziring, E. and P.S. Srirag, “Mitigating Excessive Idling of Transit Buses,” Transportation Research Record: Journal of the Transportation Research Board, No. 2143, Trans-portation Research Board of the National Academies, Washington, D.C., 2010, pp. 142–149.
52. “Clean Air Act Settlement with the Massachusetts Bay Transportation Authority (MBTA) and Massachusetts Bay Commuter Railroad Company (MBCR) for Com-muter Train Idling Violations,” U.S. Environmental Pro-tection Agency, Washington, D.C., Aug. 2010 [Online]. Available: http://www.epa.gov/region1/enforcement/air/pdfs/CAA-MBTA-MBCR-Fact-Sheet.pdf.
53. “Fuel Sense: Making Fleet and Transit Operations More Efficient,” Case Studies in Sustainable Transportation, Transport Canada, Toronto, ON, July 2004 [Online]. Available: http://www.tc.gc.ca/eng/programs/environment- utsp-fuelsense-1166.htm.
54. Hemily, B. and R. King, TCRP Synthesis 41: The Use of Small Buses in Transit Service, Transportation Research
59
Board of the National Academies, Washington, D.C., 2002, 71 pp.
55. Lehtonen, M. and R. Kulmala, “Benefits of Pilot Imple - mentation of Public Transport Signal Priorities and Real- Time Passenger Information,” Transportation Research Record: Journal of the Transportation Research Board, No. 1799, Transportation Research Board of the National Academies, Washington, D.C., 2002, pp. 18–25.
56. “Hybrids, Diesels, and Alternative Fuel Vehicles,” U.S. Department of Energy, Washington, D.C., Mar. 28, 2012 [Online]. Available: http://www.fueleconomy.gov/feg/alternatives.shtml.
57. “Dial Down Rising Fuel Costs,” Office of Energy Efficiency & Renewable Energy, U.S. Department of Energy, Washington, D.C. [Online]. Available: http://www. fueleconomy.gov/feg/tiplist.shtml [accessed Mar. 19, 2012].
58. “Lighting,” Energy Star Building Upgrade Manual, U.S. Environmental Protection Agency, Washington, D.C., 2008 [Online]. Available: http://www.energystar.gov/index.cfm? cbusiness.bus_upgrade_manual [accessed Mar. 18, 2012].
59. “New York City Transit and the Environment,” Metro-politan Transit Authority, New York, n.d. [Online]. Avail-able: http://www.mta.info/nyct/facts/ffenvironment.htm [accessed Mar. 15, 2012].
60. Capital District Transportation Authority, Solar Tran-sit Stops on Central Avenue: Final Report, New York State Energy Research and Development Authority, Feb. 2011 [Online]. Available: https://www.dot.ny.gov/divisions/engineering/technical-services/trans-r-and-d-repository/C-08-04%20CDTA%20Solar%20Transit%20Stop%20Final%20Report_Feb%202011.pdf?ndnysdot [accessed Nov. 23, 2011].
61. Report to Congress: Transit Green Building Action Plan, Federal Transit Administration, Washington, D.C., July 2009 [Online]. Available: http://www.fta.dot.gov/documents/Transit_Green_Building_Action_Plan.pdf. [accessed Mar. 19, 2012].
62. Eudy, L., R. Burgess, and C. Ainscough, Transit Investments for Greenhouse Gas and Energy Reduction Program: First Assessment Report, Federal Transit Administration, Wash-ington, D.C., Apr. 2012.
63. Water Sustainability Report, The MTA Blue Ribbon Com-mission on Sustainability, Metropolitan Transportation Authority, New York, Dec. 24, 2008.
64. 2008–2009 Sustainability Report, Regional Transit Dis-trict, Denver, Colo., Nov. 29, 2010.
65. Lowell, D., TCRP Synthesis 9: Waste Control Practices at Bus Maintenance Facilities, Transportation Research Board, National Research Council, Washington, D.C., 1995, 26 pp.
66. Renewable Energy Policy, Los Angeles County Metro-politan Transportation Authority, Sep. 14, 2011.
67. “MARTA’s Sustainability Programs,” Metropolitan Atlanta Rapid Transit Authority [Online]. Available: http://www.itsmarta.com/marta-sustainability-programs.aspx#canopies [accessed Feb. 9, 2012].
68. Smith, D.A., “Selection of Provider for Solar Purchase Power Agreement,” Board Memorandum to Santa Clara Valley Transportation Authority Board of Directors, Jan. 24, 2011.
69. “CityBus, Lafayette–West Lafayette, IN,” Northern Power Systems [Online]. Available: http://northernpower.kiosk-view.com/citybus [accessed June 13, 2012].
70. “Quantifying Greenhouse Gas Emissions from Transit,” APTA SUDS-CC-RP-001-09, American Public Trans-portation Association, Washington, D.C., Aug., 2009.
71. “Connecticut Transit Hybrid Bus and Stationary Fuel Cell Installation,” TIGGER-FS-CT-77-001, U.S. Federal Transit Administration, Washington, D.C., July 2011.
72. Eudy, L., et al., “Transit Investments for Greenhouse Gas and Energy Reduction Program: First Assessment Report” [Draft].
73. Sep-tainable: The Route to Regional Sustainability, South-eastern Pennsylvania Transportation Authority, Philadel-phia, Jan. 2011.
74. “About Metro,” King County Metro Transit [Online]. Available: http://metro.kingcounty.gov/am/metro.html [accessed May 8, 2012].
75. King County Energy Plan, King County Energy Task Force, Seattle, Wash., Oct. 2010.
76. An ordinance requiring the King County executive to develop a strategic climate action plan by June 29, 2012; amending Ordinance 17166, Section 2, and K.C.C. 18.50.010 and adding a new chapter to K.C.C. Title 18, King County Legislature Enactment #17270, Feb. 27,2012 [Online]. Available: http://mkcclegisearch.kingcounty.gov/View.ashx?MF&ID1822458&GUID342CADEC-671B-47EF-A4B3-6C08DE8431C8 [accessed June 13, 2012].
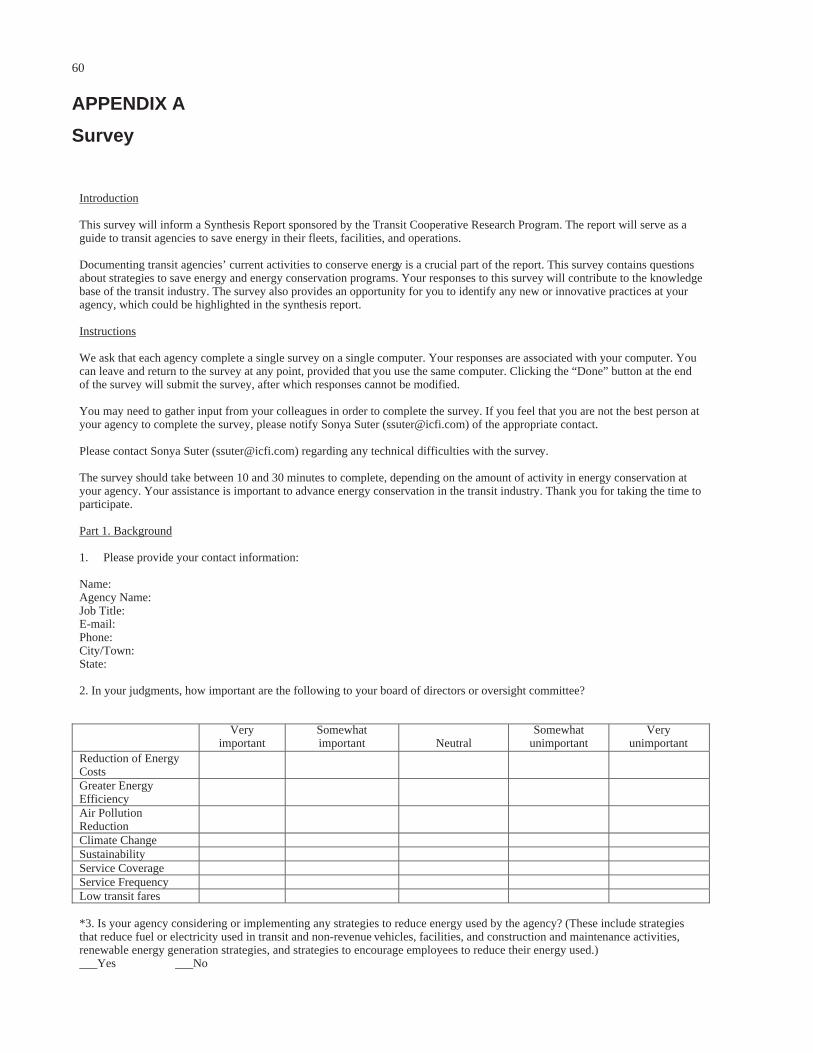
60
APPENDIX A
Survey
Introduction This survey will inform a Synthesis Report sponsored by the Transit Cooperative Research Program. The report will serve as a guide to transit agencies to save energy in their fleets, facilities, and operations. Documenting transit agencies’ current activities to conserve energy is a crucial part of the report. This survey contains questions about strategies to save energy and energy conservation programs. Your responses to this survey will contribute to the knowledge base of the transit industry. The survey also provides an opportunity for you to identify any new or innovative practices at your agency, which could be highlighted in the synthesis report. Instructions We ask that each agency complete a single survey on a single computer. Your responses are associated with your computer. You can leave and return to the survey at any point, provided that you use the same computer. Clicking the “Done” button at the end of the survey will submit the survey, after which responses cannot be modified. You may need to gather input from your colleagues in order to complete the survey. If you feel that you are not the best person at your agency to complete the survey, please notify Sonya Suter ([email protected]) of the appropriate contact. Please contact Sonya Suter ([email protected]) regarding any technical difficulties with the survey. The survey should take between 10 and 30 minutes to complete, depending on the amount of activity in energy conservation at your agency. Your assistance is important to advance energy conservation in the transit industry. Thank you for taking the time to participate. Part 1. Background 1. Please provide your contact information: Name: Agency Name: Job Title: E-mail: Phone: City/Town: State: 2. In your judgments, how important are the following to your board of directors or oversight committee? Very
important Somewhat important Neutral
Somewhat unimportant
Veryunimportant
Reduction of Energy Costs
Greater Energy Efficiency
Air Pollution Reduction
Climate Change Sustainability Service Coverage Service Frequency Low transit fares *3. Is your agency considering or implementing any strategies to reduce energy used by the agency? (These include strategies that reduce fuel or electricity used in transit and non-revenue vehicles, facilities, and construction and maintenance activities,renewable energy generation strategies, and strategies to encourage employees to reduce their energy used.) ___Yes ___No

61
Transit Vehicle Technology Strategies A *4. Is your agency saving energy through strategies related to transit vehicle technology (such as using lighter vehicles powered by alternative propulsion technologies)? ___Yes ___No Transit Vehicle Technology Strategies B 5. Is your agency using any of the following alternative vehicle technologies to save energy in buses? (Check all that apply.)
o Hydrogen fuel cell o Battery electric vehicles o Hybrid electric vehicles o N/A (do not operate buses) o None of the above o Other (please specify):
6. Is your agency using any of the following strategies to improve the fuel economy of existing or new buses? (Check all that apply.)
o Procure lighter weight vehicles o Improve efficiency of HVAC systems o Improve efficiency of vehicle lighting o N/A (do not operate buses) o None of the above o Other (please specify):
7. Is your agency using any of the following strategies to improve the fuel economy of existing or new rail cars? (Check all that apply.)
o Switch to lighter weight vehicles o Regenerative braking o Improve efficiency of HVAC systems o Improve efficiency of vehicle lighting o Minimize electric transmission losses o N/A (do not operate rail) o None of the above o Other (please specify):
8. Briefly describe your agency’s use of strategies selected above (Questions 5–7). Have they been considered successful or unsuccessful? 9. Do you have information on the actual or expected impacts of transit vehicle technology strategies at your transit agency? Impacts include fuel or electricity saved, cost or cost savings, and co-benefits or other impacts such as changes to transit service or environmental impacts.
o Yes [please describe the impacts and how impacts were measured. Forward any supplementary documents to Sonya Suter, [email protected]]
o No If you answered “Yes,” please describe: Transit Vehicle Operations and Maintenance Strategies A 10. Is your agency saving energy through transit vehicle operations and maintenance strategies (such as anti-idling policies or driver training)? Transit Vehicle Operations and Maintenance Strategies B 11. Please check all strategies that your agency is using:
o Use of anti-idling technologies or policies o Driver training for eco-driving/operation of vehicles o Maintenance programs to improve fuel efficiency o Other (please specify):

62
12. Briefly describe your agency’s use of strategies selected above. Have they been considered successful or unsuccessful? 13. Do you have information on the actual or expected impacts of transit vehicle operations and maintenance strategies at your transit agency? Impacts include fuel or electricity saved, cost or cost savings, and co-benefits or other impacts such as changes to transit service or environmental impacts.
o Yes [please describe the impacts and how impacts were measured. Forward any supplementary documents to Sonya Suter, [email protected]]
o No If you answered “Yes,” please describe: Transit Service Design Strategies A *14. Is your agency saving energy through transit service design strategies (such as signal priority for transit vehicles or layover timing)? ___Yes ___No Transit Service Design Strategies B 15. Please check all strategies that your agency is using:
o Off-board fare payment o GIS tracking of transit vehicles o Automatic vehicle dispatch and management for traffic flow o Layover timing o Signal priority for transit vehicles o Stop spacing o Use of demand response service when demand not sufficient for fixed-route service o Other (please specify):
16. Does your agency consider energy savings in designing transit service? ___Yes ___No Impacts of Service Design Strategies 17. Briefly describe your agency’s use of service design strategies to save energy selected above. Have they been considered successful or unsuccessful? 18. Do you have information on the actual or expected impacts of transit service design strategies at your agency? Impacts include fuel or electricity saved, cost or cost savings, and co-benefits or other impacts such as changes to transit service or environmental impacts.
o Yes [please describe the impacts and how impacts were measured. Forward any supplementary documents to Sonya Suter, [email protected]]
o No If you answered “Yes,” please describe: Non-Revenue Vehicle Strategies A *19. Is your agency saving energy through non-revenue vehicle strategies? ___Yes ___No Non-Revenue Vehicle Strategies B 20. Please check all strategies that your agency is using:
o Hydrogen vehicles o Battery electric vehicles o Hybrid electric vehicles o Plug-in hybrid electric vehicles o Reductions in fleet size o Trip chaining or other trip reduction measures o Use of anti-idling technologies or policies o Driver training for eco-driving/operation of vehicles o Maintenance programs to improve fuel efficiency o Other (please specify):
21. Briefly describe your agency’s use of strategies selected above. Have they been considered successful or unsuccessful?

63
22. Do you have information on the actual or expected impacts of strategies pertaining to non-revenue vehicles at your transit agency? Impacts include fuel or electricity saved, cost or cost savings, and co-benefits or other impacts such as changes to transit service or environmental impacts.
o Yes [please describe the impacts and how impacts were measured. Forward any supplementary documents to Sonya Suter, [email protected]]
o No If you answered “Yes,” please describe: Construction and Maintenance Strategies A *23. Is your agency saving energy used in construction activities and maintenance yards (through strategies such as using recycled materials and more efficient equipment)? ___Yes ___No Construction and Maintenance Strategies B 24. Please check all strategies your agency is using:
o Strategies to reduce energy used in maintenance yards o Strategies to reduced energy used in construction and maintenance equipment o Use of alternative (recycled) construction materials o Sourcing materials locally o Recycling construction waste o Reuse of building materials to reduce waste o Other (please specify):
25. Briefly describe your agency’s use of strategies selected above. Have they been considered successful or unsuccessful? 26. Do you have information on the actual or expected impacts of strategies to reduce energy consumption from construction or maintenance? Impacts include fuel or electricity saved, cost or cost savings, and co-benefits or other impacts such as changes to transit service or environmental impacts.
o Yes [please describe the impacts and how impacts were measured. Forward any supplementary documents to Sonya Suter, [email protected]]
o No If you answered “Yes,” please describe: Power Generation Strategies A *27. Is your agency saving energy through power generation strategies (such as generating solar energy on site)? ___Yes ___No Power Generation Strategies B 28. Please check forms of renewable energy that your agency is using:
o Solar o Wind o Geothermal o Fuel cells o Other (please specify):
29. Briefly describe your agency’s use of strategies selected above. Have they been considered successful or unsuccessful? 30. Do you have information on the actual or expected impacts of power generation strategies at your transit agency? Impacts include fuel or electricity saved, cost or cost savings, and co-benefits or other impacts such as changes to transit service or environmental impacts.
o Yes [please describe the impacts and how impacts were measured. Forward any supplementary documents to Sonya Suter, [email protected]]
o No If you answered “Yes,” please describe: Energy at Stations and Stops A *31. Is your agency saving energy through strategies to save energy at stations and stops (through strategies such as efficient lighting)? ___Yes ___No

64
Energy at Stations and Stops B 32. Is your agency saving energy at transit stations and stops (through strategies such as efficient lighting)?
o Solar-powered lighting at stations or stops o LED lighting at stations or stops o Efficient heating or cooling in stations o Other (please specify):
33. Briefly describe your agency’s use of strategies selected above. Have they been considered successful or unsuccessful? 34. Do you have information on the actual or expected impacts of strategies to save energy at stations and stops? Impacts include fuel or electricity saved, cost or cost savings, and co-benefits or other impacts such as changes to transit service or environmental impacts.
o Yes [please describe the impacts and how impacts were measured. Forward any supplementary documents to Sonya Suter, [email protected]]
o No If you answered “Yes,” please describe: Office Facilities and Other Buildings A *35. Is your agency saving energy through strategies related to building energy use? ___Yes ___No Office Facilities and Other Buildings B 36. Please check all strategies that your agency is using:
o Upgrading to more efficient lighting o Install automatic timers/sensors for lighting o Upgrading to more efficient appliances and computers o Enhancing building insulation o Installing passive heating or cooling systems o Achieving LEED certification o Water conservation measures o Use of green/recycled materials o Waste diversion/recycling programs o None of the above o Other (please specify):
37. Briefly describe your agency’s use of strategies selected above. Have they been considered successful or unsuccessful? 38. Do you have information on the actual or expected impacts of strategies to reduce energy from facilities and other buildingsat your transit agency? Impacts include fuel or electricity saved, cost or cost savings, and co-benefits or other impacts such as changes to transit service or environmental impacts.
o Yes [please describe the impacts and how impacts were measured. Forward any supplementary documents to Sonya Suter, [email protected]]
o No If you answered “Yes,” please describe: Workforce Management Practices A *39. Is your agency saving energy through workforce management practices? ___Yes ___No Workforce Management Practices B 40. Please check all strategies that your agency is using:
o Encouraging ridesharing or vanpool participation o Providing transit benefits o Allowing for compressed work weeks or telework o Providing bike benefits or bike amenities (bike racks or showers on site) o None of the above o Other (please specify):
65
41. Briefly describe your agency’s use of strategies selected above. Have they been considered successful or unsuccessful? 42. Do you have information on the actual or expected impacts of workforce management practices at your transit agency? Impacts include fuel or electricity saved, cost or cost savings, and co-benefits or other impacts such as changes to transit service or environmental impacts.
o Yes [please describe the impacts and how impacts were measured. Forward any supplementary documents to Sonya Suter, [email protected]]
o No If you answered “Yes,” please describe: Other Strategies 43. Is your agency using or considering any other strategies to save energy not mentioned above? Please describe. Planning and Implementing Strategies 44. Do you have any formal procedures or practices to evaluate and compare strategies for saving energy? Examples could include use of benefit-cost, return on investment, or net present value analyses. If yes, please describe below. 45. How are you financing your adoption of energy saving strategies? Some options include bonding for major investments, use of state or federal tax credits, or supplementary funding from state, regional, or local governments. 46. What, if any strategic planning techniques are you using to select or implement energy saving strategies? Check all that apply.
o Establishing reduction goals, objectives, and performance measures o Developing agency policy statements o Developing an agency energy or sustainability plan o Establishing an energy or environmental management system o None of the above o Other (please specify):
47. If you selected a strategic planning technique above, please explain: 48. What challenges has your agency experienced with implementing energy saving strategies? Please check all that apply.
o Upfront costs required to implement strategies o Time required to realize benefits from strategies o Lack of internal expertise or staff time available o Lack of decision maker/stakeholder support o Unsure of strategy effectiveness o No challenges o Other (please specify):
49. What other factors are important in your consideration and implementation of energy saving strategies? Please check all that apply.
o State and/or regional mandates for energy efficiency or reduction o Communicating with decision makers, stakeholders, or the general public o Co-benefits of energy saving strategies such as congestion reduction, air quality improvement, cost savings, or otherso Presence of champions of energy saving strategies within the agency o Public/customer desire for energy savings o Other (please specify):
Case Study Identification 50. If selected, would you be willing to serve as a case study for this TCRP synthesis report? ___Yes ___No 51. Do you have any suggestions of other agencies that we should survey and/or consider as case studies? Agency: Contact Name: Contact E-mail: Agency: Contact Name: Contact E-mail:

66
52. What would you most like to see provided in this TCRP synthesis of practice? 53. Is there any additional information you would like to provide related to energy savings strategies, selection of energy savings strategies at your agency, or any other related topic? If there is any additional documentation you can provide, please forward this to [email protected]. Closing and Thank You Thank you for taking the time to participate in the survey. Your responses will be used to inform a synthesis of practice about energy saving strategies in use at transit agencies around the country and will be a resource for others. If you have any additional questions about the survey, please do not hesitate to contact Sonya Suter ([email protected], 703-225-2866). Once you have hit “done,” your survey will be submitted and you will not be able to edit your responses without contacting us directly.
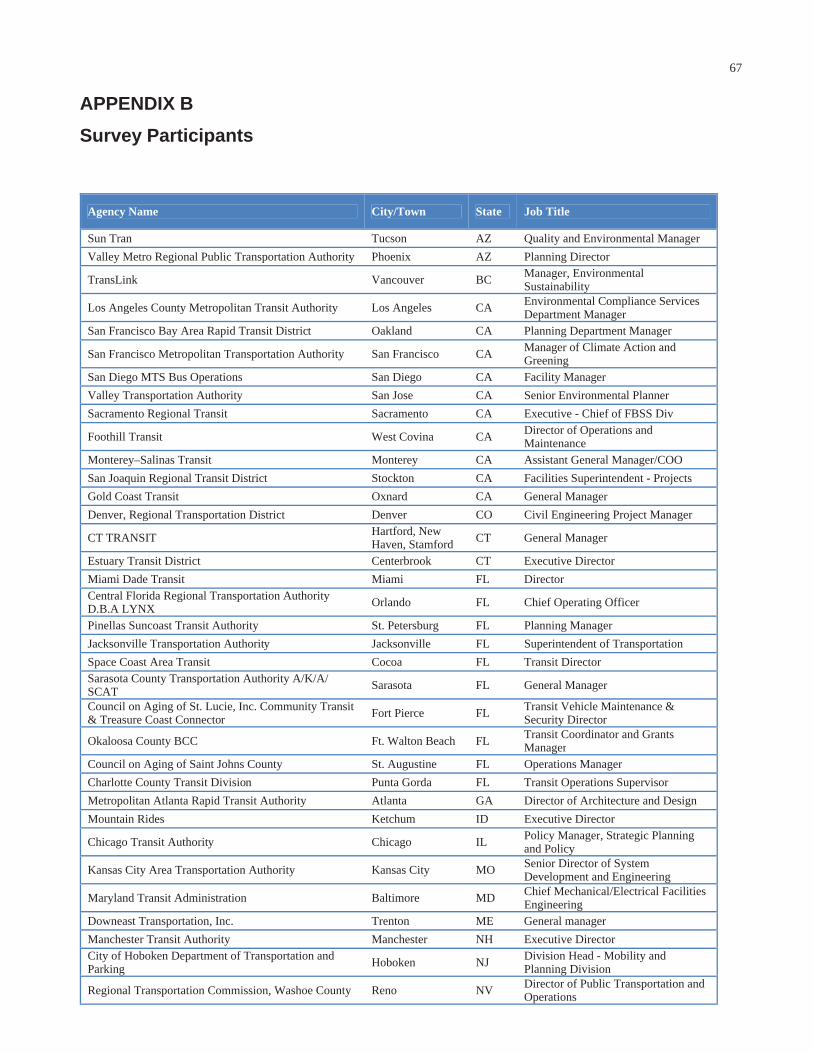
67
APPENDIX B
Survey Participants
Agency Name City/Town State Job Title
Sun Tran Tucson AZ Quality and Environmental Manager
Valley Metro Regional Public Transportation Authority Phoenix AZ Planning Director
TransLink Vancouver BC Manager, Environmental Sustainability
Los Angeles County Metropolitan Transit Authority Los Angeles CA Environmental Compliance Services Department Manager
San Francisco Bay Area Rapid Transit District Oakland CA Planning Department Manager
San Francisco Metropolitan Transportation Authority San Francisco CA Manager of Climate Action and Greening
San Diego MTS Bus Operations San Diego CA Facility Manager
Valley Transportation Authority San Jose CA Senior Environmental Planner
Sacramento Regional Transit Sacramento CA Executive - Chief of FBSS Div
Foothill Transit West Covina CA Director of Operations and Maintenance
Monterey–Salinas Transit Monterey CA Assistant General Manager/COO
San Joaquin Regional Transit District Stockton CA Facilities Superintendent - Projects
Gold Coast Transit Oxnard CA General Manager
Denver, Regional Transportation District Denver CO Civil Engineering Project Manager
CT TRANSIT Hartford, New Haven, Stamford CT General Manager
Estuary Transit District Centerbrook CT Executive Director
Miami Dade Transit Miami FL Director Central Florida Regional Transportation Authority D.B.A LYNX Orlando FL Chief Operating Officer
Pinellas Suncoast Transit Authority St. Petersburg FL Planning Manager
Jacksonville Transportation Authority Jacksonville FL Superintendent of Transportation
Space Coast Area Transit Cocoa FL Transit Director Sarasota County Transportation Authority A/K/A/ SCAT Sarasota FL General Manager
Council on Aging of St. Lucie, Inc. Community Transit & Treasure Coast Connector Fort Pierce FL
Transit Vehicle Maintenance & Security Director
Okaloosa County BCC Ft. Walton Beach FL Transit Coordinator and Grants Manager
Council on Aging of Saint Johns County St. Augustine FL Operations Manager
Charlotte County Transit Division Punta Gorda FL Transit Operations Supervisor
Metropolitan Atlanta Rapid Transit Authority Atlanta GA Director of Architecture and Design
Mountain Rides Ketchum ID Executive Director
Chicago Transit Authority Chicago IL Policy Manager, Strategic Planning and Policy
Kansas City Area Transportation Authority Kansas City MO Senior Director of System Development and Engineering
Maryland Transit Administration Baltimore MD Chief Mechanical/Electrical Facilities Engineering
Downeast Transportation, Inc. Trenton ME General manager
Manchester Transit Authority Manchester NH Executive Director City of Hoboken Department of Transportation and Parking Hoboken NJ
Division Head - Mobility and Planning Division
Regional Transportation Commission, Washoe County Reno NV Director of Public Transportation and Operations

68
Capital District Transportation Authority Albany NY Chief Executive Officer
Metro–Southwest Ohio Regional Transit Authority Cincinnati OH Director of Maintenance, Fleet and Facilities
TriMet Portland OR Coordinator, Strategic Planning
Southeastern Pennsylvania Transportation Authority Philadelphia PA Strategy and Sustainability Planner
Metropolitan Transit Authority of Harris County Houston TX Vice President Facilities Maintenance
Dallas Area Rapid Transit Dallas TX Vice President, Maintenance
Capital Metro Austin TX Vice President for Planning
Utah Transit Authority Salt Lake City UT Environmental Compliance Administrator
Hampton Roads Transit Norfolk VA Environmental Compliance and Sustainability Officer
Arlington County, Va (Art & Star) Arlington County VA Transit Services Manager
Jaunt, Inc. Charlottesville VA Executive Director
King County Metro Transit Seattle WA Sr. Project Manager
Community Transit Everett WA Risk Management Analyst
Pierce Transit Lakewood WA Facilities Manager
Sound Transit Seattle WA Sustainability Manager
New York Metropolitan Transit Authority New York, NY NY Director, Sustainability Initiatives

Abbreviations used without definitions in TRB publications:
A4A Airlines for AmericaAAAE American Association of Airport ExecutivesAASHO American Association of State Highway OfficialsAASHTO American Association of State Highway and Transportation OfficialsACI–NA Airports Council International–North AmericaACRP Airport Cooperative Research ProgramADA Americans with Disabilities ActAPTA American Public Transportation AssociationASCE American Society of Civil EngineersASME American Society of Mechanical EngineersASTM American Society for Testing and MaterialsATA American Trucking AssociationsCTAA Community Transportation Association of AmericaCTBSSP Commercial Truck and Bus Safety Synthesis ProgramDHS Department of Homeland SecurityDOE Department of EnergyEPA Environmental Protection AgencyFAA Federal Aviation AdministrationFHWA Federal Highway AdministrationFMCSA Federal Motor Carrier Safety AdministrationFRA Federal Railroad AdministrationFTA Federal Transit AdministrationHMCRP Hazardous Materials Cooperative Research Program IEEE Institute of Electrical and Electronics EngineersISTEA Intermodal Surface Transportation Efficiency Act of 1991ITE Institute of Transportation EngineersMAP-21 Moving Ahead for Progress in the 21st Century Act (2012)NASA National Aeronautics and Space AdministrationNASAO National Association of State Aviation OfficialsNCFRP National Cooperative Freight Research ProgramNCHRP National Cooperative Highway Research ProgramNHTSA National Highway Traffic Safety AdministrationNTSB National Transportation Safety BoardPHMSA Pipeline and Hazardous Materials Safety AdministrationRITA Research and Innovative Technology AdministrationSAE Society of Automotive EngineersSAFETEA-LU Safe, Accountable, Flexible, Efficient Transportation Equity Act: A Legacy for Users (2005)TCRP Transit Cooperative Research ProgramTEA-21 Transportation Equity Act for the 21st Century (1998)TRB Transportation Research BoardTSA Transportation Security AdministrationU.S.DOT United States Department of Transportation