updated cloud physics in a regional atmospheric climate model improves the modelled surface
TRANSCRIPT

The Cryosphere 8 125ndash135 2014wwwthe-cryospherenet81252014doi105194tc-8-125-2014copy Author(s) 2014 CC Attribution 30 License
The Cryosphere
Open A
ccess
Updated cloud physics in a regional atmospheric climate modelimproves the modelled surface energy balance of Antarctica
J M van Wessem1 C H Reijmer1 J T M Lenaerts1 W J van de Berg1 M R van den Broeke1 andE van Meijgaard2
1Institute for Marine and Atmospheric Research Utrecht Utrecht University Utrecht the Netherlands2Royal Netherlands Meteorological Institute De Bilt the Netherlands
Correspondence toJ M van Wessem (jmvanwessemuunl)
Received 21 May 2013 ndash Published in The Cryosphere Discuss 1 July 2013Revised 2 December 2013 ndash Accepted 3 December 2013 ndash Published 22 January 2014
Abstract In this study the effects of changes in thephysics package of the regional atmospheric climate modelRACMO2 on the modelled surface energy balance near-surface temperature and wind speed of Antarctica are pre-sented The physics package update primarily consists of animproved turbulent and radiative flux scheme and a revisedcloud scheme that includes a parameterisation for ice cloudsuper-saturation The ice cloud super-saturation has led tomore moisture being transported onto the continent result-ing in more and optically thicker clouds and more downwardlong-wave radiation Overall the updated model better rep-resents the surface energy balance based on a comparisonwith gt 750 months of data from nine automatic weather sta-tions located in East Antarctica Especially the representationof the turbulent sensible heat flux and net long-wave radiativeflux has improved with a decrease in biases of up to 40 Asa result modelled surface temperatures have increased andthe bias when compared to 10 m snow temperatures from 64ice-core observations has decreased fromminus23 K tominus13 KThe weaker surface temperature inversion consequently im-proves the representation of the sensible heat flux whereaswind speed biases remain unchanged However significantmodel biases remain partly because RACMO2 at a resolu-tion of 27 km is unable to resolve steep topography
1 Introduction
Understanding the climate of the polar regions and changestherein requires a thorough understanding of the surface en-ergy balance (SEB) which describes the exchange of heat
and moisture at the earthrsquos surface Regional atmosphericclimate models (RCMs) are important tools to improve ourunderstanding of polar SEB They provide a physically con-sistent representation of the climate in areas with a low spa-tial and temporal coverage of observations RCMs are alsocapable of resolving detailed features that are not capturedby global circulation models Specifically RCMs have beensuccessfully applied to remote areas such as Antarctica (egVan Lipzig et al 2002) and Greenland (Fettweis 2007 Et-tema et al 2010a) to assess the SEB and surface mass bal-ance (SMB) of these ice sheets (egVan Lipzig et al 1999Van de Berg et al 2005 Lenaerts et al 2012a) MoreoverRCM output can be used to enhance the interpretation of re-mote sensing data such as GRACE (Chen et al 2006) In-SAR (Rignot et al 2008) and radarlaser altimetry (Ligten-berg et al 2012)
The Regional Atmospheric Climate Model RACMO2which has been adapted for specific use over the polar re-gions has recently undergone a major update of its physicspackage In the present study we examine whether this up-date from version RACMO21 to RACMO23 has improvedthe representation of the Antarctic near-surface climate withits extreme temperatures and winds and surface energy bal-ance Even though RACMO21 has proved to realisticallysimulate the Antarctic near-surface climate (Van de Berget al 2005 Lenaerts et al 2012a) previous model evalu-ations showed that downward long-wave radiation is gener-ally underestimated by the model (Van de Berg et al 2007)resulting in a significant cold surface bias (Van den Broeke2008) To see whether this has improved in RACMO23 wewill assess the changes for Antarctica in SEB near-surface
Published by Copernicus Publications on behalf of the European Geosciences Union
126 J M van Wessem et al Effects of changed cloud physics
wind speed and surface temperature and compare these toavailable observations The Antarctic SEB historically hasbeen the focus of many studies based both on observa-tions (Schlatter 1970 Carroll 1982 Reijmer and Oerle-mans 2002) and modelling (Van de Berg et al 2007) in-cluding evaluations of models like RACMO (Van Lipziget al 1999 Reijmer et al 2005) Here we use new data col-lected at Antarctic automatic weather stations (AWSs) thathave been specifically designed to close and quantify theSEB (Reijmer and Oerlemans 2002)
Section2 discusses the model the changes in model for-mulation and the observational data used for evaluation InSect3 the effects of the model changes on clouds the SEBand the near-surface temperature and wind are presented anda comparison is made to observational data (Sects33ndash35)followed by conclusions in Sect4
2 Data and methods
21 RACMO2 physics update
RACMO2 combines the dynamical processes of the HighResolution Limited Area Model (HIRLAM) (Undeacuten et al2002) with the physics package of the European Cen-tre for Medium-range Weather Forecasts (ECMWF) Inte-grated Forecast System (IFS) RACMO2 has been specifi-cally adapted for use over the large ice sheets of Greenlandand Antarctica (egReijmer et al 2005) It is interactivelycoupled to a multilayer snow model that calculates melt per-colation refreezing and runoff of meltwater (Ettema et al2010b Greuell and Konzelmann 1994) Surface albedo isbased on a prognostic scheme for snow grain size (KuipersMunneke et al 2011) and a drifting snow routine simulatesthe interactions of drifting snow with the surface and thelower atmosphere (Lenaerts et al 2012a) A horizontal res-olution of sim 27 km and a vertical resolution of 40 levels isused The model is forced by ERA-Interim re-analysis data(January 1979ndashDecember 2011Dee et al 2011) at the oceanand lateral boundaries while the domain interior is allowedto evolve freely
Here we analyse changes in the modelled Antarctic near-surface climate after the ECMWF IFS physics package cycleCY23r4 in RACMO21 (White 2001) has been updated tocycle CY33r1 in RACMO23 (ECWMF-IFS 2008) The up-dates that have the most impact on Antarctic applications arethe changes in the cloud scheme the cloud microphysics andthe radiation and turbulence schemes All changes will bedescribed below and are discussed in more detail in relationwith the results in Sects33ndash35
An important change in the cloud scheme is the inclu-sion of a parameterization for ice super-saturation as de-scribed byTompkins and Gierens(2007) As a result thespecific humidity of cold air parcels (at temperatures wherethe difference between liquid water and ice saturation pres-
sure is large) has to reach a higher value in order for con-densation to occur This leads to an improved representationof clouds and moisture concentrations in the (upper) tropo-sphere (Tompkins and Gierens 2007) Aircraft observationswith the Microwave Limb Sounder (MLS) have shown thatsuper-saturation frequently occurs over the steep coastal re-gions of Antarctica (Spichtinger et al 2003) Simulationswith the ECMWF IFS have already shown that the new pa-rameterisation leads to a better global distribution of super-saturated atmospheres albeit with a slight underestimationfor Antarctica (Tompkins and Gierens 2007)
Another change in the physics is the introduction of theMcRad radiation scheme (Morcrette et al 2008) It de-scribes shortwave and long-wave radiation transfer throughclouds based on the Monte Carlo Independent Column Ap-proximation (McICABarker et al 2008) and a revision ofcloud optical properties making the parameterisations thatuse these properties more accurate This improves the inter-action of multi-layer cloud cover with shortwave and long-wave radiation but is believed to be of minor importancefor Antarctica considering the low occurrence frequency ofthese cloud types in this region In the shortwave radiationscheme (SRTMMlawer and Clough 1997) the FouqartndashBonnel scheme is replaced by a scheme that is based on thecorrelatedk method (Lacis 1991) The latter is shown to leadto an overall improved accuracy in calculated fluxes and heat-ing rates (ECWMF-IFS 2008)
The last relevant physics change is the newly implementedEddy-Diffusivity Mass Flux (EDMFSiebesma et al 2007)scheme for boundary-layer turbulenceshallow convectionThis scheme distinguishes between large-scale (updraughts)and small-scale (turbulence) mixing processes in the sur-face and boundary layer by describing them with eithermass fluxes or diffusion The surface flux relies on MoninndashObukhov similarity theory but takes into account form drag(Beljaars et al 2004) that is dependent on subscale orog-raphy For topographically rough areas like the AntarcticPeninsula these changes are expected to be especially im-portant
Furthermore the RACMO2 model update incorporateschanges in the HIRLAM dynamical core These are mostlyof numerical nature and are not addressed here For a moredetailed and complete description of the entire RACMO2 up-date the reader is referred toVan Meijgaard et al(2012) andECWMF-IFS (2008) and references therein The changesin the cloud scheme influence precipitation patterns overAntarctica Whether these changes represent an improve-ment and how these changes effect the mass budget of theice sheet will be addressed in a forthcoming study The im-pact of precipitation changes on the SEB is small as will beshown in Sect33
The Cryosphere 8 125ndash135 2014 wwwthe-cryospherenet81252014
J M van Wessem et al Effects of changed cloud physics 127
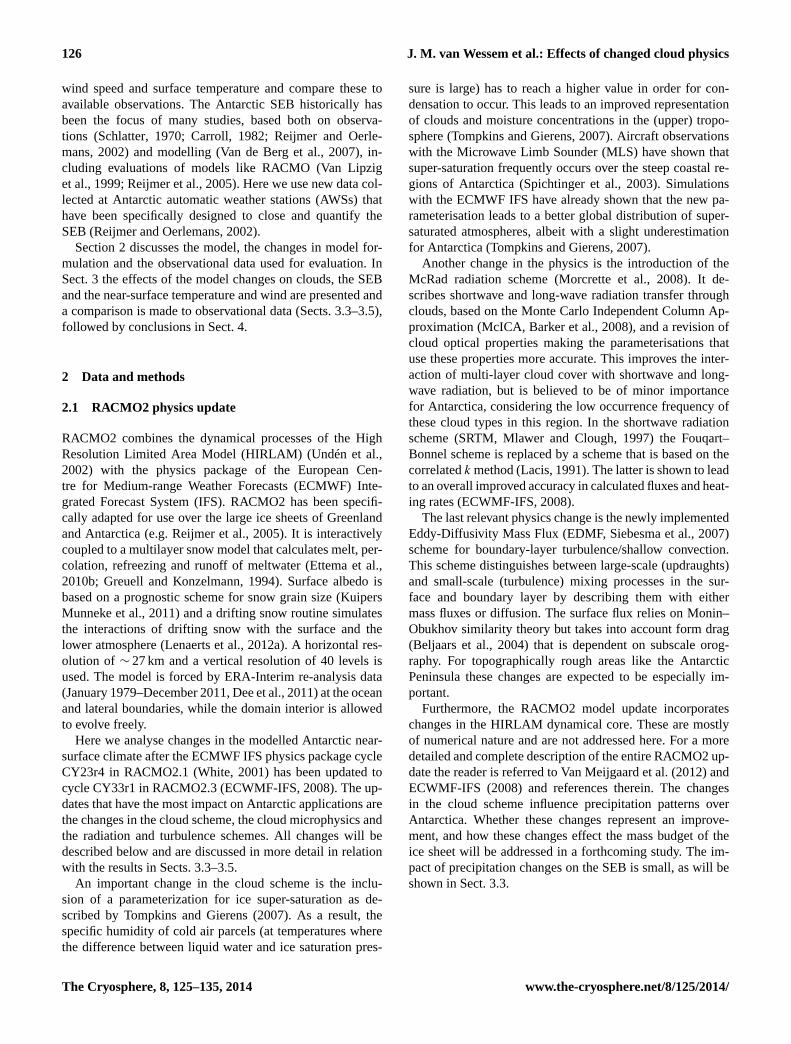
Fig 1Map of Antarctica with locations of the AWS (red diamonds)the 64 coring sites (black dots) and the position of the latitudi-nal cross-section used in Fig3 Also shown are the ice-shelf edgeand grounding line (solid lines) and height intervals every 500 m(dashed lines) based on a digital elevation model fromLiu et al(2001)
22 Observational data
The near-surface wind temperature and SEB are evalu-ated using observational data from nine automatic weatherstations maintained by the Institute for Marine and At-mospheric research of Utrecht University (UUIMAU) seethe IMAU AWS websitehttpwwwprojectsscienceuunliceclimateaws Importantly these AWSs measure all four ra-diation components as well as humidity and snow temper-ature and therefore enable a full closure of the SEB AllAWSs are of similar design single level measurements ofwind speeddirection temperature and relative humidity areperformed at a height of approximately 3 m The individualradiation components (SWdarr SWuarr LWdarr LWuarr) are mea-sured with a single sensor Treatment of the radiation fluxesfollows Van den Broeke(2004) Figure 1 shows the loca-tions of the AWSs They are located in Dronning Maud Land(DML) in different climate regimes from relatively mild andwet coastal sites (AWS 4 and 11) to the steep escarpment re-gion of DML (AWS 5 6 and 16) the south dome of BerknerIsland (AWS 10) and the high and cold East Antarctic plateau(AWS 8 9 and 12) Observation lengths range from 4 to 15 yrof data Due to instrumental problems and icing of the sen-sors some months of the data record are of lower quality Asummary of the location and data records of the AWSs is pro-vided in Table1 For more details seeVan den Broeke et al(2005a b) andReijmer and Oerlemans(2002)
The SEB can be written as
M = SWnet+ LWnet+ SHF+ LHF + G (1)
where fluxes directed towards the surface are defined positivewith units of W mminus2 M is melt energy (M = 0 if the sur-face temperatureTs lt 27315 K) SWnet and LWnet are thenet shortwave and long-wave radiative fluxes SHF and LHFare the sensible and latent heat fluxes andG is the subsur-face conductive heat flux The sensible- and latent-turbulentheat fluxes are calculated using MoninndashObukhov similaritytheory using the bulk method (Van den Broeke et al 2005b)This implies that the turbulent fluxes and surface tempera-tures are calculated values and not direct measurements Alldata from the nine AWSs are monthly averaged (resulting in770 station-months) and compared with data from the samemonths of the two RACMO cycles An assessment of thequality of the observational data can be found inReijmer andOerlemans(2002) Van den Broeke et al(2004)
As the AWSs only cover a limited part of East Antarctica64 snow temperature observations (Fig1) are additionallyused to evaluate the spatial performance of RACMO2 forTsThe 10 m snow temperature is assumed to represent the an-nual mean surface temperature a reasonable assumption inareas without melt Note that at a model resolution of 27 kmthe observational data are compared with data from the near-est model grid point For the 10 m snow temperatures thiscauses four locations to fall outside of the ice mask For thesepoints the nearest grid point that does fall within the ice maskis used
3 Results
31 General climate characteristics
In Antarctica a negative to zero net radiation budget prevailsduring most months In summer the radiation budget regu-larly becomes positive due to absorption of shortwave radia-tion at the surface In winter the radiation budget is balancedmainly by a positive (downward directed) SHF as LHF isgenerally small due to the low humidity and thus small near-surface moisture gradients exist over the Antarctic ice sheetThe negative radiation budget prevails and cools the sur-face resulting in a quasi-permanent surface-based temper-ature inversion In combination with a sloping surface thisleads to the characteristic persistent katabatic winds overthe Antarctic ice sheet As the cooling is stronger in winterthe katabatic winds increase in strength in winter Strongerkatabatic winds enhance downward sensible heat transportwhich counteracts the strength of the surface temperature in-version by increasing the surface temperature This resultsin a weaker seasonality of (near-)surface temperature in highwind speed areas
To illustrate these interactive processes Fig2 shows themonthly mean values of 10 m wind speed (V10 m) surface
wwwthe-cryospherenet81252014 The Cryosphere 8 125ndash135 2014
128 J M van Wessem et al Effects of changed cloud physics
Table 1The AWS topographic characteristics and period of operation (until December 2011) No months represents the number of availablemonths over total months (725770) of the model period (January 1979ndashDecember 2011) If no end time is indicated the AWS is stilloperational end of 2011 Observed surface slope (m kmminus1) is based on a 1kmtimes 1km digital elevation model (Liu et al 2001) modelledsurface slope is based on the 27 km interpolated grid
AWS 4 5 6 8 9 10 11 12 16
Latitude 7245prime S 7306prime S 7428prime S 7600prime S 7500prime S 7934prime S 7109prime S 7839prime S 7157prime SLongitude 15299prime W 13099prime W 11310prime W 0803prime W 0000prime EW 4547prime W 0642prime W 3538prime E 2320prime EElevation (obs) 34 m 363 m 1160 m 2400 m 2892 m 890 m 700 m 3620 m 1300 mElevation (mod) 23 m 332 m 1219 m 2405 m 2856 m 789 m 224 m 3621 m 1130 mSlope (obs) 10 231 384 20 15 11 155 20 156Slope (mod) 34 78 289 35 20 51 107 22 162Start Dec 1997 Feb 1998 Jan 1998 Jan 1998 Dec 1997 Jan 2001 Jan 2007 Dec 2007 Feb 2009End Dec 2002 ndash Jan 2009 Jan 2003 ndash Jan 2006 ndash ndash ndashno months 6060 167167 134134 1944 162168 4854 5759 4949 2935
Fig 2Monthly mean(a) 10 m wind speed (V10 m) (b) surface temperature (Ts) and(c) sensible heat flux (SHF) and net long-wave radiation(LWnet) for AWS 4 AWS 5 AWS 6 and AWS 9 The temperature curves for AWS 5 6 and 9 (Fig2b) are shifted upward by 02 49 and182 K respectively to correct for elevation and continentality differences (Van den Broeke 2004)
temperature (Ts) net long-wave radiation (LWnet) and sensi-ble heat flux (SHF) for four AWSs in different climate zonesof the Antarctic ice sheet (AWS 4 5 6 and 9) Figure2ashows that monthly mean wind speeds for AWS 5 and 6in the steep escarpment region exhibit a strong seasonal cy-cle due to stronger katabatic forcing in winter with monthlymean wind speeds up to 9 m sminus1 These katabatic winds mixwarm air downward to the surface (large SHF) increasingsurface temperature (Fig2b) and hence upward long-waveradiation (Fig2c) For AWS 4 and AWS 9 located on therelatively flat coastal ice shelf and interior ice sheet respec-tively wind speeds are lower and show no seasonal cycleAt these sites the seasonal amplitude in temperature is largerthan at the sites dominated by katabatic winds (AWS 5 and 6)mainly because the wintertime surface temperature inversionis stronger
32 Changes in cloud properties and impact onsimulated near-surface variables
The new parameterisation for cloud ice super-saturationchanges the total amount of modelled clouds over Antarcticamost notably over the East Antarctic plateau To illustratethis effect Fig3 shows a latitudinal cross-section of the ver-
tical distribution of total cloud waterice content averagedover the period 1979ndash2011 A significant increase of mod-elled cloud content is found over the East Antarctic plateauwhile cloud content has decreased along the coastline andover the ocean With the new parameterisation moist air thatreaches the continent has to exceed 100 relative humidityby up to 50 in order to form clouds As a result cloudsform farther inland and higher up in the troposphere result-ing in more clouds simulated by RACMO23 in the interior
The increase in clouds has caused more downward long-wave radiation to be emitted as seen in Fig4 where thedifference fields (RACMO23ndashRACMO21) for LWdarr (a)Ts(b) V10 m (c) and SHF (d) are shown The increase in LWdarr
is found on most of the Antarctic ice sheet but is strongeston the East Antarctic plateau and has led to higher sur-face temperatures (Fig4b) reducing the temperature gra-dients in the surface layer and resulting in lower SHF values(Fig 4d) A related pattern in near-surface wind speed is notseen (Fig4c) with changes being smaller than 5
The increase in clouds over the continent also results in anincrease of precipitation This is illustrated in Fig5 whichshows the changes in total precipitation (mostly snowfall) forDML where the AWSs are located The generally increased
The Cryosphere 8 125ndash135 2014 wwwthe-cryospherenet81252014
J M van Wessem et al Effects of changed cloud physics 129
Fig 3Latitudinal cross-section of yearly (1979ndash2011) averaged total cloud waterice content for(a) RACMO23(b) RACMO21 and(c) thedifference (RACMO23ndashRACMO21) at 1 E Location of cross-section is indicated in Fig1
Fig 4Spatial distribution of difference (RACMO23ndashRACMO21) for LWdown (a) Ts (b) V10 m (c) and SHF(d)
precipitation will have an effect on the SEB through in-creased albedo (impacting the shortwave radiation) and sub-limation (impacting latent heat flux) As will be shown in thenext section the effects on SWnet are small and limited tothe short austral summer while effects on LHF are generallysmall as well
33 Impact on simulation of the surface energy balance
Figure 6 shows the difference between the monthly aver-aged modelled and observed SEB fluxes for all nine AWSs(gt750 months) for RACMO23 and RACMO21 The aver-
age bias and correlation coefficients are summarized in Ta-ble 2 as well as the bias standard deviationσbias and rootmean square deviation (RMSD) Most biases (and RMSD)are reduced in RACMO23 for SHF from 105 Wmminus2 to71 Wmminus2 for LWnet from minus104 Wmminus2 to minus63 Wmminus2The changes in LHF and SWnet are small For SWnet thebias increased fromminus13 Wmminus2 to minus20 Wmminus2 but the cor-relation remains high (r2
093) For LHF the slight im-provement from 06 Wmminus2 to 04 Wmminus2 is of little signif-icance due to its small magnitude and the uncertainty of theobserved fluxes The standard deviationσbias has the same
wwwthe-cryospherenet81252014 The Cryosphere 8 125ndash135 2014
130 J M van Wessem et al Effects of changed cloud physics
Fig 5Spatial distribution of difference (RACMO23ndashRACMO21)for total precipitation (rain+ snowfall) in mm water equivalent peryear over Dronning Maud Land for 1979ndash2011 Shown are all theAWS except AWS 10 that falls just outside of the boundary
Fig 6 Difference (modelledminusobserved of(a) sensible heat flux(SHF) (b) latent heat flux (LHF)(c) net shortwave radiation(SWnet) and (d) net long-wave radiation (LWnet) as a function ofthe AWS observations Shown are RACMO23 (red) with biasbnewand RACMO21 (blue) with biasbold Biases (in [W mminus2]) are av-erages over all monthly average weather station data (gt 750 datapoints)
order of magnitude as the bias suggesting that the improve-ments are not statistically significant because of the signifi-cant noise
Fig 7 Annual cycle of monthly mean difference(modelledminusobserved) of the SEB components (SHF (blue)LHF (red) SWnet (orange) LWnet (green)) LWdarr (black circles)and SWdarr (black asterisks) for(a) AWS 4 (b) AWS 5 (c) AWS 6and(d) AWS 9 Shown are RACMO23 (solid line) and RACMO21(dashed line)
To investigate the seasonal effects Fig7 shows themonthly mean difference (modelledminusobserved) of SEBfluxes LWdarr and SWdarr for AWS 4 5 6 and 9 LWnet is under-estimated at the four AWS locations and most significantlyat AWS 4 and 9 The overestimated surface slope at thesetwo sites is responsible for activating a katabatic feedback inwinter resulting in overestimated SHF In RACMO23 theimproved LWdarr reduces this problem for the stations locatedmore inland as can be seen in Fig7 most significantly forAWS 9 For AWS 4 the improvement is not related to theincreased LWdarr but to a decreased LWuarr (not shown) Forthis coastal siteV10 m that was overestimated has slightly de-creased (the performance of the near-surface wind speed willbe discussed in Sect34) resulting in a lowerTs and lesslong-wave cooling For all AWS except AWS 9 the differencein SWdarr has increased most notably for the coastal AWSsHere changes in the radiation scheme have led to increasedatmospheric transmissivity For the more inland AWSs theeffect of increased transmissivity is increasingly balanced byincreased snowfall (see Fig5) raising the surface albedo andSWuarr
The underestimated surface slope results in too low windspeeds at AWS 5 and 6 resulting in an overestimation ofthe surface temperature inversion (Fig9d) As a result SHFis reasonably well represented because stability effects re-main small even at the underestimated wind speeds (Vanden Broeke et al 2005b) The problem is further reduced
The Cryosphere 8 125ndash135 2014 wwwthe-cryospherenet81252014
J M van Wessem et al Effects of changed cloud physics 131
Table 2 Mean bias (model-observation) standard deviation of the biasσ root mean square deviation and correlation coefficient (r2 withsignificance levelp lt 00001) for sensible heat flux (SHF) latent heat flux (LHF) net shortwave radiation (SWnet) net long-wave radiation(LWnet) 10 m wind speed (V10 m) and surface temperatureTs as modelled by RACMO21 and RACMO23 and as observed with the 9 AWSs(770 months) Also shown are the values for annual averagedTs in comparison with 10 m snow temperatures from 64 ice-core measurementsFor calculation of the statistics all 770 months are used
Obs RACMO21 RACMO23
mean bias σbias RMSD r2 bias σbias RMSD r2
SHF [Wmminus2] 1424 1046 853 1358 057 707 812 1078 06
LHF [Wmminus2] minus211 056 295 30 031 036 277 279 038
SWnet [Wmminus2] 2273 minus133 623 641 094 minus196 760 786 092
LWnet [Wmminus2] minus3503 minus1036 983 1422 066 minus631 982 1165 066
V10 m [msminus1] 638 minus048 167 174 028 minus051 164 172 027
Ts(AWS) [K] 24428 minus324 45 557 091 minus191 436 477 091Ts (ice cores) [K] 2406 minus232 229 323 096 minus128 213 245 098
Fig 8 Modelled and difference (modelledminusobserved) as a func-tion of the AWS observations of (a b) monthly averaged 10 mwind speed (V10 m) and (c d) surface temperature (Ts) Shownare RACMO23 (red) with correlationr2
new and biasbnew andRACMO21 (blue) with correlationr2
old and biasbold Biases are
averages over all data with units [m sminus1] for V10 m and [K] for Ts
in RACMO23 in which the SEB at AWS 5 and 6 is wellrepresented
In summer the SHF bias at AWS 4 is smaller becauseSWnet and LHF help to balance the excess long-wave cool-ing For AWS 9 however there is an increased negative biasin SWnet in RACMO23 due to an overestimated albedo (Vande Berg et al 2007) To conclude for most of the climatezones of the Antarctic ice sheet the improved representationof SEB components mainly results from a better represen-
Fig 9 Annual cycle of monthly mean difference(modelledminusobserved) of(a) 10 m wind speed (V10 m) (b) 2 mtemperature (T2 m) (c) surface temperature (Ts) and(d) the surfacetemperature inversion (Tinv = T2mminus Ts) for AWS 4 AWS 5 AWS6 and AWS 9 Shown are RACMO23 (solid line) and RACMO21(dashed line)
tation of LWdarr but also changes in the turbulence scheme(Sect35) contribute to the improvement
Figure6a confirms that high wintertime SHF values in theescarpment zone are well represented and that RACMO2generally overestimates SHF in flatter areas This leads tooverestimatedTs and hence too negative LWnet (Fig 6d)Both biases are significantly reduced in RACMO23 by 33 (SHF) and 39 (LWnet) In summer RACMO2 underes-timates SWnet in the high interior (Figs6c and 7d) As
wwwthe-cryospherenet81252014 The Cryosphere 8 125ndash135 2014
132 J M van Wessem et al Effects of changed cloud physics
a result of the underestimation of SWnet Ts is underestimated(Figs8c d and9c) while the surface temperature inversionand the SHF are overestimated (Figs6a 7d) As a resultof too lowTs sublimation (negative LHF) is underestimatedand summertime convection (upward SHF) is not modelledon the ice sheet (see Sect35)
34 Impact on simulation of temperature andnear-surface wind speed
Figure8 shows modelled values (Fig8a c) and difference(model-observation) (Fig8b d) of the monthly averagedwind speed and surface temperature of all AWSs as a func-tion of the observed value The figure also shows correlationcoefficient (r2) and average bias (b) also denoted in Table2Figure 8a b shows that the wind speed representation hasnot improved in RACMO23 when compared to RACMO21(for both data setsb 05 r2
027) Both model cyclesgenerally underestimate high wind speeds and overestimatelow wind speeds Since near-surface winds over the Antarcticice sheet are dominated by katabatic forcing this is causedby an overestimation of surface slopes in relatively flat ar-eas (AWS 4 8 9 10 12) and an underestimation of surfaceslopes in steep areas (AWS 5 6 11) in the escarpment regionof DML (and elsewhere in Antarctica) as a result of the lim-ited horizontal resolution of the model (Reijmer et al 2005Lenaerts et al 2012b) The small differences inV10 m aredue to the combined effect of model changes but the errorsin wind speed with respect to the observations are dominatedby the smoothed model topography (note that the model to-pography is the same in both model cycles)
Figure 9a shows the monthly mean difference (model-observation) ofV10 m for AWS 4 5 6 and 9 For AWS 5 andAWS 6 (slopegt 10 m kmminus1) wind speed is underestimatedyear round For AWS 4 and AWS 9 the wind speed is overes-timated in winter when katabatic forcing is overestimatedand therefore shows a seasonality that is too pronouncedThis has a strong effect on surface and 2 m temperature asshown in Fig9b c where temperature is underestimatedat AWS 5 and 6 The surface temperature inversion definedhere asTinv = T2 mminusTs is underestimated when wind speedis overestimated (AWS 4 and 9) (Fig9d) which is intuitivelyexpected
In contrast to wind speed a clear improvement in surfacetemperatureTs (Fig 8c d) in RACMO23 over RACMO21is seen due to the increased LWdarr The cold bias has beenreduced from 32 K to 19 K while the correlation has notchanged (r2
= 091) This improvement occurs year roundfor all the AWSs except for the coastal AWSs (see AWS 4)where the representation was already good due in part tothe overestimated wind speed A comparison of monthly av-eragedV10 m and T2 m from the Reference Antarctic Datafor Environmental Research (READERTurner et al 2004)AWS and surface station data gave the same results (notshown)
Fig 10Difference (modelledminusobserved) of the annual period av-eraged (1979ndash2011) surface temperature (Ts) as a function of 10 mice-core observations Shown are RACMO23 (red) with biasbnewand RACMO21 (blue) with biasbold (in [K])
Since the AWS are located mainly in DML which hasa topography that is not typical for the entire ice sheet weuse 10 m-snow temperature data to obtain a better spatialcoverage for theTs evaluation (Fig1) Figure 10 showsthe difference between modelled and observedTs as a func-tion of the latter averaged over the model time span Aver-age values biasσbias RMSD and correlation are given inTable 2 Surface temperatures in RACMO21 are underes-timated at almost all locations and on average are too lowby 23 K RACMO23 reduces this bias tominus13 K Overallthe spatial variability of surface temperatures is well repre-sented by both model versions (r2
= 096 for RACMO21and r2
= 098 for RACMO23) although there seems to bea tendency towards larger underestimations at higher tem-perature locations Figure10 shows that the best agreementis found on the cold East Antarctic plateau where the overes-timated wind speeds compensate for the bias in temperaturecaused by the underestimated LWdarr Because of the improvedLWdarr Ts on the plateau has changed from being slightly un-derestimated in RACMO21 to being slightly overestimatedin RACMO23 In coastal and West AntarcticaTs is under-estimated the most due to bothV10 m and LWnet being under-estimated and it is here that RACMO23 produces the largestimprovement
35 Impact on SHF regimes
To assess the impact of changes in the atmospheric sur-face layer scheme Fig11 shows monthly averaged SHFfor all AWSs (a) RACMO23 (b) and RACMO21 (c) asa function of the surface temperature inversion and windspeed (colour scheme) The filled circles represent winterconditions (AprilndashSeptember) open circles conditions forOctoberndashMarch Figure11a clearly shows four regimes
The Cryosphere 8 125ndash135 2014 wwwthe-cryospherenet81252014
J M van Wessem et al Effects of changed cloud physics 133
Fig 11Monthly averaged SHF as a function of the surface temperature inversion (Tinv = T2mminus Ts) for (a) all AWSs(b) RACMO23 and(c) RACMO21 The colour scheme represents wind speedV10 m and model data is from the same months and locations as the observationaldata Filled circles are winter values (months 4ndash9) and open circles represent months (10ndash3) Four climate regimes are denoted and explainedin Sect35
Regime I represents the katabatic wind zone where SHF in-creases quadratically with the katabatic wind forcing (inver-sion strength) Regime II represents the exceptional condi-tions at AWS 16 (Thiery et al 2012 Gorodetskaya et al2013) where despite stable conditions and low wind speedsSHF values are high probably due to large-scale circulationeffects The model (Fig11b c) does not simulate this regimeaccurately due to the limited spatial resolution as the stationis positioned in a topographically complex region Regime IIIrepresents the stable conditions of the AWSs in flat areaswhere static stability effects become important at high val-ues of the temperature inversion suppressing SHF
For lower stabilities and towards summer conditions thebranches join and SHF shows a linear dependence onTinvthe negative values indicating the convective summertimeconditions at plateau stations AWS 9 and 12 (Regime IV)This regime is exclusively found on the plateau where thelow summertime temperatures prevent sublimation (LHF) toact as a surface energy sink (King et al 2006) BecauseRACMO2 overestimates albedo and underestimates atmo-spheric transmissivity a positive radiation balance is not sim-ulated and convection does not occur (at least not in themonthly mean sense)
Figure11b c shows the inability of RACMO2 to simulateregimes II and IV The behaviour in the katabatic wind zoneis represented well although the branch is less pronounceddue to the underestimation of the slope and hence windspeeds RACMO23 simulates an improved separation of themost important regimes II and III compared to RACMO21because of the improved surface layer turbulence scheme andgeneral changes in the simulated results
4 Conclusions
The physics package of the regional atmospheric climatemodel RACMO2 adopted from the ECMWF-IFS has been
upgraded from cycle CY23r4 (RACMO21) to CY33r1(RACMO23) This study evaluates the effects of this changeon the Antarctic surface energy balance (SEB) 10 m windspeedV10 m and surface temperatureTs by comparing bothcycles with observational SEB data gathered from nine au-tomatic weather stations in East Antarctica and 64 deepsnow temperature sites The model has improved in sev-eral aspects Due to the inclusion of a parameterization forcloud ice super-saturation more clouds and increased mois-ture content are simulated in the upper troposphere As aresult more clouds and an increased cloud optical thick-ness in the interior have resulted in more downward long-wave radiation Consequently in RACMO23 the biases inthe sensible heat flux (SHF) and the net long-wave radiation(LWnet) have decreased from 105 to 71 W mminus2 andminus104to minus63 W mminus2 respectively The change in long-wave ra-diation has improved the bias in the SHF through its tightcoupling withTs and wind speed the bias inTs based onthe deep snow temperature observations has decreased fromminus23 K to minus13 K Near-surface air temperatures have alsoincreased but less so thanTs decreasing the surface-basedtemperature inversion The bias inV10 m which is mainly dueto the flattened ice sheet topography at the limited model res-olution remains unchanged
AcknowledgementsWe are grateful for the financial support ofNWOALW Netherlands Polar Programme The installation andmaintenance of AWS 16 was financed by the Belgian SciencePolicy Office under grant number EN014B supervised by N vanLipzig KU Leuven We thank I Gorodetskaya for providingAWS 16 data
Edited by E Hanna
wwwthe-cryospherenet81252014 The Cryosphere 8 125ndash135 2014
134 J M van Wessem et al Effects of changed cloud physics
References
Barker H W Cole J N S Morcrette J and Pincus R TheMonte Carlo Independent Column Approximation An assess-ment using several global atmospheric models Q J Roy MeteorSoc 134 1463ndash1478 doi101002qj303 2008
Beljaars A C Brown A R and Wood N A new parametrizationof turbulent orographic form drag Q J Roy Meteor Soc 1301327ndash1347 doi101256qj0373 2004
Carroll J J Long-Term Means and Short-term Variablity of theSurface Energy Balance Components at the South Pole J Geo-phys Res 87 4277ndash4286 1982
Chen J L Wilson C R Blankenship D D and Tapley B DAntarctic mass rates from GRACE Geophys Res Lett 33L11502 doi1010292006GL026369 2006
Dee D P Uppala S M Simmons A J Berrisford P PoliP Kobayashi S Andrae U Balmaseda M A Balsamo GBauer P Bechtold P Beljaars A C M Van de Berg L Bid-lot J Bormann N Delsol C Dragani R Fuentes M GeerA J Haimberger L Healy S B Hersbach H Hoacutelm E VIsaksen L Karing llberg P Koumlhler M Matricardi M McNallyA P Monge-Sanz B M Morcrette J J Park B K PeubeyC de Rosnay P Tavolato C Theacutepaut J N and Vitart F TheERA-Interim reanalysis configuration and performance of thedata assimilation system Q J Roy Meteor Soc 137 553ndash597doi101002qj828 2011
ECWMF-IFS Part IV Physical Processes (CY33R1) TechRep June httpwwwecmwfintresearchifsdocsCY33r1PHYSICSIFSPart4pdf(last access 29 October 2012) 2008
Ettema J van den Broeke M R van Meijgaard E and van deBerg W J Climate of the Greenland ice sheet using a high-resolution climate model ndash Part 2 Near-surface climate and en-ergy balance The Cryosphere 4 529ndash544 doi105194tc-4-529-2010 2010a
Ettema J van den Broeke M R van Meijgaard E van de BergW J Box J E and Steffen K Climate of the Greenland icesheet using a high-resolution climate model ndash Part 1 EvaluationThe Cryosphere 4 511ndash527 doi105194tc-4-511-2010 2010b
Fettweis X Reconstruction of the 1979ndash2006 Greenland ice sheetsurface mass balance using the regional climate model MARThe Cryosphere 1 21ndash40 doi105194tc-1-21-2007 2007
Gorodetskaya I V Van Lipzig N P M Van den Broeke M RMangold A Boot W and Reijmer C H Meteorologicalregimes and accumulation patterns at Utsteinen Dronning MaudLand East Antarctica Analysis of two contrasting years J Geo-phys Res 118 1700ndash1715 doi101002jgrd50177 2013
Greuell W and Konzelmann T Numerical modelling of theenergy balance and the englacial temperature of the Green-land Ice Sheet Calculations for the ETH-Camp location (WestGreenland 1155 m asl) Global Planet Change 9 91ndash114doi1010160921-8181(94)90010-8 1994
King J C Argentini S A and Anderson P S Contrasts be-tween the summertime surface energy balance and boundarylayer structure at Dome C and Halley stations Antarctica J Geo-phys Res 111 D02105 doi1010292005JD006130 2006
Kuipers Munneke P Van den Broeke M R Lenaerts J T MFlanner M G Gardner A S and Van de Berg W JA new albedo parameterization for use in climate modelsover the Antarctic ice sheet J Geophys Res 116 D05114doi1010292010JD015113 2011
Lacis A A Description of the Correlated k Distribution Methodfor Modeling Nongray Gaseous Absorption Thermal Emis-sion and Multiple Scattering in Vertically Inhomogeneous At-mospheres to N2 ) Comparison cooling J Geophys Res 969027ndash9063 1991
Lenaerts J T M Van den Broeke M R Deacutery S J Van Mei-jgaard E Van de Berg W J Palm S P and Sanz RodrigoJ Modeling drifting snow in Antarctica with a regional climatemodel 1 Methods and model evaluation J Geophys Res 117D05108 doi1010292011JD016145 2012a
Lenaerts J T M Van Den Broeke M R Scarchilli C andAgosta C Impact of model resolution on simulated wind drift-ing snow and surface mass balance in Terre Adeacutelie East Antarc-tica J Glaciol 58 821ndash829 doi1031892012JoG12J0202012b
Ligtenberg S R M Horwath M Van den Broeke M Rand Legreacutesy B Quantifying the seasonal breathing ofthe Antarctic ice sheet Geophys Res Lett 39 L23501doi1010292012GL053628 2012
Liu H Jezek K Li B and Zhao Z Radarsat Antarctic MappingProject Digital Elevation Model Version 2 Tech rep 2001
Mlawer E J and Clough S A Shortwave and Longwave En-hancements in the Rapid Radiative Transfer Model in Proc7th Atmospheric Radiation Measurement (ARM) Science TeamMeeting 1992 409ndash413 1997
Morcrette J-J Barker H W Cole J N S Iacono M J andPincus R Impact of a New Radiation Package McRad in theECMWF Integrated Forecasting System Mon Weather Rev136 4773ndash4798 doi1011752008MWR23631 2008
Reijmer C H and Oerlemans J Temporal and spatialvariability of the surface energy balance in DronningMaud Land East Antarctica J Geophys Res 107 4759doi1010292000JD000110 2002
Reijmer C H Van Meijgaard E and Van den Broeke M REvaluation of temperature and wind over Antarctica in a Re-gional Atmospheric Climate Model using 1 year of automaticweather station data and upper air observations J Geophys Res110 D04103 doi1010292004JD005234 2005
Rignot E Bamber J L Van den Broeke M R Davis C Li YVan de Berg W J and Van Meijgaard E Recent Antarctic icemass loss from radar interferometry and regional climate mod-elling Nat Geosci 1 106ndash110 doi101038ngeo102 2008
Schlatter T W The Local Surface Energy Balance and SubsurfaceTemperature Regime in Antarctica J Appl Meteorol 11 1048ndash1062 1970
Siebesma A P Soares P M M and Teixeira J A Com-bined Eddy-Diffusivity Mass-Flux Approach for the Con-vective Boundary Layer J Atmos Sci 64 1230ndash1248doi101175JAS38881 2007
Spichtinger P Gierens K and Read W The global distribu-tion of ice-supersaturated regions as seen by the MicrowaveLimb Sounder Q J Roy Meteor Soc 129 3391ndash3410doi101256qj02141 2003
Thiery W Gorodetskaya I V Bintanja R Van Lipzig N P MVan den Broeke M R Reijmer C H and Kuipers Munneke PSurface and snowdrift sublimation at Princess Elisabeth stationEast Antarctica The Cryosphere 6 841ndash857 doi105194tc-6-841-2012 2012
The Cryosphere 8 125ndash135 2014 wwwthe-cryospherenet81252014
J M van Wessem et al Effects of changed cloud physics 135
Tompkins A M and Gierens K Ice supersaturation in theECMWF integrated forecast Q J Roy Meteor Soc 133 53ndash63 doi101002qj14 2007
Turner J Colwell S R Marshall G J Lachlan-Cope T A Car-leton A M Jones P D and Reid P A The SCAR READERProject Toward a High-Quality Database of Mean Antarctic Me-teorological Observations J Climate 17 2890ndash2898 2004
Undeacuten P Rontu L Jarvinen H Lynch P Calvo J Cats GCuxart J Eerola K Fortelius C Garcia-moya J A JonesC Lenderlink G Mcdonald A Mcgrath R and NavascuesB HIRLAM-5 Scientific Documentation Tech Rep DecemberSwedish Meteorology and Hydrology Institute 2002
Van de Berg W J Van den Broeke M R Reijmer C H and VanMeijgaard E Characteristics of the Antarctic surface mass bal-ance 1958ndash2002 using a regional atmospheric climate modelAnn Glaciol 41 97ndash104 doi1031891727564057818133022005
Van de Berg W J Van den Broeke M R and Van MeijgaardE Heat budget of the East Antarctic lower atmosphere derivedfrom a regional atmospheric climate model J Geophys Res112 D23101 doi1010292007JD008613 2007
Van den Broeke M R Surface radiation balance in Antarctica asmeasured with automatic weather stations J Geophys Res 109D04103 doi1010292003JD004394 2004
Van den Broeke M R Depth and density of the Antarctic firnlayer Arct Antarct Alp Res 40 432ndash438 doi1016571523-0430(07-021)[BROEKE]20CO2 2008
Van den Broeke M R Van As D Reijmer C H andVan de Wal R S W Assessing and Improving the Qual-ity of Unattended Radiation Observations in AntarcticaJ Atmos Ocean Tech 21 1417ndash1431 doi1011751520-0426(2004)021lt1417AAITQOgt20CO2 2004
Van den Broeke M R Reijmer C H and Van As D Sea-sonal cycles of Antarctic surface energy balance from automaticweather stations Ann Glaciol 41 131ndash139 2005a
Van den Broeke M R Van As D Reijmer C H and Van deWal R S W Sensible heat exchange at the Antarctic snow sur-face a study with automatic weather stations Int J Climatol25 1081ndash1101 doi101002joc1152 2005b
Van Lipzig N P M Van Meijgaard E and Oerlemans J Eval-uation of a Regional Atmospheric Model Using Measurementsof Surface Heat Exchange Processes from a Site in AntarcticaMon Weather Rev 127 1994ndash2011 1999
Van Lipzig N P M Van Meijgaard E and Oerlemans J Thespatial and temporal variability of the surface mass balance inAntarctica results from a regional atmospheric climate modelInt J Climatol 22 1197ndash1217 doi101002joc798 2002
Van Meijgaard E Van Ulft L H Lenderink G De Roode S RWipfler L Boers R and Timmermans A Refinement and ap-plication of a regional atmospheric model for climate scenariocalculations of Western Europe Climate changes Spatial Plan-ning publication KvR 05412 2012
White P W Part IV PHYSICAL PROCESSES (CY23R4 ) TechRep September 2001
wwwthe-cryospherenet81252014 The Cryosphere 8 125ndash135 2014
126 J M van Wessem et al Effects of changed cloud physics
wind speed and surface temperature and compare these toavailable observations The Antarctic SEB historically hasbeen the focus of many studies based both on observa-tions (Schlatter 1970 Carroll 1982 Reijmer and Oerle-mans 2002) and modelling (Van de Berg et al 2007) in-cluding evaluations of models like RACMO (Van Lipziget al 1999 Reijmer et al 2005) Here we use new data col-lected at Antarctic automatic weather stations (AWSs) thathave been specifically designed to close and quantify theSEB (Reijmer and Oerlemans 2002)
Section2 discusses the model the changes in model for-mulation and the observational data used for evaluation InSect3 the effects of the model changes on clouds the SEBand the near-surface temperature and wind are presented anda comparison is made to observational data (Sects33ndash35)followed by conclusions in Sect4
2 Data and methods
21 RACMO2 physics update
RACMO2 combines the dynamical processes of the HighResolution Limited Area Model (HIRLAM) (Undeacuten et al2002) with the physics package of the European Cen-tre for Medium-range Weather Forecasts (ECMWF) Inte-grated Forecast System (IFS) RACMO2 has been specifi-cally adapted for use over the large ice sheets of Greenlandand Antarctica (egReijmer et al 2005) It is interactivelycoupled to a multilayer snow model that calculates melt per-colation refreezing and runoff of meltwater (Ettema et al2010b Greuell and Konzelmann 1994) Surface albedo isbased on a prognostic scheme for snow grain size (KuipersMunneke et al 2011) and a drifting snow routine simulatesthe interactions of drifting snow with the surface and thelower atmosphere (Lenaerts et al 2012a) A horizontal res-olution of sim 27 km and a vertical resolution of 40 levels isused The model is forced by ERA-Interim re-analysis data(January 1979ndashDecember 2011Dee et al 2011) at the oceanand lateral boundaries while the domain interior is allowedto evolve freely
Here we analyse changes in the modelled Antarctic near-surface climate after the ECMWF IFS physics package cycleCY23r4 in RACMO21 (White 2001) has been updated tocycle CY33r1 in RACMO23 (ECWMF-IFS 2008) The up-dates that have the most impact on Antarctic applications arethe changes in the cloud scheme the cloud microphysics andthe radiation and turbulence schemes All changes will bedescribed below and are discussed in more detail in relationwith the results in Sects33ndash35
An important change in the cloud scheme is the inclu-sion of a parameterization for ice super-saturation as de-scribed byTompkins and Gierens(2007) As a result thespecific humidity of cold air parcels (at temperatures wherethe difference between liquid water and ice saturation pres-
sure is large) has to reach a higher value in order for con-densation to occur This leads to an improved representationof clouds and moisture concentrations in the (upper) tropo-sphere (Tompkins and Gierens 2007) Aircraft observationswith the Microwave Limb Sounder (MLS) have shown thatsuper-saturation frequently occurs over the steep coastal re-gions of Antarctica (Spichtinger et al 2003) Simulationswith the ECMWF IFS have already shown that the new pa-rameterisation leads to a better global distribution of super-saturated atmospheres albeit with a slight underestimationfor Antarctica (Tompkins and Gierens 2007)
Another change in the physics is the introduction of theMcRad radiation scheme (Morcrette et al 2008) It de-scribes shortwave and long-wave radiation transfer throughclouds based on the Monte Carlo Independent Column Ap-proximation (McICABarker et al 2008) and a revision ofcloud optical properties making the parameterisations thatuse these properties more accurate This improves the inter-action of multi-layer cloud cover with shortwave and long-wave radiation but is believed to be of minor importancefor Antarctica considering the low occurrence frequency ofthese cloud types in this region In the shortwave radiationscheme (SRTMMlawer and Clough 1997) the FouqartndashBonnel scheme is replaced by a scheme that is based on thecorrelatedk method (Lacis 1991) The latter is shown to leadto an overall improved accuracy in calculated fluxes and heat-ing rates (ECWMF-IFS 2008)
The last relevant physics change is the newly implementedEddy-Diffusivity Mass Flux (EDMFSiebesma et al 2007)scheme for boundary-layer turbulenceshallow convectionThis scheme distinguishes between large-scale (updraughts)and small-scale (turbulence) mixing processes in the sur-face and boundary layer by describing them with eithermass fluxes or diffusion The surface flux relies on MoninndashObukhov similarity theory but takes into account form drag(Beljaars et al 2004) that is dependent on subscale orog-raphy For topographically rough areas like the AntarcticPeninsula these changes are expected to be especially im-portant
Furthermore the RACMO2 model update incorporateschanges in the HIRLAM dynamical core These are mostlyof numerical nature and are not addressed here For a moredetailed and complete description of the entire RACMO2 up-date the reader is referred toVan Meijgaard et al(2012) andECWMF-IFS (2008) and references therein The changesin the cloud scheme influence precipitation patterns overAntarctica Whether these changes represent an improve-ment and how these changes effect the mass budget of theice sheet will be addressed in a forthcoming study The im-pact of precipitation changes on the SEB is small as will beshown in Sect33
The Cryosphere 8 125ndash135 2014 wwwthe-cryospherenet81252014
J M van Wessem et al Effects of changed cloud physics 127
Fig 1Map of Antarctica with locations of the AWS (red diamonds)the 64 coring sites (black dots) and the position of the latitudi-nal cross-section used in Fig3 Also shown are the ice-shelf edgeand grounding line (solid lines) and height intervals every 500 m(dashed lines) based on a digital elevation model fromLiu et al(2001)
22 Observational data
The near-surface wind temperature and SEB are evalu-ated using observational data from nine automatic weatherstations maintained by the Institute for Marine and At-mospheric research of Utrecht University (UUIMAU) seethe IMAU AWS websitehttpwwwprojectsscienceuunliceclimateaws Importantly these AWSs measure all four ra-diation components as well as humidity and snow temper-ature and therefore enable a full closure of the SEB AllAWSs are of similar design single level measurements ofwind speeddirection temperature and relative humidity areperformed at a height of approximately 3 m The individualradiation components (SWdarr SWuarr LWdarr LWuarr) are mea-sured with a single sensor Treatment of the radiation fluxesfollows Van den Broeke(2004) Figure 1 shows the loca-tions of the AWSs They are located in Dronning Maud Land(DML) in different climate regimes from relatively mild andwet coastal sites (AWS 4 and 11) to the steep escarpment re-gion of DML (AWS 5 6 and 16) the south dome of BerknerIsland (AWS 10) and the high and cold East Antarctic plateau(AWS 8 9 and 12) Observation lengths range from 4 to 15 yrof data Due to instrumental problems and icing of the sen-sors some months of the data record are of lower quality Asummary of the location and data records of the AWSs is pro-vided in Table1 For more details seeVan den Broeke et al(2005a b) andReijmer and Oerlemans(2002)
The SEB can be written as
M = SWnet+ LWnet+ SHF+ LHF + G (1)
where fluxes directed towards the surface are defined positivewith units of W mminus2 M is melt energy (M = 0 if the sur-face temperatureTs lt 27315 K) SWnet and LWnet are thenet shortwave and long-wave radiative fluxes SHF and LHFare the sensible and latent heat fluxes andG is the subsur-face conductive heat flux The sensible- and latent-turbulentheat fluxes are calculated using MoninndashObukhov similaritytheory using the bulk method (Van den Broeke et al 2005b)This implies that the turbulent fluxes and surface tempera-tures are calculated values and not direct measurements Alldata from the nine AWSs are monthly averaged (resulting in770 station-months) and compared with data from the samemonths of the two RACMO cycles An assessment of thequality of the observational data can be found inReijmer andOerlemans(2002) Van den Broeke et al(2004)
As the AWSs only cover a limited part of East Antarctica64 snow temperature observations (Fig1) are additionallyused to evaluate the spatial performance of RACMO2 forTsThe 10 m snow temperature is assumed to represent the an-nual mean surface temperature a reasonable assumption inareas without melt Note that at a model resolution of 27 kmthe observational data are compared with data from the near-est model grid point For the 10 m snow temperatures thiscauses four locations to fall outside of the ice mask For thesepoints the nearest grid point that does fall within the ice maskis used
3 Results
31 General climate characteristics
In Antarctica a negative to zero net radiation budget prevailsduring most months In summer the radiation budget regu-larly becomes positive due to absorption of shortwave radia-tion at the surface In winter the radiation budget is balancedmainly by a positive (downward directed) SHF as LHF isgenerally small due to the low humidity and thus small near-surface moisture gradients exist over the Antarctic ice sheetThe negative radiation budget prevails and cools the sur-face resulting in a quasi-permanent surface-based temper-ature inversion In combination with a sloping surface thisleads to the characteristic persistent katabatic winds overthe Antarctic ice sheet As the cooling is stronger in winterthe katabatic winds increase in strength in winter Strongerkatabatic winds enhance downward sensible heat transportwhich counteracts the strength of the surface temperature in-version by increasing the surface temperature This resultsin a weaker seasonality of (near-)surface temperature in highwind speed areas
To illustrate these interactive processes Fig2 shows themonthly mean values of 10 m wind speed (V10 m) surface
wwwthe-cryospherenet81252014 The Cryosphere 8 125ndash135 2014
128 J M van Wessem et al Effects of changed cloud physics
Table 1The AWS topographic characteristics and period of operation (until December 2011) No months represents the number of availablemonths over total months (725770) of the model period (January 1979ndashDecember 2011) If no end time is indicated the AWS is stilloperational end of 2011 Observed surface slope (m kmminus1) is based on a 1kmtimes 1km digital elevation model (Liu et al 2001) modelledsurface slope is based on the 27 km interpolated grid
AWS 4 5 6 8 9 10 11 12 16
Latitude 7245prime S 7306prime S 7428prime S 7600prime S 7500prime S 7934prime S 7109prime S 7839prime S 7157prime SLongitude 15299prime W 13099prime W 11310prime W 0803prime W 0000prime EW 4547prime W 0642prime W 3538prime E 2320prime EElevation (obs) 34 m 363 m 1160 m 2400 m 2892 m 890 m 700 m 3620 m 1300 mElevation (mod) 23 m 332 m 1219 m 2405 m 2856 m 789 m 224 m 3621 m 1130 mSlope (obs) 10 231 384 20 15 11 155 20 156Slope (mod) 34 78 289 35 20 51 107 22 162Start Dec 1997 Feb 1998 Jan 1998 Jan 1998 Dec 1997 Jan 2001 Jan 2007 Dec 2007 Feb 2009End Dec 2002 ndash Jan 2009 Jan 2003 ndash Jan 2006 ndash ndash ndashno months 6060 167167 134134 1944 162168 4854 5759 4949 2935
Fig 2Monthly mean(a) 10 m wind speed (V10 m) (b) surface temperature (Ts) and(c) sensible heat flux (SHF) and net long-wave radiation(LWnet) for AWS 4 AWS 5 AWS 6 and AWS 9 The temperature curves for AWS 5 6 and 9 (Fig2b) are shifted upward by 02 49 and182 K respectively to correct for elevation and continentality differences (Van den Broeke 2004)
temperature (Ts) net long-wave radiation (LWnet) and sensi-ble heat flux (SHF) for four AWSs in different climate zonesof the Antarctic ice sheet (AWS 4 5 6 and 9) Figure2ashows that monthly mean wind speeds for AWS 5 and 6in the steep escarpment region exhibit a strong seasonal cy-cle due to stronger katabatic forcing in winter with monthlymean wind speeds up to 9 m sminus1 These katabatic winds mixwarm air downward to the surface (large SHF) increasingsurface temperature (Fig2b) and hence upward long-waveradiation (Fig2c) For AWS 4 and AWS 9 located on therelatively flat coastal ice shelf and interior ice sheet respec-tively wind speeds are lower and show no seasonal cycleAt these sites the seasonal amplitude in temperature is largerthan at the sites dominated by katabatic winds (AWS 5 and 6)mainly because the wintertime surface temperature inversionis stronger
32 Changes in cloud properties and impact onsimulated near-surface variables
The new parameterisation for cloud ice super-saturationchanges the total amount of modelled clouds over Antarcticamost notably over the East Antarctic plateau To illustratethis effect Fig3 shows a latitudinal cross-section of the ver-
tical distribution of total cloud waterice content averagedover the period 1979ndash2011 A significant increase of mod-elled cloud content is found over the East Antarctic plateauwhile cloud content has decreased along the coastline andover the ocean With the new parameterisation moist air thatreaches the continent has to exceed 100 relative humidityby up to 50 in order to form clouds As a result cloudsform farther inland and higher up in the troposphere result-ing in more clouds simulated by RACMO23 in the interior
The increase in clouds has caused more downward long-wave radiation to be emitted as seen in Fig4 where thedifference fields (RACMO23ndashRACMO21) for LWdarr (a)Ts(b) V10 m (c) and SHF (d) are shown The increase in LWdarr
is found on most of the Antarctic ice sheet but is strongeston the East Antarctic plateau and has led to higher sur-face temperatures (Fig4b) reducing the temperature gra-dients in the surface layer and resulting in lower SHF values(Fig 4d) A related pattern in near-surface wind speed is notseen (Fig4c) with changes being smaller than 5
The increase in clouds over the continent also results in anincrease of precipitation This is illustrated in Fig5 whichshows the changes in total precipitation (mostly snowfall) forDML where the AWSs are located The generally increased
The Cryosphere 8 125ndash135 2014 wwwthe-cryospherenet81252014
J M van Wessem et al Effects of changed cloud physics 129
Fig 3Latitudinal cross-section of yearly (1979ndash2011) averaged total cloud waterice content for(a) RACMO23(b) RACMO21 and(c) thedifference (RACMO23ndashRACMO21) at 1 E Location of cross-section is indicated in Fig1
Fig 4Spatial distribution of difference (RACMO23ndashRACMO21) for LWdown (a) Ts (b) V10 m (c) and SHF(d)
precipitation will have an effect on the SEB through in-creased albedo (impacting the shortwave radiation) and sub-limation (impacting latent heat flux) As will be shown in thenext section the effects on SWnet are small and limited tothe short austral summer while effects on LHF are generallysmall as well
33 Impact on simulation of the surface energy balance
Figure 6 shows the difference between the monthly aver-aged modelled and observed SEB fluxes for all nine AWSs(gt750 months) for RACMO23 and RACMO21 The aver-
age bias and correlation coefficients are summarized in Ta-ble 2 as well as the bias standard deviationσbias and rootmean square deviation (RMSD) Most biases (and RMSD)are reduced in RACMO23 for SHF from 105 Wmminus2 to71 Wmminus2 for LWnet from minus104 Wmminus2 to minus63 Wmminus2The changes in LHF and SWnet are small For SWnet thebias increased fromminus13 Wmminus2 to minus20 Wmminus2 but the cor-relation remains high (r2
093) For LHF the slight im-provement from 06 Wmminus2 to 04 Wmminus2 is of little signif-icance due to its small magnitude and the uncertainty of theobserved fluxes The standard deviationσbias has the same
wwwthe-cryospherenet81252014 The Cryosphere 8 125ndash135 2014
130 J M van Wessem et al Effects of changed cloud physics
Fig 5Spatial distribution of difference (RACMO23ndashRACMO21)for total precipitation (rain+ snowfall) in mm water equivalent peryear over Dronning Maud Land for 1979ndash2011 Shown are all theAWS except AWS 10 that falls just outside of the boundary
Fig 6 Difference (modelledminusobserved of(a) sensible heat flux(SHF) (b) latent heat flux (LHF)(c) net shortwave radiation(SWnet) and (d) net long-wave radiation (LWnet) as a function ofthe AWS observations Shown are RACMO23 (red) with biasbnewand RACMO21 (blue) with biasbold Biases (in [W mminus2]) are av-erages over all monthly average weather station data (gt 750 datapoints)
order of magnitude as the bias suggesting that the improve-ments are not statistically significant because of the signifi-cant noise
Fig 7 Annual cycle of monthly mean difference(modelledminusobserved) of the SEB components (SHF (blue)LHF (red) SWnet (orange) LWnet (green)) LWdarr (black circles)and SWdarr (black asterisks) for(a) AWS 4 (b) AWS 5 (c) AWS 6and(d) AWS 9 Shown are RACMO23 (solid line) and RACMO21(dashed line)
To investigate the seasonal effects Fig7 shows themonthly mean difference (modelledminusobserved) of SEBfluxes LWdarr and SWdarr for AWS 4 5 6 and 9 LWnet is under-estimated at the four AWS locations and most significantlyat AWS 4 and 9 The overestimated surface slope at thesetwo sites is responsible for activating a katabatic feedback inwinter resulting in overestimated SHF In RACMO23 theimproved LWdarr reduces this problem for the stations locatedmore inland as can be seen in Fig7 most significantly forAWS 9 For AWS 4 the improvement is not related to theincreased LWdarr but to a decreased LWuarr (not shown) Forthis coastal siteV10 m that was overestimated has slightly de-creased (the performance of the near-surface wind speed willbe discussed in Sect34) resulting in a lowerTs and lesslong-wave cooling For all AWS except AWS 9 the differencein SWdarr has increased most notably for the coastal AWSsHere changes in the radiation scheme have led to increasedatmospheric transmissivity For the more inland AWSs theeffect of increased transmissivity is increasingly balanced byincreased snowfall (see Fig5) raising the surface albedo andSWuarr
The underestimated surface slope results in too low windspeeds at AWS 5 and 6 resulting in an overestimation ofthe surface temperature inversion (Fig9d) As a result SHFis reasonably well represented because stability effects re-main small even at the underestimated wind speeds (Vanden Broeke et al 2005b) The problem is further reduced
The Cryosphere 8 125ndash135 2014 wwwthe-cryospherenet81252014
J M van Wessem et al Effects of changed cloud physics 131
Table 2 Mean bias (model-observation) standard deviation of the biasσ root mean square deviation and correlation coefficient (r2 withsignificance levelp lt 00001) for sensible heat flux (SHF) latent heat flux (LHF) net shortwave radiation (SWnet) net long-wave radiation(LWnet) 10 m wind speed (V10 m) and surface temperatureTs as modelled by RACMO21 and RACMO23 and as observed with the 9 AWSs(770 months) Also shown are the values for annual averagedTs in comparison with 10 m snow temperatures from 64 ice-core measurementsFor calculation of the statistics all 770 months are used
Obs RACMO21 RACMO23
mean bias σbias RMSD r2 bias σbias RMSD r2
SHF [Wmminus2] 1424 1046 853 1358 057 707 812 1078 06
LHF [Wmminus2] minus211 056 295 30 031 036 277 279 038
SWnet [Wmminus2] 2273 minus133 623 641 094 minus196 760 786 092
LWnet [Wmminus2] minus3503 minus1036 983 1422 066 minus631 982 1165 066
V10 m [msminus1] 638 minus048 167 174 028 minus051 164 172 027
Ts(AWS) [K] 24428 minus324 45 557 091 minus191 436 477 091Ts (ice cores) [K] 2406 minus232 229 323 096 minus128 213 245 098
Fig 8 Modelled and difference (modelledminusobserved) as a func-tion of the AWS observations of (a b) monthly averaged 10 mwind speed (V10 m) and (c d) surface temperature (Ts) Shownare RACMO23 (red) with correlationr2
new and biasbnew andRACMO21 (blue) with correlationr2
old and biasbold Biases are
averages over all data with units [m sminus1] for V10 m and [K] for Ts
in RACMO23 in which the SEB at AWS 5 and 6 is wellrepresented
In summer the SHF bias at AWS 4 is smaller becauseSWnet and LHF help to balance the excess long-wave cool-ing For AWS 9 however there is an increased negative biasin SWnet in RACMO23 due to an overestimated albedo (Vande Berg et al 2007) To conclude for most of the climatezones of the Antarctic ice sheet the improved representationof SEB components mainly results from a better represen-
Fig 9 Annual cycle of monthly mean difference(modelledminusobserved) of(a) 10 m wind speed (V10 m) (b) 2 mtemperature (T2 m) (c) surface temperature (Ts) and(d) the surfacetemperature inversion (Tinv = T2mminus Ts) for AWS 4 AWS 5 AWS6 and AWS 9 Shown are RACMO23 (solid line) and RACMO21(dashed line)
tation of LWdarr but also changes in the turbulence scheme(Sect35) contribute to the improvement
Figure6a confirms that high wintertime SHF values in theescarpment zone are well represented and that RACMO2generally overestimates SHF in flatter areas This leads tooverestimatedTs and hence too negative LWnet (Fig 6d)Both biases are significantly reduced in RACMO23 by 33 (SHF) and 39 (LWnet) In summer RACMO2 underes-timates SWnet in the high interior (Figs6c and 7d) As
wwwthe-cryospherenet81252014 The Cryosphere 8 125ndash135 2014
132 J M van Wessem et al Effects of changed cloud physics
a result of the underestimation of SWnet Ts is underestimated(Figs8c d and9c) while the surface temperature inversionand the SHF are overestimated (Figs6a 7d) As a resultof too lowTs sublimation (negative LHF) is underestimatedand summertime convection (upward SHF) is not modelledon the ice sheet (see Sect35)
34 Impact on simulation of temperature andnear-surface wind speed
Figure8 shows modelled values (Fig8a c) and difference(model-observation) (Fig8b d) of the monthly averagedwind speed and surface temperature of all AWSs as a func-tion of the observed value The figure also shows correlationcoefficient (r2) and average bias (b) also denoted in Table2Figure 8a b shows that the wind speed representation hasnot improved in RACMO23 when compared to RACMO21(for both data setsb 05 r2
027) Both model cyclesgenerally underestimate high wind speeds and overestimatelow wind speeds Since near-surface winds over the Antarcticice sheet are dominated by katabatic forcing this is causedby an overestimation of surface slopes in relatively flat ar-eas (AWS 4 8 9 10 12) and an underestimation of surfaceslopes in steep areas (AWS 5 6 11) in the escarpment regionof DML (and elsewhere in Antarctica) as a result of the lim-ited horizontal resolution of the model (Reijmer et al 2005Lenaerts et al 2012b) The small differences inV10 m aredue to the combined effect of model changes but the errorsin wind speed with respect to the observations are dominatedby the smoothed model topography (note that the model to-pography is the same in both model cycles)
Figure 9a shows the monthly mean difference (model-observation) ofV10 m for AWS 4 5 6 and 9 For AWS 5 andAWS 6 (slopegt 10 m kmminus1) wind speed is underestimatedyear round For AWS 4 and AWS 9 the wind speed is overes-timated in winter when katabatic forcing is overestimatedand therefore shows a seasonality that is too pronouncedThis has a strong effect on surface and 2 m temperature asshown in Fig9b c where temperature is underestimatedat AWS 5 and 6 The surface temperature inversion definedhere asTinv = T2 mminusTs is underestimated when wind speedis overestimated (AWS 4 and 9) (Fig9d) which is intuitivelyexpected
In contrast to wind speed a clear improvement in surfacetemperatureTs (Fig 8c d) in RACMO23 over RACMO21is seen due to the increased LWdarr The cold bias has beenreduced from 32 K to 19 K while the correlation has notchanged (r2
= 091) This improvement occurs year roundfor all the AWSs except for the coastal AWSs (see AWS 4)where the representation was already good due in part tothe overestimated wind speed A comparison of monthly av-eragedV10 m and T2 m from the Reference Antarctic Datafor Environmental Research (READERTurner et al 2004)AWS and surface station data gave the same results (notshown)
Fig 10Difference (modelledminusobserved) of the annual period av-eraged (1979ndash2011) surface temperature (Ts) as a function of 10 mice-core observations Shown are RACMO23 (red) with biasbnewand RACMO21 (blue) with biasbold (in [K])
Since the AWS are located mainly in DML which hasa topography that is not typical for the entire ice sheet weuse 10 m-snow temperature data to obtain a better spatialcoverage for theTs evaluation (Fig1) Figure 10 showsthe difference between modelled and observedTs as a func-tion of the latter averaged over the model time span Aver-age values biasσbias RMSD and correlation are given inTable 2 Surface temperatures in RACMO21 are underes-timated at almost all locations and on average are too lowby 23 K RACMO23 reduces this bias tominus13 K Overallthe spatial variability of surface temperatures is well repre-sented by both model versions (r2
= 096 for RACMO21and r2
= 098 for RACMO23) although there seems to bea tendency towards larger underestimations at higher tem-perature locations Figure10 shows that the best agreementis found on the cold East Antarctic plateau where the overes-timated wind speeds compensate for the bias in temperaturecaused by the underestimated LWdarr Because of the improvedLWdarr Ts on the plateau has changed from being slightly un-derestimated in RACMO21 to being slightly overestimatedin RACMO23 In coastal and West AntarcticaTs is under-estimated the most due to bothV10 m and LWnet being under-estimated and it is here that RACMO23 produces the largestimprovement
35 Impact on SHF regimes
To assess the impact of changes in the atmospheric sur-face layer scheme Fig11 shows monthly averaged SHFfor all AWSs (a) RACMO23 (b) and RACMO21 (c) asa function of the surface temperature inversion and windspeed (colour scheme) The filled circles represent winterconditions (AprilndashSeptember) open circles conditions forOctoberndashMarch Figure11a clearly shows four regimes
The Cryosphere 8 125ndash135 2014 wwwthe-cryospherenet81252014
J M van Wessem et al Effects of changed cloud physics 133
Fig 11Monthly averaged SHF as a function of the surface temperature inversion (Tinv = T2mminus Ts) for (a) all AWSs(b) RACMO23 and(c) RACMO21 The colour scheme represents wind speedV10 m and model data is from the same months and locations as the observationaldata Filled circles are winter values (months 4ndash9) and open circles represent months (10ndash3) Four climate regimes are denoted and explainedin Sect35
Regime I represents the katabatic wind zone where SHF in-creases quadratically with the katabatic wind forcing (inver-sion strength) Regime II represents the exceptional condi-tions at AWS 16 (Thiery et al 2012 Gorodetskaya et al2013) where despite stable conditions and low wind speedsSHF values are high probably due to large-scale circulationeffects The model (Fig11b c) does not simulate this regimeaccurately due to the limited spatial resolution as the stationis positioned in a topographically complex region Regime IIIrepresents the stable conditions of the AWSs in flat areaswhere static stability effects become important at high val-ues of the temperature inversion suppressing SHF
For lower stabilities and towards summer conditions thebranches join and SHF shows a linear dependence onTinvthe negative values indicating the convective summertimeconditions at plateau stations AWS 9 and 12 (Regime IV)This regime is exclusively found on the plateau where thelow summertime temperatures prevent sublimation (LHF) toact as a surface energy sink (King et al 2006) BecauseRACMO2 overestimates albedo and underestimates atmo-spheric transmissivity a positive radiation balance is not sim-ulated and convection does not occur (at least not in themonthly mean sense)
Figure11b c shows the inability of RACMO2 to simulateregimes II and IV The behaviour in the katabatic wind zoneis represented well although the branch is less pronounceddue to the underestimation of the slope and hence windspeeds RACMO23 simulates an improved separation of themost important regimes II and III compared to RACMO21because of the improved surface layer turbulence scheme andgeneral changes in the simulated results
4 Conclusions
The physics package of the regional atmospheric climatemodel RACMO2 adopted from the ECMWF-IFS has been
upgraded from cycle CY23r4 (RACMO21) to CY33r1(RACMO23) This study evaluates the effects of this changeon the Antarctic surface energy balance (SEB) 10 m windspeedV10 m and surface temperatureTs by comparing bothcycles with observational SEB data gathered from nine au-tomatic weather stations in East Antarctica and 64 deepsnow temperature sites The model has improved in sev-eral aspects Due to the inclusion of a parameterization forcloud ice super-saturation more clouds and increased mois-ture content are simulated in the upper troposphere As aresult more clouds and an increased cloud optical thick-ness in the interior have resulted in more downward long-wave radiation Consequently in RACMO23 the biases inthe sensible heat flux (SHF) and the net long-wave radiation(LWnet) have decreased from 105 to 71 W mminus2 andminus104to minus63 W mminus2 respectively The change in long-wave ra-diation has improved the bias in the SHF through its tightcoupling withTs and wind speed the bias inTs based onthe deep snow temperature observations has decreased fromminus23 K to minus13 K Near-surface air temperatures have alsoincreased but less so thanTs decreasing the surface-basedtemperature inversion The bias inV10 m which is mainly dueto the flattened ice sheet topography at the limited model res-olution remains unchanged
AcknowledgementsWe are grateful for the financial support ofNWOALW Netherlands Polar Programme The installation andmaintenance of AWS 16 was financed by the Belgian SciencePolicy Office under grant number EN014B supervised by N vanLipzig KU Leuven We thank I Gorodetskaya for providingAWS 16 data
Edited by E Hanna
wwwthe-cryospherenet81252014 The Cryosphere 8 125ndash135 2014
134 J M van Wessem et al Effects of changed cloud physics
References
Barker H W Cole J N S Morcrette J and Pincus R TheMonte Carlo Independent Column Approximation An assess-ment using several global atmospheric models Q J Roy MeteorSoc 134 1463ndash1478 doi101002qj303 2008
Beljaars A C Brown A R and Wood N A new parametrizationof turbulent orographic form drag Q J Roy Meteor Soc 1301327ndash1347 doi101256qj0373 2004
Carroll J J Long-Term Means and Short-term Variablity of theSurface Energy Balance Components at the South Pole J Geo-phys Res 87 4277ndash4286 1982
Chen J L Wilson C R Blankenship D D and Tapley B DAntarctic mass rates from GRACE Geophys Res Lett 33L11502 doi1010292006GL026369 2006
Dee D P Uppala S M Simmons A J Berrisford P PoliP Kobayashi S Andrae U Balmaseda M A Balsamo GBauer P Bechtold P Beljaars A C M Van de Berg L Bid-lot J Bormann N Delsol C Dragani R Fuentes M GeerA J Haimberger L Healy S B Hersbach H Hoacutelm E VIsaksen L Karing llberg P Koumlhler M Matricardi M McNallyA P Monge-Sanz B M Morcrette J J Park B K PeubeyC de Rosnay P Tavolato C Theacutepaut J N and Vitart F TheERA-Interim reanalysis configuration and performance of thedata assimilation system Q J Roy Meteor Soc 137 553ndash597doi101002qj828 2011
ECWMF-IFS Part IV Physical Processes (CY33R1) TechRep June httpwwwecmwfintresearchifsdocsCY33r1PHYSICSIFSPart4pdf(last access 29 October 2012) 2008
Ettema J van den Broeke M R van Meijgaard E and van deBerg W J Climate of the Greenland ice sheet using a high-resolution climate model ndash Part 2 Near-surface climate and en-ergy balance The Cryosphere 4 529ndash544 doi105194tc-4-529-2010 2010a
Ettema J van den Broeke M R van Meijgaard E van de BergW J Box J E and Steffen K Climate of the Greenland icesheet using a high-resolution climate model ndash Part 1 EvaluationThe Cryosphere 4 511ndash527 doi105194tc-4-511-2010 2010b
Fettweis X Reconstruction of the 1979ndash2006 Greenland ice sheetsurface mass balance using the regional climate model MARThe Cryosphere 1 21ndash40 doi105194tc-1-21-2007 2007
Gorodetskaya I V Van Lipzig N P M Van den Broeke M RMangold A Boot W and Reijmer C H Meteorologicalregimes and accumulation patterns at Utsteinen Dronning MaudLand East Antarctica Analysis of two contrasting years J Geo-phys Res 118 1700ndash1715 doi101002jgrd50177 2013
Greuell W and Konzelmann T Numerical modelling of theenergy balance and the englacial temperature of the Green-land Ice Sheet Calculations for the ETH-Camp location (WestGreenland 1155 m asl) Global Planet Change 9 91ndash114doi1010160921-8181(94)90010-8 1994
King J C Argentini S A and Anderson P S Contrasts be-tween the summertime surface energy balance and boundarylayer structure at Dome C and Halley stations Antarctica J Geo-phys Res 111 D02105 doi1010292005JD006130 2006
Kuipers Munneke P Van den Broeke M R Lenaerts J T MFlanner M G Gardner A S and Van de Berg W JA new albedo parameterization for use in climate modelsover the Antarctic ice sheet J Geophys Res 116 D05114doi1010292010JD015113 2011
Lacis A A Description of the Correlated k Distribution Methodfor Modeling Nongray Gaseous Absorption Thermal Emis-sion and Multiple Scattering in Vertically Inhomogeneous At-mospheres to N2 ) Comparison cooling J Geophys Res 969027ndash9063 1991
Lenaerts J T M Van den Broeke M R Deacutery S J Van Mei-jgaard E Van de Berg W J Palm S P and Sanz RodrigoJ Modeling drifting snow in Antarctica with a regional climatemodel 1 Methods and model evaluation J Geophys Res 117D05108 doi1010292011JD016145 2012a
Lenaerts J T M Van Den Broeke M R Scarchilli C andAgosta C Impact of model resolution on simulated wind drift-ing snow and surface mass balance in Terre Adeacutelie East Antarc-tica J Glaciol 58 821ndash829 doi1031892012JoG12J0202012b
Ligtenberg S R M Horwath M Van den Broeke M Rand Legreacutesy B Quantifying the seasonal breathing ofthe Antarctic ice sheet Geophys Res Lett 39 L23501doi1010292012GL053628 2012
Liu H Jezek K Li B and Zhao Z Radarsat Antarctic MappingProject Digital Elevation Model Version 2 Tech rep 2001
Mlawer E J and Clough S A Shortwave and Longwave En-hancements in the Rapid Radiative Transfer Model in Proc7th Atmospheric Radiation Measurement (ARM) Science TeamMeeting 1992 409ndash413 1997
Morcrette J-J Barker H W Cole J N S Iacono M J andPincus R Impact of a New Radiation Package McRad in theECMWF Integrated Forecasting System Mon Weather Rev136 4773ndash4798 doi1011752008MWR23631 2008
Reijmer C H and Oerlemans J Temporal and spatialvariability of the surface energy balance in DronningMaud Land East Antarctica J Geophys Res 107 4759doi1010292000JD000110 2002
Reijmer C H Van Meijgaard E and Van den Broeke M REvaluation of temperature and wind over Antarctica in a Re-gional Atmospheric Climate Model using 1 year of automaticweather station data and upper air observations J Geophys Res110 D04103 doi1010292004JD005234 2005
Rignot E Bamber J L Van den Broeke M R Davis C Li YVan de Berg W J and Van Meijgaard E Recent Antarctic icemass loss from radar interferometry and regional climate mod-elling Nat Geosci 1 106ndash110 doi101038ngeo102 2008
Schlatter T W The Local Surface Energy Balance and SubsurfaceTemperature Regime in Antarctica J Appl Meteorol 11 1048ndash1062 1970
Siebesma A P Soares P M M and Teixeira J A Com-bined Eddy-Diffusivity Mass-Flux Approach for the Con-vective Boundary Layer J Atmos Sci 64 1230ndash1248doi101175JAS38881 2007
Spichtinger P Gierens K and Read W The global distribu-tion of ice-supersaturated regions as seen by the MicrowaveLimb Sounder Q J Roy Meteor Soc 129 3391ndash3410doi101256qj02141 2003
Thiery W Gorodetskaya I V Bintanja R Van Lipzig N P MVan den Broeke M R Reijmer C H and Kuipers Munneke PSurface and snowdrift sublimation at Princess Elisabeth stationEast Antarctica The Cryosphere 6 841ndash857 doi105194tc-6-841-2012 2012
The Cryosphere 8 125ndash135 2014 wwwthe-cryospherenet81252014
J M van Wessem et al Effects of changed cloud physics 135
Tompkins A M and Gierens K Ice supersaturation in theECMWF integrated forecast Q J Roy Meteor Soc 133 53ndash63 doi101002qj14 2007
Turner J Colwell S R Marshall G J Lachlan-Cope T A Car-leton A M Jones P D and Reid P A The SCAR READERProject Toward a High-Quality Database of Mean Antarctic Me-teorological Observations J Climate 17 2890ndash2898 2004
Undeacuten P Rontu L Jarvinen H Lynch P Calvo J Cats GCuxart J Eerola K Fortelius C Garcia-moya J A JonesC Lenderlink G Mcdonald A Mcgrath R and NavascuesB HIRLAM-5 Scientific Documentation Tech Rep DecemberSwedish Meteorology and Hydrology Institute 2002
Van de Berg W J Van den Broeke M R Reijmer C H and VanMeijgaard E Characteristics of the Antarctic surface mass bal-ance 1958ndash2002 using a regional atmospheric climate modelAnn Glaciol 41 97ndash104 doi1031891727564057818133022005
Van de Berg W J Van den Broeke M R and Van MeijgaardE Heat budget of the East Antarctic lower atmosphere derivedfrom a regional atmospheric climate model J Geophys Res112 D23101 doi1010292007JD008613 2007
Van den Broeke M R Surface radiation balance in Antarctica asmeasured with automatic weather stations J Geophys Res 109D04103 doi1010292003JD004394 2004
Van den Broeke M R Depth and density of the Antarctic firnlayer Arct Antarct Alp Res 40 432ndash438 doi1016571523-0430(07-021)[BROEKE]20CO2 2008
Van den Broeke M R Van As D Reijmer C H andVan de Wal R S W Assessing and Improving the Qual-ity of Unattended Radiation Observations in AntarcticaJ Atmos Ocean Tech 21 1417ndash1431 doi1011751520-0426(2004)021lt1417AAITQOgt20CO2 2004
Van den Broeke M R Reijmer C H and Van As D Sea-sonal cycles of Antarctic surface energy balance from automaticweather stations Ann Glaciol 41 131ndash139 2005a
Van den Broeke M R Van As D Reijmer C H and Van deWal R S W Sensible heat exchange at the Antarctic snow sur-face a study with automatic weather stations Int J Climatol25 1081ndash1101 doi101002joc1152 2005b
Van Lipzig N P M Van Meijgaard E and Oerlemans J Eval-uation of a Regional Atmospheric Model Using Measurementsof Surface Heat Exchange Processes from a Site in AntarcticaMon Weather Rev 127 1994ndash2011 1999
Van Lipzig N P M Van Meijgaard E and Oerlemans J Thespatial and temporal variability of the surface mass balance inAntarctica results from a regional atmospheric climate modelInt J Climatol 22 1197ndash1217 doi101002joc798 2002
Van Meijgaard E Van Ulft L H Lenderink G De Roode S RWipfler L Boers R and Timmermans A Refinement and ap-plication of a regional atmospheric model for climate scenariocalculations of Western Europe Climate changes Spatial Plan-ning publication KvR 05412 2012
White P W Part IV PHYSICAL PROCESSES (CY23R4 ) TechRep September 2001
wwwthe-cryospherenet81252014 The Cryosphere 8 125ndash135 2014
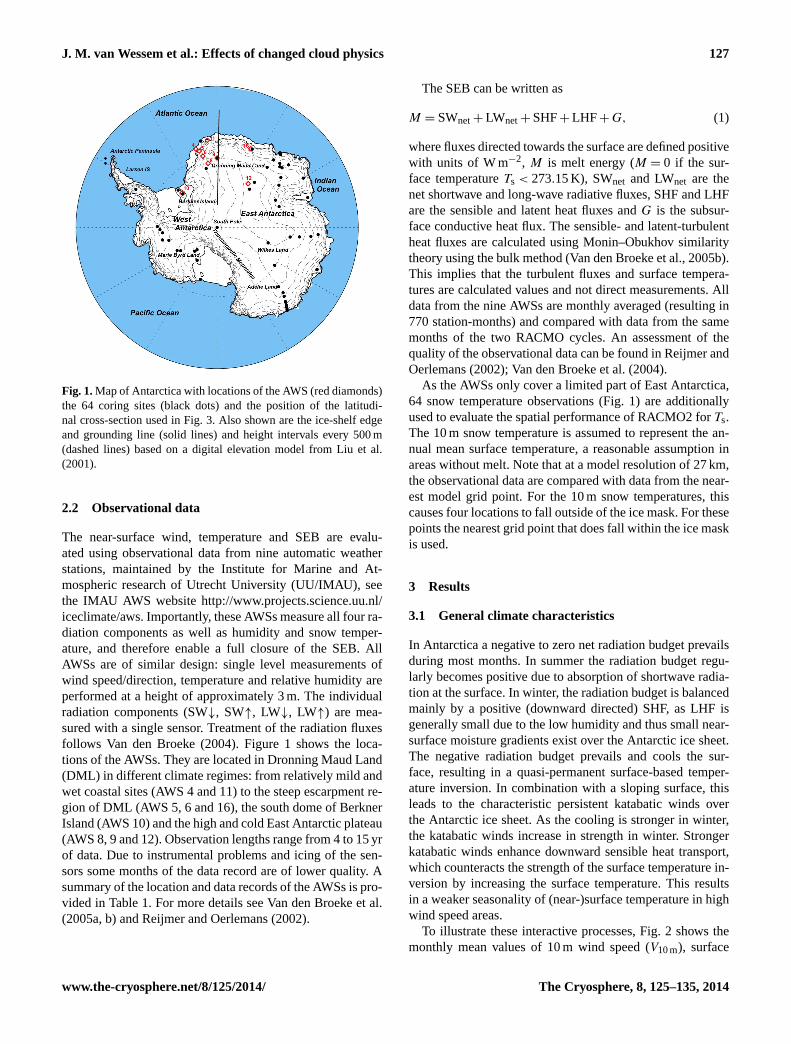
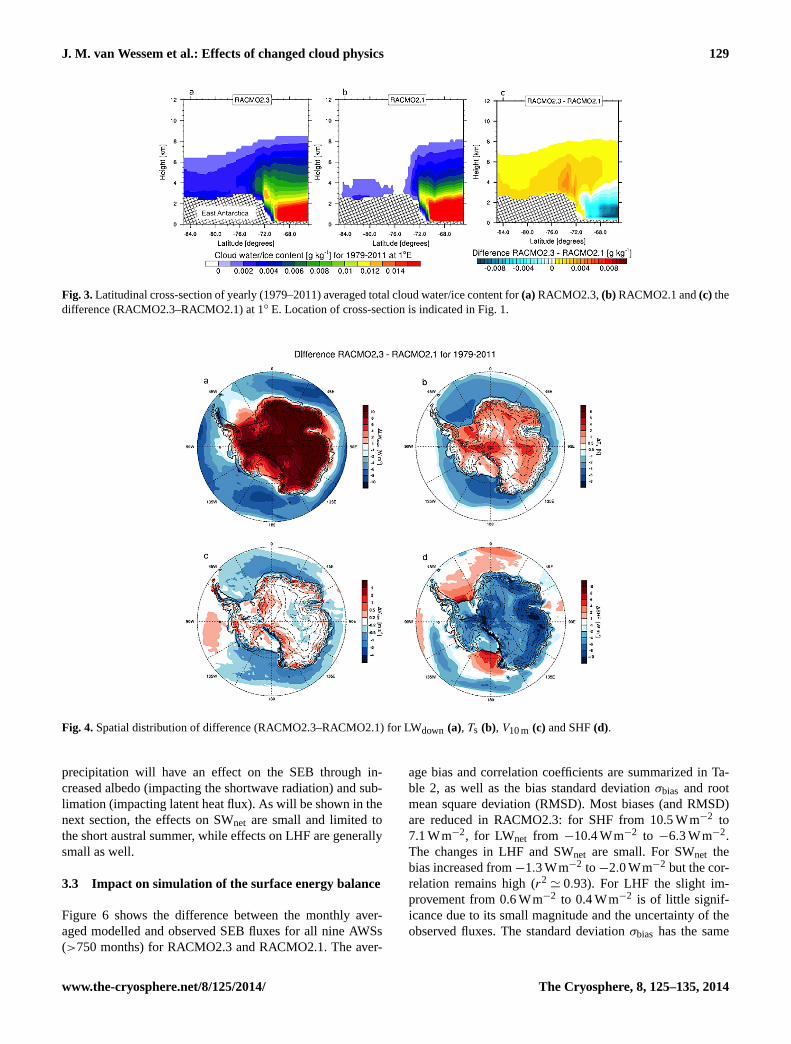
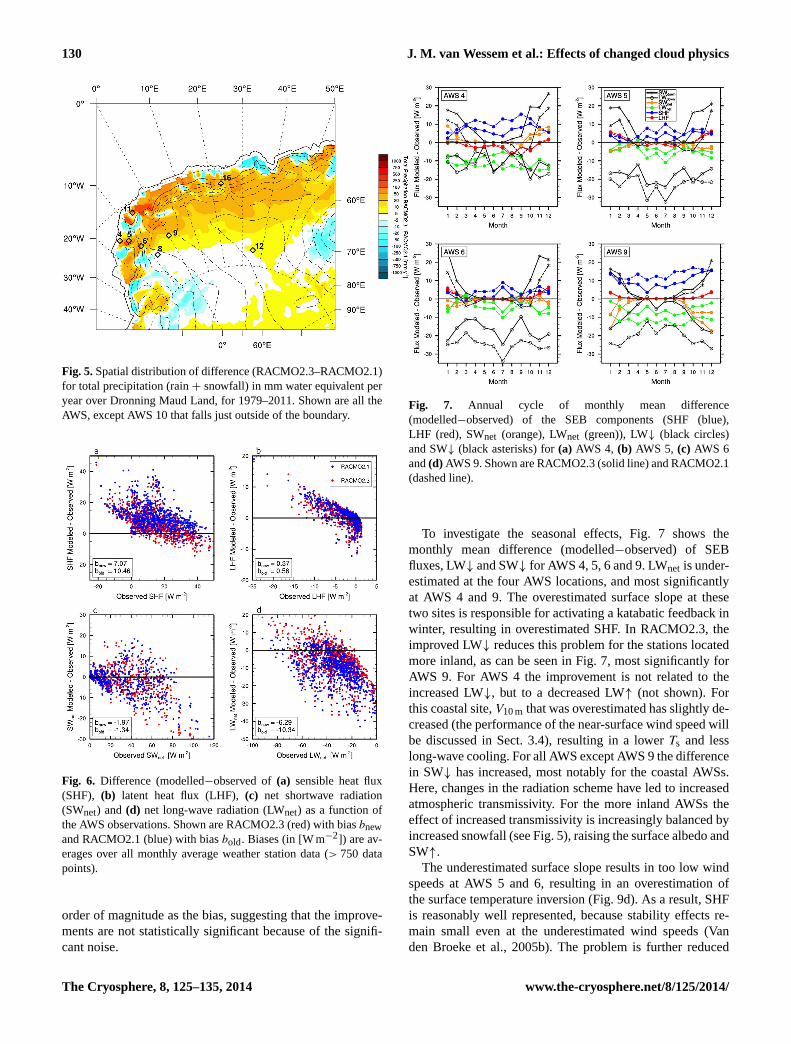
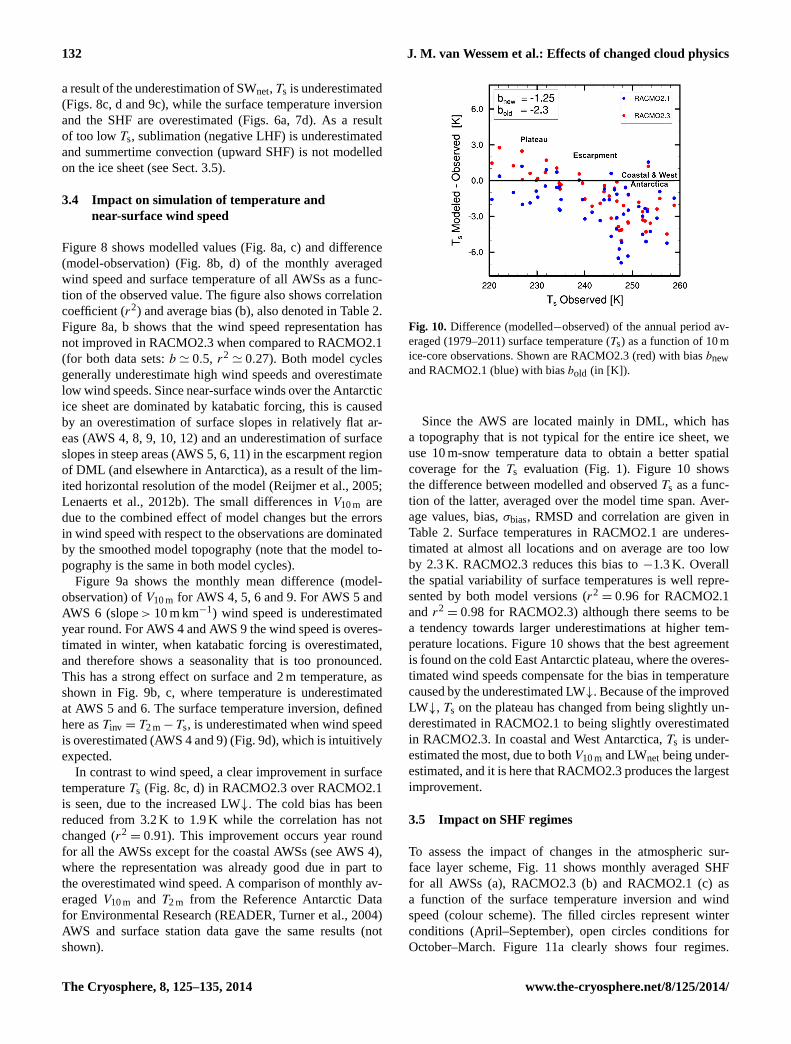