updated injury risk/benefit analysis of quadbar crush … injury risk-benefit... · updated injury...
TRANSCRIPT

UPDATED INJURY RISK/BENEFIT ANALYSIS OF QUADBAR CRUSH
PROTECTION DEVICE (CPD) FOR ALL-TERRAIN VEHICLES (ATVS)
DRI-TR-12-06-3
J.W. Zellner S.A. Kebschull
R.M. Van Auken
This is the Third Revision, 8 August 2016. (Second Revision, 29 October 2014).
(First Revision, 6 August 2012) (Original Version, 3 August 2012)

REVISION HISTORY
First Revision DRI-TR-12-06-1 6 August 2012
The first revision corrected minor typographical errors that were discovered after the original report was published on 3 August 2012.
Second Revision DRI-TR-12-06-2 29 October 2014
The second revision incorporated the following changes:
- Technical report – Minor refinements, corrections and clarifications as follows: o The simulation model goodness of fit was assessed by the Nash-Sutcliffe
model efficiency instead of the correlation coefficient. o Corrected the probability of fatality, which is used in the risk-benefit
analysis, when a mechanical/traumatic (compressive) asphyxia fatality is predicted. If a mechanical/traumatic (compressive) asphyxia fatality is predicted then the probability of fatality is assumed to be 100%. The previous versions of this report inadvertently did not assume that the probability of fatality is 100% if an asphyxia fatality is predicted (the probability of fatality was only calculated based on the probabilities of other modeled injuries, such as head, neck, and thorax injury). This change had a small effect on the numerical results in Tables 9 and 10, but did not affect the overall conclusions.
o Minor text revisions for clarification (e.g., that 1,580 baseline simulations and 1,580 Quadbar simulations were run, sources for the UK HSE and US CPSC ATV accident cases, descriptions of dummy/soil contact friction models).
o Corrected typographical errors. - References

o Added additional references. o Expanded or corrected some references (e.g., added missing information).
- Appendix B o Minor corrections and clarifications to some of the criteria and
assumptions. - Appendix C
o Removed terrain type 6, which is not defined and not used. - Appendix D – Corrected values in the following columns:
o Torso pitch angle – An intermediate simulation parameter was inadvertently reported instead of the torso pitch angle. This has been corrected.
o D1, d2, and h – Values that are not used, depending on the terrain type, have been replaced with “-“.
o Total # of accident variables used by the CS – Values have been recomputed depending on the terrain type.
- Appendix E – Expanded to include additional simulation calibration results, and more readable calibration graphs. o E.1. ROPS/CPD Laboratory Test versus Simulation Calibration Results –
Added the Quadbar-2011 calibration plot o E.2. Dummy Laboratory Component Test versus Simulation Calibration
Results – Replaced figures with low resolution with figures with higher resolution.
o E.3. Motorcycle and Opposing Vehicle Laboratory Test versus Simulation Calibration Results and E.4. Full-Scale Motorcycle Impact Test versus Simulation Results – These sections were added in order to demonstrate the level of agreement in the dummy measurements between full-scale tests and computer simulations, using pre-existing motorcycle impact test results.
o E.5. ISO 13232 (2005) Dummy Neck Laboratory Component Test versus Simulation Calibration Results – This section was added to supplement the dummy laboratory component calibration results in Section E.2.
- Appendix F o Added the equation used to calculate the comparison figure-of-merit, for
clarification purposes. - Appendix G

- Corrected and condensed the figures showing the level of agreement between the simulation and accident data. Replaced the original Table G-2 with a new Table G-2 listing the Nash-Sutcliffe model efficiency figure of merit for the agreement between the simulation and accident data results.
- Appendix H o Corrected the risk-benefit analysis results for the probability of fatality.
- Appendix J o Corrected citations to Box et al. (1978) and Satterthwaite (1947).
Third Revision DRI-TR-12-06-3
July 2016 This third revision incorporates the following changes:
- Added the Revision History - Technical report – Minor corrections as follows:
o Revised the injury cost model results for 4 unhelmeted Quadbar simulations that indicated a mechanical/traumatic (compressive) asphyxia fatality was predicted to occur, when in reviewing the simulation animations it was determined that the asphyxiation was in fact unlikely to occur because the ATV had not come to rest by the end of the simulation. The simulation run numbers for the 4 cases were 81059, 81199, 81311, and 81461. This change decreased the probability of fatality and normalized injury cost results for the Quadbar. This change had a small effect on the numerical results in Tables 7 through 10, but did not affect the overall conclusions. See Footnote 8 on page 6.
o Incorporated the ICnorm risk/benefit and net benefit results for the two different baselines from Tables I-3 and I-4 in Appendix I into Tables 7 and 8 in the main body of the report.
o Added the probability of fatality risk/benefit and net benefit results for the two different baselines into Tables 9 and 10 in the main body of the report. These results were inadvertently omitted in the previous versions of Appendix I.
- References o Added additional references for Appendix L.

- Appendix D. o Corrected the reported values of the simulation parameters and initial
conditions for the CPSC cases. The previously reported values were inadvertently the same as some of the HSE cases. This only affected the table presented in Appendix D and did not affect the simulations. The CPSC cases have a 13 digit alpha/numeric case identifier.
- Appendix I o Removed Tables I-3 and I-4 and accompanying discussion because the
results were incorporated into Tables 7 and 8 in the Technical Report. o Changed the name of the appendix to reflect the change in scope of the
appendix. o Minor changes in the table headings and notes, and text for clarification
purposes. - Appendix L
o Appendix L is a new appendix with a supplemental injury risk-benefit analysis results including body region injury indices, half helmets and also low speed cases (i.e., only cases with initial velocity less than 20 km/h). This comprises a further analysis of a subset of the simulation results.

TABLE OF CONTENTS
Page EXECUTIVE SUMMARY ................................................................................................ 1 I. INTRODUCTION ................................................................................................... 15 II. OVERVIEW OF METHODOLOGY ...................................................................... 17
A. Protective Device Injury Evaluation Methods ................................................ 17 B. Application of Injury Evaluation Methods to Potential ATV
Protective Devices ...........................................................................................19 C. Injury Risk/Benefit Evaluation Methods .........................................................25
III. BACKGROUND ......................................................................................................30
A. Review of ATV Definition and Functionalities ...............................................30
1. ISO 13232 Injury Analysis .....................................................................31
B. Overview of ISO 13232 and Injury Risk/Benefit Analysis Methodology .....................................................................................31
1. Adaptation and Application to ATV Overturn Events ...........................33 2. Extension to Include Skull Fracture ........................................................34
C. Review of Previous ATV ROPS/CPD Feasibility Research ...........................34
1. Overview of Previous Research Including Injury Analysis and
Functional Performance ..........................................................................34
a. Dahle ROPS ...................................................................................34 b. Johnson ROPS ...............................................................................35 c. NZ T-bar CPD................................................................................35 d. UK U-bar CPD ...............................................................................36 e. MUARC ROPS ..............................................................................36 f. QuadBar-2007 CPD .......................................................................37
2. Review of Previous Injury Analysis of 6 ATV ROPS/CPDs
by means of ISO 13232...........................................................................38
a. Methodology of Previous Injury Analysis by Means of ISO 13232 ..................................................................................38
i. Models of Rider Dummy, ATV, ROPS/CPDs......................38

TABLE OF CONTENTS (CONT’D)
Page 1) Rider dummy model ....................................................39 2) ATV model ..................................................................41 3) ROPS/CPD models ......................................................43
ii. ATV Overturn Events ...........................................................46
1) 113 UK/US Misuse Cases ............................................46 2) Variation in Overturn Events .......................................47
iii. Calibration Against Full-Scale ATV Overturn Tests ...........49
b. Results of Previous Injury Risk/Benefit Analysis .........................52
i. Injury Risk/Benefit Results ...................................................52 ii. ROPS/CPD Injury Mechanisms ............................................55 iii. Conclusions of the Previous Injury
Risk/Benefit Analysis ...........................................................55
1) Recommendations Based on the Previous Injury Risk/Benefit Analysis.............................................................................................57
IV. UPDATED INJURY RISK/BENEFIT ANALYSIS OF THE QUADBAR CPD ....58
A. Methodology Updates, Extensions and Refinements ......................................58
1. "Lower Energy" US and UK Overturn "Types" .....................................58 2. Inclusion of Preliminary Potential Mechanical/Traumatic
(Compressive) Traumatic Asphyxia Criterion ........................................60 3. Effect of Hand Grip Release Force .........................................................64 4. Refinements of Other Methodology Details ...........................................65
a. Updated and Revised Injury Coding for US/UK cases ..................65 b. Revised number of US/UK cases ...................................................66 c. Brake, throttle, and steering release ...............................................66 d. Helmeted and unhelmeted head force deflection functions ...........67 e. Dummy/soil friction coefficients ...................................................68 f. Hand grip release force ..................................................................69 g. Leg fracture strength ......................................................................69 h. Updated contact definitions ...........................................................70 i. Simulation end time .......................................................................70 j. Extents of ground planes ................................................................70

TABLE OF CONTENTS (CONT’D)
Page k. Comparing only cases where both the baseline and
modified ATV overturned..............................................................71 l. Refined variation analysis ..............................................................71 m. Graphics software anomalies .........................................................71 n. Miscellaneous ................................................................................72
5. Additional Calibrations of the Simulation Model ...................................72
a. Simulated versus actual injury distributions ..................................72 b. Comparison of helmet risk/benefit analysis outcomes to
published literature.........................................................................73
6. Use of a Single Baseline Condition for the Main Risk/Benefit Tabulations ..............................................................................................74
B. Results of Updated Injury Risk/Benefit Analysis of the Quadbar CPD ..........75
1. Quadbar Results for Injuries of All Severities ........................................76 2. Quadbar Results for Probability of Fatality ............................................78 3. Quadbar Injury Benefit and Injury Risk Mechanisms ............................80
C. Conclusions Based on The Updated Injury/Risk Benefit Analysis of
The Quadbar CPD ............................................................................................85 D. Recommendations Based on The Updated Injury
Risk/Benefit Analysis ......................................................................................97 REFERENCES ..................................................................................................................98 APPENDIX A – UPDATED CONDITIONS AND INJURY CODINGS
FOR 110 US/UK CASES ................................................................... A-1 APPENDIX B – ORIGINAL METHODOLOGY USED TO DEFINE
THE 113 US/UK ATV OVERTURN TYPES ....................................B-1 APPENDIX C – UPDATED “LOW ENERGY” METHODOLOGY USED
TO DEFINE THE 110 UPDATED US/UK ATV OVERTURN TYPES ..........................................................................C-1

TABLE OF CONTENTS (CONT’D)
Page APPENDIX D – 17 INITIAL CONDITIONS FOR EACH US/UK ATV
OVERTURN TYPE RESULTING FROM APPLICATION OF THE LOW ENERGY METHODOLOGY ................................... D-1
APPENDIX E – CALIBRATION: ATV ROPS/CPD AND MATD DUMMY ............ E-1 APPENDIX F – CALIBRATION: SIMULATION VERSUS FULL SCALE TEST
ATV AND DUMMY MOTION CORRELATION RESULTS .......... F-1 APPENDIX G – UPDATED CALIBRATION: DISTRIBUTIONS OF SIMULATED
INJURIES VERSUS ACTUAL INJURIES ....................................... G-1 APPENDIX H – UPDATED CALIBRATION: HELMET NET BENEFIT
AND RISK/BENEFIT OUTCOMES, SIMULATIONS VERSUS ACTUAL ACCIDENTS .................................................... H-1
APPENDIX I – SUPPLEMENTAL TABULATIONS OF PREVIOUS (2008)
RESULTS WITH A SINGLE BASELINE .......................................... I-1 APPENDIX J – CONFIDENCE INTERVAL EQUATIONS FOR ISO 13232-5
RISK/BENEFIT ANALYSIS FOR 110 TYPES OF OVERTURN WITH 7 VARIATIONS EACH ........................................................... J-1
APPENDIX K – VARIATIONS FOR EACH OF 110 TYPES OF OVERTURN ........ K-1 APPENDIX L - SUPPLEMENTAL INJURY RISK-BENEFIT ANALYSIS OF
QUADBAR CRUSH PROTECTION DEVICE (CPD) FOR ALL-TERRAIN VEHICLES (ATVS) ......................................................... L-1

LIST OF FIGURES
Page Figure 1. Example distributions of modeled versus actual injury severity, from Kuchar (2001) .......................................................................................................... 25 Figure 2. Image of computer simulation model of the rider dummy (MATD) ............... 40 Figure 3. Model of ATV with and without ROPS/CPD .................................................. 44 Figure 4. Simulated Ground Terrain Types and Obstacles .............................................. 48 Figure 5. Example Full-Scale Tests and Corresponding Computer Simulations ............ 50 Figure 6. Example Correlation Between Full-Scale Test and Computer Simulation (Test 97101612) ................................................................................................................ 52 Figure 7. Estimated Risk and Benefit of the T-bar CPD (Unbelted Dummy) ................. 54 Figure 8. Estimate of Human Tolerance to Mechanical Asphyxia With Fatal and Survival Data (source: Hopkins et al. 1993) ..................................................................... 62 Figure 9. Example still image of QuadBar CPD injury risk. Potential asphyxia and AIS 2 concussive head injury occurred with the Quadbar. Baseline had no monitor-able injuries............................................................................................................................................ 82 Figure 10. Frequency distribution of ATV final resting orientation, based on 3,080 overturn simulations (Baseline ATV versus Quadbar ATV, combination of helmeted and unhelmeted conditions) ..................................................................................................... 83 Figure 11. Frequency distribution of ATV final resting orientation for 11 Baseline and 11 Quadbar potential “breathing difficulty” outcomes, based on 3,080 overturn simulations (Baseline ATV versus Quadbar ATV, combination of helmeted and unhelmeted conditions) ..................................................................................................... 84

LIST OF TABLES
Page Table 1. ATB Model Summary ....................................................................................... 39 Table 2. ISO 13232 MATD-Based Injury Criteria Used in the 2008 Analyses .............. 41 Table 3. Main ATV Simulation Parameters .................................................................... 42 Table 4. Overturn Event Variation Scheme ..................................................................... 49 Table 5. Full Scale Tests .................................................................................................. 50 Table 6. Summary of Previous ICnorm Risk/Benefit Percentage Results for ROPS/CPDs........................................................................................................................................... 55 Table 7. Summary of Updated ICnorm Risk/Benefit Percentage Results for the Quadbar........................................................................................................................................... 76 Table 8. Summary of Updated ICnorm Net Benefit Percentage Results for the Quadbar........................................................................................................................................... 78 Table 9. Summary of Updated Probability of Fatality Risk/Benefit Percentage Results for the Quadbar ................................................................................................................. 79 Table 10. Summary of Updated Probability of Fatality Net Benefit Percentage Results for the Quadbar ................................................................................................................. 80

1
EXECUTIVE SUMMARY
This report describes results of an updated evaluation of the effects on predicted injuries of the Quadbar crush protective device (CPD) that has been proposed for application to All-Terrain Vehicles (ATVs). As in previous evaluations, this was done by extending and applying the test and analysis methods defined in ISO 13232 (2005) for motorcycle-car impacts, in order to evaluate of the effects on predicted injuries of the Quadbar in a sample of simulated ATV overturn events.
The report includes a review of, and a consolidation of documentation for, the past methodologies used to evaluate Rollover Protective Systems (ROPS) and CPDs proposed for application to ATVs; and a review of the previous reported results and conclusions of those evaluations.
The updated evaluation of the Quadbar CPD included updates to the previous evaluation methods, primarily comprising a series of modeling refinements identified since the previous Quadbar evaluation reported by Munoz et al. (2007). The modeling refinements took into account desired refinements to, as well as all known comments on, the previously used methodologies, including:
— lowering the energy levels (e.g., reducing the slopes, slope lengths, speeds, obstacle sizes, etc.) of the simulated overturn events used, so as to “barely” result in a simulated overturn in each overturn event (in contrast to the use of higher energy conditions that were more likely to result in a simulated overturn in the previous analyses);
— taking into account potential mechanical/traumatic (compressive) asphyxia mechanisms and factors;
— quantifying the effects of dummy hand grip release force (during overturn) on potential mechanical/traumatic (compressive) asphyxia mechanisms and factors;

2
— refining the ATV control inputs (e.g., throttle, brakes, steering) used to induce each of the overturn events so as to terminate the control inputs when the dummy hands release from the hand grips;
— refining the force-deflection characteristics of crash dummy helmet, head, upper leg and lower leg so as to reduce potential over-prediction of head and leg injuries, and verifying these refined force-deflection characteristics by means of calibrations against previous dummy lab test data;
— measuring and incorporating values for dummy/soil coefficients of friction, so as to increase the model’s accuracy and reduce potential over-prediction of head and leg injuries due to excessive dummy/soil friction;
— increasing the handgrip release force for all overturn simulations in order to minimize potential occurrence of pre-overturn hand release;
— after implementing the aforementioned refinements, calibrating the simulation models against aggregated injury distributions from actual accidents, which resulted in closer agreement between the simulated and actual injury distributions (e.g., with a Nash-Sutcliffe model efficiency statistic of 0.95 on average for the helmeted dummy simulations, and 0.82 on average for the unhelmeted dummy simulations);
— additional calibration of the simulation model results against published literature for helmet net injury benefits which, in terms of incremental injury severity, indicated a helmet net injury benefit for head injuries of 70%

3
[53%, 87%]1 and a helmet risk/benefit percentage for head injuries of 2% [1%, 13%]2;
— reporting the risk and benefit results using a single baseline condition (i.e., the baseline ATV with helmet, which represents the intended use of the vehicle) as well as using two different baseline conditions (i.e., with and without a helmet); and
— refining the models and software in order to improve the details of the graphic animations, the ground plane dimensional limits, list of objects contactable by the dummy limbs, simulation run time duration, and other details.
The previously evaluated Quadbar device as described in Munoz et al. (2007) was then reevaluated based on these refinements of and updates to the methodology. This reevaluation involved running 3,080 computer simulations, with the baseline ATV and the Quadbar ATV, using 110 “low energy” overturn types, and six additional variations
1 The value in front of the square brackets is the point estimate of the net benefit percentage. This value is the average of the total decreases in the injury index (e.g., the normalized injury cost (ICnorm) minus the average of the total increases in the injury index value divided by the average injury index value per crash event for the baseline condition, expressed as a percentage. The square brackets [ ] denote the 95% confidence interval for the estimated net benefit percentage. This confidence interval indicates the range of uncertainty in the estimated net benefit percentage for the population of all overturn events, assuming that the changes in the index (e.g., ICnorm) are independently and identically normally distributed and assuming that the simulation sample of (overturn) events and the resulting changes in the index comprise a representative sample of the overturn event population. The magnitude of the uncertainty reflects the simulation sample size (i.e., 770 simulations comprising 110 overturn types with 7 perturbations each) and the run-to-run variation in the simulation results. If the confidence interval includes 0% then the estimated net benefit percentage for the population is not statistically significantly different from 0%, i.e., there is no statistically significant difference between the magnitude of the risk and the magnitude of the benefit, and therefore there is no statistically significant net benefit. 2 The value in front of the square brackets is the point estimate of the risk/benefit percentage. This value according to ISO 13232 (2005) is the summation of the increases in the index (e.g., the normalized injury cost (ICnorm)) value divided by the summation of the decreases in the index value, as a result of fitting the device, across the simulation sample of (overturn) events, expressed as a percentage. The square brackets [ ] denote the 95% confidence interval for the estimated risk/benefit percentage. This confidence interval indicates the range of uncertainty in the estimated risk/benefit percentage for the population of all overturn events, assuming that the changes in the index (e.g., ICnorm) are independently and identically normally distributed and assuming that the simulation sample of (overturn) events and the resulting changes in the index comprise a representative sample of the overturn event population. The magnitude of the uncertainty reflects the simulation sample size (i.e., 770 simulations comprising 110 overturn types with 7 perturbations each) and the run-to-run variation in the simulation results. If the confidence interval includes 100% then the estimated risk/benefit percentage for the population is not statistically significantly different from 100%, i.e., there is no statistically significant difference between the magnitude of the risk and the magnitude of the benefit, and therefore there is no statistically significant net benefit.

4
(i.e., perturbations) of each overturn type in order to reduce the sensitivity of the results to the details of any single overturn simulation, for the helmeted condition and for the unhelmeted condition. Note that the ATV and dummy simulation models had been previously extensively calibrated by means of laboratory tests and full-scale overturn tests (i.e., Van Auken et al. (1998), Kebschull et al. (1998)), and were further calibrated as described above.
The overall conclusions from the results of the updated analysis based on the refined methodology are similar to those from the results reported in Munoz et al. (2007), namely that, in terms of injury “fatality equivalents” involving injuries of all severities (i.e., ICnorm):
− under helmeted use conditions, the Quadbar was found to have injury risks (in comparison to injury benefits) that were, for the simulation sample, greater than its injury benefits, and when extended to the population, not statistically significantly different from its injury benefits;
− under unhelmeted misuse conditions, the Quadbar was found to have injury risks (in comparison to injury benefits) compared to the helmeted baseline condition that were, for the simulation sample, greater than its injury benefits, and when extended to the population, statistically significantly greater than its injury benefits;
− and which for both helmeted and unhelmeted conditions are therefore:
− much higher than those found in any published data for any automotive safety device, for which the injury risks have been found to be less than 7% of the injury benefits;
− unacceptably high injury risks in comparison to injury benefits in comparison to the suggested reference guideline for research purposes published in ISO 13232 (2005), i.e., the Quadbar injury risk/benefit percentages were all far greater than the “not… more

5
than 12 percent” reference guideline indicated in International Standard ISO 13232-5 (2005);3 and
− unacceptably high injury risks in comparison to injury benefits, when compared to the “regulatory policies of several of the [Australian] states,” mentioned in the Heads of Workplace Health and Safety Authorities (HWSA) Technical Engineering Group (TEG) report, which were apparently stated to be that the “the benefits need to be at least 2 times the risks" (i.e., 2 deaths prevented for every 1 new death caused by a device, or 50 percent risk/benefit.”4
More specifically the updated results, in terms of injury “fatality equivalents” involving injuries of all severities (i.e., ICnorm) and in terms of the probability of fatality, indicated the following:
− In the helmeted condition, comparing a dummy with a full face helmet on a Quadbar ATV to a dummy with a full face helmet on a baseline ATV5, the Quadbar had an injury risk/benefit percentage of 108% [69%, 168%]; and a fatality risk/benefit percentage of 121% [72%, 198%]6. The point estimates for both of these results indicate that the Quadbar increases the injury severity and the fatality probability for the simulation sample of overturn events, however the confidence intervals indicate that these estimated increases are relatively small and not statistically significant. The
3 The suggested reference guideline for research that is published in ISO 13232 (2005), Annex E is said to be “[b]ased on the results for automobile seat belts (7 percent) based on Malliaris, et al., 1982, as described by Rogers, [et al.] 199[8], which is presumed to be an acceptable risk/benefit percentage; and the results for pre-1998 automobile passenger airbags (12 percent), based on Iijima, et al., 1998, which is presumed to be an unacceptable risk/benefit percentage.” 4 Technical Engineering Group report, p. 32, footnote 7, November 2010. 5 ATV warning labels mandated by US law state that riders should always wear a helmet, and this recommended condition is taken as the baseline condition. 6 In accordance with International Standard ISO 13232-5 (2005), “risk/benefit percentage” is defined as the average of the total increases in normalized injury cost divided by the average of the total decreases in injury costs, when evaluated on a paired comparison basis across a sample of crash events. This is entirely different from, and cannot be directly calculated from, the net injury benefit, which is defined as the average of the total decreases in injury costs minus the average of the total increases in normalized injury cost divided by the average normalized injury cost per crash event for the baseline condition. The normalized injury cost for each simulated (or tested) crash event is calculated in the Standard based upon the measured forces, deflections and accelerations sensed in the various crash dummy body regions.

6
confidence intervals for these results indicate that the estimated injury risks and fatality risks of the device for the population of overturn events are not statistically significantly different from the estimated injury benefits and fatality benefits of the device, respectively, for the population of overturns. Therefore these results indicate that the Quadbar would cause approximately as many injuries and fatalities as it would prevent.
− In the unhelmeted condition, comparing an unhelmeted dummy on a Quadbar ATV to a dummy with a full face helmet on a baseline ATV (i.e., comparing to the same baseline condition noted above7), the Quadbar had an injury risk/benefit percentage of 483% [250%, 774%]; and a fatality risk/benefit percentage of 721% [273%, 1172%]8. Both of these results indicate, on average, that the combination of adding a Quadbar and removing the helmet9 substantially increases the injury severity and the fatality probability, across the simulation sample of overturn events. In extending this sample estimate to the population of overturns, these confidence intervals indicate that the injury risks and fatality risks of adding the device and removing the helmet are statistically significantly greater than the injury benefits and fatality benefits of adding the device and removing the helmet, respectively, i.e., adding the device and removing the helmet would cause statistically significantly more injuries and fatalities than these actions would prevent.
− In the unhelmeted condition, comparing an unhelmeted dummy on a Quadbar ATV to an unhelmeted dummy on a baseline ATV, the Quadbar had an injury risk/benefit percentage of 65% [41%, 110%]; and a fatality
7 ATV warning labels mandated by US law state that riders should always wear a helmet, and this recommended condition is taken as the baseline condition. In addition, this particular comparison describes what may occur if a rider adds a Quadbar and removes his helmet which may occur in the population. 8 The risk/benefit and net benefit results for the Quadbar with an unhelmeted dummy were revised in this Third Revision because the injury cost model results for 4 the 770 unhelmeted Quadbar simulations that originally predicted that asphyxiation were revised. The injury cost model results for these 4 simulations (81059, 81199, 81311, and 81461) were revised because, after reviewing the simulation animations, it was judged by the authors that, while an asphyxiation had been predicted, it was actually unlikely to occur because the ATV was not at rest at the end of the 10 second simulation. As a result of this change the normalized injury cost and probability of fatality results for the Quadbar decreased slightly overall. This change had a small effect on the numerical results in Tables 7 through 10, and no effect on the overall conclusions. 9 As a user might do if, for example, he/she mistakenly believed that the Quadbar had a significant protective effect.

7
risk/benefit percentage of 66% [41%, 114%]. The point estimates for both of these results indicate that the Quadbar decreases the injury severity and the fatality probability for the simulation sample of overturn events, however the confidence intervals indicate that these estimated decreases are relatively small and not statistically significant. The confidence intervals for these results indicate that the estimated injury risks and fatality risks of the device for the population of overturn events are not statistically significantly different from the estimated injury benefits and fatality benefits of the device, respectively, for the population of overturns. Therefore these results indicate that the Quadbar would cause approximately as many injuries and fatalities as it would prevent.
Taken together, the above three results indicate that the effect on injuries and fatalities of adding a Quadbar to an ATV (keeping the helmet condition the same, i.e., the first and third comparisons above) is small and not statistically significant, i.e., the Quadbar would cause approximately as many injuries and fatalities as it would prevent. In contrast, the effect of adding a Quadbar and removing the helmet (i.e., the second comparison above) is large and statistically significant, in other words, the effect of removing the helmet is large, adverse and much larger than the effect of adding a Quadbar alone. This suggests that while the direct effect of adding a Quadbar on injuries and fatalities is small and not statistically significant, to the extent that adding a Quadbar induces any helmet-wearing riders to remove their helmet, the results would be large, adverse and (for a sample of 1,540 overturns) statistically significant.
The associated computer simulation animations and injury assessment value time histories were reviewed to determine the mechanisms behind these Quadbar risk and benefit results. The identified mechanisms included:
− Injury benefits from the Quadbar were often related to injuries that occurred with the baseline ATV (and with helmet) that were either reduced in severity or prevented by the Quadbar (e.g., trapping between the top surfaces of the ATV and ground).
− Injury risks from the Quadbar were related to injuries that did not occur with the baseline ATV (and with helmet) that were caused by the Quadbar and its lack of a restraint system (e.g., impacts between portions of the dummy and

8
the Quadbar; trapping of portions of the dummy between the other surfaces (i.e., not the top surfaces) of the ATV and/or the Quadbar, and the ground), or altered overturning motions of the ATV that increased some of the impacts and/or forces between the dummy and the Quadbar ATV and/or the ground.
− During rollover, the Quadbar’s geometry tends to lift (i.e., leverage upward) the ATV, resulting in greater forces when it lands. Note that in some cases the simulation animations indicated that when the dummy was wearing a helmet, the helmet’s decreased ground friction (relative to that with a bare head) and size resulted in the helmet sliding into this zone of increased landing force, thereby increasing head and neck injuries. 10 In other cases when the dummy did not wear a helmet, the bare head’s increased ground friction (relative to that that with a helmet) and smaller size resulted in the head not sliding into this zone of increased landing force, resulting in reduced head and neck injuries relative to the helmeted-Quadbar case. This and other hypotheses may explain the marginal (i.e., not statistically significant) trends in the first and third comparisons above. However, across all of the overturn events, the unhelmeted dummy sustained approximately 2 1/2 times the normalized injury costs of the helmeted dummy, so the effect of not wearing a helmet was far more harmful than the marginal (i.e., not statistically significant) benefit of adding a Quadbar when not wearing a helmet. Therefore, the far more effective safety strategy (by a large factor) would be to recommend wearing a helmet (in which case the Quadbar is marginal harmful and therefore should not be fitted), rather than to recommend not wearing a helmet in order to try to obtain a marginal (i.e., statistically not significant) benefit of a Quadbar.
− Similarly, based on a comparison of all 1,540 Quadbar versus the corresponding baseline simulations run (i.e., 3,080 total simulations with full face helmeted and unhelmeted dummies), the Quadbar caused the same number of potential compressive asphyxia/breathing difficulty outcomes (i.e., n=11) as it prevented (i.e., n=11). The lack of improvement in potential
10 As described in the report, in general, reducing helmet friction was found to reduce substantially dummy head and neck injuries. Increased injuries with reduced friction was believed to be a marginal anomalous effect that occurred in only a small number of cases which involved the interaction of Quadbar and helmet.

9
asphyxia outcomes appears to be due to a shift in final resting attitude of the ATV caused by the Quadbar. The results indicated that with the Quadbar, no “breathing difficulty” outcomes were observed when the Quadbar ATV came to rest on its top (i.e., upside down), whereas more “breathing difficulty” cases were observed when the Quadbar ATV came to rest on its side, with no net change in the total number of helmeted and unhelmeted potential asphyxiations. Since serious injuries have been known to occur when a baseline ATV comes to rest on its side on a rider, this shift toward more “breathing difficulty” (i.e., potential asphyxia) cases when the ATV comes to rest on its side is considered to be a realistic phenomenon.
Therefore the overall conclusions of the updated evaluation of the Quadbar, based on these results, were that:
− The Quadbar was found to have:
− injury and fatality risks that were greater than its injury and fatality benefits, respectively, for the helmeted use (i.e., helmeted Quadbar versus helmeted baseline) condition for the sample of simulated overturns analyzed, however the estimated net increases in injury and fatality risk for the population of overturns were not statistically significant;
− injury and fatality risks that were greater than its injury and fatality benefits, respectively, for the unhelmeted Quadbar versus helmeted baseline condition for the sample of simulated overturns analyzed, and the estimated net increases in injury and fatality risk for the population of overturns were statistically significant; and
− injury and fatality risks that were less than its injury and fatality benefits, respectively, for the unhelmeted Quadbar versus unhelmeted baseline condition for the sample of simulated overturns analyzed, however the estimated net decreases in injury and fatality risk for the population of overturns were not statistically significant.

10
− These injury and fatality risks, in comparison to the respective injury and fatality benefits, were therefore:
− much higher than those found in any published data for any automotive safety device;
− unacceptably higher than the suggested reference guideline for research purposes published in ISO 13232 (2005), i.e., the Quadbar injury risk/benefit percentages were all far greater than the “not… more than 12 percent” reference guideline indicated in International Standard ISO 13232-5 (2005);11 and
− apparently, unacceptably higher than “regulatory policies of several of the [Australian] states,” mentioned in the Heads of Workplace Health and Safety Authorities (HWSA) Technical Engineering Group (TEG ) meeting and report. As stated in the TEG report, these policies apparently are that the “the benefits need to be at least 2 times the risks" (i.e., 2 deaths prevented for every 1 new death caused by a device, or 50 percent risk/benefit.”12
Further analysis of the computer simulation results underlying the Quadbar Crush Protective Device (CPD) risk/benefit analysis described in this report and the Zellner et al. (2014) TRB paper are provided in Appendix L. This supplemental analysis involved calculation of additional injury indices (i.e., the incremental injury costs for each body region, and the number of AIS 6 (maximal) injuries) and additional risk-benefit indices (i.e., the average benefit per protective device beneficial case, the average risk per protective device harmful case, and the percentage of cases in which the protective device is beneficial, had no effect and is harmful) and additional risk-benefit criteria, in accordance with methods defined in International Standard ISO 13232-5 (2005).
11 The suggested reference guideline for research that is published in ISO 13232 (2005), Annex E is said therein to be “[b]ased on the results for automobile seat belts (7 percent) based on Malliaris, et al., 1982, as described by Rogers, et al. (199[8]), which is presumed to be an acceptable risk/benefit percentage; and the results for pre-1998 automobile passenger airbags (12 percent), based on Iijima, et al., 1998, which is presumed to be an unacceptable risk/benefit percentage.” 12 Technical Engineering Group report, p 32, footnote 7, November 2010.

11
This supplemental analysis was conducted for two samples of ATV overturn types: “all” (n=770 simulated) overturns; and a “low speed” subsample (n=304) of the “all” overturn (main) sample. “Low speed” was defined as less than 20 km/h as proposed by Grzebieta et al. (2014). In addition, three helmet configurations were analyzed: full face helmet, unhelmeted and half helmet. This supplemental analysis provided additional insights into the body regions affected by the Quadbar device, as well as the frequency and magnitude of the Quadbar injury benefits and injury risks. For example, the results for the “all” ATV overturn types sample indicate that the Quadbar produces a:
− statistically significant Quadbar negative net injury benefit (i.e., a net injury risk) in terms of neck incremental injury cost, for the full face helmet (-107%) and half helmet (-97%), i.e., fitment of the Quadbar roughly doubled the neck injury risk for the helmeted condition;
− statistically significant Quadbar negative net injury benefit (i.e., a net injury risk) in terms of the total number of maximum AIS 6 injuries across all body regions when the half helmet was worn. This resulted from non-statistically significant increases in the numbers of AIS 6 head injuries (from 10 to 12), AIS 6 neck injuries (from 4 to 13) and AIS 6 asphyxias (from 2 to 8) when the Quadbar was fitted; and
− statistically significant negative net injury benefit (i.e., a net injury risk) in terms of the normalized injury cost across all body regions if the helmet is removed when a Quadbar is fitted. This outcome is relevant for users who may mistakenly believe that fitting a Quadbar may enable them not to wear a helmet.
The normalized injury cost results for the “low speed” ATV overturn subsample indicated that the Quadbar had a negative net benefit (i.e., a net risk) for all five helmet configuration comparisons, although the point estimates were not statistically significant in some of the comparisons; and none of these five helmet configuration comparisons met at least three of the four ISO 13232 protective device guidelines. Overall, the supplemental results suggest that, particularly for “low speeds”, the Quadbar has a potentially (i.e., non-statistically significant) adverse effect (i.e., net injury harm) for the neck and other critical body regions, including AIS 6 asphyxias for the half

12
helmet condition. These low speed conditions have been reported to be relevant to operating conditions on Australian farms.
Based on these findings, the Quadbar device evaluated in this study should not be fitted to ATVs, including for predominantly “low speed” ATV operating environments, because the net injury risks from (i.e., new injuries created by) a Quadbar are generally similar in magnitude to (and for some conditions, on average greater than) the injury benefits from (i.e., injuries prevented by) a Quadbar; the injury risks in comparison to the injury benefits far exceed published levels for other protective devices in other vehicles; and also exceed ISO 13232 guidelines - as well as apparent workplace health and safety policies for some of the Australian states - for protective devices. Authorities and individuals should be advised of these findings. In addition, though not evaluated in this study, previous studies of rollover protection systems (ROPS) that do have restraints have indicated such devices installed on ATVs tended to have substantial adverse effects on ATV stability, mobility and utility, rider visibility, ergonomics and ride quality, due to the substantial mass13 of a ROPS relative to the mass of an ATV, as well as due to raising the total cg height of the vehicle, and due to the ergonomically restrictive action of its belts and other structures (e.g., seat backs) when adding these to the straddle-seat-handlebar “rider active” seating configuration of an ATV. Generally, as suggested by the literature describing previous evaluations, it is possible to partially offset the adverse effects of ROPS on ATV stability by increasing the ATV wheelbase and track, with penalties incurred in terms of degraded mobility, utility and ride quality. However, other, alternative (e.g., so called side-by-side) vehicles are currently available in the market which have been designed to have greater wheelbase, track and mass than ATVs, thereby being capable of accommodating a ROPS without the substantial adverse effects that are encountered when attempting to fit a ROPS on smaller, straddle-seat, handlebar, rider-active, highly mobile ATVs.
This study also confirmed the results of other research that has indicated that helmet wearing does have substantial net injury benefits. Beyond this, the results of this study also indicated that helmets have a risk/benefit percentage that is comparable to those for automotive safety devices (e.g., airbags, safety belts, head restraints) and that, in addition, also meets the ISO 13232 guidelines for motorcyclist protective devices. Injury
13 Including the mass required to reinforce the ATV, in order to securely mount the ROPS.

13
risk/benefit analysis of the “baseline ATV” simulations (i.e., helmeted versus unhelmeted, without the Quadbar) indicated that in terms of the head incremental injury severity (ICnorm, head), the helmet had a net injury benefit of 70% [53%, 87%], with a risk/benefit percentage of 2% [1%, 13%]. This net injury benefit percentage result is in general agreement with helmet net benefit percentage data in the published literature. For example, Rodgers (1990) of the US Consumer Product Safety Commission (CPSC) estimated that helmet wearing on ATVs reduces the risk of non-fatal head injuries by 64%. The results in the current study confirm the importance, effectiveness and low additional injury risk of helmet wearing.
It is recommended that, in the future, the Quadbar device evaluated in this study should not be fitted to ATVs because, for this category of relatively small, highly mobile, straddle seat, handlebar controlled, helmet-required, rider-active vehicle, the injury risks from (i.e., new injuries created by) a Quadbar are generally similar in magnitude to the injury benefits from (i.e., injuries prevented by) a Quadbar, far exceed published levels for other protective devices in other vehicles, and also exceed ISO 13232 guidelines - as well as apparent workplace health and safety policies for some of the Australian states - for protective devices. Authorities and individuals should be advised of these findings.
This study addressed the injury benefits and injury risks associated with and relevant to the Quadbar. Other safety-related factors, including the previously studied, potentially adverse effects of other ROPS or CPDs devices on ATV stability as related to raised centre-of-gravity height (i.e., reduced overturn stability), reduced visibility, risk compensation by riders and increased potential for misuse (e.g., as related to warned-against passenger-carrying or elevated equipment carrying) should be taken into account as well. Functional performance, including effects on ATV mobility, utility and ergonomics, have been evaluated for some ROPS, and should be also taken into account in such evaluations.
For ATV’s, the results of this study confirm that helmet wearing should be encouraged and wherever feasible, required, as helmets, as found herein and elsewhere, have significant and substantial net injury benefits and very low risks in comparison to their substantial benefits.

14
This study did not address ATV accessories and cargo, which can interact with rider motions and injuries in overturns, and such research should be considered in the future, toward providing a better basis for more specific ATV usage guidelines (e.g., Lenkeit et al. (2006)).
Finally, other vehicles that are somewhat larger and heavier than ATVs exist in the market that can accommodate ROPS, and have been engineered to take into account the relevant functional factors. Such vehicles should be considered as alternatives to smaller, lighter, more mobile ATVs, for some tasks and usages.

15
Section I INTRODUCTION
This report describes results of an updated evaluation of the effects on predicted injuries of the Quadbar crush protection device (CPD) that has been proposed for application to All Terrain Vehicles (ATVs). The update took into account desired refinements to and all known, valid comments on the previous evaluation methodology including: lowering the energy level of the overturn events used; considering potential mechanical/traumatic (compressive) asphyxia factors; refining the control inputs used to induce each of the overturn events; additional calibrations of the simulation models against actual injuries in accidents and literature on helmet net injury benefits; and other refinements.
As in previous evaluations described by Van Auken et al. (1998), Zellner et al. (2004), Munoz et al. (2007) and Zellner et al. (2008), this evaluation adapts the relevant portions of the test and analysis methods specified in ISO 13232 (2005) for motorcycle protective devices, extended so as to be applicable to ATV overturn events. This evaluation estimates and evaluates the predicted injury benefits and injury risks of fitting the Quadbar to ATVs, and a comparison of these results to published data for other occupant protection systems for automobiles, as well as to guidelines for motorcycle rider protection systems given in ISO 13232 (2005).
In this report, the term “CPD” refers to devices like the Quadbar which have an overturn protective structure and no restraint belts. The term “ROPS” refers to systems which have an overturn protective structure and one or more restraint belts. The term “overturn” is considered to include rollovers, pitchovers and combined axis overturns of a vehicle. The term “misuse” refers to using a product in a way that is contrary to the warning labels that are on the product (i.e., in this case, an ATV), for example, not wearing a helmet, use by children, etc.
The analysis described in this report evaluates the Quadbar using a procedure similar to that used in previous evaluations, namely by predicting the injury benefits and injury risks that would result from fitment of a protective device, by means of paired comparisons (i.e., predicted injuries with and without the proposed device), across a

16
representative set of overturn “types” (and variations thereto), in which the types of overturn are based on two different samples of actual ATV accidents.
Section II continues with an overview of the methodology used; Section III describes the previous research background, and Section IV describes the updated analysis, in terms of the methodology refinements, the results, conclusions and recommendations. The appendices contain further details of the methodology and results.

17
Section II OVERVIEW OF METHODOLOGY
A. PROTECTIVE DEVICE INJURY EVALUATION METHODS
When evaluating protective devices that are proposed to be fitted to vehicles, it is important to consider the effects of the device on injuries and fatalities.
For automobiles, since the 1960’s consideration of the effects of protective devices on injuries has been done by means of tests with appropriate, standardized, injury-monitoring crash dummies. The tests represent one or more “types” of crash event, which are based upon (to a greater or lesser extent) information about actual accidents.
While one or more “types” of crash event are typically used for baseline evaluations, in general, it is desirable in principle to evaluate the effects of a proposed protective device across a range of conditions representing the intended use of the device. A device which reduces injuries in one test condition (producing an “injury benefit”) may have other (e.g., unintended) effects under other test conditions (i.e., an “injury risk”). It is desirable that the injury benefits of a protective device should be its primary effect, and that any “injury risks” of a protective device be very small or effectively zero, if possible, in comparison to its injury benefits, as is typically found to be the case, for example, in published data for automotive occupant protection systems such as safety belts, head restraints and airbags.
More recently, computer modeling and simulation of crash tests, suitably calibrated against real crash tests and crash dummies, have become more widely applied methodologies for research and development purposes (e.g., Iijima et al. (1998), Osendorfer et al. (2001), Weiss et al. (2001), Van Hoof et al. (2003), ISO 13232 (2005), Kuroe et al. (2005), Ootani et al. (2007), to mention a just a few examples). Simulation methods generally require that the models be experimentally verified and calibrated using a sufficiently wide range of actual tests. At the same time, simulations which have been calibrated for one purpose may not be applicable to other purposes. The advantages of simulations and models are that they can be used to cover a wider range of events far more quickly and economically than full-scale testing can, and that they can do so with perfect repeatability. For this reason, and within these limitations, simulations and models

18
are increasingly widely relied upon in many fields (e.g., aerospace and automotive engineering) when they achieve a reasonable level of agreement with a reasonably wide range of calibration tests. In addition, simulations and models can be further refined and improved, based on further test data and refined assumptions.
In regard to another aspect of injury evaluation, it is important to note that crash dummies, while representing the current state-of-technology in injury evaluation, have several limitations, e.g., crash dummies:
− Can monitor only a limited set of locations, types and severities of human injury;
− Are passive, i.e., they cannot actively move by themselves as humans do (e.g., lean or shift weight uphill or into a turn, purposefully separate from the ATV prior to rollover, etc.);
− Each represent a given category of human (e.g., in terms of sex, age, size and weight), and only a limited set of categories exist. Crash dummies do not exist that represent all conceivable heights, weights, girths, sexes, ages, physical conditions, etc., of humans present in actual accident case files.
Nevertheless, evaluation with crash dummies is the widely accepted state-of-technology for injury evaluation in vehicles. A hypothetical alternative, conducting crash tests with live humans in potentially injurious events, has significant moral and ethical issues associated with it, not to mention practical issues with experimental reproducibility and repeatability.
In virtually all such research and evaluations, the crash tests, simulations of crash tests and crash dummies involve “baseline” conditions (i.e., a baseline dummy size, age category and sex, a baseline vehicle and baseline crash conditions, based on one or more general “types” of crash event, which in turn may be generally based on what is recorded by investigators in a sample of actual accidents). They virtually never involve an attempt to reproduce all of the details of the actual accident-involved vehicles, persons, environments, injuries, or contacts that occur in specific actual crashes, because a) generally many or most of these variables are not recorded in accident case files, b) in reality there is an enormous diversity of such details occurring across a sample or census

19
of actual accident cases, and c) as noted previously, the current state-of-technology of crash dummies cannot monitor all potential locations, types and severities of human injury, or the enormous diversity of age, sex, stature, girth, weight, etc. of accident-involved persons. Instead, systematic tests and/or simulations are conventionally done with one or more baseline dummies, a baseline vehicle, and baseline “types” of crash event/environment. In this way, the number of input variables is controlled, and the effects of the device are assessed relative to the baseline conditions.
B. APPLICATION OF INJURY EVALUATION METHODS TO POTENTIAL ATV OVERTURN PROTECTIVE DEVICES
An “All Terrain Vehicle” is a particular type of standardized off-highway vehicle, which is defined by (among other factors (as in, e.g., ANSI/SVIA-1-2010 (2010))) its “straddle seat-handlebar-helmet-required” configuration. ATV definitions and characteristics are further discussed in Section III.A. An All Terrain Vehicle has a precise legal definition in the United States,14 which is currently the largest market for ATVs, accounting for approximately 90% of sales worldwide. A “Quadbike” is a slang, non-legally precise term used in some regions, which may include ATVs, but which has also been used to refer to other four wheeled vehicles that do not comply with ANSI/SVIA-1-2010.15
At the current time, only one standard exists, worldwide, for evaluating the effects on injuries of protective devices on one type of “straddle seat-handlebar-helmet-required” vehicle, namely motorcycles, and that is International Standard ISO 13232 (2005). This Standard defines test and analysis methods for research evaluation of rider crash protective devices applicable to two wheeled motorcycle-to-car impacts. Many, but not all, of the tools available in the Standard are potentially applicable to evaluating the effects on injuries of candidate overturn protective devices on another category of “straddle seat-handlebar-helmet-required” vehicle, namely ATVs. Obviously, those 14 Under the US Consumer Product Safety Improvement Act (CPSIA), an ATV is as defined in ANSI/SVIA-1-2010. 15 For example, of n=106 "quadbike" fatalities reported in the Australian National Coronial Information System, it has been found that as many as 23 cases were either not an "ATV accident" or involved a vehicle that was not an "ATV." Some recorded accidents, including some of those in the UK and US accident case summaries and databases described subsequently in this report, in fact involved, e.g., 3-wheeled, 6-wheeled, and tracked vehicles, which are not ATVs, and are very dissimilar to ATV's in terms of size, weight, configuration, etc., and those were not considered in the current study.

20
aspects of the Standard which specifically involve only “two wheeled motorcycle-to-car impacts” are not applicable to ATV overturn events. However, the tools that are defined and available in the Standard that are broader in nature and potentially applicable to evaluating the effects of protective devices in ATV overturn events include:
− The only standardized injury-monitoring crash dummy worldwide which is designed to be compatible with “straddle seat-handlebar-helmet-required” vehicles (of which motorcycles and ATVs are two examples);
− The only standardized injury-monitoring crash dummy worldwide which can monitor for injuries in several directions (i.e., lateral, fore-aft and vertical), which may occur in ATV lateral, forward, rearward and multi-axis axis overturns;
− The only standardized injury-monitoring crash dummy worldwide which can monitor for a range of injury severities at several body regions (i.e., for which injury probability curves exist for different Abbreviated Injury Scale (AIS) injury severities);
− A requirement that the motions calculated by computer simulation be calibrated against those recorded in full-scale tests, in order to obtain a correlation figure-of-merit;
− A requirement for calibrating the response of the simulated crash dummy against laboratory tests done with the actual crash dummy;
− Definition of a sample of accidents - ideally a representative sample including all injury severities – from which to define a set of general “types” (or “configurations”) of accident event, which are then used for simulation and testing purposes;
− Evaluation of the “injury benefits” of a proposed protective device, as well as the “injury risks” (i.e., unintended consequences) of a proposed protective device, across all of the general “types” of event, and taking into account their frequency of occurrence, with the guideline in the Standard (Part 5, Annex E) being that the average injury risks of the proposed protective

21
device should be small in comparison to the average injury benefits of the proposed protective device.
Note that ISO 13232 (2005) is intended for research purposes, which is the purpose of the current study, and (due to its paired comparison methodology and other aspects) it is not intended for, or suitable for, regulatory purposes.
The main portions of ISO 13232 (2005) that are not applicable to ATV overturns are the “definition of impact conditions in relation to accident data” (i.e., Part 2) and “Full-scale impact test procedures” (i.e., Part 6) of the Standard, which are defined specifically for two wheeled motorcycle-to-car impacts, and which are not defined (in ISO 13232 or in any other standard) for ATV overturn events.
Consequently, in the current and previous ATV ROPS and CPD research, an ad hoc approach was adopted in order to define several types of ATV overturn events, which was analogous to the approach formally used in ISO 13232 for two wheeled motorcycle-to-car impacts. This ad hoc approach involved collecting available samples of ATV overturn accident case files – comprising a sample of US/Consumer Product Safety Commission (CPSC) ATV Injury Survey Data and In-Depth Investigation (IDI) case files, and text descriptions of 105 accidents investigated by the UK Health and Safety Executive (HSE) – and using them to define a set of general “types” of ATV overturn events, for testing and/or computer simulation purposes.
It is important to note that the general “types” of ATV overturn events that were defined for the purposes of this report – and the predecessor related reports - were not intended to reproduce any specific individual accident cases in these samples, or their specific outcomes (e.g., in terms of specific vehicle or rider motions, or specific rider injuries), as the original case files are insufficiently detailed and are inadequate to enable that to be done. Instead, the general “types” of ATV overturn that were defined were intended to be: a) consistent (i.e., not in conflict) with the very limited set of overturn “input” variables that were described in each case, the number of which varied case by case, and b) relevant and feasible to be tested or simulated by means of selected baseline conditions, i.e., a baseline adult-sized ATV, the baseline ISO 13232 mid-sized adult male crash dummy, c) consistent with the other ATV overturn full-scale test methods described by Van Auken et al. (1998) and Zellner et al. (2008), e.g., based on using suitable ATV control inputs from vehicle remote controllers and suitable simplified

22
terrains, in order to provide repeatable inputs, so as to induce several types of ATV overturn events, and d) involve convenient “rounded” values of input variables, e.g., speed, slope, obstacle size, etc., as would be used in, for example, a standardized test.16 Note that while it might be of interest, at the current time there are no small female, large male or child crash dummies that exist that are compatible with “straddle-seat-handlebar-helmet-required” vehicles, or with the other injury monitoring requirements of, e.g., ISO 13232 (2005).
In this research, the emphasis was on evaluating the consequences of an overturn, and not on the event(s) that might cause an overturn. Therefore, modeling of ATV tires, suspension, and vehicle response to rider steering, braking, throttle inputs, etc., while done at a generally accurate level, were not highly detailed or calibrated in high detail against test data for those particular subsystems, as they are secondary to the topic of interest, namely the consequences of an overturn. Moreover, the available accident case files did not contain any specific (and often times, not even general) information regarding ATV make-model-year, tire type and inflation pressure, or actual steering, braking or throttle input magnitudes or time histories, or detailed description of the vehicle response to such inputs prior to the overturn event. Furthermore, even if such information had been recorded in one or more accidents, invariably these variables would differ from case to case, thereby not allowing any generalized assumptions to be made about, or standardized test conditions defined for, their magnitudes or time histories. Instead, the general “types” of overturn were defined based on whatever general information was available in the associated case file (e.g., general type of terrain, operating conditions, general types of control inputs, general types of resulting motions, etc.), nominal input magnitudes and conditions for those were assumed, and then the unspecified inputs were systematically varied, as described in Appendices C and D, so that a simulated overturn would occur.
It is also important to note that the original ATV case file information from the US and UK government agencies was, in many cases, extremely limited, and in many cases did not contain all or even a majority of the variables that are needed to model the type of ATV overturn (e.g., see Appendix D). In addition, the available ATV overturn samples
16 ISO 13232 (2005) also uses "rounded" values to define the motorcycle impact “types” used for testing and simulation purposes.

23
(i.e., in the current analysis, a total of n=110 cases17 identified as involving an “ATV” overturn) were relatively small in comparison to the motorcycle impact sample of n=501 cases used in ISO 13232 to define a set of 200 general “types” of impact).
Therefore, in the current research, an approach based on the “best available information” was used which involved using all of the general “input” variables for which some information was available or inferable for each case, plus implementing a set of systematic, consistent, plausible assumptions regarding the missing “input” variables (as outlined in Appendix B) so as to define one general “type” of baseline dummy/ATV overturn per case. Note that the occurrence of ATV overturn was the one common variable that described all the actual cases as well as all of the 110 general “types” of simulated overturn. In addition, recognizing that the detailed assumed conditions can affect the outcome of any crash or overturn event, each of the 110 general “types” of overturn was systematically varied in six additional ways (e.g., comprising a “perturbation” analysis), as further described in Section IV, so that a total of 770 conditions were simulated, for each ATV configuration (i.e., baseline ATV and Quadbar ATV) and helmet configuration. The latter perturbation analysis helped reduce the sensitivity of the overall outcomes to the exact initial conditions assumed for each “type” of overturn. Conceptually, each actual accident case could be considered to be similar to the set of seven overturn “types” (i.e., the baseline overturn and the six variations of it) defined for each case. Note, however, that in general it is not possible to verify whether or not the actual case lay within or outside this set of seven overturn types, as many of the needed variables were not recorded by the original government accident investigator.
It is also important to note that, in reviewing the outcomes of tests and/or test-calibrated computer simulations involving crash dummies, the injury outcomes fundamentally cannot match those of specific actual accidents, nor can they even exactly match the “frequency distributions” of injury outcomes from samples of actual accidents, for the reasons stated previously. Nevertheless, to a greater or lesser extent, the “aggregated”18 frequency distributions of injuries measured with a crash dummy in a 17 In the previous ATV ROPS/CPD research, 59 cases from the UK Health and Safety Executive (HSE) and 55 cases from the US Consumer Product Safety Commission (CPSC), which were all of the cases in the group of cases received that involved overturn formed the basis for defining 113 general “types” of ATV overturn. In the current study, it was found that three of these cases involved vehicles that may not have been ATVs, and which were subsequently excluded from the analysis. This resulted in a total of n=110 ATV cases being used as the basis for defining 110 general “types” of ATV overturn. 18 “Aggregated” refers to the summation of all injuries of a given location, type and severity across all cases in a sample. This is different from type-by-case reporting of injuries.

24
sample of tests and/or simulations of several general types of crash events can be “generally” similar to those observed in a sample of actual accidents, but if and only if the particulars of the test/simulation sample are “generally” similar to those of the accident sample (in terms of types of injuries monitored, person types modeled, vehicle types modeled, types and severities of accidents, etc.)
Note that case-by-case (or type-by-case) matching of injuries for large collections of cases exceeds the state-of-technology in the biomechanics field, as well as the state of the available accident data; and there are no known published examples of it.
Matching the “aggregated” injury distribution (between modeled distribution and the actual distribution) is within the state-of-technology in safety research, as illustrated for example by Kuchar (2001) in Figure 1 below, and as also illustrated by, for example, Kramer et al. (1990) and Rogers et al. (2004).

25
Figure 1. Example distributions of modeled versus actual injury severity, from Kuchar (2001)
The generally close agreement between the baseline ATV aggregated injury frequency distributions of the simulation sample and those of the ATV accident sample that was found in the current analysis is described Section IV.A.5.a and in more detail in Appendix G.
C. INJURY RISK/BENEFIT EVALUATION METHODS
Finally, as noted previously, it is appropriate (as in this report, and as is required in ISO 13232 (2005)) to evaluate both the injuries prevented by a protective device (benefits) as well as the unintended new injuries caused by a protective device (risks, or

26
health costs), because (as generally discussed by Thompson et al. (2001) and Thompson (2011)):
− In principle, a health or safety intervention should provide health benefits and “do no harm” (to the extent practicable and feasible);19
− The “risk assessment” (of a task, procedure, vehicle, equipment, etc.) is an evaluation process that is entirely different from the risk/benefit analysis of an intervention. Risk assessment characterizes the impacts of potential application of countermeasures such as engineering controls, administrative controls, substitution, elimination, etc. Generally, all products (e.g., airplanes, cars, pencils, etc.) have some risk associated with their use, which in general cannot be reduced to zero without losing some of the functionality of the product, and risk assessments characterize the risks considering the entire system in which they occur;
− “Net benefit” and “risk/benefit” analysis of an intervention are fundamentally very different but complementary concepts that both warrant consideration;
− The “net benefit” (i.e., the injury benefits minus the injury risks) of a protective device (or other intervention) should be a positive number (e.g., as recommended in ISO 13232-5, Annex E) when analyzed across a sample of events.
− In addition, when extending the simulation sample estimate to the population of events, the net benefit should be “statistically significant” across the range of conditions evaluated (i.e., the statistical confidence
19 Examples of this principle that are found in US/DOT/NHTSA documents include: 1) "NHTSA sent a letter to twenty-one vehicle manufacturers urging them to personally ensure that their side-mounted air bags are designed to "do no harm" to occupants." (Report to Congress, Status of NHTSA plan for Side Impact Regulation Harmonization and Upgrade, NHTSA, March 1999); 2) "New technology or regulations can both have unintended consequences. We will therefore proceed expeditiously but deliberately. The physician’s overriding ethic is "first, do no harm" (The Honorable Jeffrey W. Runge, M.D., Administrator, National Highway Traffic Safety Administration before the Committee On Commerce, Science, and Transportation, United States Senate, February 26, 2003).

27
interval on the estimate of net benefit should generally not include negative numbers);
− Notwithstanding the fact that a given protective device may have a positive net benefit, the potential harm to individuals from a protective device (or other intervention) is not measurable or quantifiable by the “net benefit” index. A device can have a positive “net benefit,” and also have any level of risk/benefit percentage between 0% and 100%. Therefore, the net benefit and risk/benefit percentage are two independent indices that describe different aspects of risk and benefit and cannot be calculated one from the other, as described by Thompson et al. (2001);
− A goal of product development is to remove or reduce to a minimum “protective device” risk from products, before and as a pre-condition to their being placed on a market;
− “Risk/benefit percentage” is one useful index for describing the relative magnitude (i.e., ratio) of the risks in relation to the benefits. “Risk/benefit percentage” is calculated in, e.g., ISO 13232 (2005);
− Although risk/benefit considerations have not to date been used as part of the formal “benefits analysis” process used by vehicle safety agencies (e.g., the US National Highway Traffic Safety Administration (NHTSA)), largely because “protective device” risk removal is assumed to be the responsibility of manufacturers, risk/benefit considerations are used by other consumer product agencies (e.g., US Food and Drug Administration for health interventions, e.g., pharmaceuticals, medical devices, etc.);
− Vehicle safety agencies have occasionally considered relative safety device risk, e.g., in the case of NHTSA, the risk of an airbag injuring small front

28
seat passengers, as in the first generation Light Passenger Vehicle airbag depowering and subsequent related rulings;20
− Traditionally, acceptable health and safety interventions have small risks in comparison to their benefits (especially those to which a large population is exposed). Examples are non-prescription medications;
− Automotive safety devices (e.g., safety belts, airbags, head restraints, etc.) have demonstrably small risk/benefit percentages (e.g., less than 7 percent as described by Thompson et al. (2001));
− International Standard ISO 13232-5 (2005), Annex E contains a guideline that the risk/benefit percentage “should be less than 7 percent and should not be more than 12 percent,” which has been applied to the evaluation of various real safety devices in the market place (e.g., Honda Goldwing motorcycle airbag (i.e., Kuroe et al. (2005)), BMW C1 frontal crash frame (i.e., Osendorfer et al. (2001)), and is the guideline applied in this current analysis.
In addition, although it is not part of the main risk/benefit literature, it was noted in the Australia-New Zealand Heads of Workplace Health and Safety Authorities (HWSA) TransTasman QuadBike Working Party’s (TQWP) Technical Engineering Group (TEG) meeting and report that "in the regulatory policies of several of the states, the benefits needed to be at least 2 times the risks" (i.e., 2 deaths prevented for every 1 new death caused by a device, or 50 percent risk/benefit).”21
Although the latter criterion, if accurate, would be a very high risk/benefit percentage criterion, for example, higher than any known and measured risk/benefit
20 For example, from the January 6, 1997 Airbag Depowering Notice of Proposed Rule Making (US Federal Docket No. 74–14; Notice 108), "Finally, the ratio of lives saved by air bags to persons fatally injured is very different for driver air bags than passenger air bags. Driver air bags are estimated to have saved 1500 lives, as compared to 19 persons fatally injured. Passenger air bags are estimated to have saved 164 lives, as compared to 32 persons fatally injured." Note, however, that although the ratio (of saved to injured) is mentioned, the risk/benefit ratio (or risk/benefit percentage) of airbags was not part of the formal rules analysis used by the NHTSA, which gave “high priority to protecting children and accordingly has applied these different cost-benefit [emphasis added] considerations to its rulemaking affecting children" (19 March 1997 Depowering Final Rule). 21 TEG Report, p. 32, footnote 7, November 2010.

29
percentage of any automotive safety device, it provides a further point of reference for the current evaluation, as it may represent a policy in place in at least some regulatory agencies.

30
Section III BACKGROUND
From time to time, beginning in the late 1980s and continuing until the current time, there have been proposals to fit four-wheeled ATVs with ROPS or CPDs of various types, with the goal of increasing rider protection in overturns beyond those levels afforded by the basic design of ATVs (i.e., relatively small size, relatively compliant seat, plastic body panels and tires, relatively few and small rigid projections, protected foot environment, etc.) as well as recommendations for wearing a helmet and other recommended personal protective equipment (PPE). The candidate ROPS and CPD devices and their respective evaluations have been described in a series of publications, summarized subsequently. Generally speaking, a mixture of evaluation methodologies was used to analyze the candidate ROPS and CPD devices. These included subjective and objective tests of occupant protection, mobility, stability, utility and ergonomics; as well as full-scale tests and computer simulations of ATVs fitted and not fitted with ROPS or CPDs, in example ATV overturn and obstacle impact events, in order to assess changes in injury potential due to addition of the proposed device. Due to the diversity of methodologies used, it is difficult to compare directly the various evaluations, results and conclusions.
The purpose of the current review is to provide a summary and unified evaluation of candidate ROPS and CPDs previously proposed for use on ATVs, using a consistent methodology, based on relevant portions of the standardized test and analysis methodologies specified in International Standard ISO 13232 (2005).
A. REVIEW OF ATV DEFINITION AND FUNCTIONALITIES
In regard to the category of vehicles to be analyzed in this report, Type I ATVs are defined as “Any motorized off-highway vehicle designed to travel on four low pressure tires, having a seat to be straddled by the operator and handlebars for steering control,

31
and intended for use by a single operator with no passengers” (ANSI/SVIA 1-2010 (2010).22
The evolution of ATVs over more than four decades has resulted in a relatively small, economical, highly mobile, personal transport vehicle, which has found wide application in both recreation and in diverse, light-duty utility applications on unpaved off-road surfaces. Worldwide, there are more than 11 million ATVs in use, and this number continues to grow. Generally ATVs are characterized by their relatively unique blend of high mobility (e.g., capability to travel on narrow trails, dense forests, rough ground, low traction situations, etc.), along with basic levels of stability and utility (e.g., some limited cargo and towing capacity). Their unique levels of mobility, utility and stability distinguish them from, on the one hand, smaller, lighter, highly mobile off-road motorcycles; and on the other hand, from larger, heavier, somewhat less mobile, 4 wheeled off-road vehicles with “side-by-side” seating configurations.
1. ISO 13232 Injury Analysis
In a previous analysis (e.g., as described by Zellner et al. (2008)), the injury analysis methods standardized in ISO 13232 (2005) were adapted to ATVs, by applying them to ATV overturn events; and by extending them to cover unhelmeted head injuries (as the latter misuse-related injuries are often reported in government-recorded accident case files). A brief summary of the ISO 13232 methodology is provided here, along with the previous extensions to it made for purposes of ATV ROPS/CPD overturn evaluation.
B. OVERVIEW OF ISO 13232 AND INJURY RISK/BENEFIT ANALYSIS METHODOLOGY
ISO 13232 standardizes test and analysis methods used to evaluate rider protective devices (e.g., leg protective devices, airbags, etc.) fitted to motorcycles. Its eight parts describe 200 standardized impact configurations (i.e., crash types), based on data from in-depth accident investigations of specific accidents, to be used for computer simulations of motorcycle crashes, with a motorcycle either fitted, or in the "baseline" configuration, not
22 A Type II ATV, not analyzed in this report, “is intended for use by an operator or an operator and a passenger. It is equipped with a designated seating position behind the operator designed to be straddled by no more than one passenger”.

32
fitted with, a proposed protective device. This enables “paired comparison” evaluation of the crash outcomes, across a representative sample of impact configurations (or impact types). In addition, 7 out of the 200 impact configurations are replicated in full-scale tests, the purpose of which is to calibrate the computer simulations for these 7 impact configurations and to provide an initial evaluation of a candidate protective device, also by paired comparison.
The evaluation of the crash outcomes is based on objective measurements of rider “injury assessment values” (IAVs), recorded by means of crash dummy sensors in both the full-scale tests, and in the computer simulations. The IAVs for each crash test are converted to injury indices, including separate Abbreviated Injury Scale (AIS) outcomes for the head, neck, chest, upper legs, knees and lower legs, and the overall (i.e., total body) Normalized Injury Cost (ICnorm). The latter is based on similar data and indices as are used by, for example, the US/National Highway Traffic Safety Administration (NHTSA) in evaluating proposed protective system benefits by means of, for example, “injury fatality equivalents.”
Specifically, the injury indices of ISO 13232 (2005) are intended to predict:
– head concussive injuries (including diffuse axonal brain injuries); – upper neck fracture/dislocation; – chest compression (associated with internal organ crush and rupture); – abdominal penetration (associated with internal organ rupture); – upper leg fracture; – knee dislocation; – lower leg fracture.
In accordance with ISO 13232 (2005), for each pair of simulated or tested crashes (i.e., with and without the protective device fitted to the vehicle), the crash outcome in terms of ICnorm is compared. If the protective device reduces the normalized injury cost, the reduction in ICnorm is designated an “injury benefit” if the protective device increases the injury cost, the increase in ICnorm is designated an “injury risk.” The injury benefits (and separately, the injury risks) so measured are then summed across 200 impact configurations (each one of which is weighted by its frequency of occurrence in the real world) to yield the total injury risks and benefits.

33
The final step in ISO 13232 involves using these data to calculate various indices for the protective device, including: the average benefit; the average risk; net benefit; and the risk/benefit percentage. ISO 13232 Part 5, Annex E contains risk/benefit guidelines for protective devices, based on levels for each of these indices that have been found to correspond to existing vehicle occupant protection systems.
Annexes to ISO 13232 (2005) contain the details of the methods, as well as their rationale and bases.
1. Adaptation and Application to ATV Overturn Events
There are obvious similarities between motorcycles and ATVs (e.g., rider active seating configuration, i.e., straddle seat, handlebars, recommended use of a helmet, typical separation from the vehicle during an impact or overturn event, etc.) which suggest the application of similar methodologies for evaluating rider protection systems. Some of the potential differences, which were addressed in the modeling, include: the relatively high frequency of unhelmeted ATV riders; and the substantially different types of operating environments and accidents of ATVs in comparison to those of street motorcycles.
In consequence of the latter difference, in order to evaluate ATV ROPS/CPD devices, two sets of actual ATV accident case files, from the UK and US governments respectively, were obtained and in the previous work (i.e., Van Auken et al. (1998) and Zellner et al. (2004)) were transformed into 113 general “types” (or “configurations”) of ATV overturn events. These overturn types were used in place of the 200 (motorcycle/car) impact configurations in ISO 13232. Each of the 113 general types of ATV overturn include a general description of the terrain, speed, obstacles and control inputs which were inferred as being associated with each type of ATV overturn. For analysis purposes, the 113 general “types” of overturn were assumed to be a representative sample of ATV overturn events relevant to the evaluation of ROPS/CPD devices. Further descriptions of the general types of overturn events are given subsequently.

34
2. Extension to Include Skull Fracture
For an unhelmeted rider, which is an ATV misuse (i.e., a warned-against behavior), potential fracture of the vault and the facial bones are two primary injury types that can be addressed, in addition to closed-skull brain injuries already addressed in ISO 13232 (2005). Van Auken et al. (2011) used existing cadaver skull impact/fracture test data to derive probability curves for vault and face fracture as functions of peak skull contact force and resulting energy, as measured with a Hybrid III head form.
While experimental measurement of contact force and energy occurring in the Hybrid III (or MATD) dummy head form is currently difficult, except with specialized laboratory apparatus, force measurement in computer simulations of the Hybrid III head form are relatively straightforward, and was the approach used in some of the cited previous ATV ROPS/CPD studies as well as in the current study.
C. REVIEW OF PREVIOUS ATV ROPS/CPD FEASIBILITY RESEARCH
This sub-section first reviews previous research into ATV ROPS/CPD feasibility, including injury analyses and the effects of ROPS/CPDs on ATV functional performance. Following this, the remainder of this sub-section further focuses on previous ATV ROPS injury analysis based on application of International Standard ISO 13232 (2005).
1. Overview of Previous Research Including Injury Analysis and Functional Performance
A brief background for each of the six previously analyzed ROPS/CPD devices summarized by Zellner et al. (2008) and Munoz et al. (2007) is given as follows.
a. Dahle ROPS
In 1987, Dahle (1987) described a ROPS comprising “a four post design which mounts directly onto the rear main frame extension …and the front of the frame.” It is relatively light in weight (i.e., 20 kg), energy absorbing and has a rounded profile. The seat restraint system involves an adjustable belt worn on the upper hips, and three detachable tethers which allow some movement but are intended to restrain the rider

35
generally on or in proximity to the seat. Belt retractors were not present. Piziali et al. (1993) evaluated the Dahle device by means of crash tests (lateral and rear overturns, and frontal impacts), and concluded that “many of the accidents probably would have produced more serious injuries with [the Dahle] ROPS equipped vehicles due to the introduction of alternate accident and injury modes;” and that “the net safety impact of the [Dahle] ROPS system would be negative, by demonstrating a probable safety cost with no measurable safety benefit.” Piziali et al. (1993) cite a US CPSC report that concluded that there was no evidence to support the claim that this device would have a safety benefit.
b. Johnson ROPS
In 1991, Johnson et al. (1991) describe a heavier duty ROPS, with multiple bars comprising a cage-like design, involving: integral attachment to the ATV frame; wheel base lengthened by 15 cm; front and rear tracks widened by 10 cm; ballast added to each wheel; seat lowered by 12 cm; seatback added; special waist and shoulder belt restraints added which allowed 10 cm vertical and 15 cm lateral body movement, with elastic slack-removing straps. This was evaluated by Piziali et al. (1994) and found to be 123 kg heavier than the baseline ATV. Piziali et al. concluded that the Johnson ROPS would introduce new accident modes and new injury modes, degraded visibility, mobility, utility, ride quality, ergonomics and practicality of the vehicle.
c. NZ T-bar CPD
The T-bar ROPS/CPD (e.g., “Quadrop” (1997)) is a generic type of ROPS/CPD manufactured and occasionally used in New Zealand (OSHS, 1997). It comprises a “T-shaped” post attached to the rear extremity (e.g., to the rear cargo rack) of an ATV. It involves no rider restraint system, and is sometimes referred to as a “roll preventing system” (also with the mnemonic of “ROPS”) or as a type of CPD. Van Auken et al. (1998) evaluated the T-Bar fitted to a Honda TRX 400 ATV by means of full-scale overturn tests with an instrumented dummy (further described below) and computer simulations in 59 general “types” of overturn events based on UK Health and Safety Executive recorded ATV accidents. Van Auken et al. (1998) concluded that the injury risks from (e.g., head and neck impacts to) the device were similar in magnitude to, and in some cases greater than, the injury benefits, and therefore it was recommended not to be used. Other concerns included strength of the attachment to the ATV; raising the

36
center of gravity of the ATV thereby reducing stability and increasing overturn likelihood; and potential misuse of this ROPS/CPD (i.e., providing a convenient support for farm equipment and warned-against passengers).
d. UK U-bar CPD
In 1996, Allinson (1996) and Allinson et al. (1997) of the UK Health and Safety Laboratory began a feasibility study of an inverted “U-shaped” bar, attached to the ATV aft of the rider. It was proposed that this feasibility concept should meet existing ROPS/CPD strength and energy absorbing standards for other classes of vehicles; and be attached just aft of the ATV seat, so as to maximize the “deflection limiting volume” protected by the CPD. A cooperative study was initiated by the UK Health and Safety Executive (HSE), which led to Van Auken et al. (1998) evaluating the U-Bar fitted to the Honda TRX-400 by means of computer simulations in 59 general “types” of overturn events based on UK Health and Safety Executive recorded ATV accident case files, and by means of full-scale overturn tests with an instrumented dummy (further described subsequently). As with the T-bar CPD, Van Auken et al. (1998) concluded that the injury risks from (e.g., head and neck impacts to) the device were similar in magnitude to, and in some cases greater than, the injury benefits, and therefore it was recommended not to be used. In particular the proximity of the horizontal portion of the CPD to the rider’s neck was a concern. As with the T-bar CPD, other concerns included strength of the attachment to the ATV; raising the center of gravity of the ATV thereby reducing stability and increasing overturn likelihood; and potential misuse of the ROPS/CPD (convenient location for equipment and illegal passengers). The HSE subsequently commissioned the Motor Industry Research Laboratory, to do an additional independent evaluation by means of computer simulation. The MIRA report (Tyler-Street (1999)) reached virtually the same conclusions as Van Auken et al. (1998). Based on these results, in 1999, the HSE issued guidelines for ATV use in the workplace, recommending against use of ROPS/CPDs on ATVs.
e. MUARC ROPS
In 2003, Rechnitzer et al. (2003), at that time with the Monash University Accident Research Centre (MUARC), proposed a heavy duty cage-type ROPS that would withstand large rollover forces, and would restrain the rider by means of a 4 point belt system, seatback, head restraint and lateral shoulder bolsters. In computer simulations of

37
3 low speed rollover events, Rechnitzer et al. (2003) reported that the ROPS prevented fatal outcomes in 2 out of 3 cases. Zellner et al. (2004) independently analyzed the same 3 rollover events, using ISO 13232-compliant simulation models. Zellner et al. (2004) found that there were no fatalities with the baseline ATV, and that the ROPS/CPD increased rider injuries in 2 out of 3 cases. Zellner et al. (2004) also did computer simulations of 59 general “types” of overturn events based on the available descriptions in the UK HSE case files and 54 general “types” of overturn events based on the available descriptions in the US CPSC data and case files, and found that, overall, the MUARC ROPS23 caused more injuries than it prevented, due to impacts between the rider and the device, crushing of the rider between ground and the device; flail of the legs outside the vehicle; and high g (acceleration-induced) brain injuries Zellner et al. (2004) (2004(a)). Zellner et al. also conducted a variety of full-scale tests of mobility, stability, utility and ergonomics, and found that this particular ROPS design degraded each of these areas. Rechnitzer et al. (2003) described the ROPS as having a mass of 34.1 kg; however, the supporting MUARC MADYMO simulation model indicated a mass of 42.1 kg. In addition, Zellner et al. (2005) found that in order not to degrade its static stability and in order to have adequate structural strength, the resulting vehicle would have substantially increased ROPS mass (including structural reinforcements to the ATV) of 152 kg (i.e., increasing the ATV total mass by 65%), increased wheelbase and track (i.e., increased by 34% and 33% respectively) and if engine size was not increased, degraded performance.
f. Quadbar CPD
In 2007, in the context of coronial hearings on several ATV-related fatalities, the Victorian Coroner requested that Dynamic Research, Inc. conduct an evaluation of the Quadbar, manufactured by QB Industries of Queensland, Australia. Munoz et al. (2007) used measured force-deflection, mass and geometric characteristics of a Quadbar and a simulation and analysis methodology essentially identical to that used by Van Auken et al. (1998) and Zellner et al. (2004). All elements of the pre-existing simulation models were used, including the CPD/soil force-deflection and other vehicle, dummy and environment characteristics that had been previously calibrated by Van Auken et al. (1998) by means of full-scale tests. No additional full-scale calibration tests were done, due to the requested schedule and the assumed similarity in CPD/soil force deflection 23 The MUARC ROPS was fitted to a Honda TRX-350, corresponding to the ATV model used in the MUARC study.

38
characteristics to those of the U-bar and T-bar CPDs, which had had the benefit of both extensive laboratory tests (i.e., Appendix E) and full-scale overturn tests (i.e., Section III.C. 2.a.iii and Appendix F). The results of the simulations and injury risk/benefit analyses, including both helmeted and unhelmeted conditions, indicated that “the injury risk/benefit percentages of the [Quadbar], across these conditions of intended use and foreseeable misuse, in terms of normalized injury cost (ICnorm), [were]…excessively large in comparison to the injury benefits from the [Quadbar];24 and that any net benefit [from the Quadbar] is not statistically significant.”
2. Review of Previous Injury Analysis of 6 ATV ROPS/CPDS by Means of ISO 13232
This subsection reviews the methodology used in the previous injury analysis of 6 ATV ROPS/CPDs by means of ISO 13232 (2005) reported in Zellner et al. (2008), followed by a review of the results, conclusions and recommendations based on those results.
a. Methodology Used in Previous Injury Analysis by Means of ISO 13232
The methodology was based on a series of dummy, ATV and ROPS/CPD models, 113 general types of ATV overturn events, and calibration against full-scale ATV overturn tests, which are described subsequently.
i. Models of Rider Dummy, ATV, ROPS/CPDs
Mathematical models to simulate the overturn motions of a rider on an ATV, with and without a ROPS/CPD fitted to the ATV, in a representative sample of 113 general “types” of ATV overturn, were developed and as described subsequently, were calibrated against laboratory and full-scale tests, in order to estimate the injury risks and benefits of the candidate ROPS/CPD devices. The simulations models were based on the Articulated Total Body (ATB) computer program developed by Calspan and the US Air Force for the
24 ISO 13232-5 guidelines are that the risk/benefit percentage for safety devices “should be less than 7 percent and should not be more than 12 percent.”

39
US National Highway Traffic Safety Administration (e.g., Obergefell et al. (1988)). The ATB models are summarized in Table 1.
Table 1. ATB Model Summary Model Description Mass (kg) Number of Rigid
Bodies (ATB segments)
Number of Degrees of Freedom
Rider MATD dummy 71.2 35 69 ATV TRX 350 243.2 8 11 ROPS/CPD Dahle 16.3 2 3
Johnson 106.6 4 NZ T-bar 9.5 4 HSE U-bar 7.5 4 MUARC 43.1 3
1) Rider dummy model
The rider model was an ISO 13232 Motorcyclist Anthropometric Test Device (MATD) specified in Part 3 of the ISO 13232 (2005). The physical MATD is based on the Hybrid III passenger car dummy but has 28 special modifications which make it suitable for testing and analysis of crash protective devices for motorcycles and therefore for other straddle-seat/handlebar/helmet-required vehicles such as ATVs, including frangible legs and abdomen, and a biofidelic neck that has been calibrated against Navy volunteer dynamic tests in several directions. In addition, with its pedestrian pelvis, aerospace lumbar spine and gripping hands, the MATD is better suited than the Hybrid III for positioning in typical riding postures involving motorcycle and ATV straddle seats and handlebars. The modified soft tissue of its headform enables a helmet to be fitted and properly retained by means of helmet retention straps, which is not feasible with a standard Hybrid III dummy.
The MATD was mathematically modeled for computer simulation purposes by 35 articulated rigid body segments with 57 nominal degrees-of-freedom as illustrated in Figure 1. The MATD model was based on the simulation model of a Hybrid III ATD described by Kaleps et al. (1988), suitably modified to represent the ISO 13232 MATD, including the frangible legs and neck. The basic model was calibrated against laboratory test data according to ISO 13232 as described by Kebschull et al. (1998) and as described

40
in Appendix E. The model of the neck, which was revised in the 2005 revision of the Standard, is described by Van Auken et al. (2003).
Figure 2. Image of computer simulation model of the rider dummy (MATD)
The probability of specific levels of AIS injury of the head, face, neck, chest, abdomen, and lower extremities injury were estimated from objective injury assessment values using methods adapted from Part 5 of ISO 13232 (2005), as summarized in Table 2. Part 5 injury criteria were used for the closed skull brain, chest, abdomen, and lower leg injuries. It was assumed that the ROPS/CPD may have an effect on the probability of neck injury, and therefore this probability was estimated using neck injury criteria described in ISO 13232-5 (2005) and by Van Auken et al. (2005). It was assumed that the ROPS/CPD may also have an effect on the probability of skull fracture of unhelmeted riders, and in the 2008 analysis this probability was estimated using preliminary criteria described by Van Auken et al. (2008(a)). It was assumed that probability of a skull fracture for helmeted riders wearing a full-face helmet such as the one specified in ISO 13232 (2005) was very small and could be neglected in this analysis.

41
The overall injury severity was quantified by the ISO 13232-5 Normalized Injury Cost (ICnorm), which is a medical and ancillary economic cost-weighted measure of injuries in terms of equivalent life units. A value of zero corresponds to no injury, and value of 1 corresponds to a fatality equivalent. Medical and ancillary costs include medical care and initial and subsequent hospitalization, household productivity, lost wages, workplace costs, and legal costs but exclude "pain and suffering". The incremental ICnorm was also computed for each body region, which is defined as the value of ICnorm assuming that other body regions did not sustain any injuries.
Table 2. ISO 13232 MATD-Based Injury Criteria Used in the 2008 Analyses Body Region
Injury Injury Assessment Value Reference
Head Closed skull brain Maximum GAMBITb
(translational and angular acceleration) ISO 13232-5
Vault fracturea Maximum vault contact forcea Van Auken et al. (2008(a))
Face Zygoma fracture Maximum face contact forcea Van Auken et al. (2008(a))
Neck AO/C1/C2 dislocation or fracture
Maximum NIIc value (combination of forces and moments)
ISO 13232-5 (2005) and Van Auken et al. (2005)
Chest Chest crush and high velocity injuries, associated with internal organ rupture and crush
Maximum chest deflection and viscous criterion
ISO 13232-5
Abdomen Penetration and internal organ rupture
Maximum abdomen penetration ISO 13232-5
Lower Femur fracture Fracture of frangible femur ISO 13232-5 extremities Knee dislocation Shear failure of frangible components ISO 13232-5 Tibia fracture Fracture of frangible tibia ISO 13232-5 a Assumed to be applicable to unhelmeted riders only b Generalized Acceleration Model for Brain Injury Trauma c Neck Injury Index
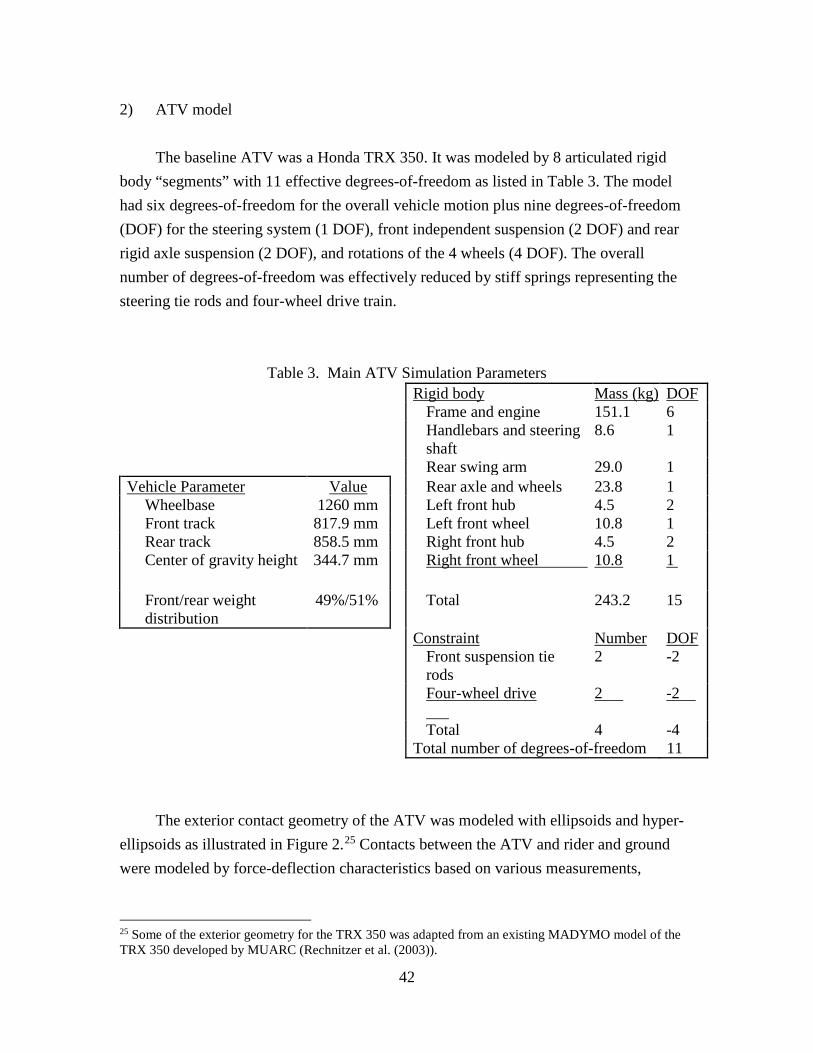
42
2) ATV model
The baseline ATV was a Honda TRX 350. It was modeled by 8 articulated rigid body “segments” with 11 effective degrees-of-freedom as listed in Table 3. The model had six degrees-of-freedom for the overall vehicle motion plus nine degrees-of-freedom (DOF) for the steering system (1 DOF), front independent suspension (2 DOF) and rear rigid axle suspension (2 DOF), and rotations of the 4 wheels (4 DOF). The overall number of degrees-of-freedom was effectively reduced by stiff springs representing the steering tie rods and four-wheel drive train.
Table 3. Main ATV Simulation Parameters Rigid body Mass (kg) DOF Frame and engine 151.1 6 Handlebars and steering
shaft 8.6 1
Rear swing arm 29.0 1 Vehicle Parameter Value Rear axle and wheels 23.8 1
Wheelbase 1260 mm Left front hub 4.5 2 Front track 817.9 mm Left front wheel 10.8 1 Rear track 858.5 mm Right front hub 4.5 2 Center of gravity height 344.7 mm Right front wheel 10.8 1
Front/rear weight distribution
49%/51% Total 243.2 15
Constraint Number DOF Front suspension tie
rods 2 -2
Four-wheel drive
2 -2
Total 4 -4 Total number of degrees-of-freedom 11
The exterior contact geometry of the ATV was modeled with ellipsoids and hyper-ellipsoids as illustrated in Figure 2.25 Contacts between the ATV and rider and ground were modeled by force-deflection characteristics based on various measurements,
25 Some of the exterior geometry for the TRX 350 was adapted from an existing MADYMO model of the TRX 350 developed by MUARC (Rechnitzer et al. (2003)).

43
estimates and assumptions. Overall, the predictive capability of the model was verified using the full-scale tests that are described in Section III.C.2.a.iii.
3) ROPS/CPD models
The ATB simulations included models of the ROPS/CPD designs illustrated in Figure 2.

44
Baseline ATV Dahle ROPS Johnson ROPS
NZ T-bar ROPS HSE U-bar ROPS MUARC ROPS
Quadbar
Figure 3. Model of ATV with and without ROPS/CPD
The ATB model of the Dahle-type ROPS, which comprised a ROPS structure and a waist belt restraint system, was developed based on information in Dahle (1987) and Piziali et al. (1993). The 3 degrees-of-freedom bending characteristics of the Dahle-type ROPS about its attachment points were assumed to be the same as those of the MUARC ROPS model. The restraint system consisted of a belt that was secured to the rider’s upper hips and attached to the ATV with three tethers located to the front of the rider, and to the left and right sides of the rider’s back. These tethers were simulated using springs with non-linear force-deflection functions, which modeled the initial slack in the belt, but generally restrained the rider’s buttocks to be in contact with the ATV seat.

45
The model of the Johnson-type ROPS, which comprised a ROPS structure, a 4-point belt restraint system, and modified ATV wheelbase, track, and seat height, was developed based on information in Johnson et al. (1991) and Piziali et al. (1994). Since the Johnson ROPS was fitted to a TRX 250, the changes for the Johnson ROPS configuration were proportionately scaled to TRX 350 values based on the relative wheelbase, track, and weight of the original ATVs. It was assumed that the Johnson ROPS was sufficiently stiff that it would not bend or absorb energy during overturn. An initial amount of belt slack was provided.
The model of the NZ T-bar CPD was developed based on a “Quadrop” CPD fitted to a Honda TRX (as in Quadrop, (1997)) and New Zealand ROPS guidelines (OSHS (1997)), which at the time of their publication were intended to provide minimum strength and energy absorption guidelines for anyone choosing to fit such a device to their ATV. The T-bar CPD was modeled by 2 ATB segments attached to the ATV frame in series with 2 angular degrees-of-freedom each, in order to model potential CPD bending and energy absorption. The additional intermediate segment was needed in order to obtain the force-deflection characteristics that were measured in laboratory tests, as illustrated in Appendix E.
The model of the U-bar CPD was developed based on a U-bar fitted to a Honda TRX 400. The U-bar was designed based on information and guidelines in Allinson (1996) and Allinson et al. (1997). The force-deflection characteristics of the CPD were scaled to a TRX 350 values based on the mass ratio of the original ATVs, as illustrated in Appendix E.
The ATB model of the MUARC ROPS, which comprised a ROPS structure, seat back with side bolsters, and seat belts fitted to a Honda TRX350 ATV, was developed based on a design and MADYMO model from the Monash University Accident Research Centre as described by Rechnitzer et al. (2003). The seat belts comprised a conventional three point belt with a second crossover torso belt. The ELR retractor for each of these two belts was assumed to be locked at the beginning of each simulation, with 1 inch of slack, representing a best case condition for the functioning of the restraint system.
The ATB version of the MUARC ROPS model that was used for this analysis was translated from a MADYMO model provided by MUARC. The ROPS model represents a structure of 25 x 50 x 2.5 mm thickness steel tubing of rectangular cross section attached

46
at four points to the ATV chassis, with a mass of 43.1 kg. The bending stiffness and strength of the ROPS was modeled based on off-line finite element model simulations of the MUARC design. Three degrees of rotational freedom were included in the ATB model to represent bending and energy absorption quantified by means of the FE simulation model.
The ATB model of the Quadbar CPD consisted of two (i.e., upper and lower) segments with a bendable joint connecting the segments. This allowed for structural compliance to be modeled in the CPD. Measurements taken directly from a physical prototype of the device were used to develop models of the Quadbar. Lateral and longitudinal bending characteristics were modeled based on laboratory test data described by Sulman et al. (2007) comprising measured force-deflection characteristics, as illustrated in Appendix E. The two bottom members of the CPD were attached to the ATV swing arm-axle assembly via a pin joint. A sliding joint, present in the prototype device in the form of a U-bolt capturing each vertical member of the CPD aft of the rear cargo rack, was modeled by the use of a very stiff, critically damped (i.e., damping ratio = 1.0)26 spring acting to constrain the longitudinal motion of the CPD relative to the ATV. The spring attachment point was located at the height of the rear cargo rack in the plane of symmetry of the vehicle. It was also assumed that there was negligible friction acting in the sliding direction.
An additional feature of the Quadbar model included friction and force-deflection characteristics for the contact between the CPD (in the region of the elbow bend) and the ground, in order to model sliding on and penetrating into the soil, in the event of a rear overturn.
ii. ATV Overturn Events
The effect of each of the ROPS/CPDs on predicted rider injuries was calculated using simulations of the 113 general “types” of overturn events. In all of the baseline overturn types, the ATV either overturned or tipped ejecting the rider.
26 A critically damped spring was used so as to avoid oscillations that otherwise would be present in such a spring coupling.

47
1) 113 UK/US Misuse Cases
The 113 general “types” of overturn events were developed based on 59 cases from the UK Health and Safety Executive (HSE) and 54 cases from the US Consumer Product Safety Commission (CPSC) involving ATV misuse as described in HSE (1996) and CPSC (1997).
The 59 UK HSE cases were selected from a larger set of 105 incidents based on whether their narrative descriptions indicated that the ATV overturned, flipped, somersaulted, or toppled. In some cases, the overturn or topple was not explicitly noted in the narratives, but was assumed if, for example, the narrative indicated the ATV “landed” on the rider.
For simulation purposes the overturn events were described by a set of initial conditions and other parameters describing the ATV, rider, and ground terrain as listed in Appendix E of Zellner et al. (2004). The simulated ground terrains and obstacles are illustrated in Figure 3 where the ground terrain type, slope, and parameters d1, d2, and h are case-dependent parameters. Values for these parameters were based either on those values explicitly mentioned in the case file; or else on assumed plausible values which were otherwise consistent (i.e., not inconsistent) with the description of the overturn precipitating event in the associated case file.27
The previous simulations and risk/benefit analyses were based on 113 general “types” of overturn events. The method used to define each general “type” of (as contrasted with the specific) overturn event was based on taking the information in each baseline ATV accident case file, coding the known variables using a set of assumed, plausible conventions, and then making systematic, plausible assumptions regarding the remaining unknown (i.e., missing) variables needed to define an ATV overturn event, as described in Appendix B. This method, while obviously based on a set of systematic assumptions, cannot reconstruct specific accidents, for which a very large number of additional variables would need to be known. In addition, the outcome of each general “type” of overturn so identified can exhibit substantial sensitivity to changes in initial 27 The ground terrain models represented the assumed effective ground terrain in the near vicinity of the overturn event (e.g., locally linearized ground planes) and the 3 sec simulation epoch in Van Auken et al. (1998). More complex ground terrains and features would require additional parameters to describe and to model, which are usually unknown from the case files and which would likely require an on-scene inspection to obtain.

48
conditions. Therefore, systematic variation of the initial conditions (i.e., of the plausible conventions and assumptions) associated with each of the 113 general “types” of overturn events was undertaken, in order to include the effects of variation in initial conditions, to reduce the sensitivity of the overall outcome to the exact conditions used in each type of overturn, and to increase the sample size.
2) Variation in Overturn Events
As noted, for each of the 113 general “types” of overturn event, six additional overturn events were simulated by introducing minor variations in the initial conditions. This was done to reduce potential oversensitivity of the outcomes to the details of the individual events and in order to increase the number of statistical degrees-of-freedom in the risk/benefit analysis.
0 – Sloped
1 – Four Slope Ditch or
Embankment 2 – Rutted Road
4 – Pothole
Symmetric Obstacle
3 – Curb or Adjacent
Field 5 – Ramp
11 – Tilted,
Folded Ground Plane
Asymmetric Obstacle
7 – Periodic Bumps
Figure 4. Simulated Ground Terrain Types and Obstacles
This was accomplished by varying the overturn event parameters listed in Appendix E of Zellner et al. (2004) according to the priority and conditions indicated in Table 4, until six additional overturn events were obtained. The number of additional runs was
d 1
d 2
d 1 2 d

49
chosen to be a fixed value of six in order to uniformly represent variations about each of the 113 original types of overturn event. The amount of variation in each of the parameters was chosen to be relatively small, but large enough to result in variation in the ATV and dummy motions and estimated injuries. The result was a total of 791 overturn events.
Table 4. Overturn Event Variation Scheme Priority Description Condition Parameter Variation Additional
Runs 1 Steering Steer Torque ≠ 0 Steer Torque ± 5% 0 or 2 1 Braking Brake Torque ≠ 0 Brake Torque ± 5% 0 or 2 1 Speed U ≠ 0 or V ≠ 0a) U ± 5%, V ± 5% 0 or 2 2 Obstacle As needed, 0 < h <
1m h ± 5% 0 or 2
3 Heading As needed, Slope Angle
ATV Heading ± 5 deg
0 or 2
4 Rider lean As needed Torso Pitch ± 2 deg 0 or 2 Total 6
a U denotes forward speed, V denotes lateral speed.
iii. Calibration Against Full-Scale ATV Overturn Tests
The ATB models of the MATD, ATV (in this case, a TRX 400) with and without ROPS/CPD was calibrated in 1998 by means of 12 full scale tests, each involving an ATV overturn, as described in Van Auken et al. (1998). As noted previously, although the analysis of the ROPS/CPDs reported herein was done with the TRX 350, both the TRX 350 and TRX 400 have been used as the basis for various simulation models. Since an earlier simulation analysis of the T-bar and U-bar CPDs had been done with a Honda TRX 400, the latter ATV along with these two CPDs was used for both the full-scale tests and for the simulation model, for the purposes of calibration. The primary purpose of the calibration was to verify and to refine as needed the dynamic force-deflection characteristics between the ATV, the ROPS, the soil and the dummy. These dynamic force-deflection characteristics are relatively independent of the ATV used, and are applicable to either the TRX 350 or TRX 400. Moreover, these two ATV’s are very similar in design, in any case. The full-scale tests comprised four overturn events, each involving a different type of overturn, and each involving a baseline ATV and a CPD

50
ATV configuration, as illustrated in Figure 4 and Table 5. Each test was filmed with high speed cameras and electronic data recorded within the ISO 13232 MATD dummy.
Figure 5. Example Full-Scale Tests and Corresponding Computer Simulations
Table 5. Full Scale Tests Test Condition
Ground Slope
Initial Speed
Rider (MATD)
ROPS HSE Misuse Case
Number of Tests
Cross Slope 45 deg 0 Unhelmeted U-bar T-bar
62 3
Uphill with step wide open throttle
45 deg 2 mph Unhelmeted U-bar (x2)
17, 59 3
Large steer input at higher speed
Level 30 mph Helmeted U-bar T-bar
94 3
Locked wheel braking while travelling over 6 inch semi-cylindrical bump at high speed
Level 30 mph Helmeted U-bar (x2)
74 3
For each test, the motions of the dummy, ATV and CPD were numerically correlated with the motions predicted by the ATB simulation. This was accomplished by digitizing various points on the dummy, ATV and CPD using a sequence of frames from the high speed films of the test and comparing these values to corresponding values from

51
the computer simulation.28 For example, Figure 6 illustrates the motion of several points in the film plane of camera 1 in test 97101612, a cross slope with U-bar. The dashed lines illustrate the motion of each digitized point over time, and the solid lines illustrate the corresponding motion of the simulated point as it would appear in the film plane. The curves representing the digitized and simulated points are connected by lines at every 5 film frames (approximately 0.033 sec). In this example the correlation and model efficiency figure-of-merit between the digitized and simulated points was 2
0R = 0.98,29 which indicated that the simulation and full-scale test are in very close agreement. Correlation and model efficiency figure-of-merit results for each of the tests and camera views are summarized in Appendix F. Overall the average correlation and model efficiency figure-of-merit for the 12 tests and available camera views was 2
0R = 0.91,
28 The ground terrains in these simulations were modeled by "planes" representing the effective locally linear ground terrain in the vicinity of the test location. The "planes" used in the simulation model are not intended to be representative of the overall ground terrain and features farther away from the immediate test location, or of small surface irregularities. 29 The correlation and model efficiency figure-of-merit was computed according to the following equation (Van Auken et al. (1998))
0,
20 1
tot
resSSSS
R −=
where for this film-plane analysis
)y-y( + )x-x( =SS
)y-y( + )x-x( = SS
2j,kj,
2j,kj,
N
1=k
N
1=jtot
2kj,kj,
2kj,kj,
N
1=k
N
1=jres
000,framepoint
framepointˆˆ
∑∑
∑∑
and where
x kj, and y kj, are the digitized film plane coordinates of point j for film frame k,
x kj,ˆ and y kj,ˆ are the computer simulation predictions of points x kj, and y kj, ,
x j,0 and y j,0 are initial film values for points x kj, and y kj, ,
N point is the number of digitized points, and
N frame is the number of digitized frames. This figure-of-merit is similar to the Nash-Sutcliffe model efficiency “E’ and the correlation factor “C” in ISO 13232-7 clause 4.5.4, and a generalization of the linear regression coefficient of multiple determination
to all models, with the exception that the 0,totSS term quantifies the variation in the observed data relative to the initial film point values and not relative to the mean film point values. Note that unlike Pearson’s correlation coefficient, this figure-of-merit is sensitive to differences in the mean offset and slope as well as overall fit (i.e., it tests for differences in the values from the line y=x, not y=a+bx).

52
indicating a relatively high level of correlation and close agreement between the tests and the simulations.
Figure 6. Example Correlation Between Full-Scale Test and Computer Simulation (Test 97101612)
b. Results of Previous Injury Risk/Benefit Analysis
For the baseline ATV and for each of the ROPS/CPDs, computer simulations were run for each of the 113 overturn events x (1 nominal + 6 perturbations) x 2 (or 4) use/misuse configurations. The latter comprised helmet versus unhelmeted (for all ATV configurations), and belted versus unbelted (for those vehicle configurations fitted with belts). The outputs of the simulations were time histories of all relevant dummy and ATV motions and forces; and based on this, Injury Assessment Values (IAVs) and other injury indices for each simulated overturn event.
i. Injury Risk/Benefit Results
The injury risks and benefits of the proposed ROPS/CPDs were calculated based on ISO 13232-5 (2005) for both helmeted and unhelmeted dummies (and also including skull fracture for the unhelmeted dummy). Example results for the T-bar ROPS/CPD are illustrated in Figure 7 for a dummy with and without a helmet. The risks and benefits of the Dahle, Johnson, and MUARC ROPS/CPD were calculated with and without rider belt
53
use. In each of these figures, the length of the green bar is the average benefit (i.e., the total summed injury benefit resulting from fitting the ROPS/CPD divided by the total number of overturn events), the length of the red bar is the average risk, and the vertical blue line is the average net benefit per accident (i.e., simulated overturn). The horizontal blue line represents the 95% confidence interval for the average net benefit per accident,30 representing the uncertainty in this estimate due to the observed variation in the change in ICnorm due to the ROPS/CPD and the number of runs.
The risk/benefit percentage point estimates and 95% confidence intervals31 in square brackets [ ] are also indicated on Figure 7. Whenever the 95% confidence interval for risk/benefit percentage includes 100%, it is considered that the risk/benefit percentage is not statistically significantly different from 100% (i.e., wherein the risk is equal to the benefit), or in other words, there is no statistically significant net benefit.32 In addition, guidelines in Annex E of ISO 13232-5 (2005) indicate that the risk/benefit percentage of protective devices “should be less than seven percent and should not be more than 12 percent.”
30 The average net benefit per accident is ∑=
∆=∆N
kkx
Nx
1
1, where x∆ is the change in the injury index
value (protective device – baseline) as specified in ISO 13232-5. The 95% confidence interval for the x∆ is
CIxx %95∆±∆ , where Nstx xNCI ∆−=∆ 025.0,1%95 , ( )∑=
∆ ∆−∆−
=N
kkx xx
Ns
1
22
11
, and
96.1lim 025.0,1 ≈−∞→ NNt .This confidence interval is based on the assumption that each of the N changes in the
injury index value is independently and identically distributed, which may not be valid if the N cases comprise multiple (e.g., 7) variations of the (e.g., 113) different overturn types. In this case this confidence interval may underestimate the magnitude of the uncertainty in the results. See Appendix J for a more general expression for the confidence interval that takes into account changes based on multiple variations of the overturns. 31 The 95% confidence intervals for the Risk/Benefit percentages were estimated by replacing the values for x∆ with
CIxx %95∆±∆ in the risk/benefit calculation procedure specified in clause 5.9.4.2 of ISO 13232-5. 32 The risk/benefit percentage equaling 100% is mathematically equivalent to a statement that the risk is equal to the benefit, or the net benefit is equal to zero.

54
Helmeted Dummy Unhelmeted Dummy
Figure 7. Estimated Risk and Benefit of the T-bar CPD (Unbelted Dummy)
The 2008 risk/benefit results for the previously analyzed ROPS/CPDs are summarized in Table 6. In all cases it was found that either the ROPS/CPD had no statistically significant net injury benefit (i.e., the injury risks from the device were approximately equal in magnitude to the injury benefits from the device), or if there was a ROPS/CPD net benefit, then the ROPS/CPD risk/benefit percentage was much greater than the ISO 13232-5 guideline value of 12%. This was found for all six ROPS/CPDs, for both helmeted and unhelmeted cases, and for all body regions, as well as for the total injury cost, ICnorm. For the Quadbar in particular, it was found that the device had no statistically significant net injury benefit (i.e., the injury risks from the device were approximately equal to the injury benefits).
-0.4 -0.3 -0.2 -0.1 0 0.1 0.2 0.3 0.4
ICnorm 107% [83%,137%] ICnorm,head 97% [74%,128%]
ICnorm,neck 96% [67%,138%] ICnorm,chest 88% [42%,196%]
ICnorm,abdomen 85% [65%,113%] ICnorm,femurs 91% [68%,126%]
ICnorm,knees 97% [70%,135%] ICnorm,tibias 118% [80%,166%]
-Average Risk Average Benefit Risk/Benefit %
Average Net Benefit
-0.4 -0.3 -0.2 -0.1 0 0.1 0.2 0.3 0.4
ICnorm 66% [53%,83%] ICnorm,head 63% [50%,80%] ICnorm,face 132% [101%,169%] ICnorm,neck 128% [69%,223%] ICnorm,chest 56% [35%,109%] ICnorm,abdomen 62% [47%,81%] ICnorm,femurs 86% [65%,118%] ICnorm,knees 113% [79%,157%] ICnorm,tibias 128% [87%,177%]
-Average Risk Average Benefit Risk/Benefit %
Average Net Benefit

55
Table 6. Summary of Previous ICnorm Risk/Benefit Percentage Results for ROPS/CPDs Device Device with Helmeted Dummy versus
Baseline with Helmeted Dummy* Device with Unhelmeted Dummy versus
Baseline with Unhelmeted Dummy Belted Unbelted Belted Unbelted
ROPS Dahle 87%a [69%,110%]b 127% [99%,161%] 70% [57%,88%] 111% [90%, 136%] Johnson 50% [39%,66%] 151% [118%,191%] 38% [30%,50%] 96% [78%,118%] MUARC 174% [135%,220%] 147% [116%,184%] 74% [60%,92%] 142% [115%,174%]
CPDs T-bar Not applicable 107% [83%,137%] Not Applicable 66% [53%,83%] U-bar Not applicable 95% [74%,122%] Not applicable 91% [73%,113%] Quadbar Not applicable 99% [53%, 192%] Not applicable 71% [41%, 137%]
a % value indicates risk/benefit percentage. % value greater than 100% indicates that injury risks are greater than injury benefits.
b Values in square brackets [ ] indicate the 95% confidence interval. Values are statistically significant at the 5% level of significance if the 95% confidence interval does not include 100%. Statistically significant results are in bold font; statistically insignificant results are in gray font.
* The baseline ATV with helmeted rider represents the intended use of the vehicle as defined by manufacturers and as required in warning labels under US law.
ii. ROPS/CPD Injury Mechanisms
Graphical animations and associated time histories of ATV and dummy forces and motions enabled accident injury mechanisms for this large array of simulations to be analyzed. Though not statistically analyzed in this regard, it was observed in the previous simulations that in general, ROPS/CPD-related injuries were associated with impacts between the dummy and the ROPS/CPD, and the dummy being caught between the ROPS/CPD and ground. In addition, for ROPS/CPDs without restraints (e.g., T-bar, U-bar, Quadbar, and all ROPS when unbelted), the ROPS/CPD impeded rapid separation from the vehicle (as tended to occur with the baseline ATV) and this resulted in an increased number and duration of ATV-to-dummy and ROPS/CPD-to-dummy impacts. In addition, for fully or tightly restrained ROPS (i.e., MUARC ROPS), there was an increase in non-head impact head g’s and associated brain injury, most likely due to the dummy being restrained in a tumbling, low mass vehicle, which did not occur with the baseline ATV.
iii. Conclusions of the Previous Injury Risk/Benefit Analyses
Based on Table 5, the overall conclusions from the Munoz et al. (2007) and Zellner et al. (2008) results were that:

56
− All of the devices evaluated were found to have unacceptably high injury risks in comparison to injury benefits (in comparison to the guideline in ISO 13232 (2005), i.e., the “risk/benefit percentages” were all far greater than the “less than 7 percent and ... not... more than 12 percent” guideline indicated in International Standard ISO 13232 (2005) which is stated therein to be “[b]ased on the results for automobile seat belts (7 percent) based on Malliaris, et al., 1982, as described by Rogers, [et al.] 199[8], which is presumed to be an acceptable risk/benefit percentage; and the results for pre-1998 automobile passenger airbags (12 percent), based on Iijima, et al., 1998, which is presumed to be an unacceptable risk/benefit percentage;”33
− In addition, some devices either had greater injury risks than injury benefits (e.g., MUARC ROPS), or else had no statistically significant “net injury benefits” (e.g., U-bar and Quadbar).34
In regard to the “unacceptably high injury risk” observed with all of the ROPS/CPDs evaluated on this class of vehicle, as discussed by, for example, Thompson et al. (2001), “risk/benefit percentages” that are more than some acceptably small value violate the “first do no harm” principle of health and safety interventions (as has been recognized for many years in the approval process for medical devices, pharmaceuticals and surgical procedures). Automotive safety devices such as safety belts and head restraints (as reported by Malliaris et al. (1982) as reported by Rogers et al. (1998) and driver airbags (as reported in Iijima et al. (1998)) have risk/benefit percentages less than 7%. Devices such as US first generation (fully powered) light passenger vehicle airbags (which in some circumstances have been reported to fatally injure small front passenger occupants)
33 ISO 13232-5, Annex E. 34 Note that the numerical value of the “net injury benefit” cannot be calculated from the numerical value of the “risk/benefit percentage” alone. However, it can be concluded that if the “risk/benefit percentage” is not statistically significantly different from 100%, then the “net injury benefit” is also not statistically significantly different from zero, i.e., there is no statistically significant “net injury benefit.”

57
were reported to have larger risk/benefit percentages for front seat passengers.35Although for the latter devices, the risk/benefit percentage was not a formal part of the regulatory analysis, a series of near term and longer term Federal measures were implemented in order to reduce the injury risks to front passengers from such devices.
1) Recommendations Based on the Previous Injury Risk/Benefit Analysis
Based on these results, and previous research, Zellner et al. (2008) recommended that ROPS/CPD devices should not be fitted to ATVs. Helmets as a protective device have been found to be far more effective for ATV users (e.g., Rodgers, 1990), and have not been found to increase injury risks.
Zellner et al. (2008) further recommended that avoiding (rather than adding) rigid external projections on ATVs is an important priority for increasing ATV safety. The authors stated that the results reported were significant for the design and planning of ATV rider protection strategies and for ATV design engineering.
35 For example, from the 1997 NHTSA Airbag Depowering Notice of Proposed Rule Making, "Finally, the ratio of lives saved by air bags to persons fatally injured is very different for driver air bags than passenger air bags. Driver air bags are estimated to have saved 1500 lives, as compared to 19 persons fatally injured [i.e., a risk/benefit percentage of 1.3%]. Passenger air bags are estimated to have saved 164 lives, as compared to 32 persons fatally injured [i.e., a risk/benefit percentage of 19.5%]"(62 FR 807, "Federal Motor Vehicle Safety Standards; Occupant Crash Protection, Notice of Proposed Rulemaking," National Highway Traffic Safety Administration, DOT, Docket No. 74-14; Notice 108, Section V.C.3, Paragraph 10, Page 823, Column 3, Line 29, January 6, 1997). However, note that although the ratio (of saved to injured) is mentioned, the risk/benefit ratio (or risk/benefit percentage) for quantifying the effects of airbags on children was not part of the formal regulatory analysis used by the NHTSA, for which NHTSA states "In confronting the possibility of inevitable short-term safety tradeoffs between young children and unbelted occupants over 12 years of age, the agency believes that greater weight must be placed on protecting young children. NHTSA has always given a high priority to protecting children and accordingly has applied these different cost-benefit [emphasis added] considerations to its rulemaking affecting children."(62 FR 12960, "Federal Motor Vehicle Safety Standards; Occupant Crash Protection, Final Rule," National Highway Traffic Safety Administration, DOT, Docket No. 74-14; Notice 114, Section V.A, Paragraph 14, Pages 12964-12965, Column 3, Line 58, March 19, 1997).

58
Section IV UPDATED INJURY RISK/BENEFIT ANALYSIS OF THE QUADBAR CPD
A. METHODOLOGY UPDATES, EXTENSIONS AND REFINEMENTS
Subsequent to the previous injury risk/benefit analysis of the Quadbar reported by Munoz et al. (2007), a series of updates, extensions and refinements to the methodology were identified and implemented in an updated analysis, and these are described subsequently.
1. “Low Energy” US and UK Overturn “Types”
As described in Section III.B, the previous simulations and risk/benefit analyses were based on 113 general “types” of overturn events based on US and UK accident case information. The method used to define the general “type” of (and not the specific) overturn that occurred in each accident was based on reviewing the information in each ATV case file, coding the relevant variables that were known based on information in the case file using a series of assumed conventions, and then making plausible assumptions regarding the remaining unknown variables needed to define an ATV overturn event that occurred within the scope of an assumed 3 sec simulation epoch,36 as described in Appendix B.
It was observed that in some of the baseline ATV “types” of overturn that were defined using this method, the level of kinetic energy (e.g., initial speed) plus potential energy (i.e., slope, slope length, obstacle height, etc.) was relatively high. Further consideration of the details involved in the previous methodology led to the conclusion that this was due, in part, to systematically assuming “plausible” values for unknown variables in such a way that an “overturn definitely occurred,” with no other constraints regarding the outcomes of this (e.g., the number of rolls that ensued, the distance rolled, etc.) after the initial 3 sec. This situation led in turn to the question of whether the overall
36 Some overturn types based on some of the US CPSC cases were originally developed for an assumed 4.5 sec simulation epoch. The other overturn types based on the other UK HSE and US CPSC cases were originally developed for an assumed 3.0 sec. The run length has a large effect on computational time, and it was desirable to minimize the latter, given the typical computer computational speeds available circa 2000.

59
risk/benefit outcomes were influenced by these relatively “high energy” (i.e., high number of multiple roll) overturns.
In order to address this, and as a type of sensitivity analysis, each of the ATV overturn cases was re-defined, this time using a systematic “low energy” approach, as outlined in Appendix C. In essence, given the known variables, values for the unknown values (e.g., speed, slope, obstacle height) were systematically varied, such that that a simulated overturn “barely” occurred as a result of the initial conditions, with the baseline ATV. In this way, 11037 types of overturn were defined which corresponded to “low energy” ATV overturns, given the assumed values for the known variables based on each case file. Another key change used in this “low energy” approach was to define a horizontal plane 3 meters below the initial position of the ATV. The purpose of this plane was to limit the number of rolls and total travel of the ATV and dummy down steeply sloped terrain.
The resulting redefined 110 “types” of “low energy” overturns involve substantially lower kinetic and potential energy levels, resulting in a substantially fewer number of rolls and total distance traveled by the dummy and ATV following overturn. By way of comparison, in the original “high energy” overturn types, the dummy’s final kinetic energy (at the end of the simulation run) was less than 1% of its initial kinetic energy (i.e., it was virtually at rest) in 59% of the baseline ATV overturns; whereas in the “low energy” overturn types, the dummy’s final kinetic energy was less than 1% of its initial kinetic energy in 99% of the baseline ATV overturns. Similarly, in the original “high energy” overturn types, the ATV’s final kinetic energy was less than 1% of its initial kinetic energy in only 29% of the baseline ATV overturns; whereas in the “low energy” overturn types, the ATV’s final kinetic energy was less than 1% of its initial kinetic energy in 55% of the baseline ATV overturns. Note that in both the “high energy” and the “low energy” overturns, the situations in which the final ATV kinetic energy was greater than 1% of its initial kinetic energy were often due to terminal rolling of the ATV away from the dummy which would have no effect on the injury evaluation, and in the “high energy” overturns, the use of very long slopes (due to lack of any information concerning slope length in the case files and due to extrapolating the slopes beyond the originally developed simulation epoch in order to avoid any encounters with a “cliff” at
37 See footnote 17 on page 16.

60
the end of the slope), which were eliminated in the “low energy” overturns, which all had terminal, level slopes.
In addition, in the original “high energy” baseline ATV simulations, the final separation distance between dummy and baseline ATV at the end of the runs was less than 1.5 m (4.9 ft) in 18% of the runs. In the “low energy” baseline ATV simulations, the final separation distance between dummy and baseline ATV at the end of the runs was less than 1.5 m (4.9 ft) in 27% of the runs. This indicates that as the overturn energy was reduced, the dummy tended to stay in closer proximity to the ATV. This may increase the potential for entrapment beneath the ATV.
2. Inclusion of Preliminary Potential Mechanical/Traumatic (Compressive) Traumatic Asphyxia (i.e., Breathing Difficulty) Criterion
Although asphyxia of any type appears to be relatively rare in US and UK ATV accidents,38 the diverse mechanisms of asphyxia are nonetheless of potential interest in protective device evaluation.
As summarized by Smith et al. (2011), based on the proposed classification scheme of Sauvageau et al. (2010), there are nine types of asphyxia that may occur in a forensic context. Only one of these – mechanical/traumatic (compressive) asphyxia -might involve a hypothetical situation in which an ATV could overturn and come to rest on a rider in such a manner that it could potentially restrict respiratory movements over some extended time period.
The reported frequency of all types of “asphyxia” in Australian ATV accidents has been inferred by Lower et al. (2010) to be much more frequent (e.g., 25% of all fatal
38 For example, 3 of the 113 US and UK cases that were considered in the current analysis were reported to involve some form of asphyxia; two of those involving children, and one involving an adult with high (i.e., over 0.12%) blood alcohol level in which the vehicle tire came to rest on his face, i.e., asphyxiation by suffocation. It is unclear how many of these US and UK sample cases, if any, specifically involved mechanical/traumatic (compressive) asphyxia. As another example, US CPSC fatality data some cases among which recorded cause of death at a more detailed level, indicate that mechanical/traumatic (compressive) asphyxia in combination with pinning beneath the ATV was recorded at a rate of approximately 1.2% among 2,977 US ATV fatalities that occurred during 2005 through 2009 (Anon., “2009 Public Release of the All-Terrain Vehicles Deaths (ATVD) Database” Consumer Product Safety Commission (US), Bethesda, Maryland, December 2010).

61
cases)39 than “mechanical/traumatic (compressive) asphyxia” associated with being pinned beneath the vehicle in US ATV fatal accidents (i.e., 1.2%).38 The previous simulations and risk/benefit analyses did not include potential for mechanical/traumatic (compressive) asphyxia that hypothetically could occur if an ATV or ROPS/CPD came to rest on a rider’s thorax.
Nevertheless, in an exploratory way, a preliminary potential mechanical/traumatic (compressive) asphyxia criterion – or more specifically a criterion for potential “significant breathing difficulty beyond 1 hour” – was considered, preliminarily developed and applied in the current research. This preliminary potential “significant breathing difficulty beyond 1 hour” criterion was based on a review of the literature, a biomechanics pilot test with two adult male volunteers and an analysis of the final (at rest) chest compressive forces observed in the baseline ATV overturn simulations in instances where there was no final contact between the adult male dummy and the ATV.
As described by Smith et al. (2011), tolerance levels for steady state chest compression force found in the literature vary widely and are highly duration dependent, and also depend on outcome, e.g., voluntary tolerance, loss of consciousness, death, etc. The levels of steady state chest compression force reported by:
− McKenzie (2005) in estimates made of early prisoner torture methods were survivable for up to 63 minutes at a force level of 1615 N (363 lb);
− Brierman et al. (1946) for Army soldiers, tests were tolerable for up to 80 seconds at a force level of 2448 N (550 lb);
− Smith et al. (1995) for standing adults applied with a 150 mm (5.9 inch) diameter plate were tolerable for up to 30 seconds at a force level of 249 N (56 lb); and for University of Surrey students back frame pull tests were tolerable for an unreported time period at a force level of 418 N (94 lb);
39 Another source, Clapperton, et al (2013) reports that 0.2% (i.e., n=3) of a Victorian 8 year census of n=1,601 fatal, hospital admission and non-admitted emergency department presentations associated with ATV accidents involved traumatic asphyxiation. Of the fatalities, Clapperton, et al (2013) reports that 16% (n=3 out of n=19 fatalities) involved traumatic asphyxiation.

62
− Hopkins et al. (1993) for estimating crowd crush phenomena suggests loss of consciousness at 60 minutes at a force level of 1980 N (445 lb); and death at 60 minutes at a force level of 2225 N (500 lb); as well as approximate tolerance curves for loss of consciousness and fatality extrapolated to shorter and longer durations (Figure 8).
Figure 8. Estimate of Human Tolerance to Mechanical Asphyxia With Fatal and Survival Data (source: Hopkins et al. 1993)
The accuracy of all of the foregoing results, however, may have been substantially limited by lack of sensors (e.g., in the cases of prisoner torture and crowd crush phenomena) and/or lack of accurate sensors and force application apparatus and methods in general.
As can be observed in the tolerance curves suggested by Hopkins et al. (1993), the force levels for loss of consciousness and death are relatively greater for short durations, and then decrease and tend to level out at durations greater than about 30 minutes.
In an effort to estimate the maximum chest compression force level that adult human volunteer subjects might report as being tolerable for “many hours,” a simple pilot
0
1
2
3
4
5
6
7
8
9
10
0 10 20 30 40 50 60 70 80 90 100
Forc
e A
pplie
d to
Tor
so (kN
)
Time (min)
Loss of consciousnessDeathFatal Data from various sourcesSurvival data from various sources
[0.5]
[2.0 thousand lbf]]
[1.0]
[1.5]
[0]

63
test involving two adult male subjects was conducted, as reported in Smith et al. (2011). Both of the pilot test subjects reported that they would be able to withstand a 223 N (50 lb) force for “many hours”; and both subjects reported that a 445 N (100 lb) force could present some breathing difficulty after an extended period of time (i.e., “many hours”).
In addition, further examination of the distribution of steady state chest compression forces that existed at the end of each of the 770 baseline ATV 10 second overturn simulation runs for only those cases in which the rider was not in contact with the ATV at the end of the 10 second run, indicated that the chest compression force (i.e., with the dummy lying on the ground) ranged between 0 N (0 lb) and 463 N (104 lb) (i.e., depending on the dummy position relative to the ATV, and its posture and orientation, after it came to rest).
Based on the assumption that mechanical/traumatic (compressive) asphyxia would not occur with a healthy individual merely lying on the ground at any orientation (e.g., prone, supine, etc.) with no contact by the vehicle - a situation which in the simulations produced a chest compression force as large as 104 lb (463 N) - a conservative estimate for a chest compression force tolerance level for “significant breathing difficulty beyond 1 hr” – as related to potential mechanical/traumatic (compressive) asphyxia - was assumed to be slightly larger than this force, in particular, it was assumed to be 490 N (110 lb) for the purposes of the current analysis. In other words, it was assumed, based on the pilot tests with two volunteers and other data from the literature review, and on the data from the baseline ATV simulations, that final (at rest) chest compressive forces in excess of 490 N (110 lb) could present some breathing difficulty after an extended period of time (e.g., “many hours”).
Note that this preliminary potential chest compression force tolerance level is substantially lower than the loss of consciousness and death levels at 1 hour (of 1980 N (445 lb) and 2225 N (500 lb), respectively) proposed by Hopkins et al. (1993); and the survivable limit proposed of 1615 N (363 lb) at 63 minutes proposed by McKenzie et al. (2005).
Nevertheless, it is considered that the 490 N (110 lb) proposed compressive force level provides a conservative (i.e., low) tolerance level for there being some potential for

64
“significant breathing difficulty beyond 1 hr,” i.e., as might be relevant to assessing potential for hypothetical mechanical/traumatic (compressive) asphyxia phenomena.
3. Effect of Hand Grip Release Force
The previous simulations were based on a hand grip release force of 223 N (50 lb) per hand, which is the value of the hand grip release force in the physical MATD dummy specified in ISO 13232 (2005). This value is stated in the rationale to ISO 13232-3 to be generally sufficient to keep the physical dummy on a motorcycle while rolling forward under moderately rough (paved) test surface conditions.
Preliminary simulation runs with the preliminary asphyxia (i.e., breathing difficulty) criteria described in Section IV.C indicated that with this nominal hand grip release force, very few potential asphyxiations (i.e., potential “breathing difficulties beyond 1 hour”) occurred (i.e., 1.1% of the n = 770 Baseline ATV runs). Note that the very low number of occurrences was observed to be due the tendency of the dummy to separate from the ATV during overturns; and in the few cases where complete separation did not occur, and where the ATV came to rest on top of the dummy, the very small number of cases in which the compressive force on the chest exceeded 490 N (110 lb). The latter fact was due to a variety of factors, including the orientation of the dummy on the ground, the extent of "overlap" between the dummy and the ATV, and the proportion of the ATV weight that was supported by the ATV contact with the ground on the one hand, and by various portions of the dummy on the other hand.
In order to assess whether and the extent to which the predicted potential asphyxia (i.e., “breathing difficulty”) frequency might be influenced by hand grip release force, the baseline hand grip release force was varied so as to have values of zero times and 2 times this standard grip release force and, in addition, a force that was effectively, though an unrealistic extreme, a rigid attachment of each hand to the grip (i.e., 200 times the standard grip force).
When this was done, the baseline simulations indicated that 0.9% potential “breathing difficulties” occurred when the hand grip release force was reduced to zero, i.e., when potential separation of the passive dummy from the ATV was maximized; 2.0% potential “breathing difficulties” when the hand grip release force was increased to 2 times the normal level; and 4.7% potential “breathing difficulties” when the hand grip

65
release force was increased to 200 times the normal level. These results, along with review of the associated graphics animations, indicated that final (at rest) chest compressive forces corresponding to potential “breathing difficulties” occurred relatively rarely in the simulations with the baseline ATV, adult male MATD dummy and baseline 110 general “types” of ATV overturn; and that this frequency can be somewhat increased by the hand grip force being increased to very high levels (i.e., whereby the dummy stays attached to the ATV longer and has a somewhat greater chance of being caught under the ATV). Note that two times the standard grip force level is in the region of maximum grip strength for 50th percentile adult males, as reported by, e.g., Laubach et al. (1969). This fact, in addition to occasional occurrence of pre-overturn hand separation when the grip force was set to its nominal value of 223 N (50 lb), led to this value (i.e., 445 N (100 lb)) of hand grip force being used for all of the updated simulations.
4. Refinements of Other Methodology Details
This subsection describes updates to other simulations details, made since the Zellner et al. (2008) analysis.
a. Updated and Revised Injury Coding for US/UK cases
The previous simulations produced injury outcomes for each of the 113 general “types” of overturn, which were able to be compared (in terms of the distributions of injury locations, types and severities) to those of the 113 US/UK actual accidents. The latter injuries had been previously AIS-coded and reported in Zellner et al. (2004(b)).
On further consideration of the data, it was recognized that such type-by-case comparisons of specific injuries were not valid, not only because of the substantial dissimilarities in terms of human, vehicle, environment and accident factors between the actual cases and the general “types” of simulated overturns, as discussed in Sections II.A and B, but because of differences in the locations, types and severities of the coded injuries themselves, related to the limited range of these that are monitor-able with the ISO 13232 MATD (and any other) crash dummy.40
40 As discussed subsequently in Section IV.5.a and Appendix G, under certain assumptions, comparison of “aggregated” injury distributions can be valid, and are within the state-of-technology. Results reported in

66
Therefore, in order to provide for more (but not for complete) comparability of the simulated injury distributions to the actual injury distributions, the previous injury coding of the 113 US/UK actual accidents was reviewed in detail and revised so as: 1) to update the Abbreviated Injury Scale (AIS) coding to AIS-2005; and 2) to identify and include only those injury locations, types and severities that can be monitored using ISO 13232 (2005) methodologies, plus the proposed methodologies for monitoring for potential mechanical/traumatic (compressive) asphyxia, as discussed in Section IV.A.2, and for vault and face fractures as discussed in Section III.B.2, as together these comprised the range of injury locations, type and severities that were able to be addressed in the updated simulation analysis. Those injury locations, types and severities that were not monitor-able by the ISO 13232 MATD dummy were ignored in these updated codings, as they are not technologically feasible to monitor at the current time and therefore not relevant to this type of analysis. The results were reported in Zellner et al. (2011), summarized in Appendix A, and used in the injury distribution calibrations described in Appendix G.
b. Revised number of US/UK cases
In reviewing and updating the injury coding for the 113 US and UK ATV overturn cases, it was found that three of the US/UK cases involved off-road vehicles that on closer inspection may not have been ATVs.41 Therefore, these cases were removed from the samples, and the remaining 110 ATV cases were used as a basis for defining 110 general types of ATV overturn.
c. Brake, throttle, and steering release
The previous simulations were based on brake, throttle, and steering control inputs consistent (i.e., not in conflict) with the limited information contained in the accident case files used to develop the 110 general “types” of overturn, with the objective of generating a simulated ATV overturn. They are also consistent with what was done experimentally by means of radio-controlled servo-actuation of brake, throttle and steering inputs in the full-scale calibrations tests, as reported by Van Auken et al. (1998). In the previous simulations, the control inputs continued to be applied throughout the simulation sequence. However, occasionally, this resulted in unrealistic ATV motions because the
Appendix G indicate that the aggregated injury locations, types and severities compare closely between the simulated and actual injuries. 41 UK HSE cases 24, 25, and 76.

67
control inputs continued to be applied after the MATD dummy separated from the ATV. For example, if there was a throttle input to the ATV and the ATV rolled one complete revolution, the driven wheels would continue accelerating even though the dummy had been separated from the ATV during the rollover.
In order to address this issue, the simulation model was modified so that brake force inputs were automatically switched off when both hands were separated from both hand grips, throttle force inputs were switched off when the MATD’s right hand was separated from the right hand grip, and steering force inputs were switched off when both hands were separated from both hand grips. In a full-scale test, this would correspond to manually (i.e., via radio control) or automatically switching off the brake, throttle and steering inputs to the ATV when the respective dummy hand or hands separate(s) from the grips.
d. Helmeted and unhelmeted head force-deflection functions
Upon review of previous simulation results, the frequency of occurrence of head injuries predicted by the simulation was found to be higher than that recorded in the US/UK ATV accident samples. Further evaluation indicated that, while this could have been due to the differences between the modeled and the actual riders, vehicles, environments and conditions, in addition it could also be due to modeling details of the dummy head and helmet, in particular at larger helmet and head deflection levels.
The previous simulations were based on measured force-deflection functions for a helmeted head and for an unhelmeted head. The laboratory tests used to develop these functions only included deflections up to 19 mm (0.75 in) for the helmeted head and deflections up to 20 mm (0.78 in) for the unhelmeted head, with a maximum force occurring at 13 mm (0.50 in), as illustrated in Figure 9 of Van Auken et al. (2011). In the previous simulations, beyond these deflections, the force level for the helmeted head was assumed to remain at the force level corresponding to 19 mm (0.75 in) until the deflection reached 25 mm (1.0 in). Beyond that point, the force-deflection function was considered to “bottom out” against the relatively stiff dummy skull assumed to have a stiffness of 46.9 N/mm (5300 lb/in). For the unhelmeted head, the stiffness at deflections beyond 13 mm (0.5 in) was assumed to be 8.85 N/mm (1000 lb/in) but not to “bottom out” with higher stiffness.

68
Because of this disparity in the stiffness at higher deflection levels, in some very severe head impact conditions, the previous model of the helmeted head could have higher contact forces than an unhelmeted head at the same deflection level (resulting in higher head acceleration and potential for brain injury). To address this issue, both the helmeted and unhelmeted head stiffness functions were modified such that the “bottoming out” stiffness was assumed to be the same for both, albeit at different total deflection levels.
These refinements to the head and helmet force-deflection characteristics, as well as changes to the helmet/soil and head/soil friction coefficient discussed in the next sub-section, resulted in the simulated and actual head injury frequencies being in substantially closer agreement, as described in Appendix G.
e. Dummy/soil friction coefficients
In the previous analyses, the coefficients of friction between the MATD dummy and other contact surfaces had been set to an estimated value of 1.0, based on the dummy sliding motions observed in the DRI 1998 full-scale overturn tests. This high friction was attributed to possible snagging of the dummy clothing on ground surface irregularities and ground covering (e.g., dry brush). The dummy clothing was long sleeved close fitting thermal knit underwear specified in ISO 13232-6, which had a rough texture. However, because this estimated friction value might be higher than what might be the case for dummy-to-soil friction coefficients in general, where loose soil particles may reduce the effective friction, and where portions of the dummy are clothed or helmeted, a series of tests was conducted in order to measure the actual friction coefficients between the clothed dummy leg and soil, helmeted head and soil, and unhelmeted head and soil.
These tests indicated that on dry, compacted clayey soil, the coefficient of friction between the MATD upper leg - clothed with the underwear defined in ISO 13232 for full-scale testing - and the soil was approximately 0.6. Using the same test conditions, the coefficient of friction between an unhelmeted MATD head and the same dry, compacted clayey soil was approximately 0.5, and the coefficient of friction between a helmeted MATD head and the same dry, compacted clayey soil was approximately 0.4. The simulation models were subsequently revised to incorporate these values for the respective dummy body region-to-soil coefficients of friction.

69
f. Hand grip release force
The previous simulations were based on the ISO 13232 MATD dummy standard hand grip release force of 223 N (50 lb). However, it was noted that at this grip release force, in the 110 general “types” of overturn, the hands could occasionally release from the grips prematurely (e.g., following an obstacle encounter or sudden slope transition, before overturn was fully developed). Because of the revised brake, throttle, and steering release logic described previously in Section IV.A.4.c, releasing the hands from the grips terminates the control input, and in some of the types of overturn (or in some of the seven variations of each type of overturn), terminating the control inputs prematurely prevented the induced overturn of the ATV.
As previously discussed in Section IV.A.3, in order to prevent the premature release and resulting prevention of induced overturn, the grip strength level was increased to 445 N (100 lb). As previously noted, this level is still in the region of 50th percentile male grip strength limits as reported in, e.g., Laubach et al. (1969). Note that in view of the effects of grip strength on the likelihood of the rider being caught under the ATV and in a subset of the “caught” runs, predicted “breathing difficulty beyond 1 hour,” previously described in Section IV.A.3, this change tended to increase slightly the frequency of “breathing difficulty beyond 1 hour” predicted by the simulation model, i.e., from 1.1% to 2.0% of the overturn types.
g. Leg fracture strength
Upon review of previous simulation results, the frequency of occurrence of femur and tibia fractures predicted by the simulation was found to be higher than that recorded in the US/UK ATV accident samples. Further evaluation of the MATD femur and tibia design criteria and bone acceptance tests indicated that a higher fracture threshold in the computer simulations could be used while still providing a close match to the MATD bone fracture test data.
It was found that the simulation force threshold for MATD femur and tibia fractures could be increased by 40% and the calibration revised such that a close match between the component calibration simulation data and the MATD bone fracture test data was still attained. This had the effect of reducing the frequency of femur and tibia fractures, which

70
more closely matched the frequencies recorded in the accident samples, while still providing a close match to the MATD bone fracture test data.
h. Updated contact definitions
In the previous simulations, it had been observed that on rare occasions some dummy ellipsoids would appear to “pass through” some ATV or ROPS/CPD ellipsoids. This occurred because the simulation software requires the model to contain force-deflection definitions for each and every contact that the simulation software will compute. If a contact occurs (among many thousands contact pairs that theoretically could occur but are unlikely to occur) that has not been defined, no contact forces are computed by the simulation software. In order to address this issue, a detailed review of theoretically possible contacts pairs was conducted and additional contact force-deflection definitions were added.
i. Simulation end time
In order to limit the total computational time necessary to run the thousands of simulations that needed to be run, the previous (e.g., Zellner et al. (2004, 2008)) simulations were run using an end time of 6 seconds42. However, in some cases this time was not sufficient to cover the entire relevant dummy motion sequence. In order to adjust for this, the simulation time was further extended to 10 seconds, which, along with introduction of the “low energy” assumption described above, was found to be sufficient to cover the entire relevant dummy motion sequence for nearly all (i.e., 99%) of the simulation runs.
j. Extents of ground planes
Due to the increase in the simulation end time, the ATV in some simulations would travel beyond the end of the ground planes that had been defined in the models. In order to address this, the dimensions of the relevant ground planes were increased.
42 This was greater than the end time of 3 seconds used in the Van Auken et al. (1998) simulations.

71
k. Comparing only cases where both the baseline and modified ATV overturned
The previous analyses were based on comparing the injury outcomes for all cases in which the baseline ATV overturned, regardless of whether or not the ATV ROPS/CPD vehicle overturned. However, in general, due to various dynamic and static effects, there can be types and variations of overturn in which the ATV with ROPS/CPD overturns but the baseline ATV does not overturn; and types and variations of overturn in which the baseline ATV overturns but the ATV with ROPS/CPD does not overturn. The former category has been excluded (by assumptions made) in both the previous and in the current analysis. However, the latter category was not excluded in the previous analyses. It was determined that both the former and the latter categories should be excluded in the current analysis; in other words, only overturns in which both the baseline ATV and the ATV with the Quadbar overturned would be included in the updated risk/benefit analysis, in order to provide a fair comparison of the effects of the device in the event of an overturn.
l. Refined initial condition variation analysis
A revised and more consistent method for defining the 6 other variations (i.e., perturbations) of the initial conditions for each of the 110 general types of ATV overturn was developed and applied, as described in Appendix K.
m. Graphics software anomalies
In the graphic animations outputs of previous simulations, several graphics software anomalies were observed in some simulations. One graphics anomaly was that objects in the distance would occasionally disappear. This occurs because in general, virtually all 3D computer graphics software programs rely on a near clipping plane and a far clipping plane in order to determine how to display the 3D objects. In the previous animations, the far clipping plane was not set to be far enough away to prevent objects from suddenly disappearing as they moved far away. Although this did not affect the previous simulations, simulation results, or injury evaluations, the clipping plane was moved much further away so that this visual anomaly was unlikely to occur.
Another graphics anomaly that was observed was that in some cases the grids of lines overlaid on the ground planes to enhance visual sense of size and perspective were

72
occasionally offset or rotated from the associated planes. Because the grids were only visualization aids and were not used in the simulation calculations, this, like other graphics anomalies, had no effect on the results. The offsets and rotations occurred due to a bug in the graphics software that generated the grids of lines. The graphics software was modified to eliminate this problem.
n. Miscellaneous
Various other minor refinements were also made to the model in order to eliminate small anomalies that occasionally or rarely occurred.
5. Additional Calibrations of the Simulation Model
Two additional calibrations of the simulation model were made as part of the update process, as described subsequently.
a. Simulated versus actual injury distributions
Appendix G presents simulation calibration results comparing the aggregated frequency distributions of the predicted injury severities from the baseline ATV computer simulations to those of the actual coded injury severities from the US/UK ATV accident data, in terms of the distribution of AIS injury severity for the body regions and injury types able to be monitored by means of the ISO 13232 MATD dummy, as well as by means of the preliminary potential mechanical/traumatic (compressive) asphyxia(i.e., potential “breathing difficulty beyond 1 hour”) criterion described in Section IV.A.2, and the skull fracture criterion described by Van Auken et al. (2011).
As noted in Section II.2 and further discussed in Appendix G, the simulated and actual injury distributions, though generally similar, fundamentally would not be expected to be identical, because of the inherent dissimilarities in human, vehicle environment and accident variables between the simulation sample of general types of overturn, and the sample of much more complex actual accidents, many variables of which were unknown, as described in Appendix G.
A case by case comparison between the injuries occurring in each of the 770 baseline ATV simulations versus each of the 110 actual accidents is fundamentally

73
inappropriate and not feasible, as each set of 7 simulation runs (i.e., one of a general type of overturn, plus 6 variations of the general type of overturn) was run with a baseline ATV, baseline dummy, baseline simplified terrain and baseline control inputs, i.e., a fundamentally different assumed set of human, vehicle, environment and accident variables than those of the associated actual accident, which were far more diverse and to a large extent unknown. For example, the injuries occurring in the actual accident case can in general be related to a large number of diverse, unknown or difficult-to-model variables, such as rider age, size, weight, made-model-year of ATV, accessories, modifications and cargo on the ATV, possibility of broken, worn or missing ATV parts, complex and highly diverse environmental objects (e.g., rocks, trees fences, etc.), highly detailed terrain shapes, etc. Such a type-by-case comparison is not the state-of-technology in vehicle crash testing or simulation, whereas aggregated comparison of simulated and actual injury distributions can be found in the literature (e.g., Kramer et al. (1990), Kuchar (2001), Rogers et al. (2004)).
Overall, as illustrated and further discussed in Appendix G, the updated simulated and actual aggregated frequency distributions of injury locations, types and severities are generally similar. In terms of the Nash-Sutcliffe model efficiency E,43 the results indicate a close agreement between modeled and actual aggregated injury severity distributions (Nash-Sutcliffe model efficiency E = 0.95 on average for helmeted dummy simulations, and in excess of 0.99 for some body regions, between modeled and actual frequency of injury, across all body regions and overturn cases/types).
b. Comparison of helmet risk/benefit analysis outcomes to published literature
Based upon the baseline ATV simulations, Appendix H presents the risk/benefit percentage and net benefit percentage outcomes for the helmet as a protective device, in comparison to an unhelmeted dummy. In terms of the head incremental injury severity (ICnorm, head), the simulation model of the helmet produces a net benefit for head injuries of 70% [53%, 87%], with a risk/benefit percentage for head injuries of 2% [1%, 13%]. This result is in general agreement with helmet net benefit percentage data in the
43 Nash and Sutcliffe (1970). Rajaraman et al. (2012) is an example application of the Nash-Sutcliffe model efficiency E (referred to as R2 in Eqn A7) to assess the model goodness of fit. This figure of merit ranges from negative infinity to 1.0, with higher values indicating a better model fit to the data.

74
published literature. For example, Rodgers (1990) of the US CPSC estimated that helmet wearing on ATVs reduces the risk of non-fatal head injuries by 64%.44
6. Use of a Single Baseline Condition for the Main Risk/Benefit Tabulations
In its defined risk/benefit analysis methods, ISO 13232 (2005) uses a single baseline condition (i.e., the unmodified vehicle) as a basis for all injury risk and benefit calculations.
ISO 13232 (2005) does not describe methods for evaluating various types of misuse that may affect the performance of the protective device, however, evaluating the effects of such misuse can be of interest in such evaluations.
In the previous ROPS/CPD evaluations (e.g., Zellner et al. (2004, 2008)), in addition to the baseline ATV with helmet condition, two types of potential misuse were evaluated which could potentially affect the performance of the ROPS/CPDs: an unhelmeted dummy for all of the ROPS and CPD configurations; and an unbelted dummy for the ROPS configurations. In analyzing the various configurations, different baselines were used for different portions of those previous analyses. For example, in the Zellner et al. (2004) study, all possible configurations of the MUARC ROPS (i.e., helmeted, unhelmeted, belted, unbelted) were compared to a baseline ATV with helmeted dummy and also to a baseline ATV with unhelmeted dummy (i.e., a 6-way comparison). In the Zellner et al. (2008) study, the helmeted ROPS cases were compared to the helmeted baseline ATV cases, and the unhelmeted ROPS cases were compared to the unhelmeted baseline ATV cases (i.e., a 4-way comparison).
To aid in simplifying the presentation of results, and to reduce the potential for confusion and misinterpretation, in previous versions of the current report regarding the updated study a single baseline – the baseline ATV with helmet - was used for all risk/benefit analysis tabulations for the Quadbar in the main text. However, in this Third Revision, both the single baseline and two different baseline results are presented.
44 Note that these non-fatal head injury statistics are not identical but are somewhat similar to the statistical indices being evaluated in the simulation sample, as in the simulations more than 80% of the unhelmeted head injuries and more than 95% of the helmeted head injuries were non-fatal.

75
B. RESULTS OF UPDATED INJURY RISK/BENEFIT ANALYSIS OF THE QUADBAR CPD
The results from the updated ATV Quadbar simulations and evaluations are given in Tables 7 through 10. The Quadbar model is identical to that evaluated in Munoz et al. (2007).
Table 7 summarizes the updated risk/benefit percentage results for the overall injury severity index (ICnorm), which addresses injuries of all severities. The first two columns in the table give results for the helmeted and unhelmeted condition respectively compared to the baseline ATV with a helmeted dummy, which is the intended use. The third column in the table gives results for the Quadbar compared to the baseline ATV, where both have an unhelmeted dummy. As in Table 6 for the results of the previous analysis, the value in front of the square brackets is the point estimate of the risk/benefit percentage, and the values in square brackets [ ] indicate the 95% confidence interval for the estimated percentage. The point estimate is the summation of the increases in the index (e.g., the normalized injury cost (ICnorm)) divided by the summation of the decreases in the index, as a result of fitting the device compared to be baseline condition, across the simulation sample of overturn events, expressed as a percentage, according to ISO 13232 (2005). The confidence interval indicates the range of uncertainty in the risk/benefit percentage for the population of overturns assuming that the changes in the index due to fitting the device are independently and identically normally distributed and the simulated cases and resulting changes in the index comprise a representative sample of the overturn event population. Values are statistically significant at the 0.05 level of significance in terms of the effect on the population if the 95% confidence interval does not include 100%. Statistically significant results are denoted in bold font; statistically insignificant results are denoted in gray font. In addition, as described in the key to the table, the cell colors indicate the general category of each risk/benefit outcome.

76
Table 7. Summary of Updated ICnorm Risk/Benefit Percentage Results for the Quadbar
Device
Device with Helmeted Dummy versus
Baseline with Helmeted Dummy*
Device with Unhelmeted Dummy versus
Baseline with Helmeted Dummy*
Device with Unhelmeted Dummy versus
Baseline with Unhelmeted Dummy Quadbar 108% [69%,168%] 483% [250%,774%]† 65% [41%,110%] Key
Risk/benefit percentage significantly more than 100%: injury risks of the device are greater than injury benefits of the device.
Risk/benefit percentage not significantly different from 100% (within 95% confidence interval): injury risks of the device are effectively equal to injury benefits of the device.
Notes: *
The baseline ATV with a helmeted rider is the intended use of the vehicle.
† See Footnote 8 on page 6
— White cells denote a risk/benefit percentage not significantly different from 100% (within a 95% confidence interval). This indicates a device for which the new injury risks are effectively equal to the injury benefits, i.e., not recommended as a safety device, as it creates a substantial level of new injury risks, and it is also an ineffective device from an injury reduction viewpoint.
— Pink cells denote a risk/benefit percentage significantly more than 100%, i.e., the device is unacceptable because the injury risks of the device are statistically significantly greater than the injury benefits. This is also an unacceptable device according to the voluntary guidelines in ISO 13232.
1. Quadbar Results for Injuries of All Severities
The results in Table 7 indicate that for the overall injury severity index (ICnorm), calculated according to ISO 13232, the risk/benefit percentage45 of the Quadbar with helmeted dummy is 108% [69%, 168%], meaning that for the simulation sample the average injury risks of fitting the Quadbar were 108% of the average injury benefits from fitting the Quadbar (i.e., the injury risks of the Quadbar (with helmet) are greater than its 45 In accordance with International Standard ISO 13232-5 (2005), “risk/benefit percentage” is defined as the average of the total increases in normalized injury cost divided by the average of the total decreases in injury costs, when evaluated on a paired comparison basis across a sample of crash events. This is entirely different from, and not directly calculate-able from, the net injury benefit, which is defined as the average of the total decreases in injury costs minus the average of the total increases in normalized injury cost divided by the average normalized injury cost per crash event for the baseline condition. The normalized injury cost for each simulated (or tested) crash event is calculated in the Standard based upon the measured forces, deflections and accelerations sensed in the various crash dummy body regions.

77
injury benefits); but that at the population level, this percentage is not statistically significantly different from 100%, which is the point at which the injury risks of the device equal the injury benefits of the device.
The risk/benefit percentage for the unhelmeted configuration is substantially higher (i.e., 483% [250%, 774%]) assuming the baseline is the baseline ATV with helmeted dummy), which indicates that for the simulation sample the injury risks of the Quadbar (without helmet) in comparison to the baseline ATV with helmet, are substantially greater than its benefits, and when extended to the population the injury risks of the Quadbar (without helmet) are statistically significantly greater than its injury benefits.
The risk/benefit percentage of the Quadbar for an unhelmeted dummy compared to a baseline ATV with an unhelmeted dummy (i.e., a misuse condition) is 65% [41%, 110%], meaning that for the simulation sample the average injury risks of the Quadbar were 65% of the average injury benefits from fitting the Quadbar (i.e., the injury risks of the Quadbar (without helmet) are less than its injury benefits), but that at the population level, this percentage is not statistically significantly different from 100%.
Overall, the risk/benefit percentage results in Table 7 indicate that the Quadbar is either ineffective (if helmet is worn), has injury risks greater than injury benefits (if helmet is not worn with the Quadbar but is worn with the baseline), or is ineffective (if helmet is not worn with either the Quadbar or baseline).
Table 8 summarizes the corresponding net benefit percentage results.

78
Table 8. Summary of Updated ICnorm Net Benefit Percentage Results for the Quadbar
Device
Device with Helmeted Dummy versus
Baseline with Helmeted Dummy*
Device with Unhelmeted Dummy versus
Baseline with Helmeted Dummy*
Device with Unhelmeted Dummy versus
Device with Unhelmeted Dummy Quadbar -3% [-24%,18%] -111% [-151%,-71%]† 13% [-3%,29%] Key
Net benefit significantly less than 0% (i.e., significant disbenefit exists): causes significantly more injuries than it prevents.
Net benefit percentage not significantly different from 0% (within 95% confidence interval): injury risks of the device are effectively equal to injury benefits of the device.
Notes: *
The baseline ATV with helmeted rider is the intended use of the vehicle.
† See Footnote 8 on page 6.
The net benefit results in Table 8 are generally similar to but not directly calculable from the risk/benefit percentage results in Table 7. The Quadbar is observed to be either ineffective (i.e., in the white category), or to have statistically significant injury disbenefits (i.e., injury risks greater than injury benefits, i.e., in the pink category) relative to the baseline ATV depending on the helmet condition assumed for the baseline configuration.
Note that the net benefit percentage values in Table 8 cannot be calculated from the risk/benefit percentages in Table 7 alone. This is because another value (in this case, the average ICnorm value for the baseline ATV) enters into the calculation of net benefit percentage, but is not used in the risk/benefit percentage calculation. In general, it can be seen that the net benefit percentage is substantially smaller in magnitude than 100% minus the risk/benefit percentage listed in Table 7.46
2. Quadbar Results for Probability of Fatality
The results in Table 9 for the Probability of Fatality (POF), calculated according to ISO 13232 (2005), indicate that the Quadbar fatality risk/benefit percentage is 121% for the helmeted configuration for the simulation sample, but that this is not significantly different from 100% for the population (i.e., it not an effective protective device); for the unhelmeted Quadbar configuration, the fatality risk/benefit percentage of 721% is
46 This fact is noted because of the misunderstanding by some readers of previous reports that the net benefit could be calculated from the risk/benefit percentage alone, and based on that, that the net benefit had a larger value than in fact was the case. This is clarified by referring to the respective equations in ISO 13232-5 (2005).

79
statistically significantly greater than 100%, indicating that for both the simulation sample and for the population, the fatality risks of the Quadbar are greater than its fatality benefits in terms of Probability of Fatality, relative to the baseline helmeted configuration; and for the unhelmeted Quadbar configuration, the fatality risk/benefit percentage of 66% is not statistically significantly different from 100% (i.e., it is not an effective protective device).
Table 9. Summary of Updated Probability of Fatality Risk/Benefit Percentage Results for the Quadbar
Device
Device with Helmeted Dummy versus
Baseline with Helmeted Dummy*
Device with Unhelmeted Dummy versus
Baseline with Helmeted Dummy*
Device with Unhelmeted Dummy versus
Baseline with Unhelmeted Dummy Quadbar 121% [72%,198%] 721% [273%,1172%]† 66% [41%,114%] Key
Risk/benefit percentage significantly more than 100%: injury risks of the device are greater than injury benefits of the device.
Risk/benefit percentage not significantly different from 100% (within 95% confidence interval): injury risks of the device are effectively equal to injury benefits of the device.
Notes: *
The baseline ATV with a helmeted rider is the intended use of the vehicle.
† See Footnote 8 on page 6.
The net benefit results in Table 10 for the Probability of Fatality (POF) are generally similar to but not directly calculable from the risk/benefit percentage results for the Probability of Fatality (POF) in Table 9. This indicates that for the Quadbar, the net benefit percentages for Probability of Fatality are either in the white category (i.e., not significantly different from 0%, i.e., the fatality risks of the device are essentially equal to the fatality benefits of the device and therefore it is not an effective protective device); or in the pink category (i.e., the net benefit percentage for the population is significantly less than 0%, indicating that the fatality risks of the Quadbar are significantly greater than the fatality benefits of the Quadbar, in terms of Probability of Fatality. In particular, for the unhelmeted Quadbar condition compared to the helmeted baseline (i.e., fitting the Quadbar and removing the helmet), the Probability of Fatality net benefit for the Quadbar

80
in the simulation sample is -209% (i.e., the Probability of Fatality is 3.09 times greater than for the baseline ATV with helmet).47
Table 10. Summary of Updated Probability of Fatality Net Benefit Percentage Results for the Quadbar
Device with Helmeted Dummy versus
Baseline with Helmeted Dummy*
Device with Unhelmeted Dummy versus
Baseline with Helmeted Dummy*
Device with Unhelmeted Dummy versus
Baseline with Unhelmeted Dummy Device Quadbar -10% [-41%,21%] -209% [-284%,-134%]† 15% [-5%,35%] Key
Net benefit significantly less than 0% (i.e., significant disbenefit exists): causes significantly more injuries than it prevents.
Net benefit percentage not significantly different from 0% (within 95% confidence interval): injury risks of the device are effectively equal to injury benefits of the device.
Note: *
The baseline ATV with a helmeted rider the intended use of the vehicle.
† See Footnote 8 on page 6.
3. Quadbar Injury Benefit and Injury Risk Mechanisms
Examination of the injury summary sheets and graphics animations for individual runs generally indicated that, as in past studies:
− Injury benefits from the Quadbar were often related to injuries that occurred (i.e., in the baseline ATV with helmet) that were reduced in severity or prevented by the Quadbar, e.g., trapping between the upper surfaces of the ATV and the ground;
− Injury risks from the Quadbar were related to injuries that did not occur in the baseline ATV with helmet, that were caused by the Quadbar, e.g., impacts between portions of the dummy and the Quadbar; trapping of portions of the dummy between other surfaces of the ATV and/or the Quadbar and the ground; and altered overturning motions of the ATV,
47 The value of 3.09 is calculated from 1 + 2.09, or equivalently 100% + 209%. In other words, if an item's price is increased by 100%, it is the same as the item being 200% of the original price, i.e., 100% + 100%).

81
which in some cases increased some of the impacts and/or forces between the dummy and the ATV and/or the ground;
− The injury risks (i.e., the newly created injuries) from the Quadbar due to the aforementioned and other mechanisms tended to be relatively large in comparison to, i.e., equal or greater in magnitude than the injury benefits of the Quadbar due to the aforementioned and other mechanisms.
− During rollover, the Quadbar’s geometry tends to lift (i.e., leverage upward) the ATV, resulting in greater forces when it lands. Note that in some cases the simulation animations indicated that when the dummy was wearing a helmet, the helmet’s decreased ground friction (relative to that with a bare head) and size in some cases resulted in the helmet sliding into this zone of increased landing force, thereby increasing head and neck injuries. In other cases when the dummy did not wear a helmet, the bare head’s increased ground friction (relative to that that with a helmet) and smaller size resulted in the head not sliding into this zone of increased landing force, resulting in reduced head and neck injuries relative to the helmeted-Quadbar case. This and other hypotheses may explain the marginal (i.e., not statistically significant) trends in the first and third comparisons above.
Figure 9 illustrates one injury risk example for the Quadbar. The pair of images for each case shows the baseline ATV (on the left); and the Quadbar ATV (on the right), at the same time instant. The predominant change in injury was the occurrence of an AIS 2 concussive head injury and also potential asphyxia for the Quadbar ATV, while no monitor-able injuries occurred with the baseline ATV.
As for “asphyxiation,” the simulations indicated that the Quadbar caused as many new potential "breathing difficulties" (i.e., n = 11 breathing difficulties) as it prevented (i.e., 11 breathing difficulties) out of 1,540 simulated overturns with the Quadbar compared to 1,540 simulated overturns without the Quadbar (i.e., across a total of 3,080 simulated overturns with the helmeted and unhelmeted dummies).

82
Figure 9. Example still image of QuadBar CPD injury risk. Potential asphyxia and AIS 2 concussive head injury occurred with the Quadbar. Baseline had no monitor-able injuries.
The mechanism behind this lack of effectiveness in asphyxia potential appears to be a shift in the final resting attitude of the ATV caused by the Quadbar. Figure 10 indicates the frequency distribution of final resting attitude of the ATV, based on 770 simulations each, for the baseline ATV (helmeted) and for the Quadbar ATV (helmeted). This indicates that with the Quadbar, the frequency of the ATV coming to rest on its top (i.e., upside down) has decreased from 20% to 7%,48 and instead, the frequency with which it comes to rest on its side has increased from 25% to 31%.
48 Upside down final resting attitude with the Quadbar may occur in the presence of ditches, obstacles and other non-flat terrain and environment conditions.

83
Figure 10. Frequency distribution of ATV final resting orientation, based on 3,080 overturn simulations (Baseline ATV versus Quadbar ATV, combination of helmeted and
unhelmeted conditions)

84
Figure 11. Frequency distribution of ATV final resting orientation for 11 Baseline and 11 Quadbar potential “breathing difficulty” outcomes, based on 3,080 overturn simulations (Baseline ATV versus Quadbar ATV, combination of helmeted and
unhelmeted conditions)
This pattern is reflected in the frequency distribution of final resting attitude of the ATV for those cases in which “breathing difficulty” occurred (i.e., overturn events in which the final chest force exceeded 490 N (110 lb) as illustrated in Figure 10. In comparison to the baseline ATV, while with the Quadbar ATV, fewer (i.e., no) “breathing difficulty” cases occurred when the ATV came to rest on its top (i.e., upside down), substantially more “breathing difficulty” cases occurred when the Quadbar ATV came to rest on its side. Since serious injuries have been known to occur when a baseline ATV comes to rest on its side on a rider,49 this shift toward relatively more “breathing
49 For example, a New Zealand case described at the Technical Engineering Group meetings, Sydney, 5 to 7 October 2010, resulting in long term rider entrapment and subsequent medical leg amputation.

85
difficulty” (i.e., potential asphyxia) cases occurring when the ATV comes to rest on its side as compared to on its top is considered to be a realistic phenomenon.
As noted elsewhere, it was observed that the total number of potential “breathing difficulty” outcomes were relatively small among (i.e., about 1% of) these 3,080 simulated “low energy” overturns involving all injury severities with 50th percentile adult male dummy, no accessories, mid-sized ATV, and other simulated conditions.
C. CONCLUSIONS BASED ON THE UPDATED INJURY/RISK BENEFIT ANALYSIS OF THE QUADBAR CPD
The updated risk/benefit analysis took into account desired refinements to, as well as all known comments on, the previously used methodologies, including:
— lowering the energy levels (e.g., reducing the slopes, slope lengths, speeds, obstacle sizes, etc.) of the simulated overturn events used, so as to “barely” result in a simulated overturn in each overturn event (in contrast to the use of higher energy conditions that were more likely to result in a simulated overturn in the previous analyses);
— taking into account potential mechanical/traumatic (compressive) asphyxia mechanisms and factors;
— quantifying the effects of dummy hand grip release force (during overturn) on potential mechanical/traumatic (compressive) asphyxia mechanisms and factors;
— refining the ATV control inputs (e.g., throttle, brakes, steering) used to induce each of the overturn events so as to terminate the control inputs when the dummy hands release from the hand grips;
— refining the force-deflection characteristics of crash dummy helmet, head, upper leg and lower leg so as to reduce potential over-prediction of head and leg injuries, and verifying these refined force-deflection characteristics by means of calibrations against previous dummy lab test data;

86
— measuring and incorporating values for dummy/soil coefficients of friction, so as to increase the model’s accuracy and reduce potential over-prediction of head and leg injuries due to excessive dummy/soil friction;
— increasing the handgrip release force for all overturn simulations in order to minimize potential occurrence of pre-overturn hand release;
— after implementing the aforementioned refinements, calibrating the simulation models against aggregated injury distributions from actual accidents, which resulted in closer agreement between the simulated and actual injury distributions (e.g., with a Nash-Sutcliffe model efficiency statistic of 0.95 on average for the helmeted dummy simulations, and 0.82 on average for the unhelmeted dummy simulations);
— additional calibration of the simulation model results against published literature for helmet net injury benefits which, in terms of incremental injury severity, indicated a helmet net injury benefit for head injuries of 70% [53%, 87%] and a helmet risk/benefit percentage for head injuries of 2% [1%, 13%];
— reporting the risk and benefit results using a single baseline condition (i.e., the baseline ATV with helmet, which represents the intended use of the vehicle) as well as using two different baseline conditions (i.e., with and without a helmet); and
— refining the models and software in order to improve the details of the graphic animations, the ground plane dimensional limits, list of objects contactable by the dummy limbs, simulation run time duration, and other details.
The previously evaluated Quadbar device as described in Munoz et al. (2007) was then reevaluated based on these refinements of and updates to the methodology. This reevaluation involved running 3,080 computer simulations, with the baseline ATV and the Quadbar ATV, using 110 “low energy” overturn types, and six additional variations (i.e., perturbations) of each overturn type in order to reduce the sensitivity of the results to the details of any single overturn simulation, for the helmeted condition and for the

87
unhelmeted condition. Note that the ATV and dummy simulation models had been previously extensively calibrated by means of laboratory tests and full-scale overturn tests (i.e., Van Auken et al. (1998), Kebschull et al. (1998)), and were further calibrated as described above.
The overall conclusions from the results of the updated analysis reported in Tables 7 and 8 and based on the refined methodology are similar to those from the results reported in Munoz et al. (2007), namely that, in terms of injury “fatality equivalents” involving injuries of all severities (i.e., ICnorm):
− under helmeted use conditions, the Quadbar was found to have injury risks (in comparison to injury benefits) that were, for the simulation sample, greater than its injury benefits, and when extended to the population, not statistically significantly different from its injury benefits;
− under unhelmeted misuse conditions, the Quadbar was found to have injury risks (in comparison to injury benefits) compared to the helmeted baseline condition that were, for the simulation sample, greater than its injury benefits, and when extended to the population, statistically significantly greater than its injury benefits;
− and which for both helmeted and unhelmeted conditions are therefore:
− much higher than those found in any published data for any automotive safety device, for which the injury risks have been found to be less than 7% of the injury benefits;
− unacceptably high injury risks in comparison to injury benefits in comparison to the suggested reference guideline for research purposes published in ISO 13232 (2005), i.e., the Quadbar injury risk/benefit percentages were all far greater than the “not… more

88
than 12 percent” reference guideline indicated in International Standard ISO 13232-5 (2005);50 and
− unacceptably high injury risks in comparison to injury benefits, when compared to the “regulatory policies of several of the [Australian] states,” mentioned in the Heads of Workplace Health and Safety Authorities (HWSA) Technical Engineering Group (TEG) report, which were apparently stated to be that the “the benefits need to be at least 2 times the risks" (i.e., 2 deaths prevented for every 1 new death caused by a device, or 50 percent risk/benefit.”51
More specifically the updated results, in terms of injury “fatality equivalents” involving injuries of all severities (i.e., the ICnorm results in Tables 7 and 8) and in terms of the probability of fatality (i.e., the results in the results in Tables 9 and 10), indicated the following:
− In the helmeted condition, comparing a dummy with a full face helmet on a Quadbar ATV to a dummy with a full face helmet on a baseline ATV52, the Quadbar had an injury risk/benefit percentage of 108% [69%, 168%]53,54;
50 The suggested reference guideline for research that is published in ISO 13232 (2005), Annex E is said to be “[b]ased on the results for automobile seat belts (7 percent) based on Malliaris, et al., 1982, as described by Rogers, [et al.] 199[8], which is presumed to be an acceptable risk/benefit percentage; and the results for pre-1998 automobile passenger airbags (12 percent), based on Iijima, et al., 1998, which is presumed to be an unacceptable risk/benefit percentage.” 51 Technical Engineering Group report, p. 32, footnote 7, November 2010. 52 ATV warning labels mandated by US law state that riders should always wear a helmet, and this recommended condition is taken as the baseline condition. 53 In accordance with International Standard ISO 13232-5 (2005), “risk/benefit percentage” is defined as the average of the total increases in normalized injury cost divided by the average of the total decreases in injury costs, when evaluated on a paired comparison basis across a sample of crash events. This is entirely different from, and cannot be directly calculated from, the net injury benefit, which is defined as the average of the total decreases in injury costs minus the average of the total increases in normalized injury cost divided by the average normalized injury cost per crash event for the baseline condition. The normalized injury cost for each simulated (or tested) crash event is calculated in the Standard based upon the measured forces, deflections and accelerations sensed in the various crash dummy body regions. 54 The value in front of the square brackets is the point estimate of the risk/benefit percentage. This value according to ISO 13232 (2005) is the summation of the increases in the index (e.g., the normalized injury cost (ICnorm)) divided by the summation of the decreases in the index, as a result of fitting the device, across the simulation sample of (overturn) events, expressed as a percentage. The square brackets [ ] denote the 95% confidence interval for the estimated risk/benefit percentage. This confidence interval indicates the range of uncertainty in the estimated risk/benefit percentage for the population of all overturn events,

89
and a fatality risk/benefit percentage of 121% [72%, 198%]53. The point estimates for both of these results indicate that the Quadbar increases the injury severity and the fatality probability for the simulation sample of overturn events, however the confidence intervals indicate that these estimated increases are relatively small and not statistically significant. The confidence intervals for these results indicate that the estimated injury risks and fatality risks of the device for the population of overturn events are not statistically significantly different from the estimated injury benefits and fatality benefits of the device, respectively, for the population of overturns. Therefore these results indicate that the Quadbar would cause approximately as many injuries and fatalities as it would prevent.
− In the unhelmeted condition, comparing an unhelmeted dummy on a Quadbar ATV to a dummy with a full face helmet on a baseline ATV (i.e., comparing to the same baseline condition noted above55), the Quadbar had an injury risk/benefit percentage of 483% [250%, 774%]; and a fatality risk/benefit percentage of 721% [273%, 1172%]56. Both of these results indicate, on average, that the combination of adding a Quadbar and removing the helmet57 substantially increases the injury severity and the fatality probability, across the simulation sample of overturn events. In extending this sample estimate to the population of overturns, these
assuming that the changes in the index (e.g., ICnorm) are independently and identically normally distributed and assuming that the simulation sample of (overturn) events and the resulting changes in the index comprise a representative sample of the overturn event population. The magnitude of the uncertainty reflects the simulation sample size (i.e., 770 simulations comprising 110 overturn types with 7 perturbations each) and the run-to-run variation in the simulation results. If the confidence interval includes 100% then the estimated risk/benefit percentage for the population is not statistically significantly different from 100%, i.e., statistically, there is no difference between the magnitude of the risk and the magnitude of the benefit, and therefore there is no statistically significant net benefit. 55 ATV warning labels mandated by US law state that riders should always wear a helmet, and this recommended condition is taken as the baseline condition. In addition, this particular comparison describes what may occur if a rider adds a Quadbar and removes his helmet which may occur in the population. 56 The risk/benefit and net benefit results for the Quadbar with an unhelmeted dummy were revised in this Third Revision because the injury cost model results for 4 the 770 unhelmeted Quadbar simulations that originally predicted that asphyxiation were revised. The injury cost model results for these 4 simulations (81059, 81199, 81311, and 81461) were revised because, after reviewing the simulation animations, it was judged that, while an asphyxiation had been predicted, it was actually unlikely to occur because the ATV was not at rest at the end of the 10 second simulation. As a result of this change the normalized injury cost and probability of fatality results for the Quadbar decreased slightly overall. This change had a small effect on the numerical results in Tables 7 through 10, and no effect on the overall conclusions. 57 As a user might do if, for example, he/she mistakenly believed that the Quadbar had a significant protective effect.

90
confidence intervals indicate that the injury risks and fatality risks of adding the device and removing the helmet are statistically significantly greater than the injury benefits and fatality benefits of adding the device and removing the helmet, respectively, i.e., adding the device and removing the helmet would cause statistically significantly more injuries and fatalities than these actions would prevent.
− In the unhelmeted condition, comparing an unhelmeted dummy on a Quadbar ATV to an unhelmeted dummy on a baseline ATV, the Quadbar had an injury risk/benefit percentage of 65% [41%, 110%]; and a fatality risk/benefit percentage of 66% [41%, 114%]. The point estimates for both of these results indicate that the Quadbar decreases the injury severity and the fatality probability for the simulation sample of overturn events, however the confidence intervals indicate that these estimated decreases are relatively small and not statistically significant. The confidence intervals for these results indicate that the estimated injury risks and fatality risks of the device for the population of overturn events are not statistically significantly different from the estimated injury benefits and fatality benefits of the device, respectively, for the population of overturns. Therefore these results indicate that the Quadbar would cause approximately as many injuries and fatalities as it would prevent.

91
Taken together, the above three results indicate that the effect on injuries and fatalities of adding a Quadbar to an ATV (keeping the helmet condition the same, i.e., the first and third comparisons above) is small and not statistically significant, i.e., the Quadbar would cause approximately as many injuries and fatalities as it would prevent. In contrast, the effect of adding a Quadbar and removing the helmet (i.e., the second comparison above) is large and statistically significant, in other words, the effect of removing the helmet is large, adverse and much larger than the effect of adding a Quadbar alone. This suggests that while the direct effect of adding a Quadbar on injuries and fatalities is small and not statistically significant, to the extent that adding a Quadbar induces any helmet-wearing riders to remove their helmet, the results would be large, adverse and (for a sample of 1,540 overturns) statistically significant.
The associated computer simulation animations and injury assessment value time histories were reviewed to determine the mechanisms behind these Quadbar risk and benefit results. The identified mechanisms included:
− Injury benefits from the Quadbar were often related to injuries that occurred with the baseline ATV (and with helmet) that were either reduced in severity or prevented by the Quadbar (e.g., trapping between the top surfaces of the ATV and ground).
− Injury risks from the Quadbar were related to injuries that did not occur with the baseline ATV (and with helmet) that were caused by the Quadbar and its lack of a restraint system (e.g., impacts between portions of the dummy and the Quadbar; trapping of portions of the dummy between the other surfaces (i.e., not the top surfaces) of the ATV and/or the Quadbar, and the ground), or altered overturning motions of the ATV that increased some of the impacts and/or forces between the dummy and the Quadbar ATV and/or the ground.
− During rollover, the Quadbar’s geometry tends to lift (i.e., leverage upward) the ATV, resulting in greater forces when it lands. Note that in some cases the simulation animations indicated that when the dummy was wearing a helmet, the helmet’s decreased ground friction (relative to that with a bare head) and size resulted in the helmet sliding into this zone of increased landing force, thereby increasing head and neck injuries. In other cases

92
when the dummy did not wear a helmet, the bare head’s increased ground friction (relative to that that with a helmet) and smaller size resulted in the head not sliding into this zone of increased landing force, resulting in reduced head and neck injuries relative to the helmeted-Quadbar case. This and other hypotheses may explain the marginal (i.e., not statistically significant) trends in the first and third comparisons above. However, across all of the overturn events, the unhelmeted dummy sustained approximately 2 1/2 times the normalized injury costs of the helmeted dummy, so the effect of not wearing a helmet was far more harmful than the marginal (i.e., not statistically significant) benefit of adding a Quadbar when not wearing a helmet. Therefore, the far more effective safety strategy (by a large factor) would be to recommend wearing a helmet (in which case the Quadbar is marginal harmful and therefore should not be fitted), rather than to recommend not wearing a helmet in order to try to obtain a marginal (i.e., statistically not significant) benefit of a Quadbar.
− Similarly, based on a comparison of all 1,540 Quadbar versus the corresponding baseline simulations run (i.e., 3,080 total simulations with full face helmeted and unhelmeted dummies), the Quadbar caused the same number of potential compressive asphyxia/breathing difficulty outcomes (i.e., n=11) as it prevented (i.e., n=11). The lack of improvement in potential asphyxia outcomes appears to be due to a shift in final resting attitude of the ATV caused by the Quadbar. The results indicated that with the Quadbar, no “breathing difficulty” outcomes were observed when the Quadbar ATV came to rest on its top (i.e., upside down), whereas more “breathing difficulty” cases were observed when the Quadbar ATV came to rest on its side, with no net change in the total number of helmeted and unhelmeted potential asphyxiations. Since serious injuries have been known to occur when a baseline ATV comes to rest on its side on a rider, this shift toward more “breathing difficulty” (i.e., potential asphyxia) cases when the ATV comes to rest on its side is considered to be a realistic phenomenon.
Therefore the overall conclusions of the updated evaluation of the Quadbar, based on these results, were that:
− The Quadbar was found to have:

93
− injury and fatality risks that were greater than its injury and fatality benefits, respectively, for the helmeted use (i.e., helmeted Quadbar versus helmeted baseline) condition for the sample of simulated overturns analyzed, however the estimated net increases in injury and fatality risk for the population of overturns were not statistically significant;
− injury and fatality risks that were greater than its injury and fatality benefits, respectively, for the unhelmeted Quadbar versus helmeted baseline condition for the sample of simulated overturns analyzed, and the estimated net increases in injury and fatality risk for the population of overturns were statistically significant; and
− injury and fatality risks that were less than its injury and fatality benefits, respectively, for the unhelmeted Quadbar versus unhelmeted baseline condition for the sample of simulated overturns analyzed, however the estimated net decreases in injury and fatality risk for the population of overturns were not statistically significant.
− These injury and fatality risks, in comparison to the respective injury and fatality benefits, were therefore:
− much higher than those found in any published data for any automotive safety device;
− unacceptably higher than the suggested reference guideline for research purposes published in ISO 13232 (2005), i.e., the Quadbar injury risk/benefit percentages were all far greater than the “not… more than 12 percent” reference guideline indicated in International Standard ISO 13232-5 (2005);58 and
58 The suggested reference guideline for research that is published in ISO 13232 (2005), Annex E is said therein to be “[b]ased on the results for automobile seat belts (7 percent) based on Malliaris, et al., 1982, as described by Rogers, et al. (199[8]),which is presumed to be an acceptable risk/benefit percentage; and the results for pre-1998 automobile passenger airbags (12 percent), based on Iijima, et al., 1998, which is presumed to be an unacceptable risk/benefit percentage.”

94
− apparently, unacceptably higher than “regulatory policies of several of the [Australian] states,” mentioned in the Heads of Workplace Health and Safety Authorities (HWSA) Technical Engineering Group (TEG ) meeting and report. As stated in the TEG report, these policies apparently are that the “the benefits need to be at least 2 times the risks" (i.e., 2 deaths prevented for every 1 new death caused by a device, or 50 percent risk/benefit.”59
Further analysis of the computer simulation results underlying the Quadbar Crush Protective Device (CPD) risk/benefit analysis described in this report and the Zellner et al. (2014) TRB paper are provided in Appendix L. This supplemental analysis involved calculation of additional injury indices (i.e., the incremental injury costs for each body region, and the number of AIS 6 (maximal) injuries) and additional risk-benefit indices (i.e., the average benefit per protective device beneficial case, the average risk per protective device harmful case, and the percentage of cases in which the protective device is beneficial, had no effect and is harmful) and additional risk-benefit criteria, in accordance with methods defined in International Standard ISO 13232-5 (2005). This supplemental analysis was conducted for two samples of ATV overturn types: “all” (n=770 simulated) overturns; and a “low speed” subsample (n=304) of the “all” overturn (main) sample. “Low speed” was defined as less than 20 km/h as proposed by Grzebieta et al. (2014). In addition, three helmet configurations were analyzed: full face helmet, unhelmeted and half helmet. This supplemental analysis provided additional insights into the body regions affected by the Quadbar device, as well as the frequency and magnitude of the Quadbar injury benefits and injury risks. For example, the results for the “all” ATV overturn types sample indicate that the Quadbar produces a:
− statistically significant Quadbar negative net injury benefit (i.e., a net injury risk) in terms of neck incremental injury cost, for the full face helmet (-107%) and half helmet (-97%), i.e., fitment of the Quadbar roughly doubled the neck injury risk for the helmeted condition;
59 Technical Engineering Group report, p 32, footnote 7, November 2010.

95
− statistically significant Quadbar negative net injury benefit (i.e., a net injury risk) in terms of the total number of maximum AIS 6 injuries across all body regions when the half helmet was worn. This resulted from non-statistically significant increases in the numbers of AIS 6 head injuries (from 10 to 12), AIS 6 neck injuries (from 4 to 13) and AIS 6 asphyxias (from 2 to 8) when the Quadbar was fitted; and
− statistically significant negative net injury benefit (i.e., a net injury risk) in terms of the normalized injury cost across all body regions if the helmet is removed when a Quadbar is fitted. This outcome is relevant for users who may mistakenly believe that fitting a Quadbar may enable them not to wear a helmet.
The normalized injury cost results for the “low speed” ATV overturn subsample indicated that the Quadbar had a negative net benefit (i.e., a net risk) for all five helmet configuration comparisons, although the point estimates were not statistically significant in some of the comparisons; and none of these five helmet configuration comparisons met at least three of the four ISO 13232 protective device guidelines. Overall, the supplemental results suggest that, particularly for “low speeds”, the Quadbar has a potentially (i.e., non-statistically significant) adverse effect (i.e., net injury harm) for the neck and other critical body regions, including AIS 6 asphyxias for the half helmet condition. These low speed conditions have been reported to be relevant to operating conditions on Australian farms.
Based on these findings, the Quadbar device evaluated in this study should not be fitted to ATVs, including for predominantly “low speed” ATV operating environments, because the net injury risks from (i.e., new injuries created by) a Quadbar are generally similar in magnitude to (and for some conditions, on average greater than) the injury benefits from (i.e., injuries prevented by) a Quadbar; the injury risks in comparison to the injury benefits far exceed published levels for other protective devices in other vehicles; and also exceed ISO 13232 guidelines - as well as apparent workplace health and safety policies for some of the Australian states - for protective devices. Authorities and individuals should be advised of these findings.
In addition, though not evaluated in this study, previous studies of rollover protection systems (ROPS) that do have restraints have indicated such devices installed

96
on ATVs tended to have substantial adverse effects on ATV stability, mobility and utility, rider visibility, ergonomics and ride quality, due to the substantial mass60 of a ROPS relative to the mass of an ATV, as well as due to raising the total cg height of the vehicle, and due to the ergonomically restrictive action of its belts and other structures (e.g., seat backs) when adding these to the straddle-seat-handlebar “rider active” seating configuration of an ATV. Generally, as suggested by the literature describing previous evaluations, it is possible to partially offset the adverse effects of ROPS on ATV stability by increasing the ATV wheelbase and track, with penalties incurred in terms of degraded mobility, utility and ride quality. However, other, alternative (e.g., so called side-by-side) vehicles are currently available in the market which have been designed to have greater wheelbase, track and mass than ATVs, thereby being capable of accommodating a ROPS without the substantial adverse effects that are encountered when attempting to fit a ROPS on smaller, straddle-seat, handlebar, rider-active, highly mobile ATVs.
This study also confirmed the results of other research that has indicated that helmet wearing does have substantial net injury benefits. Beyond this, the results of this study also indicated that helmets have a risk/benefit percentage that is comparable to those for automotive safety devices (e.g., airbags, safety belts, head restraints) and that, in addition, also meets the ISO 13232 guidelines for motorcyclist protective devices. As discussed in Section IV.A.5.b, injury risk/benefit analysis of the “baseline ATV” simulations (i.e., helmeted versus unhelmeted, without the Quadbar) indicated that in terms of the head incremental injury severity (ICnorm, head), the helmet had a net injury benefit of 70% [53%, 87%], with a risk/benefit percentage of 2% [1%, 13%]. This net injury benefit percentage result is in general agreement with helmet net benefit percentage data in the published literature. For example, Rodgers (1990) of the US CPSC estimated that helmet wearing on ATVs reduces the risk of non-fatal head injuries by 64%. The results in the current study confirm the importance, effectiveness and low additional injury risk of helmet wearing.
60 Including the mass required to reinforce the ATV, in order to securely mount the ROPS.

97
D. RECOMMENDATIONS BASED ON THE UPDATED INJURY RISK/BENEFIT ANALYSIS
In the future, the Quadbar device evaluated in this study should not be fitted to ATVs because, for this category of relatively small, highly mobile, straddle seat, handlebar controlled, helmet-required, rider-active vehicle, the injury risks from (i.e., new injuries created by) a Quadbar are generally similar in magnitude to the injury benefits from (i.e., injuries prevented by) a Quadbar, far exceed published levels for other protective devices in other vehicles, and also exceed ISO 13232 guidelines - as well as apparent workplace health and safety policies for some of the Australian states - for protective devices. Authorities and individuals should be advised of these findings.
This study addressed the injury benefits and injury risks associated with and relevant to the Quadbar. Other safety-related factors, including the previously studied, potentially adverse effects of other ROPS or CPDs devices on ATV stability as related to raised centre-of-gravity height (i.e., reduced overturn stability), reduced visibility, risk compensation by riders and increased potential for misuse (e.g., as related to warned-against passenger-carrying or elevated equipment carrying) should be taken into account as well. Functional performance, including effects on ATV mobility, utility and ergonomics, have been evaluated for some ROPS, and should be also taken into account in such evaluations.
For ATV’s, the results of this study confirm that helmet wearing should be encouraged and wherever feasible, required, as helmets, as found herein and elsewhere, have significant and substantial net injury benefits and very low risks in comparison to their substantial benefits.
This study did not address ATV accessories and cargo, which can interact with rider motions and injuries in overturns, and such research should be considered in the future, toward providing a better basis for more specific ATV usage guidelines (e.g., Lenkeit et al. (2006)).
Finally, other vehicles that are somewhat larger and heavier than ATVs exist in the market that can accommodate ROPS, and have been engineered to take into account the relevant functional factors. Such vehicles should be considered as alternatives to smaller, lighter, more mobile ATVs, for some tasks and usages.

98
REFERENCES
Anon., “American National Standard for Four Wheel All-Terrain Vehicles- Equipment, Configuration and Performance Requirements,” ANSI-SVIA-1-2010, December 2010.
Anon., “Accidents Investigated by HSE Involving ATV’s April 86 – May 96,” UK Health and Safety Executive, Edinburgh, 1996.
Anon., “Guidelines for the Design, Construction and Installation of Rollover Protective Structures (ROPS) for All Terrain Vehicles,” Occupational Safety & Health Service, Department of Labour Te Tari Mahi, New Zealand, October 1997.
Anon., NEISS 1989 Injury Survey Codebook, US Consumer Product Safety Administration, September 22, 1989 (Annotated version, correspondence from C. Lee, Heiden Associates, to M. Van Auken, 23 April 1997).
Anon., “Motorcycles – Test and Analysis Procedures for Research Evaluation of Rider Crash Protective Devices Fitted to Motorcycle,” ISO 13232, International Organization for Standardization, Geneva, 1996, and Revision 1, 2005.
Anon., “Notice, Federal Register,” U.S. Consumer Product Safety Commission, Washington, D.C., Vol. 63, No. 174, pp 48199-48204, 9 September 1998.
Anon., “Quadrop ATV Safety Equipment,” New Zealand, c. 1997.
Anon., “Report of the Technical Engineering Group (TEG) to the Heads of Workplace Health and Safety Authorities (HWSA) Trans-Tasman Working Party on “Quad Bike Safety,”” November 2010, Work Health and Safety Division, WorkCover New South Wales, Sydney NSW.
Anon., “2009 Public Release of the All-Terrain Vehicles Deaths (ATVD) Database,” Consumer Product Safety Commission, Bethesda, Maryland, USA, December 2010.

99
Anon., "Federal Motor Vehicle Safety Standards; Occupant Crash Protection, Notice of Proposed Rulemaking," National Highway Traffic Safety Administration, 62 FR 807, US Department of Transportation, Federal Docket No. 74-14; Notice 108, January 6, 1997.
Anon., "Federal Motor Vehicle Safety Standards; Occupant Crash Protection, Final Rule," 62 FR 12960, National Highway Traffic Safety Administration, US Department of Transportation, Federal Docket No. 74-14; Notice 114 (Section V.A, 12964-12965, par 14, line 58), March 19, 1997.
Anon., The Abbreviated Injury Scale, 1990 Revision, 1998 Update. Association for the Advancement of Automotive Medicine (AAAM), Des Plaines, Illinois, USA, 1998.
Anon., The Abbreviated Injury Scale, 2005, Update 2008. Association for the Advancement of Automotive Medicine (AAAM), Des Plaines, Illinois, USA, 2008.
Anon., “Report to Congress, Status of NHTSA plan for Side Impact Regulation Harmonization and Upgrade,” National Highway Traffic Safety Administration, Washington, DC, March 1999.
Allinson, D., “Roll-Over Protection for Agricultural All Terrain Vehicles,” Report FE/96/01, Health and Safety Laboratory, Buxton, UK, February 1996.
Allinson, D., and Crichton, O., “ATV Roll-Over Protection Feasibility and Development,” Health and Safety Laboratory, Buxton, UK, c. April 1997.
Bierman, H.R., Wilder, R.M., and Hellems, H.K., The Physiological Effects of Compressive Forces on the Torso, Report No. 8, Naval Medical Research Institute Project X-630, Bethesda, MD, 1946.
Box, B.E.P, Hunter, W.G., and Hunter, J.S., Statistics for Experimenters, John Wiley & Sons, New York, 1978.
Clapperton, A.J., Herde. E.L., Lower, T., “Quad bike-related injury in Victoria, Australia,” Medical Journal of Australia, 199(6), 16 September 2013.

100
Dahle, J.L., “Occupant Protection for All-Terrain Vehicles,” Society of Automotive Engineers Paper SAE 871920, 1987.
DiMaio, V.J., and DiMaio, D., Asphyxia. In: Forensic Pathology, 2nd edition, V.J. Geberth, editor Boca Raton, Florida, CRC Press, 2001.
Garland, S., All-Terrain Vehicle Death (ATVD) Database, 2005 through 2009 (as of 16 September 2011) and Coding Manual (October 2010), Consumer Product Safety Commission, Directorate for Epidemiology Division of Hazard Analysis, Bethesda, MD.
Grzbebieta, R., Rechnitzer, G., Simmons, K., and McIntosh, A., “Final Project Summary Report: Quad Bike Performance Project Test Results, Conclusions, and Recommendations”, Transport and Road Safety (TARS), Report 4, University of New South Wales, Sydney, Australia, January 2015.
Hopkins, I.H.G., Pountney, S.J., Hayes, P., and Sheppard, M.A., “Crowd Pressure Monitoring,” In: Engineering for Crowd Safety, R.A. Smith and J.F. Dickie (editors), Elsevier Science Publishers B.V., 1993.
Iijima, S., Hosono, S., Ota, A., Yamamoto, T., “Exploratory Study of an Airbag Concept for a Large Touring Motorcycle” Paper No. 98-S10-O-14, Sixteenth International Technical Conference on the Enhanced Safety of Vehicles, Windsor, Canada, 1-4 June 1998.
Johnson, F.H., Carpenter, T.G., Wright, R.R., and Nelson, R., “A Safer ATV,” Society of Automotive Engineers Paper SAE 911945, 1991.
Kaleps, I., White, R.P., Beecher, R.M., Whitestone, J., and Obergefell, L.A., “Measurement of Hybrid III Dummy Properties and Analytical Simulation Data Base Development,” Harry G. Armstrong Aerospace Medical Research Laboratory, AAMRTL-TR-88-05, February 1988.
Kebschull, S.A., Zellner, J.W., Van Auken, R.M., and Rogers, N., “Injury Risk/Benefit Analysis of Motorcyclist Protective Devices Using Computer Simulation and ISO 13232,” Proceedings of the 16th International Technical Conference On the

101
Enhanced Safety of Vehicles, Windsor, Canada, Paper Number 98-S10-W-26, 1-4 June 1998.
Kramer, F. and Appel, H., “Evaluation of Protection Criteria on the Basis of Statistical Biomechanics,” Proceedings of the 1990 International IRCOBI Conference on the Biomechanics of Impacts, Lyon, France, 1990.
Kuroe, T., Namiki, H. and Iijima, S, “Exploratory Study of an Airbag Concept for a Large Touring Motorcycle: Further Research Second Report,” 19th Enhanced Safety of Vehicle Conference, Paper Number 05-0316, May 2005.
Kuchar, A.C., “A Systems Modeling Methodology for Estimation of Harm in the Automotive Crash Environment,” Volpe National Transportation Systems Center, US Department of Transportation, 17th International Technical Conference on the Enhanced Safety of Vehicles, Paper No. 01-354, Amsterdam, May 2001.
Landis, J.R and Koch, G.G, “The Measurement of Observer Agreement for Categorical Data,” Biometrics 33 (1), 1977, 159–174.
Laubach, L. L., and McConville, J. T. 1969, “The Relationship of Strength to Body Size and Typology,” Medicine and Science in Sports, 1, 189 – 194.
Lenkeit, J.F., Kelly, J., and Broen, P.C., Operational Considerations Related to the Use of ATVs by the Bureau of Land Management, Dynamic Research Inc. Technical Report DRI-TR-05-20-3, October 2006.
Liu, B.C., Ivers, R., Norton, R., Boufous, S., Blows, S., and Lo, S.K., Helmets for preventing injury in motorcycle riders, Cochrane Database of Systematic Reviews 2008, Issue 1. Art. No.: CD004333. DOI: 10.1002/14651858.CD004333.pub3. Available at: http://www.cochrane.org.
Lower, T., Fragar, L., and Herde, E., Quad Bike Rollover Deaths in Australia (2001-2009), Brief Report Prepared for the Trans Tasman Quad Bike (Engineering) Group, Australia Centre for Agricultural Health and Safety, October 5-6, 2010.

102
Malliaris, A.C., Hitchcock, R., and Hedlund, J., “A search for priorities in crash protection,” Society of Automotive Engineers Paper Number SAE 820242, Warrendale, Pennsylvania, 1982.
McKenzie, A., Law and History Review, Summer, Vol. 23, No. 2. University of Illinois, 2005.
Munoz, S., Van Auken, R.M., and Zellner, J.W., An Assessment of the Effects of the Robertson V-Bar ROPS on the Risk of Rider Injury due to Overturns Resulting from ATV Misuse, Dynamic Research Inc. Technical Report DRI-TR-07-14, July 2007.
Myers, R., Classical and Modern Regression with Applications, Second Edition, Duxbury Press, Belmont, California, 1990.
Nash, J.E. and Sutcliffe, J.V., “River Flow Forecasting through Conceptual Models, Part I - A Discussion of Principles,” Journal of Hydrology, 10 (3), 282–290, 1970.
Obergefell, L.A., Fleck, J.T., Kaleps, I., and Gardner, T.R., “Articulated Total Body Model Enhancements,” Harry G. Armstrong Aerospace Medical Research Laboratory, AAMRL-TR-88-009, January 1988.
Ootani, R. and Chinmoy, P. “Effective Numerical Simulation Tool for Real-World Rollover Accidents by Combining PC-Crash and FEA,” Society of Automotive Engineers Paper SAE 2007-01-1773, 2007.
Osendorfer, H., and Rauscher, S. “The Development of a New Class of Two-Wheeler Vehicles,” 17 International Technical Conference on the Enhanced Safety of Vehicles, Paper Number 01-S8-O-475, Amsterdam, May 2001.
Piziali, R.L., Ayres, T.J., Paver, J.G., Fowler, G., and McCarthy, R.L., “Investigation of the Net Safety Impact of an Occupant Protection System from All-Terrain Vehicles,” Society of Automotive Engineers Paper SAE 930208, 1993.
Piziali, R.L., Fowler, G.F., Merala, R., Grewal, D.S., and McCarthy, R.L., “Evaluation of a Proposed ATV Design Modification,” Society of Automotive Engineers Paper SAE 940276, 1994.

103
Rajaraman, S., Ramakrishnan, S., Thorsley, D., Wesensten, N.J., Thomas J., Balkin, T.J., and Reifman, J., “A New Metric for Quantifying Performance Impairment on the Psychomotor Vigilance Test,” J. Sleep Research, Vol. 21, 2012, 659–674.
Rechnitzer, G., Day, L., Grzebieta, R., Zou, R., and Richardson, S., “All Terrain Vehicle Injuries and Deaths,” Monash University Accident Research Centre, March 2003.
Rodgers, G.B, “The Effectiveness of Helmets in Reducing All-Terrain Vehicle Injuries and Deaths,” Accident Analysis and Prevention, 1990 Feb; 22(1):47–58.
Rogers, N.M., and Zellner, J.W., "An Overall Evaluation of UKDS Motorcyclist Leg Protectors based on ISO 13232," Proceedings of the 16th International Technical Conference on Enhanced Safety of Vehicle, Paper No. 98-S10-O-13, Windsor, Canada, June 1998.
Rogers, N.M., and Zellner, J.W., "A Technical Review of Motorcycle Crash Simulation Methodologies," International Crashworthiness Conference, ICrash 2004, Graz, Austria, July 2004.
Ross, S., A First Course in Probability, Macmillan Publishing, New York, 1976 (252-257)
The Honorable Jeffrey W. Runge, M.D., Administrator, National Highway Traffic Safety Administration before the Committee On Commerce, Science, and Transportation, United States Senate, Washington, DC, February 26, 2003
Satterthwaite, F. E., "An Approximate Distribution of Estimates of Variance Components," Biometrics Bulletin, Vol. 2, 1946 (110–114).
Sauvageau, A., and Boghossian, E., “Classification of Asphyxia: The Need for Standardization,” Journal of Forensic Sciences, 2010.
Smith, R.A., and Lim, L.B., “Experiments to Investigate the Level of ‘Comfortable’ Forces for People Against Crush Barriers,” Safety Science, Volume 18, pp 329-335, 1995.

104
Smith, T.A, Kebschull, S.A., and Zellner, J.W., A Pilot Study to Determine Maximum Tolerable Static Chest Forces in Volunteer Subjects, Dynamic Research Inc. Technical Memorandum DRI-TM-11-82, November 2011.
Sulman, R., Kapke, P., and Robertson, D, “Test Report – ATV Rollover Protection Structure,” Sulman, Toowoomba, Queensland, February 2007.
Thompson, K.M., Graham, J.D., and Zellner, J.W., “Risk-Benefit Analysis Methods for Vehicle Safety Devices,” Proceedings of the 17th International Technical Conference on the Enhanced Safety of Vehicles, Amsterdam, Paper Number 01-S4-O-340, 2001, June 2001.
Thompson, K.M., Managing the Risks of Injury for Operators of All-Terrain Vehicles (ATVs) and Evaluation of the Potential Role of Rollover Protection Systems (ROPS) and Crush Protection Devices (CPDs): Creating the Right Incentives to Improve Outcomes: Perspective, Available at: http//:www.aorm.com, 30 November 2011.
Tyler-Street, M.D., Mathematical Modelling of an ATV and Rider in an Overturn, Contract Research Report 222/1999, Prepared by the Motor Industry Research Association for the Health & Safety Executive, HSE Books, Sudbury, UK, 1999.
Van Hoof, J., Puppini, R., Baldauf, H., Oakley, C., and Kayvantash, K., “ADVISER: A Software Tool for Evaluation and Rating of Numerical Models in Crash Safety Analyses,” Society of Automotive Engineers Paper SAE 2003-06-0188, 2003.
Van Auken, R.M., and Zellner, J.W., “ATV ROPS/CPD Tests and Simulations,” Dynamic Research, Inc., Technical Report DRI-TR-98-2, October 1998.
Van Auken, R.M., Munoz, S., and Zellner, J.W., ATV Misuse Scenarios for the Computer Simulation of ATV Overturns, Dynamic Research Inc., Technical Report DRI-TR-03-07, May 2003.
Van Auken, R.M., Smith, T.A., and Zellner, J.W., “Development of a Probabilistic Skull Fracture Model for a Fiftieth Percentile Adult Male Motorcyclist ATD Head Form,” forthcoming conference paper, 2008(a) (see Van Auken et al. (2011)).

105
Van Auken, R.M., Zellner, J.W., Smith, T.A., Rogers, N., "Development of an Improved Neck Injury Assessment Criteria for the ISO 13232 Motorcyclist Anthropometric Test Dummy," Paper No. 05-0227-O, 19th International Technical Conference on the Enhanced Safety of Vehicles, Washington, D.C., June 2005.
Van Auken, R.M., Smith, T.A., and Zellner, J.W., “Development of a Probabilistic Skull Fracture Model for a Fiftieth Percentile Adult Male Motorcyclist ATD Head Form,” 22nd
International Technical Conference on Enhanced Safety of Vehicles, Paper 11-00035, Washington DC, June 2011.
Van Ee, C.A., Toomey, D.E., Moroski-Brown, B.A, Vander Roest, M. and Wilson, A., “ATV Rollover, Rider Response and Determinants of Injury: In-Depth Analysis of Video-documented ATV Rollover Events, Traffic Injury Prevention, Volume 15, 2014.
Weiss, C., Rieger, G., and Scheef, J., “Advanced Development Methods in Passive Vehicle Safety,” Society of Automotive Engineers Paper SAE 2001-07-0160, 2001.
Welch, B. L., "The Generalization of "Student's" Problem when Several Different Population Variances are Involved," Biometrika 34 (1–2), 1947, pp 28–35.
Zellner, J.W., Kebschull, S.A., Van Auken, R.M., Lenkeit, J.F. and Broen, P.C., “Review and Analysis of MUARC Report “ATV Injuries and Deaths,” and Additional Simulations and Initial Testing of MUARC ATV Roll Over Protection System (ROPS),” Vols. I, II and III, Dynamic Research Inc., Technical Report DRI-TR-04-01, January 2004.
Zellner, J.W., Van Auken, R.M., Kebschull, S.A., and Boughton, J.P., “G Forces Acting on MUARC ATV ROPS/CPD and Rider during Rollovers and Impacts,” Technical Memorandum 04-74-1, Dynamic Research, Inc., December 2004(a).
Zellner, J.W., and Broen, P.C., Mass Characteristics of MUARC ROPS and Comparison Vehicles, Dynamic Research Inc. Technical Memorandum, DRI-TM-04-71, January 2005.
Zellner, J.W., Van Auken, R.M., Kebschull, S.A., and Munoz, S., “Injury risk-benefit analysis of rollover protection systems (ROPS) for All-Terrain Vehicles (ATVS) Using Computer Simulation, Full-scale Testing and ISO 13232,” Paper F2008-08-009, FISITA

106
(International Federation of Automotive Societies) World Automotive Congress Proceedings, Volume II (Vehicle Safety), Munich, Germany, 14-19 September 2008, pp 14-27.
Zellner, J.W., Smith, T.A, and Kebschull, S.A., Approximate AIS Injury Coding of 113 US/UK ATV Accidents, Dynamic Research Inc., Technical Memorandum DRI-TM-04-77, December 2004(b), and DRI-TM-04-77-1, Revised November 2011.
Zellner, J. W., Kebschull, S. A., Van Auken, R. M., “Predicted Effectiveness of Potential Injury Countermeasures for All-Terrain Vehicle Overturns,” Paper No. 14-2272, 93rd Annual Meeting of the Transportation Research Board, Washington, D.C., January 2014.

A-1
APPENDIX A
UPDATED CONDITIONS AND INJURY CODINGS FOR 110 US/UK CASES

A-2
AIS Injury Levels
Hea
d –
Bra
in
Hea
d - V
ault
Frac
ture
Face
Fra
ctur
e
Lower Extremities
MA
IS
Femurs
Knees
Tibias
Cas
e ID
Nec
k
Che
st
Asp
hyxi
a
Abd
omen
Rig
ht
Left
R o
r L
Rig
ht
Left
R o
r L
Rig
ht
Left
R o
r L
Injury factors 1 0 0 0 0 3 0 0 0 0 0 0 0 0 0 0 0 3 3 broken ribs 2 0 0 0 2 0 0 0 0 0 0 0 0 0 0 0 0 2 fracture of one vertebra, (DRI assumed to be neck) 8 0 0 0 0 0 0 0 0 0 0 0 0 0 0 0 2 2 broken and dislocated ankle 9 0 0 0 0 0 0 0 0 0 0 0 0 0 0 0 0 0 bruises and lacerations from striking barbed wire fence
10 1 0 0 0 0 0 0 0 0 0 0 0 0 0 0 0 1 concussion
11 0 0 0 0 0 0 0 0 0 0 0 0 0 0 0 0 one sustained broken arm and the other bruising (DRI assumed broken arm was radius = AIS 2)
12 0 0 0 0 0 0 0 0 0 0 0 0 0 0 0 0 broken L wrist, from (rider) impact with ground
14 4 2 0 0 0 0 0 0 0 0 0 0 0 0 0 0 4 crushing, severe head injuries (DRI assumed large edema with a total volume of 30 - 50 cc's with midline shift and a vault fracture)
17 0 0 0 0 2 0 0 0 0 0 0 0 0 0 0 0 2 Rib injuries (DRI assumed 2 rib fractures = AIS 2) 18 0 0 0 0 0 0 0 0 0 0 0 0 0 0 0 0 0 fractured collar bone from handlebar impact 19 0 0 0 0 2 0 0 0 0 0 0 0 0 0 0 0 2 bruising, broken teeth and 2 cracked ribs 22 0 0 0 0 0 0 0 0 0 0 0 0 0 2 0 0 2 Fractured RL (DRI assumed tibia Fx = AIS 2) 23 2 0 0 0 0 0 0 0 0 0 0 0 0 0 0 0 2 Injuries to head and back (DRI assumed skull fracture = AIS 2) 27 0 0 0 0 0 0 0 0 0 0 0 0 0 0 0 0 0 lacerated left shoulder 29 0 0 0 0 0 0 0 0 0 0 0 0 0 0 0 0 dislocation of L shoulder and fracture of R wrist
31 0 0 0 0 0 0 0 0 0 0 0 0 0 0 0 0 0 Fatal injury reported - injury location and type not specified. Loaded shotgun discharged
33 0 2 0 0 0 0 0 0 0 0 0 0 0 0 0 0 2 fractured skull 34 0 0 0 0 2 0 0 0 0 0 0 0 0 0 0 0 2 fractured ribs (DRI assumed 2 rib fractures = AIS 2)
36 0 0 0 0 0 0 0 0 0 0 0 0 0 0 2 0 2 L leg muscle/tendon damage and fracture, (DRI assumed leg = tibia = AIS 2)
37 6 0 0 0 0 0 0 0 0 0 0 0 0 0 0 0 6 Fatal injury reported (DRI assumed massive destruction of skull, brain and intracranial contents = AIS 6)
38 0 0 0 0 0 0 0 0 0 0 0 0 0 0 0 0 0 injured 39 0 0 0 0 0 0 0 0 0 0 0 0 0 0 0 0 0 no injuries 40 0 0 0 0 0 0 0 0 0 0 0 0 0 2 0 0 2 breaking R leg (DRI assumed "leg" = "tibia" = AIS 2) 42 0 0 0 0 0 6 0 0 0 0 0 0 0 0 0 0 6 asphyxiated, bike landed across chest 46 0 0 0 0 2 0 0 0 0 0 0 0 0 0 0 0 2 crush injuries to the chest (assume 2 fractured ribs)
50 0 0 0 5 0 0 0 0 0 0 0 0 0 0 0 0 5 fracturing spine and causing paralysis (DRI assumed C4 or lower complete cord syndrome with fracture)
51 0 0 0 0 2 0 0 0 0 0 0 0 0 0 0 0 2 2 cracked ribs 56 0 0 0 0 0 0 0 0 0 0 0 0 0 0 0 0 0 No injuries reported 59 0 0 0 0 0 0 0 0 0 0 0 0 0 0 0 0 0 Bruising 61 0 0 0 0 0 0 0 0 0 0 0 0 0 0 2 0 2 broken L ankle 62 0 0 0 0 0 0 0 0 0 0 0 0 0 0 0 0 0 severe head lacerations

A-3
AIS Injury Levels
Hea
d –
Bra
in
Hea
d - V
ault
Frac
ture
Face
Fra
ctur
e
Lower Extremities
MA
IS
Femurs
Knees
Tibias C
ase
ID
Nec
k
Che
st
Asp
hyxi
a
Abd
omen
Rig
ht
Left
R o
r L
Rig
ht
Left
R o
r L
Rig
ht
Left
R o
r L
Injury factors 63 0 0 0 0 0 0 0 0 0 0 0 0 0 0 0 0 0 Back injuries 65 0 0 0 0 0 0 0 0 0 0 0 0 0 0 0 0 0 severe bruising 67 0 0 0 0 0 0 0 0 0 0 0 0 0 0 0 0 0 laceration to forehead (chin strap not fastened) 69 0 0 0 0 0 0 0 0 0 0 0 0 0 0 0 0 0 facial lacerations
70 3 2 0 0 0 0 0 0 0 0 0 0 0 0 0 0 3 Extensive head injuries - NFS (DRI assumed multiple injuries to cerebrum, NFS)
71 0 0 0 0 0 0 0 0 0 0 0 0 0 0 0 0 fractured wrist
72 0 0 0 0 2 0 0 0 0 0 0 0 0 0 0 2 2 sustaining injuries to ribs and ankle, (DRI assumed injuries to ribs to be 2 fractures and ankle injury to be a fracture)
74 0 0 0 0 0 0 0 0 0 0 0 0 0 0 0 0 0 broken collar bone 75 0 0 0 0 0 6 0 0 0 0 0 0 0 0 0 0 6 Death due to asphyxiation 78 0 0 0 0 0 0 0 0 0 0 2 2 0 0 0 0 2 Bilateral knee injuries - NFS - (DRI assumed knee dislocations) 79 0 0 0 0 2 0 0 0 0 0 0 0 0 0 0 0 2 Broken pelvis and ribs (DRI assumed 2 rib fractures = AIS 2) 80 0 0 0 0 0 0 0 0 0 0 0 0 0 0 0 0 0 Wrenched knee and shoulder - NFS 81 0 0 0 0 0 0 0 0 0 0 0 0 0 0 0 0 0 sprained back muscle 82 0 0 0 0 0 0 0 0 0 0 0 0 0 0 0 0 0 Hand injuries 83 0 0 0 0 0 0 0 0 0 0 0 0 0 0 0 0 0 L collar bone 88 0 0 0 0 0 0 0 0 0 0 0 0 0 0 0 0 0 bruising 91 0 0 0 0 0 0 0 0 0 0 0 0 0 0 0 0 severe bruising, fractured right wrist 92 1 0 0 0 0 0 0 0 0 0 0 0 0 0 0 0 1 broken collar bone and concussion (assume concussion = AIS 1) 94 0 0 0 0 0 0 0 0 0 0 0 0 0 0 0 0 fractured right humerus 95 0 0 0 0 0 0 0 0 0 0 0 0 0 0 0 0 0 Kidney damage
96 0 0 0 0 0 0 0 0 0 0 0 0 0 0 0 0 left elbow dislocated and fractured (DRI assumed ulna fracture = AIS 2)
97 0 0 0 0 0 0 0 0 0 0 0 0 0 0 0 0 0 cuts to cheek
100 2 0 0 0 0 0 0 0 0 0 0 0 0 0 0 0 2 Fractured skull (assumed AIS 2), fractured arm (assumed to be radius/ulna = AIS 2), punctured eardrum
103 0 0 0 0 0 0 0 0 0 0 0 0 0 0 0 0 0 back injury - severity unknown 105 0 0 0 0 0 0 0 0 0 0 0 0 0 0 0 0 0 Dislocated collar bone
890110BEP0006 0 0 0 0 0 0 0 0 0 0 0 0 0 0 0 0 0 Contusions, Abrasions - 25-50% of body 890123BEP0010 0 0 0 0 0 0 0 0 0 0 0 0 0 0 0 0 Fracture - Wrist
890131BEP0001 0 0 0 0 1 0 0 0 0 0 0 0 0 0 0 0 1 Fracture - Trunk, upper (not including shoulders) (DRI assumed this to be a rib fracture = AIS 1)
890314BEP0010 0 0 0 0 0 0 0 0 0 0 0 0 0 0 0 0 0 Hematoma - Leg, lower (not including knee or ankle) 890317BEP0004 0 0 0 0 0 0 0 0 0 0 0 0 0 0 0 0 0 Strain or Sprain - Trunk, lower 890317BEP0006 0 0 0 0 0 0 0 0 0 0 0 0 0 0 0 0 0 Contusions, Abrasions - 25-50% of body 890501BEP0011 0 0 0 0 0 0 0 0 0 0 0 0 0 0 0 0 Fracture - Elbow (DRI assumed this to be a ulna fracture = AIS 2) 890508BEP0001 0 0 0 0 0 0 0 0 0 0 0 0 0 0 0 0 0 Contusions, Abrasions - Elbow

A-4
AIS Injury Levels
Hea
d –
Bra
in
Hea
d - V
ault
Frac
ture
Face
Fra
ctur
e
Lower Extremities
MA
IS
Femurs
Knees
Tibias C
ase
ID
Nec
k
Che
st
Asp
hyxi
a
Abd
omen
Rig
ht
Left
R o
r L
Rig
ht
Left
R o
r L
Rig
ht
Left
R o
r L
Injury factors 890508BEP0006 0 0 0 0 0 0 0 0 0 0 0 0 0 0 0 0 Fracture - Arm, lower (not including elbow or wrist) 890531BEP0014 0 0 0 0 0 0 0 0 0 0 0 0 0 0 0 0 0 Contusions, Abrasions - Shoulder (including clavicle, collarbone) 890601BEP0006 0 0 0 0 0 0 0 0 0 0 0 0 0 0 0 0 0 Contusions, Abrasions - Trunk, upper (not including shoulders) 890601BEP0007 0 0 0 0 0 0 0 0 0 0 0 0 0 0 0 0 0 Fracture - Shoulder (including clavicle, collarbone) 890613BEP0017 0 0 0 0 0 0 0 0 0 0 0 0 0 0 0 0 0 Laceration - 25-50% of body 890614BEP0005 0 0 0 0 0 0 0 0 0 0 0 0 0 0 0 0 0 Strain or Sprain - Trunk, lower 890628BEP0008 0 0 0 0 0 0 0 0 0 0 0 0 0 0 0 0 0 Contusions, Abrasions - Leg, upper 890630BEP0001 0 0 0 0 0 0 0 0 0 0 0 0 0 0 0 0 0 Contusions, Abrasions - Trunk, lower 890712BEP0004 0 0 0 0 0 0 0 0 0 0 0 0 0 0 0 0 0 Strain or Sprain - Trunk, upper (not including shoulders) 890712BEP0006 0 0 0 0 0 0 0 0 0 0 0 0 0 0 0 0 0 Laceration - Face (including eyelid, eye area and nose) 890724BEP0006 0 0 0 0 0 0 0 0 0 0 0 0 0 0 0 0 0 Contusions, Abrasions - Trunk, upper (not including shoulders) 890725BEP0004 0 0 0 0 0 0 0 0 0 0 0 0 0 0 0 0 0 Laceration - Face (including eyelid, eye area and nose) 890805BEP0008 0 0 0 0 0 0 0 0 0 0 0 0 0 0 0 0 0 Contusions, Abrasions - Knee 890821BEP0006 0 0 0 0 0 0 0 0 0 0 0 0 0 0 0 0 0 Contusions, Abrasions - Foot 890824BEP0010 0 0 0 0 0 0 0 0 0 0 0 0 0 0 0 0 0 Fracture - Shoulder (including clavicle, collarbone) 890831BEP0004 0 0 0 0 0 0 0 0 0 0 0 0 0 0 0 0 0 Contusions, Abrasions - Leg, lower (not including knee or ankle)
890905BEP0005 0 0 0 0 1 0 0 0 0 0 0 0 0 0 0 0 1 Fracture - Trunk, upper (not including shoulders) (DRI assumed this to be a rib fracture = AIS 1)
890912BEP0001 0 0 0 0 0 0 0 0 0 0 0 0 0 0 0 2 2 Fracture - Ankle
890913BEP0005 0 0 1 0 0 0 0 0 0 0 0 0 0 0 0 0 1 Fracture - Face (including eyelid, eye area and nose) (DRI assumed this to be "Face fracture NFS" = AIS 1)
891004HEP9001 0 0 0 0 0 0 0 0 0 0 0 0 0 0 0 0 0 Fracture - Trunk, lower 891013HEP9001 0 0 0 0 0 0 0 0 0 0 0 0 0 0 0 0 0 #N/A 891016HEP9003 0 0 0 0 0 0 0 0 0 0 0 0 0 0 0 0 0 Laceration - Face (including eyelid, eye area and nose) 891016HEP9009 0 0 0 0 0 0 0 0 0 0 0 0 0 0 0 0 0 Strain or Sprain - Trunk, upper (not including shoulders) 891113HEP9004 0 0 0 0 0 0 0 0 0 0 0 0 0 0 0 0 0 Strain or Sprain - Ankle 891211HEP9004 0 0 0 0 0 0 0 0 0 0 0 0 0 0 0 0 0 Strain or Sprain - Ankle
890313BEP0025 0 0 0 0 0 0 0 0 0 0 0 0 0 0 0 0 0 Fracture - Face (including eyelid, eye area and nose) (DRI did not use this as a face fracture because the model does not allow for helmeted face fractures)
890511BEP0004 0 0 0 0 0 0 0 0 0 0 0 0 0 0 0 0 0 Contusions, Abrasions - Knee
890619BEP0001 0 0 0 0 1 0 0 0 0 0 0 0 0 0 0 0 1 Fracture - Trunk, upper (not including shoulders) (DRI assumed this to be a rib fracture = AIS 1)
890907BEP0005 0 0 0 0 0 0 0 0 0 0 0 0 0 0 0 0 0 Fracture - Hand 890919BEP0007 0 0 0 0 0 0 0 0 0 0 0 0 0 0 0 0 0 Dislocation - Shoulder (including clavicle, collarbone) 891113HEP9002 0 0 0 0 0 0 0 0 0 0 0 0 0 0 0 0 0 Strain or Sprain - Finger 891219HEP9006 0 0 0 0 0 0 0 0 0 0 0 0 0 0 0 0 Fracture - Elbow (DRI assumed this to be an ulna fracture) 891219HEP9007 0 0 0 0 0 0 0 0 0 0 0 0 0 0 0 0 Fracture - Wrist

A-5
AIS Injury Levels
Hea
d –
Bra
in
Hea
d - V
ault
Frac
ture
Face
Fra
ctur
e
Lower Extremities
MA
IS
Femurs
Knees
Tibias C
ase
ID
Nec
k
Che
st
Asp
hyxi
a
Abd
omen
Rig
ht
Left
R o
r L
Rig
ht
Left
R o
r L
Rig
ht
Left
R o
r L
Injury factors 891228HEP1281 0 0 0 1 0 0 0 0 0 0 0 0 0 0 0 0 1 Strain or Sprain - Neck (DRI assumed this to be AIS 1) 891229HEP9001 0 0 0 0 0 0 0 0 0 0 0 0 0 0 0 0 Fracture - Arm, lower (not including elbow or wrist) 891229HEP9005 0 0 0 0 0 0 0 0 0 0 0 0 0 0 0 0 0 Laceration - Leg, upper
970520HCC2189 5 0 0 0 0 0 0 0 0 0 0 0 0 0 0 0 5 Fatal closed head injury (DRI assumed this to be cerebellum contusion, single or multiple, extensive; massive = AIS 5)
970225HCC5351 0 0 0 0 0 6 0 0 0 0 0 0 0 0 0 0 6 Death due to asphyxiation
970429HCC1177 0 0 0 0 0 0 5 0 0 0 0 0 0 0 0 0 5 Death due to severe abdominal injuries - NFS (DRI assumed aorta rupture/transection)
970321HWE4112 5 2 0 0 3 0 0 0 0 0 0 0 0 0 0 0 5
Fatal "head and chest injuries" "There appeared to be a neck fracture or dislocation with a freely moveable cervical spine and a palpable skull fracture" (DRI assumed this to be severe DAI = AIS 5, skull fracture = AIS 2, and 3 rib fractures = AIS 3)
970702HEP1921 0 0 0 0 1 0 0 0 0 0 0 0 0 0 0 0 1 Fractured rib 970717HEP0961 0 0 0 0 0 0 0 0 0 0 0 0 0 0 0 0 0 Minor cuts and scrapes 970728HEP1921 0 0 0 0 0 0 0 0 0 0 0 0 0 0 0 0 Fractured right wrist 970707HEP8035 0 0 0 0 0 0 0 0 0 0 0 0 0 0 0 0 0 Bruised left shoulder 970813HEP4081 0 0 0 0 0 0 0 0 0 0 0 0 0 0 0 0 0 Sprained knee - NFS
970905HCN0523 5 2 0 0 0 0 0 0 0 0 0 0 0 0 0 0 5 Death due to head trauma - NFS (DRI assumed this to be cerebellum contusion, single or multiple, extensive; massive = AIS 5 and vault fracture = AIS 2)
List of abbreviations: MAIS: Maximum Abbreviated Injury Score NFS: Not further specified DAI: Diffuse axonal injury

B-1
APPENDIX B
ORIGINAL METHODOLOGY USED TO DEFINE THE 113 US/UK ATV OVERTURN TYPES

B-2
Criterion or Assumption 1 Case was a real world ATV accident 2 Case information was collected and placed in a database by an impartial source (i.e.,
national government field investigators) 3 Case was made available to DRI 4 59 UK/HSE cases plus 54 US/CPSC cases (n=113) is a large enough sample size to
detect statistically significant differences of 10% or greater, in paired comparisons involving continuous variable outcomes, within 95 percent confidence intervals
5 Involved a 4-wheeled ATV (without trailer; and not a 3-wheeled, 6-wheeled or other type of vehicle)
6 Involved a solo rider (or else could plausibly have also occurred with a solo rider) 7 Involved an ATV overturn (or else could plausibly have involved an overturn, e.g., the
ATV “landed on …”) 8 Contained description of at least one of the following: terrain, speed, obstacle, control
inputs, ATV motion, rider motion 9 Used all cases that met above criteria and which an overturn type could be simulated (i.e.,
a census) 10 Assumed cases were a representative sample of ATV accidents for purposes of evaluating
ATV rider rollover protection systems (ROPS) 11 Assumed 17 initial conditions and control inputs for each case, based on information
in the case file, or else assumed plausible values which were consistent with the information in the case file, and which resulted in a simulated overturn (see initial condition table, in Zellner et al. (2004), Annex E)
12 Initial conditions and control inputs for each case were constrained to be physically reproducible via full-scale tests with a servo-controlled ATV and an instrumented crash dummy, in order to be able to calibrate and validate the computer simulation model (see Van Auken, 1998)
13 Simulation models of ATV and dummy were based on laboratory as well as full-scale measurements, including approximately 39 dummy static and dynamic calibration tests according to ISO 13232 (see Kebschull, 1998)
14 Overturn types included 8 types of terrain, including symmetric and asymmetric obstacles, and terrain type, slope, and obstacle length, height and depth (see DRI-TR-03-07). In some cases, symmetry was used (ala ISO 13232-2) to represent the overturn case with a more parsimonious set of overturn type parameters (e.g., the direction of turn in cases involving an asymmetric obstacle would have been switched to match the equivalent symmetric conditions with the simulated asymmetric obstacle location).
15 Computer simulations were based on ISO 13232 (1996) computer simulation requirements and procedures, based on similarities between ATV’s and motorcycles (e.g., straddle seat, handlebars, relatively exposed position of rider, recommended use of a helmet, typical separation from vehicle during an accident, lateral as well as forward impacts, etc.)
16 Computer simulation assumed a 50th percentile male rider (modeled with an ISO 13232 MATD dummy) and a Honda TRX 400 ATV, as typical examples, and in order to minimize the number of parameters being varied

B-3
Criterion or Assumption 17 Simulations were run to evaluate intended use as well some conditions of foreseeable
misuse, i.e., with and without a helmet; and with and without a belt, for those ROPS which include a belt
18 Were not attempting to define the cause of each overturn, or how the rider transitioned to overturn; or specific accidents; but rather a set of initial conditions and control inputs that would result in a simulated overturn or ejection (i.e., were evaluating consequences of overturns, with and with ROPS, rather than the causes of overturn)
19 Were not attempting to reproduce rider injuries in specific accidents, as that requires much more information than was available in the cases files regarding rider size, sex, age, physical condition, specific ATV design, further details of terrain and environment, helmet, clothing, among other variables. In addition, a standardized straddle seat-handlebar-helmet-required dummy is not available for any size beside mid-sized adult male.
20 Overturns and ejections were “passive,” i.e., dependent only on assumed initial conditions, terrain and rider control inputs, and not on adding energy in the form of additional external forces (other than gravity) or active impactors
21 The 113 general “types” of overturn as defined by the limited number of available variables in the case files should result in a typical aggregated distribution of injuries, i.e., for the sample as a whole, many with no injury or low severity, and progressively fewer cases at greater severities
22 Sensitivity analysis: for each case, systematically varied the assumed initial conditions and control inputs (i.e., increased or decreased them), with rule-driven priorities, until six variations per case were obtained, in order to address uncertainty in initial conditions and inputs; and to increase statistical degrees of freedom (see sensitivity analysis flowchart)
23 Magnitudes of sensitivity variations were chosen to be consistent with assumed uncertainty in the coded values in the cases; and sufficiently large to result in variations in ATV and rider motions and estimated injuries
24 Resulting simulation sample size (n=791) of sensitivity analysis sample is large enough to detect statistically significant differences of 5% or greater, in paired comparisons of continuous variable outcomes, within 95 percent confidence intervals
25 The results are “types” of overturn, rather than specific “accident reconstructions.” An overturn “type” is one example scenario from among the many possible scenarios that would be consistent with a given case description.
27 Simulated occurrence of an ATV overturn may be sensitive to the ATV, rider, ground terrain, and initial conditions and the dynamic interactions between these factors. Therefore, these overturn “types” may not result in an overturn for all computer simulations involving initial condition sensitivity variations, ATVs with ROPS/CPD, other ATVs or other rider sizes and weights.

B-4
Criterion or Assumption 28 The original injury risk-benefit analyses were based on all simulations run with a
particular baseline ATV and with that baseline ATV fitted with a ROPS/CPD, and all sensitivity variations, regardless of whether or not overturn occurred. (Note: in the updated analysis, only paired comparisons in which both vehicles (i.e., with ROPS/CPD and without ROPS/CPD) overturned were included in the evaluation. This is because the model is not intended for analyzing the cause of overturns, for which it is not properly designed or calibrated, but rather the consequences of overturn, given that an overturn occurs.
29 The defined overturn “types” were based on misuse cases for ATVs that were not fitted with ROPS/CPD, and therefore do not include conditions for which ROPS/CPD could increase the likelihood of overturn (e.g., overhead obstacles, smaller slopes with raised cg ROPS/CPD, etc.)

C-1
APPENDIX C
UPDATED “LOW ENERGY” METHODOLOGY USED TO DEFINE THE 110 UPDATED US/UK ATV OVERTURN TYPES

C-2

C-3

C-4
Run simulation using the initial speed indicated in Table 1
Ground Type 0 (flat, tilted terrain)
Is SLOPE > 0Yes
No
Starting with the specified slope angle, or 25 degrees, if slope is
not specified in the narrative, increase slope in 2 degree increments
Does ATV overturn?(ATV inclination angle
> 55 deg.)
Yes
No
Starting with an obstacle height of 6 inches,
increase obstacle height in 2 inch increments
Is there an obstacle?Yes
No
Increase the speed by the increment indicated in Table 1 and tire/ground mu by 0.05, starting at
0.8
Is there braking?Yes
Add terminal horizontal ground plane [5] m vertically below
ATV
No
Increase the speed by the increment indicated in Table 1
Type0
End
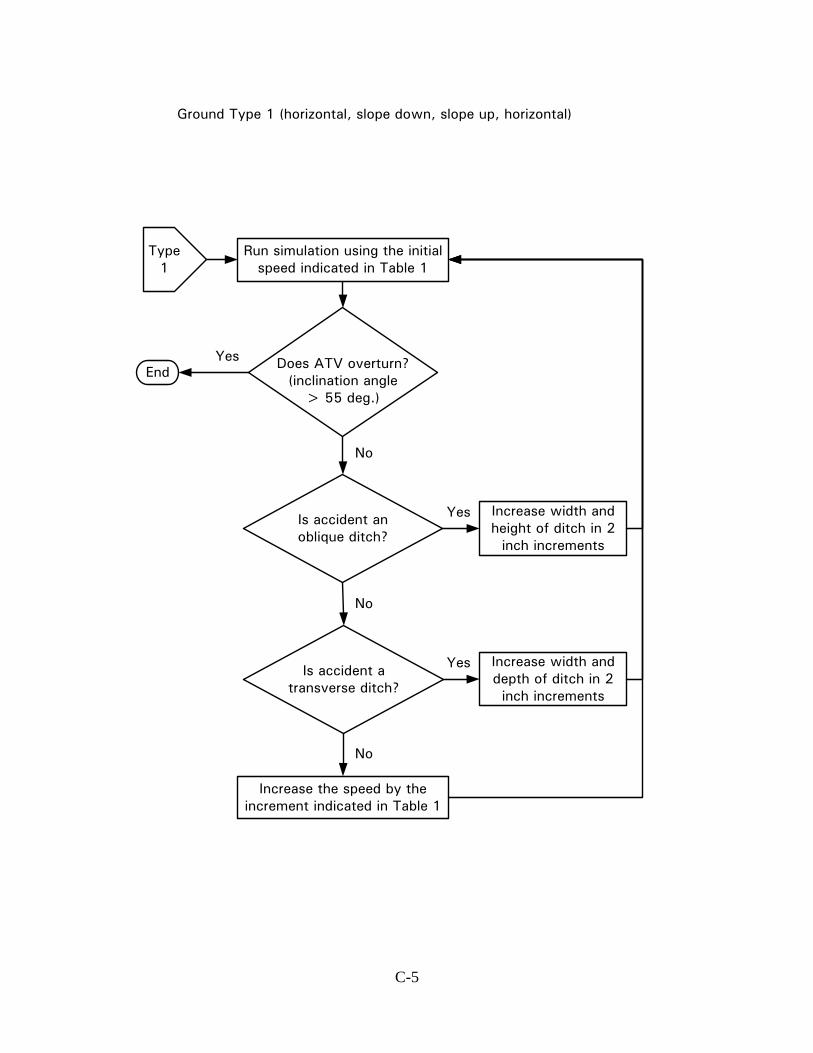
C-5
Run simulation using the initial speed indicated in Table 1
Ground Type 1 (horizontal, slope down, slope up, horizontal)
Is accident anoblique ditch?
Yes
No
Increase width and height of ditch in 2
inch increments
Does ATV overturn?(inclination angle
> 55 deg.)
Yes
No
Is accident atransverse ditch?
Yes Increase width and depth of ditch in 2 inch increments
No
Increase the speed by the increment indicated in Table 1
Type1
End

C-6
Run simulation using the initial speed indicated in Table 1
Ground Type 2 (rutted track)
Does ATV overturn?(ATV inclination angle
> 55 deg.)
Yes
No
Starting with a rut depth of 3 inches, increase width and
depth of ruts in 1 inch increments and increase the
speed by the increment indicated in Table 1
Type2
End

C-7
Run simulation using the initial speed indicated in Table 1
Ground Type 3 (horizontal, obstacle sloped and offset)
Does ATV overturn?(ATV inclination angle
> 55 deg.)
Yes
No
Increase the speed by the increment indicated in Table 1
Type3
End

C-8
Run simulation using the initial speed indicated in Table 1
Ground Type 4 (pothole)
Does ATV overturn?(ATV inclination angle
> 55 deg.)
Yes
No
Increase depth and width of the pothole in 1 inch
increments
Add terminal horizontal ground plane [5] m vertically below
ATV
Type4
End
Increase the slope in 2 degree increments and increase the
speed by the increment indicated in Table 1
Is the slopenon-zero?
No
Yes

C-9
Run simulation using the initial speed indicated in Table 1
Ground Type 5 (ramp)
Does ATV overturn?(ATV inclination angle
> 55 deg.)
Yes
No
Increase lateral offset between the center of the ramp and the
center of the ATV in 1 inch increments and increase the
speed by the increment indicated in Table 1
Type5
End

C-10
Run simulation using the initial speed indicated in Table 1
Ground Type 7 (whoop-de-do)
Does ATV overturn?(ATV inclination angle
> 55 deg.)
Yes
No
Starting with a height of 3 inches, increase peak-to-peak height of whoop-de-doos in
0.5 inch increments and increase the speed by the
increment indicated in Table 1
Type7
End
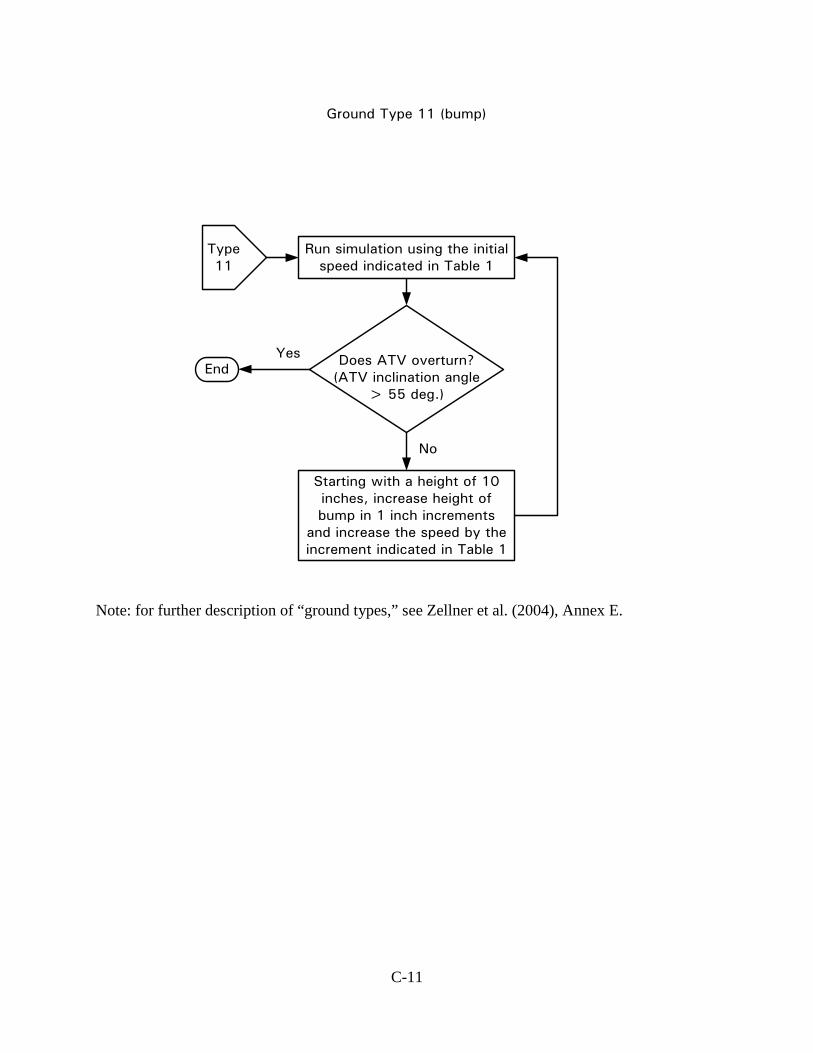
C-11
Note: for further description of “ground types,” see Zellner et al. (2004), Annex E.
Run simulation using the initial speed indicated in Table 1
Ground Type 11 (bump)
Does ATV overturn?(ATV inclination angle
> 55 deg.)
Yes
No
Starting with a height of 10 inches, increase height of bump in 1 inch increments
and increase the speed by the increment indicated in Table 1
Type11
End

D-1
APPENDIX D
17 INITIAL CONDITIONS FOR EACH US/UK ATV OVERTURN TYPE
RESULTING FROM APPLICATION OF THE LOW ENERGY METHODOLOGY

D-2
ATV MATD Ground Run
HSE
/CPS
C M
isuse
Cas
e N
umbe
r
Tota
l # o
f var
iabl
es in
dat
abas
e de
scrip
tion
# of
var
iabl
es fr
om th
e D
B us
ed
by th
e C
S
Tota
l # o
f acc
iden
t var
iabl
es
used
by
the
CS
U (m
ph)
V (m
ph)
Stee
r Tor
que
(ft-lb
s)
Whe
el T
orqu
e M
ode
Bra
ke F
acto
r %
Tors
o Pi
tch
(deg
)
Han
d G
rip (l
bs)
Terra
in T
ype
Slop
e A
ngle
(deg
)
ATV
Hea
ding
(deg
)
Fina
l Slo
pe (d
eg)
d1 (i
n)
d2 (i
n)
Surfa
ce H
ardn
ess
Nom
inal
Fric
tion
Coe
ffici
ent
h Leng
th (s
ec)
Run
ID N
umbe
r
12 0 -100 Dss 100% 0 100 1 30 30 - 38 38 mixed mixed - 10 1 1 6 3 13 10 0 0 Dss 100% 0 100 0 30 0 30 - - soft 1.0 -3 10 2 2 5 3 15 20 0 -10 Dss 100% -25 100 0 40 -30 40 - - soft 1.0 -3 10 3 8 5 3 15 32 0 -100 Dss 100% 0 100 3 0 15 - -6 - mixed mixed -6 10 4 9 6 3 13 20 0 100 Dss 100% 0 100 1 30 30 - 0 72 mixed mixed - 10 5 10 6 4 13 20 0 0 Dss 100% 0 100 1 30 30 - 0 72 mixed mixed - 10 6 11 8 3 13 10 0 0 Dss 100% 0 100 0 0 0 0 - - soft 1.0 -24 10 7 12 6 3 15 8 0 0 Bss 100% 0 100 0 45 90 45 - - soft 1.0 15 10 8 14 9 4 15
10 0 0 T1 100% -25 100 0 45 -90 45 - - hard 1.0 0 10 9 17 5 3 15 10 0 0 Dss 100% 0 100 0 30 0 30 - - soft 1.0 -6 10 10 18 6 2 15 10 0 -100 Dss 100% 0 100 0 30 45 30 - - soft 1.0 0 10 11 19 8 3 15 -5 0 0 Dss 100% 0 100 1 30 -15 - 72 72 mixed mixed - 10 12 22 9 7 13 16 0 0 Dss 100% 0 100 0 0 0 0 - - soft 1.0 -27 10 13 23 7 3 15 10 0 0 Dss 100% 0 100 3 0 45 - 0 - mixed mixed 36 10 14 27 6 3 13 20 0 -100 Dss 100% 0 100 1 15 120 - 0 36 mixed mixed - 10 15 29 7 4 13 15 0 0 Dss 100% 0 100 1 30 7.5 - 36 0 mixed mixed - 10 16 31 10 4 13 18 0 0 T1¼ 100% -25 100 0 14 -90 43 - - soft 1.0 0 10 17 33 6 3 15 18 0 0 Dss 100% 0 100 0 0 0 0 - - soft 1.0 -25 10 18 34 4 3 15 10 0 0 T1 100% 0 100 0 30 -90 30 - - hard 1.0 12 10 19 36 8 3 15 24 0 -50 Dss 100% 0 100 1 30 10 - 48 48 mixed mixed - 10 20 37 7 2 13 26 0 0 B1 100% 0 100 1 45 80 - 72 72 mixed mixed - 10 21 38 5 3 13 28 0 100 Dss 100% 0 100 0 34 135 34 - - soft 1.0 -24 10 22 39 6 4 15 10 0 0 Dss 100% 0 100 0 30 0 30 - - soft 1.0 -3 10 23 40 5 3 15 10 0 -100 Dss 100% 0 100 0 17 19 17 - - soft 1.0 0 10 24 42 9 4 15 14 0 -100 Dss 100% 0 100 0 0 0 0 - - soft 1.0 0 10 25 46 4 2 15 14 0 0 T1¼ 100% 0 100 0 34 -90 34 - - hard 1.0 12 10 26 50 7 3 15 10 0 0 Dss 100% 0 100 0 30 0 30 - - soft 1.0 -6 10 27 51 5 4 15 12 0 -100 Dss 100% 0 100 1 30 30 - 44 44 mixed mixed - 10 28 56 5 2 13 10 0 0 T1 100% -25 100 0 45 -90 45 - - hard 1.0 0 10 29 59 9 3 15 14 0 0 T1 100% 0 100 0 34 -90 34 - - hard 1.0 10 10 30 61 6 3 15

D-3
ATV MATD Ground Run
HSE
/CPS
C M
isuse
Cas
e N
umbe
r
Tota
l # o
f var
iabl
es in
dat
abas
e de
scrip
tion
# of
var
iabl
es fr
om th
e D
B us
ed
by th
e C
S
Tota
l # o
f acc
iden
t var
iabl
es
used
by
the
CS
U (m
ph)
V (m
ph)
Stee
r Tor
que
(ft-lb
s)
Whe
el T
orqu
e M
ode
Bra
ke F
acto
r %
Tors
o Pi
tch
(deg
)
Han
d G
rip (l
bs)
Terra
in T
ype
Slop
e A
ngle
(deg
)
ATV
Hea
ding
(deg
)
Fina
l Slo
pe (d
eg)
d1 (i
n)
d2 (i
n)
Surfa
ce H
ardn
ess
Nom
inal
Fric
tion
Coe
ffici
ent
h Leng
th (s
ec)
Run
ID N
umbe
r
0 0 0 B1 100% 0 100 0 45 0 45 - - soft 1.0 0 10 31 62 7 4 15 -5 0 -100 Dss 100% 0 100 0 30 -45 60 - - soft 1.0 0 10 32 63 7 5 15 10 0 0 Dss 100% 0 100 0 30 0 30 - - soft 1.0 -3 10 33 65 5 3 15 14 0 -100 Dss 100% 0 100 0 0 0 0 - - soft 1.0 0 10 34 67 5 2 15 12 0 0 Dss 100% 0 100 0 0 0 0 - - soft 1.0 -30 10 35 69 6 3 15 34 0 100 Dss 100% 0 100 1 40 30 - 0 40 mixed mixed - 10 36 70 5 3 13 15 0 -100 Dss 100% 0 100 2 - 0 - 4 - mixed mixed - 10 37 71 5 2 11 14 0 -100 Dss 100% 0 100 2 - 0 - 6 - mixed mixed - 10 38 72 6 2 11 24 0 0 B1 100% 0 100 0 0 0 0 - - hard 1.1 0 10 39 74 6 3 15 10 0 0 Dss 100% 0 100 1 30 30 - 72 72 mixed mixed - 10 40 75 10 4 13 2 0 0 Dss 100% 0 100 5 22.5 -85 - 48 6 mixed mixed - 10 41 78 3 2 13
10 0 0 Bss 100% 0 100 0 30 90 30 - - soft 1.0 16 10 42 79 11 5 15 22 0 0 Dss 100% 0 100 0 27.5 75 27.5 - - soft 1.0 -18 10 43 80 7 3 15 14 0 0 Dss 100% 0 100 4 30.5 45 - 13 27 mixed mixed - 10 44 81 6 3 13 10 0 0 T1 100% -25 100 0 45 -90 45 - - hard 1.0 0 10 45 82 6 3 15 15 4 0 Dss 100% 0 100 0 30 0 30 - - soft 1.0 0 10 46 83 6 2 15 -9 0 0 Dss 100% 0 100 5 22.5 85 - 48 -6 mixed mixed - 10 47 88 5 3 13 17 3 0 Dss 100% 0 100 0 0 0 0 - - soft 1.0 0 10 48 91 8 3 15 22 0 0 Dss 100% 0 100 4 40 0 - 8 26 mixed mixed - 10 49 92 8 4 13 15 0 100 Dss 100% 0 100 0 0 0 0 - - hard 1.0 0 10 50 94 6 4 15 14 0 -100 Dss 100% 0 100 0 0 0 0 - - soft 1.0 0 10 51 95 7 2 15 10 1 0 Dss 100% 0 100 0 40 45 40 - - soft 1.0 0 10 52 96 7 4 15 30 0 -100 Dss 100% 0 100 3 0 15 - 0 - mixed mixed 30 10 53 97 7 3 13 14 4 -100 Dss 100% 0 100 0 0 0 0 - - soft 1.0 0 10 54 100 7 2 15 22 0 -50 Dss 100% 0 100 1 15 120 - 0 36 mixed mixed - 10 55 103 7 2 13 14 0 -100 Dss 100% 0 100 2 - 0 - 7 - mixed mixed - 10 56 105 5 3 11 27 0 0 Dss 100% -25 100 0 46 -90 71 - - soft 1.0 0 10 57 890110BEP0006 49 15 15 34 0 0 Dss 100% 0 100 0 0 0 0 - - hard 1.0 -14 10 58 890123BEP0010 50 15 15 25 0 -50 Dss 100% 0 100 7 - 50 - 8.5 120 mixed mixed 0 10 59 890131BEP0001 49 13 13 34 0 0 Dss 100% 0 100 7 - 90 - 7 132 mixed mixed 0 10 60 890314BEP0010 45 13 13

D-4
ATV MATD Ground Run
HSE
/CPS
C M
isuse
Cas
e N
umbe
r
Tota
l # o
f var
iabl
es in
dat
abas
e de
scrip
tion
# of
var
iabl
es fr
om th
e D
B us
ed
by th
e C
S
Tota
l # o
f acc
iden
t var
iabl
es
used
by
the
CS
U (m
ph)
V (m
ph)
Stee
r Tor
que
(ft-lb
s)
Whe
el T
orqu
e M
ode
Bra
ke F
acto
r %
Tors
o Pi
tch
(deg
)
Han
d G
rip (l
bs)
Terra
in T
ype
Slop
e A
ngle
(deg
)
ATV
Hea
ding
(deg
)
Fina
l Slo
pe (d
eg)
d1 (i
n)
d2 (i
n)
Surfa
ce H
ardn
ess
Nom
inal
Fric
tion
Coe
ffici
ent
h Leng
th (s
ec)
Run
ID N
umbe
r
15 0 0 Bss 100% 0 100 1 30 75 - 720 0 mixed mixed - 10 61 890317BEP0004 46 13 13 30 0 100 T1 100% 0 100 0 0 0 0 - - hard 1.0 0 10 62 890317BEP0006 52 15 15 20 0 0 Dss 100% -25 100 0 45 -60 45 - - hard 1.0 -3 10 63 890501BEP0011 44 15 15 5 0 0 Dss 100% -25 100 0 45 -90 45 - - soft 1.0 6 10 64 890508BEP0001 49 15 15
22 0 0 Dss 100% 0 100 0 32 45 32 - - hard 1.0 -6 10 65 890508BEP0006 47 15 15 -2 0 0 Dss 100% -25 100 0 30 -90 30 - - hard 1.0 0 10 66 890531BEP0014 47 15 15 6 0 0 Dss 100% 0 100 0 30 -90 60 - - hard 1.0 0 10 67 890601BEP0006 47 15 15
55 0 -100 Dss 100% 0 100 0 0 -45 25 - - soft 1.0 -3 10 68 890601BEP0007 45 15 15 9 0 0 Dss 100% -25 100 0 34 -30 34 - - soft 1.0 -6 10 69 890613BEP0017 51 15 15
20 0 0 Dss 100% 0 100 0 0 0 0 - - soft 1.0 16 10 70 890614BEP0005 48 15 15 20 0 0 Dss 100% 0 100 0 0 0 0 - - soft 1.0 16 10 71 890628BEP0008 45 15 15 22 0 -100 T1¼ 100% 0 100 0 30 45 30 - - hard 1.0 0 10 72 890630BEP0001 49 15 15 37 0 0 Dss 100% 0 100 7 - 90 - 7 240 mixed mixed 0 10 73 890712BEP0004 50 13 13 23 0 0 T1 100% 0 100 0 0 0 0 - - hard 1.55 0 10 74 890712BEP0006 46 15 15 13 0 0 Dss 100% -25 100 0 53 -90 53 - - hard 1.3 0 10 75 890724BEP0006 44 15 15 5 0 20 B1 100% -25 100 0 45 -60 45 - - hard 1.0 0 10 76 890725BEP0004 46 15 15
23 0 100 Dss 100% 0 100 0 15 -90 -15 - - hard 5.0 0 10 77 890805BEP0008 45 15 15 10 0 0 Dss 100% 0 100 0 45 0 45 - - hard 1.0 -3 10 78 890821BEP0006 44 15 15 24 0 -50 Dss 100% 0 100 7 - 60 - 8.5 150 mixed mixed -3 10 79 890824BEP0010 47 13 13 10 0 -50 Dss 100% 0 100 1 50 15 - 720 0 mixed mixed - 10 80 890831BEP0004 46 13 13 50 0 0 T1¼ 100% 0 100 4 0 0 - 6 48 mixed mixed - 10 81 890905BEP0005 44 13 13 45 0 0 Dss 100% 0 100 0 0 0 0 - - hard 1.0 -6 10 82 890912BEP0001 48 15 15 20 0 0 Dss 100% -25 100 0 45 -90 75 - - hard 1.0 0 10 83 890913BEP0005 47 15 15 10 0 0 T1 100% -25 100 0 45 -90 45 - - soft 1.0 3 10 84 891004HEP9001 46 15 15 5 0 0 T1 100% 0 100 0 30 -90 60 - - hard 1.0 0 10 85 891013HEP9001 47 15 15 5 0 0 B1 100% -25 100 0 40 -90 50 - - hard 1.0 0 10 86 891016HEP9003 47 15 15
17 0 0 Dss 100% 0 100 0 45 0 45 - - soft 1.0 -3 10 87 891016HEP9009 47 15 15 20 0 0 Dss 100% 0 100 0 14 0 14 - - soft 1.0 -3 10 88 891113HEP9004 48 15 15 27 0 0 Dss 100% -25 100 0 45 -90 65 - - soft 1.0 0 10 89 891211HEP9004 48 15 15 22 0 -20 Dss 100% 0 100 0 0 0 0 - - hard 1.0 -24 10 90 890313BEP0025 45 15 15

D-5
ATV MATD Ground Run
HSE
/CPS
C M
isuse
Cas
e N
umbe
r
Tota
l # o
f var
iabl
es in
dat
abas
e de
scrip
tion
# of
var
iabl
es fr
om th
e D
B us
ed
by th
e C
S
Tota
l # o
f acc
iden
t var
iabl
es
used
by
the
CS
U (m
ph)
V (m
ph)
Stee
r Tor
que
(ft-lb
s)
Whe
el T
orqu
e M
ode
Bra
ke F
acto
r %
Tors
o Pi
tch
(deg
)
Han
d G
rip (l
bs)
Terra
in T
ype
Slop
e A
ngle
(deg
)
ATV
Hea
ding
(deg
)
Fina
l Slo
pe (d
eg)
d1 (i
n)
d2 (i
n)
Surfa
ce H
ardn
ess
Nom
inal
Fric
tion
Coe
ffici
ent
h Leng
th (s
ec)
Run
ID N
umbe
r
10 0 0 Dss 100% 0 100 0 30 60 30 - - soft 1.0 -6 10 91 890511BEP0004 49 15 15 30 0 20 Dss 100% 0 100 0 0 0 0 - - hard 1.0 0 10 92 890619BEP0001 46 15 15 25 0 -20 Dss 100% 0 100 0 0 0 0 - - hard 1.0 0 10 93 890907BEP0005 43 15 15 20 0 -20 B1 100% 0 100 0 30 90 30 - - hard 1.0 12 10 94 890919BEP0007 48 15 15 12 0 -20 Dss 100% 0 100 0 0 0 0 - - hard 1.0 -10 10 95 891113HEP9002 47 15 15 15 0 0 Dss 100% 0 100 0 0 0 0 - - soft 1.0 -12 10 96 891219HEP9006 46 15 15 35 0 0 Dss 100% 0 100 0 20 90 20 - - soft 1.0 -24 10 97 891219HEP9007 47 15 15 45 0 0 Bss 25% 0 100 11 0 90 - 60 14 mixed mixed - 10 98 891228HEP1281 45 13 13 35 0 -30 Dss 100% 0 100 0 0 0 0 - - hard 1.5 -3 10 99 891229HEP9001 47 15 15 10 0 -50 Dss 100% 0 100 0 30 60 30 - - soft 1.0 0 10 100 891229HEP9005 47 15 15 19 0 -100 T1 100% 0 100 3 17 9.5 - 0 - mixed mixed 0 10 101 970520HCC2189 13 4 13 19 0 -100 Dss 100% 0 100 1 34 20 - 72 0 mixed mixed - 10 102 970225HCC5351 7 3 13 0 0 0 Dss 100% -25 100 0 45 -90 45 - - hard 1.0 0 10 103 970429HCC1177 9 2 15 8 0 0 Dss 100% 0 100 3 0 90 - 52 - mixed mixed 0 10 104 970321HWE4112 10 2 13
15 0 100 Dss 100% 0 100 0 20 90 20 - - hard 1.0 0 10 105 970702HEP1921 8 4 15 12 0 0 Dss 100% 0 100 0 45 90 45 - - hard 1.0 108 10 106 970717HEP0961 8 4 15 10 0 0 Dss 100% 0 100 3 0 15 - 72 - mixed mixed 0 10 107 970728HEP1921 6 3 13 0 0 0 Dss 100% 0 100 0 32 0 32 - - soft 1.0 0 10 108 970707HEP8035 8 4 15
10 0 0 Dss 100% 0 100 3 0 30 - 100 - mixed mixed 0 10 109 970813HEP4081 8 4 13 15 0 20 Dss 100% 0 100 0 0 0 0 - - hard 1.0 0 10 110 970905HCN0523 8 3 15
Key: U Initial forward velocity of the ATV and dummy in mph V Initial lateral velocity of the ATV and dummy in mph Steer Torque Input torque about the steering axis in ft-lbs (+ to right, - to left) Wheel Torque Mode Wheel torque (braking or traction) mode Dss = Drive torque sufficient to maintain constant speed at t=0 Bss = Brake torque sufficient to maintain constant speed at t=0 T1 = Drive torque set to 100% of nominal B1 = Brake torque sufficient to decelerate at 1 g on level surface if sufficient traction available T1¼ = Drive torque set to 125% of nominal

D-6
Brake Factor Percentage of brake torque to apply from “Wheel Torque Mode” value Torso Pitch Torso pitch angle relative to the nominal dummy position (- forwards) Hand Grip Maximum grip force per hand Terrain Type Ground terrain type (see Fig 4, not applicable to Terrain Type = 2 or 7) Slope Angle Ground slope angle ATV Heading ATV orientation with respect to the ground reference system Final Slope Final ground slope angle (Terrain Type 0 only) d1 Ground terrain parameter (see Fig 4) (not applicable to Terrain Type = 0) d2 Ground terrain parameter (see Fig 4) (not applicable to Terrain Type = 0, 2 or 3) Surface Hardness Ground contact stiffness, either hard, soft, or combination depending on the Terrain Type Nominal Friction Coefficient Nominal friction coefficient, depending on the Terrain Type h Obstacle height parameter (see Fig 4, only applicable to Terrain Type = 0, 3 or 7) |h| = Obstacle height in inches h > 0 indicates obstacle in front of both wheels h < 0 indicates obstacle in front of left wheel Run Length Length of computer simulation in sec Run Number A unique computer simulation run identifier Misuse Case Case identifier assigned by HSE or CPSC

E-1
APPENDIX E
CALIBRATION: ATV ROPS/CPD AND MATD DUMMY

E-2
This appendix contains calibration graphs of the force-deflection and other characteristics of the simulation model versus those measured in laboratory tests, for several of the prototype ROPS/CPDs; and for the ISO 13232 MATD dummy. Full-scale dummy test results are also compared to corresponding simulation results.61
E.1. ROPS/CPD Laboratory Test vs Simulation Calibration Results
61 Note that the motorcycle and opposing passenger vehicle laboratory component test vs simulation calibration results in Section E.3 are included for completeness because the full-scale test vs simulation calibration results are based on the same simulation models.

E-3
Quadbar-2011 Calibration

E-4
E.2. Dummy Laboratory Component Test vs Simulation Calibration Results
Flat anvil/Helmeted head
Flat anvil/Helmeted head
Flat/Upper arm
Flat/Upper arm
Flat/Lower arm
Flat/Lower arm
Cylinder/Dummy thorax
Cylinder/Dummy thorax
Cylinder/Abdomen

E-5
Flat/Pelvis
Flat/Pelvis
Cylinder/Upper leg
Cylinder/Upper leg
Flat/Knee
Flat/Knee
Cylinder/Lower leg
Cylinder/Lower leg
Dummy knee torsion

E-6
Dummy knee valgus
Forward neck flexion
Forward neck flexion
Forward neck flexion
Forward neck flexion
Forward neck flexion
Forward neck flexion
Rearward neck extension
Rearward neck extension

E-7
Rearward neck extension
Rearward neck extension
Rearward neck extension
Rearward neck extension
Lateral neck flexion
Lateral neck flexion
Lateral neck flexion
Lateral neck flexion
Lateral neck flexion

E-8
Lateral neck flexion
Neck torsion
Neck torsion
E.3. Motorcycle and Opposing Vehicle Laboratory Test vs Simulation Calibration Results
Sphere/OV roof rail
Sphere/OV roof rail
Disc edge/OV side

E-9
Disc edge/OV side
Disc side/OV side
Disc side/OV side
Disc edge/OV front bumper
Disc edge/OV front bumper
Disc side/OV front bumper
Disc side/OV front bumper
Disc edge/OV rear bumper
Disc edge/OV rear bumper

E-10
Disc side/OV rear bumper
Disc side/OV rear bumper
Sphere/OV bonnet
Sphere/OV bonnet
Sphere/OV front windscreen
Sphere/OV front windscreen
Ground/OV front suspension
Ground/OV front suspension
Ground/OV rear suspension

E-11
Ground/OV rear suspension
Cylinder/MC fuel tank
Cylinder/MC fuel tank
Cylinder/MC seat
Cylinder/MC seat
Flat/PIE
Flat/PIE
Knee form/KPE
Knee form/KPE

E-12
MC rear spring damper
MC rear spring damper
Barrier/MC front wheel
E.4. Full-Scale Motorcycle Impact Test vs Simulation Results
The agreement between full-scale motorcycle impact tests and corresponding computer simulations were assessed based on the results initially reported in Kebscull et al. (1998). E.4.1. Maximum Resultant Head Acceleration Agreement
The maximum resultant head accelerations observed in 14 full-scale tests and corresponding computer simulations are listed in Table E-1. These results correspond to Figure 1 in Kebschull et al. (1998). The Pearson correlation coefficient for the comparison between the full-scale test and computer simulation results, as required to be calculated in ISO 13232-7, which was reported in Kebschull et al. (1998), is 907.02 =r .
The Nash-Sutcliffe model efficiency62 for the comparison between the full-scale test and computer simulation results in Table E-1 is 893.0=E . Therefore, the sum-of-squares of the differences between the simulation and full-scale test results, including any differences in the mean value and slope, is less than 11% of the total sum-of-squares of the variation in the test results. This value is also within the range of acceptable values
62 Nash and Sutcliffe (1970). Rajaraman et al. (2012) is an example application of the Nash-Sutcliffe model efficiency E (referred to as R2 in Eqn A7) to assess the model goodness of fit. This figure of merit ranges from negative infinity to 1.0, with higher values indicating a better model fit to the data.

E-13
for 2R (which is similar to E ) of 0.7 to 0.99 that was suggested by Myers (1990)63 for linear regression models.
Table E-1. Maximum Resultant Head Accelerations from 14 Full-Scale Motorcycle
Impact Tests and Corresponding Computer Simulations Maximum Resultant Head Acceleration (g)
Full-Scale Test Computer Simulation 75.450 99.126 42.080 79.437 39.420 64.884 80.500 81.474 193.820 203.987 112.080 126.170 107.070 111.912 161.720 146.378 24.820 14.011 44.400 16.200 147.110 135.210 131.770 148.967 15.020 11.983 28.620 30.067
The change in the maximum resultant head accelerations observed in 7 pairs of full-scale tests and corresponding computer simulations are listed in Table E-2. These results correspond to Figure 2 in Kebschull et al. (1998). The Pearson correlation coefficient for the comparison between the full-scale test and computer simulation results, which was reported in Kebschull et al. (1998), is 836.02 =r .
The Nash-Sutcliffe model efficiency for the comparison between the full-scale test and computer simulation results in Table E-2 is 821.0=E . Therefore, the sum-of-squares of the differences between the simulation and full-scale test results, including any differences in the mean value and slope, is less than 18% of the total sum-of-squares of
63 According to Myers (1990, p 38), an acceptable value for 2R “depends on the scientific field from which the data were taken. A chemist, charged with doing a linear calibration of a high precision piece of equipment, certainly expects to experience a very high 2R value (perhaps exceeding 0.99), which a behavioral scientist, dealing in data reflecting human behavior, may feel fortunate to observe an 2R as high as 0.70. An experienced model fitter senses when the value of 2R is large enough, given the situation confronted. Clearly, some scientific phenomena lend themselves to modeling with considerably more accuracy then others.”

E-14
the variation in the test results. This value is also within the range of acceptable values suggested by Myers (1990).
Table E-2. Change in the Maximum Resultant Head Accelerations due to the Fitment of
Leg Protectors from 7 Pairs of Full-Scale Tests and Corresponding Computer Simulations
Change in the Maximum Resultant Head Acceleration due to the Fitment of Leg Protectors (g)
Full-Scale Test Computer Simulation 33.370 19.689 -41.080 -16.590 81.740 77.817 -54.650 -34.466 -19.580 -2.189 15.340 -13.757 -13.600 -18.084
E.4.2. Leg Fracture and Knee Dislocation Agreement The numbers of femur fractures observed in the full-scale tests and corresponding computer simulations are listed in Table E-3. These results correspond to Table 5 in Kebschull et al. (1998).
Table E-3. Number of Femur Fractures in Observed in Full-Scale Tests and Corresponding Computer Simulations
Computer Number of Test-Femur Combinations Simulation Full-Scale Test Fracture? Total Fracture? Yes No Yes 2 2 4 No 0 24 24 Total 2 26 28
Source: Table 5 in Kebschull et al. (1998). The Cohen kappa statistic for the agreement between the simulation and full-scale test results in Table E-3 is 0.632. According to Landis and Koch (1977) this indicates that the

E-15
strength of agreement between the computer simulations and full-scale test is “Substantial”.64
The marginal probabilities for the data in Table E-3 indicate that femur fractures occurred in 2 of 28 full-scale test (FST)-leg combinations and 4 of 28 computer simulation (CS) test-leg combinations. Therefore:
- The corresponding probability estimates for the FST fractures are 0.071 (0.009, 0.235) and computer simulation (CS) fractures are 0.143 (0.040, 0.327), where the values in parentheses “( )” are the lower and upper values for the 95% confidence interval for a binomial distribution.
- The probability value for the McNemar Test for the null hypothesis that the probability of FST and CS femur fractures are equal is 0.50. This result indicates that the differences in the observed proportions are not statistically significantly different.
These resulting measures of agreement are summarized in the second column of Table E-6.
The numbers of tibia fractures for the full-scale tests and corresponding computer simulations are listed in Table E-4. The resulting measures of tibia fracture agreement are summarized in the third column of Table E-6. Note that the results in the second and third columns of Table E-6 are the same because the numbers of tibia factures listed in Table E-4 is the same as the numbers of femur fractures listed in Table E-5.
Table E-4. Number of Tibia Fractures in Observed in Full-Scale Tests and Corresponding
64 Landis and Koch (1997) suggested the following labels to describe the relative strength of agreement indicated by the kappa statistic:
Kappa Statistic Strength of Agreement 00.0<κ Poor
20.000.0 ≤≤ κ Slight
40.021.0 ≤≤ κ Fair
60.041.0 ≤≤ κ Moderate
80.061.0 ≤≤ κ Substantial
00.181.0 ≤≤ κ Almost perfect

E-16
Computer Simulations Computer Number of Test-Tibia Combinations Simulation Full-Scale Test Fracture? Total Fracture? Yes No Yes 2 2 4 No 0 24 24 Total 2 26 28
Source: Table 6 in Kebschull et al. (1998). The number of knee dislocations observed in the full-scale tests and corresponding computer simulations are listed in Table E-5. The resulting measures of knee dislocation agreement are summarized in the fourth column of Table E-6. Since there were no knee dislocations in full-scale tests and computer simulations the Cohen’s kappa statistic is undefined. However, it was possible to estimate the 95% confidence intervals for the probability of knee dislocation, which is the same for both the full-scale test and computer simulations.
Table E-5. Number of Knee Dislocations in Observed in Full-Scale Tests and Corresponding Computer Simulations
Computer Number of Test-Knee Combinations Simulation Full-Scale Test Dislocation? Total Dislocation? Yes No Yes 0 0 0 No 0 28 28 Total 0 28 28
Source: Table 7 in Kebschull et al. (1998).

E-17
Table E-6. Summary of Full-Scale Test vs Computer Simulation Leg Fracture and Dislocation Agreement
Measure of Body Region Comparison Result Comment Agreement Femur Fractures Tibia Fractures Knee Dislocations Cohen’s kappa 0.632 0.632 Undefined See Landis and Koch (1997)
suggested labels (summarized in footnote 64).
Marginal Agreement FST probability of
fracture or dislocation 0.071
(0.009, 0.235) 0.071
(0.009, 0.235) 0.000
(0.000,0.123) Compare 95% confidence intervals. Non-overlapping 95% confidence intervals may indicate significant differences in the marginal proportions.
CS probability of fracture or dislocation
0.143 (0.040, 0.327)
0.143 (0.040, 0.327)
0.000 (0.000,0.123)
McNemar P-value 0.500 0.500 Undefined P-values less than 0.05 indicate statistically significant differences in the marginal proportions.
Numbers in parentheses () are the lower and upper bounds for the 95% confidence interval. The Cohen’s kappa and the p-value for the knee dislocations are undefined because there were no knee dislocations.

E-18
E.5. ISO 13232 (2005) Dummy Neck Laboratory Component Test vs Simulation Calibration Results A new dummy neck was introduced in the 2005 Revision of the ISO 13232 Standard. The supplemental laboratory component test vs simulation calibration results are illustrated in this section.

E-19
Forward Neck Flexion (2005 MATD Neck)
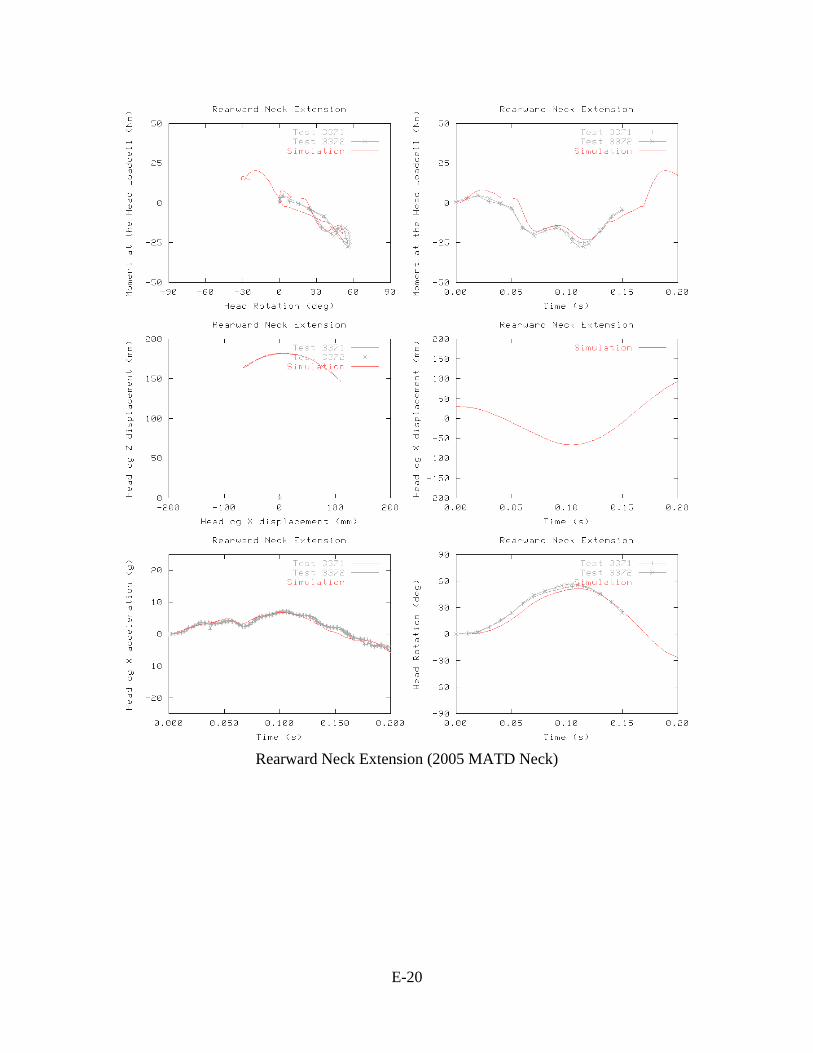
E-20
Rearward Neck Extension (2005 MATD Neck)

E-21
Lateral Neck Flexion (2005 MATD Neck)

E-22
Forward Torsion (2005 MATD Neck)
Forward Tension (2005 MATD Neck)

E-23
Full Scale Test for Impact Configuration 413-0/30 (2005 MATD Neck)
F-1
APPENDIX F
CALIBRATION: SIMULATION VERSUS FULL SCALE TEST ATV AND
DUMMY MOTION CORRELATION RESULTS

F-2
This appendix contains correlation and model efficiency figure-of-merit results for each of the full-scale tests and camera views. The correlation and model efficiency figure-of-merit was computed according to the following equation (Van Auken et al., 1998)
0,
20 1
tot
resSSSS
R −=
where for this film-plane analysis
)y-y( + )x-x( =SS
)y-y( + )x-x( = SS
2j,kj,
2j,kj,
N
1=k
N
1=jtot
2kj,kj,
2kj,kj,
N
1=k
N
1=jres
000,framepoint
framepointˆˆ
∑∑
∑∑
and where x kj, and y kj, are the digitized film plane coordinates of point j for film frame k,
x kj,ˆ and y kj,ˆ are the computer simulation predictions of points x kj, and y kj, ,
x j,0 and y j,0 are initial film values for points x kj, and y kj, ,
N point is the number of digitized points, and
N frame is the number of digitized frames.65
65 This figure-of-merit is similar to the Nash-Sutcliffe model efficiency “E” and the correlation factor “C” in ISO 13232-7 clause 4.5.4, and a generalization of the linear regression coefficient of multiple
determination to all models, with the exception that the 0,totSS term quantifies the variation in the observed data relative to the initial film point values and not relative to the mean film point values. Note that unlike Pearson’s correlation coefficient, this figure-of-merit is sensitive to differences in the mean offset and slope as well as overall fit (i.e., it tests for differences in the values from the line y=x, not y=a+bx).

F-3
Test ATV Test ID Correlation and Model Efficiency Figure of Merit ( 2
0R ) Event Configuration View 1 View 2 Overall 45o Cross Baseline 97100803 0.97 0.82 0.87 Slope U-bar 97101612 0.98 0.79 0.86 T-bar 97100805 0.97 0.70 0.78 Uphill Baseline 98041512 0.81 n/a 0.81 with U-bar 98041503 0.89 0.91 0.91 WOT 97100912 0.92 0.87 0.88 High Speed Baseline 97101512 0.99 0.91 0.97 Step Steer U-bar 98041303 0.99 0.77 0.97 T-bar 97101504 0.98 0.98 0.98 Bump Baseline 98041411 0.92 n/a 0.92 and Locked U-bar 98041402 0.96 n/a 0.96 Brake 98041404 0.97 n/a 0.97 Average 0.91
Note: “n/a” indicates a second high speed camera view was not available.

G-1
APPENDIX G
UPDATED CALIBRATION: DISTRIBUTIONS OF SIMULATED INJURIES VERSUS ACTUAL INJURIES

G-2
This appendix presents simulation calibration results comparing the predicted injuries from the computer simulations to the actual injuries from the accident data, in terms of the distribution of injury severity for the body regions and injury types able to be monitored by means of the ISO 13232 crash dummy, as well as by means of the preliminary potential asphyxia criterion described in Section IV.A.2, and the skull fracture criterion described by Van Auken et al. (2011).
It is important to note that the simulated and actual injury distributions, though generally similar, fundamentally would not be expected to be identical, because of the dissimilarities listed in Table G-1. That is, the simulated 110 general “types” of overturn (plus the 6 additional perturbations of each type), and the 110 actual overturn accidents, have some inherent differences in terms of human, vehicle, environment and accident variables, as listed in Table G-1.
Table G-1: List of some of the differences between baseline ATV simulation sample and accident sample
Variable category Baseline ATV simulation sample Actual Accident Sample Human 50th percentile adult male ISO
MATD crash dummy, with or without one make and model of helmet
Diverse, as well as many unknown rider ages, sexes, sizes, weights, physical conditions, helmet usage, helmet makes and models
Vehicle Honda TRX 350, OE mechanical condition, no cargo, no accessories
Diverse, as well as many unknown makes-models-years of ATV, with diverse, as well as many unknown mechanical conditions, and weights, locations, vehicle modifications and types of cargo and accessories
Accident 110 assumed general “types” of overturn (based on the 3 to 17 initial conditions, inputs, and terrain variables available in each accident case file, plus systematic plausible assumptions for the missing variables) plus 6 other systematic plausible variations of each “type” of overturn
Diverse and additional, as well as many unknown, initial conditions, inputs, and terrain details
Sample size N = 770 overturns N = 110 overturns

G-3
Note that the injury severity coding of the 110 US/UK actual accidents was updated and revised as described by Zellner et al. (2011) in order to reflect the AIS (2005) conventions, and the injury locations, types and severities that are able to be monitored by the ISO 13232 MATD crash dummy and injury indices. Only those actual human injury locations, types and severities that can be monitored by the crash dummy using existing technology can be validly compared.66
Figures G-1 through G-10 compare the frequency distributions of the helmeted and unhelmeted dummy simulation samples to that of the actual accident sample in terms of 10 locations, types and severities of injury. The color coded vertical bars in each figure indicate the estimated percentage of cases for each AIS level, which is the number of cases for each AIS level divided by the total number of cases (N), which is either 110 accidents or 770 computer simulations. The error bars indicate the 95% confidence interval for the estimated percentage, assuming the percentage value has a binomial distribution that depends on the total sample size N. In most of these figures the injury severity distributions are relatively close, especially in view of the inherent differences between the simulation and accident samples that are noted in Table G-1.
The comparisons between the simulation and accident data in Figures G-1 through G-10 can be quantified in terms of the Nash-Sutcliffe model efficiency “E”, the results of which are summarized in Table G-2. The Nash-Sutcliffe model efficiency “E” for these comparisons were calculated according to the equation
tot
resSSSS
E −= 1
where
( ) ( )
( ) 26
0
26
0
=∑
==∑
a
aa
=ktot
a
a
cs
cs
=kres
Nn-kAISn = SS
NkAISn-
NkAISn = SS
and where ( )kAISna = are the number of accident cases with kAIS = , such that
66 In general, current technology crash dummies cannot monitor for external contusions, abrasions, lacerations, the full range of thoracic and lumbar spinal injury severities, and many other locations, types and severities of human body injury.

G-4
( ) 1106
0==∑ =
=a
ka NkAISn
( )kAISncs = are the number computer simulations with kAIS = , such that
( ) 7706
0==∑ =
=cs
kcs NkAISn
n a is the average number of accident cases for each AIS severity level,
( ) aa
kaa N
NkAISnn ×≈=∑ ==
=143.0
771 6
0
The results in Table G-2 indicate that there is a close agreement between the modeled helmeted dummy and actual aggregated injury severity distributions (Nash-Sutcliffe E = 0.95 on average for the helmeted dummy simulations, and in excess of 0.99 for some body regions, between modeled and actual frequency of injury, across all body regions and overturn cases/types). The results indicate that the unhelmeted dummy simulations are not in as close agreement with the accident data as the helmeted dummy simulations. The differences may be due to more accident cases where the rider wore a helmet.
Table G-2: Nash-Sutcliffe Model Efficiency Comparisons between Simulated and Actual Aggregated Abbreviated Injury Scale (AIS) Injuries (DRI Latest Results)
Body Region or Index Nash-Sutcliffe Model Efficiency
Helmeted Dummy Simulation vs Accident Data
Unhelmeted Dummy Simulation vs Accident
Data MAIS 0.8327 0.2960 Head (brain and vault fracture)
0.8344 0.2402
Face (fracture) Not modeled 0.8671 Neck 0.9807 0.8981 Chest 0.9905 0.9887 Abdomen 0.9995 0.9998 Femur 0.9917 0.9831 Knee 0.9667 0.9760 Tibia 0.9925 0.9967 Asphyxia 0.9981 0.9985 Average value 0.9541 0.8244

G-5
Note that a direct, type-by-case comparison between the injuries occurring in each of the 770 simulations and in the 110 actual accidents is inappropriate and is not feasible, as each set of 7 simulations (representing a given ”type” of overturn) is for a different assumed set of human, vehicle, environment and accident variables than those of the associated actual accident, which are more highly diverse (e.g., involving a high diversity of rider ages and ATV models) and to a large extent unknown. As can be observed in Figures G-1 through G-18, the overall distribution of injury locations, types and severities is comparable, however. This similarity of the distributions of injuries between simulated and actual accidents -- rather than type-by-case comparison that is generally not possible 67–has been employed by various researchers in the statistical biomechanics field (e.g., Kramer et al. (1990), Kuchar (2001), Rogers et al. (2004) and others).
In addition, note that for head and brain injuries, “no injury” and “AIS 1” injuries could be grouped together, due to typical under-reporting of “slight” head injuries (e.g., an AIS 1 brain injury is defined by the AIS-2005 scale as a headache).
In addition, note that the frequency of asphyxia AIS 6 outcomes, though similar, represent fundamentally different phenomena, i.e., a force assumed to correspond to subjective “breathing difficulty beyond 1 hour” was used as the simulation criterion, as described in Section IV.A.2; whereas unknown types of asphyxiation fatality, involving n=2 children and n=1 intoxicated adult suffocation, occurred in the actual accidents.
In addition, note that differences, particularly in head injury frequency, occur due to helmet versus no helmet in the simulation sample. In some cases, the actual accident frequency (which involves mostly unknown helmet usage) lies between the helmeted and unhelmeted simulation frequencies.
67 Therefore it is not possible to assess the agreement between the computer simulations and accident data using the Cohen’s kappa statistic because it is based on type-by-case comparisons which are not available.

G-6
Figure G-1. Comparison of Maximum AIS injury distributions
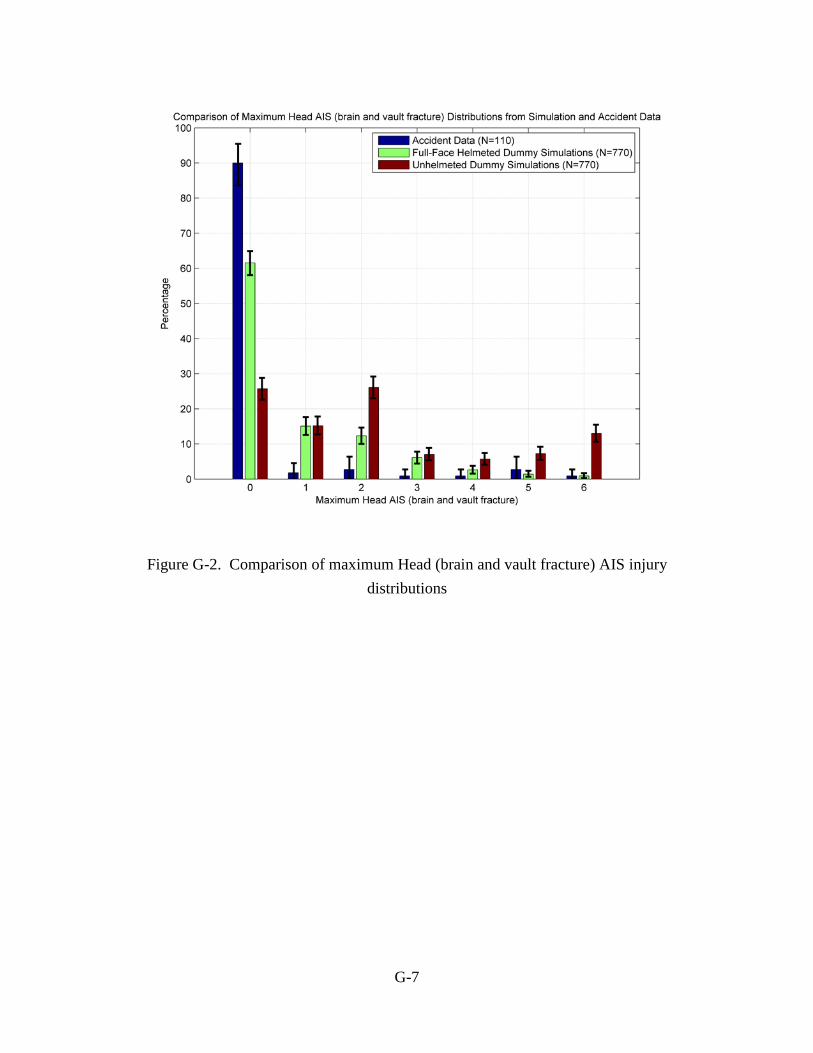
G-7
Figure G-2. Comparison of maximum Head (brain and vault fracture) AIS injury distributions

G-8
Figure G-3. Comparison of maximum Face (fracture) AIS injury distributions

G-9
Figure G-4. Comparison of maximum Neck AIS injury distributions

G-10
Figure G-5. Comparison of maximum Chest AIS injury distributions
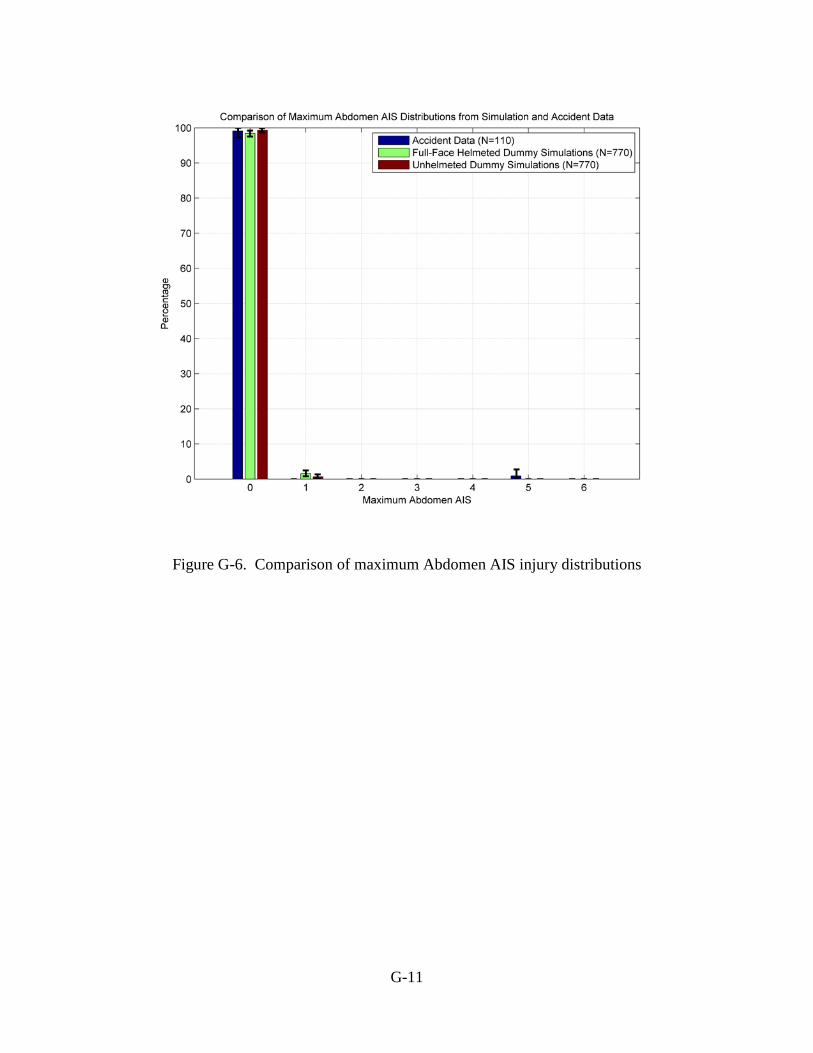
G-11
Figure G-6. Comparison of maximum Abdomen AIS injury distributions

G-12
Figure G-7. Comparison of maximum Femur (fracture) AIS injury distributions

G-13
Figure G-8. Comparison of maximum Knee (dislocation) AIS injury distributions

G-14
Figure G-9. Comparison of maximum Tibia (fracture) AIS injury distributions

G-15
Figure G-10. Comparison of Asphyxia AIS injury distributions

H-1
APPENDIX H
UPDATED CALIBRATION: HELMET NET BENEFIT AND RISK/BENEFIT OUTCOMES,
SIMULATIONS VERSUS ACTUAL ACCIDENTS

H-2
Table H-1 presents the risk/benefit percentage and net benefit percentage for the helmet as a protective device, in comparison to no helmet, based on the baseline ATV simulations. This is presented in terms of the overall ICnorm injury severity across all body regions, probability of fatality (POF), MAIS=6, and the incremental ICnorm injury severity for each body region.
The results indicate that in terms of overall ICnorm across all monitor-able body regions, the simulation model of the closed face, Bieffe B12 motorcycle-type helmet, as specified in ISO 13232 (2005), produces a net benefit of 60% [45%, 75%], with a risk/benefit percentage of 9% [6%, 21%]. This falls within the ISO 13232 guideline for recommended outcomes for protective devices.
In terms of head incremental ICnorm, the simulation model of the helmet produces a net benefit of 70% [53%, 87%], with a risk/benefit percentage of 2% [1%, 13%]. Although head incremental ICnorm values are not formally part of the ISO guideline for risk/benefit percentage, this result is in general agreement with helmet net benefit percentage data in the published literature. For example, Rodgers (1990) of the US CPSC estimated that helmet wearing on ATVs reduces the risk of non-fatal head injuries by 64%. Liu et al. (2008) estimated, based on a review of published papers on motorcycle helmets, that motorcycle helmets are effective in reducing non-fatal head injuries by 69%. Note that these non-fatal head injury statistics are generally similar to that which is being evaluated in the simulation sample, as more than 85% of the unhelmeted head injuries and more than 95% of the helmeted head injuries in the simulations are non-fatal.
The results in Table H-1 indicate that the helmet is also protective of the neck. This is believed to be due to the reduction in forces transmitted to the neck because of the energy (i.e., impact) absorbing effect of the helmet in head impacts, the forces from which are often transmitted through the neck.
Note that the apparent net disbenefit and large risk/benefit for the chest occur in an extremely small percentage (i.e., 5% harmful, 3% beneficial) of cases where the helmet produces an extremely small difference in outcome for the chest. Note that the “Average risk per risk case” and “Average benefit for benefit case” are extremely small (e.g., 0.009 and 0.006, respectively) which injury levels are similar to, or less than equivalent to, a chest bruise. Examination of the data suggests that this very small difference may be due

H-3
to small load transfer effects (in the case of both being loaded by some surface) and contact between the helmet and the chest in a very small number of cases.

H-4
Table H-1.Helmet risk/benefit analysis calculated from the baseline ATV simulations
Injury Assessment Variable
Risk/Benefit Ratio
Net Benefit
% Harmful/ % Beneficial/
% No Difference Average Risk/
Risk Case Average Benefit/
Benefit Case IC_{norm} 9% [6%,21%] 60% [45%,75%] 9%/75%/16% 0.103 [0.032,0.174] 0.205 [0.163,0.247] POF 6% [4%,22%] 72% [53%,92%] 6%/65%/29% 0.070 [-0.009,0.150] 0.197 [0.149,0.245] MAIS=6 7% [5%,42%] 88% [52%,124%] 1%/13%/86% 1.000 [1.000,1.000] 1.000 [1.000,1.000] IC_{norm,head} 2% [1%,13%] 70% [53%,87%] 5%/78%/17% 0.033 [0.005,0.061] 0.192 [0.149,0.235] IC_{norm,neck} 12% [7%,50%] 75% [39%,111%] 8%/27%/65% 0.035 [0.015,0.055] 0.143 [0.088,0.198] IC_{norm,chest} 134% [60%,271%] -25% [-109%,59%] 5%/3%/92% 0.009 [0.003,0.015] 0.006 [0.001,0.011] IC_{norm,abdomen} 105% [69%,159%] -1% [-12%,10%] 2%/1%/97% 0.001 [0.000,0.002] 0.001 [0.001,0.001] IC_{norm,femurs} 55% [31%,130%] 25% [-17%,67%] 2%/4%/94% 0.144 [0.116,0.172] 0.158 [0.147,0.169] IC_{norm,knees} 129% [70%,214%] -13% [-49%,23%] 6%/4%/90% 0.122 [0.115,0.129] 0.131 [0.118,0.144] IC_{norm,tibias} 35% [19%,117%] 44% [-11%,99%] 1%/2%/97% 0.068 [0.068,0.068] 0.068 [0.068,0.068] Key for "IC_{norm}", "POF", and "MAIS=6" only:
Risk/benefit percentage significantly less than 100%, and less than 12% ISO 13232 guideline and net benefit percentage significantly greater than 0%. May be a reasonable safety device, assuming acceptable functional characteristics.
Risk/benefit percentage significantly less than 100%, but more than 12% ISO 13232 guideline: not a recommended safety device. If introduced, some entity in society must bear responsibility for relatively high risks of the device compared to benefits of the device.
Risk/benefit percentage significantly more than 100% and net benefit significantly less than 0% : injury risks of the device are greater than injury benefits of the device.
Risk/benefit percentage not significantly different from 100% (within 95% confidence interval) and net benefit percentage not significantly different from 0% (within 95% confidence interval): injury risks of the device are effectively equal to injury benefits of the device.

H-5
The net benefits and disbenefits for the other body regions are all small and statistically insignificant (i.e., not statistically significantly different from zero), and as is often the case with such small effects, the risks and benefits are small, chaotic in magnitude and effectively equal and opposite, and the risk/benefit percentage is not statistically significantly different from 100%.
Overall, the data indicate that the helmet net benefit calibration is in substantial agreement with the published data.

I-1
APPENDIX I
SUPPLEMENTAL TABULATIONS OF PREVIOUS (2008) RESULTS WITH
A SINGLE BASELINE

I-2
For reference and comparison purposes, this appendix gives supplemental tabulations of risk/benefit percentage and net benefit percentage results for the Munoz et al. (2007) Quadbar and the Zellner et al. (2008) ROPS/CPD results using a single baseline for calculation purposes.
Tables I-1 and I-2 give risk/benefit percentage and net benefit percentage results for the 2007 and 2008 analyses, using a single baseline (i.e., the baseline ATV, helmeted). The results in Table I-1 are based on the same simulation results as Table 6 but use two different baselines: the baseline ATV-helmeted for the helmeted ROPS/CPD conditions, and the baseline ATV-unhelmeted for the unhelmeted ROPS/CPD conditions.
Table I-1: Summary of Previous ICnorm Risk/Benefit Results for ROPS/CPDs, Using a Single Baseline
Device Device with Helmeted Dummy versus Baseline with Helmeted Dummy
Device with Unhelmeted Dummy versus Baseline with Helmeted Dummy
Notes
Belted Unbelted Belted Unbelted Quadbar . 99% [53%,192%] . 275% [144%, 477%] No restraints T-BAR . 107% [83%,137%] . 227% [181%,277%] No restraints U-BAR . 95% [74%,122%] . 313% [244%,385%] No restraints DAHLE 87% [69%,110%] 127% [99%,161%] 179% [139%,226%] 353% [271%,438%] Belts, allow some
rider movement
JOHNS 50% [40%,65%] 151% [119%,190%] 94% [75%,117%] 260% [205%,319%] Belts, allow some rider movement
MUARC 174% [137%,217%] 147% [116%,183%] 180% [142%,224%] 330% [261%,403%] Belts, no rider movement (not a
"rider active" vehicle)
Key Risk/benefit percentage significantly less than 100%, and less than 12% ISO 13232 guideline. May be a reasonable
safety device, assuming acceptable functional characteristics.
Risk/benefit percentage significantly less than 100%, but more than 12% ISO 13232 guideline: some entity in society must bear responsibility for relatively high risks of the device compared to benefits of the device.
Risk/benefit percentage significantly more than 100%: injury risks of the device are greater than injury benefits of the device.
Risk/benefit percentage not significantly different from 100% (within 95% confidence interval): injury risks of the device are effectively equal to injury benefits of the device.
Note 1: All percentages are relative to baseline ATV, no ROPS/CPD, helmeted rider, which is the intended use of the vehicle.
Table I-2: Summary of Previous ICnorm Net Benefit Results for ROPS/CPDs, Using a Single Baseline
Device Device with Helmeted Dummy versus Baseline with Helmeted Dummy
Device with Unhelmeted Dummy versus Baseline with Helmeted Dummy
Notes
Belted Unbelted Belted Unbelted Quadbar . 0% [-20%, 21%] . -38% [-61%, -15%] No restraints T-BAR . -2% [-10%, 6%] . -31% [-39%,-22%] No restraints

I-3
U-BAR . 1% [-5%, 8%] . -44% [-53%,-35%] No restraints DAHLE 6% [-4%,17%] -8% [-17%, 0%] -29% [-41%,-17%] -54% [-64%,-44%] Belts, allow some
rider movement
JOHNS 26% [17%,34%] -17% [-27%,-7%] 3% [-7%,13%] -46% [-57%,-35%] Belts, allow some rider movement
MUARC -29% [-41%,-17%] -19% [-30%,-8%] -31% [-43%,-19%] -71% [-84%,-58%] Belts, no rider movement (not a
"rider active" vehicle)
Key Net benefit percentage significantly greater than 0%: may be a reasonable safety device, depending on acceptable
risk/benefit percentage and functional characteristics.
Net benefit significantly less than 0% (i.e., significant disbenefit exists): causes significantly more injuries than it prevents.
Net benefit percentage not significantly different from 0% (within 95% confidence interval): injury risks of the device are effectively equal to injury benefits of the device.
Note 1: All percentages are relative to baseline ATV, no ROPS/CPD, helmeted rider, which is the intended use of the vehicle.
Note 2: The Johnson ROPS had 1 inch of belt slack in these results, which is incorrect. It should have used 7 inches of slack.

J-1
APPENDIX J
CONFIDENCE INTERVAL EQUATIONS FOR ISO 13232-5 RISK/BENEFIT ANALYSIS FOR
110 TYPES OF OVERTURN WITH 7 VARIATIONS EACH

J-2
1. ISO 13232-5 Risk/Benefit Equations According to clause 5.9.4.2 in ISO 13232-5 (2005) the procedure to calculate the average risk/benefit percentage is as follows (where equation numbers have been added): “Across all impact configurations or events, calculate the average risk/benefit percentage for each injury assessment variable, each body region's incremental normalized injury cost, and normIC as follows:
( )∑ ×∆−===
benNjl FOx
Njj
1,
1index injury in decrease average benefit average
(1)
( )∑ ×∆===
riskN
kkjk FOx
Njj
1,
1index injury in increase average risk average (2)
(3)
where
benN is the number of configurations in which the protective device was beneficial (i.e., resulted in a decrease in the injury index value) for a given injury index;
riskN is the number of configurations in which the protective device is harmful (i.e., resulted in an increase in the injury index value) for a given injury index;
x∆ is the change in injury index value (protective device - baseline);
is the subscript for each impact configuration in which there was a decrease in the injury index value;
k is the subscript for each impact configuration in which there was an increase in the injury index value;
N is the total number of accidents;
j is the subscript for each injury index or injury assessment value;
FO is the frequency of occurrence of a given impact configuration or event in accidents
Note that the total number of accidents is given by the following equation
∑==
confiigm
iiFON
1 (4)
where configm is the total number of (rollover) configurations (i.e.,
changenoriskbenconfig NNNm ++= ). Also note that these expressions assume that there are no repeated observations of a given accident configuration (i.e., each accident configuration is sampled only once). In addition, the following assumptions are used in the following special conditions:
100%x benefit average
risk average percentage itrisk/benef
j
jj =

J-3
a) If there are no beneficial cases then the average benefit is undefined. b) If there are no harmful cases then the average risk is undefined. c) If there are no beneficial cases or the average benefit is zero, and no harmful
cases or the average risk is zero, then the risk/benefit percentage is undefined. d) If there are harmful cases and the average risk is greater than zero, but there are
no beneficial cases or the average benefit is zero, then the risk/benefit percentage is infinite.
e) If there are beneficial cases and the average benefit is greater than zero, but there are no harmful cases or the average risk is zero, then the risk/benefit percentage is zero.
According to clause 5.9.4.3 in ISO 13232-5 (2005) the procedure to calculate the average net benefit per accident is as follows: “Across all configurations or events, calculate the average net benefit for each injury assessment variable, each component normalized injury cost, and normIC as follows:
jjj risk averagebenefit average benefitnet average −= ” (5)
2. Confidence Interval for the Average Net Benefit By substituting Eqns (1) and (2) into Eqn (5) the average net benefit per accident can then be expressed as
jj x∆−= benefitnet average (6)
where
( )∑ ×∆=∆=
configm
iijij FOx
Nx
1,
1 (7)
If 1=FO (and provided that each rollover configuration is sampled only once), then
configmN = and Eqn (7) can simplified to
∑ ∆=∆=
N
kjkj x
Nx
1,
1 (8)
The 95% confidence interval for x∆ (and the average net benefit per accident) is then
xv stx ∆±∆ 025.0, (9)

J-4
assuming that xsx ∆∆ has a t-distribution with ν statistical degrees-of-freedom.68 If the x∆ values are computed from m rollover configurations (e.g., 110=m ), each with
tn repeated observations (e.g., 7=tn simulation perturbations), such that
tittix ετη ++=∆ (10)
( )
( )
( )
( )( ) 0
otherwise0 and if
0otherwise0
if
0
2
2
=
===
=
==
=
ujt
ujti
ti
ut
t
E
jiutE
E
utE
E
ετ
σεε
ε
σττ
τ
ε
τ
(11)
and
∑==
m
ttnN
1ˆ (12)
then
∑ ∑∆=∆= =
m
t
n
iti
tx
Nx
1 1
1 (13)
and the variance of x∆ is
∑+==
∆m
ttx n
NN 1
22
222 τε σσ
σ (14)
Note the following special cases: g. If nnt = then nmN ×= and
mNx
222 τε σσ
σ +=∆ (15)
h. If 02 =τσ then
Nx
22 εσσ =∆ (16)
The unbiased estimate of the variance of x∆ is given by
68 Note that x∆ will tend to have a Normal Distribution even if x∆ does not have a Normal Distribution, as indicated by the Central Limit Theorem, as indicated by Ross (1976). Therefore xsx ∆∆ will also tend to have a t-distribution and therefore this assumption is generally considered robust for large sample sizes.

J-5
∑+==
∆m
ttx n
N
sNs
s1
22
222 τε (17)
The 2εs in 2
τs terms in Eqn (17) are calculated by the following equations
22Rss =ε (18)
( )
∑−
−=
=
m
tt
TRT
nN
N
vsss
1
2
222
1τ (19)
where 2Rs and 2
Ts and Tv are obtained from the One-Way Analysis of Variance in Table J-
1 (Box et al. (1978)), setting xy ∆= ), provided that 22RT ss ≥ . If 22
RT ss < then it is
assumed that 02 =τs and
( )∑ ∆−∆−
==
N
ii xx
Ns
1
221
1ε (20)
This condition can occur if 2τσ is small compared to 2
εσ . For x∆ given by Eqns (10) through (12) and 2
xs∆ according to Eqn (17), xsx ∆∆ will
have approximately a t-distribution with *ν statistical degrees-of-freedom according to the following Satterthwaite approximation (Satterthwaite (1947)):
∑
∑
≈
i i
i
ii
s
s
ν
ν 4
22
* (21)
where
Ns
s2
21 ˆ ε= (22)
∑==
m
ttn
N
ss
1
22
222 ˆ τ (23)
such that 2
221
2 sss x +=∆ (24) The 95% confidence interval for x∆ is then
xv stx ∆±∆ 025.0,* (25) and the average net benefit per accident is
xj stx ∆±∆−= 025.0,*benefit net average ν (26)

J-6
Table J-1.One-Way Analysis of Variance and Expected Values of Mean Squares for tittiy ετη ++=
Source of Variation Sum of Squares Degrees of Freedom Mean Square Expected Value of Mean Square
Average 2
1 1
1
∑ ∑=== =
m
t
n
itiA
ty
NyNS 1=Aν
A
AA
Ssν
=2
Between Treatments ( )∑ −==
m
tttT yynS
1
2 1−= mTν T
TT
Ssν
=2 22
1
211ετ σσ
ν+
∑−=
m
tt
Tn
NN
Within Treatments ( )∑ ∑ −== =
m
t
n
ittiR
tyyS
1 1
2 mNR −=ν R
RR
Ssν
=2 2εσ
Total ∑ ∑== =
m
t
n
iti
tyS
1 1
2 N
Notes: a) See Table 6.4 in Box et al. (1978). b) xy ∆=

J-7
The net benefit percentage and corresponding 95% confidence interval can then be calculated by dividing the average net benefit per accident by the average injury index value for the baseline configuration. 3. Confidence Intervals for the Risk/Benefit Percentage The 95% confidence intervals for the risk/benefit percentage are calculated by replacing the values for x∆ in Eqns (1) through (3) with CIxx %95∆±∆ , as noted by Zellner et al. (2008). 4. Confidence Intervals for the Average Benefit per Beneficial Case and Average Risk
per Harmful Case The average benefit per beneficial case (defined in ISO 13232-5 Section 5.9.4.4) and the corresponding 95% confidence interval can be calculated by only using the beneficial cases (i.e., 0<∆x ) in Eqns (12) through (26). Therefore the average benefit per beneficial case is
( ){ }0025.0,* case beneficialper benefit average
<∆∈∆∆±∆−=xxxstx ν (27)
Note that m and tn in this calculation count only the beneficial cases. Therefore the values for m and tn will generally be less than the corresponding values used to calculate the net benefit. Also note that if there are no beneficial cases then the average benefit per beneficial case is undefined. The average risk per harmful case (defined in ISO 13232-5 Section 5.9.4.4) and the corresponding 95% confidence interval can be calculated by only using the harmful cases (i.e., 0<∆x ) in Eqns (12) through (26). Therefore the average risk per harmful case is
( ){ }0025.0,* case harmfulper risk average
>∆∈∆∆±∆=xxxstx ν (28)
Note that m and tn in this calculation count only the harmful cases. Therefore the values for m and tn will generally be less than the corresponding values used to calculate the net benefit. Also note that if there are no harmful cases then the average risk per harmful case is undefined. Provided that there are both beneficial and harmful cases, then the statistical significance of the difference between the average benefit per beneficial case and the average risk per harmful case can be determined using Welch’s t-test as described by Welch (1947). If the expected value of the average benefit per beneficial case and the average risk per harmful case are equal (i.e., the Null Hypothesis), then

J-8
22
br xx
brrb
ss
xxt
∆∆ +
∆+∆= (28)
where
{ } { }{ } { }00
00ˆˆˆˆ
>∆∈∆∆∆>∆∈∆
<∆∈∆∆∆<∆∈∆=∆=∆
=∆=∆
xxxxxxr
xxxxxxb
ssxxssxx
b
b (29)
will have approximately a t-distribution with *rbν degrees-of-freedom, where
*
4
*
4
222*
b
x
r
x
xxrb
br
br
ss
ss
νν
ν∆∆
∆∆
+
+
≈ (30)
Therefore the probability of the observed or more extreme value for rbt can be determined from the following equation
( ) ( ) ( ) ( )rbrbrbrb tFtFtFttPrbrbrb*** 221 ννν −=−+−=≥ (31)
where ( )tFν is the cumulative distribution function for a t-distribution with ν degrees-of-
freedom. If the ( ) 05.0<≥ rbttP then the Null Hypothesis that the expected values for the average benefit per beneficial case and the average risk per harmful case are equal is unlikely and should be rejected. Therefore the observed difference is statistically significant at the 0.05 level of significance. 5. Confidence Intervals for the Average Benefit and Average Risk The average benefit (defined in ISO 13232-5 Section 5.9.4.2) and the corresponding 95% confidence interval can be calculated from the average risk per beneficial case according to the equation
case beneficialper benefit averagebenefit average ×=N
Nben (32)
The average risk = (defined in ISO 13232-5 Section 5.9.4.2) and the corresponding 95% confidence interval can be calculated from the average risk per harmful case according to the equation
case harmfulper risk averagerisk average ×=N
Nben (33)

K-1
APPENDIX K
VARIATIONS FOR EACH OF 110 TYPES OF OVERTURN

K-2
This flow chart on the following pages describes methods for defining the six variations (i.e., perturbations) that were applied to each of the 110 overturn types. These variations were applied in order to reduce the sensitivity in the overall outcomes to the exact input conditions of any one overturn type and to increase the statistical degrees of freedom. Simulations were run for each of the 110 overturn types and each of the six variations of each of the overturn types. In other words, (6+1) x 110 = 770 simulations were run for each ATV/dummy configuration.

K-3
Does overturn typeinvolve steering?
Create one additional type with steering multiplied by 0.95, and one additional type with steering multiplied by 1.05
Does overturn typeinvolve braking?
Create one additional type with speed multiplied by 0.95, and one additional
type with speed multiplied by 1.05
Create one additional type with braking multiplied by 0.95, and one additional type with braking multiplied by 1.05
No
Yes
Yes
Does overturn typespeed > 0?
Yes
No
Yes
Yes
Start
Have a total of 6additional variations been
defined?
Create one additional type with obstacle height multiplied by 0.95, and one additional type with obstacle height
multiplied by 1.05
End
Does overturn typeinvolve an obstacle?
Have a total of 6additional variations been
defined?End
2

K-4
Create one additional type with heading = heading – 5 deg., and one additional type with heading = heading + 5 deg.
Is overturn typeslope > 0?
Have a total of 6additional variations been
defined?End
Create one additional type with slope = slope – 1 deg and one additional type
with slope = slope + 1 deg..
Have a total of 6additional variations been
defined?End
2
Create one additional type with dummy torso pitch = torso pitch – 2 deg. And one additional type with torso pitch =
torso pitch + 1 deg.
End

L-1
APPENDIX L
SUPPLEMENTAL INJURY RISK-BENEFIT ANALYSIS OF QUADBAR CRUSH PROTECTION DEVICE (CPD) FOR ALL-TERRAIN VEHICLES (ATVS)

L-2
Section L-I INTRODUCTION
This appendix provides further supplemental analyses of the computer simulation results underlying the results in this report and the Zellner et al. (2014) TRB paper. These supplemental analyses were done in order to address further, more detailed aspects beyond those described in the previous paper and elsewhere in this report. Whereas the main results reported elsewhere in this report are based on 3,080 computer simulations of ATV overturns (comprising all combinations of the 110 overturn types times 7 perturbations times 2 helmet configurations (full face helmet and no helmet), with and without the CPD), the results in this appendix are also based on the results from an additional 1,540 simulations for a dummy with a half helmet, for a total of 4,620 simulations.
Section L-II of this appendix extends the analysis of the 4,620 simulations to include more specific risk/benefit and net benefit results for incremental body region normalized injury costs and for body region AIS=6 (maximal injury) as well as asphyxiation potential (assumed to be AIS=6) in order to provide further insights into potential injury mechanisms. Also reported in this appendix are results for additional ISO 13232 (2005)-type indices for the 4,620 simulations, including the percentage of overturns in which addition of the Quadbar had one of three outcomes -- beneficial, no effect, or harmful -- as well as the average Quadbar benefit per beneficial case, and the average Quadbar risk per harmful case. Section L-II also contains an analysis focusing on cases with an initial ATV velocity of less than or equal to 20 km/h. This was done because, although the Quadbar had been found to be harmful or to have no statistically significant effect across the sample of ATV accident types previously analyzed, it was hypothesized by Grzebieta et al. (2015) that the Quadbar CPD may be beneficial in low-speed (i.e., “20 km/h or less”) ATV overturns.
More detailed supporting tables for Section L-II of this appendix are located in Sections L-A and L-B of this appendix. The estimated risk/benefit and net benefit percentages listed in Sections L-A and L-B of this appendix comprise the “point estimate” followed by the lower and upper 95% confidence interval values in square brackets []. The “point estimate” is based on the average values from the simulated case sample. The 95% confidence interval represents the estimated accuracy of the point estimate for the population of all overturn events represented by the simulated sample, which depends on the variation in the simulation results for the different

L-3
overturn types, and perturbations in the initial conditions, and the number of simulated cases. The estimated risk/benefit values are statistically significantly different from 100% at the 0.05 level of significance, in terms of the estimated effect on the population, if the 95% confidence interval does not include 100%. The estimated net benefit values are statistically significantly different from 0% if the 95% confidence interval does not include 0%. Statistically significant results are denoted in bold font; results that are not statistically significant are denoted in gray font. In addition, as described in the key to the table, and only for the overall normalized injury cost (ICnorm),69 the cell colors indicate the general category of each risk/benefit outcome as follows:
– Green cells denote an estimated risk/benefit percentage that is significantly less than 100% or a net benefit percentage that is significantly greater than 0%, i.e., the estimated injury benefits of the device are statistically significantly greater than the estimated injury risks of the device. However, this does not indicate an acceptable device according to the voluntary guidelines in ISO 13232 unless the following additional criteria are also satisfied:
− the percentage of cases which are beneficial is greater than the percentage of cases which indicate no effect, which percentage is, in turn, greater than the percentage which are harmful;
− the risk/benefit percentage is not greater than 12%;
− the net benefit is greater than 0%; and
− the average benefit/beneficial case is greater than the average risk/harmful case.
– White cells denote an estimated risk/benefit percentage that is not significantly different from 100% (within a 95% confidence interval). This indicates a device for which the new injury risks are effectively equal to the new injury benefits, i.e., not recommended as a safety device, as it creates a substantial level of new injury risks, and it is also an ineffective device from an injury reduction viewpoint.
69 ISO 13232-5 Annex E provides reference guideline criteria for risk/benefit indices that are stated to be only applicable to the overall normalized injury cost, ICnorm. This restriction appears reasonable, because, for example, a protective device having a net benefit for only one body region, and a net risk for all other body regions, would seem to be highly undesirable.

L-4
– Red cells denote an estimated risk/benefit percentage that is significantly more than 100%, which indicates that the injury risks of the device are statistically significantly greater than the injury benefits of the device. This is self-evidently unacceptable. This is also an unacceptable device according to the voluntary guidelines in ISO 13232.
In addition to the risk/benefit and net benefit results reported elsewhere in this report and in the Zellner et al. (2014) TRB paper, Sections L-A and L-B of this appendix present the ISO 13232 incremental normalized injury cost for each body region as well as Abbreviated Injury Scale (AIS)70 6 results for those body regions that are subject to this maximal level of injury (i.e., the head, neck, chest, and asphyxiation). These incremental normalized injury cost and maximal injury severity results may provide further insights into which body region(s) a proposed protective device, in this case the Quadbar, has relatively stronger effects. As specified in ISO 13232-5 (2005) clause 5.8.1, incremental normalized injury cost is calculated by using, for each body region, only the injury assessment values associated with that body region, and setting the injury assessment values for all other body regions equal to zero. Note that in general the sum of the incremental normalized injury costs across all body regions will not equal the total normalized injury cost, due to interactions among the body regions and other nonlinearities in the injury cost model.
Sections L-II, L-A and L-B of this appendix also include additional indices for which suggested referenced guidelines are presented in ISO 13232-5 (2005), Annex E, including the percentage of cases for which the protective device (i.e., the Quadbar) is harmful, the percentage for which it is beneficial, and the percentage for which it had no effect. Also included are the ISO 13232-5 Annex E indices for average risk per harmful case and average benefit per beneficial case.
For purposes of “comparison of results to reference risk and benefit values”, ISO 13232-5 Annex E presents the following “suggested reference guidelines” for the
70 The Abbreviated Injury Scale (AIS) is an extensive classification system internationally developed and maintained by the Association for the Advancement of Automotive Medicine. It is the most widely recognized and used classification system for vehicular injuries, in which injuries are classified according to their specific location, type and severity. The AIS scale is used in the ISO 13232-5 standard, as one way to classify simulated and actual injuries. The AIS scale ranges from AIS 1 (minor) to AIS 6 (maximal), each of these in accordance with multiple criteria including extent of tissue damage, difficulty and urgency of treatment, and probability of fatality. AIS 6 injuries are the most severe in the classification system, and on average have a probability of fatality of approximately 80% (depending on many factors including promptness of treatment). The AIS classification system is updated every several years, reflecting advances in medical treatment, improvement of the quality and quantity of available statistics and many other factors.

L-5
overall normalized injury cost (ICnorm):
1) “Ideally, the percentage of accidents which are beneficial should be greater than the percentage which indicate no effect, which should be greater than the percentage which are harmful,
2) the risk/benefit percentage should be less than seven percent and should not be more than 12 percent,71
3) the net benefit should be greater than zero, and
4) the average benefit per beneficial case should be greater than the average risk per harmful case.”
As discussed in the rationale to ISO 13232-5 (in Annex O thereto), these reference values are based on self-evident concepts that: a safety device should have a net benefit greater than zero (Item 3) and should (at least in principle) have injury benefits in more cases than it has no effect or a harmful effect (Item 1); it should “do no (or very little) harm” (i.e., create no (or few) new injuries) in comparison to its benefits (Item 2); and the average benefit should be larger than the average harm (i.e., injury risk) (Item 4) “in order to address situations in which a large number of small injury benefits may [inappropriately tend to] outweigh a small number of serious (i.e., life threatening) injury risks”, as discussed by, e.g., Thompson et al. (2001).
For two wheeled vehicles, examples of protective devices which have been reported to meet the ISO 13232 criteria are the frontal crash protection frame described by Osendorfer et al. (2001) and the Honda GL airbag described by Kuroe et al. (2005).
71 Stated in ISO 13232-5 Annex E to be “Based on the results for automobile seat belts (7 percent) based on Malliaris, et al., 1982, as described by Rogers, [et al.] 199[8], which is presumed to be an acceptable risk/benefit percentage; and the results for pre-1998 automobile passenger airbags (12 percent), based on Iijima, et al., 1998, which is presumed to be an unacceptable risk/benefit percentage.”

L-6
Section L-II
SUPPLEMENTAL RESULTS OF INJURY RISK-BENEFIT ANALYSIS
Table 1 of the Zellner et al. (2014) TRB paper presented the risk/benefit and net benefit results for seven countermeasure comparisons between various baseline configurations and various countermeasure configurations for overall normalized injury costs (ICnorm) and probability of fatality (POF). The seven comparisons were as follows:
Baseline Countermeasure No helmet, no CPD Full face helmet, no CPD No helmet, no CPD Half helmet, no CPD No helmet, no CPD No helmet, with CPD Full face helmet, no CPD (intended use) Full face helmet, with CPD Full face helmet, no CPD (intended use) No helmet, with CPD Half helmet, no CPD (intended use) Half helmet, with CPD Half helmet, no CPD (intended use) No helmet, with CPD
A. SUPPLEMENTAL RESULTS FOR ALL OVERTURN CASES
Supplemental injury indices and risk-benefit indices for the sample of
approximately 770 simulated overturns (representing “all” overturn types in the sample of 110 UK/US overturn accident cases) are presented in Section L-A of this appendix.72
Each table in Section L-A of this appendix restates the results (for each of the above seven countermeasure configurations) that were previously presented in Table 1 of Zellner et al. (2014)73, including the following injury indices:
− Total normalized injury cost (ICnorm);
72 Some of the simulated cases did not result in an overturn and were excluded from the risk/benefit and net benefit analysis. For each helmet-CPD configuration, the number of remaining simulation pairs that resulted in an overturn both with and without the CPD, and used in the risk/benefit analysis, varied between 684 and 687 out of a possible 770 simulation pairs. 73 The results in Section L-A of this appendix are slightly different from those in Zellner et al. (2014) because a) the probability of fatality calculation used in the TRB paper did not account for asphyxiation fatalities, and this had been corrected herein, and b) the injury cost model results for four unhelmeted Quadbar cases with indicated asphyxiation fatalities were revised as described in Footnote 8 on page 3 of the main report (note that this later change slightly reduces the total estimated injury risk of the Quadbar).

L-7
− Probably of fatality (POF); and the following risk-benefit indices:
− Estimated risk/benefit percentage; − Estimated net benefit.
In addition, each table in Section L-A of this appendix also includes the following additional injury indices (which are calculated from the same simulation output files as were used previously):
− Incremental normalized injury cost for head; − Incremental normalized injury cost for face; − Incremental normalized injury cost for neck; − Incremental normalized injury cost for chest; − Incremental normalized injury cost for abdomen; − Incremental normalized injury cost for femurs; − Incremental normalized injury cost for knees; − Incremental normalized injury cost for tibias; − Number of cases with at least one AIS 6 (maximal) injury across all body
regions; − Number of cases with head AIS 6 (maximal) injury; − Number of cases with neck AIS 6 (maximal) injury; − Number of cases with chest AIS 6 (maximal) injury; − Number of cases with AIS 6 asphyxiation potential (i.e., cases exceeding
490 N (110 lb) chest compressive force 10 seconds after overturn begins). Section L-A of this appendix also includes the following additional risk/benefit indices for all of the above injury indices:
− Percentage of cases in which the protective device is beneficial; − Percentage of cases in which the protective device is harmful; − Percentage of cases in which the protective device has no effect (i.e., shows
no difference); − Average risk per beneficial case; − Average risk per harmful case.
The helmet configurations used for these supplemental calculations were, as described in Zellner et al. (2014):
− Unhelmeted − Half helmet (THH T70) − Full face helmet (Bieffe B12R)
and combinations of these, as further described subsequently.

L-8
1. Summary of Results for “All” ATV Overturn types
Based on the detailed results given in Section L-A of this appendix, Table L-1 summarizes the Quadbar risk-benefit outcomes in terms of normalized injury cost (ICnorm) across all body regions for five helmet configurations and for the sample of 770 simulated overturns representing all of the 110 UK/US ATV overturn types, along with an indication of whether the outcomes meet the guidelines of the ISO 13232-5 standard.
The only statistically significant results in Table L-1 are for the last two
helmet configurations, in which the dummy on the Quadbar ATV is unhelmeted and the dummy on the Baseline ATV is helmeted (with half helmet and with full face helmet respectively). These rows indicate that addition of the Quadbar, if accompanied by removal of the helmet, results in a statistically significant negative net benefit (i.e., a net harm). This outcome is relevant for users who may mistakenly believe that fitting a Quadbar may enable them not to wear a helmet.
The first three rows of Table L-1 indicate that fitting a Quadbar while not changing helmet configuration has no statistically significant effect. The unhelmeted configuration results in the first row indicate that the Quadbar has a non-statistically significant net benefit of 13 percent, in which the Quadbar average benefit per beneficial case is greater than the Quadbar average risk per harmful case, and the number of beneficial cases exceeds the number of harmful cases. However, the risk/benefit percentage of 65 % greatly exceeds the ISO 13232-5 guideline of maximum 12%, indicating that there are substantial new injuries caused by the Quadbar (i.e., for every 3 injuries prevented by the Quadbar, there are roughly two new injuries created by the Quadbar). In contrast, the half helmet and full face helmet results in the second and third rows indicate that if the rider is helmeted, the Quadbar has a non-statistically significant negative net benefit (of -20% and -3% respectively), in which the Quadbar average risk per harmful case is greater than the Quadbar average benefit per beneficial case, when a helmet is worn with and without a Quadbar (and although the number of Quadbar beneficial cases exceeds the number of harmful cases). The latter outcomes imply that when there is a Quadbar harmful case (although there are fewer of them than Quadbar beneficial cases), it involves a substantial harm. The results in Table L-1 are corroborated by the results in Table L-2, which summarizes the risk-benefit outcomes for the critical body regions (head, neck chest,

L-9
asphyxia) in terms of number of AIS 6 (maximal) injury, for the five helmet configurations and for all (n=770) overturn types. For the unhelmeted configuration, there is a non-statistically significant net injury benefit in terms of the number of maximum AIS 6 (MAIS 6) injuries across all body regions, however with a risk/benefit percentage greater than the maximum 12% ISO 13232-5 guideline. However, for the half helmet, there is a statistically significant negative net benefit in terms of the number of MAIS 674 injuries across all body regions of -107%, essentially doubling the total number of MAIS 6 injuries (i.e., as indicated, from 15 MAIS 6 injuries to 31 MAIS 6 injuries75). Further examination of the results in Table L-2 reveals that this doubling of the number of MAIS 6 injuries is associated with increased numbers of AIS 6 head (brain) injuries (from 10 to 12), AIS 6 neck injuries (from 4 to 13), and AIS 6 asphyxias (from 2 to 8). Results for the full face helmet in Table L-2 are mixed, there being a non-statistically significant negative injury benefit (i.e., a net harm) in terms of the MAIS 6 of -9% (i.e., an increase of MAIS 676 injuries from 11 to 12). This is observed to be the result of an increased number of AIS 6 neck injuries (from 1 to 6) with the Quadbar, and a decreased number of AIS 6 head injuries (from 5 to 3) and AIS 6 asphyxias (from 5 to 4). The fourth and fifth rows in Table L-2 indicate that fitment of the Quadbar along with removing the helmet has a statistically significant negative net benefit for AIS 6 head injuries (as might be expected from removal of the helmet); and non-statistically significant negative net benefits in terms of AIS 6 neck injuries, and mixed effects on AIS 6 asphyxias. Further review of the detailed results in Section L-A indicated that for the three basic helmet configurations (i.e., in which the Baseline ATV and Quadbar ATV both had the same helmet configuration) and for the critical body regions (i.e., head, neck, chest, asphyxia) there were only two statistically significant outcomes: a statistically significant Quadbar negative net benefit (i.e., an net injury risk) of 97% in terms of neck incremental injury cost with the half helmet; and a statistically significant Quadbar negative net benefit (i.e., an net injury risk) of 107% in terms of neck
74 In accordance with international convention, the maximum AIS across all body regions is denoted as “MAIS”. For the purpose of the injury risk-benefit analysis reported herein, MAIS includes only those body regions and injuries that are monitorable by the dummy and an included in the injury cost model described by ISO 13232-5 (2005) with extensions for the vault and face fracture and mechanical/traumatic (compressive) asphyxia. Therefore injuries such as arm fractures, burns, contusions, and abrasions are not included in the MAIS results reported in this appendix. 75 Approximately doubling the number of MAIS 6 injuries can be interpreted as approximately doubling the probable number of fatalities. Note that MAIS 6 represents the highest probability of fatality, though fatality is not certain. 76 “MAIS 6” denotes a maximum (across all monitorable and modeled body regions, see Footnote 74) Abbreviated Injury Scale value equal to 6, which in turn denotes a “maximal” injury having the highest probability of fatality, according to the AIS Coding Manual, published by the Association for the Advancement of Automotive Medicine (2005).

L-10
incremental injury cost with the full face helmet. This means that, in effect, the neck injury risk is roughly doubled by fitment of the Quadbar, when a helmet is worn. Examination of the simulation animations for the AIS 6 outcomes suggested that potential mechanisms for these differing results due to helmet configuration may include:
− greater head protection afforded by the half helmet (in comparison to unhelmeted) and the full face helmet (in comparison to the half helmet), as previously reported in Zellner et al. (2014);
− somewhat different trajectories of the dummy head and body due to
progressively greater helmet mass and size;
− potential load transfer (or “bridging”) effects if/when the ATV lands on the dummy head/helmet (e.g., as a result of Quadbar “pole vaulting” action, see Figure L-1 below), wherein the helmet (which is rigid and larger than the head) may contact and support the ATV, thereby transferring increased loads to the neck.

L-10
Table L-1. Summary of Quadbar risk-benefit outcomes for sample of all ATV overturn types (770 Simulations)
Configuration:
Quadbar ATV
relative to
Baseline ATV
Injury Index Net Benefit % Risk/Benefit % Avg ben./ben
case>Avg
risk/harm case
% Ben. >
% Harmful
Significant Not significant Meets ISO
(Net Benefit
% > 0%)
Significant Not significant Meets ISO
(Risk/Benefit
% < 12%)
Meets ISO Meets ISO
Both are
unhelmeted
ICnorm +13 Yes 65 No Yes Yes
Both are half
helmet
ICnorm -20 No 158 No No Yes
Both are full
face helmet
ICnorm -3 No 108 No No Yes
Quadbar is
unhelmeted,
Baseline is
half helmet
ICnorm -70 No 370 No No No
Quadbar is
unhelmeted,
Baseline is full
face helmet
ICnorm -111 No 483 No No No

L-11
Table L-2. Summary of Quadbar risk-benefit AIS 6 (maximal injury) outcomes for sample of all ATV overturn types (770 Simulations)
Configuration: Quadbar ATV
relative to Baseline ATV
Injury Index Net Benefit % Risk/Benefit % Baseline
ATV count
Quadbar
ATV count Significant Not significant Significant Not significant
Both are unhelmeted MAIS 6 +24 59 93 71
Head AIS 6 +20 65 84 67
Neck AIS 6 +36 56 11 7
Chest AIS 6 UD Risk=Benefit=0 0 0
Asphyxia AIS 6 +57 33 7 3
Both have half helmet MAIS 6 -107 245 15 31
Head AIS 6 -20 133 10 12
Neck AIS 6 -225 325 4 13
Chest AIS 6 UD Risk=Benefit=0 0 0
Asphyxia AIS 6 -300 400 2 8
Both have full face helmet MAIS 6 -9 109 11 12
Head AIS 6 +40 60 5 3
Neck AIS 6 -500 600 1 6
Chest AIS 6 UD Risk=Benefit=0 0 0
Asphyxia AIS 6 +20 80 5 4

L-12
Table L-2. (cont’d)
Configuration: Quadbar ATV
relative to Baseline ATV
Injury Index Net Benefit % Risk/Benefit % Baseline
ATV count
Quadbar
ATV count Significant Not significant Significant Not significant
Quadbar is unhelmeted,
Baseline is half helmet
MAIS 6 -373 1033 15 71
Head AIS 6 -570 2950 10 67
Neck AIS 6 -75 175 4 7
Chest AIS 6 UD Risk=Benefit=0 0 0
Asphyxia AIS 6 -50 150 2 3
Quadbar is unhelmeted,
Baseline is full face helmet
MAIS 6 -545 957 11 71
Head AIS 6 -1240 6300 5 67
Neck AIS 6 -600 700 1 7
Chest AIS 6 UD Risk=Benefit=0 0 0
Asphyxia AIS 6 40 60 5 3

L-13
Figure L-1 illustrates an example simulation animation time sequence resulting in the Baseline ATV dummy having no serious recorded injuries; and the Quadbar ATV having an AIS 6 (maximal) neck injury. In both cases the ATV is initially moving uphill on a steep slope, a substantial throttle input is applied, and the ATV overturns rearward77. The Baseline ATV overturns rearward, the dummy separates from the ATV in the rearward direction, the ATV tumbles downhill, overtakes and contacts the dummy, with no serious recorded injuries (in a manner similar to that observed in the Van Auken et al. (1998) full scale uphill/rearward overturn tests, and also several of the Van Ee (2012) uphill/rearward overturns in which there were no recorded injuries with a baseline ATV in similar scenarios). In contrast, in Figure L-1, the Quadbar ATV overturns rearward onto the Quadbar itself, and then “pole-vaults” upward, rotating upward about the Quadbar/ground contact point, the Quadbar ATV rising to a substantially greater height than the Baseline ATV78, and then the ATV front end lands on the head-neck region of the dummy, recording forces/moments corresponding to a AIS 6 neck injury (at the AO/C1 vertebrae). This type of mechanism was observed in a number of the n=770 simulation pairs, resulting in AIS 6 (as well as AIS 1-5) neck injuries.
77 This is a not uncommon overturn scenario within the UK/US accident sample that formed a basis for the n=770 overturn types and within the n=129 Van Ee (2012) internet videos. 78 As hypothesized by Van Ee (2012); as also observed in the Snook (2009) tests (Figure 9 therein); and as also observed in the Van Auken et al. (1998) uphill/rearward overturn tests with the U-Bar CPD (rather than the Quadbar CPD, which did not yet exist).

L-14
Figure L-1. Example simulation animation time sequence, uphill/rearward overturn, with Baseline ATV (left) resulting in AIS 1 (minor) neck injury, with Quadbar ATV (right) resulting in AIS 6 (maximal) neck injury, AIS 6 (maximal) brain injury, AIS 1
(minor) face fracture

L-15
Note that the AIS 6 asphyxia net benefit outcomes (as well as the AIS 6 outcomes for the neck and other critical body regions) vary substantially with helmet configuration, however, with the several exceptions noted (i.e., for the AIS 6 neck injury and for the number of MAIS 6 injuries), almost none of these are statistically significant within a 95% confidence interval (i.e., p=0.05), i.e., according to conventional statistical practice, one cannot be “somewhat convinced of [the] reality of” the differences.79 In particular, the asphyxia outcomes (and AIS 6 outcomes for other critical body regions) are based on very few predicted asphyxias (as noted in Table L-2) and, although the frequency of pinned asphyxia in the simulations is similar to that observed in US and AU accident data,80 given their relatively small number, small perturbations in the overturn conditions would be expected to result in substantially different percentage outcomes.81 As observed in Table L-1, in none of the five helmet configurations does the Quadbar meet all four of the ISO 13232-5 Annex E guideline risk-benefit criteria, for the sample of “all” ATV overturn types. 2. Summary of Results for “Low Speed” ATV Overturn types
Based on the detailed results given in Section L-B of this appendix, Table L-3
summarizes the Quadbar risk-benefit outcomes in terms of normalized injury cost (ICnorm) across all body regions for five helmet configurations and for the sample of n=304 ATV “low speed” (less than 20 km/h) overturn types,82 along with an indication of whether the outcomes meet the guidelines of the ISO 13232-5 standard.
79 Box et al. (1978), page 109. 80 For example, US CPSC fatality data (see Footnote 38) indicates that 1.2% of fatal accidents involved pinned compressive asphyxia; and Clapperton, et al (2013) indicates that 0.2% (i.e., n=3) of a Victorian 8 year census of n=1,601 fatal, hospital admission and non-admitted emergency department presentations associated with ATV accidents involved traumatic asphyxiation. As indicated in Table L-2, the simulations result in roughly 1% or less of pinned compressive asphyxias, depending on the helmet configuration. 81 An analogy would be a coin toss. If six coins were tossed (i.e., similar to the number of asphyxias indicated in the footnotes to Table L-2), there is a relatively high and equal probability that one might observe either 2 heads and 4 tails (33%/67%) or 4 heads and 2 tails (67%/33%), thereby exhibiting very large differences in the percentage of head and tail outcomes. On the other hand, if (in this example) 100 coins were tossed, the variation in the percentage outcomes would be expected to be much smaller, and would tend to be closer to 50%/50%, overall. 82 Some of the simulated cases did not result in an overturn and were excluded from the risk/benefit and net benefit analysis. The number of remaining simulation pairs that resulted in an overturn with and without the CPD, and used in the risk/benefit analysis, varied from 298 to 300 out of a possible 304 simulation pairs. In addition, several simulation pairs were subsequently identified that had minor modeling anomalies, such that they were subsequently also excluded from the risk/benefit analysis. Each of these excluded anomalous pairs was at low speed, and was associated with a Quadbar injury risk, so that their exclusion slightly reduced the total injury risk of the Quadbar.

L-16
Table L-3 summarizes the results for the “low speed” (speed less than 20 km/h) ATV overturn types that are, according to Grzebieta et al. (2015), relevant to ATV work use on farms. The only statistically significant results are for the last two helmet configurations, in which the dummy on the Quadbar ATV is unhelmeted and the dummy on the Baseline ATV is helmeted (half helmet and full face helmet respectively). As with the “all” overturn sample, the last two rows in Table L-3 indicate that for “low speed” overturns, addition of the Quadbar, if accompanied by removal of the helmet, results in a statistically significant negative net benefit (i.e., a net harm). This outcome is relevant for users who may mistakenly believe that fitting a Quadbar may enable them not to wear a helmet. The first three rows of Table L-3 indicate that fitting a Quadbar while not changing helmet configuration has no statistically significant effect. The unhelmeted configuration results in the first row indicate that the Quadbar has a non-statistically significant negative net benefit (i.e., a net harm) of -4 percent, in which the average net risk is greater than the average benefit, and the number of beneficial cases exceeds the number of harmful cases. The risk/benefit percentage of 111% also substantially exceeds the ISO 13232-5 guideline of maximum 12%. The half helmet and full face helmet results in the second and third rows of Table L-3 also indicate that the Quadbar has a non-statistically significant negative net benefit (of -40% and -3% respectively), in which the average risk is greater than the average benefit, although the number of beneficial cases exceeds the number of harmful cases. The latter fact implies that when there is a Quadbar harmful case (although there are fewer of them than Quadbar beneficial cases) it involves a substantial harm. The results in Table L-3 are corroborated by the results in Table L-4, which summarizes the risk-benefit outcomes for the critical body regions (head, neck, chest, asphyxia) in terms of number of AIS 6 (maximal) injury, for all (n=304) “low speed” overturn types. For the unhelmeted configuration, there is a non-statistically significant net injury benefit of +13% in terms of all AIS 6 injuries, however this occurs with a risk/benefit percentage of 80%, which is substantially greater than the maximum 12% ISO 13232-5 guideline. For the half helmet, there is a statistically significant negative net benefit for MAIS 6 injuries across all body regions of -267%, nearly quadrupling the number of MAIS 6 injuries (i.e., as indicated, increasing the MAIS 6 count from 3 to 11). Further examination of the data in Table L-4 reveals that this is associated with increased numbers of AIS 6 neck injuries (which increased from 0 to 6) and AIS 6 asphyxias (which increased from 2 to 5). Results for the full face helmet in Table L-4 are mixed, there being no change in the number of MAIS 6

L-17
injuries. This is observed to be the result of an increased number of AIS 6 neck injuries (increased from 0 to 3) and a decreased number of AIS 6 asphyxias (decreased from 4 to 1). The fourth and fifth rows in Table L-4 indicate that fitment of the Quadbar along with removing the helmet has a non-statistically significant negative net benefit for AIS 6 head injuries (as might be expected from removal of the helmet) and also for AIS 6 neck injuries, and a non-statistically significant net benefit on AIS 6 asphyxias. Note that the net number of new AIS 6 head and neck injuries created by the Quadbar (13 when removing the half helmet, 14 when removing the full face helmet) greatly exceeds the net number of AIS 6 asphyxias prevented by the Quadbar (2 when removing the half helmet, 4 when removing the full face helmet). Again, the asphyxia net benefit outcomes (both positive and negative) – as well as those for the neck and other critical body regions – appear to vary substantially with helmet configurations, however, with some exceptions (i.e., number of MAIS 6 injuries, and neck incremental injury cost, described subsequently, both of these with the half helmet) these outcomes are not statistically significantly different from 0 within a 95% confidence interval (i.e., p=0.05), i.e., according to conventional statistical practice, one cannot be “somewhat convinced of [the] reality of” the differences83. In particular, the asphyxia AIS 6 outcomes (as well as the AIS 6 outcomes for other critical body regions) are based on very few predicted AIS 6 asphyxias (as noted in Table L-4) and, although the frequency of pinned asphyxia in the simulations is similar to that observed in US and AU accident data84, given their relatively small number, perturbations in the overturn conditions would be expected to result in substantially different percentage outcomes.85
Further review of the detailed data in Section L-B of this appendix indicated that for the three basic helmet configurations (i.e., in which the Baseline ATV and Quadbar ATV both had the same helmet configuration) and for the critical body regions (i.e., head, neck, chest, asphyxia) there was only one statistically significant
83 Box et al. (1978) page 109. 84 For example, US CPSC fatality data (see footnote 38) indicates that 1.2% of ATV n=2,977 fatal accidents compiled by the US CPSC during 2005 through 2009 involved pinned compressive asphyxia; and Clapperton, et al. (2013) indicates that 3 of n=1,601 (i.e., 0.2% of) ATV accidents (i.e., comprising all fatalities, hospital admissions and non-admitted ED presentations) in Victoria, Australia during the 2002 to 2010 period involved traumatic asphyxiation. As indicated in the Tables L-1 and L-2, the simulations result in roughly 1% or less of predicted pinned compressive asphyxia, depending on helmet condition. 85 An analogy would be a coin toss. If six coins were tossed (i.e., similar to the number of asphyxias indicated in the footnotes to Table L-2), there is a relatively high and equal probability that one might observe 2 heads and 4 tails (33%/67%) or 4 heads and 2 tail (67%/33%), thereby exhibiting very large changes in the percentage of head and tail outcomes. On the other hand, if (in this example) 100 coins were tossed, the variation in the percentage outcomes would be expected to be much smaller, and would tend to be closer to 50%/50%, overall.

L-18
outcome: a statistically significant Quadbar negative net benefit (i.e., an net injury risk) of 297% in terms of neck incremental injury cost with the half helmet. This means that, in effect, the neck injury risk is roughly quadrupled by fitment of the Quadbar, when a half helmet is worn. Figure L-1 above illustrates one of the mechanisms involved in some of the new neck injuries associated with the Quadbar. As in the “all” overturn sample, examination of the simulation animations for the AIS 6 outcomes for the “low speed” overturn sample suggested that potential mechanisms for the helmet effect may include greater head protection with more helmet coverage; somewhat different trajectories of the dummy head and body due to greater head/helmet mass and size; and potential load transfer (or “bridging”) to the neck if/when the ATV lands on the dummy head/helmet (e.g., as a result of Quadbar “pole vaulting” action). As observed in Table L-4, in none of the five helmet configurations does the Quadbar meet all four of the ISO 13232-5 Annex E guideline risk-benefit criteria, for the sample of “low speed” ATV overturn types.

L-19
Table L-3. Summary of Quadbar risk-benefit outcomes for sample of “Low Speed” ATV overturn types (n=304) Configuration:
Quadbar ATV
relative to
Baseline ATV
Injury Index Net Benefit % Risk/Benefit % Avg ben./ben
case>Avg
risk/harm case
% Ben. >
% Harmful
Significant Not significant Meets ISO
(Net Benefit
% > 0%)
Significant Not significant Meets ISO
(Risk/Benefit
% < 12%)
Meets ISO Meets ISO
Both are
unhelmeted
ICnorm -4 No 111 No No Yes
Both have half
helmet
ICnorm -40 No 205 No No Yes
Both have full
face helmet
ICnorm -3 No 106 No No Yes
Quadbar is
unhelmeted,
Baseline is
half helmet
ICnorm -73 No 364 No No No
Quadbar is
unhelmeted,
Baseline is full
face helmet
ICnorm -119 No 401 No Yes No

L-20
Table L-4. Summary of Quadbar risk-benefit AIS 6 (maximal injury) outcomes for sample of “Low Speed” ATV overturn types (n=304)
Configuration: Quadbar ATV
relative to Baseline ATV
Injury Index Net Benefit % Risk/Benefit % Baseline
ATV count
Quadbar
ATV count Significant Not significant Significant Not significant
Both are unhelmeted MAIS 6 +13 80 15 13
Head AIS 6 0 100 12 12
Neck AIS 6 -100 200 1 2
Chest AIS 6 UD Risk=Benefit=0 0 0
Asphyxia AIS 6 +100 0 2 0
Both have half helmet MAIS 6 -267 367 3 11
Head AIS 6 0 100 1 1
Neck AIS 6 UD Risk>0, Benefit=0 0 6
Chest AIS 6 UD Risk=Benefit=0 0 0
Asphyxia AIS 6 -150 250 2 5
Both have full face helmet MAIS 6 0 100 4 4
Head AIS 6 UD Risk=Benefit=0 0 0
Neck AIS 6 UD Risk>0, Benefit=0 0 3
Chest AIS 6 UD Risk=Benefit=0 0 0
Asphyxia AIS 6 +75 25 4 1

L-21
Table L-4. (cont’d)
Configuration: Quadbar ATV
relative to Baseline ATV
Injury Index Net Benefit % Risk/Benefit % Baseline
ATV count
Quadbar
ATV count Significant Not significant Significant Not significant
Quadbar is unhelmeted,
Baseline is half helmet
MAIS 6 -333 433 3 13
Head AIS 6 -1100 1200 1 12
Neck AIS 6 UD Risk>0, Benefit=0 0 2
Chest AIS 6 UD Risk=Benefit=0 0 0
Asphyxia AIS 6 100 0 2 0
Quadbar is unhelmeted,
Baseline is full face helmet
MAIS 6 -225 325 4 13
Head AIS 6 UD Risk>0, Benefit=0 0 12
Neck AIS 6 UD Risk>0, Benefit=0 0 2
Chest AIS 6 UD Risk=Benefit=0 0 0
Asphyxia AIS 6 100 0 4 0

L-22
Section L-III CONCLUSIONS FROM THE SUPPLEMENTAL ANALYSIS
This appendix provides a further supplemental analysis of the computer simulation data underlying the Quadbar Crush Protective Device (CPD) risk/benefit analysis described in this report and the Zellner et al. (2014) TRB paper. The supplemental analysis involved calculation of additional injury indices (i.e., the incremental injury costs for each body region, and the number of AIS 6 (maximal) injuries) and additional risk-benefit indices (i.e., the average benefit per protective device beneficial case, the average risk per protective device harmful case, and the percentage of cases in which the protective device is beneficial, had no effect and is harmful) and additional risk-benefit criteria, in accordance with methods defined in International Standard ISO 13232-5 (2005). This supplemental analysis was conducted for two samples of ATV overturn types: “all” (n=770 simulated) overturns; and a “low speed” subsample (n=304) of the “all” overturn (main) sample. “Low speed” was defined as less than 20 km/h as proposed by Grzebieta et al. (2014). In addition, three helmet configurations were analyzed: full face helmet; unhelmeted and half helmet. This supplemental analysis provided additional insights into body regions affected by the Quadbar device, as well as the frequency and magnitude of the Quadbar injury benefits and injury risks. Results for the “all” ATV overturn types sample indicate that the Quadbar produces a:
− statistically significant Quadbar negative net injury benefit (i.e., a net injury risk) in terms of neck incremental injury cost, for the full face helmet (-107%) and half helmet (-97%), i.e., fitment of the Quadbar roughly doubled the neck injury risk for the helmeted condition;
− statistically significant Quadbar negative net injury benefit (i.e., a net injury risk) in terms of the total number of maximum AIS 6 injuries across all body regions when the half helmet was worn. This resulted from non-statistically significant increases in the numbers of AIS 6 head injuries (from 10 to 12), AIS 6 neck injuries (from 4 to 13) and AIS 6 asphyxias (from 2 to 8) when the Quadbar was fitted; and

L-23
− statistically significant negative net injury benefit (i.e., a net injury risk) in terms of the normalized injury cost across all body regions if the helmet is removed when a Quadbar is fitted. This outcome is relevant for users who may mistakenly believe that fitting a Quadbar may enable them not to wear a helmet.
In addition, for the “all” ATV overturn sample there were changes due to fitment of the Quadbar that were not statistically significant, for other helmet configurations and injury indices. For the unhelmeted configuration, these included non-statistically significant reductions in normalized injury cost and in AIS 6 injuries to all critical body regions; and for the full face helmet configuration, non-statistically significant increases in normalized injury cost and in AIS 6 injuries to the neck, and non-statistically significant reductions in total number of AIS 6 injuries, AIS 6 head injuries and AIS 6 asphyxias. For all of these non-statistically significant changes due to fitment of the Quadbar (that were not statistically significant within a 95% confidence interval. i.e., p=0.05), one cannot be “somewhat convinced of [the] reality of” the differences according to conventional statistical practice86, due to the relatively small magnitude and/or frequency of the changes.
However, results for the “low speed” (i.e., speed less than or equal to 20 km/h) ATV overturn types subsample, which according to Grzebieta et al. (2015), is applicable to ATV work use on farms, indicated somewhat different results, generally involving relatively more Quadbar net injury risks than for the “all” overturn types sample. In particular, results for the “low speed” ATV overturn types subsample indicate that the Quadbar produces a:
− statistically significant negative net injury benefit (i.e., net injury risk) in terms of neck incremental normalized injury cost, for the half helmet configuration (-297%), i.e., fitment of the Quadbar roughly quadrupled the neck injury risk; and
− as with the “all” overturn sample, statistically significant negative net injury benefit (i.e., a net injury risk) in terms of the normalized injury cost across all body regions if the helmet is removed when a Quadbar is fitted. This outcome is relevant for users who may mistakenly believe that fitting a Quadbar may enable them not to wear a helmet.
86 Box et al. (1978) page 109.
L-24
In addition, for the “low speed” ATV overturn sample there were changes due to fitment of the Quadbar that were not statistically significant, for other helmet configurations and injury indices. For the unhelmeted configuration, these included non-statistically significant (i.e., relatively small compared to the known uncertainty in the estimate) increases in the estimated overall normalized injury cost and number of AIS 6 neck injuries, and non-statistically significant (i.e., relatively small) reductions in the estimated number of AIS 6 asphyxias; for the half helmet configurations, non-statistically significant increases in the estimated normalized injury cost and number of AIS 6 neck injuries and asphyxias; and for the full face helmet configuration, non-statistically significant increases in the estimated normalized injury cost and number of AIS 6 neck injuries, and non-statistically significant reductions in the numbers of total MAIS 6 injuries, AIS 6 head injuries and AIS 6 asphyxias. Summing across all three helmet configurations, fitment of the Quadbar resulted in non-statistically significant increases in the total number of MAIS 6 injuries (from 22 to 28), AIS 6 neck injuries (from 1 to 11), and non-statistically significant reductions in AIS 6 asphyxias (from 8 to 6). For all of these non-statistically significant changes due to fitment of the Quadbar (that were not statistically significant within a 95% confidence interval. i.e., p=0.05), one cannot be “somewhat convinced of [the] reality of” the differences according to conventional statistical practice87, due to the relatively small magnitude and/or frequency of the changes.
For the “low speed” ATV overturn subsample and in terms of normalized injury costs, the Quadbar had a negative net benefit (i.e., a net risk) for all five helmet configurations; and for all five helmet configurations did not meet at least three of the four ISO 13232 protective device guidelines. Overall, the supplemental results suggest that, particularly for “low speeds”, the Quadbar has a potentially (i.e., non-statistically significant) adverse effect (i.e., net injury harm) for the neck and other critical body regions, including AIS 6 asphyxias for the half helmet condition. These low speed conditions have been reported to be relevant to operating conditions on Australian farms. Based on these findings, the Quadbar device evaluated in this study should not be fitted to ATVs, including for predominantly “low speed” ATV operating environments, because the net injury risks from (i.e., new injuries created by) a Quadbar are generally similar in magnitude to (and for some conditions, on average
87 Box et al. (1978) page 109.

L-25
greater than) the injury benefits from (i.e., injuries prevented by) a Quadbar; the injury risks in comparison to the injury benefits far exceed published levels for other protective devices in other vehicles; and also exceed ISO 13232 guidelines - as well as apparent workplace health and safety policies for some of the Australian states - for protective devices. Authorities and individuals should be advised of these findings.

L-26
Section L-A SUPPLEMENTAL RISK/BENEFIT RESULTS FOR
“ALL” ATV OVERTURN TYPES (770 SIMULATIONS)
Tables L-5 through L-9 below are expanded versions of the Zellner et al. (2014) TRB paper’s Quadbar OPD risk-benefit results for various helmet configurations, for the sample of n=770 “all” ATV overturn types. The helmet conditions are:
− Unhelmeted Quadbar ATV versus Unhelmeted Baseline ATV (Table L-5)
− Half helmet Quadbar ATV versus Half helmet Baseline ATV (Table L-6)
− Full face helmet Quadbar ATV versus Full face helmet Baseline ATV (Table L-7)
− Unhelmeted Quadbar ATV versus Half helmet Baseline ATV (Table L-8)88
− Unhelmeted Quadbar ATV versus Full face helmet Baseline ATV (Table L-9)24
88 This condition is relevant in the event that riders may mistakely believe they can remove their helmet if a Quadbar is fitted.

L-27
Table L-5. Analysis Results for Quadbar ATV with Unhelmeted Rider versus Baseline ATV with Unhelmeted Rider, for “All” ATV Overturn Types
Measure Risk/Benefit Net BenefitPercentHarmful
PercentBeneficial
PercentNo Difference
Average Risk/Harmful Case
Average Benefit/Beneficial Case
ICnorm 65% [ 41%, 110%] 13% [-3%, 29%] 33.3 42.0 24.7 0.1 0.2
ICnorm,head 65% [ 39%, 115%] 13% [-5%, 31%] 33.0 38.3 28.7 0.1 0.2
ICnorm,face 88% [ 48%, 170%] 6% [-29%, 41%] 13.9 21.5 64.6 0.0 0.0
ICnorm,neck 75% [ 45%, 135%] 16% [-20%, 52%] 20.6 20.9 58.5 0.1 0.1
ICnorm,chest 221% [ 66%, 579%] -115% [-327%, 97%] 6.7 5.4 87.9 0.0 0.0
ICnorm,abdomen 84% [ 56%, 130%] 6% [-9%, 21%] 3.2 2.8 94.0 0.0 0.0
ICnorm,femurs 42% [ 25%, 103%] 47% [-2%, 96%] 2.3 5.4 92.3 0.2 0.2
ICnorm,knees 73% [ 43%, 139%] 19% [-25%, 63%] 5.3 6.6 88.2 0.1 0.1
ICnorm,tibias 35% [ 20%, 103%] 65% [-3%, 133%] 1.3 3.8 94.9 0.1 0.1
Probability of Fatality 66% [ 41%, 114%] 15% [-5%, 35%] 29.2 38.7 32.0 0.1 0.2
MAIS=6 59% [ 36%, 122%] 24% [-12%, 60%] 4.7 7.9 87.4 1.0 1.0
HAIS=6 65% [ 37%, 135%] 20% [-19%, 59%] 4.5 7.0 88.5 1.0 1.0
NAIS=6 56% [ 28%, 156%] 36% [-45%, 117%] 0.7 1.3 98.0 1.0 1.0
CAIS=6 Risk=0 and Benefit=0 UD 0.0 0.0 100.0 UD UD
AsphyxiaAIS=6 33% [ 17%, 126%] 57% [-22%, 136%] 0.3 0.9 98.8 1.0 1.0
UD Denotes undefined value, i.e., the value of the denominator is zero.
Estimated risk/benefit percentage significantly more than 100%) p-value less than or equal to 0.05 and the injury risks of the device are greater than injury benefits of the device), and the estimated net benefit significantly less than 0% (i.e., significant disbenefit exists). Device causes significantly more injuries than it prevents.
Estimated risk/benefit percentage not significantly different from 100% (p-value is greater than 0.05, the injury risks of the device are effectively equal to injury benefits of the device), and the estimated net benefit percentage not significantly different from 0% (within 95% confidence interval). Injury risks of the device are effectively equal to injury benefits of the device.
Estimated risk/benefit percentage is significantly less than 100% (p-value less than or equal to 0.05 and the injury risks of the device are much less than the injury benefits of the device), and the estimated net benefit is significantly greater than 0% (i.e., significant benefit exists). May be a reasonable device assuming acceptable functional characteristics.

L-28
Table L-6. Analysis Results for Quadbar ATV with Half Helmeted Rider versus Baseline ATV with Half Helmeted Rider, for “All” ATV Overturn Types
Measure Risk/Benefit Net BenefitPercentHarmful
PercentBeneficial
PercentNo Difference
Average Risk/Harmful Case
Average Benefit/Beneficial Case
ICnorm 158% [ 97%, 248%] -20% [-42%, 2%] 31.7 36.5 31.7 0.2 0.1
ICnorm,head 121% [ 74%, 193%] -8% [-29%, 13%] 24.7 28.2 47.1 0.1 0.1
ICnorm,face 110% [ 58%, 209%] -5% [-45%, 35%] 12.3 15.6 72.1 0.0 0.0
ICnorm,neck 282% [ 114% , 502% ] -97% [-177% , -17% ] 20.8 14.3 64.9 0.1 0.1
ICnorm,chest 189% [ 84%, 348%] -75% [-179%, 29%] 6.4 5.8 87.7 0.0 0.0
ICnorm,abdomen 108% [ 68%, 175%] -3% [-23%, 17%] 4.7 3.1 92.3 0.0 0.0
ICnorm,femurs 55% [ 33%, 120%] 37% [-16%, 90%] 3.2 5.4 91.4 0.1 0.2
ICnorm,knees 62% [ 40%, 116%] 30% [-12%, 72%] 5.7 9.4 84.9 0.1 0.1
ICnorm,tibias 130% [ 46%, 311%] -23% [-161%, 115%] 1.3 0.7 98.0 0.1 0.1
Probability of Fatality 175% [ 99%, 284%] -31% [-63%, 1%] 27.5 30.7 41.8 0.1 0.1
MAIS=6 245% [ 104% , 388% ] -107% [-207% , -7% ] 3.9 1.6 94.4 1.0 1.0
HAIS=6 133% [ 60%, 258%] -20% [-94%, 54%] 1.2 0.9 98.0 1.0 1.0
NAIS=6 325% [ 81%, 633%] -225% [-524%, 74%] 1.9 0.6 97.5 1.0 1.0
CAIS=6 Risk=0 and Benefit=0 UD 0.0 0.0 100.0 UD UD
AsphyxiaAIS=6 400% [ 94%, 730%] -300% [-624%, 24%] 1.2 0.3 98.5 1.0 1.0
UD Denotes undefined value, i.e., the value of the denominator is zero.
Estimated risk/benefit percentage significantly more than 100%) p-value less than or equal to 0.05 and the injury risks of the device are greater than injury benefits of the device), and the estimated net benefit significantly less than 0% (i.e., significant disbenefit exists). Device causes significantly more injuries than it prevents.
Estimated risk/benefit percentage not significantly different from 100% (p-value is greater than 0.05, the injury risks of the device are effectively equal to injury benefits of the device), and the estimated net benefit percentage not significantly different from 0% (within 95% confidence interval). Injury risks of the device are effectively equal to injury benefits of the device.
Estimated risk/benefit percentage is significantly less than 100% (p-value less than or equal to 0.05 and the injury risks of the device are much less than the injury benefits of the device), and the estimated net benefit is significantly greater than 0% (i.e., significant benefit exists). May be a reasonable device assuming acceptable functional characteristics.

L-29
Table L-7. Analysis Results for Quadbar ATV with Full Face Helmeted Rider versus Baseline ATV with Full Face Helmeted Rider, for “All” ATV Overturn Types
Measure Risk/Benefit Net BenefitPercentHarmful
PercentBeneficial
PercentNo Difference
Average Risk/Harmful Case
Average Benefit/Beneficial Case
ICnorm 108% [ 69%, 168%] -3% [-24%, 18%] 26.8 35.2 38.0 0.1 0.1
ICnorm,head 99% [ 61%, 163%] 0% [-22%, 22%] 18.6 26.3 55.0 0.1 0.0
ICnorm,face Risk=0 and Benefit=0 UD 0.0 0.0 100.0 UD UD
ICnorm,neck 273% [ 104% , 503% ] -107% [-208% , -6% ] 16.9 11.4 71.8 0.1 0.0
ICnorm,chest 166% [ 76%, 307%] -55% [-148%, 38%] 7.0 3.9 89.1 0.0 0.0
ICnorm,abdomen 92% [ 62%, 137%] 3% [-13%, 19%] 2.6 4.4 93.0 0.0 0.0
ICnorm,femurs 104% [ 57%, 189%] -4% [-77%, 69%] 4.7 4.7 90.7 0.2 0.2
ICnorm,knees 45% [ 29% , 94% ] 44% [5% , 83% ] 4.4 9.9 85.7 0.1 0.1
ICnorm,tibias 114% [ 50%, 241%] -14% [-137%, 109%] 2.0 2.0 95.9 0.1 0.1
Probability of Fatality 121% [ 72%, 198%] -10% [-41%, 21%] 24.6 28.8 46.6 0.1 0.1
MAIS=6 109% [ 58%, 199%] -9% [-97%, 79%] 1.7 1.6 96.7 1.0 1.0
HAIS=6 60% [ 28%, 172%] 40% [-71%, 151%] 0.4 0.7 98.8 1.0 1.0
NAIS=6 600% [ 88%, 1194%] -500% [-1084%, 84%] 0.9 0.1 99.0 1.0 1.0
CAIS=6 Risk=0 and Benefit=0 UD 0.0 0.0 100.0 UD UD
AsphyxiaAIS=6 80% [ 32%, 232%] 20% [-130%, 170%] 0.6 0.7 98.7 1.0 1.0
UD Denotes undefined value, i.e., the value of the denominator is zero.
Estimated risk/benefit percentage significantly more than 100%) p-value less than or equal to 0.05 and the injury risks of the device are greater than injury benefits of the device), and the estimated net benefit significantly less than 0% (i.e., significant disbenefit exists). Device causes significantly more injuries than it prevents.
Estimated risk/benefit percentage not significantly different from 100% (p-value is greater than 0.05, the injury risks of the device are effectively equal to injury benefits of the device), and the estimated net benefit percentage not significantly different from 0% (within 95% confidence interval). Injury risks of the device are effectively equal to injury benefits of the device.
Estimated risk/benefit percentage is significantly less than 100% (p-value less than or equal to 0.05 and the injury risks of the device are much less than the injury benefits of the device), and the estimated net benefit is significantly greater than 0% (i.e., significant benefit exists). May be a reasonable device assuming acceptable functional characteristics.

L-30
Table L-8. Analysis Results for Quadbar ATV with Unhelmeted Rider versus Baseline ATV with Half Helmeted Rider, for “All” ATV Overturn Types
Measure Risk/Benefit Net BenefitPercentHarmful
PercentBeneficial
PercentNo Difference
Average Risk/Harmful Case
Average Benefit/Beneficial Case
ICnorm 370% [ 202% , 590% ] -70% [-99% , -41% ] 64.6 22.8 12.6 0.2 0.1
ICnorm,head 561% [ 265% , 877% ] -110% [-151% , -69% ] 73.4 13.2 13.5 0.2 0.1
ICnorm,face 307% [ 125% , 589% ] -85% [-149% , -21% ] 22.4 13.3 64.3 0.0 0.0
ICnorm,neck 241% [ 125% , 373% ] -88% [-149% , -27% ] 24.6 13.5 62.0 0.1 0.1
ICnorm,chest 250% [ 67%, 647%] -131% [-359%, 97%] 5.8 5.7 88.5 0.0 0.0
ICnorm,abdomen 78% [ 49%, 125%] 9% [-8%, 26%] 2.8 3.5 93.7 0.0 0.0
ICnorm,femurs 45% [ 27%, 104%] 46% [-3%, 95%] 2.5 5.4 92.1 0.2 0.2
ICnorm,knees 59% [ 38%, 111%] 32% [-8%, 72%] 5.1 9.2 85.7 0.1 0.1
ICnorm,tibias 101% [ 40%, 254%] -1% [-118%, 116%] 1.0 0.7 98.2 0.1 0.1
Probability of Fatality 500% [ 220% , 804% ] -120% [-169% , -71% ] 54.1 17.7 28.2 0.2 0.1
MAIS=6 1033% [ 173% , 1618% ] -373% [-579% , -167% ] 9.1 0.9 90.1 1.0 1.0
HAIS=6 2950% [ 186% , 4710% ] -570% [-880% , -260% ] 8.6 0.3 91.1 1.0 1.0
NAIS=6 175% [ 66%, 340%] -75% [-238%, 88%] 1.0 0.6 98.4 1.0 1.0
CAIS=6 Risk=0 and Benefit=0 UD 0.0 0.0 100.0 UD UD
AsphyxiaAIS=6 150% [ 42%, 407%] -50% [-304%, 204%] 0.4 0.3 99.3 1.0 1.0
UD Denotes undefined value, i.e., the value of the denominator is zero.
Estimated risk/benefit percentage significantly more than 100%) p-value less than or equal to 0.05 and the injury risks of the device are greater than injury benefits of the device), and the estimated net benefit significantly less than 0% (i.e., significant disbenefit exists). Device causes significantly more injuries than it prevents.
Estimated risk/benefit percentage not significantly different from 100% (p-value is greater than 0.05, the injury risks of the device are effectively equal to injury benefits of the device), and the estimated net benefit percentage not significantly different from 0% (within 95% confidence interval). Injury risks of the device are effectively equal to injury benefits of the device.
Estimated risk/benefit percentage is significantly less than 100% (p-value less than or equal to 0.05 and the injury risks of the device are much less than the injury benefits of the device), and the estimated net benefit is significantly greater than 0% (i.e., significant benefit exists). May be a reasonable device assuming acceptable functional characteristics.

L-31
Table L-9. Analysis Results for Quadbar ATV with Unhelmeted Rider versus Baseline ATV with Full Face Helmeted Rider, for “All” ATV Overturn Types
Measure Risk/Benefit Net BenefitPercentHarmful
PercentBeneficial
PercentNo Difference
Average Risk/Harmful Case
Average Benefit/Beneficial Case
ICnorm 483% [ 250% , 774% ] -111% [-151% , -71% ] 69.1 18.0 13.0 0.2 0.2
ICnorm,head 998% [ 386% , 1654% ] -191% [-251% , -131% ] 78.2 9.5 12.3 0.2 0.1
ICnorm,face Risk>0 and Benefit=0 UD 31.2 0.0 68.8 0.0 UD
ICnorm,neck 462% [ 162% , 769% ] -208% [-326% , -90% ] 28.0 8.9 63.1 0.1 0.0
ICnorm,chest 198% [ 63%, 485%] -92% [-285%, 101%] 6.0 5.1 88.9 0.0 0.0
ICnorm,abdomen 79% [ 53%, 119%] 8% [-6%, 22%] 2.3 3.4 94.3 0.0 0.0
ICnorm,femurs 59% [ 35%, 128%] 34% [-23%, 91%] 2.8 4.5 92.7 0.2 0.2
ICnorm,knees 52% [ 33%, 104%] 34% [-2%, 70%] 4.4 8.5 87.2 0.1 0.1
ICnorm,tibias 58% [ 32%, 142%] 36% [-35%, 107%] 1.0 1.8 97.2 0.1 0.1
Probability of Fatality 721% [ 273% , 1172% ] -209% [-284% , -134% ] 59.4 13.7 26.9 0.2 0.1
MAIS=6 957% [ 174% , 1494% ] -545% [-844% , -246% ] 9.8 1.0 89.2 1.0 1.0
HAIS=6 6300% [ 202% , 9927% ] -1240% [-1874% , -606% ] 9.2 0.1 90.7 1.0 1.0
NAIS=6 700% [ 99%, 1319%] -600% [-1208%, 8%] 1.0 0.1 98.8 1.0 1.0
CAIS=6 Risk=0 and Benefit=0 UD 0.0 0.0 100.0 UD UD
AsphyxiaAIS=6 60% [ 23%, 216%] 40% [-115%, 195%] 0.4 0.7 98.8 1.0 1.0
UD Denotes undefined value, i.e., the value of the denominator is zero.
Estimated risk/benefit percentage significantly more than 100%) p-value less than or equal to 0.05 and the injury risks of the device are greater than injury benefits of the device), and the estimated net benefit significantly less than 0% (i.e., significant disbenefit exists). Device causes significantly more injuries than it prevents.
Estimated risk/benefit percentage not significantly different from 100% (p-value is greater than 0.05, the injury risks of the device are effectively equal to injury benefits of the device), and the estimated net benefit percentage not significantly different from 0% (within 95% confidence interval). Injury risks of the device are effectively equal to injury benefits of the device.
Estimated risk/benefit percentage is significantly less than 100% (p-value less than or equal to 0.05 and the injury risks of the device are much less than the injury benefits of the device), and the estimated net benefit is significantly greater than 0% (i.e., significant benefit exists). May be a reasonable device assuming acceptable functional characteristics.

L-32
Section L-B SUPPLEMENTAL RISK/BENEFIT RESULTS FOR
“LOW SPEED” ATV OVERTURN TYPES (304 SIMLATIONS)
In order to determine the effectiveness of the Quadbar in “low speed” ATV overturns, rather than the full range of speeds discussed in Section L-II of this appendix, the subset of cases with an initial speed less than 20 km/h was analyzed, and the risk/benefit, net benefit, percent harmful, percent beneficial, percent no difference, average risk per harmful case, and average benefit per beneficial case were calculated for overall injury costs (i.e., ICnorm) as well as incremental normalized injury cost for each body region, probability of fatality, and asphyxiation potential. For the Quadbar ATV with a full face helmeted rider compared to a baseline ATV with a full face helmeted rider, there were approximately 300 cases that met this speed criterion and in which both the Quadbar and baseline ATVs overturned, compared to 687 cases for this comparison discussed in Section L-A of this appendix.
Tables L-10 through L-14 below correspond to the tables in Section L-A of this appendix, except that they are for the N=304 “low speed” ATV overturn types. The helmet conditions are:
− Unhelmeted Quadbar ATV versus Unhelmeted Baseline ATV (Table L-10)
− Half helmet Quadbar ATV versus Half helmet Baseline ATV (Table L-11)
− Full face helmet Quadbar ATV versus Full face helmet Baseline ATV (Table L-12)
− Unhelmeted Quadbar ATV versus Half helmet Baseline ATV (Table L-13)89
− Unhelmeted Quadbar ATV versus Full face helmet Baseline ATV (Table L-14)25
89 This condition is relevant in the event that riders may mistakenly believe they can remove their helmet if a Quadbar is fitted.
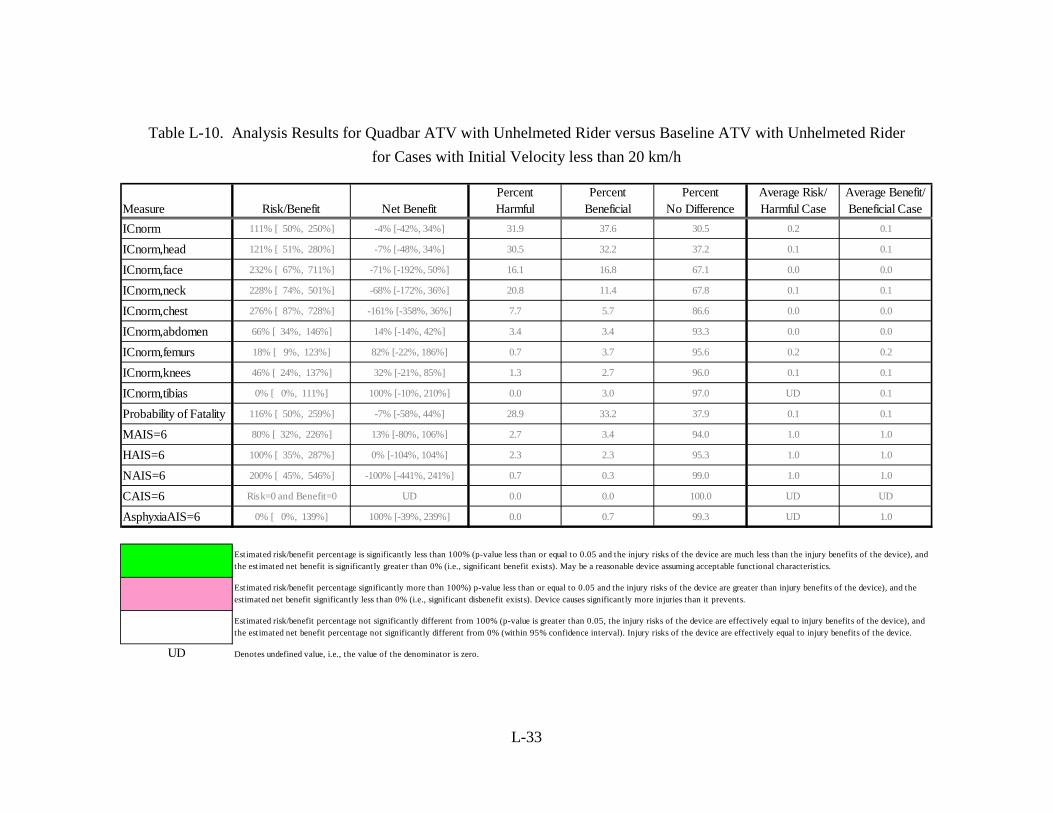
L-33
Table L-10. Analysis Results for Quadbar ATV with Unhelmeted Rider versus Baseline ATV with Unhelmeted Rider for Cases with Initial Velocity less than 20 km/h
Measure Risk/Benefit Net BenefitPercentHarmful
PercentBeneficial
PercentNo Difference
Average Risk/Harmful Case
Average Benefit/Beneficial Case
ICnorm 111% [ 50%, 250%] -4% [-42%, 34%] 31.9 37.6 30.5 0.2 0.1
ICnorm,head 121% [ 51%, 280%] -7% [-48%, 34%] 30.5 32.2 37.2 0.1 0.1
ICnorm,face 232% [ 67%, 711%] -71% [-192%, 50%] 16.1 16.8 67.1 0.0 0.0
ICnorm,neck 228% [ 74%, 501%] -68% [-172%, 36%] 20.8 11.4 67.8 0.1 0.1
ICnorm,chest 276% [ 87%, 728%] -161% [-358%, 36%] 7.7 5.7 86.6 0.0 0.0
ICnorm,abdomen 66% [ 34%, 146%] 14% [-14%, 42%] 3.4 3.4 93.3 0.0 0.0
ICnorm,femurs 18% [ 9%, 123%] 82% [-22%, 186%] 0.7 3.7 95.6 0.2 0.2
ICnorm,knees 46% [ 24%, 137%] 32% [-21%, 85%] 1.3 2.7 96.0 0.1 0.1
ICnorm,tibias 0% [ 0%, 111%] 100% [-10%, 210%] 0.0 3.0 97.0 UD 0.1
Probability of Fatality 116% [ 50%, 259%] -7% [-58%, 44%] 28.9 33.2 37.9 0.1 0.1
MAIS=6 80% [ 32%, 226%] 13% [-80%, 106%] 2.7 3.4 94.0 1.0 1.0
HAIS=6 100% [ 35%, 287%] 0% [-104%, 104%] 2.3 2.3 95.3 1.0 1.0
NAIS=6 200% [ 45%, 546%] -100% [-441%, 241%] 0.7 0.3 99.0 1.0 1.0
CAIS=6 Risk=0 and Benefit=0 UD 0.0 0.0 100.0 UD UD
AsphyxiaAIS=6 0% [ 0%, 139%] 100% [-39%, 239%] 0.0 0.7 99.3 UD 1.0
UD Denotes undefined value, i.e., the value of the denominator is zero.
Estimated risk/benefit percentage significantly more than 100%) p-value less than or equal to 0.05 and the injury risks of the device are greater than injury benefits of the device), and the estimated net benefit significantly less than 0% (i.e., significant disbenefit exists). Device causes significantly more injuries than it prevents.
Estimated risk/benefit percentage not significantly different from 100% (p-value is greater than 0.05, the injury risks of the device are effectively equal to injury benefits of the device), and the estimated net benefit percentage not significantly different from 0% (within 95% confidence interval). Injury risks of the device are effectively equal to injury benefits of the device.
Estimated risk/benefit percentage is significantly less than 100% (p-value less than or equal to 0.05 and the injury risks of the device are much less than the injury benefits of the device), and the estimated net benefit is significantly greater than 0% (i.e., significant benefit exists). May be a reasonable device assuming acceptable functional characteristics.

L-34
Table L-11. Analysis Results for Quadbar ATV with Half Helmeted Rider versus Baseline ATV with Half Helmeted Rider for Cases with Initial Velocity less than 20 km/h
Measure Risk/Benefit Net BenefitPercentHarmful
PercentBeneficial
PercentNo Difference
Average Risk/Harmful Case
Average Benefit/Beneficial Case
ICnorm 205% [ 81%, 501%] -40% [-95%, 15%] 29.9 35.2 34.9 0.2 0.1
ICnorm,head 133% [ 53%, 323%] -12% [-59%, 35%] 21.5 26.2 52.3 0.1 0.0
ICnorm,face 215% [ 64%, 663%] -56% [-164%, 52%] 9.1 13.4 77.5 0.0 0.0
ICnorm,neck 1550% [ 101% , 8975% ] -297% [-592% , -2% ] 16.8 11.4 71.8 0.2 0.0
ICnorm,chest 272% [ 88%, 584%] -147% [-323%, 29%] 7.7 3.7 88.6 0.0 0.0
ICnorm,abdomen 102% [ 49%, 240%] -1% [-38%, 36%] 5.4 2.7 91.9 0.0 0.0
ICnorm,femurs 40% [ 14%, 215%] 60% [-111%, 231%] 0.7 1.7 97.7 0.2 0.2
ICnorm,knees 25% [ 13%, 106%] 54% [-4%, 112%] 1.7 6.4 91.9 0.1 0.1
ICnorm,tibias Risk>0 and Benefit=0 UD 0.3 0.0 99.7 0.1 UD
Probability of Fatality 249% [ 81%, 600%] -68% [-159%, 23%] 25.2 26.5 48.3 0.1 0.0
MAIS=6 367% [ 77%, 766%] -267% [-641%, 107%] 3.7 1.0 95.3 1.0 1.0
HAIS=6 100% [ 26%, 381%] 0% [-279%, 279%] 0.3 0.3 99.3 1.0 1.0
NAIS=6 Risk>0 and Benefit=0 UD 2.0 0.0 98.0 1.0 UD
CAIS=6 Risk=0 and Benefit=0 UD 0.0 0.0 100.0 UD UD
AsphyxiaAIS=6 250% [ 69%, 518%] -150% [-410%, 110%] 1.7 0.7 97.7 1.0 1.0
UD Denotes undefined value, i.e., the value of the denominator is zero.
Estimated risk/benefit percentage significantly more than 100%) p-value less than or equal to 0.05 and the injury risks of the device are greater than injury benefits of the device), and the estimated net benefit significantly less than 0% (i.e., significant disbenefit exists). Device causes significantly more injuries than it prevents.
Estimated risk/benefit percentage not significantly different from 100% (p-value is greater than 0.05, the injury risks of the device are effectively equal to injury benefits of the device), and the estimated net benefit percentage not significantly different from 0% (within 95% confidence interval). Injury risks of the device are effectively equal to injury benefits of the device.
Estimated risk/benefit percentage is significantly less than 100% (p-value less than or equal to 0.05 and the injury risks of the device are much less than the injury benefits of the device), and the estimated net benefit is significantly greater than 0% (i.e., significant benefit exists). May be a reasonable device assuming acceptable functional characteristics.

L-35
Table L-12. Analysis Results for Quadbar ATV with Full Face Helmeted Rider versus Baseline ATV with Full Face Helmeted Rider for Cases with Initial Velocity less than 20 km/h
Measure Risk/Benefit Net BenefitPercentHarmful
PercentBeneficial
PercentNo Difference
Average Risk/Harmful Case
Average Benefit/Beneficial Case
ICnorm 106% [ 48%, 244%] -3% [-58%, 52%] 22.7 32.0 45.3 0.1 0.1
ICnorm,head 63% [ 32%, 148%] 15% [-16%, 46%] 11.0 20.3 68.7 0.0 0.0
ICnorm,face Risk=0 and Benefit=0 UD 0.0 0.0 100.0 UD UD
ICnorm,neck 831% [ 90%, 2693%] -285% [-600%, 30%] 16.7 7.0 76.3 0.1 0.0
ICnorm,chest 191% [ 64%, 454%] -77% [-234%, 80%] 6.3 4.3 89.3 0.0 0.0
ICnorm,abdomen 73% [ 43%, 137%] 12% [-12%, 36%] 3.3 5.0 91.7 0.0 0.0
ICnorm,femurs 351% [ 85%, 685%] -251% [-561%, 59%] 3.7 1.3 95.0 0.2 0.2
ICnorm,knees 42% [ 20%, 149%] 45% [-35%, 125%] 3.0 6.7 90.3 0.1 0.1
ICnorm,tibias 0% [ 0% , 96% ] 100% [4% , 196% ] 0.0 2.3 97.7 UD 0.1
Probability of Fatality 96% [ 37%, 255%] 2% [-77%, 81%] 21.0 23.0 56.0 0.1 0.0
MAIS=6 100% [ 33%, 302%] 0% [-197%, 197%] 1.3 1.3 97.3 1.0 1.0
HAIS=6 Risk=0 and Benefit=0 UD 0.0 0.0 100.0 UD UD
NAIS=6 Risk>0 and Benefit=0 UD 1.0 0.0 99.0 1.0 UD
CAIS=6 Risk=0 and Benefit=0 UD 0.0 0.0 100.0 UD UD
AsphyxiaAIS=6 25% [ 9%, 189%] 75% [-87%, 237%] 0.3 1.3 98.3 1.0 1.0
UD Denotes undefined value, i.e., the value of the denominator is zero.
Estimated risk/benefit percentage significantly more than 100%) p-value less than or equal to 0.05 and the injury risks of the device are greater than injury benefits of the device), and the estimated net benefit significantly less than 0% (i.e., significant disbenefit exists). Device causes significantly more injuries than it prevents.
Estimated risk/benefit percentage not significantly different from 100% (p-value is greater than 0.05, the injury risks of the device are effectively equal to injury benefits of the device), and the estimated net benefit percentage not significantly different from 0% (within 95% confidence interval). Injury risks of the device are effectively equal to injury benefits of the device.
Estimated risk/benefit percentage is significantly less than 100% (p-value less than or equal to 0.05 and the injury risks of the device are much less than the injury benefits of the device), and the estimated net benefit is significantly greater than 0% (i.e., significant benefit exists). May be a reasonable device assuming acceptable functional characteristics.

L-36
Table L-13. Analysis Results for Quadbar ATV with Unhelmeted Rider versus Baseline ATV with Half Helmeted Rider for Cases with Initial Velocity less than 20 km/h
Measure Risk/Benefit Net BenefitPercentHarmful
PercentBeneficial
PercentNo Difference
Average Risk/Harmful Case
Average Benefit/Beneficial Case
ICnorm 364% [ 140% , 724% ] -73% [-124% , -22% ] 71.1 20.1 8.7 0.1 0.1
ICnorm,head 798% [ 194% , 1553% ] -133% [-211% , -55% ] 76.8 8.1 15.1 0.1 0.1
ICnorm,face 520% [ 99%, 1578%] -173% [-347%, 1%] 22.1 8.7 69.1 0.0 0.0
ICnorm,neck 901% [ 138% , 2922% ] -213% [-368% , -58% ] 19.8 10.7 69.5 0.1 0.0
ICnorm,chest 349% [ 87%, 864%] -226% [-494%, 42%] 7.7 4.0 88.3 0.0 0.0
ICnorm,abdomen 68% [ 35%, 153%] 14% [-16%, 44%] 3.4 3.0 93.6 0.0 0.0
ICnorm,femurs 40% [ 14%, 215%] 60% [-112%, 232%] 0.7 1.7 97.7 0.2 0.2
ICnorm,knees 14% [ 8% , 76% ] 65% [18% , 112% ] 1.0 6.7 92.3 0.1 0.1
ICnorm,tibias Risk=0 and Benefit=0 UD 0.0 0.0 100.0 UD UD
Probability of Fatality 469% [ 130% , 911% ] -133% [-235% , -31% ] 53.4 14.8 31.9 0.1 0.1
MAIS=6 433% [ 72%, 971%] -333% [-827%, 161%] 4.4 1.0 94.6 1.0 1.0
HAIS=6 1200% [ 79%, 2736%] -1100% [-2511%, 311%] 4.0 0.3 95.6 1.0 1.0
NAIS=6 Risk>0 and Benefit=0 UD 0.7 0.0 99.3 1.0 UD
CAIS=6 Risk=0 and Benefit=0 UD 0.0 0.0 100.0 UD UD
AsphyxiaAIS=6 0% [ 0%, 139%] 100% [-39%, 239%] 0.0 0.7 99.3 UD 1.0
UD Denotes undefined value, i.e., the value of the denominator is zero.
Estimated risk/benefit percentage significantly more than 100%) p-value less than or equal to 0.05 and the injury risks of the device are greater than injury benefits of the device), and the estimated net benefit significantly less than 0% (i.e., significant disbenefit exists). Device causes significantly more injuries than it prevents.
Estimated risk/benefit percentage not significantly different from 100% (p-value is greater than 0.05, the injury risks of the device are effectively equal to injury benefits of the device), and the estimated net benefit percentage not significantly different from 0% (within 95% confidence interval). Injury risks of the device are effectively equal to injury benefits of the device.
Estimated risk/benefit percentage is significantly less than 100% (p-value less than or equal to 0.05 and the injury risks of the device are much less than the injury benefits of the device), and the estimated net benefit is significantly greater than 0% (i.e., significant benefit exists). May be a reasonable device assuming acceptable functional characteristics.

L-37
Table L-14. Analysis Results for Quadbar ATV with Unhelmeted Rider versus Baseline ATV with Full Face Helmeted Rider for Cases with Initial Velocity less than 20 km/h
Measure Risk/Benefit Net BenefitPercentHarmful
PercentBeneficial
PercentNo Difference
Average Risk/Harmful Case
Average Benefit/Beneficial Case
ICnorm 401% [ 140% , 793% ] -119% [-204% , -34% ] 74.6 13.4 12.0 0.1 0.2
ICnorm,head 1611% [ 254% , 3492% ] -257% [-390% , -124% ] 81.9 4.7 13.4 0.1 0.1
ICnorm,face Risk>0 and Benefit=0 UD 28.4 0.0 71.6 0.0 UD
ICnorm,neck 1097% [ 131% , 3182% ] -432% [-769% , -95% ] 24.7 7.0 68.2 0.1 0.0
ICnorm,chest 218% [ 73%, 503%] -106% [-278%, 66%] 7.7 5.4 87.0 0.0 0.0
ICnorm,abdomen 62% [ 33%, 128%] 16% [-9%, 41%] 3.3 3.0 93.6 0.0 0.0
ICnorm,femurs 50% [ 21%, 190%] 50% [-88%, 188%] 0.7 1.3 98.0 0.2 0.2
ICnorm,knees 16% [ 8%, 105%] 62% [-4%, 128%] 1.0 6.0 93.0 0.1 0.1
ICnorm,tibias 0% [ 0% , 96% ] 100% [4% , 196% ] 0.0 2.3 97.7 UD 0.1
Probability of Fatality 513% [ 131% , 993% ] -201% [-355% , -47% ] 57.9 11.0 31.1 0.1 0.1
MAIS=6 325% [ 64%, 756%] -225% [-621%, 171%] 4.3 1.3 94.3 1.0 1.0
HAIS=6 Risk>0 and Benefit=0 UD 4.0 0.0 96.0 1.0 UD
NAIS=6 Risk>0 and Benefit=0 UD 0.7 0.0 99.3 1.0 UD
CAIS=6 Risk=0 and Benefit=0 UD 0.0 0.0 100.0 UD UD
AsphyxiaAIS=6 0% [ 0%, 154%] 100% [-53%, 253%] 0.0 1.3 98.7 UD 1.0
UD Denotes undefined value, i.e., the value of the denominator is zero.
Estimated risk/benefit percentage significantly more than 100%) p-value less than or equal to 0.05 and the injury risks of the device are greater than injury benefits of the device), and the estimated net benefit significantly less than 0% (i.e., significant disbenefit exists). Device causes significantly more injuries than it prevents.
Estimated risk/benefit percentage not significantly different from 100% (p-value is greater than 0.05, the injury risks of the device are effectively equal to injury benefits of the device), and the estimated net benefit percentage not significantly different from 0% (within 95% confidence interval). Injury risks of the device are effectively equal to injury benefits of the device.
Estimated risk/benefit percentage is significantly less than 100% (p-value less than or equal to 0.05 and the injury risks of the device are much less than the injury benefits of the device), and the estimated net benefit is significantly greater than 0% (i.e., significant benefit exists). May be a reasonable device assuming acceptable functional characteristics.