updated - philippine statistics authority | republic of the … crs of... · · 2016-08-05pili...
TRANSCRIPT

Updated
Republic of the Philippines
Philippine Statistics Authority


ii
TITLE PAGE
Foreword i
Table of Contents ii
List of Figures iii
List of Tables iv
Assumptions and Procedures Used in Updating the
Cost of Production for Other Crops v
Assumptions and Procedures Used in Updating the
Cost of Production for Milkfishvii
Summary of Findings 1
FRUITS 1
Calamansi 1
Durian 1
Mango 2
Papaya 2
Pineapple 3
Watermelon 3
NUTS 4
Cashew 4
Pili 4
ROOT CROPS 5
Cassava 5
Sweet Potato 5
BULBS 6
Onion (Bulb) 6
Onion (Multiplier) 6
Garlic 7
VEGETABLES 7
Ampalaya 7
Cabbage 8
Carrot 8
Cauliflower 9
Eggplant 9
Habitchuelas 10
Potato 10
Stringbeans 11
Tomato 11
LEGUMES 12
Mongo 12
Peanut 12
COMMERCIAL CROP 13
Coffee 13
FISHERIES 13
Milkfish 13
Tilapia 14
TABLE OF CONTENTS

iii
FIGURE NO. TITLE PAGE
1Returns on Investment of Selected Fruits, Philippines,
2014 - 201518
2Returns on Investment of Selected Nuts, Philippines,
2014 - 201526
3Returns on Investment of Selected Root Crops,
Philippines, 2014 - 201530
4Returns on Investment of Selected Bulbs, Philippines,
2014 - 201534
5Returns on Investment of Selected Vegetables,
Philippines, 2014 - 201539
6Returns on Investment of Selected Legumes,
Philippines, 2014 - 201550
7Returns on Investment of Selected Commercial Crop,
Philippines, 2014 - 201554
8Returns on Investment of Selected Fisheries,
Philippines, 2014 - 201557
LIST OF FIGURES

iv
TABLE NO. TITLE PAGE
1Summary of Costs of Production, Selected
Commodities, Philippines, 201516
2Calamansi: Updated Average Costs of Production,
Philippines, 2013 - 201519
3Durian: Updated Average Costs of Production,
Philippines, 2013 - 201520
4Mango: Updated Average Costs of Production,
Philippines, 2013 - 201521
5Papaya: Updated Average Costs of Production,
Philippines, 2013 - 201522
6Pineapple: Updated Average Costs of Production,
Philippines, 2013 - 201523
7Watermelon: Updated Average Costs of Production,
Philippines, 2013 - 201524
8Cashew Nuts: Updated Average Costs of Production,
Philippines, 2013 - 201527
9Pili Nuts: Updated Average Costs of Production,
Philippines, 2013 - 201528
10Cassava: Updated Average Costs of Production,
Philippines, 2013 - 201531
11Sweet Potato: Updated Average Costs of Production,
Philippines, 2013 - 201532
12Onion (Red): Updated Average Costs of Production,
Philippines, 2013 - 201535
13Onion (Multiplier): Updated Average Costs of
Production, Philippines, 2013 - 201536
14Garlic: Updated Average Costs of Production,
Philippines, 2013 - 201537
15Ampalaya: Updated Average Costs of Production,
Philippines, 2013 - 201540
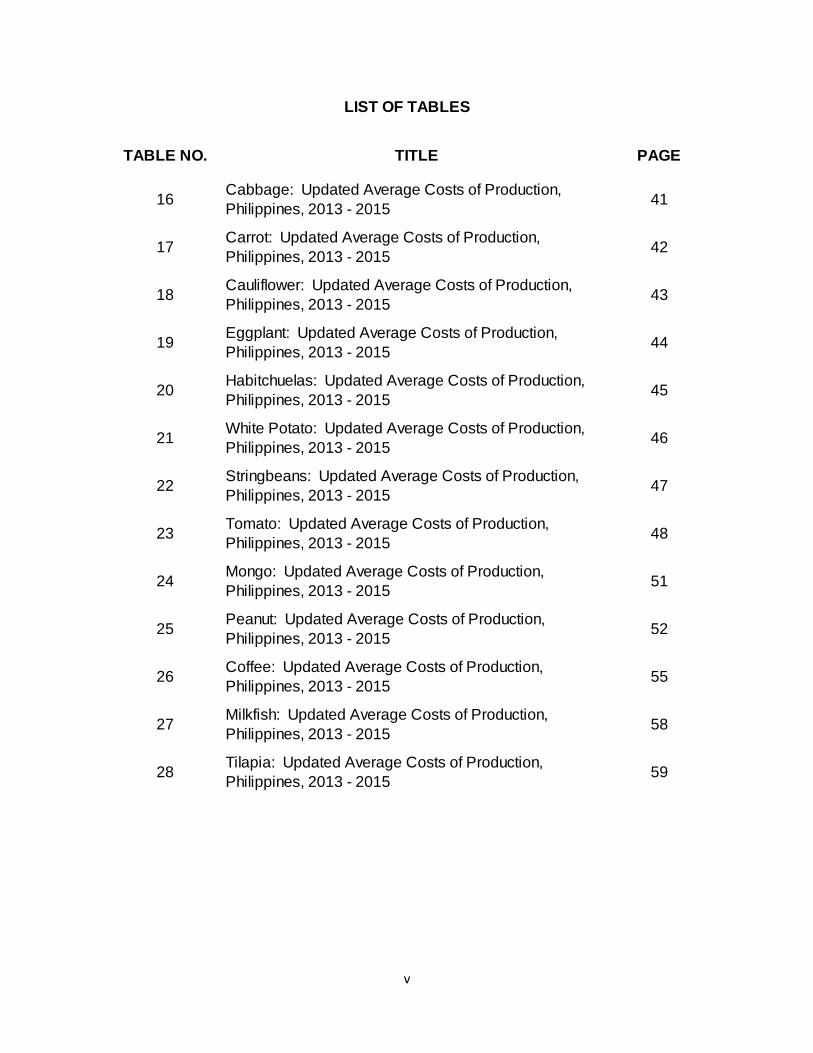
LIST OF TABLES
v
TABLE NO. TITLE PAGE
16Cabbage: Updated Average Costs of Production,
Philippines, 2013 - 201541
17Carrot: Updated Average Costs of Production,
Philippines, 2013 - 201542
18Cauliflower: Updated Average Costs of Production,
Philippines, 2013 - 201543
19Eggplant: Updated Average Costs of Production,
Philippines, 2013 - 201544
20Habitchuelas: Updated Average Costs of Production,
Philippines, 2013 - 201545
21White Potato: Updated Average Costs of Production,
Philippines, 2013 - 201546
22Stringbeans: Updated Average Costs of Production,
Philippines, 2013 - 201547
23Tomato: Updated Average Costs of Production,
Philippines, 2013 - 201548
24Mongo: Updated Average Costs of Production,
Philippines, 2013 - 201551
25Peanut: Updated Average Costs of Production,
Philippines, 2013 - 201552
26Coffee: Updated Average Costs of Production,
Philippines, 2013 - 201555
27Milkfish: Updated Average Costs of Production,
Philippines, 2013 - 201558
28Tilapia: Updated Average Costs of Production,
Philippines, 2013 - 201559
LIST OF TABLES

vi
ITEM BASIS/PROCEDURE
1. Stocking materials (fry, fingerlings) - movement of farmgate prices
(Cash, Non-cash and Imputed)
2. Fertilizer
Organic - movement of the retail prices of all fertilizer
Inorganic -quantity used from the survey results multiplied by the
current retail price of fertilizer by grade
3. Feeds - movement of CPI for all items
4. Pesticides, other chemicals, other inputs - movement of the retail prices for all types of pesticides
5. Land tax - 1% per annum
6. Rental: Land - movement of farmgate prices
Machine, tools and equipment
7. Labor cost (hired, unpaid operator, family and
exchange labormovement of agricultural wage rates
8. Fuel and oil - movement of CPI for fuel and oil
9. Transport cost of inputs - movement of CPI for transport
10. Irrigation fee - movement of farmgate prices
11. License/permit - movement of Fishpond Lease Agreement (FLA) rates
12. Interest payment on crop loans - increase of 10.0 percent per annum
13. Electricity - movement of CPI for light
14. Food expense - movement of CPI for food
15. Repairs - movement of CPI for minor repairs
16. Other expense (containers, etc) - movement of CPI for all items
17. Other laborer's share - movement of agricultural wage rates
18. Landlord's share - movement of farmgate prices
19. Harvester's share - movement of gross value of yield
20. Lease rental - movement of farmgate prices
21. Depreciation - increase of 10.0 percent per annum
22. Interest on operating capital - based on Average Lending Rates from BSP
23. Rental value of owned land - movement of farmgate prices
ASSUMPTIONS AND PROCEDURES USED IN UPDATING
THE COSTS OF PRODUCTION FOR MILKFISH

vii
ITEM BASIS/PROCEDURE
1. Cost of seeds/planting materials
(Cash, Non-cash and Imputed)
2. Irrigation fee
3. Lease rental movement of the farmgate price
4. Rental value of owned land
5. Landlord's share
6. Harvester/thresher/sheller's share - movement of the gross value of yield
7. Cost of fertilizer -quantity used from the survey results multiplied by the
current retail price of fertilizer by grade
8. Cost of pesticides
Solid - movement of the retail price for selected pesticides
Liquid -quantity used from the survey results multiplied by the
current retail price of pesticides
9. Soil ameliorants - movement of the retail price of fertilizer
10. Cost of mulching materials - movement of the retail price of fertilizer
11. Labor costs (hired, unpaid operator, family and
exchange labor-
number of mandays from the survey results multiplied by
the current agricultural wage rates
12. Rentals (tools, equipment, machine and animals) - movement of agricultural wage rates
13. Food cost - movement of CPI for food
14. Transport cost - movement of CPI for transport
15. Fuel and oil - movement of CPI for fuel and oil
16. Repair cost - movement of CPI for minor repairs
17. Electricity cost - movement of CPI for light
18. Interest on crop loans - increase of 10.0 percent per annum
19. Other production costs - movement of CPI for all items
20. Depreciation cost - increase of 10.0 percent per annum
21. Interest on operating capital - based on Average Lending Rates from BSP
22. Land tax - increase of 1.0 percent per annum
ASSUMPTIONS AND PROCEDURES USED IN UPDATING
THE COSTS OF PRODUCTION FOR OTHER CROPS

1
SUMMARY OF FINDINGS
FRUITS CALAMANSI
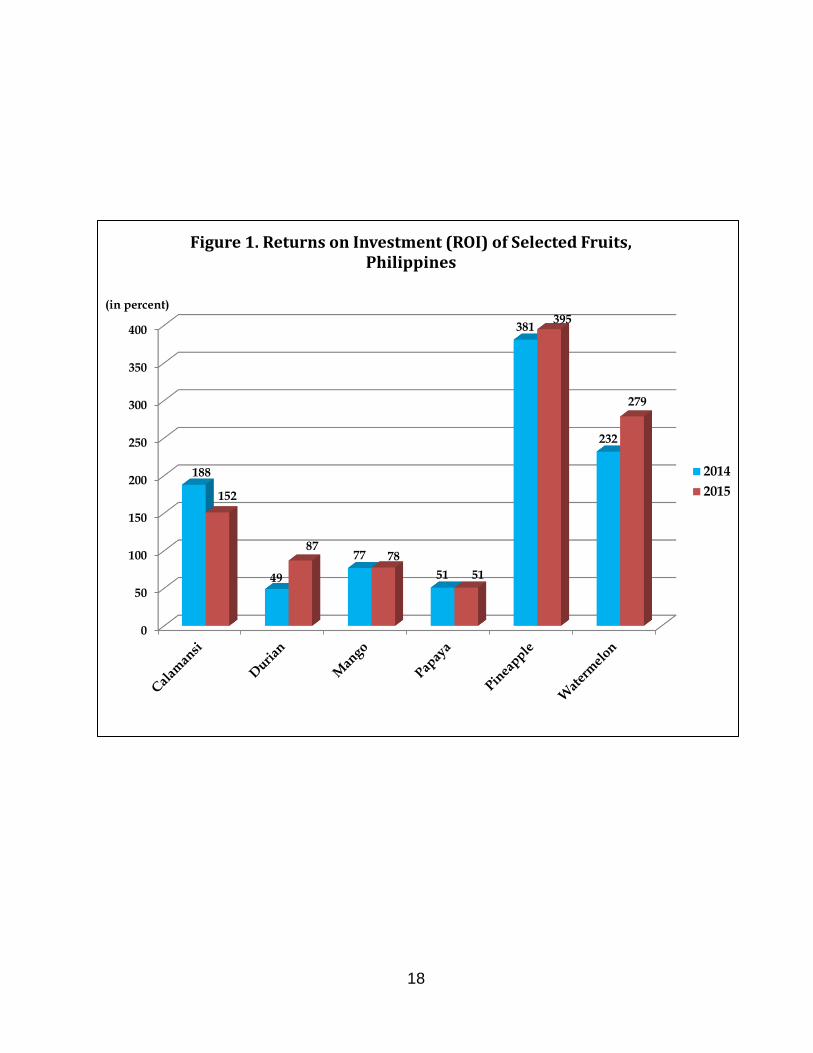
In 2015, production cost of calamansi averaged P59,630 per hectare. Average yield per hectare was 8,137 kilograms valued at P149,802.
Returns above cash costs amounted to P108,425 per hectare. Returns above cash and non-cash costs figured to P107,187 per hectare in 2015.
Calamansi production during the reference period netted P90,172 per hectare.
Cost per kilogram averaged P7.33 while farmgate price per kilogram settled at P18.41.
Calamansi producer earned P1.51 for every peso of investment during the reference year.
DURIAN
Durian production entailed an average cost of P84,721 per hectare in 2015. Yield per hectare of 5,257 kilograms generated gross receipts at P158,341.
Returns after deducting cash costs amounted to P135,167 per hectare. After both cash and non-cash costs were accounted for, returns averaged P89,496 per hectare. After subtracting all costs, net returns settled at P73,620 per hectare.
On a per kilogram basis, costs averaged P16.12 and the farmer’s selling price was P30.12 in 2015.
Net profit-cost ratio stood at 0.87 in 2015.
2
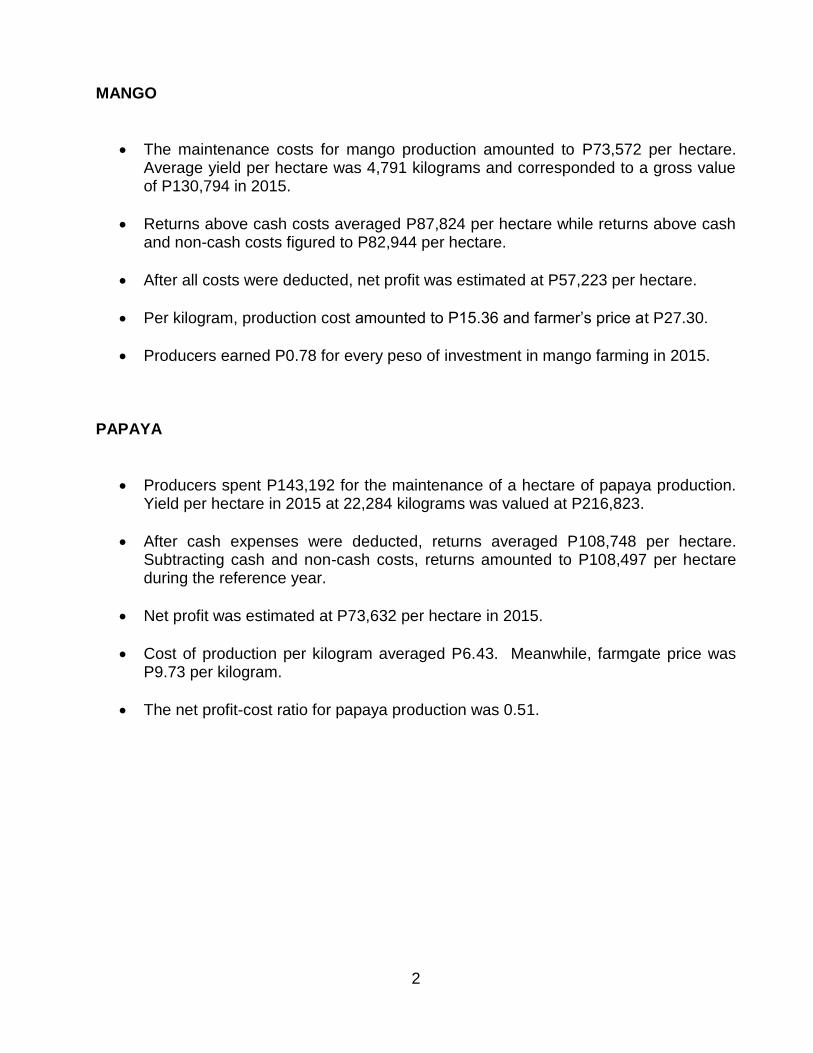
MANGO
The maintenance costs for mango production amounted to P73,572 per hectare. Average yield per hectare was 4,791 kilograms and corresponded to a gross value of P130,794 in 2015.
Returns above cash costs averaged P87,824 per hectare while returns above cash and non-cash costs figured to P82,944 per hectare.
After all costs were deducted, net profit was estimated at P57,223 per hectare.
Per kilogram, production cost amounted to P15.36 and farmer’s price at P27.30.
Producers earned P0.78 for every peso of investment in mango farming in 2015. PAPAYA
Producers spent P143,192 for the maintenance of a hectare of papaya production. Yield per hectare in 2015 at 22,284 kilograms was valued at P216,823.
After cash expenses were deducted, returns averaged P108,748 per hectare. Subtracting cash and non-cash costs, returns amounted to P108,497 per hectare during the reference year.
Net profit was estimated at P73,632 per hectare in 2015.
Cost of production per kilogram averaged P6.43. Meanwhile, farmgate price was P9.73 per kilogram.
The net profit-cost ratio for papaya production was 0.51.

3
PINEAPPLE
The cost of producing a hectare of pineapple averaged P67,318 in 2015. Yield per
hectare at 41,118 kilograms amounted to P333,467.
Returns after cash costs amounted to P272,266 per hectare. After all cash and
non-cash costs were deducted, returns reached P271,382 per hectare.
Net of all costs, profit averaged P266,149 per hectare during the reference year.
Per kilogram, production cost was P1.64 while farmgate price was P8.11.
Producers gained P3.95 for every peso invested in pineapple production.
WATERMELON
Production of watermelon incurred an average cost of P62,622 per hectare in 2015. At a yield of 20,122 kilograms per hectare, gross earnings amounted to P237,238 during the year in review.
Per hectare, returns above cash costs stood at P195,417 and returns over the combined cash and non-cash costs figured to P194,882.
Net returns settled at P174,616 in 2015.
The cost of producing per kilogram of watermelon was P3.11. Price received by farmers averaged P11.79 per kilogram.
For every peso invested in watermelon production, growers earned P2.79.
4
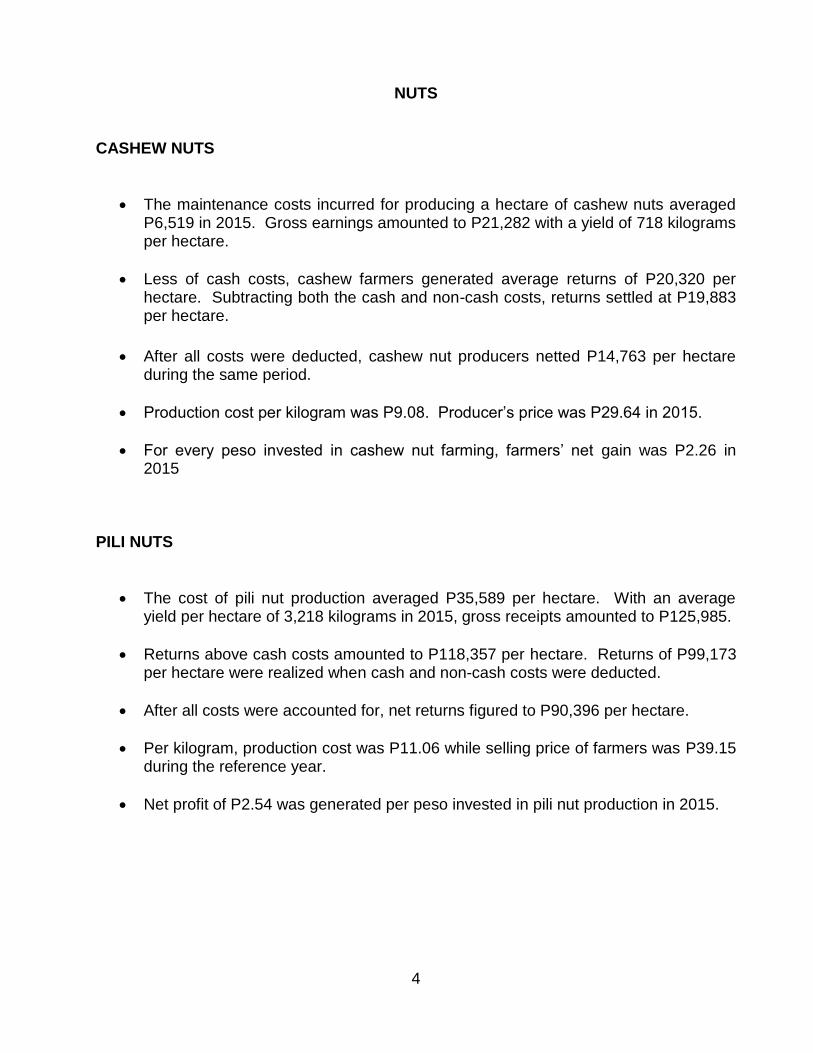
NUTS
CASHEW NUTS
The maintenance costs incurred for producing a hectare of cashew nuts averaged P6,519 in 2015. Gross earnings amounted to P21,282 with a yield of 718 kilograms per hectare.
Less of cash costs, cashew farmers generated average returns of P20,320 per hectare. Subtracting both the cash and non-cash costs, returns settled at P19,883 per hectare.
After all costs were deducted, cashew nut producers netted P14,763 per hectare during the same period.
Production cost per kilogram was P9.08. Producer’s price was P29.64 in 2015.
For every peso invested in cashew nut farming, farmers’ net gain was P2.26 in 2015
PILI NUTS
The cost of pili nut production averaged P35,589 per hectare. With an average yield per hectare of 3,218 kilograms in 2015, gross receipts amounted to P125,985.
Returns above cash costs amounted to P118,357 per hectare. Returns of P99,173 per hectare were realized when cash and non-cash costs were deducted.
After all costs were accounted for, net returns figured to P90,396 per hectare.
Per kilogram, production cost was P11.06 while selling price of farmers was P39.15 during the reference year.
Net profit of P2.54 was generated per peso invested in pili nut production in 2015.
5
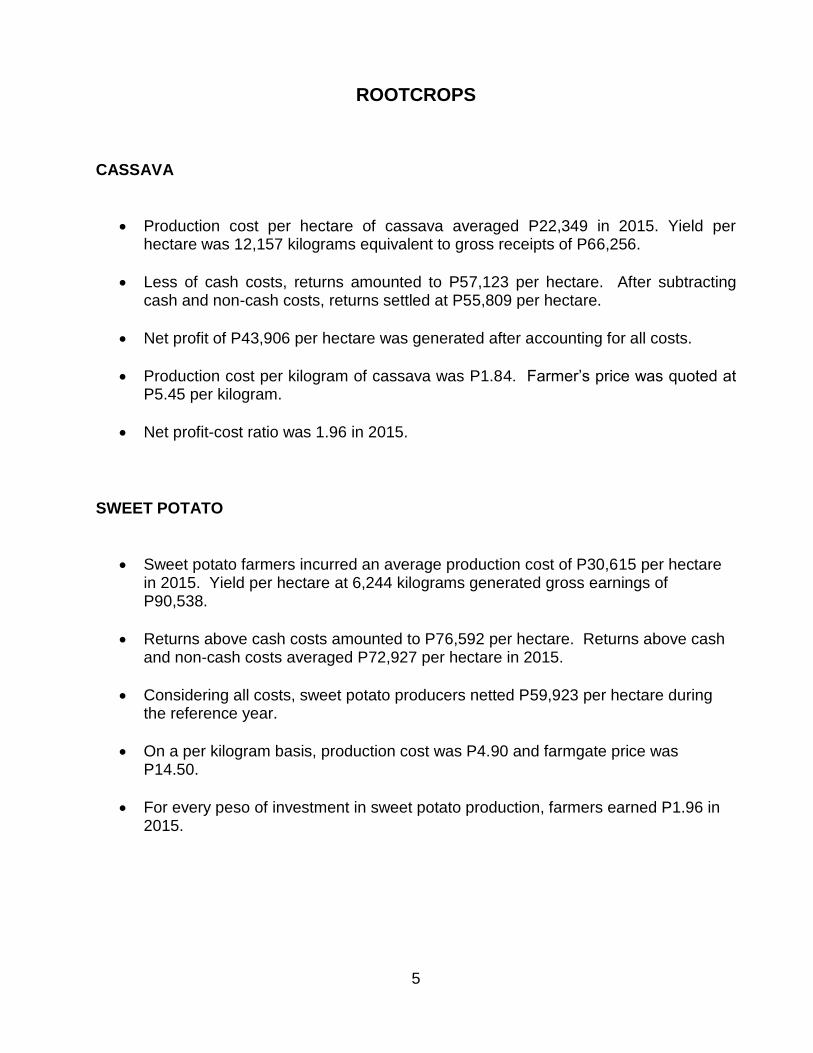
ROOTCROPS CASSAVA
Production cost per hectare of cassava averaged P22,349 in 2015. Yield per hectare was 12,157 kilograms equivalent to gross receipts of P66,256.
Less of cash costs, returns amounted to P57,123 per hectare. After subtracting cash and non-cash costs, returns settled at P55,809 per hectare.
Net profit of P43,906 per hectare was generated after accounting for all costs.
Production cost per kilogram of cassava was P1.84. Farmer’s price was quoted at P5.45 per kilogram.
Net profit-cost ratio was 1.96 in 2015.
SWEET POTATO
Sweet potato farmers incurred an average production cost of P30,615 per hectare in 2015. Yield per hectare at 6,244 kilograms generated gross earnings of P90,538.
Returns above cash costs amounted to P76,592 per hectare. Returns above cash and non-cash costs averaged P72,927 per hectare in 2015.
Considering all costs, sweet potato producers netted P59,923 per hectare during the reference year.
On a per kilogram basis, production cost was P4.90 and farmgate price was P14.50.
For every peso of investment in sweet potato production, farmers earned P1.96 in 2015.

6
BULBS
ONION (RED)
The cost of producing red onion averaged P129,520 per hectare in 2015. With a yield of 13,253 kilograms per hectare, gross value of production amounted to P416,542.
Returns after cash costs were deducted amounted to P314,458 per hectare while returns above cash and non-cash costs figured to P306,700 per hectare.
Net returns settled at P287,022 in 2015.
The average production cost was P9.77 per kilogram and the farmers’ price of onion was P31.43 per kilogram.
For every peso of investment in onion production, farmers netted P2.22. ONION (MULTIPLIER)
For the multiplier type of onion, the average production cost was estimated at P96,314 in 2015. Yield per hectare at 9,385 kilograms generated gross earnings of P190,140.
After subtracting cash costs, returns amounted to P134,248 per hectare. Less of cash and non-cash costs, returns settled at P114,293 per hectare.
Accounting for all costs, net returns amounted to P93,826 per hectare in 2015.
On a per kilogram basis, production costs averaged P10.26 while the farmgate price was P20.26.
Farmers realized a net gain of P0.97 for every peso of investment in the production of this type of onion.

7
GARLIC
Garlic farmers incurred an average production cost of P108,040 per hectare in 2015. Gross receipts amounted to P309,380 from an average yield of 3,797 kilograms per hectare.
Net of cash costs, returns amounted to P260,846 per hectare. After subtracting cash and non-cash costs, returns settled at P240,250 per hectare in 2015.
Garlic production in 2015 netted an average of P201,340 per hectare.
The cost of producing garlic per kilogram was P28.45. Farmgate price per kilogram was P81.48.
Farmers realized a net gain of P1.86 for every peso of investment in garlic production.
VEGETABLES AMPALAYA
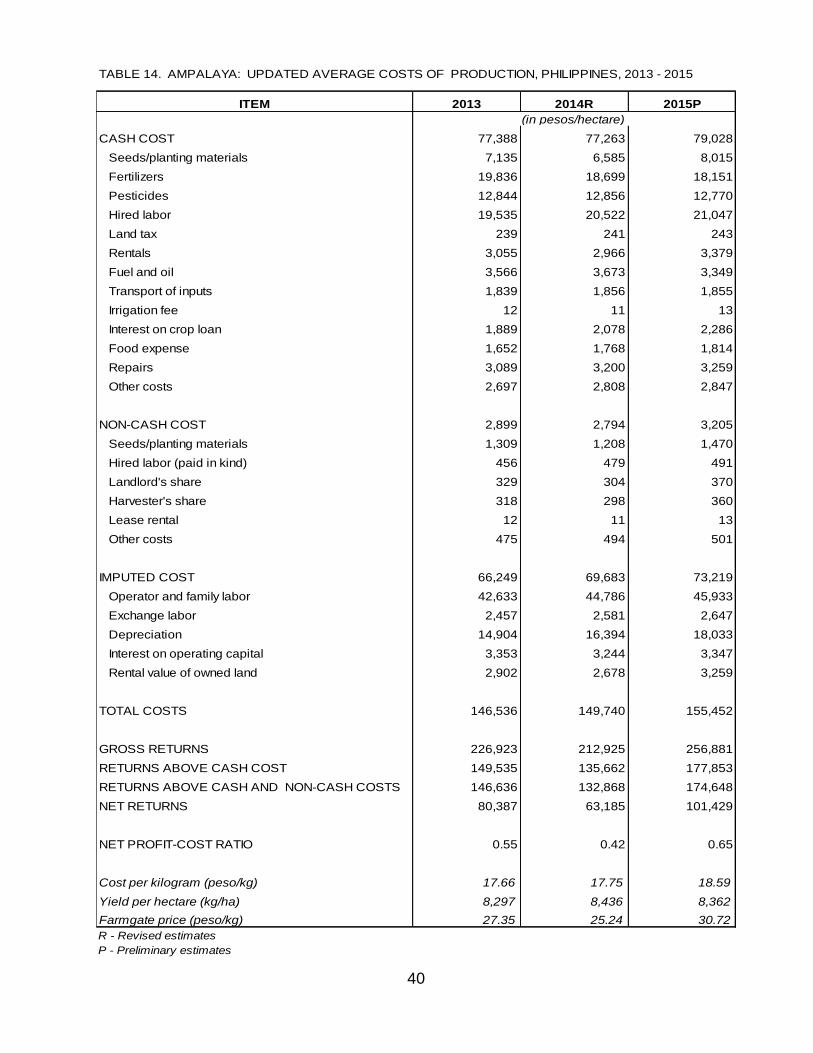
Ampalaya production in 2015 recorded an average cost of P155,452 per hectare. Yield per hectare at 8,362 kilograms corresponded to gross value of P256,881.
Returns above cash costs amounted to P177,853 per hectare while returns above cash and non-cash costs figured to P174,648 per hectare.
After all costs were deducted, ampalaya producers netted P101,429 per hectare.
Per kilogram, production cost stood at P18.59 while farmgate price settled at P30.72 in 2015.
The net profit-cost ratio for ampalaya production was computed at 0.65 in 2015.

8
CABBAGE
The cost of producing cabbage in the country averaged P126,855 per hectare in 2015. With a yield of 15,374 kilograms, gross earnings amounted to P309,786.
When cash costs were deducted from gross returns, farmers earned an average of P233,384 per hectare. Less of cash and non-cash costs, returns reached P233,251 per hectare.
After all costs were accounted for, net returns amounted to P182,931 per hectare in 2015.
Production cost per kilogram was estimated at P8.25 while farmgate price was P20.15 per kilogram during the reference year.
In 2015, producers earned P1.44 per peso of investment in cabbage production. CARROT
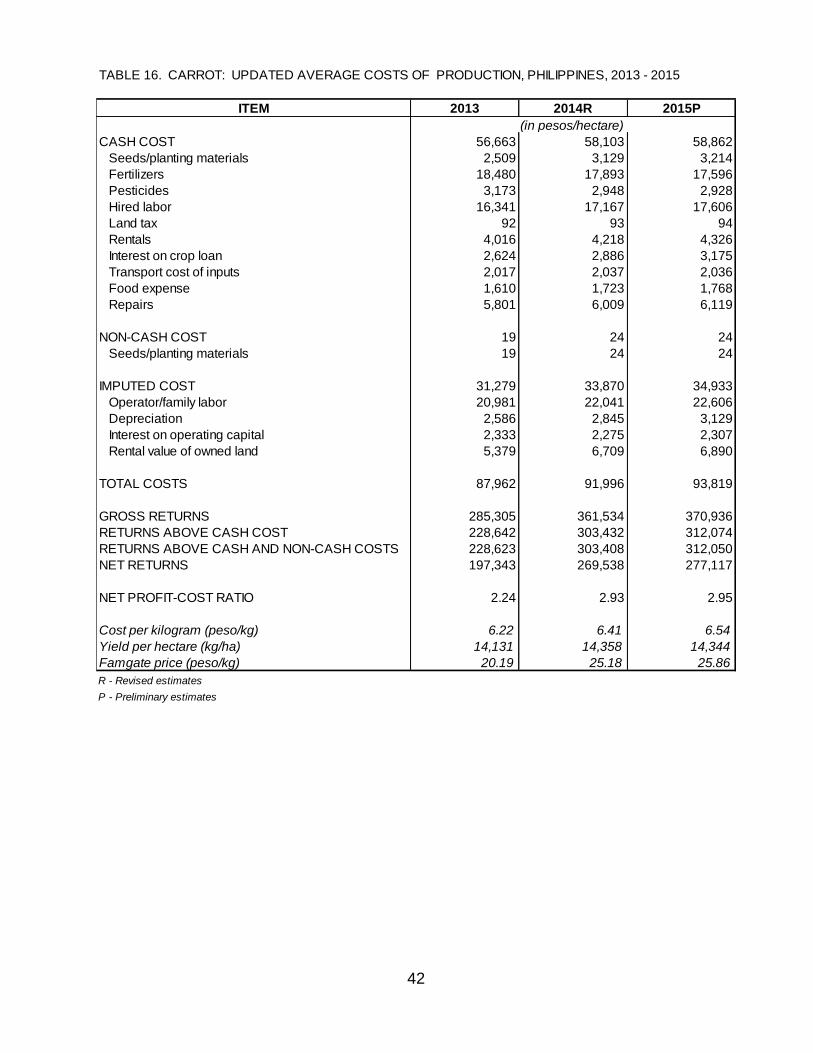
Carrot production incurred an average cost of P93,819 per hectare in 2015. Yield per hectare of 14,344 kilograms corresponded to gross receipts of P370,936.
Returns above cash costs averaged P312,074 per hectare while the returns above the combined cash and non-cash costs figured to P312,050 per hectare.
Carrot production netted an average of P277,117 per hectare in 2015.
On the average, cost of producing a kilogram of carrot was P6.54 in 2015. Farmer’s selling price was P25.86 per kilogram.
For every peso of investment in carrot production, farmers had a net gain of P2.95.

9
CAULIFLOWER
The cost of cauliflower production in 2015 averaged P108,997 per hectare. Yield per hectare was 10,997 kilograms equivalent to gross earnings of P371,039 during the period.
After cash costs were deducted, returns averaged P295,332 per hectare. After deducting cash and non-cash costs, returns reached P290,280 per hectare.
Net returns from cauliflower production averaged P262,042 per hectare in 2015.
Per kilogram, production cost averaged P9.91 while farmgate price was quoted at P33.74.
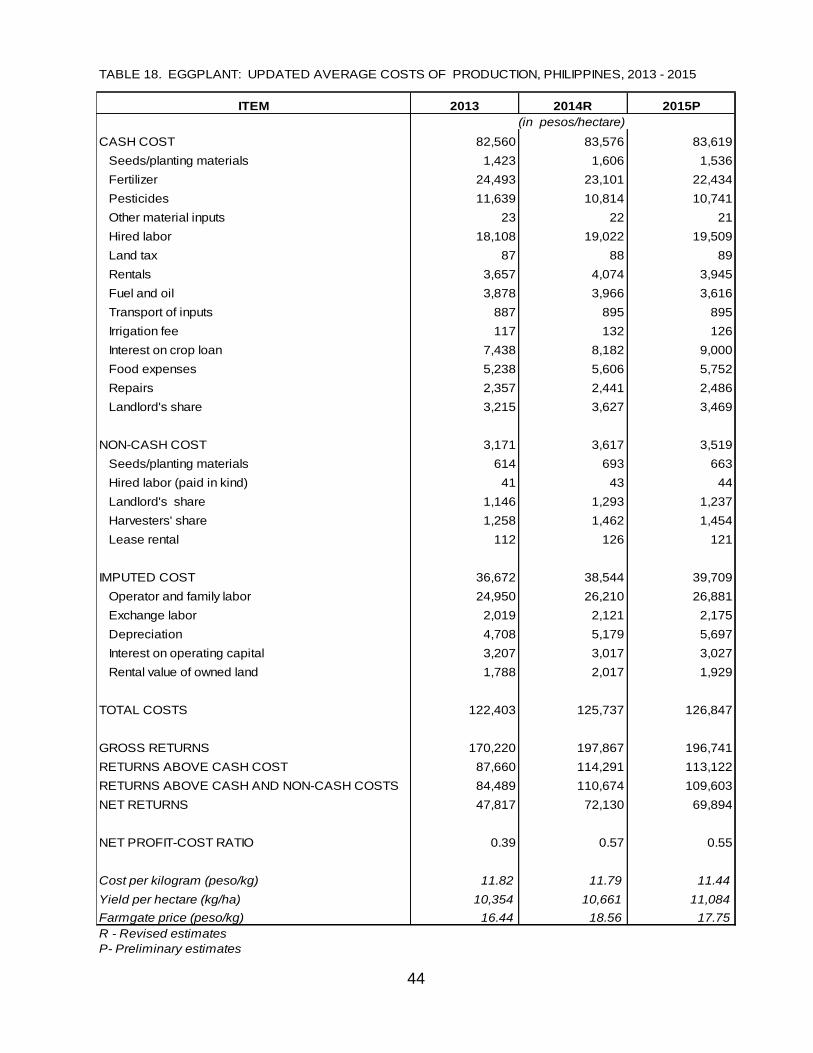
Net profit-cost ratio of 2.40 was realized in 2015. EGGPLANT
Eggplant farmers incurred an average cost of P126,847 per hectare in 2015. With an average yield of 11,084 kilograms per hectare, gross output value amounted to P196,741 during the reference year.
After subtracting cash costs, returns amounted to P113,122 per hectare. Less of cash and non-cash costs, returns averaged P109,603 per hectare.
After all costs were accounted for, eggplant farmers netted P69,894 per hectare.
On a per kilogram basis, production cost was estimated at P11.44 and farmgate price was P17.75 in 2015.
For every peso of investment in eggplant production, farmers earned P0.55.

10
HABITCHUELAS
The cost of producing a hectare of habitchuelas amounted to P81,513 in 2015. Gross earnings reached P107,062 from an average yield of 4,550 kilograms per hectare.
Returns above cash costs averaged P63,970 per hectare while returns above cash and non-cash costs figured to P62,259 per hectare.
Net returns settled at P25,548 per hectare in 2015.
On a per kilogram basis, the cost of habitchuelas production amounted to P17.92 while farmgate price stood at P23.53.
The net profit-cost ratio for habitchuelas production was 0.31.
WHITE POTATO
Production cost of white potato averaged P158,858 per hectare in 2015. Yield per hectare was 15,107 kilograms which corresponded to gross earnings of P320,722 during the reference year.
Less of cash costs, returns amounted to P218,461 per hectare. When both cash and non-cash costs were deducted, returns figured to P211,035.
Net profit from potato production was estimated at P161,864 per hectare in 2015.
The average production cost of potato was P10.52 per kilogram. Farmers sold potato at P21.23 per kilogram in 2015.
A peso invested in potato production generated net gain of P1.02.

11
STRINGBEANS
Production cost of stringbeans averaged P142,421 per hectare in 2015. Yield per hectare was 18,386 kilograms and grossed P453,399 during the year.
After deducting cash costs, returns amounted to P384,346 per hectare. Accounting for both cash and non-cash costs, returns settled at P380,874 per hectare.
Net gain averaged P310,978 per hectare.
Production cost per kilogram averaged P7.75. Farmgate price was P24.66 per kilogram.
Net profit-cost ratio stood at 2.18 in 2015. TOMATO
Tomato producers incurred an average production cost of P92,257 per hectare. Yield per hectare was 13,286 kilograms corresponding to gross earnings of P202,877 in 2015.
Subtracting cash costs, returns amounted to P132,448 per hectare. Net of cash and non-cash costs, returns averaged P129,088 per hectare during the reference period.
After all costs were deducted, net returns averaged P110,620 per hectare.
The cost of producing a kilogram of tomato was P6.94 while price received by farmers was P15.27 per kilogram.
A peso invested in tomato production generated net earnings of P1.20 in 2015.

12
LEGUMES
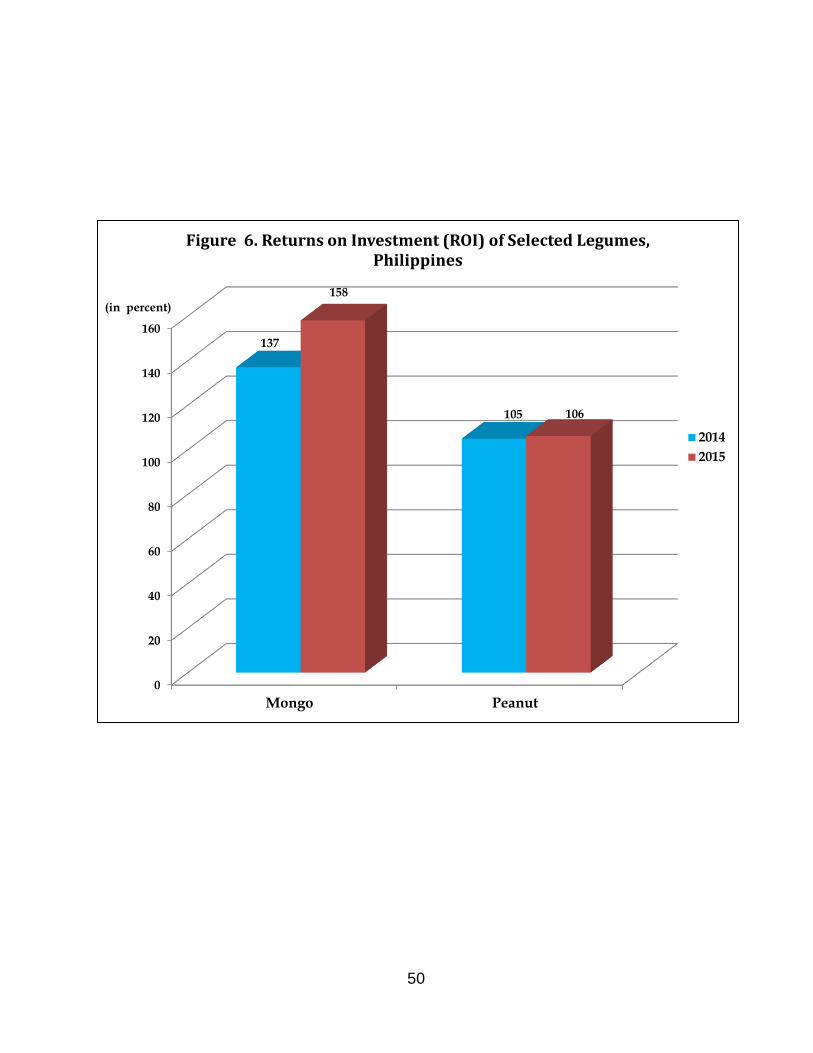
MONGO
The cost of producing mongo averaged P17,858 per hectare in 2015. At yield of 812 kilograms per hectare, mongo farmers grossed P46,162.
Returns after deducting cash costs amounted to P39,261 per hectare while returns less of cash and non-cash costs stood at P36,036.
Net of all costs, returns settled at P28,305 per hectare in 2015.
Production cost per kilogram for mongo was P21.99. Farmgate price was P56.85 per kilogram.
For every peso invested in mongo production, a net gain of P1.59 was realized in 2015.
PEANUT
Peanut production incurred an average cost of P32,383 per hectare in 2015. Yield per hectare at 1,643 kilograms generated gross earnings at P66,788 during the reference year.
Net of cash costs, returns amounted to P48,615 per hectare. After cash and non-cash costs were considered, returns reached P44,579 per hectare in 2015.
A net gain of P34,405 was generated after accounting for all costs.
Per kilogram, production cost averaged P19.71 while price received was P40.65 in 2015.
A farmer earned P1.06 for every peso invested in peanut production.

13
COMMERCIAL CROP
COFFEE
The maintenance cost in coffee production averaged P31,727 per hectare in 2015. Yield per hectare averaged 636 kilograms equivalent to gross receipts of P51,344.
Returns after cash costs were deducted amounted to P29,689 per hectare. Net of cash and non-cash costs, returns averaged P28,545 per hectare.
Net profit was estimated at P19,617 per hectare in 2015.
Production cost per kilogram averaged P49.89 while farmer’s price was quoted at P80.73 per kilogram.
Per peso of investment in coffee production, farmers netted P0.62 in 2015.
FISHERIES
MILKFISH
The cost of producing a hectare of milkfish in brackishwater fishpond amounted to P39,087 in 2015. Yield of 988 kilograms per hectare grossed P88,594.
After deducting cash costs, returns averaged P58,449 per hectare. Returns above cash and non-cash costs amounted to P57,756 per hectare in 2015.
Milkfish producers netted P49,507 per hectare in 2015.
Per kilogram, production cost was P39.56 while farmgate price was P89.67.
For every peso invested in milkfish production, growers earned P1.27 in 2015.

14
TILAPIA
In 2015, tilapia production incurred an average cost of P262,704 per hectare. Yield per hectare of 5,613 kilograms generated gross earnings of P416,653 during the year.
When cash costs were deducted, returns amounted to P188,497 per hectare. Returns above cash and non-cash costs were P186,187 per hectare.
Net returns after deducting all costs amounted to P153,949 per hectare in 2015.
Per kilogram, cost was estimated at P46.80 and farmgate price was P74.23.
For every peso of investment in tilapia production, net gain was P0.59 in 2015.

15
TABLES
AND
FIGURES

16
TABLE 1. SUMMARY OF COSTS OF PRODUCTION, SELECTED AGRICULTURAL COMMODITIES, PHILIPPINES, 2015
Commodity Gross Total Net Net Profit- Return on Yield per Farmgate Cost per
Returns Costs Returns Cost Ratio Investments Hectare Price Kilogram
(in percent)
FRUITS
Calamansi 149,802 59,630 90,172 1.51 151 8,137 18.41 7.33
Durian 158,341 84,721 73,620 0.87 87 5,257 30.12 16.12
Mango 130,794 73,572 57,223 0.78 78 4,791 27.30 15.36
Papaya 216,823 143,236 73,587 0.51 51 22,284 9.73 6.43
Pineapple 244,062 67,058 177,004 2.64 264 38,435 6.35 1.74
Watermelon 237,238 62,635 174,603 2.79 279 20,122 11.79 3.11
NUTS
Cashew 21,282 6,519 14,763 2.26 226 718 29.64 9.08
Pili 125,985 35,589 90,396 2.54 254 3,218 39.15 11.06
ROOT CROPS
Cassava 66,256 22,349 43,906 1.96 196 12,157 5.45 1.84
Sweet Potato 90,538 30,615 59,923 1.96 196 6,244 14.50 4.90
BULBS
Onion (Red Creole) 416,542 129,520 287,022 2.22 222 13,253 31.43 9.77
Onion (Multiplier) 190,140 96,314 93,826 0.97 97 9,385 20.26 10.26
Garlic 309,380 108,040 201,340 1.86 186 3,797 81.48 28.45
VEGETABLES
Ampalaya 256,881 155,452 101,429 0.65 65 8,362 30.72 18.59
Cabbage 309,786 126,855 182,931 1.44 144 15,374 20.15 8.25
Carrot 370,936 93,819 277,117 2.95 295 14,344 25.86 6.54
Cauliflower 371,039 108,997 262,042 2.40 240 10,997 33.74 9.91
Eggplant 196,741 126,847 69,894 0.55 55 11,084 17.75 11.44
Habitchuelas 107,062 81,513 25,548 0.31 31 4,550 23.53 17.92
White potato 320,722 158,858 161,864 1.02 102 15,107 21.23 10.52
Stringbeans 453,399 142,421 310,978 2.18 218 18,386 24.66 7.75
Tomato 202,877 92,257 110,620 1.20 120 13,286 15.27 6.94
LEGUMES
Mongo 46,162 17,858 28,305 1.59 159 812 56.85 21.99
Peanut 66,788 32,383 34,405 1.06 106 1,643 40.65 19.71
COMMERCIAL CROP
Coffee 51,344 31,727 19,617 0.62 62 636 80.73 49.89
FISHERIES
Milkfish 88,594 39,087 49,507 1.27 127 988 89.67 39.56
Tilapia 416,653 262,704 153,949 0.59 59 5,613 74.23 46.80
(in pesos/hectare) (kg/ha)
17
FRUITS
18
0
50
100
150
200
250
300
350
400
188
49
77
51
381
232
152
8778
51
395
279
(in percent)
Figure 1. Returns on Investment (ROI) of Selected Fruits, Philippines
2014
2015

19
TABLE 2. CALAMANSI: UPDATED AVERAGE COSTS OF PRODUCTION, PHILIPPINES, 2013 - 2015
ITEM 2013 2014R 2015P
CASH COST 39,820 40,859 41,377
Fertilizer 6,046 5,467 5,223
Pesticides 920 921 915
Hired labor 27,822 29,227 29,975
Wages for overseer 593 623 639
Land tax 426 430 434
Rentals 105 120 111
Fuel and oil 622 636 580
Transport of inputs 574 579 579
Interest on crop loan 41 45 50
Food expense 1,204 1,289 1,323
Repairs 1,455 1,507 1,535
Irrigation fee 12 15 13
NON-CASH COST 1,185 1,358 1,238
Hired labor paid in kind 84 86 88
Wages for overseer (paid in kind) 313 321 329
Landlord's share 102 124 106
Harvester's share 386 463 403
Lease rental 300 364 312
IMPUTED COST 15,868 17,590 17,015
Operator and family labor 5,759 6,050 6,204
Exchange labor 12 12 13
Depreciation 2,207 2,428 2,671
Interest on operating capital 2,038 2,004 2,051
Rental value of owned land 5,852 7,096 6,076
TOTAL COSTS 56,873 59,807 59,630
GROSS RETURNS 143,578 172,237 149,802
RETURNS ABOVE CASH COSTS 103,758 131,378 108,425
RETURNS ABOVE CASH & NON-CASH COSTS 102,573 130,020 107,187
NET RETURNS 86,705 112,430 90,172
NET PROFIT- COST RATIO 1.52 1.88 1.51
Cost per kilogram (peso/kg) 7.02 7.47 7.33
Yield/hectare (kg/ha) 8,098 8,011 8,137
Farmgate price (peso/kg) 17.73 21.50 18.41
* - Refers to maintenance costs only
R - Revised estimates
P - Preliminary estimates
(in pesos per hectare)

20
TABLE 3. DURIAN: UPDATED AVERAGE COSTS OF PRODUCTION, PHILIPPINES, 2013-2015
ITEM 2013 2014R 2015P
CASH COST 23,626 23,206 23,174
Fertilizer 13,229 12,487 12,150
Pesticides 592 550 547
Other material inputs 16 15 15
Hired labor 5,181 5,442 5,582
Land tax 1,136 1,147 1,158
Land rental 449 446 565
Transportation of inputs 1,190 1,201 1,201
Fuel and oil 13 13 12
Food expense 590 631 647
Repairs 1,230 1,274 1,297
NON-CASH COST 40,881 40,248 45,671
Hired labor (paid in kind) 26,150 27,471 28,174
Landlord's share 290 288 365
Harvester's share 14,441 12,489 17,132
IMPUTED COST 13,769 14,152 15,876
Operator/family labor 5,111 5,369 5,506
Exchange labor 324 340 349
Depreciation 2,190 2,409 2,650
Interest on operating capital 1,095 1,023 1,021
Rental value of owned land 5,049 5,011 6,350
TOTAL COSTS 78,276 77,606 84,721
GROSS RETURNS 133,473 115,427 158,341
RETURNS ABOVE CASH COSTS 109,847 92,221 135,167
RETURNS ABOVE CASH AND NON-CASH COSTS 68,966 51,973 89,496
NET RETURNS 55,197 37,821 73,620
NET PROFIT-COST RATIO 0.71 0.49 0.87
Cost per kilogram (peso/kg) 14.05 15.98 16.12
Yield per hectare (kg/ha) 5,573 4,856 5,257
Farmgate price (peso/kg) 23.95 23.77 30.12
*- Refers to maintenance costs only
R - Revised estimates
P - Preliminary estimates
(in pesos per hectare)

21
TABLE 4. MANGO: UPDATED COSTS OF PRODUCTION, PHILIPPINES, 2012-2015 *
ITEM 2013R 2014R 2015P
(in pesos per hectare)
CASH COST 43,320 43,041 42,970
Fertilizer 15,705 14,981 14,606
Pesticides 7,823 7,269 7,220
Hired labor 11,009 11,565 11,861
Land tax 807 815 823
Rentals 1,819 1,922 1,957
Water/electric bills 304 307 280
Fuel and oil 1,867 1,923 1,753
Interest on crop loan 1,371 1,508 1,659
Food expense 1,227 1,313 1,347
Repairs 1,388 1,438 1,464
NON-CASH COST 4,484 4,815 4,880
Hired labor paid in kind 692 727 746
Rentals (machine and vehicle) 129 136 139
Landlord's share 3,023 3,215 3,239
Harvesters' share 640 737 756
IMPUTED COST 22,540 24,127 25,722
Operator and family labor 5,481 5,758 5,905
Depreciation 12,918 14,210 15,631
Interest on operating capital 1,989 1,870 1,880
Rental value of owned land 2,152 2,289 2,306
TOTAL COSTS 70,344 71,983 73,572
GROSS RETURNS 110,685 127,506 130,794
RETURNS ABOVE CASH COSTS 67,365 84,465 87,824
RETURNS ABOVE CASH AND NON-CASH COSTS 62,881 79,650 82,944
NET RETURNS 40,341 55,523 57,223
NET PROFIT-COST RATIO 0.57 0.77 0.78
Cost per kilogram (peso/kg) 16.19 15.30 15.36
Yield per hectare (kg/ha) 4,344 4,705 4,791
Farmgate price (peso/kg) 25.48 27.10 27.30
* - Refers to maintenance costs only
R - Revised estimates
P - Preliminary estimates

22
TABLE 5. PAPAYA: UPDATED AVERAGE COSTS OF PRODUCTION, PHILIPPINES, 2013-2015
ITEM 2013 2014R 2015P
CASH COST 108,089 107,871 108,075
Fertilizer 34,287 31,197 30,439
Pesticides 4,476 4,480 4,450
Other material inputs 11 10 10
Hired labor 34,698 35,409 36,315
Land tax 306 309 312
Rentals 4,024 4,659 4,679
Fuel and oil 10,583 10,900 9,939
Transport cost of inputs 5,655 5,709 5,707
Irrigation fee 68 83 83
Interest on crop loan 8,891 9,780 10,758
Food expenses 1,769 1,893 1,942
Repairs 1,347 1,395 1,421
Landlord's share 34 41 41
Wages for overseer 121 123 126
Electric bill 543 555 506
Other costs 1,276 1,328 1,347
NON-CASH COST 211 249 251
Hired labor paid in kind 55 56 57
Landlord's share 122 148 148
Harvester's share 34 45 46
IMPUTED COST 31,024 32,899 34,866
Operator/family labor 9,364 9,556 9,801
Depreciation 15,344 16,878 18,566
Interest on operating capital 4,232 3,932 3,974
Rental value of owned land 2,084 2,533 2,525
TOTAL COSTS 139,324 141,019 143,192
GROSS RETURNS 159,050 212,797 216,823
RETURNS ABOVE CASH COSTS 50,961 104,926 108,748
RETURNS ABOVE CASH & NON-CASH COSTS 50,750 104,677 108,497
NET RETURNS 19,726 71,778 73,632
NET PROFIT- COST RATIO 0.14 0.51 0.51
Cost per kilogram (peso/kg) 7.03 6.47 6.43
Yield per hectare(kg/ha) 19,807 21,803 22,284
Farmgate price (peso/kg) 8.03 9.76 9.73
* - Refers to maintenance costs only
R - Revised estimates
P - Preliminary estimates
(in pesos per hectare)

23
TABLE 6. PINEAPPLE: UPDATED AVERAGE COSTS OF PRODUCTION, PHILIPPINES, 2013 - 2015
ITEM 2013R 2014R 2015P
CASH COST 58,789 60,516 61,201
Seeds/planting materials 17,861 19,829 20,460
Fertilizer 16,705 15,323 14,780
Pesticides 1,615 1,617 1,606
Other material inputs 1,101 1,010 975
Hired labor 12,032 12,640 12,964
Land tax 318 321 324
Rentals 2,936 3,254 3,357
Fuel and oil 100 102 93
Transport cost of inputs 1,773 1,790 1,789
Irrigation fee 229 254 262
Interest on crop loan 1,453 1,598 1,758
Food expenses 463 496 509
Repairs 2,203 2,282 2,324
NON-CASH COST 772 857 884
Hired labor (paid in kind) 5 5 5
Landlord's share 5 6 6
Harvesters' share 5 6 6
Lease rental 757 840 867
IMPUTED COST 4,970 5,101 5,233
Operator and family labor 186 172 87
Exchange labor 10 9 4
Depreciation 1,449 1,594 1,753
Interest on operating capital 2,840 2,788 2,834
Rental value of owned land 485 538 555
TOTAL COSTS 64,531 66,474 67,318
GROSS RETURNS 286,485 319,682 333,467
RETURNS ABOVE CASH COSTS 227,696 259,166 272,266
RETURNS ABOVE CASH AND NON-CASH COSTS 226,924 258,309 271,382
NET RETURNS 221,954 253,208 266,149
NET PROFIT-COST RATIO 3.44 3.81 3.95
Cost per kilogram (peso/kg) 1.59 1.63 1.64
Yield per hectare (kg/ha) 40,464 40,672 41,118
Farmgate price (peso/kg) 7.08 7.86 8.11
R - Revised estimates
P - Preliminary estimates
(in pesos per hectare)

24
TABLE 7. WATERMELON: UPDATED AVERAGE COSTS OF PRODUCTION, PHILIPPINES, 2013-2015
ITEM 2013 2014R 2015P
CASH COST 40,920 41,545 41,821
Seeds/planting materials 645 667 721
Fertilizer 14,025 13,443 13,122
Pesticides 3,362 3,365 3,343
Other material inputs 56 53 52
Hired labor 16,975 17,833 18,289
Land tax 289 292 295
Rentals 1,794 1,872 1,965
Fuel and oil 996 1,026 936
Transport cost of inputs 327 328 328
Irrigation fee 49 51 55
Interest on crop loan 463 509 560
Food expenses 1,209 1,350 1,385
Repairs 730 756 770
NON-CASH COST 481 498 535
Seeds 62 64 69
Hired labor (paid in kind) 69 72 74
Landlord's share 74 77 83
Harvester's share 12 12 14
Lease rental 264 273 295
IMPUTED COST 18,689 19,559 20,266
Operator and family labor 12,843 13,492 13,837
Exchange labor 749 787 807
Depreciation 2,167 2,384 2,622
Interest on operating capital 2,020 1,955 1,982
Rental value of owned land 910 941 1,018
TOTAL COSTS 60,090 61,602 62,622
GROSS RETURNS 197,899 204,222 237,238
RETURNS ABOVE CASH COSTS 156,979 162,677 195,417
RETURNS ABOVE CASH AND NON-CASH COSTS 156,498 162,179 194,882
NET RETURNS 137,809 142,620 174,616
NET PROFIT-COST RATIO 2.29 2.32 2.79
Cost per kilogram (peso/kg) 3.20 3.29 3.11
Yield per hectare (kg/ha) 18,776 18,736 20,122
Farmgate price (peso/kg) 10.54 10.90 11.79
R - Revised estimates
P - Preliminary estimates
(in pesos per hectare)

25
NUTS

26
0
50
100
150
200
250
300
Cashew Nuts Pili Nuts
175
249
226
254
(in percent)
Figure 2. Returns on Investment (ROI) of Selected Nuts, Philippines
2014
2015

27
TABLE 8. CASHEW NUTS: UPDATED AVERAGE COSTS OF PRODUCTION, PHILIPPINES, 2013 - 2015
ITEM 2013 2014R 2015P
CASH COST 903 943 962
Fertilizer 2 2 2
Hired labor 395 415 426
Land tax 233 235 237
Food expense 99 111 114
Repairs 174 180 183
NON-CASH COST 383 409 437
Hired labor (paid in kind) 257 270 277
Landlord's share 50 50 51
Harvester's share 76 89 109
IMPUTED COST 4,787 4,983 5,120
Operator/family labor 3,265 3,430 3,518
Depreciation 254 279 307
Interest on operating capital 23 23 24
Rental value of owned land 1,245 1,251 1,271
TOTAL COSTS 6,073 6,335 6,519
GROSS RETURNS 14,839 17,414 21,282
RETURNS ABOVE CASH COSTS 13,936 16,471 20,320
RETURNS ABOVE CASH AND NON-CASH COSTS 13,553 16,062 19,883
NET RETURNS 8,767 11,079 14,763
NET PROFIT-COST RATIO 1.44 1.75 2.26
Cost per kilogram (peso/kg) 11.88 10.61 9.08
Yield per hectare (kg/ha) 511 597 718
Farmgate price (peso/kg) 29.04 29.17 29.64
* - Refers to maintenance costs only
R - Revised estimates
P - Preliminary estimates
(in pesos/hectare)

28
TABLE 9. PILI NUTS: UPDATED AVERAGE COSTS OF PRODUCTION, PHILIPPINES, 2013 - 2015
ITEM 2013 2014R 2015P
CASH COST 7,093 7,443 7,628
Hired labor 5,318 5,587 5,730
Land tax 543 548 553
Lease rental 213 240 255
Transport cost of inputs 107 107 107
Food expense 451 483 496
Repairs 461 478 487
NON-CASH COST 17,674 17,993 19,184
Hired labor in kind 130 137 141
Landlord's share 2,013 2,268 2,408
Harvester's share 15,531 15,588 16,635
IMPUTED COST 7,765 8,389 8,777
Operator/family labor 4,008 4,210 4,318
Depreciation 697 767 844
Interest on operating capital 306 309 320
Rental value of owned land 2,754 3,103 3,295
TOTAL COSTS 32,532 33,825 35,589
GROSS RETURNS 117,628 118,058 125,985
RETURNS ABOVE CASH COSTS 110,535 110,615 118,357
RETURNS ABOVE CASH AND NON-CASH COSTS 92,861 92,622 99,173
NET RETURNS 85,096 84,233 90,396
NET PROFIT-COST RATIO 2.62 2.49 2.54
Cost per kilogram (peso/kg) 9.05 10.56 11.06
Yield per hectare (kg/ha) 3,595 3,202 3,218
Farmgate price (peso/kg) 32.72 36.87 39.15
* - Refers to maintenance cost only
R - Revised estimates
P - Preliminary estimates
(in pesos/hectare)

29
ROOT CROPS

30
0
50
100
150
200
250
Cassava Sweet Potato
245
171
196 196
(in percent)
Figure 3. Returns on Investment (ROI) of Selected Root Crops, Philippines
2014
2015

31
TABLE 10. CASSAVA: UPDATED AVERAGE COSTS OF PRODUCTION, PHILIPPINES, 2013 - 2015
ITEM 2013 2014R 2015P
CASH COST 8,713 8,956 9,133
Seeds/planting materials 155 132 110
Fertilizer 2,305 2,240 2,213
Hired labor 3,904 4,101 4,206
Land tax 27 27 27
Rentals 550 536 515
Transport of inputs 47 47 47
Interest on crop loan 1,172 1,289 1,418
Food expenses 324 347 356
Repairs 229 237 241
NON-CASH COST 1,799 1,554 1,314
Seeds/planting materials 1,263 1,079 902
Hired labor (paid in kind) 64 67 69
Landlord's share 128 109 91
Harvester's share 67 62 54
Lease rental 277 237 198
IMPUTED COST 11,173 11,643 11,902
Operator and family labor 9,077 9,536 9,780
Exchange labor 694 730 748
Depreciation 545 600 660
Interest on operating capital 367 358 364
Rental value of owned land 490 419 350
TOTAL COSTS 21,685 22,153 22,349
GROSS RETURNS 82,976 76,401 66,256
RETURNS ABOVE CASH COSTS 74,263 67,445 57,123
RETURNS ABOVE CASH AND NON-CASH COSTS 72,464 65,891 55,809
NET RETURNS 61,291 54,248 43,906
NET PROFIT-COST RATIO 2.83 2.45 1.96
Cost per kilogram (peso/kg) 1.99 1.89 1.84
Average yield per hectare (kg/ha) 10,875 11,718 12,157
Farmgate price (peso/kg) 7.63 6.52 5.45
R - Revised estimates
P - Preliminary estimates
(in pesos/hectare)

32
TABLE 11. SWEET POTATO: UPDATED AVERAGE COSTS OF PRODUCTION, PHILIPPINES, 2013 - 2015
ITEM 2013 2014R 2015P
CASH COST 13,039 13,656 13,946
Seeds/planting materials 1,606 1,808 1,911
Fertilizers 2,467 2,322 2,256
Pesticides 107 99 99
Hired labor 4,915 5,163 5,295
Land tax 150 152 154
Rentals 1,670 1,864 1,964
Fuel and oil 552 569 519
Interest on crop loan 358 394 433
Transport of inputs 91 92 92
Food expense 886 948 973
Repairs 237 245 250
NON-CASH COST 3,004 3,428 3,665
Seeds/planting materials 1,372 1,544 1,632
Hired labor (paid in kind) 74 78 80
Landlord's share 1,054 1,186 1,253
Harvester's share 504 620 700
IMPUTED COST 11,770 12,501 13,004
Operator/family labor 8,066 8,473 8,690
Exchange labor 312 328 336
Depreciation 1,739 1,913 2,104
Interest on operating capital 524 519 534
Rental value of owned land 1,129 1,268 1,340
TOTAL COSTS 27,813 29,585 30,615
GROSS RETURNS 65,143 80,166 90,538
RETURNS ABOVE CASH COSTS 52,104 66,510 76,592
RETURNS ABOVE CASH AND NON-CASH COSTS 49,100 63,082 72,927
NET RETURNS 37,330 50,581 59,923
NET PROFIT-COST RATIO 1.34 1.71 1.96
Cost per kilogram (peso/kg) 5.20 5.06 4.90
Yield per hectare (kg/ha) 5,344 5,843 6,244
Farmgate price (peso/kg) 12.19 13.72 14.50
R - Revised estimates
P - Preliminary estimates
(in pesos/hectare)

33
BULBS

34
0
50
100
150
200
250
300
Onion (Red) Onion (Multiplier) Garlic
298
103
281
222
97
186
(in percent)
Figure 4. Returns on Investment (ROI) of Selected Bulbs, Philippines
2014
2015

35
Table 12.1. ONION (RED): UPDATED AVERAGE COSTS PRODUCTION, PHILIPPINES, 2013-2015
ITEM 2013 2014R 2015P
CASH COSTS 103,604 104,735 102,084
Planting materials 14,418 14,033 12,204
Fertilizers 19,048 18,143 17,647
Mulching materials 9 9 9
Pesticides 9,600 9,605 9,541
Hired labor 32,429 34,067 34,939
Caretaker/overseer's/employee's salary 1,626 1,708 1,752
Land tax 421 425 429
Rentals 1,118 1,137 1,093
Fuel and Oil 7,366 7,587 6,918
Transport cost of inputs 431 433 433
Interest payment on crop loan 3,034 3,337 3,671
Landowner's share 6,656 6,478 5,634
Irrigation fee 308 324 332
Storage cost 802 781 679
Electricity 69 71 65
Food expense 2,876 3,078 3,158
Repairs 2,456 2,544 2,591
Other costs 937 975 989
NON-CASH COSTS 8,382 9,532 7,758
Fertilizers 62 59 57
Mulching materials 423 403 392
Hired labor in kind 64 67 69
Harvesters' share 5,838 7,042 5,492
Caretaker/overseer's wages 256 269 276
Rentals 1,430 1,392 1,211
Landowner's share 288 280 244
Irrigation fee 21 20 17
IMPUTED COSTS 19,520 19,757 19,678
Seeds 195 190 165
Fertilizers 108 103 101
Mulching material 21 20 19
Pesticides 1 1 1
Operator labor 6,404 6,727 6,899
Family labor 2,993 3,144 3,224
Exchange labor 350 368 377
Depreciation 1,460 1,606 1,767
Interest on operating capital 4,589 4,289 4,246
Rental value of owned land 3,389 3,299 2,869
Transport cost of inputs 10 10 10
TOTAL COSTS 131,506 134,024 129,520
GROSS RETURNS 442,747 534,077 416,542
RETURNS ABOVE CASH COSTS 339,143 429,342 314,458
RETURNS ABOVE CASH AND NON-CASH COSTS 330,761 419,810 306,700
NET RETURNS 311,240 400,053 287,022
NET PROFIT-COST RATIO 2.37 2.98 2.22
Cost per kilogram (peso/kg) 11.03 9.07 9.77
Yield/hectare (kg/ha) 11,924 14,778 13,253
Farmgate price (peso/kg) 37.13 36.14 31.43
P - Preliminary estimates
R - Revised estimates
(in pesos/hectare)

36
Table 12.2. ONION (MULTIPLIER): UPDATED AVERAGE COSTS OF PRODUCTION, PHILIPPINES, 2013-2015
ITEM 2013 2014R 2015P
CASH COSTS 58,597 57,033 55,892
Planting materials 2,393 1,621 1,343
Fertilizers 13,292 12,538 12,136
Mulching materials 344 324 314
Pesticides 5,125 5,128 5,094
Hired labor 18,493 19,427 19,924
Other permanent employee's salary 287 301 309
Land tax 91 92 93
Rentals 564 427 379
Fuel and Oil 5,390 5,552 5,062
Transport cost of inputs 348 349 349
Interest payment on crop loan 1,113 1,224 1,346
Landowner's share 4,362 2,954 2,446
Irrigation fee 54 37 31
Electricity 1,297 1,326 1,209
Food expense 2,641 2,827 2,901
Repairs 2,160 2,237 2,278
Other costs 643 669 678
NON-CASH COSTS 33,008 23,443 19,955
Planting materials 19,701 13,343 11,047
Fertilizer 15 14 14
Mulching materials 3,652 3,445 3,334
Rentals 299 314 322
Landowner's share 9,341 6,327 5,238
IMPUTED COSTS 20,610 20,312 20,467
Planting materials 80 54 45
Fertilizers 14 14 14
Mulching material 166 157 152
Operator labor 8,535 8,966 9,196
Family labor 4,564 4,794 4,917
Exchange labor 376 395 405
Depreciation 782 860 946
Interest on operating capital 2,272 2,398 2,532
Rental value of owned land 3,580 2,425 2,008
Transport cost of inputs 62 63 63
Other costs 179 186 189
TOTAL COSTS 112,215 100,788 96,314
GROSS RETURNS 304,659 205,034 190,140
RETURNS ABOVE CASH COSTS 246,062 148,001 134,248
RETURNS ABOVE CASH AND NON-CASH COSTS 213,054 124,558 114,293
NET RETURNS 192,444 104,246 93,826
NET PROFIT-COST RATIO 1.71 1.03 0.97
Cost per kilogram (peso/kg) 13.31 12.03 10.26
Yield/hectare (kg/ha) 8,432 8,379 9,385
Farmgate price (peso/kg) 36.13 24.47 20.26
P - Preliminary estimates
R - Revised estimates
(in pesos/hectare)

37
Table 13. GARLIC: UPDATED AVERAGE COSTS OF PRODUCTION, PHILIPPINES, 2013 - 2015
ITEM 2013 2014R 2015P
CASH COSTS 46,861 53,836 48,534
Planting materials (cloves) 4,413 9,555 5,108
Fertilizers 9,617 9,168 8,912
Mulching materials 159 152 148
Pesticides 4,128 4,130 4,102
Hired labor 16,066 16,877 17,309
Caretaker/overseer's wages 106 111 114
Land tax 323 326 329
Rentals 262 371 289
Fuel and Oil 4,498 4,633 4,224
Transport cost of inputs 412 416 416
Interest payment on crop loan 762 838 922
Landowner's share 684 1,473 849
Irrigation fee 69 149 80
Electricity 256 264 241
Food expense 2,400 2,569 2,636
Repairs 2,615 2,709 2,759
Other costs 91 95 96
NON-CASH COSTS 18,445 35,691 20,596
Planting materials (cloves) 9,062 19,620 10,488
Fertilizers 93 88 86
Mulching materials 3,128 2,982 2,899
Pesticides 5 5 5
Hired labor in kind 238 250 256
Harvesters' share 188 405 234
Caretaker/overseer's wages 17 18 18
Rentals 440 909 506
Interest payment on crop loan 4 4 4
Landowner's share 5,109 11,061 5,913
Irrigation fee 161 349 187
IMPUTED COSTS 35,306 51,274 38,910
Planting materials (cloves) 7,745 16,769 8,964
Fertilizers 847 808 786
Mulching materials 325 310 301
Pesticides 7 7 7
Operator labor 10,715 11,256 11,544
Family labor 7,207 7,571 7,765
Exchange labor 353 371 380
Depreciation 1,144 1,258 1,384
Interest on operating capital 1,949 2,212 1,992
Rental value of owned land 4,888 10,583 5,657
Transport cost of inputs 90 91 91
Interest payment on crop loan 10 11 12
Other costs 26 27 27
TOTAL COSTS 100,612 140,801 108,040
GROSS RETURNS 249,146 536,518 309,380
RETURNS ABOVE CASH COSTS 202,285 482,682 260,846
RETURNS ABOVE CASH AND NON-CASH COSTS 183,840 446,991 240,250
NET RETURNS 148,534 395,718 201,340
NET PROFIT-COST RATIO 1.48 2.81 1.86
Cost per kilogram (peso/kg) 28.43 40.00 28.45
Yield/hectare (kg/ha) 3,539 3,520 3,797
Farmgate price (peso/kg) 70.40 152.42 81.48
R - Revised estimates
P-Preliminary estimates
(in pesos/hectare)

38
VEGETABLES

39
0
50
100
150
200
250
300
42
100
293
183
57
20
147
195
82
65
144
295
240
55
31
102
218
120
(in percent)
Figure 5. Returns on Investmens (ROI) of Selected Vegetables, Philippines
2014
2015
40
TABLE 14. AMPALAYA: UPDATED AVERAGE COSTS OF PRODUCTION, PHILIPPINES, 2013 - 2015
ITEM 2013 2014R 2015P
CASH COST 77,388 77,263 79,028
Seeds/planting materials 7,135 6,585 8,015
Fertilizers 19,836 18,699 18,151
Pesticides 12,844 12,856 12,770
Hired labor 19,535 20,522 21,047
Land tax 239 241 243
Rentals 3,055 2,966 3,379
Fuel and oil 3,566 3,673 3,349
Transport of inputs 1,839 1,856 1,855
Irrigation fee 12 11 13
Interest on crop loan 1,889 2,078 2,286
Food expense 1,652 1,768 1,814
Repairs 3,089 3,200 3,259
Other costs 2,697 2,808 2,847
NON-CASH COST 2,899 2,794 3,205
Seeds/planting materials 1,309 1,208 1,470
Hired labor (paid in kind) 456 479 491
Landlord's share 329 304 370
Harvester's share 318 298 360
Lease rental 12 11 13
Other costs 475 494 501
IMPUTED COST 66,249 69,683 73,219
Operator and family labor 42,633 44,786 45,933
Exchange labor 2,457 2,581 2,647
Depreciation 14,904 16,394 18,033
Interest on operating capital 3,353 3,244 3,347
Rental value of owned land 2,902 2,678 3,259
TOTAL COSTS 146,536 149,740 155,452
GROSS RETURNS 226,923 212,925 256,881
RETURNS ABOVE CASH COST 149,535 135,662 177,853
RETURNS ABOVE CASH AND NON-CASH COSTS 146,636 132,868 174,648
NET RETURNS 80,387 63,185 101,429
NET PROFIT-COST RATIO 0.55 0.42 0.65
Cost per kilogram (peso/kg) 17.66 17.75 18.59
Yield per hectare (kg/ha) 8,297 8,436 8,362
Farmgate price (peso/kg) 27.35 25.24 30.72
R - Revised estimates
P - Preliminary estimates
(in pesos/hectare)

41
TABLE 15. CABBAGE: UPDATED AVERAGE COSTS OF PRODUCTION, PHILIPPINES, 2013 - 2015
ITEM 2013 2014R 2015P
CASH COST 73,758 74,415 76,402
Seeds/planting materials 5,306 5,692 7,414
Fertilizers 26,748 25,833 25,342
Pesticides 5,736 5,329 5,294
Hired labor 19,033 19,994 20,507
Land tax 232 234 236
Rentals 2,581 2,711 2,780
Transport of inputs 4,201 4,241 4,239
Food expense 2,867 3,069 3,149
Repairs 5,955 6,168 6,281
Other costs 1,099 1,144 1,160
NON-CASH COST 110 116 133
Seeds/planting materials 46 49 64
Hired labor (paid in kind) 64 67 69
IMPUTED COST 42,015 44,403 50,320
Operator/family labor 19,378 20,357 20,878
Depreciation 4,715 5,187 5,706
Interest on operating capital 3,273 3,144 3,267
Rental value of owned land 14,649 15,715 20,469
TOTAL COSTS 115,883 118,934 126,855
GROSS RETURNS 217,800 238,269 309,786
RETURNS ABOVE CASH COST 144,042 163,854 233,384
RETURNS ABOVE CASH AND NON-CASH COSTS 143,932 163,738 233,251
NET RETURNS 101,917 119,335 182,931
NET PROFIT-COST RATIO 0.88 1.00 1.44
Cost per kilogram (peso/kg) 7.67 7.72 8.25
Yield per hectare (kg/ha) 15,104 15,402 15,374
Farmgate price (peso/kg) 14.42 15.47 20.15
R - Revised estimates
P - Preliminary estimates
(in pesos/hectare)
42
TABLE 16. CARROT: UPDATED AVERAGE COSTS OF PRODUCTION, PHILIPPINES, 2013 - 2015
ITEM 2013 2014R 2015P
CASH COST 56,663 58,103 58,862
Seeds/planting materials 2,509 3,129 3,214
Fertilizers 18,480 17,893 17,596
Pesticides 3,173 2,948 2,928
Hired labor 16,341 17,167 17,606
Land tax 92 93 94
Rentals 4,016 4,218 4,326
Interest on crop loan 2,624 2,886 3,175
Transport cost of inputs 2,017 2,037 2,036
Food expense 1,610 1,723 1,768
Repairs 5,801 6,009 6,119
NON-CASH COST 19 24 24
Seeds/planting materials 19 24 24
IMPUTED COST 31,279 33,870 34,933
Operator/family labor 20,981 22,041 22,606
Depreciation 2,586 2,845 3,129
Interest on operating capital 2,333 2,275 2,307
Rental value of owned land 5,379 6,709 6,890
TOTAL COSTS 87,962 91,996 93,819
GROSS RETURNS 285,305 361,534 370,936
RETURNS ABOVE CASH COST 228,642 303,432 312,074
RETURNS ABOVE CASH AND NON-CASH COSTS 228,623 303,408 312,050
NET RETURNS 197,343 269,538 277,117
NET PROFIT-COST RATIO 2.24 2.93 2.95
Cost per kilogram (peso/kg) 6.22 6.41 6.54
Yield per hectare (kg/ha) 14,131 14,358 14,344
Famgate price (peso/kg) 20.19 25.18 25.86
R - Revised estimates
P - Preliminary estimates
(in pesos/hectare)

43
TABLE 17. CAULIFLOWER: UPDATED AVERAGE COSTS OF PRODUCTION, PHILIPPINES, 2013 - 2015
ITEM 2013 2014R 2015P
( in pesos/hectare)
CASH COST 72,006 72,966 75,707
Seeds/planting materials 10,212 10,815 13,293
Fertilizers 22,882 21,909 21,547
Pesticides 5,919 5,924 5,883
Hired labor 12,487 13,117 13,453
Land tax 1,002 1,012 1,022
Rentals 10,300 10,820 11,097
Transport of inputs 7,103 7,170 7,167
Food expense 663 710 729
Repairs 1,438 1,489 1,516
NON-CASH COST 3,881 4,110 5,052
Landlord's share 3,881 4,110 5,052
IMPUTED COST 25,622 26,764 28,238
Operator/family labor 18,427 19,358 19,854
Depreciation 1,572 1,729 1,902
Interest on operating capital 2,966 2,863 3,023
Rental value of owned land 2,657 2,814 3,459
TOTAL COSTS 101,509 103,840 108,997
GROSS RETURNS 276,359 294,182 371,039
RETURNS ABOVE CASH COST 204,353 221,216 295,332
RETURNS ABOVE CASH AND NON-CASH COSTS 200,472 217,106 290,280
NET RETURNS 174,850 190,342 262,042
NET PROFIT-COST RATIO 1.72 1.83 2.40
Cost per kilogram (peso/kg) 9.52 9.69 9.91
Yield per hectare (kg/ha) 10,662 10,717 10,997
Farmgate price (peso/kg) 25.92 27.45 33.74
R- Revised estimates.
P - Preliminary estimates
44
TABLE 18. EGGPLANT: UPDATED AVERAGE COSTS OF PRODUCTION, PHILIPPINES, 2013 - 2015
ITEM 2013 2014R 2015P
(in pesos/hectare)
CASH COST 82,560 83,576 83,619
Seeds/planting materials 1,423 1,606 1,536
Fertilizer 24,493 23,101 22,434
Pesticides 11,639 10,814 10,741
Other material inputs 23 22 21
Hired labor 18,108 19,022 19,509
Land tax 87 88 89
Rentals 3,657 4,074 3,945
Fuel and oil 3,878 3,966 3,616
Transport of inputs 887 895 895
Irrigation fee 117 132 126
Interest on crop loan 7,438 8,182 9,000
Food expenses 5,238 5,606 5,752
Repairs 2,357 2,441 2,486
Landlord's share 3,215 3,627 3,469
NON-CASH COST 3,171 3,617 3,519
Seeds/planting materials 614 693 663
Hired labor (paid in kind) 41 43 44
Landlord's share 1,146 1,293 1,237
Harvesters' share 1,258 1,462 1,454
Lease rental 112 126 121
IMPUTED COST 36,672 38,544 39,709
Operator and family labor 24,950 26,210 26,881
Exchange labor 2,019 2,121 2,175
Depreciation 4,708 5,179 5,697
Interest on operating capital 3,207 3,017 3,027
Rental value of owned land 1,788 2,017 1,929
TOTAL COSTS 122,403 125,737 126,847
GROSS RETURNS 170,220 197,867 196,741
RETURNS ABOVE CASH COST 87,660 114,291 113,122
RETURNS ABOVE CASH AND NON-CASH COSTS 84,489 110,674 109,603
NET RETURNS 47,817 72,130 69,894
NET PROFIT-COST RATIO 0.39 0.57 0.55
Cost per kilogram (peso/kg) 11.82 11.79 11.44
Yield per hectare (kg/ha) 10,354 10,661 11,084
Farmgate price (peso/kg) 16.44 18.56 17.75
R - Revised estimates
P- Preliminary estimates

45
TABLE 19. HABITCHUELAS: UPDATED AVERAGE COSTS OF PRODUCTION, PHILIPPINES, 2013 - 2015
ITEM 2013 2014R 2015P
CASH COST 43,403 42,957 43,092
Seeds/planting materials 2,804 2,827 3,126
Fertilizers 21,668 20,893 20,443
Pesticides 4,254 3,953 3,927
Hired labor 7,602 7,986 8,191
Land tax 204 206 208
Rentals 2,241 2,354 2,414
Transport of inputs 2,208 2,229 2,228
Repairs 2,422 2,509 2,555
NON-CASH COST 1,535 1,547 1,711
Seeds/planting materials 1,535 1,547 1,711
IMPUTED COST 33,883 35,285 36,710
Operator/family labor 24,977 26,238 26,910
Depreciation 2,241 2,465 2,712
Interest on operating capital 2,092 1,972 1,991
Rental value of owned land 4,573 4,610 5,097
TOTAL COSTS 78,821 79,789 81,513
GROSS RETURNS 92,926 95,883 107,062
RETURNS ABOVE CASH COST 49,523 52,926 63,970
RETURNS ABOVE CASH AND NON-CASH COSTS 47,988 51,379 62,259
NET RETURNS 14,105 16,094 25,548
NET PROFIT-COST RATIO 0.18 0.20 0.31
Cost per kilogram (peso/kg) 17.91 17.71 17.92
Yield per hectare (kg/ha) 4,402 4,506 4,550
Farmgate price (peso/kg) 21.11 21.28 23.53
R - Revised estimates
P - Preliminary estimates
( in pesos/hectare)

46
TABLE 20. WHITE POTATO: UPDATED AVERAGE COSTS OF PRODUCTION, PHILIPPINES, 2013 - 2015
ITEM 2013 2014R 2015P
CASH COST 108,520 106,181 102,261
Seeds/planting materials 19,351 17,294 13,356
Fertilizers 43,692 42,285 41,544
Pesticides 6,930 6,438 6,396
Hired labor 21,245 22,318 22,889
Land tax 612 618 624
Rentals 953 1,001 1,027
Transport of inputs 6,485 6,547 6,544
Food expense 2,796 2,993 3,071
Repairs 6,456 6,687 6,810
NON-CASH COST 10,760 9,616 7,426
Seeds/planting materials 10,760 9,616 7,426
IMPUTED COST 53,868 52,731 49,171
Operator/family labor 21,111 22,177 22,745
Depreciation 5,284 5,812 6,393
Interest on operating capital 5,254 4,885 4,698
Rental value of owned land 22,219 19,857 15,335
TOTAL COSTS 173,148 168,528 158,858
GROSS RETURNS 458,939 416,281 320,722
RETURNS ABOVE CASH COST 350,419 310,100 218,461
RETURNS ABOVE CASH AND NON-CASH COSTS 339,659 300,484 211,035
NET RETURNS 285,791 247,753 161,864
NET PROFIT-COST RATIO 1.65 1.47 1.02
Cost per kilogram (peso/kg) 11.61 11.13 10.52
Yield per hectare (kg/ha) 14,920 15,143 15,107
Farmgate price (peso/kg) 30.76 27.49 21.23
R - Revised estimates
P - Preliminary estimates
( in pesos/hectare)

47
TABLE 21. STRINGBEANS: UPDATED AVERAGE COSTS OF PRODUCTION, PHILIPPINES, 2013 - 2015
ITEM 2013R 2014R 2015P
CASH COSTS 68,481 68,469 69,053
Seeds 3,973 4,176 4,624
Fertilizer 12,343 11,768 11,481
Pesticides 17,174 15,957 15,850
Other Material Inputs 384 366 357
Hired labor 11,867 12,466 12,785
Land tax 486 491 496
Rentals 3,893 4,091 4,448
Fuel and oil 5,826 6,001 5,472
Transport of inputs 1,791 1,808 1,807
Irrigation fee 164 172 190
Interest on crop loan 1,971 2,168 2,385
Food expenses 1,550 1,659 1,702
Repairs 990 1,025 1,044
Wages for overseer 276 290 297
Other costs 5,793 6,031 6,115
NON-CASH COSTS 2,991 3,142 3,472
Seeds 2,812 2,955 3,272
Hired labor (in kind) 85 89 91
Landlord's share 19 20 22
Harvester's share 33 34 38
Lease Rental 42 44 49
IMPUTED COSTS 63,635 66,981 69,896
Operator/family labor 46,991 49,364 50,628
Exchange labor 501 526 539
Depreciation 8,577 9,435 10,379
Interest on operating capital 2,635 2,474 2,612
Rental value of owned land 4,931 5,182 5,738
TOTAL COSTS 135,107 138,592 142,421
GROSS RETURNS 400,639 408,788 453,399
RETURNS ABOVE CASH COSTS 332,158 340,319 384,346
RETURNS ABOVE CASH & NON-CASH COSTS 329,167 337,177 380,874
NET RETURNS 265,532 270,196 310,978
NET PROFIT- COST RATIO 1.97 1.95 2.18
Cost per kilogram (peso/kg) 7.15 7.55 7.75
Yield per hectare (kg/ha) 18,907 18,356 18,386
Farmgate price (peso/kg) 21.19 22.27 24.66
R - Revised estimates
P-Preliminary estimates
(in pesos/hectare)

48
TABLE 22. TOMATO: UPDATED AVERAGE COSTS OF PRODUCTION, PHILIPPINES, 2013 - 2015
ITEM 2013 2014R 2015P
CASH COST 69,876 70,008 70,429
Seeds/planting materials 1,118 954 1,137
Fertilizer 23,955 22,814 22,154
Pesticides 8,946 8,950 8,890
Hired labor 22,694 23,841 24,451
Land tax 166 168 170
Rentals 1,943 1,740 2,000
Fuel and oil 1,718 1,770 1,614
Transport of inputs 656 662 662
Irrigation fee 36 31 37
Interest on crop loan 576 634 697
Food expenses 2,437 2,608 2,676
Repairs 5,031 5,211 5,307
Other costs 600 625 634
NON-CASH COST 3,283 2,841 3,360
Seeds/planting materials 590 503 600
Hired labor ( paid in kind) 177 186 191
Landlord's share 1,076 918 1,094
Harvesters' share 98 89 110
Lease rental 1,342 1,145 1,365
IMPUTED COST 17,055 17,582 18,468
Operator and family labor 8,311 8,731 8,955
Exchange labor 399 419 430
Depreciation 3,939 4,333 4,766
Interest on operating capital 3,267 3,128 3,160
Rental value of owned land 1,139 971 1,157
TOTAL COSTS 90,214 90,431 92,257
GROSS RETURNS 181,021 164,176 202,877
RETURNS ABOVE CASH COST 111,145 94,168 132,448
RETURNS ABOVE CASH AND NON-CASH COSTS 107,862 91,327 129,088
NET RETURNS 90,807 73,745 110,620
NET PROFIT-COST RATIO 1.01 0.82 1.20
Cost per kilogram (peso/kg) 7.49 7.06 6.94
Yield per hectare (kg/ha) 12,052 12,816 13,286
Farmgate price (peso/kg) 15.02 12.81 15.27
R - Revised estimates
P - Preliminary estimates
(in pesos/hectare)

49
LEGUMES
50
0
20
40
60
80
100
120
140
160
Mongo Peanut
137
105
158
106
(in percent)
Figure 6. Returns on Investment (ROI) of Selected Legumes, Philippines
2014
2015

51
TABLE 23. MONGO: UPDATED AVERAGE COSTS OF PRODUCTION, PHILIPPINES, 2013 - 2015
ITEM 2013 2014R 2015P
CASH COST 6,502 6,765 6,932
Seeds/planting materials 857 935 984
Fertilizers 90 81 77
Pesticides 708 657 653
Hired labor 2,257 2,371 2,432
Land tax 142 143 144
Rentals 509 535 549
Fuel and oil 198 204 186
Irrigation fee 45 49 52
Interest on crop loan 349 384 422
Transport cost of inputs 54 55 55
Food expense 323 346 355
Repairs 970 1,005 1,023
NON-CASH COST 2,695 2,945 3,225
Seeds/planting materials 827 902 949
Hired labor paid in kind 56 59 61
Landlord's share 512 558 587
Harvester's share 1,294 1,419 1,621
Irrigation fee 6 7 7
IMPUTED COST 6,834 7,320 7,733
Operator/family labor 3,296 3,462 3,551
Exchange labor 57 60 62
Depreciation 2,435 2,679 2,947
Interest on operating capital 225 224 231
Rental value of owned land 821 895 942
TOTAL COSTS 16,031 17,030 17,890
GROSS RETURNS 36,850 40,399 46,162
RETURNS ABOVE CASH COST 30,348 33,634 39,230
RETURNS ABOVE CASH AND NON-CASH COSTS 27,653 30,689 36,005
NET RETURNS 20,819 23,370 28,272
NET PROFIT-COST RATIO 1.30 1.37 1.58
Cost per kilogram (peso/kg) 21.55 22.77 22.03
Yield per hectare (kg/ha) 744 748 812
Farmgate price (peso/kg) 49.53 54.01 56.85
R- Revised estimates
P- Preliminary estimates
(in pesos/hectare)

52
TABLE 24. PEANUT: UPDATED AVERAGE COSTS OF PRODUCTION, PHILIPPINES, 2013 - 2015
ITEM 2013 2014R 2015P
CASH COST 16,849 17,621 18,173
Seeds/planting materials 1,850 1,928 2,101
Fertilizers 605 581 569
Pesticides 36 36 36
Hired labor 10,619 11,155 11,441
Land tax 225 227 229
Rentals 564 590 629
Fuel and oil 335 345 315
Irrigation fee 66 69 75
Interest on crop loan 371 408 449
Transport cost of inputs 169 171 171
Food expense 880 942 967
Repairs 1,129 1,169 1,191
NON-CASH COST 3,562 3,730 4,036
Seeds/planting materials 2,137 2,227 2,426
Hired labor paid in kind 65 68 70
Landlord's share 802 836 911
Harvester's share 558 599 629
IMPUTED COST 9,129 9,642 10,174
Operator/family labor 4,572 4,803 4,926
Exchange labor 172 181 186
Depreciation 2,033 2,236 2,460
Interest on operating capital 755 758 789
Rental value of owned land 1,597 1,664 1,813
TOTAL COSTS 29,540 30,993 32,383
GROSS RETURNS 59,230 63,614 66,788
RETURNS ABOVE CASH COST 42,381 45,993 48,615
RETURNS ABOVE CASH AND NON-CASH COSTS 38,819 42,263 44,579
NET RETURNS 29,690 32,621 34,405
NET PROFIT-COST RATIO 1.01 1.05 1.06
Cost per kilogram (peso/kg) 17.86 18.18 19.71
Yield per hectare (kg/ha)* 1,654 1,705 1,643
Farmgate price (peso/kg) 35.81 37.31 40.65
R - Revised estimates.
P - Preliminary estimates
* Average of top two (2) producing provinces.
(in pesos/hectare)
53
COMMERCIAL CROP

54
48
50
52
54
56
58
60
62
Coffee
53
62
(in percent)
Figure 7. Returns on Investment (ROI) of Selected Commercial Crop, Philippines
2014
2015

55
TABLE 25. COFFEE: UPDATED AVERAGE COSTS OF PRODUCTION, PHILIPPINES, 2013 - 2015*
ITEM 2,013 2014R 2015P
CASH COST 21,027 21,419 21,655
Fertilizer 5,542 5,158 4,970
Pesticides 162 162 161
Hired labor 12,177 12,792 13,119
Land tax 644 650 657
Rentals 47 49 52
Fuel and oil 266 274 250
Transport of inputs 175 177 177
Interest on crop loan 747 822 904
Food expenses 668 715 734
Repairs 599 620 631
NON-CASH COST 1,059 1,071 1,144
Hired labor (paid in kind) 225 236 242
Landlord's share 22 23 25
Harvesters' share 587 579 624
Lease rental 225 233 253
IMPUTED COST 8,241 8,572 8,928
Operator and family labor 4,930 5,179 5,312
Exchange labor 115 121 124
Depreciation 360 396 436
Interest on operating capital 1,030 1,002 1,018
Rental value of owned land 1,806 1,874 2,038
ALL COSTS 30,327 31,062 31,727
GROSS RETURNS 48,290 47,649 51,344
RETURNS ABOVE CASH COST 27,263 26,230 29,689
RETURNS ABOVE CASH AND NON-CASH COSTS 26,204 25,159 28,545
NET RETURNS 17,963 16,588 19,617
NET PROFIT-COST RATIO 0.59 0.53 0.62
Cost per kilogram (peso/kg) 44.93 48.38 49.89
Yield per hectare (kg/ha) 675 642 636
Farmgate price (peso/kg) 71.54 74.22 80.73
* - Refers to maintenance costs only
R - Revised estimates
P - Preliminary estimates
(in pesos/hectare)

56
FISHERIES

57
0
20
40
60
80
100
120
140
Milkfish Tilapia
129
71
127
59
(in percent)
Figure 8. Returns on Investment (ROI) of Selected Fisheries, Philippines
2014
2015

58
Table 26. MILKFISH (BRACKISH FISHPOND): UPDATED AVERAGE COSTS OF PRODUCTION, PHILIPPINES, 2013 - 2015
ITEM2013 2014R 2015P
CASH COSTS 28,349 29,381 30,145
Stocking materials 10,717 11,345 12,012
Feeds 4,039 4,204 4,263
Fertilizers 2,603 2,465 2,373
Pesticides and other chemicals 421 447 444
Hired Labor 3,329 3,497 3,587
Salaries of permanent employees 2,358 2,477 2,540
Land tax 397 401 405
Rentals 3,239 3,253 3,261
Fuel and oil 366 377 344
Transport cost of inputs 155 156 156
License/permit 6 6 6
Electricity 180 184 168
Interest payment on loan 50 55 61
Food expense 195 209 214
Repairs 248 257 262
Other costs 46 48 49
NON-CASH COSTS 645 682 693
Harvesters' share 240 250 254
Caretakers' share 141 147 149
Other laborers' share 71 73 73
Administrator's share 45 47 48
Lease rental 6 6 6
Rice allowance of overseer 142 159 163
IMPUTED COSTS 7,787 8,069 8,249
Operator labor 155 163 167
Family labor 108 113 116
Exchange labor 4 4 4
Depreciation 1,315 1,447 1,592
Interest on operating capital 1,321 1,321 1,376
Rental value of owned fishpond 4,884 5,021 4,994
TOTAL COSTS 36,781 38,132 39,087
GROSS RETURNS 83,919 87,265 88,594
RETURNS ABOVE CASH COSTS 55,570 57,884 58,449
RETURNS ABOVE CASH AND NON-CASH COSTS 54,925 57,202 57,756
NET RETURNS 47,138 49,133 49,507
NET PROFIT-COST RATIO 1.28 1.29 1.27
Cost per kilogram (peso/kg) 38.43 39.39 39.56
Yield per hectare (kg/ha) 957 968 988
Farmgate price (peso/kg) 87.69 90.15 89.67
R - Revised estimates
P- Preliminary estimates
(in pesos/hectare)

59
TABLE 27. TILAPIA: UPDATED AVERAGE COSTS OF PRODUCTION, PHILIPPINES, 2013 - 2015
ITEM 2013 2014R 2015P
CASH COSTS 213,622 223,234 228,156
Stocking materials 34,538 37,194 40,173
Feeds 145,079 151,027 153,141
Fertilizers 1,708 1,586 1,529
Pesticides 2,099 2,099 2,084
Hired Labor 6,772 7,114 7,296
Salaries of permanent employees 961 1,010 1,036
Wage of stay-in laborer 5,618 5,902 6,053
Land tax 174 176 178
Rentals 4,541 4,547 4,549
Fuel and oil 6,498 6,693 6,103
Transport cost of inputs 776 783 783
License/permit 7 7 7
Electricity 138 141 129
Interest payment on loan 411 452 497
Food expense 1,379 1,476 1,515
Repairs 2,887 2,990 3,045
Other costs 36 37 38
NON-CASH COSTS 2,221 2,318 2,310
Stocking materials 302 325 351
Feeds 88 92 93
Fertilizers 18 17 16
Hired Labor (in kind) 225 236 242
Harvesters' share 576 588 556
Caretaker's share 35 37 37
Wage of stay-in laborer 468 490 486
Other laborers' share 416 436 433
Lease rental 70 73 72
Other costs 23 24 24
IMPUTED COSTS 30,156 31,345 32,238
Stocking materials 319 344 372
Feeds 139 145 147
Fertilizers 1 1 1
Operator labor 2,002 2,103 2,157
Family labor 633 665 682
Exchange labor 2 2 2
Depreciation 4,404 4,844 5,328
Interest on operating capital 11,334 11,388 11,791
Rental value of owned aquafarm 11,322 11,853 11,758
TOTAL COSTS 245,999 256,897 262,704
GROSS RETURNS 431,356 440,358 416,653
RETURNS ABOVE CASH COSTS 217,734 217,124 188,497
RETURNS ABOVE CASH AND NON-CASH COSTS 215,513 214,806 186,187
NET RETURNS 185,357 183,461 153,949
NET PROFIT-COST RATIO 0.75 0.71 0.59
Cost per kilogram (peso/kg) 40.76 43.65 46.80
Yield per hectare (kg/ha) 6,035 5,885 5,613
Farmgate price (peso/kg) 71.48 74.83 74.23
R - Revised estimates
P - Preliminary estimates
(in pesos/hectare)

UPDATED COSTS OF PRODUCTION OF SELECTED AGRICULTURAL
COMMODITIES 2013-2015
PHILIPPINE STATISTICS AUTHORITY
LISA GRACE S. BERSALES Ph. D.
National Statistician and Civil Registrar General
ROMEO S. RECIDE
Deputy National Statistician
Sectoral Statistics Office
VIVIAN R. ILARINA
Assistant National Statistician
Macroeconomic Accounts Service
AGRICULTURAL ACCOUNTS DIVISION
MARIA CAROL G. DURAN
Officer-in-Charge
CYNTHIA P. DONATO
Supervising Statistical Specialist
MANUELA S. NALUGON
Senior Statistical Specialist
JOSEPH C. EVANGELISTA
Technical Staff
JOYNABEL S. PARAGUISON
Technical Staff