updated statistical analysis of documentation of killings … statistical analysis of documentation...
TRANSCRIPT

Updated Statistical Analysis of Documentation of Killingsin the Syrian Arab Republic
Commissioned bythe Office of the UN High Commissioner for Human Rights
Megan Price, Anita Gohdes, and Patrick Ball∗
August 2014
∗The authors are deeply indebted to Michelle Dukich, Christopher Dukich, Ashraf Kheir, MazinAbdelrahman Mohamed, Tayseer Mohammed Osman, and Anas Qtiesh for their invaluable review ofrecords. The authors also thank Jeff Klingner and Scott Weikart for their web scraping and recordlinkage and machine learning programming.
Executive Summary
This report presents findings on documented conflict-related killings in the Syrian ArabRepublic (Syria) between March 2011 and April 2014. This report is an update of workpublished in June 2013. The previous report presented an enumeration of reportedkillings between March 2011 and April 2013. The numbers presented in this report arebased on the integration of information collected by multiple sources, including Syrianhuman rights groups and the Government of the Syrian Arab Republic. Althoughongoing conflict conditions make the collection of accurate records of violent eventsdifficult, different actors are continuing to gather information about killings through avariety of local sources and data collection methods.
The purpose of this report is to update previous quantitative assessments of thecurrent documentation of violence in Syria. The previous report and this updated anal-ysis both include three sources that cover the entire period under investigation: theSyrian Center for Statistics and Research, the Syrian Network for Human Rights, andthe Violations Documentation Centre. The remaining two sources—the Syrian Gov-ernment and the Syrian Observatory for Human Rights—cover a subset of that period.Records from the Syrian Government only cover the period from March 2011 throughMarch 2012 and records from the Syrian Observatory for Human Rights only coverfrom March 2011 through April 2013. The records from the Syrian Center for Statisticsand Research, the Syrian Network for Human Rights, and the Violations Documenta-tion Centre reflect all further processing, verification, cross checking, and modificationthat these groups have conducted since the beginning of the conflict. Records fromthe Syrian Government and the Syrian Observatory for Human Rights included in thisreport are the same records provided in 2012 and 2013 and do not reflect any updateseither of these groups may have made to their own databases.1 The Office of the HighCommissioner for Human Rights requested information from the Syrian Government inSeptember 2013 and April 2014. No response was received at the time of publication.The Syrian Observatory for Human Rights declined to share an updated list in early2014. Hereafter this collection of data will be referred to as the five sources on whichthis report is based.
The report considers documented killings that are fully identified by the name ofthe victim, as well as the date and location of death. Reported killings that are missingany of this information were excluded from this study. This report finds that when thefully identified records from four documentation groups plus the Syrian Governmentwere combined and duplicates identified, these five databases identified 191 369 uniquekillings.2 The integrated list of killings is called an enumeration.
We highlight four observations about patterns among the documented killings:
• Sex of the Victims: Of the 191 369 documented killings in this report, 85.1% aremale, 9.3% are female, and 5.6% of records do not indicate the sex of the victim.
• Age of the Victims: Age is unknown for 83.8% of all records, which makes itimpossible to draw conclusions about the overall distribution of the age of victims.However, the full enumeration does include 2165 records of victims 0-9 years old,
1See Section 1 and Appendix A for further details describing what is and is not included in therecords analyzed in this report.
2All numbers in this report are formatted according to the International Standards Organization31-0. The thousands separator is a small space and is used for numbers of more than four digits, andthe decimal is marked by a point.
1
and 6638 records of victims 10-18 years old.
• Location of Killing : The three comprehensive non-governmental sources includedin this report (the Syrian Center for Statistics and Research, the Syrian Networkfor Human Rights, and the Violations Documentation Centre) all record morekillings in Rural Damascus than in other governorates.3
• Combatant and Non-Combatant Status: the status of the victims as combatants ornon-combatants is unknown for all but a few records, and consequently, combatantstatus is not assessed in this report.
The enumeration is not the complete number of conflict-related killings in Syria. Theenumeration may be a slight overcount of the number of the fully identified, reportedkillings, while at the same time the enumeration is likely undercounting the true totalnumber of conflict-related killings that have occurred during this time period. Thisis because an unknown number of conflict-related killings are likely to have occurredwithout being documented by the sources used in this report. Therefore, the truetotal number of conflict-related killings must include both documented killings (thoseenumerated in this report) and undocumented killings, which must be estimated usingstatistical models.
The enumeration may be a slight overcount of identified reported killings due to twofactors. First, the enumeration may include a small number of undetected duplicatesamong the unique killings, despite human efforts and computer modeling. Second, itmay include records that are inaccurate in some sense, for example, records that describedeaths that were not conflict-related, or victims presumed dead who were later foundto be alive.4 Only a few examples of such records (fewer than 1000) have been sharedwith HRDAG so far. Both of these factors may slightly inflate the current enumeration.
However, based on experience in similar contexts, HRDAG believes that many morekillings remain undocumented, and that statistical models could be used to estimatethe probable number of undocumented killings.5 The total 191 369 can be understoodas a minimum bound of the number of killings between March 2011 and April 2014.
Report Organization
Section 1 provides a summary of documented killings in the Syrian Arab Republic be-tween March 2011 and April 2014 and a brief description of the data sources. Sections 2and 6 detail what is and is not included in these analyses and what can and cannotbe concluded from them. Section 3 briefly describes how these five datasets were com-pared and integrated. A detailed analysis of how the datasets overlap with each other ispresented in Section 4; the overlap analysis helps explain how the various data sourceseach capture distinct aspects of the total universe of killings. A comparative statisticalanalysis of all five datasets is presented in Section 5, including patterns of documentedkillings over time, as well as by geography, sex and age of the victims. Appendix Abriefly describes each of the data sources and discusses concerns regarding potentially
3Records from the Syrian Government, which cover the period from March 2011 through March2012, record the highest number of killings in Homs. The Syrian Observatory for Human Rights, withrecords from March 2011 through April 2013, records the highest number of killings in Rural Damascus.
4For more discussion of potentially inaccurate records, see Appendix A.3.5HRDAG team members have analyzed documented killings and estimated undocumented killings
in Guatemala, Kosovo, Perú, Timor-Leste, and Colombia. See the HRDAG publications page. For adiscussion of the relevant methods, see HRDAG’s page describing multiple systems estimation.
2
inaccurate records. Lastly, Appendices B and C provide technical and methodologicaldetail.
1 Background
This report presents an analysis of killings that have been documented in the SyrianArab Republic (Syria) between March 2011 and April 2014, based on five datasets.Based on a comparison of records from these five sources, HRDAG found a total of191 369 unique records of documented killings. Importantly, this enumeration shouldnot be inferred to include only civilian victims. The status of the victims as combatantsor non-combatants is unknown for all but a few records, but both statuses are reported.Therefore, collectively the data sources include records of both combatants and non-combatants.
The analysis in this report updates two previous reports, released on 2 January 2013and 13 June 2013. The most recent report, published on 13 June 2013, described 92 901records of killings from March 2011 through April 2013.
It is important to note that the two previous reports integrated records from eightdifferent sources. In the year since those publications, the conflict continues and thesedocumentation efforts have evolved. Some organizations have stopped collecting data,while others have stopped sharing their data with this project.
This report presents results based on five sources (listed below). These sources werechosen as the basis for these analyses for two reasons. First, the four Syrian humanrights groups (the Syrian Center for Statistics and Research, the Syrian Observatory forHuman Rights, the Syrian Network for Human Rights, and the Violations Documen-tation Centre) have participated in a workshop on 27 and 28 February 2014 organizedby OHCHR and the Euro-Mediterranean Human Rights Network, where OHCHR andHRDAG learned more about their data collection and verification methodology. Sec-ond, records from the Syrian Government are included since these are considered to bea valuable resource and to reflect a very different kind of knowledge about the conflictthan that available to Syrian human rights groups.
For brevity, each list will be referred to by its acronym in the tables and figuresthroughout this report. It should be noted that each data collection organization de-termines their own methods for data gathering and verification. Further detail abouteach group is listed in Appendix A.1.
1. GoSY: the Syrian Government6
2. CSR-SY: the Syrian Center for Statistics and Research7
3. SNHR: the Syrian Network for Human Rights8,9
6Throughout the report, counts of records from GoSY are highlighted with an asterisk * as areminder that GoSY records only cover the period March 2011 through March 2012.
7http://csr-sy.org/8http://sn4hr.org/9In previous reports we combined records from the Syrian Revolution General Council (SRGC) with
SNHR. After speaking with the founder and head of SNHR, it is clear that this was incorrect and thesetwo sources are no longer being combined. This report includes only records from SNHR and does notinclude any records from SRGC.
3
4. SOHR: the Syrian Observatory for Human Rights10,11
5. VDC: the Violations Documentation Centre12
It should also be noted that three of these sources (CSR-SY, SNHR, and VDC) coverthe entire period reported here (March 2011 through April 2014) whereas the remainingtwo sources cover a subset of that period. As summarized in Table 1, records from theSyrian Government only cover the period from March 2011 through March 2012 andSOHR records only cover from March 2011 through April 2013. Additionally, updatedrecords from CSR-SY, SNHR, and VDC reflect all further processing, verification, cross-checking, and modification that these groups have conducted since the beginning of theconflict. Records from SOHR and GoSY included in this report are the same recordsprovided in 2012 and 2013 and do not reflect any updates either of these groups mayhave made to their own databases.
Table 1: Time Period Covered by Each SourceDataset Period CoveredGoSY March 2011–March 2012CSR-SY March 2011–April 2014SNHR March 2011–April 2014SOHR March 2011–April 2013VDC March 2011–April 2014
2 What These Analyses Do and Do Not Include
The first step in this analysis involves semi-automated examination of each individualrecord in each dataset in order to identify multiple records that refer to the samedeath. Sometimes these records occur within a single dataset (duplicate records) andother times they occur in multiple datasets (matched records). See Appendix C for adescription of this process.
This comparison of records is only possible for records with sufficient identifyinginformation, including the name of the victim, plus the date and location of death.13
Each dataset considered in this study included a number of records which lacked thisinformation. Table 2 lists the number of records from each dataset included in theanalyses presented in this report (those with sufficient identifying information) and thenumber of records excluded from these analyses (those lacking sufficient identifyinginformation). It is important to note that, as described above, records from two sourcesdo not cover the entire period under study in this report. Therefore for GoSY andSOHR, the numbers presented in Table 2 do not represent the full set of records collectedby these sources.
10www.syriahr.com, www.syriahr.net11Throughout the report, counts of records from SOHR are highlighted with an asterisk * as a
reminder that SOHR provided records only through April 2013.12http://www.vdc-sy.org/13Ideally, records included an unambiguous governorate of death. In some cases location was inferred
from other information included in the record. Complete details of this and other data processing canbe found in Appendix B.
4
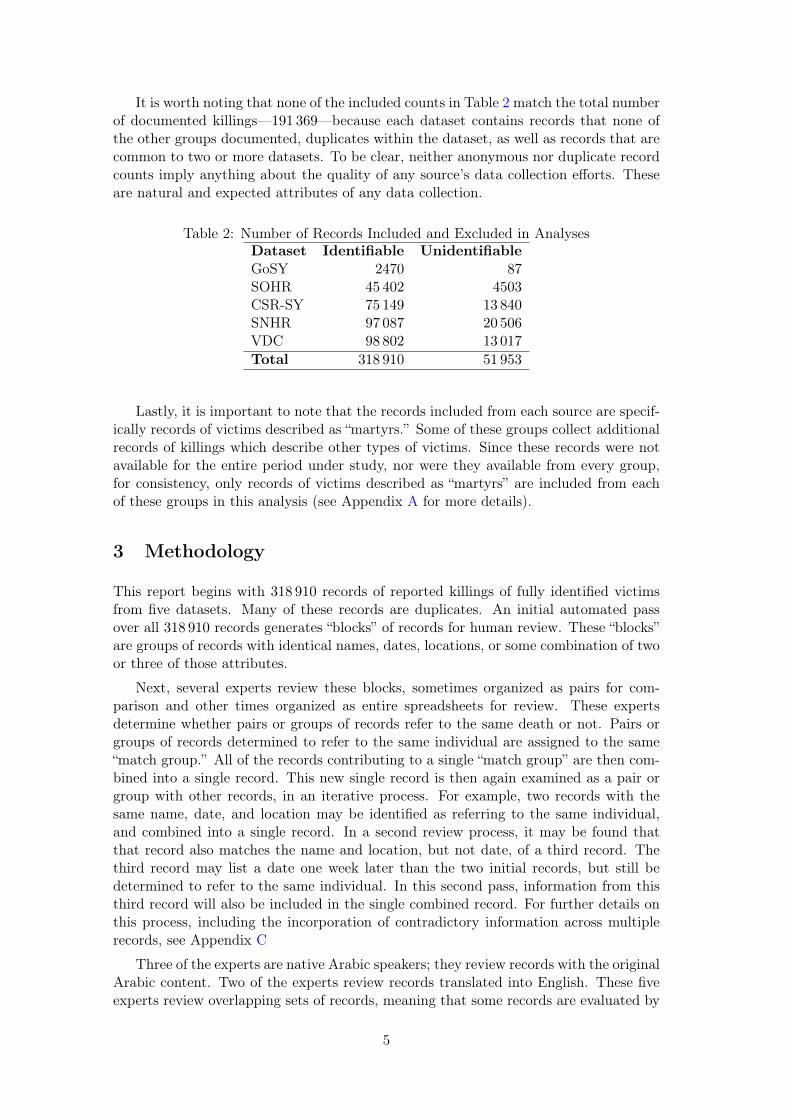
It is worth noting that none of the included counts in Table 2 match the total numberof documented killings—191 369—because each dataset contains records that none ofthe other groups documented, duplicates within the dataset, as well as records that arecommon to two or more datasets. To be clear, neither anonymous nor duplicate recordcounts imply anything about the quality of any source’s data collection efforts. Theseare natural and expected attributes of any data collection.
Table 2: Number of Records Included and Excluded in AnalysesDataset Identifiable UnidentifiableGoSY 2470 87SOHR 45 402 4503CSR-SY 75 149 13 840SNHR 97 087 20 506VDC 98 802 13 017
Total 318 910 51 953
Lastly, it is important to note that the records included from each source are specif-ically records of victims described as “martyrs.” Some of these groups collect additionalrecords of killings which describe other types of victims. Since these records were notavailable for the entire period under study, nor were they available from every group,for consistency, only records of victims described as “martyrs” are included from eachof these groups in this analysis (see Appendix A for more details).
3 Methodology
This report begins with 318 910 records of reported killings of fully identified victimsfrom five datasets. Many of these records are duplicates. An initial automated passover all 318 910 records generates “blocks” of records for human review. These “blocks”are groups of records with identical names, dates, locations, or some combination of twoor three of those attributes.
Next, several experts review these blocks, sometimes organized as pairs for com-parison and other times organized as entire spreadsheets for review. These expertsdetermine whether pairs or groups of records refer to the same death or not. Pairs orgroups of records determined to refer to the same individual are assigned to the same“match group.” All of the records contributing to a single “match group” are then com-bined into a single record. This new single record is then again examined as a pair orgroup with other records, in an iterative process. For example, two records with thesame name, date, and location may be identified as referring to the same individual,and combined into a single record. In a second review process, it may be found thatthat record also matches the name and location, but not date, of a third record. Thethird record may list a date one week later than the two initial records, but still bedetermined to refer to the same individual. In this second pass, information from thisthird record will also be included in the single combined record. For further details onthis process, including the incorporation of contradictory information across multiplerecords, see Appendix C
Three of the experts are native Arabic speakers; they review records with the originalArabic content. Two of the experts review records translated into English. These fiveexperts review overlapping sets of records, meaning that some records are evaluated by
5
two, three, four, or all five of the experts. This makes it possible to check the consistencyof the reviewers, to ensure that they are each reaching comparable decisions regardingwhether two (or more) records refer to the same individual or not. Formally, this processis referred to as inter-rater reliability, and is described further in Appendix C.1.
4 Documentation Patterns
Despite the enormous efforts by the data collecting groups, many killings in Syria arestill undocumented. One way to imagine that is to consider that in any particularmonth, some killings are documented by four groups, other killings are documented bythree groups, others by two groups, and some killings are reported by only one group.The question this observation raises is: how many killings are reported by zero groups?
The answer to this question requires statistical modeling and is beyond the scope ofthis report. Figure 1 provides a way to visualize the intensity of reporting by examiningthe killings documented by the four Syrian human rights groups (CSR-SY, SNHR,SOHR, and VDC).
Note the grey shading in Figure 1, indicating the period from May 2013 throughApril 2014, when the most number of sources available is three, since SOHR records atour disposal end in April 2013.
To interpret the graph, compare July 2013 to August 2013. Both months haveroughly comparable numbers of killings recorded by two or three sources (the two darkershades at the bottom of each bar). But there are a notably larger number of killingsin August documented by just a single source. Closer examination of these particularrecords may provide further context - were they all documented by the same source?In the same governorate? The key observation from Figure 1 is that in all months, atleast some killings are reported by only one group as shown by the light pink part atthe top of each bar.
Reframing the question posed above, how many new killings might be found if weincluded records from a fifth group? Then a sixth, seventh, eighth, etc., group? Thisis what modeling can answer, estimating the total number of deaths likely to haveoccurred, starting from those that have been documented and adding the number notyet documented.
It should also be noted that this documentation pattern, aggregated across the entirecountry, changes dramatically when broken down by geographic area. As one example,consider Figure 2 which shows the number of records documented by number of sourceswithin the governorate of Tartus. This pattern differs substantially from the pattern inFigure 1. In particular, the vast majority of killings in Tartus appear to be documentedby a single source (the majority of each bar in Figure 2 consists of the lightest pinkportion, indicating one source). One exception to this pattern are killings during themonth of May 2013. We will return to this observation in the following section.
6
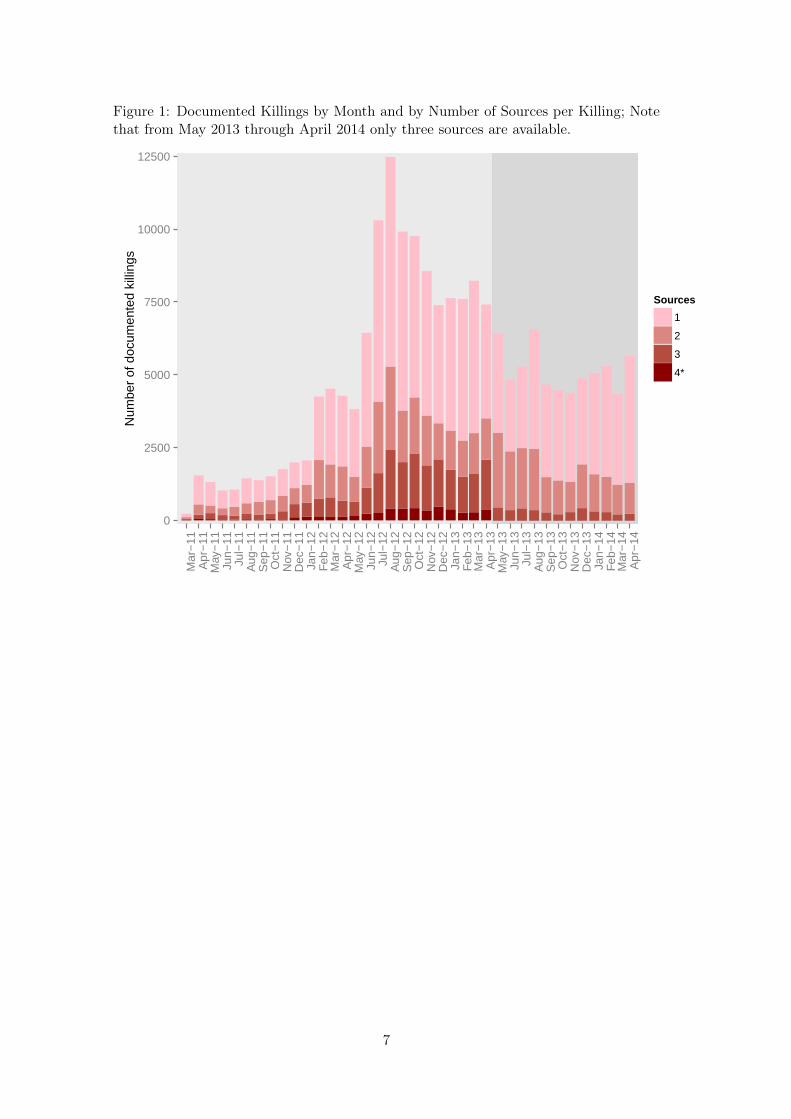
Figure 1: Documented Killings by Month and by Number of Sources per Killing; Notethat from May 2013 through April 2014 only three sources are available.
0
2500
5000
7500
10000
12500
Mar
−11
Apr
−11
May
−11
Jun−
11Ju
l−11
Aug
−11
Sep
−11
Oct
−11
Nov
−11
Dec
−11
Jan−
12F
eb−
12M
ar−
12A
pr−
12M
ay−
12Ju
n−12
Jul−
12A
ug−
12S
ep−
12O
ct−
12N
ov−
12D
ec−
12Ja
n−13
Feb
−13
Mar
−13
Apr
−13
May
−13
Jun−
13Ju
l−13
Aug
−13
Sep
−13
Oct
−13
Nov
−13
Dec
−13
Jan−
14F
eb−
14M
ar−
14A
pr−
14
Num
ber
of d
ocum
ente
d ki
lling
s
Sources
1
2
3
4*
7
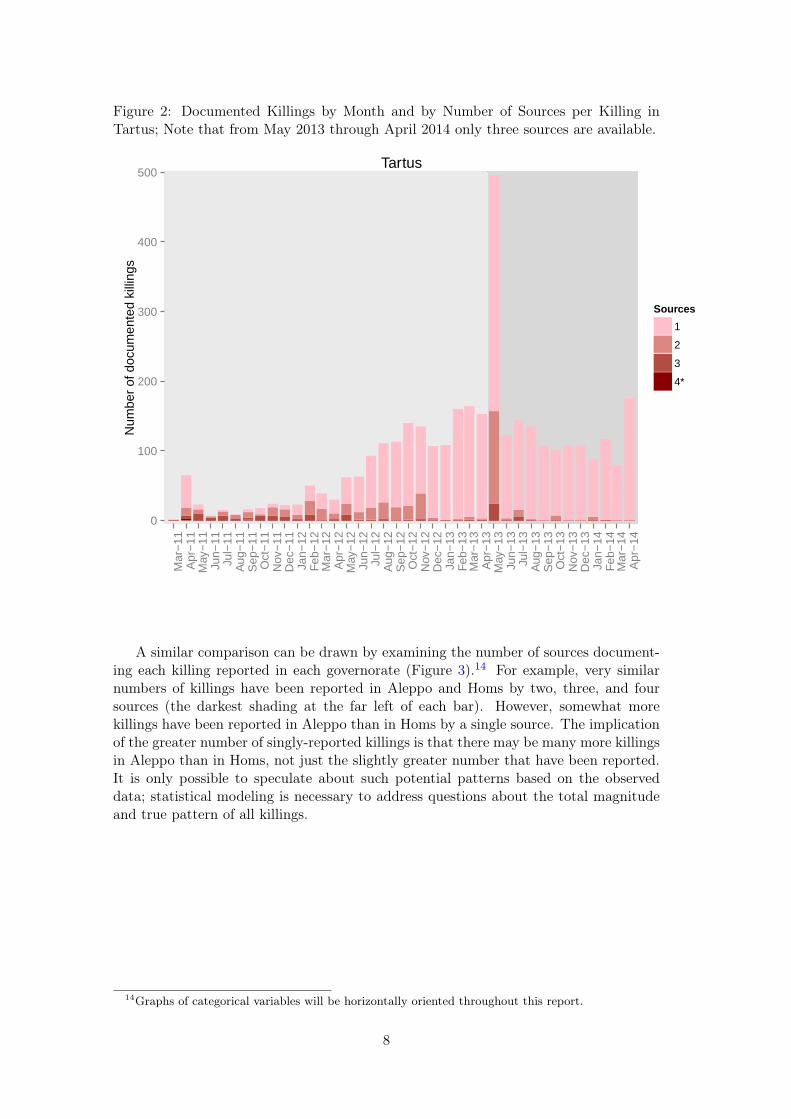
Figure 2: Documented Killings by Month and by Number of Sources per Killing inTartus; Note that from May 2013 through April 2014 only three sources are available.
0
100
200
300
400
500M
ar−
11A
pr−
11M
ay−
11Ju
n−11
Jul−
11A
ug−
11S
ep−
11O
ct−
11N
ov−
11D
ec−
11Ja
n−12
Feb
−12
Mar
−12
Apr
−12
May
−12
Jun−
12Ju
l−12
Aug
−12
Sep
−12
Oct
−12
Nov
−12
Dec
−12
Jan−
13F
eb−
13M
ar−
13A
pr−
13M
ay−
13Ju
n−13
Jul−
13A
ug−
13S
ep−
13O
ct−
13N
ov−
13D
ec−
13Ja
n−14
Feb
−14
Mar
−14
Apr
−14
Num
ber
of d
ocum
ente
d ki
lling
s
Sources
1
2
3
4*
Tartus
A similar comparison can be drawn by examining the number of sources document-ing each killing reported in each governorate (Figure 3).14 For example, very similarnumbers of killings have been reported in Aleppo and Homs by two, three, and foursources (the darkest shading at the far left of each bar). However, somewhat morekillings have been reported in Aleppo than in Homs by a single source. The implicationof the greater number of singly-reported killings is that there may be many more killingsin Aleppo than in Homs, not just the slightly greater number that have been reported.It is only possible to speculate about such potential patterns based on the observeddata; statistical modeling is necessary to address questions about the total magnitudeand true pattern of all killings.
14Graphs of categorical variables will be horizontally oriented throughout this report.
8
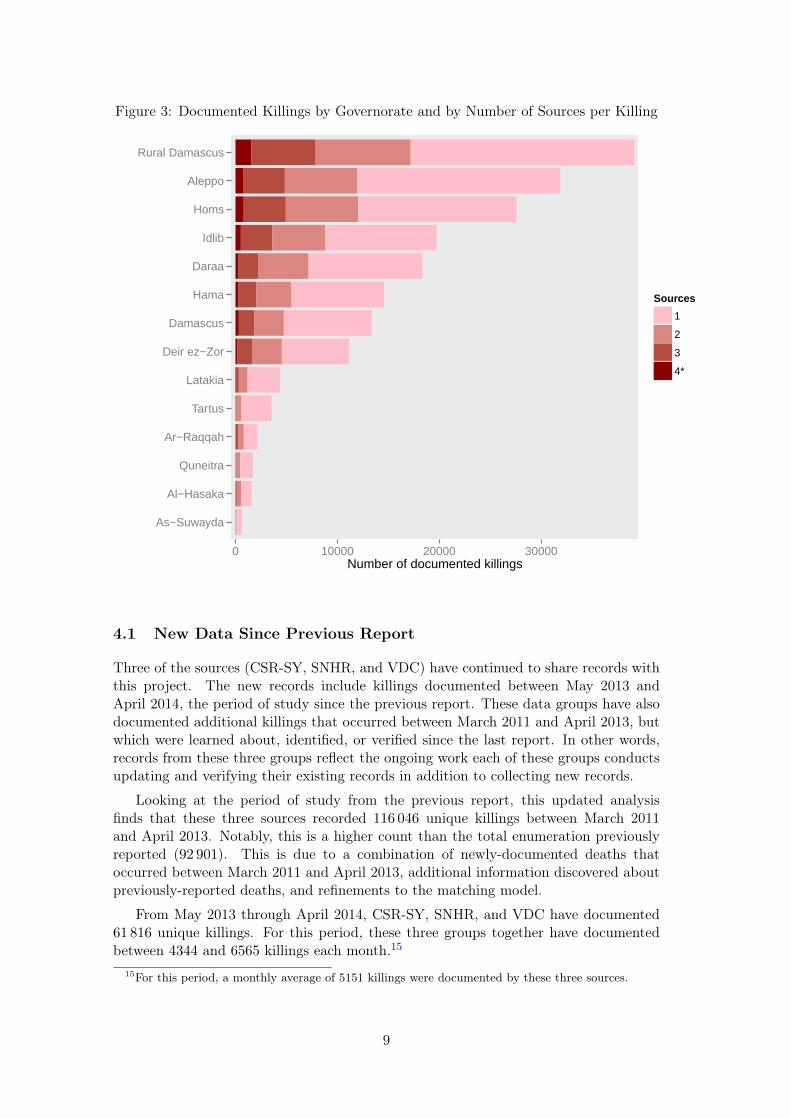
Figure 3: Documented Killings by Governorate and by Number of Sources per Killing
As−Suwayda
Al−Hasaka
Quneitra
Ar−Raqqah
Tartus
Latakia
Deir ez−Zor
Damascus
Hama
Daraa
Idlib
Homs
Aleppo
Rural Damascus
0 10000 20000 30000Number of documented killings
Sources
1
2
3
4*
4.1 New Data Since Previous Report
Three of the sources (CSR-SY, SNHR, and VDC) have continued to share records withthis project. The new records include killings documented between May 2013 andApril 2014, the period of study since the previous report. These data groups have alsodocumented additional killings that occurred between March 2011 and April 2013, butwhich were learned about, identified, or verified since the last report. In other words,records from these three groups reflect the ongoing work each of these groups conductsupdating and verifying their existing records in addition to collecting new records.
Looking at the period of study from the previous report, this updated analysisfinds that these three sources recorded 116 046 unique killings between March 2011and April 2013. Notably, this is a higher count than the total enumeration previouslyreported (92 901). This is due to a combination of newly-documented deaths thatoccurred between March 2011 and April 2013, additional information discovered aboutpreviously-reported deaths, and refinements to the matching model.
From May 2013 through April 2014, CSR-SY, SNHR, and VDC have documented61 816 unique killings. For this period, these three groups together have documentedbetween 4344 and 6565 killings each month.15
15For this period, a monthly average of 5151 killings were documented by these three sources.
9
5 Descriptive Statistics
This section presents summary statistics that describe the datasets that were integratedfor this enumeration. The analyses describe only identifiable victims reported by eachindividual dataset; unobserved and unidentifiable killings are not considered. Therefore,the analysis is affected by selection bias. That is, each killing has a different likelihoodof being reported, due to individual characteristics of the victim and to field practices ofeach reporting group. For example, one data collection group may have better contactswithin a certain religious or ethnic group, whereas another may have access to govern-ment personnel records. Another group may have excellent sources one week but beunable to contact these sources at other times. And of course, some violent events arenot reported to any source, either because only the perpetrators survived the event, orbecause surviving witnesses were unable or chose not to report the incident. Raw data,including individual datasets and integrated enumerations such as the one presented inthis report, are not suitable for drawing conclusions about statistical patterns. To drawrigorous conclusions, estimates that correct for selection bias must be made.
Nevertheless, analysis of the individual datasets explores what has been seen. Thisanalysis is called “descriptive” because it describes the data. Although this may notprovide insight into the unobserved true patterns, descriptive analysis shows what thedatasets have in common, and how they differ.
These descriptive statistics only include records of identifiable victims. Records ofidentifiable victims include the victim’s name, plus date and location of death.16 Thefull identifying information is essential for the record comparisons required to matchrecords across different datasets. Records lacking the complete information are consid-ered “anonymous” and were excluded from the integration and analysis (see Table 2).The anonymous records describe victims of violence in Syria who deserve to be acknowl-edged. However, they cannot be included in this analysis because it is impossible todetermine if the records with partial information refer to killings also described by otherrecords. That is, anonymous records cannot be matched or de-deduplicated. Recordswith partial information provide hints about the existence of killings which have notbeen fully documented; a full accounting of killings—documented and undocumented—will require additional data analysis.
5.1 Documentation Over Time
Figure 4 shows the frequency of reported killings by week for each dataset. Threedatasets (CSR-SY, SNHR, and VDC) indicate roughly comparable patterns of violenceover time. Note, however, that the y-axes are very different. VDC and SNHR reportthe highest number of killings, followed by CSR-SY. Here it is important to note againthat findings concerning GoSY and SOHR included in Figure 4 only reflect a portionof the conflict because the records available from these sources cover a shorter timeperiod (GoSY records cover March 2011–March 2012 and SOHR records cover March2011–April 2013).
It is important not to be misled by the apparent consistency across multiple sourceswhen aggregated over the entire country of Syria. As hinted at in the previous section,expansion of these comparisons to specific locations of interest rapidly reveal differingpatterns in the observed data. It is important to examine these patterns because it is
16A discussion of location and other data processing questions can be found in Appendix B.
10
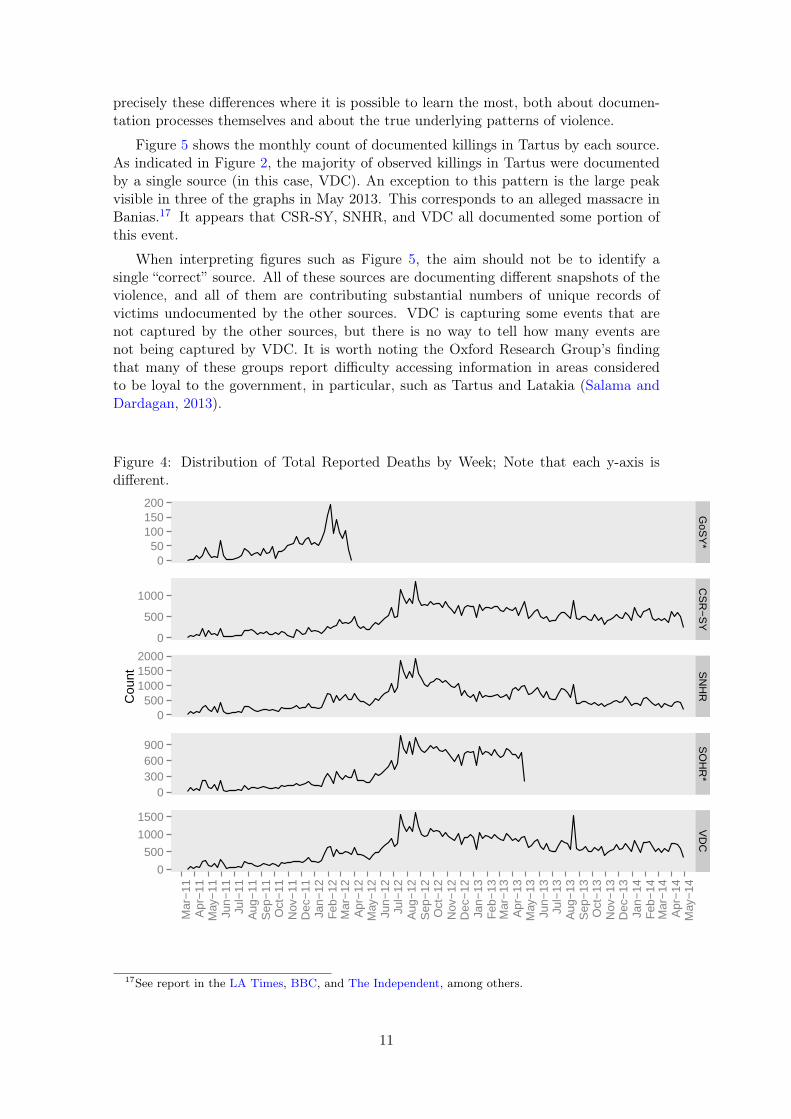
precisely these differences where it is possible to learn the most, both about documen-tation processes themselves and about the true underlying patterns of violence.
Figure 5 shows the monthly count of documented killings in Tartus by each source.As indicated in Figure 2, the majority of observed killings in Tartus were documentedby a single source (in this case, VDC). An exception to this pattern is the large peakvisible in three of the graphs in May 2013. This corresponds to an alleged massacre inBanias.17 It appears that CSR-SY, SNHR, and VDC all documented some portion ofthis event.
When interpreting figures such as Figure 5, the aim should not be to identify asingle “correct” source. All of these sources are documenting different snapshots of theviolence, and all of them are contributing substantial numbers of unique records ofvictims undocumented by the other sources. VDC is capturing some events that arenot captured by the other sources, but there is no way to tell how many events arenot being captured by VDC. It is worth noting the Oxford Research Group’s findingthat many of these groups report difficulty accessing information in areas consideredto be loyal to the government, in particular, such as Tartus and Latakia (Salama andDardagan, 2013).
Figure 4: Distribution of Total Reported Deaths by Week; Note that each y-axis isdifferent.
050
100150200
0
500
1000
0500
100015002000
0300600900
0
500
1000
1500
GoS
Y*
CS
R−
SY
SN
HR
SO
HR
*V
DC
Mar
−11
Apr
−11
May
−11
Jun−
11Ju
l−11
Aug
−11
Sep
−11
Oct
−11
Nov
−11
Dec
−11
Jan−
12F
eb−
12M
ar−
12A
pr−
12M
ay−
12Ju
n−12
Jul−
12A
ug−
12S
ep−
12O
ct−
12N
ov−
12D
ec−
12Ja
n−13
Feb
−13
Mar
−13
Apr
−13
May
−13
Jun−
13Ju
l−13
Aug
−13
Sep
−13
Oct
−13
Nov
−13
Dec
−13
Jan−
14F
eb−
14M
ar−
14A
pr−
14M
ay−
14
Cou
nt
17See report in the LA Times, BBC, and The Independent, among others.
11
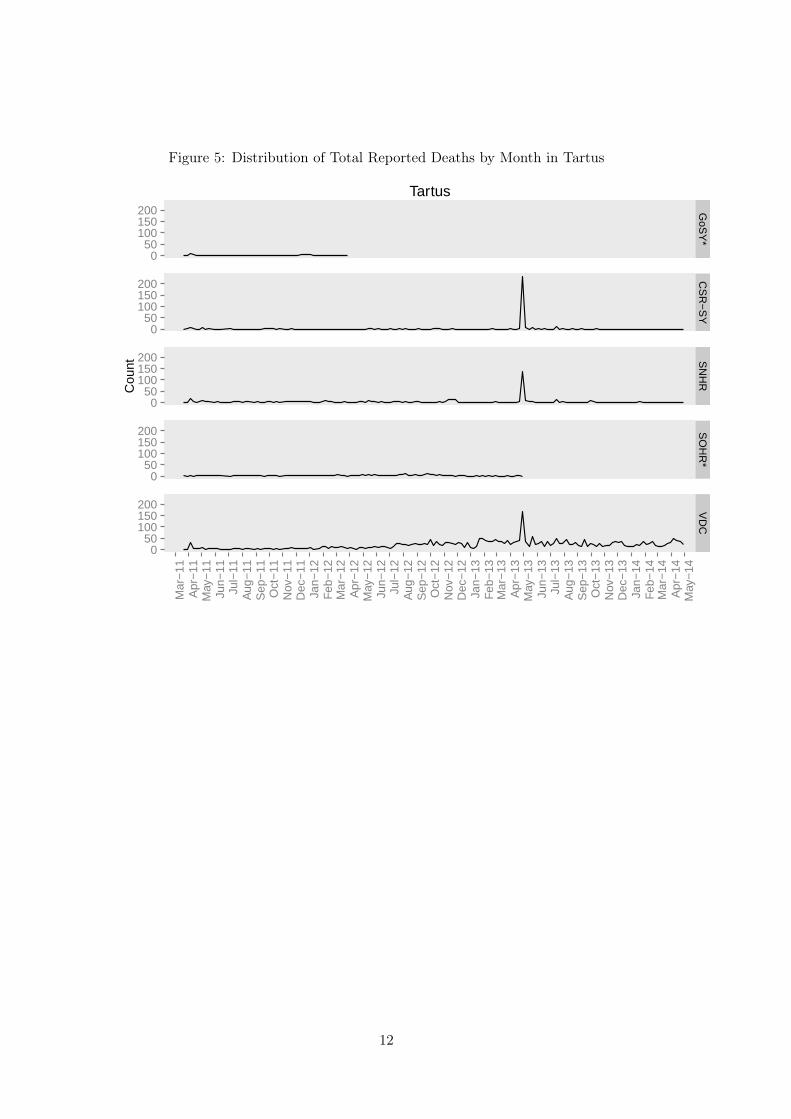
Figure 5: Distribution of Total Reported Deaths by Month in Tartus
050
100150200
050
100150200
050
100150200
050
100150200
050
100150200
GoS
Y*
CS
R−
SY
SN
HR
SO
HR
*V
DC
Mar
−11
Apr
−11
May
−11
Jun−
11Ju
l−11
Aug
−11
Sep
−11
Oct
−11
Nov
−11
Dec
−11
Jan−
12F
eb−
12M
ar−
12A
pr−
12M
ay−
12Ju
n−12
Jul−
12A
ug−
12S
ep−
12O
ct−
12N
ov−
12D
ec−
12Ja
n−13
Feb
−13
Mar
−13
Apr
−13
May
−13
Jun−
13Ju
l−13
Aug
−13
Sep
−13
Oct
−13
Nov
−13
Dec
−13
Jan−
14F
eb−
14M
ar−
14A
pr−
14M
ay−
14
Cou
nt
Tartus
12
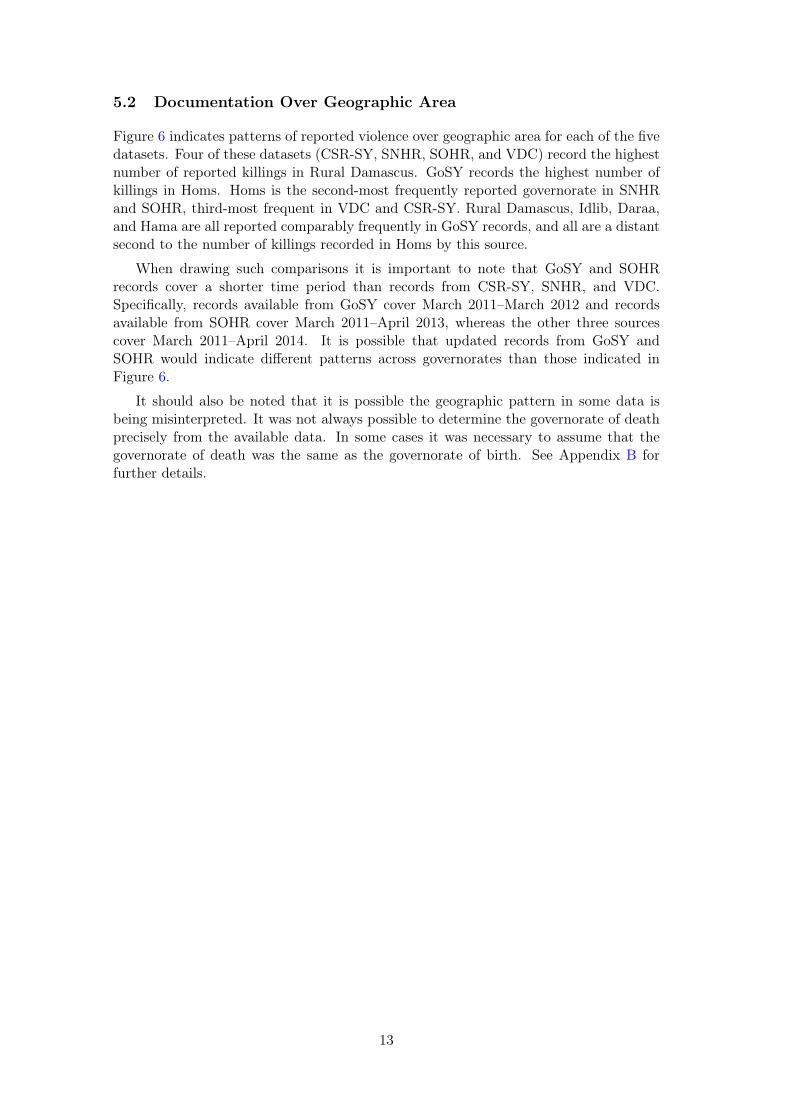
5.2 Documentation Over Geographic Area
Figure 6 indicates patterns of reported violence over geographic area for each of the fivedatasets. Four of these datasets (CSR-SY, SNHR, SOHR, and VDC) record the highestnumber of reported killings in Rural Damascus. GoSY records the highest number ofkillings in Homs. Homs is the second-most frequently reported governorate in SNHRand SOHR, third-most frequent in VDC and CSR-SY. Rural Damascus, Idlib, Daraa,and Hama are all reported comparably frequently in GoSY records, and all are a distantsecond to the number of killings recorded in Homs by this source.
When drawing such comparisons it is important to note that GoSY and SOHRrecords cover a shorter time period than records from CSR-SY, SNHR, and VDC.Specifically, records available from GoSY cover March 2011–March 2012 and recordsavailable from SOHR cover March 2011–April 2013, whereas the other three sourcescover March 2011–April 2014. It is possible that updated records from GoSY andSOHR would indicate different patterns across governorates than those indicated inFigure 6.
It should also be noted that it is possible the geographic pattern in some data isbeing misinterpreted. It was not always possible to determine the governorate of deathprecisely from the available data. In some cases it was necessary to assume that thegovernorate of death was the same as the governorate of birth. See Appendix B forfurther details.
13
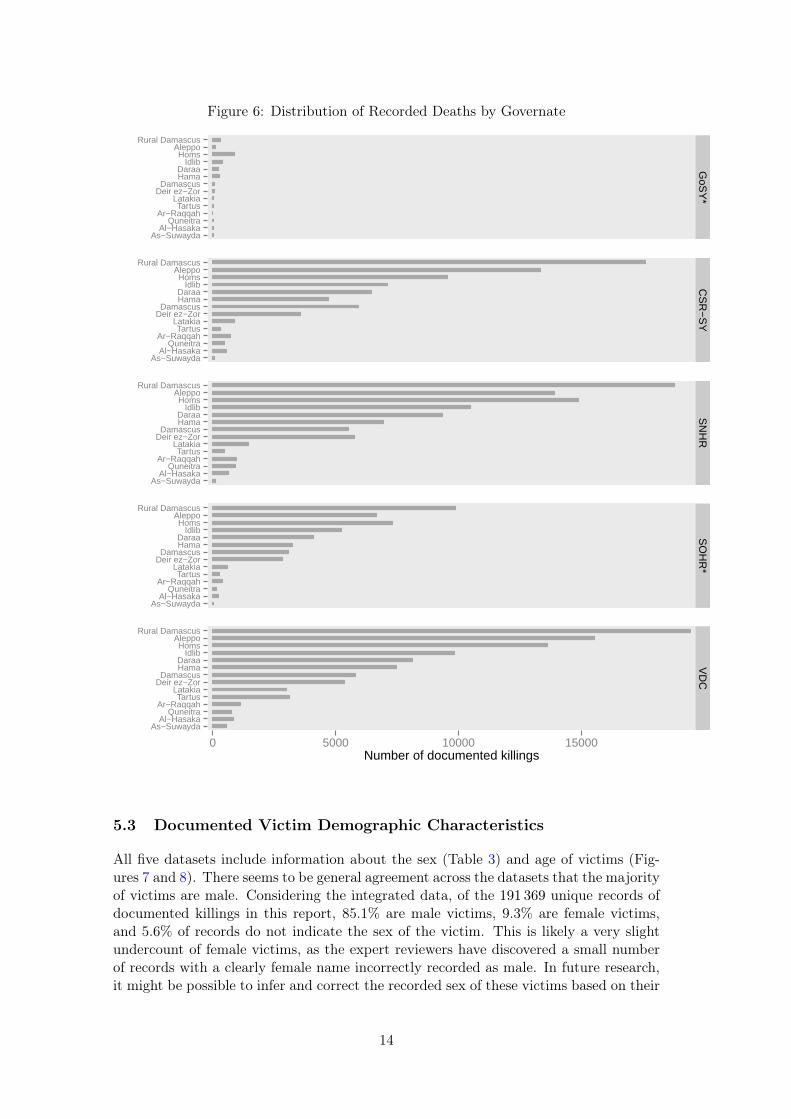
Figure 6: Distribution of Recorded Deaths by Governate
As−SuwaydaAl−Hasaka
QuneitraAr−Raqqah
TartusLatakia
Deir ez−ZorDamascus
HamaDaraa
IdlibHoms
AleppoRural Damascus
As−SuwaydaAl−Hasaka
QuneitraAr−Raqqah
TartusLatakia
Deir ez−ZorDamascus
HamaDaraa
IdlibHoms
AleppoRural Damascus
As−SuwaydaAl−Hasaka
QuneitraAr−Raqqah
TartusLatakia
Deir ez−ZorDamascus
HamaDaraa
IdlibHoms
AleppoRural Damascus
As−SuwaydaAl−Hasaka
QuneitraAr−Raqqah
TartusLatakia
Deir ez−ZorDamascus
HamaDaraa
IdlibHoms
AleppoRural Damascus
As−SuwaydaAl−Hasaka
QuneitraAr−Raqqah
TartusLatakia
Deir ez−ZorDamascus
HamaDaraa
IdlibHoms
AleppoRural Damascus
GoS
Y*
CS
R−
SY
SN
HR
SO
HR
*V
DC
0 5000 10000 15000Number of documented killings
5.3 Documented Victim Demographic Characteristics
All five datasets include information about the sex (Table 3) and age of victims (Fig-ures 7 and 8). There seems to be general agreement across the datasets that the majorityof victims are male. Considering the integrated data, of the 191 369 unique records ofdocumented killings in this report, 85.1% are male victims, 9.3% are female victims,and 5.6% of records do not indicate the sex of the victim. This is likely a very slightundercount of female victims, as the expert reviewers have discovered a small numberof records with a clearly female name incorrectly recorded as male. In future research,it might be possible to infer and correct the recorded sex of these victims based on their
14
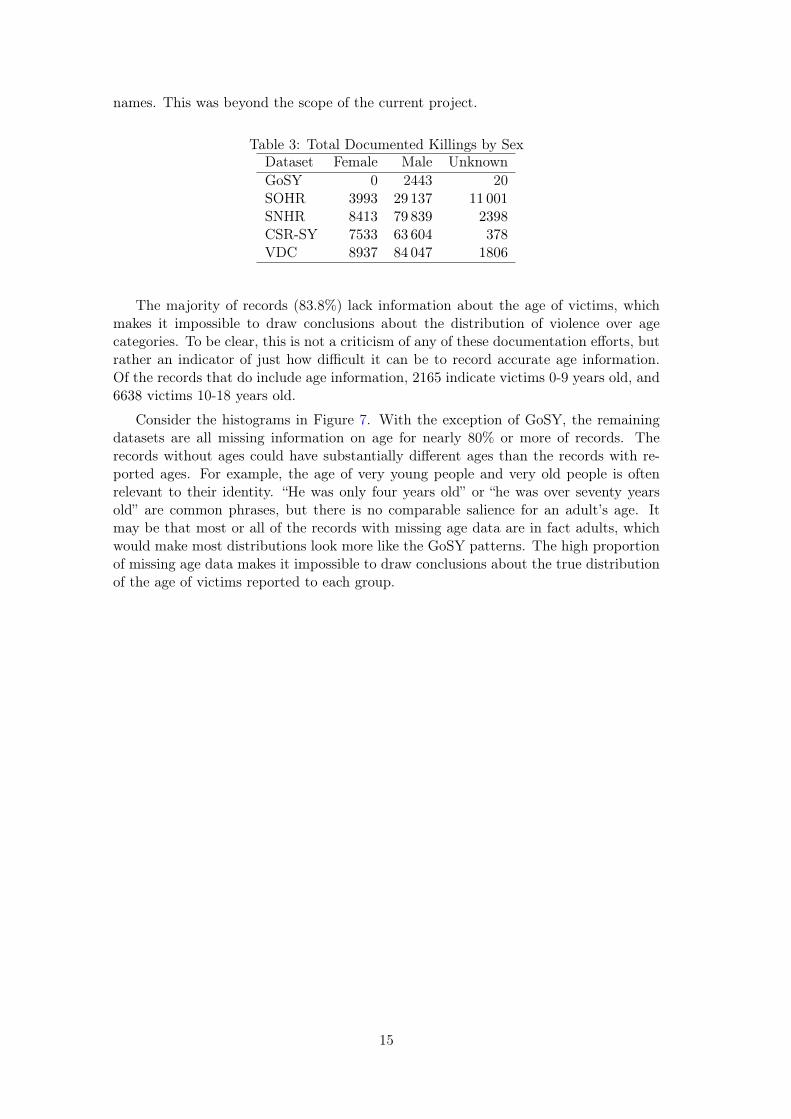
names. This was beyond the scope of the current project.
Table 3: Total Documented Killings by SexDataset Female Male UnknownGoSY 0 2443 20SOHR 3993 29 137 11 001SNHR 8413 79 839 2398CSR-SY 7533 63 604 378VDC 8937 84 047 1806
The majority of records (83.8%) lack information about the age of victims, whichmakes it impossible to draw conclusions about the distribution of violence over agecategories. To be clear, this is not a criticism of any of these documentation efforts, butrather an indicator of just how difficult it can be to record accurate age information.Of the records that do include age information, 2165 indicate victims 0-9 years old, and6638 victims 10-18 years old.
Consider the histograms in Figure 7. With the exception of GoSY, the remainingdatasets are all missing information on age for nearly 80% or more of records. Therecords without ages could have substantially different ages than the records with re-ported ages. For example, the age of very young people and very old people is oftenrelevant to their identity. “He was only four years old” or “he was over seventy yearsold” are common phrases, but there is no comparable salience for an adult’s age. Itmay be that most or all of the records with missing age data are in fact adults, whichwould make most distributions look more like the GoSY patterns. The high proportionof missing age data makes it impossible to draw conclusions about the true distributionof the age of victims reported to each group.
15
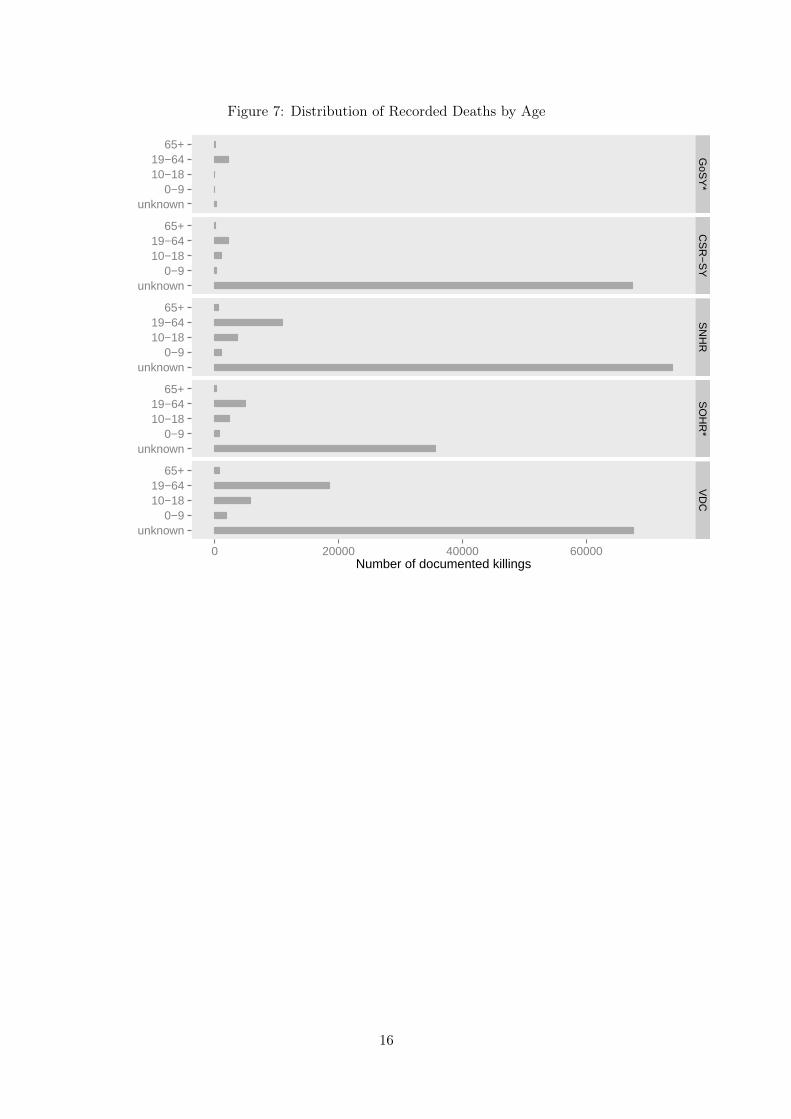
Figure 7: Distribution of Recorded Deaths by Age
unknown0−9
10−1819−64
65+
unknown0−9
10−1819−64
65+
unknown0−9
10−1819−64
65+
unknown0−9
10−1819−64
65+
unknown0−9
10−1819−64
65+
GoS
Y*
CS
R−
SY
SN
HR
SO
HR
*V
DC
0 20000 40000 60000Number of documented killings
16
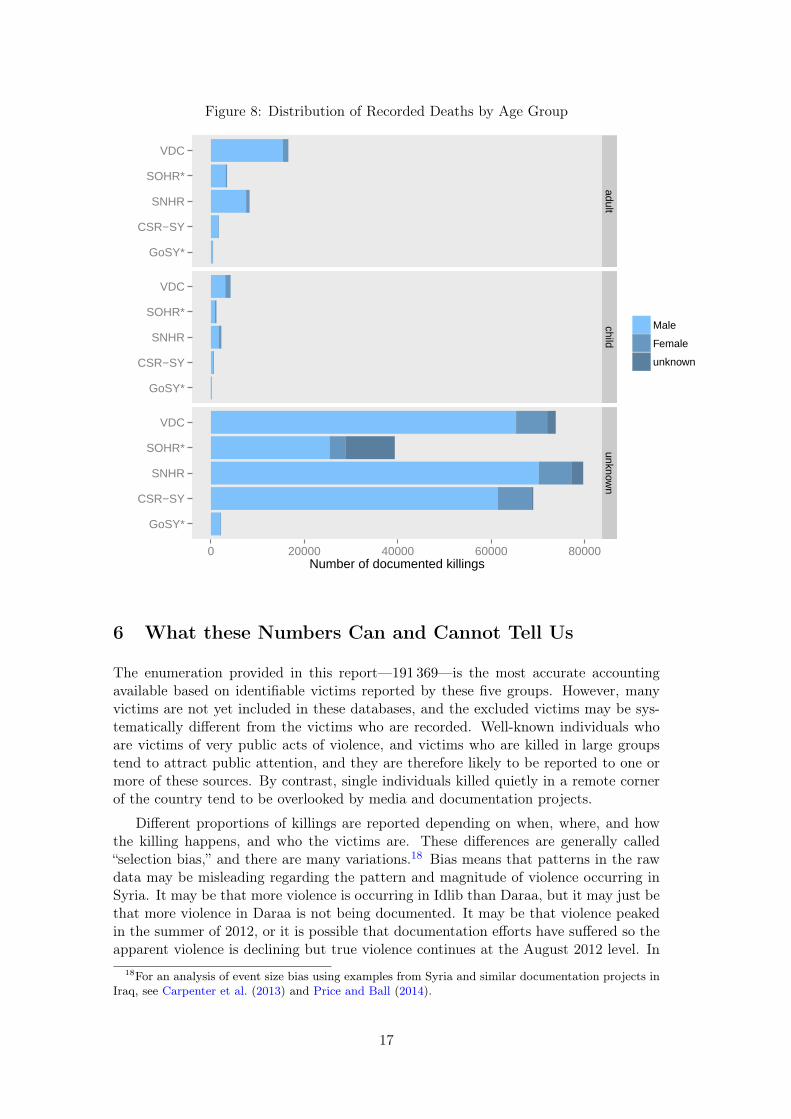
Figure 8: Distribution of Recorded Deaths by Age Group
GoSY*
CSR−SY
SNHR
SOHR*
VDC
GoSY*
CSR−SY
SNHR
SOHR*
VDC
GoSY*
CSR−SY
SNHR
SOHR*
VDC
adultchild
unknown
0 20000 40000 60000 80000Number of documented killings
Male
Female
unknown
6 What these Numbers Can and Cannot Tell Us
The enumeration provided in this report—191 369—is the most accurate accountingavailable based on identifiable victims reported by these five groups. However, manyvictims are not yet included in these databases, and the excluded victims may be sys-tematically different from the victims who are recorded. Well-known individuals whoare victims of very public acts of violence, and victims who are killed in large groupstend to attract public attention, and they are therefore likely to be reported to one ormore of these sources. By contrast, single individuals killed quietly in a remote cornerof the country tend to be overlooked by media and documentation projects.
Different proportions of killings are reported depending on when, where, and howthe killing happens, and who the victims are. These differences are generally called“selection bias,” and there are many variations.18 Bias means that patterns in the rawdata may be misleading regarding the pattern and magnitude of violence occurring inSyria. It may be that more violence is occurring in Idlib than Daraa, but it may just bethat more violence in Daraa is not being documented. It may be that violence peakedin the summer of 2012, or it is possible that documentation efforts have suffered so theapparent violence is declining but true violence continues at the August 2012 level. In
18For an analysis of event size bias using examples from Syria and similar documentation projects inIraq, see Carpenter et al. (2013) and Price and Ball (2014).
17
order to understand the true underlying patterns of violence, statistical estimates willbe needed to identify and correct biases.
Examining reported killings is an important step in understanding violence in Syria.But it is only the first step. Further analysis is necessary to answer substantive questionsabout patterns of violence during this conflict.
18
A Data
A.1 Sources
HRDAG obtained data from various sources via different mechanisms and at differenttimes. Below is a brief description of each source, how and when HRDAG obtained datafrom each source, and any additional information available about each source’s missionand data collection and verification methods.
• Syrian Government: This list was provided to HRDAG by OHCHR in September2012. OHCHR requested updated information from the Syrian Government inSeptember 2013 and April 2014; no response was received at the time of publica-tion.
• Syrian Center for Statistics and Research: HRDAG scraped19 CSR-SY’s website20
in May 2013 to obtain a copy of their published data. Individuals can fill out aform on the CSR-SY website to add victim information. HRDAG establisheddirect contact with CSR-SY in late May 2013 and all data used in this reportwere provided directly from CSR-SY.
• Syrian Network for Human Rights: This list was provided to HRDAG by OHCHRin August 2012. Beginning in February 2013, HRDAG established a direct rela-tionship with SNHR. SNHR conducts monthly reviews of their records and sub-sequently updates their dataset with newly discovered victims. All data includedin this report were provided directly from SNHR. SNHR maintains a website21
where they describe that they “adopt the highest approved documentation princi-ples by the international bodies.” Also available on their website is a descriptionof their three phase documentation process and the six categories of victims theydocument.
• Syrian Observatory for Human Rights: This list was provided to HRDAG byOHCHR in December 2012 and again in May 2013, as agreed to by SOHR. Thislist includes only “[c]ivilians and opposition fighters who are not defectors” as cat-egorized by SOHR. SOHR also collects data on defectors, pro-government militia(Sabihha), military and police personnel, unidentified persons, unidentified andforeign fighters, and Hezbollah fighters. SOHR declined to share an updated listin early 2014.
• Violation Documentation Centre: This list was provided to OHCHR in February2012. Subsequently HRDAG scraped the website22 several times in 2012, 2013,and 2014 to obtain updated data. HRDAG only includes records from the listlabeled “Martyrs.” The “About” page of their website describes the data clas-sification methods and three-stage data verification process implemented by theVDC.
19Using a computer program to extract information from websites.20http://csr-sy.org/21http://sn4hr.org/22http://www.vdc-sy.info
19
A.2 Overlap Among Sources
As noted above, a total of 191 369 unique killings were documented by five sources(GoSY, CSR-SY, SNHR, SOHR, and VDC). Each of these sources contribute somerecords that were only documented by that source, as well as records that were reportedby that source and by one or more other sources.
The remainder of this discussion focuses only on the human rights groups; these foursources (CSR-SY, SNHR, SOHR, and VDC) contributed a total of 189 739 records. Theremaining 1630 records were contributed only by the Syrian Government and were notincluded on any of the human rights groups’ lists. Of the 189 739 unique killings, only4877 were reported by all four Syrian human rights groups.
A more detailed way to look at this distribution of records is presented in Table 4.The first row of Table 4 indicates the 4877 records reported by all four human rightsgroups. Note that in the four leftmost columns, there is a ‘1’ in each, indicating thatthe row includes records from this dataset.
The second row of the table has the pattern 1101, which indicates that it countskillings recorded by SOHR, CSR-SY, and SNHR but not by VDC; there are 1107 killingswith this reporting pattern.
The sixth row of the table has the pattern 1001, which indicates that it countskillings recorded by SOHR and SNHR but not by CSR-SY or VDC; there are 4734killings with this reporting pattern.
The final row of the table has the pattern 0001, and it shows the killings reportedonly by SNHR, not by SOHR, CSR-SY, or VDC. There are 19 917 killings with thisreporting pattern.
Table 4 makes clear that VDC and SNHR share the most overlap, while CSR-SY hasthe most uniquely reported killings. SOHR is relatively smaller than the other sources,but recall that data from SOHR covers only the period March 2011–April 2013.
20
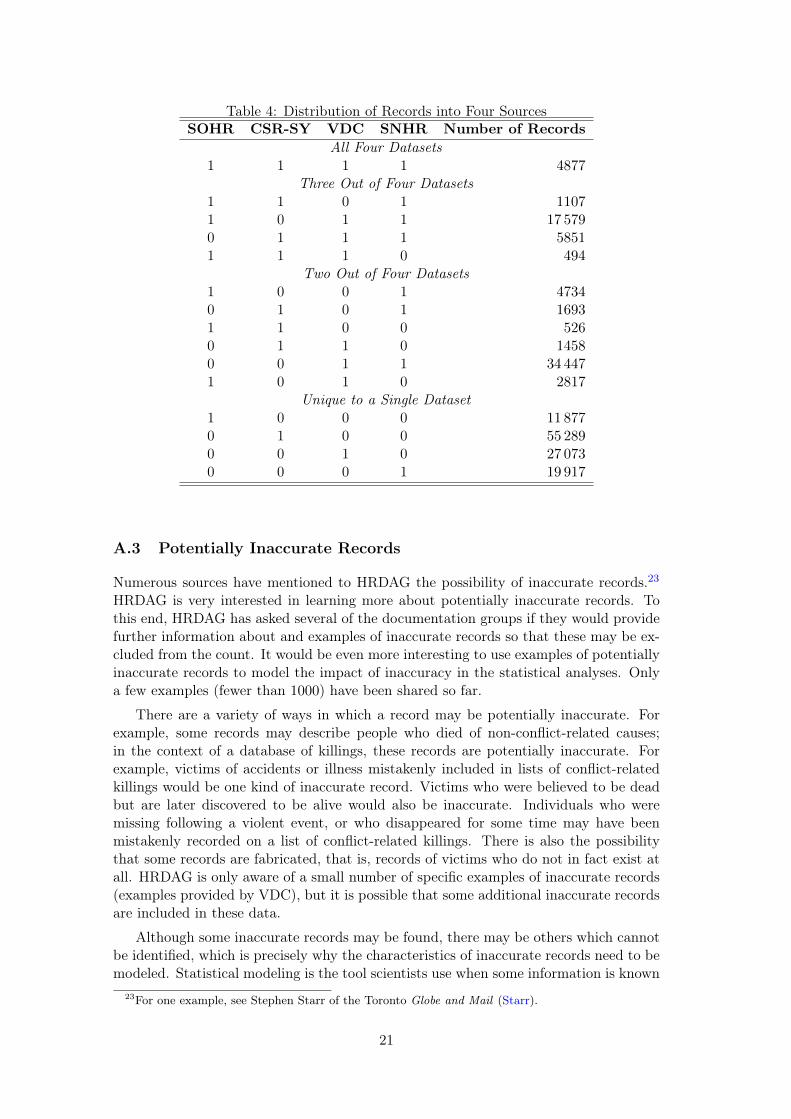
Table 4: Distribution of Records into Four SourcesSOHR CSR-SY VDC SNHR Number of Records
All Four Datasets1 1 1 1 4877
Three Out of Four Datasets1 1 0 1 11071 0 1 1 17 5790 1 1 1 58511 1 1 0 494
Two Out of Four Datasets1 0 0 1 47340 1 0 1 16931 1 0 0 5260 1 1 0 14580 0 1 1 34 4471 0 1 0 2817
Unique to a Single Dataset1 0 0 0 11 8770 1 0 0 55 2890 0 1 0 27 0730 0 0 1 19 917
A.3 Potentially Inaccurate Records
Numerous sources have mentioned to HRDAG the possibility of inaccurate records.23
HRDAG is very interested in learning more about potentially inaccurate records. Tothis end, HRDAG has asked several of the documentation groups if they would providefurther information about and examples of inaccurate records so that these may be ex-cluded from the count. It would be even more interesting to use examples of potentiallyinaccurate records to model the impact of inaccuracy in the statistical analyses. Onlya few examples (fewer than 1000) have been shared so far.
There are a variety of ways in which a record may be potentially inaccurate. Forexample, some records may describe people who died of non-conflict-related causes;in the context of a database of killings, these records are potentially inaccurate. Forexample, victims of accidents or illness mistakenly included in lists of conflict-relatedkillings would be one kind of inaccurate record. Victims who were believed to be deadbut are later discovered to be alive would also be inaccurate. Individuals who weremissing following a violent event, or who disappeared for some time may have beenmistakenly recorded on a list of conflict-related killings. There is also the possibilitythat some records are fabricated, that is, records of victims who do not in fact exist atall. HRDAG is only aware of a small number of specific examples of inaccurate records(examples provided by VDC), but it is possible that some additional inaccurate recordsare included in these data.
Although some inaccurate records may be found, there may be others which cannotbe identified, which is precisely why the characteristics of inaccurate records need to bemodeled. Statistical modeling is the tool scientists use when some information is known
23For one example, see Stephen Starr of the Toronto Globe and Mail (Starr).
21
but other information needs to be estimated. With a large number of known inaccurateand known accurate records, it might be possible to compare these two groups of recordsand identify key characteristics that differ between them. With this information, aclassification model could be built to identify sets of potentially inaccurate records (i.e.,“scenarios” of kinds of inaccuracy). The modeling would use records previously identifiedby human reviewers to suggest records not yet identified as potentially inaccurate. Withthe modeled information, HRDAG could examine how these records are distributed withrespect to geography, time, and the characteristics of the victims, and thus determinehow inaccuracy might be affecting the substantive conclusions of future analysis.
B Data Processing
The data processing step standardizes the structure and content of the different sourcesprior to matching and de-duplication. Processing includes three important steps: clean-ing, translating, and what HRDAG refers to as canonicalizing.
B.1 Data Cleaning
In this step, invalid data values are filtered from the data. For example, in manydatasets the “age” variable includes a combination of ages in years as well as specificbirth years. Ages recorded as “1970” are clearly a birth year rather than an age inyears. These values are subtracted from the year of death, and the difference in yearsis recorded as the approximate age of the victim. Another data cleaning task is simplyremoving obvious typos from data values. For example, strings of unstructured text inotherwise numeric or categorical variables (such as age or sex) can usually be trimmedfrom those variable values.
B.2 Data Translation
In this step, key analysis variables, such as sex and governorate, are translated fromArabic to English. HRDAG’s Syrian expert (one of the three native Arabic speakers whoreview records) (see Section 3 and Appendix C) confirms the translation of these values.Other Arabic content, such as names and locations (a finer geographic description thangovernorate) are reviewed in their original form by the three native Arabic speakingreviewers.
For the fourth and fifth reviewers, HRDAG uses Google’s translation applicationprogramming interface to translate names and locations, which they then review inEnglish. Close comparison of these decisions to those made by the three native Arabicspeakers confirm a high level of consistency, regardless of whether review is conductedin English or Arabic. For full details, see the section on inter-rater reliability in Ap-pendix C.1.
B.3 Data Canonicalization
In this step, analysis variables are transformed to have a common structure across allof the data sources. For example, the different datasets collect a variety of informationabout the location of death. These locations may be recorded across numerous variablesand in varying levels of precision (e.g., neighborhood, area, governorate). HRDAG
22
matches records based on governorate and compares results for different governorates,so the location variable must be standardized across data sources. In some cases, this isstraightforward, in some cases HRDAG uses other location information (such as city) tomap to governorate, and in some cases HRDAG assumes that the governorate of birthmatches the governorate of death.
C Matching
As mentioned in Section 1, to use the records described in this report, they must belinked together, identifying groups of two or more records which refer to the same person.This is challenging because each data source may record slightly different information(as indicated by Section 5). Furthermore, each data source is working to overcomethe difficulties inherent in collecting complete, accurate information in the midst of aconflict.
Linking records within a single data source is called de-duplication, and identifyingthe same death in records found in different sources is called record linkage. Both ofthese tasks were performed together, by looking for duplicates within a single list of allrecords from all data sources with sufficient information, including name plus date andlocation of death. Other variables, such as age (or date of birth), sex, and location ofbirth, were also used for matching.
From the full set of pooled records, groups of records that might be matches were firstidentified using very broad rules, dividing the pool of records according to governorateand year. In other words, all killings recorded in Homs in 2011 were examined as agroup, looking for records with similar names and dates. Reviewers then labeled groupsof records as referring to the same individual or not.
The matched groups of records which all refer to the same person were then com-bined; this is called clustering. For example if record A matches record B, and recordB matches record C, then the group (A, B, C) might be formed. Each of these groupscontains all the records from all the databases that reviewers believe refer to the samedeath. Finally, the records in each group are merged into a single record containing themost precise information available from each of the individual records. If some recordscontain contradictory information (for example, if records A and B record the victim asage 19 and record C records age 20) the most frequently reported information is used(in this case, age 19). If the same number of records report each piece of contradictoryinformation, a value from the contradictory set is randomly selected.
After an initial round of clustering, subsets of these combined records were thenre-examined to identify previously missed groups of records that refer to the sameindividual, particularly across years (e.g., records with dates of death 2011/12/31 and2012/01/01 might refer to the same individual) and governorates (e.g., records withneighboring locations of death might refer to the same individual).
C.1 Inter-Rater Reliability (IRR)
When two or more individuals review and code data, such as the reviewers employedby HRDAG to determined whether multiple records refer to the same individual, it iscommon to need to assess the consistency of the decisions made by those individuals.Formally, this assessment is referred to as inter-rater reliability (IRR) and is generallydescribed using the overall percent agreement among coders and a Kappa coefficient.
23
There are a variety of other statistical measures to evaluate IRR, but Kappa is commonlyused for categorical measures, such as assigning match/non-match to groups of records.
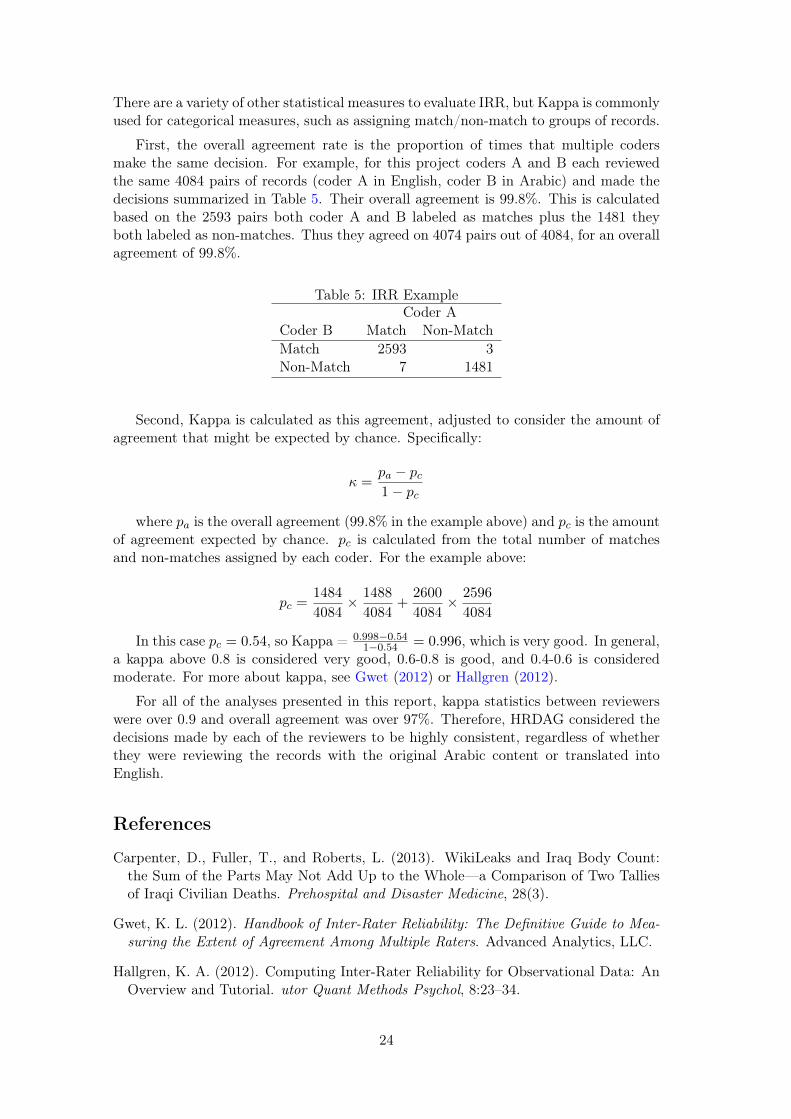
First, the overall agreement rate is the proportion of times that multiple codersmake the same decision. For example, for this project coders A and B each reviewedthe same 4084 pairs of records (coder A in English, coder B in Arabic) and made thedecisions summarized in Table 5. Their overall agreement is 99.8%. This is calculatedbased on the 2593 pairs both coder A and B labeled as matches plus the 1481 theyboth labeled as non-matches. Thus they agreed on 4074 pairs out of 4084, for an overallagreement of 99.8%.
Table 5: IRR ExampleCoder A
Coder B Match Non-MatchMatch 2593 3Non-Match 7 1481
Second, Kappa is calculated as this agreement, adjusted to consider the amount ofagreement that might be expected by chance. Specifically:
κ =pa − pc1− pc
where pa is the overall agreement (99.8% in the example above) and pc is the amountof agreement expected by chance. pc is calculated from the total number of matchesand non-matches assigned by each coder. For the example above:
pc =1484
4084× 1488
4084+
2600
4084× 2596
4084
In this case pc = 0.54, so Kappa = 0.998−0.541−0.54 = 0.996, which is very good. In general,
a kappa above 0.8 is considered very good, 0.6-0.8 is good, and 0.4-0.6 is consideredmoderate. For more about kappa, see Gwet (2012) or Hallgren (2012).
For all of the analyses presented in this report, kappa statistics between reviewerswere over 0.9 and overall agreement was over 97%. Therefore, HRDAG considered thedecisions made by each of the reviewers to be highly consistent, regardless of whetherthey were reviewing the records with the original Arabic content or translated intoEnglish.
References
Carpenter, D., Fuller, T., and Roberts, L. (2013). WikiLeaks and Iraq Body Count:the Sum of the Parts May Not Add Up to the Whole—a Comparison of Two Talliesof Iraqi Civilian Deaths. Prehospital and Disaster Medicine, 28(3).
Gwet, K. L. (2012). Handbook of Inter-Rater Reliability: The Definitive Guide to Mea-suring the Extent of Agreement Among Multiple Raters. Advanced Analytics, LLC.
Hallgren, K. A. (2012). Computing Inter-Rater Reliability for Observational Data: AnOverview and Tutorial. utor Quant Methods Psychol, 8:23–34.
24
Price, M. and Ball, P. (2014). Big Data, Selection Bias, and the Statistical Patterns ofMortality in Conflict. SAIS Review of International Affairs, 34:9–20.
Salama, H. and Dardagan, H. (2013). Stolen Futures: The Hidden Toll of Child Casu-alties in Syria. Oxford Research Group.
Starr, S. Casualty count proves inexact science, rights group finds. The Globeand Mail 27 March 2013 Available: http://www.theglobeandmail.com/news/world/casualty-count-proves-inexact-science-rights-group-finds/article10467644/.
About HRDAG
The Human Rights Data Analysis Group is a non-profit, non-partisan organization24
that applies scientific methods to the analysis of human rights violations around theworld. This work began in 1991 when Patrick Ball began developing databases forhuman rights groups in El Salvador. HRDAG grew at the American Association forthe Advancement of Science from 1994–2003, and at the Benetech Initiative from 2003–2013. In February 2013, HRDAG became an independent organization based in SanFrancisco, California; contact details and more information is available on HRDAG’swebsite (https://hrdag.org) and Facebook page.
HRDAG is composed of applied and mathematical statisticians, computer scientists,demographers, and social scientists. HRDAG supports the protections established in theUniversal Declaration of Human Rights, the International Covenant on Civil and Po-litical Rights, and other international human rights treaties and instruments. HRDAGscientists provide unbiased, scientific results to human rights advocates to clarify hu-man rights violence. The human rights movement is sometimes described as “speakingtruth to power:” HRDAG believes that statistics about violence need to be as true aspossible, with the best possible data and science.
The materials contained herein represent the opinions of the authors and editorsand should not be construed to be the view of HRDAG, any of HRDAG’s constituentprojects, the HRDAG Board of Advisers, the donors to HRDAG or to this project. Thecontent of this analysis does not necessary reflect the opinion of OHCHR.
24Formally, HRDAG is a fiscally sponsored project of Community Partners.
25