updated technical report itafós arraias ssp project, tocantins · amazon geoservices ltda abn 52...
TRANSCRIPT

Amazon GeoServices Ltda ABN 52 065 481 209 Mineral Resource Estimate - Arraias Phosphate Project, Para State, Brazil – MBAC Page: 1 Effective Date – 27 March 2013
6005 Australia
Updated Technical Report
Itafós Arraias SSP Project, Tocantins State, Brazil
NI 43-101 Technical Report
On Behalf of - MBAC Fertilizer Corp
Effective date - March 27 2013
Qualified Persons:
Bradley Ackroyd Consulting Geologist (Andes Mining Services) BSc (Geo) MAIG
Beau Nicholls Consulting Geologist (Andes Mining Services) BSc (Geo) MAIG
Carlos Guzmán Principal Mining Engineer (NCL Brasil Ltda.) (MAusIMM) & Chillean Mining Commision
Homero Delboni Jr Owner of HDA Serviços S/S Ltda Registered Member CIM & SME
Version / Status: FINAL

Amazon GeoServices Ltda ABN 52 065 481 209 Mineral Resource Estimate - Arraias Phosphate Project, Para State, Brazil – MBAC Page: ii Effective Date – 27 March 2013
6005 Australia
Table of Contents
1 Summary.................................................................................................................................................... 10
1.1 Introduction ..................................................................................................................... 10
1.2 Location .......................................................................................................................... 10
1.3 Ownership ...................................................................................................................... 10
1.4 Geology and Mineralization ............................................................................................ 10
1.5 Mineral Processing and Metallurgical Testing ................................................................ 10
1.6 Mineral Resources.......................................................................................................... 12
1.7 Mineral Reserve ............................................................................................................. 13
1.8 Mining Methods .............................................................................................................. 14
1.9 Recovery Methods.......................................................................................................... 16
1.10 Market Studies ................................................................................................................ 18
1.11 Environmental Studies ................................................................................................... 20
1.12 Capital and Operating Expenditures .............................................................................. 21
1.13 Economic Analysis ......................................................................................................... 22
1.14 Conclusions and Recommendations .............................................................................. 23
2 Introduction ............................................................................................................................................... 25
2.1 Scope of Work ................................................................................................................ 25
2.2 Forward Looking Information .......................................................................................... 25
2.3 Principal Sources of Information .................................................................................... 26
2.4 Qualifications and Experience ........................................................................................ 26
2.5 Units of Measurements and Currency ............................................................................ 27
2.6 Abbreviations .................................................................................................................. 27
3 Reliance on Other Experts ....................................................................................................................... 28
4 Property Description and Location ......................................................................................................... 29
4.1 Project Location .............................................................................................................. 29
4.2 Tenement Status ............................................................................................................ 30
4.3 Royalties and Agreements ............................................................................................. 33
4.4 Environmental Liabilities ................................................................................................. 33
4.5 Permitting ....................................................................................................................... 33
5 Accessibility, Climate, Local Resources, Infrastructure and Physiography ........................................ 34
5.1 Project Access ................................................................................................................ 34
5.2 Physiography and Climate ............................................................................................. 34
5.3 Local Infrastructure and Services ................................................................................... 34
6 History........................................................................................................................................................ 35
7 Geological Setting and Mineralization .................................................................................................... 37
7.1 Regional Geology ........................................................................................................... 37

Amazon GeoServices Ltda ABN 52 065 481 209 Mineral Resource Estimate - Arraias Phosphate Project, Para State, Brazil – MBAC Page: iii Effective Date – 27 March 2013
6005 Australia
7.2 Project Geology .............................................................................................................. 38
7.3 Mineralization ................................................................................................................. 40
8 Deposit Types ............................................................................................................................................ 41
9 Exploration ................................................................................................................................................ 42
9.1 Bulk Density Determinations .......................................................................................... 42
10 Drilling ....................................................................................................................................................... 44
10.1 RC Drilling ...................................................................................................................... 45
10.1.1 RC Drilling Results and Quality ............................................................................. 46
10.2 DC Drilling ...................................................................................................................... 48
10.2.1 DC Drilling Results and Quality ............................................................................. 48
11 Sample Preparation, Analyses and Security ........................................................................................... 49
11.1 Sampling Method............................................................................................................ 49
11.1.1 Diamond Core ....................................................................................................... 49
11.1.2 Reverse Circulation ............................................................................................... 49
11.2 Sample Security ............................................................................................................. 51
11.3 Laboratory Sample Preparation and Analysis ................................................................ 52
11.3.1 Assay Laboratories ................................................................................................ 53
11.4 Adequacy of Procedures ................................................................................................ 53
12 Data Verification ....................................................................................................................................... 54
12.1 Geological Database ...................................................................................................... 54
12.2 QAQC ............................................................................................................................. 54
12.2.1 Certified Standards and Blanks ............................................................................. 54
12.2.2 Field Duplicates ..................................................................................................... 61
12.2.3 Data Quality Summary .......................................................................................... 62
13 Mineral Processing and Metallurgical Testing ....................................................................................... 63
13.1 Metallurgical Testwork .................................................................................................... 63
13.1.1 Crushing & Comminution ...................................................................................... 63
13.1.2 Process Flotation Definition ................................................................................... 63
13.1.3 Thickening and Filtration ....................................................................................... 70
13.1.4 Technological Characterization ............................................................................. 70
13.1.5 Acidulation ............................................................................................................. 70
14 Mineral Resource Estimates .................................................................................................................... 72
14.1 Introduction ..................................................................................................................... 72
14.2 Near Mine Block ............................................................................................................. 73
14.2.1 Drill Hole Database ............................................................................................... 73
14.2.2 Geological Interpretation ....................................................................................... 73
14.2.3 Data Analysis ........................................................................................................ 75
14.2.4 Spatial Analysis of Grades .................................................................................... 76
14.2.5 Resource Block Model .......................................................................................... 76
14.2.6 Mineral Resource Tabulation ................................................................................ 77

Amazon GeoServices Ltda ABN 52 065 481 209 Mineral Resource Estimate - Arraias Phosphate Project, Para State, Brazil – MBAC Page: iv Effective Date – 27 March 2013
6005 Australia
14.2.7 Block Model Validation .......................................................................................... 79
14.3 Domingos Block .............................................................................................................. 82
14.3.1 Drill Hole Database ............................................................................................... 82
14.3.2 Geological Modelling ............................................................................................. 82
14.3.3 Data Analysis ........................................................................................................ 84
14.3.4 Spatial Analysis of Grades .................................................................................... 85
14.3.5 Resource Block Model .......................................................................................... 85
14.3.6 Mineral Resource Tabulation ................................................................................ 86
14.3.7 Block Model Validation .......................................................................................... 88
14.4 Canabrava Block ............................................................................................................ 91
14.4.1 Drill Hole Database ............................................................................................... 91
14.4.2 Geological Modelling ............................................................................................. 91
14.4.3 Data Analysis ........................................................................................................ 93
14.4.4 Spatial Analysis of Grades .................................................................................... 94
14.4.5 Resource Block Model .......................................................................................... 94
14.4.6 Mineral Resource Tabulation ................................................................................ 95
14.4.7 Block Model Validation .......................................................................................... 97
14.5 Resource Estimates Summary ....................................................................................... 99
14.6 Exploration Target - Avião, Brejo and Cabeçuda Domains ......................................... 100
15 Mineral Reserve Estimates ..................................................................................................................... 102
16 Mining Methods ...................................................................................................................................... 104
16.1 PIT AND MINING PHASE DESIGN ............................................................................. 104
16.1.1 FINAL PIT DESIGN ............................................................................................. 105
16.1.2 Tabulation of Pit Contained Resources ............................................................... 106
16.2 MINE PRODUCTION SCHEDULE ............................................................................... 106
16.2.1 Strip Mining Design ............................................................................................. 106
16.2.2 Mine Scheduling Methodology ............................................................................ 107
16.2.3 Mine Schedule ..................................................................................................... 108
16.2.4 Waste Storage Facilities ...................................................................................... 113
16.3 EQUIPMENT REQUIREMENT .................................................................................... 115
16.3.1 Drilling and Blasting Requirement ....................................................................... 115
16.3.2 Loading and Hauling Requirement ...................................................................... 116
16.3.3 Auxiliary and Support Equipment ........................................................................ 116
17 Recovery Methods ................................................................................................................................... 118
17.1 Beneficiation plant and drying ...................................................................................... 118
17.2 Sub processes Description ........................................................................................... 120
17.2.1 Crushing .............................................................................................................. 120
17.2.2 Grinding/Classification/Desliming ........................................................................ 120
17.3 Flotation ........................................................................................................................ 121
17.3.1 Conventional Flotation ......................................................................................... 121
17.3.2 Produced slimes Flotation ................................................................................... 121

Amazon GeoServices Ltda ABN 52 065 481 209 Mineral Resource Estimate - Arraias Phosphate Project, Para State, Brazil – MBAC Page: v Effective Date – 27 March 2013
6005 Australia
17.3.3 Natural slimes Flotation ....................................................................................... 122
17.3.4 Regrind and Magnetic Separation ....................................................................... 122
17.3.5 Thickening and Filtration ..................................................................................... 122
17.3.6 Drying .................................................................................................................. 123
17.4 Reagents Plant & Equipment ....................................................................................... 123
17.4.1 Caustic Soda ....................................................................................................... 123
17.4.2 Soy Bean Oil ....................................................................................................... 123
17.4.3 Flocculants .......................................................................................................... 124
17.4.4 Sodium Silicate .................................................................................................... 124
17.5 Sulphuric Acid Plant ..................................................................................................... 125
17.6 Acidulation .................................................................................................................... 126
17.7 Granulation ................................................................................................................... 127
17.8 Gas Treatment System ................................................................................................ 129
17.9 Shipment ...................................................................................................................... 130
17.10 Water accumulation and Tailings Disposal .................................................................. 131
18 Project Infrastructure ............................................................................................................................ 133
18.1 Access Roads ............................................................................................................... 133
18.2 Earthworks .................................................................................................................... 133
18.3 Drainage ....................................................................................................................... 133
18.4 Plant Buildings .............................................................................................................. 133
18.5 Administrative Buildings ............................................................................................... 134
18.6 Water System ............................................................................................................... 134
18.7 Compressed Air ............................................................................................................ 134
18.8 Electrical system ........................................................................................................... 134
19 Market Studies and Contracts ............................................................................................................... 135
19.1 Agricultural Potential of the Area .................................................................................. 135
19.2 Market Model ................................................................................................................ 138
20 Enviromental Studies, Permittings and Social or Community Impact .............................................. 141
20.1 Environmental Study (“EIS”), Impact Report (“RIMA”) and Public Hearing ................. 141
20.1.1 Environmental Study (“EIS”) Conclusions ........................................................... 141
20.2 Impact Generation and Mitigating Actions ................................................................... 144
20.2.1 Reclaim Ponds .................................................................................................... 144
20.2.2 Tailings Facility .................................................................................................... 145
20.2.3 Mining Waste ....................................................................................................... 145
20.2.4 Solid Waste ......................................................................................................... 145
20.2.5 Granulation Process ............................................................................................ 145
20.2.6 Acidulation Plant .................................................................................................. 145
20.2.7 Gas Treatment System ....................................................................................... 146
20.2.8 Dust Control Measures ........................................................................................ 146
20.2.9 Ore Haulage and Waste Dumping Dust Control ................................................. 146
20.2.10 Access Road Dust Control .................................................................................. 146

Amazon GeoServices Ltda ABN 52 065 481 209 Mineral Resource Estimate - Arraias Phosphate Project, Para State, Brazil – MBAC Page: vi Effective Date – 27 March 2013
6005 Australia
20.3 Area Description ........................................................................................................... 146
20.3.1 Hydrograph .......................................................................................................... 146
20.3.2 Flora .................................................................................................................... 146
20.3.3 Fauna .................................................................................................................. 147
20.3.4 Sociology ............................................................................................................. 147
21 Capital and Operating Costs .................................................................................................................. 147
22 Economic Analysis .................................................................................................................................. 148
22.1 Principal Assumptions .................................................................................................. 149
22.2 Cash Flow forecast ....................................................................................................... 149
22.3 Taxes and Royalties ..................................................................................................... 149
22.4 Sensitivity Analysis ....................................................................................................... 150
23 Adjacent Properties ................................................................................................................................ 152
24 Other Relevant Data and Information .................................................................................................. 152
25 Interpretation and Conclusions ............................................................................................................. 153
26 Recommendations ................................................................................................................................... 154
26.1 Exploration and Resources .......................................................................................... 154
26.2 Mineral Resource and Evaluation Budget .................................................................... 154
27 References ................................................................................................................................................ 155
28 Date and Signature Page ........................................................................................................................ 156
29 Certificates of Qualified Persons ........................................................................................................... 157
List of Tables
Table 1.5_1 – Grade Tonnage Report - Itafós Project 12
Table 1.6_1 – Itafós Project - Proposed Resource and Evaluation Budget 24
Table 2.6_1 – List of Abbreviations 27
Table 6_1 – MCB Resource Estimate (3.5% P2O5 Cut-off Grade) 35
Table 6_2 – Mineral Resources, Near Mine Blocks (2.8% Cut-off grade, April 2010) 36
Table 6_3 – Inferred Mineral Resources for Five Outlying Areas 36
Table 9.1_1 – Summary Bulk Density Data - Itafós Project 43
Table 10_1 – Summary Drilling Statistics 44
Table 11.3.1_1 – Assaying Protocols 53
Table 12.2.1_1 – Series #1 Standard Statistics 54
Table 12.2.1_2 – Series #2 Standards Statistics 55
Table 12.2.1_3 – Standards Utilized by MBAC 56

Amazon GeoServices Ltda ABN 52 065 481 209 Mineral Resource Estimate - Arraias Phosphate Project, Para State, Brazil – MBAC Page: vii Effective Date – 27 March 2013
6005 Australia
Table 14.8_2 – Grade Tonnage Report 99
– End of Periods – Domingos – Pre-Stripping through Year 2 111
– End of Periods – Domingos –Year 3 through Year 11 112
– Waste Storage Facility - Domingos 113
– Waste Storage Facility – Near Mine 114
– Waste Storage Facility – Cana Brava 114
– Acidulation Flow-Sheet 127
Table 26.2_1 – Itafós Project - Proposed Resource and Evaluation Budget 154
List of Figures
Figure 1.8_1 – Plan view – General Layout 16
Figure 1.10_1 – Selected Region for the Demand Estimate 20
Figure 4.1_1 – Project Location 28
Figure 4.2_1 – Permit Location 31
Figure 7.2_1 – Project Geology Map 38
Figure 7.2_2 – Outcrop showing main Phosphate Bearing Siltstone 39
Figure 10_1 – Typical Concrete Collar Marker 44
Figure 10.1.1_1 – Wet RC Samples at Bag Farm 45
Figure 10.1.1_2 – Twin Drill Results - (DOMI-RC-0124 & DOMI-DD-0016, 2.78m apart) 45
Figure 10.1.1_3 – Twin Drill Results - (DOMI-RC-0200 & DOMI-DD-0014, 2.05m apart) 45
Figure 10.1.1_4 – Twin Drill Results - (DOMI-RC-0197 & DOMI-DD-0015, 2.60m apart) 46
Figure 10.1.1_5 – Twin Drill Results - (DOMI-RC-0241 & DOMI-DD-0024, 3.15m apart) 46
Figure 10.1.1_6 – Twin Drill Results - (DOMI-RC-0298 & DOMI-DD-0036, 2.80m apart) 46
Figure 10.1.1_7 – Twin Drill Results - (DOMI-RC-0198 & DOMI-DD-0037, 1.60m apart) 46
Figure 10.1.1_8 – Twin Drill Results - (SBEN-RC-0001 & SD-029, 1.05m apart) 46
Figure 10.1.1_9 – Twin Drill Results - (SBEN-RC-0002 & SD-036, 2.11m apart) 46
Figure 11.1.2_1 – Single Tier Splitter 48
Figure 11.1.2_2 – Recommended Riffle Splitters 48
Figure 11.1.2_3 – Original Wet RC Sample 49
Figure 11.1.2_4 – Wet Samples Drying in Oven 49
Figure 11.1.2_5 – Manual Quartering 49
Figure 11.2_1 – Core Storage at Site 50

Amazon GeoServices Ltda ABN 52 065 481 209 Mineral Resource Estimate - Arraias Phosphate Project, Para State, Brazil – MBAC Page: viii Effective Date – 27 March 2013
6005 Australia
Figure 11.2_2 – Pulp Storage at ALS Site Lab 50
Figure 11.2_3 – Reject Sample Storage at Site 51
Figure 12.2.1_1 – RC Blank Results 55
Figure 12.2.1_2 – DD Blank Results 56
Figure 12.2.1_3 – PFA Standard Results for RC Drilling 56
Figure 12.2.1_4 – PFM Standard Results for RC Drilling 57
Figure 12.2.1_5 – PFM Standard Results for DD Drilling 57
Figure 12.2.1_6 – PFB Standard Results for RC Drilling 58
Figure 12.2.1_7 – PFB Standard Results for DD Drilling 58
Figure 12.2.1_8 – P-1 Standard Results from Series #1 for RC Drilling 59
Figure 12.2.1_9 – P-2 Standard Results from Series #1 for RC Drilling 59
Figure 12.2.2_1 – Field Duplicate Data 60
Figure 12.2.2_2 – Pulp Duplicate Data 61
Figure 14.1_1 – Plan View of Block Model Domains 71
Figure 14.2_1 – Near Mine Domain; Soil Wireframe (Clipped to Topography) 73
Figure 14.2_2 – Near Mine Domain; Siltstone and Breccia Wireframes (Clipped to Topography) 73
Figure 14.2_3 – Near Mine Mineral Resource Classification (Includes Portion of Domingos Domain) 77
Figure 14.2_4 – Near Mine Mineral Resource Classification with Drill Collar Locations 78
Figure 14.2_5 – Near Mine Mineral Resource Classification with Domingo Domain Removed 79
Figure 14.2_6 – Near Mine Mineral Resource Classification with Near Mine Domain Displayed 79
Figure 14.2_7 – Near Mine Mineral Resource Classification with P2O5 Grade Range Displayed 80
Figure 14.3_1 – Domingos and Sao Bento Wireframe with Drill Hole Collars 82
Figure 14.3_2 – Domingos and Sao Bento Wireframe with Drillhole Collars and Topography 82
Figure 14.3_3 – 1m Composite Data Statistics for Domingos Domain (Includes Sao Bento) 84
Figure 14.3_4 – Plan View of Domingos Resource Classification 87
Figure 14.3_5 – Near Mine Mineral Resource Classification with P2O5 Grade Range Displayed 88
Figure 14.3_6 – Domingos Measured Resource Location with Drill Collar Locations 89
Figure 14.4_1 – Canabrava Wireframe with Drill Hole Collar Locations 92
Figure 14.4_2 – Canabrava Wireframe with Drill Hole Collar Locations and Topography 93
Figure 14.4_3 – 1m Composite Data Statistics for Canabrava Domain 93
Figure 14.4_4 – Near Mine Mineral Resource Classification with P2O5 Grade Range Displayed 96
Figure 14.4_5 – Plan View of Canabrava Resource Classification 97
Figure 14.4_6 – Canabrava Indicated Resource with Drill Collar Locations 98

Amazon GeoServices Ltda ABN 52 065 481 209 Mineral Resource Estimate - Arraias Phosphate Project, Para State, Brazil – MBAC Page: ix Effective Date – 27 March 2013
6005 Australia
Figure 14.6_1 – Exploration Target Areas 100
Figure 16.1_1 – Plan view – General Layout 104
Figure 16.2_1 – Conceptual Design for Strip Mining 106
Figure 16.2_2 – Conceptual Sequence for Strip Mining 106
Figure 16.2_3 – End of Periods – Domingos – Pre-Stripping through Year 2 110
Figure 16.2_4 – End of Periods – Domingos –Year 3 through Year 11 111
Figure 16.2_5 – Waste Storage Facility - Domingos 112
Figure 16.2_6 – Waste Storage Facility – Near Mine 113
Figure 16.2_7 – Waste Storage Facility – Cana Brava 113
Figure 17.6_1 – Acidulation Flow-Sheet 126
Figure 17.7_1 – Granulation Flow Sheet 127
Figure 17.8_1 – Gas Treatment System Flow Sheet 128
Figure 17.9_1 – Shipment Flow Sheet 129
Figure 19_1 – Selected Region for the Demand Estimate 134
Figure 19.1_1 – Agricultural Potential of the Soils 135

Amazon GeoServices Ltda ABN 52 065 481 209 Mineral Resource Estimate - Arraias Phosphate Project, Para State, Brazil – MBAC Page: 10 Effective Date – 27 March 2013
6005 Australia
1 SUMMARY
1.1 Introduction
Andes Mining Services Ltd (AMS), NCL Brasil Ltda. (NCL) and HDA Serviços S/S Ltda (HDA)
have been commissioned by MBAC Fertilizer Corp (MBAC) to update the technical report for
the Arraias Phosphate Project, located in the municipality of Arraias, Tocantins state, Brazil,
since renamed Itafós-Arraias SSP Project (the “Itafós Project”).
The Technical Report has been prepared under the guidelines of Canadian Institute of Mining
(CIM) National Instrument 43-101 and accompanying documents 43-101.F1 and 43-101.CP
(“NI43-101”).
1.2 Location
The Itafós Project (Arraias) is located in Brazil in an easily accessible region of Goiás and
Tocantins states approximately 400 km northeast of Brazil’s federal capital, Brasilia.
1.3 Ownership
MBAC Fertilizer Corp. (“MBAC”), through its 100% owned Brazilian subsidiary Itafós
Mineração Ltda. (Itafós), is the sole registered and beneficial holder of 36 exploration permits,
5 mining applications and one mining permit for a total of 69,561.17ha.
1.4 Geology and Mineralization
Phosphate mineralization on the project property occurs in lower siltstone sections of the Sete
Lagoas Formation belonging to the Bambuí Group, a Neoproterozoic carbonate sequence
that developed in an intra-cratonic basin on the margins of granitic craton basement (São
Francisco craton). The favourable siltstone sequence has been identified for several tens of
kilometers to the N and S of the original Itafós showings, and host several other phosphate
occurrences in addition to those around Itafós Arraias.
The mineralization at Itafós Arraias is found exclusively within a basal siltstone unit of the Sete
Lagoas Formation of Neoproterozoic age lying directly on granitic basement. On section, this
basal contact appears as an undulating or locally rolling surface (possibly related to local
embayments or paleo-channels developed over basement structures); however the overall
pattern of mineralization can be described as stratiform.
MBAC is currently focussed on the commissioning of the plant and no additional exploration is
underway.
1.5 Mineral Processing and Metallurgical Testing
Crushing & Comminution
All of the grinding parameters for the Itafós Project were determined by HDA services in Brazil
(1). The mill sized by HDA services was a low aspect SAG mill with dimensions of 16.5’
Internal Diameter x 29’ EGL and with installed motor capacity of 3500 kW.

Amazon GeoServices Ltda ABN 52 065 481 209 Mineral Resource Estimate - Arraias Phosphate Project, Para State, Brazil – MBAC Page: 11 Effective Date – 27 March 2013
6005 Australia
Process Flotation Definition
Studies were conducted to evaluate the flotation process route to recover phosphate
contained in the siltstone of the Itafos targets (Arraias Tocantins deposit) commenced in the
second quarter of 2008.
Several bench and pilot plant tests have been performed over the past two years using
material from the main defined resource targets of the Arraias Tocantins deposit. A consistent
and reproducible processing flotation flow-sheet was developed to treat the various sources
from the deposit. This process allows the beneficiation of phosphate ore containing 4.5% to
6.0% P2O5 to concentrates containing 28% P2O5 whilst recovering 55 to 58% of the
contained P2O5.
The pilot tests were conducted using material from the Coité and São Bento deposits, using
both mechanical and column flotation cells. In addition to this, samples of drilled material from
several other areas of the Arraias Tocantins mineral deposit were tested at bench scale with
the results confirming the validity of the process route selected for the entire Arraias Tocantins
deposit.
Conclusions
Considering all the tests performed with several phosphate rock concentrations (P2O5,
Fe2O3/Al2O3 or Fluorine) with different granulometry, variations in the A/R ratio and sulphuric
acid concentration, it is possible to conclude the following:
1) The production of ammoniated SSP with 1% of nitrogen and 17% of soluble P2O5 in
NAC with Itafos’ rocks with of 27-28% of P2O5 is viable and it is the most suitable
solution for the specific acidulation process. It is possible, with the addition of the
ammonium (N), to obtain a product with its quality improved because of its reduced free
acidity and because the granules in the granulation plant become harder, allowing for
the SSP to be mixed with urea and other raw materials without creating parallel
reactions that can provoke the final NPK to become a paste
2) It is also viable to obtain SSP (single superphosphate) with 18% of soluble P2O5 in
neutral ammonium citrate, without the addition of ammonia, from rocks with a grades of
28% of P2O5 and lower levels of Fe2O3 (1.5% or below). The solubility of P2O5 in
water is close to the limit of minimal guarantee of 15%. This solution was not chosen
because the lower flexibility and poor product physical quality.
3) At this point it must be considered that the ammoniated SSP production with 2% of
nitrogen and 16% of P2O5 NAC is also one possible option, as it allows for a greater
flexibility in regards to the grades of P2O5 and provides even lower free acidity when
compared to the chosen solution.
4) It is better to produce SSP from the “pulp” of a phosphate rock with the addition of
water before the sulphuric acid dosage, to optimize the process reactivity.
5) Rock with granulometry 95% below the 200# is adequate to the process reactivity.

Amazon GeoServices Ltda ABN 52 065 481 209 Mineral Resource Estimate - Arraias Phosphate Project, Para State, Brazil – MBAC Page: 12 Effective Date – 27 March 2013
6005 Australia
6) With low fluorine levels in the phosphate rock, the emissions of this effluent are easier
to be absorbed in the gas scrubber system.
7) The sulphuric acid consumption is lower than the usually utilized in other rocks to
obtain the best possible conversion.
8) The optimum sulphuric acid concentration is equal or inferior to 65% to guarantee an
aqueous phase, appropriated to the process reactivity.
1.6 Mineral Resources
The updated mineral resource estimate has been classified effective as of December 20,
2011 by Bradley Ackroyd (BSc (Geo) MAIG) principal consulting geologist for Andes Mining
Services Ltd (“AMS”), a qualified person, in accordance with National Instrument 43-101.
Table 1.6_1
Itafós Project
Measured, Indicated and Inferred Mineral Resource Grade Tonnage Report - 20 December 2011
Ordinary Kriging (OK) Block Model – 12.5mE X 12.5mN X 3mRL Target Tonnage (Mt) P2O5 %
Near Mine (Wardrop July 9, 2010) 2.8% cut off grade applied
Measured 15.2 4.38
Indicated 9.4 4.12
M&I 24.6 4.28
Inferred 3.8 3.99
Canabrava (MBAC - Nov 2011) 2.8% cut off grade applied
Measured
Indicated 20.4 5.53
M&I 20.4 5.53
Inferred 3.7 4.94
Domingos (MBAC Nov 2011) 1.5% cut off grade applied
Measured 5.6 6.04
Indicated 28.4 4.87
M&I 34.0 5.06
Inferred 5.2 2.99
TOTAL M&I 79.0 4.94
TOTAL Inferred 12.7 3.85
(1) The effective date of the Mineral Resource is December,20 2011 (2) The Mineral Resource Estimate for the Arraias Tocantins deposit was constrained within lithological and grade based solids within the top 80m from surface. (3) Mineral Resources for the Arraias Tocantins deposit have been classified according to the “CIM Standards on Mineral Resources and Reserves: Definitions and Guidelines (July 2011) and reviewed by Bradley Ackroyd (BSc (Geo) MAIG) an independent Qualified Person as defined by National Instrument 43-101.

Amazon GeoServices Ltda ABN 52 065 481 209 Mineral Resource Estimate - Arraias Phosphate Project, Para State, Brazil – MBAC Page: 13 Effective Date – 27 March 2013
6005 Australia
The measured and indicated mineral resource estimate comprises 79.0 million tonnes grading
4.94% P2O5 (using a 1.5% cut-off for the Domingos target and a 2.8% cut-off for all other
targets).
Drilling, sampling and QAQC procedures were established at the beginning of the resource
drilling campaign and conform to acceptable industry standards. QAQC procedures include
inclusion of 5% certified phosphate standards, 5% field duplicates and 9 twin drill holes
comparing reverse circulation and diamond drilling. Results have returned acceptable
precision and accuracy. All recent drilling has been analysed at ALS Chemex Ltd laboratory.
Given increased geological knowledge from current mining activity (which will allow more
detailed domain modelling mainly focussed on the limits of breccia zones), along with minor
limitations identified by AMS in the current mineral resource estimate, AMS recommends that
an updated mineral resource for all domains be undertaken.
1.7 Mineral Reserve
NCL was provided with three updated resource block models: Near Mine, dated July 2010
and developed by Wardrop; Cana Brava, dated December 2011 and developed internally by
Itafós personnel; and Domingos, dated December 2011 and developed by MBAC and
supervised by AMS.
Block models included resources classified as measured, indicated and inferred. Contained
measured resources are transferred to proven reserves and contained indicated resources
are transferred to probable reserves. Inferred mineral resources are not converted to reserves
and are instead treated as waste for mine planning purposes.
It is the opinion of NCL that the mine production schedule defines the mineral reserve for a
mining project. Table 15_1 reports the mineral reserve of the Itafós Project based on the
production schedule used for this study.
Table 1.7_1 – Total Mining Reserve Summary (1)(2)
Ore Source Ktonnes P2O5 (%)
Proven Reserve 15,954 5.09
Probable Reserve 48,857 5.07
Total Reserve 64,811 5.07
Total Material 253,017 Strip ratio 2.90
(1) The Mineral Reserves as set out in the table above have been estimated by Carlos Guzmán of NCL Brasil
Ltda, who is a Qualified Person under NI 43-101, Fellow Member of the AusIMM and Registered
Member of the Chilean Mining Commission.
(2) Numbers may not add up due to rounding.

Amazon GeoServices Ltda ABN 52 065 481 209 Mineral Resource Estimate - Arraias Phosphate Project, Para State, Brazil – MBAC Page: 14 Effective Date – 27 March 2013
6005 Australia
1.8 Mining Methods
The final pit design was based on the economic shells generated at a revenue factor equal to
1.0 and minimum cut-off grades of 1.8% P2O5 for Domingos and 2.8% P2O5 for Cana Brava
and Near Mine. A constant 49.0° inter ramp angle. Table 1.8_1 shows the key open pit design
parameters.
Table 1.8_1 – Culture Analysis
Bench Height 6 m (two stacked 3m benches)
Berm Width 3 m
Batter Angle 82.0°
Inter-ramp Angle 49.0°
Ramp Width 15 m
Ramp Gradient 10%
Geotechnical information is not available, but mining activity is already developed in the area
which supports the adopted parameters shown in
The ramps width of 15 meters can accommodate up to 50 tonne trucks. NCL used the 10%
road gradient, which is common in the industry for this type of trucks.
The current mine plan is designed with 3m benches stacked to 6 meters (i.e. two stacked
benches).
For the required mining rate the appropriate loading equipment is medium size front end
loaders or hydraulic excavators, ranging between 3.5 m3 to 4.3m3 capacities. The minimum
operating widths to achieve the required productivities with this equipment is about 25m.
Figure 1.8_1 shows the final pit design which is a result of different pits for the seven sectors
(five in Near Mine, Domingos and Cana Brava), designed according to the obtained pit shell of
the optimization process. The pit exits were orientated to the selected position of the
processing plant. The total area disturbed by the pits is about 670 hectares

Amazon GeoServices Ltda ABN 52 065 481 209 Mineral Resource Estimate - Arraias Phosphate Project, Para State, Brazil – MBAC Page: 15 Effective Date – 27 March 2013
6005 Australia
Figure 1.8_1 – Plan view – General Layout
A mine production schedule was developed to show the ore tonnes, grades, total material and
waste material by year throughout of the life of the mine. The distribution of ore and waste
contained in each of the mining sectors was used to develop the schedule, assuring that
criteria such as continuous ore exposure, mining accessibility, and consistent material
movements were met.
The proposed mining method considers the backfilling of the previously mined strips. This
concept can be theoretically applied for all of the mine life, except at the beginning of each
sector. Five waste storage facilities were designed, one for Domingos, one for Cana Brava
and three in Near Mine.
Mine equipment requirements were calculated based on the annual mine production
schedule, the mine work schedule, and equipment annual production capacity estimates.
The study is based on operating the Itafós Project mine with excavators of 3.5m3 capacities
for ore and excavators of 4.3m3 for waste. Trucks with a nominal capacity of 39 tonnes and
effective capacity of 27 tonnes were considered, for both, ore and waste. The difference in
capacity between nominal and effective is due to the low density of the material.
Amazon GeoServices Ltda ABN 52 065 481 209 Mineral Resource Estimate - Arraias Phosphate Project, Para State, Brazil – MBAC Page: 16 Effective Date – 27 March 2013
6005 Australia
According to the geotechnical characteristics of the rock, was estimated that only 10% of the
material will require drill and blast. An allowance had made for the cost, considering US$2.0/t,
as part of the general mining cost.
Major auxiliary equipment refers to the major mine equipment that is not directly responsible
for production, but which is scheduled on a regular basis. Equipment operating requirements,
operating hours and personnel requirements were estimated for this equipment.
The primary function of the auxiliary equipment is to support the major production units, and
provide safe and clean working areas.
1.9 Recovery Methods
The mineral processing plant was designed based on the metallurgical test work completed
and consider the following main design parameters:
An ore with a feed grade of 5.32 % P2O5;
Production of 330,000 t/year of concentrate assaying 28% P2O5 with a metallurgical
recovery of 54% from the column flotation of the conventional and produced slimes
fractions;
Production of 94,000 t/year of concentrate assaying 15% P2O5 with a metallurgical
recovery of 8.4% from the column flotation of the natural slimes; and
Total availability of 89%.
The plant has been designed to treat 3.5 million tonnes/year of run of mine (“ROM”),
considering the parameters above. The samples tested in the pilot plant had grades varying
from 4.4 to 6.3% P2O5 and the average mass and P2O5 partition obtained in the steps of the
process was used to calculate the material balance.
The process adopted consists of the following steps, as shown in the figure below:
Primary crushing of the ROM material;
Grinding of the coarse fractions in a SAG mill; and
Classification of the ore into three size fraction streams to produce the materials
denominated as natural slimes, produced slimes and conventional.

Amazon GeoServices Ltda ABN 52 065 481 209 Mineral Resource Estimate - Arraias Phosphate Project, Para State, Brazil – MBAC Page: 17 Effective Date – 27 March 2013
6005 Australia
Each one of these size fractions is floated in columns to produce the three concentrates.
Natural slimes concentrate with a grade of 15% will be dewatered in a thickener and a press
filter. The cake will be dried in rotary drier and sent for shipment.
Produced slimes concentrate will be thickened in a pond and the underflow will be pumped to
the acidulation plant.
Conventional concentrate will be reground to 95% passing 44 microns to improve reactivity,
submitted to magnetic separation to reduce iron content and then will be dewatered in a
thickener and a press filter. The cake will be stock piled and reclaimed to the acidulation plant
where it will be combined with the slimes concentrate produced.
All the tailings are combined and sent to the tailings dam by gravity. The crushing plant was
designed to avoid dry operations as much as possible in order to maximize plant availability,
due to the sticky characteristics of the Arraias Tocantins ore. Therefore, it was decided to use
only one crushing stage followed by a SAG milling circuit to avoid clogging conveyor belts and
screens which can occur when secondary and tertiary crushing stages are utilized.
Pilot plant results showed that column flotation presented a better performance than
mechanical cells. For this reason column cells were selected as the flotation equipment.

Amazon GeoServices Ltda ABN 52 065 481 209 Mineral Resource Estimate - Arraias Phosphate Project, Para State, Brazil – MBAC Page: 18 Effective Date – 27 March 2013
6005 Australia
The major equipment items including the crusher, SAG mill, thickeners and filters were sized
based upon specific laboratory test results conducted on samples of the ore, mill feed and
concentrates.
In the Sulphuric Acid Plant Process phases are as follows:
Storage of sulphur;
Sulphur melting and filter;
Sulphur burning in reaction with oxygen air;
SO2 conversion into SO3
SO3 gases scrubber and absorption in appropriate tower;
Cooling and storage of acid product.
The phosphate rock from the stockpile will be reclaimed by a front end loader to a belt
conveyor to feed the repulping tank. After being repulped, the slurry will be pumped to the
intensive mixer where sulphuric acid (H2SO4) will be introduced. By the end of the process
the single superphosphate powder (SSP) will be transferred to the cure warehouse.
Then the single superphosphate powder (SSP) from the cure warehouse will be transferred to
the granulator drum where ammonia, water, and slurry from the gas treatment system will be
introduced. The gases produced in the granulator will direct to the gas treatment system while
the product will direct to the rotary dryer.
When drying operation is completed, the granulated SSP will be stockpile in the granular
product pile. Finally, a front end loader will transfer the granulate product from the stockpile
into a hopper fitted with a belt conveyor to feed the big bags system located on the trucks.
The trucks will be positioned in a road scale to assure they load correct weight.
1.10 Market Studies
In order to analyse the fertilizer market in the MBAC target region, MB Agro, a consulting
company specialized in the Brazilian Fertilizer Market, has prepared a study, forecasting
future fertilizer demand and analysing domestic supply as well as local infrastructure.
MBAC target region is represented by the central-northern and north-eastern Brazil, including
the main MBAC potential regions as western Bahia state, Northern Goiás state, North-eastern
Mato Grosso State and Tocantins state as marked in blue in Figure 1.10_1.

Amazon GeoServices Ltda ABN 52 065 481 209 Mineral Resource Estimate - Arraias Phosphate Project, Para State, Brazil – MBAC Page: 19 Effective Date – 27 March 2013
6005 Australia
Figure 1.10_1 – Selected Region for the Demand Estimate
Within the Brazilian territory, which has 851 million hectares, the present study focuses its
analysis on states with important agricultural potential. The area under consideration totals
308 million hectares.
Brazil, being one of the countries with the world’s largest agricultural area and one of the few
countries that still has room to expand the production area, is facing growing global demand
for food and biofuel. All of these factors are very favourable for growth in agriculture in Brazil.
The consumption of fertilizers in Brazil has increased 5.0% every year for the last 23 years. In
2008, it reached, according to the National Association for the Promotion of Fertilizers
(“ANDA”), 9.4 million tonnes of nutrients (NPK), which means a volume of 22.4 million tonnes
of intermediate products. The internal production made up 40% of this demand totalling 8.8
million tonnes.
Although there is available area for expansion in Brazil, the traditional regions, especially the
South region, there is no more room for expansion. In these states, the supply growth will be
driven by productivity more than area. This variable was also controlled in our projections and
results.
For production, it is estimated that the region should increase from 96 million tonnes to 360
million until 2040, with sugarcane and soy primarily responsible for the increase. To meet
expected demand, the sugarcane production should grow 260% and soybean, 435% in the
target region of the study.
Given the areas and expected productivities in question, we estimated that demand for NPK
should rise from 1 million tonnes in 2008 to 4.7 million tonnes in 2040. The demand will
continue to grow driven largely by the need for phosphate and potash.
The values for nutrients are shown in the Table 1.10_1 which also provides information on
sulphur demand, which is expected to grow 255% and reach 689 thousand tonnes in 2040.

Amazon GeoServices Ltda ABN 52 065 481 209 Mineral Resource Estimate - Arraias Phosphate Project, Para State, Brazil – MBAC Page: 20 Effective Date – 27 March 2013
6005 Australia
Table 1.10.10_1 – NPK Consumption – Target Region (thousand tonnes)
The Brazilian soils are known to be poor in nutrients especially in the region. These soils have
a deficit of sulphur. It can be affirmed that there are few alternatives for sulphur nutrition. In
practice, basically you have the option of the SSP and the gypsum, which is a scarce product
in a lot of areas of the country, especially in the interest area of the project.
So, due to the expected demand of Sulphur and Phosphate, we believe that the development
of the agricultural area in the region will require much greater use of SSP and represents an
unique opportunity to the company.
1.11 Environmental Studies
An Environmental Impact Study (EIS) about the potential impacts over the project’s site,
including a detailed Operations Plan description, is required by the NATURATINS
(Environmental Agency of Tocantins State) before any construction and mine operations can
begin. The Operations Plan consists of the basic mine plan, infrastructure, and operational
aspects of the Project. The EIS consists in the reviewing of the Plan of Operations to
understand the project impact over the natural resources, fauna, flora and the neighbouring
communities, including its cultural and historical heritage. The Environmental Impact Report
(EIR) consists of a document that presents only the most important parts of all content of the
Environmental Study, written in a colloquial language, in order the matter to be easily
understood and discussed by the population.
The Environmental Study was submitted to the NATURATINS, in July, 2010. The
NATURATINS has up to six months to evaluate the Environmental Study and deliver the
Impact Report to National Environmental Agencies i.e. IBAMA and other environmental
related regulatory agencies that are required to review the project viability.
The Public Hearing, in accordance with the CONAMA 009/1987 (the Federal Council that
rules the Brazilian environmental licensing process) have the objective to show to all the
people living near from the project area, the environmental impacts and other changes that
will be potentially caused by the project In this Public Hearing the Company must be present
to present information about the project and answer all questions from the people who live
around the project and representatives of governmental and nongovernmental organizations,
and collect comments and suggestions about the project. The public hearing shall occur
according to the criteria of the NATURATINS. Additional Public Hearings could occur if
requested by authority of the civil prosecutor or by manifestation signed from more than 50

Amazon GeoServices Ltda ABN 52 065 481 209 Mineral Resource Estimate - Arraias Phosphate Project, Para State, Brazil – MBAC Page: 21 Effective Date – 27 March 2013
6005 Australia
people from the community that live near from the project. The company has the responsibility
to facilitate the location and transportation to the proposed Public Hearing site.
Actually, the Public Hearings occurred in September 21, 2010, at the Arraias Church Hall,
when were present almost 600 people, discussing and debating about the EIR of Arraias
Project. Based on this event and after the studies presented evaluation, the NATURATINS
issued the Preliminary License (permit) in December 2010. This document means that the
project is feasible from an environmental standpoint.
The next step was to present the Basic Environmental Project (BEP) which consists of a set of
actions, plans and programs that aims to prevent, reduce or avoid the environmental impacts
that could be caused by the project’s construction over the surrounding natural resources and
the communities.
The BEP was approved after review by NATURATINS, which issued the Installation License
(permit) for the project in March 2011, which enabled the start of construction. Others permits
were necessary and obtained, like water grant from National Water Agency, because the
project uses a federal water to obtain water, and deforestation permits.
During the construction, environmental teams were working to ensure compliance with the
environmental commitments. Thus, with the approaching end of construction and
environmental commitments executed, the company requested the NATURATINS the
Operating License (permit) to start to produce. Itafós has received operating permits for the
water dam, the tailings dam and the beneficiation plant. The remaining licenses will be issued
in the next weeks as construction is completed.
1.12 Capital and Operating Expenditures
The Capital Cost Expenditure (CAPEX) and Operating Cost Expenditure (OPEX) have been
updated since the previous report. The new estimative for Itafós Project development have
been estimated to February/2013 rates. The accuracy assumed to prepare the CAPEX and
the OPEX is ±5% due the advanced stage of the plant construction. The exchange rates
applied to the CAPEX calculation was US$ 1.00 = R$ 2.086 and the OPEX was US$ 1.00 =
2.10.
The CAPEX and OPEX assumed for the Arrais project are summarised in table 1.12_1 and
table 1.12_2 below (see appendix 1 for detailed CAPEX):

Amazon GeoServices Ltda ABN 52 065 481 209 Mineral Resource Estimate - Arraias Phosphate Project, Para State, Brazil – MBAC Page: 22 Effective Date – 27 March 2013
6005 Australia
Table 1.12_1 – Capex Assumptions
Table 1.12_2 – Opex Assumptions
1.13 Economic Analysis
MBAC team used the discounted cash flow model to estimate the “fair value” of the Itafós
Project relying on the technical, commercial and economic information and data available by
the time of this release.
When constructing the model we considered all prices FOB MBAC site (Arraias – TO). The
current Single Super Phosphate (“SSP”) price is considered in the model as a projected price
for the life of the mine levied by 2% inflation (CPI) on a yearly basis after 2014. All costs in
Brazilian Reais were levied by the estimated inflation of 4.5% (IGPM) on a yearly basis.
DESCRIPTION UNIT 2013 2014 2015 2016 2017 2018 2019
Mining Cost USD/t SSP 56.20 31.98 31.11 33.08 38.04 33.86 35.28
Labour Cost USD/t SSP 26.22 12.53 12.55 12.55 12.59 12.83 12.59
Maintenance Cost USD/t SSP 8.52 4.26 4.26 4.26 4.28 4.36 4.28
Energy Cost USD/t SSP 15.39 10.46 10.54 10.55 10.55 10.54 10.55
Reagents Cost USD/t SSP 39.99 35.08 34.96 34.96 34.97 34.94 34.96
Sulfur Cost USD/t SSP 36.62 28.05 26.97 26.97 26.97 26.95 26.97
Ammonia Cost USD/t SSP 13.02 14.64 14.62 14.62 14.63 14.61 14.62
CFEM USD/t SSP 2.19 1.29 1.28 1.32 1.42 1.33 1.36
TOTAL USD/t SSP 198.15 138.29 136.29 138.30 143.44 139.44 140.61

Amazon GeoServices Ltda ABN 52 065 481 209 Mineral Resource Estimate - Arraias Phosphate Project, Para State, Brazil – MBAC Page: 23 Effective Date – 27 March 2013
6005 Australia
We are also assuming that the recovery of P2O5 during the mine life is 53% and that the
increase in the operating cost after the first years is a result of the estimated decrease of the
P2O5 grade during the mine life.
The principal assumptions made in the DCF model are summarised in Table 1.13_1:
Table 1.13_1 – Input Factors for DCF Model
DESCRIPTION Value Proven and probable reserves (million tonnes) 64.8
Mine life (years) 19
CAPEX ($ millions) $323.1
Payback period (years) 4.5
SSP Selling Price 2013 per tonne (FOB Arraias – US$) $280
SSP Selling Price 2014 per tonne (FOB Arraias – US$) $325
Sulphur Price per tonne (CIF Arraias – US$) $240
Ammonia Price per tonne (CIF Arraias – US$) $1,200
Grinding Ball Price per tonne (CIF Arraias – US$) $1,781
Sodium Silicate Price per tonne (CIF Arraias – US$) $352
Caustic Soda Price per tonne (CIF Arraias – US$) $467
Soybean Oil Price per tonne (CIF Arraias – US$) $1,514
Energy (US$/Mwh) $87
Operating cost (SSP) p/tonne – first 5 years (excl. 2013) 139
Operating cost (SSP) p/tonne – over mine life (US$ 2013) 162
Foreign exchange (BRL/USD) 2.1
Average run-of-mine (“ROM”) P2O5 grade – first 10 years 5.56%
Average run-of-mine (“ROM”) P2O5 grade – over mine life 5.08%
Discount Rate (WACC) 10.00%
CPI per year 2.00%
Brazilian CPI per year (IGPM) 4.50%
Plant Recovery for P2O5 53.0%
After applying all the assumptions, the DCF model has a NPV of USD 254.2m, an IRR of 21%
and payback period of 4.5 years. The cash flow forecast can be seen in Table 22_2.
1.14 Conclusions and Recommendations
AMS considers that the proposed exploration and development strategy is entirely appropriate
and reflects the potential of the Itafós Project.
AMS has made a number of recommendations within this report to increase the mineral
resource confidence and project development with key recommendations listed below:
Infill drilling across the Domingos and Canabravas domains to a 50m by 50m spacing
in order to quantify further Measured resource category material;
Given increased geological knowledge from current mining activity (which will allow
more detailed domain modelling mainly focussed on the limits of breccia zones) ,

Amazon GeoServices Ltda ABN 52 065 481 209 Mineral Resource Estimate - Arraias Phosphate Project, Para State, Brazil – MBAC Page: 24 Effective Date – 27 March 2013
6005 Australia
along with minor limitations identified by AMS in the current mineral resource
estimate, AMS recommends that an updated mineral resource for all domains be
undertaken.
The cost estimate for the recommended work program is shown in Table 1.14_1 below;
Table 1.14_1
Itafós Project
Proposed Resource and Evaluation Expenditure
Activity Total (US$)
Infill Drilling (50 x 50m Grid) $ 300,000
Assay Testwork $ 30,000
Updated Resource Studies $ 40,000
Travel and accommodation $ 20,000
Field supervision and support $ 30,000
Administration $ 30,000
Sub-total $ 450,000
MBAC has undertaken a systematic exploration program that has been successful in defining
significant resources of phosphate in close proximity to one of the largest agricultural centres
in Brazil.
Further scope exists to improve the geological and mineral resource estimation confidence in
the regions currently defined as an inferred mineral resource.
Given increased geological knowledge from current mining activity along with minor limitations
identified by AMS in the current mineral resource estimate, AMS recommends that an
updated mineral resource for all domains be undertaken.
AMS concludes that there are no fatal flaws in the current resource data.
The mine plan has not been fully optimized and it is likely that further scheduling work will
smooth out some of the grade and ore extraction variations seen in this study. The optimized
mine plan may mean that higher-grade ore is available to the mill sooner in the schedule, thus
having a positive effect on the discounted cash flow.
Finally, the economics of the project present a very positive rate of return for the investment.
Even considering possible variations in the sales price, operating costs and others as seen in
the sensitivity analysis the project economics can be considered very attractive

Amazon GeoServices Ltda ABN 52 065 481 209 Mineral Resource Estimate - Arraias Phosphate Project, Para State, Brazil – MBAC Page: 25 Effective Date – 27 March 2013
6005 Australia
2 INTRODUCTION
2.1 Scope of Work
Andes Mining Services Ltd (AMS), NCL Brasil Ltda. (NCL) and HAD Serviços S/S Ltda (HDA)
have been commissioned by MBAC Fertilizer Corp (MBAC) to update the technical report for
the Itafós-Arraias SSP Project, in the municipality of Arraias, Tocantins state, Brazil (“Itafós
Project”).
The Technical Report has been prepared under the guidelines of Canadian Institute of Mining
(CIM) National Instrument 43-101 and accompanying documents 43-101.F1 and 43-101.CP
(“NI43-101”).
2.2 Forward Looking Information
This report contains "forward-looking information" within the meaning of applicable Canadian
securities legislation. Forward-looking information includes, but is not limited to, statements
related to the capital and operating costs of the Itafós Project, the price assumptions with
respect to phosphate materials, production rates, the economic feasibility and development of
the Itafós Project and other activities, events or developments that the MBAC expects or
anticipates will or may occur in the future. Forward-looking information is often identified by
the use of words such as "plans", "planning", "planned", "expects" or "looking forward", "does
not expect", "continues", "scheduled", "estimates", "forecasts", "intends", "potential",
"anticipates", "does not anticipate", or "belief", or describes a "goal", or variation of such words
and phrases or state that certain actions, events or results "may", "could", "would", "might" or
"will" be taken, occur or be achieved.
Forward-looking information is based on a number of factors and assumptions made by the
authors and management, and considered reasonable at the time such information is made,
and forward-looking information involves known and unknown risks, uncertainties and other
factors that may cause the actual results, performance or achievements to be materially
different from those expressed or implied by the forward-looking information. Such factors
include, among others, obtaining all necessary financing, licenses to explore and develop the
project; successful definition and confirmation based on further studies and additional
exploration work of an economic mineral resource base at the project; as well as those factors
disclosed in MBAC’s current Annual Information Form and Management's Discussion and
Analysis, as well as other public disclosure documents, available on SEDAR at
www.sedar.com.
Although MBAC has attempted to identify important factors that could cause actual actions,
events or results to differ materially from those described in forward-looking information, there
may be other factors that cause actions, events or results not to be as anticipated, estimated
or intended. There can be no assurance that forward-looking information will prove to be
accurate. The forward-looking statements contained herein are presented for the purposes of
assisting investors in understanding MBAC’s plan, objectives and goals and may not be
appropriate for other purposes. Accordingly, readers should not place undue reliance on
forward-looking information. MBAC does not undertake to update any forward-looking
information, except in accordance with applicable securities laws.

Amazon GeoServices Ltda ABN 52 065 481 209 Mineral Resource Estimate - Arraias Phosphate Project, Para State, Brazil – MBAC Page: 26 Effective Date – 27 March 2013
6005 Australia
2.3 Principal Sources of Information
In addition to site visits undertaken by Mr. Bradley Ackroyd (AMS) between 25th and 27
th
February 2013 and Mr. Carlos Guzmán on 6th April 2010, the authors of this report has relied
extensively on information provided by MBAC along with discussions with MBAC technical
personnel. A full listing of the principal sources of information is included in Section 27 of this
report and a summary of the main documents is provided below:
MBAC (Oct, 2010) - Technical Report on Arraias Tocantins Feasibility Study
Letter dated 20 September 2011 - Magma Serviços de Mineração Ltda, of Brasilia,
Brazil
The authors have made enquiries to establish the completeness and authenticity of the
information provided and identified. The authors have taken all appropriate steps in their
professional judgement, to ensure that the work, information or advice contained in this report
is sound and The authors do not disclaim any responsibility for this report.
2.4 Qualifications and Experience
The “qualified persons” (as defined in NI 43-101) for this report are Mr. Beau Nicholls (AMS) Mr.
Bradley Ackroyd (AMS), Mr Carlos Guzman (NCL) and Mr. Homero Delboni (HDA).
Mr. Nicholls is an asociate consulting geologist for AMS with 17 years experience in exploration
and mining geology. Mr. Nicholls is a Member of the Australian Institute of Geosciences (MAIG)
and is responsible for sections 7 to 12, and jointly responsible for sections 1 to 7 and 23 to 26.
Mr. Ackroyd is the principal consulting geologist for AMS with 11 years experience in exploration
and mining geology. Mr. Ackroyd is a Member of the Australian Institute of Geosciences (MAIG)
and is responsible for section 14 and jointly responsible for sections 7 to 12.
Mr Guzman has 21 years of experience with main field of expertise in open pit mine design and
planning. Mr Guzmán is a Member of the AusIMM since July 2007 (229036), and elected to the
Fellow grade (FAusIMM) since July 2012; and Registered Member of the Chilean Mining
Commission since August 2011. Mr. Guzmán is responsible for sections 15 to 16 and 23 to 26.
Mr Delboni has 30 years of experience in metallurgy process design and major mining projects
engineering and implementation. Mr Delboni is a practicing engineer and a registered member
of the CIM - Canadian Institute of Mining, Metallurgy and Petroleum; and of the SME - Society
for Mining, Metallurgy and Exploration. Mr. Delboni is responsible for sections 13 and 17 to
22.
Neither the authors of this report have or have had previously any material interest in MBAC
or related entities or interests. Our relationship with MBAC is solely one of professional
association between client and independent consultant. This report is prepared in return for
fees based upon agreed commercial rates and the payment of these fees is in no way
contingent on the results of this report.

Amazon GeoServices Ltda ABN 52 065 481 209 Mineral Resource Estimate - Arraias Phosphate Project, Para State, Brazil – MBAC Page: 27 Effective Date – 27 March 2013
6005 Australia
2.5 Units of Measurements and Currency
Metric units are used throughout this report unless noted otherwise. Currency is United
States dollars ("US$").
2.6 Abbreviations
A full listing of abbreviations used in this report is provided in Table 2.6_1 below.
Table 2.6_1
List of Abbreviations
Description Description
$ United States of America dollars l/hr/m2 litres per hour per square metre
“ Inches M million
µ Microns m metres
3D three dimensional Ma thousand years
AAS atomic absorption spectrometry Mg Magnesium
Au Gold ml millilitre
bcm bank cubic metres mm millimetres
CC correlation coefficient Mtpa million tonnes per annum
cm Centimetre N (Y) northing
Co Cobalt Ni nickel
CRM certified reference material or certified standard NPV net present value
Cu Copper NQ2 Size of diamond drill rod/bit/core
CV coefficient of variation ºC degrees centigrade
DDH diamond drillhole OK Ordinary Kriging
DTM digital terrain model P80 -75µ 80% passing 75 microns
E (X) Easting Pd palladium
EDM electronic distance measuring ppb parts per billion
Fe Iron ppm parts per million
G Gram psi pounds per square inch
g/m3 grams per cubic metre PVC poly vinyl chloride
g/t grams per tonne of gold QC quality control
HARD Half the absolute relative difference QQ quantile-quantile
HDPE High density poly ethylene RC reverse circulation
HQ2 Size of diamond drill rod/bit/core RL (Z) reduced level
Hr Hours ROM run of mine
HRD Half relative difference RQD rock quality designation
ICP-AES inductivity coupled plasma atomic emission spectroscopy SD standard deviation
ICP-MS inductivity coupled plasma mass spectroscopy SG Specific gravity
ISO International Standards Organisation Si silica
kg Kilogram SMU selective mining unit
kg/t kilogram per tonne t tonnes
km Kilometres t/m3 tonnes per cubic metre
km2 square kilometres tpa tonnes per annum
kW Kilowatts UC Uniform conditioning
kWhr/t kilowatt hours per tonne w:o waste to ore ratio

Amazon GeoServices Ltda ABN 52 065 481 209 Mineral Resource Estimate - Arraias Phosphate Project, Para State, Brazil – MBAC Page: 28 Effective Date – 27 March 2013
6005 Australia
3 RELIANCE ON OTHER EXPERTS
AMS has relied on the independent lawyers Magma Serviços de Mineração Ltda., of Brasilia,
Brazil for their opinion on the title for the Itafós Project mineral permits and AMS have
received a memorandum from them dated 20 September 2011, supporting MBAC’s claims.
MBAC is utilizing a number of experts in respects to the Itafós Project. They are listed below:
Andes Mining Services – Exploration, Geology and Mineral Resource Estimates.
NCL Brasil Ltda – Mine design and planning, Mineral Reserves Estimates
HDA Serviços S/S – Metallurgy design and performance

Amazon GeoServices Ltda ABN 52 065 481 209 Mineral Resource Estimate - Arraias Phosphate Project, Para State, Brazil – MBAC Page: 29 Effective Date – 27 March 2013
6005 Australia
4 PROPERTY DESCRIPTION AND LOCATION
4.1 Project Location
The project is located in Brazil and straddles the state limit between Tocantins to the north
and Goiás to the south (see Figure 4.1_1). The exploration field office, sample preparation
laboratory and other facilities are located ~7 km northeast from Campos Belos, the nearest
settlement of any size (19,000 inhabitants).
The roads connecting the project to the main cities and commercial centres in the region are
paved and in good conditions. The field office and most exploration areas are easily
accessible from Campos Belos all year round through a good network of gravel roads.
Figure 4.1_1 Project Location

Amazon GeoServices Ltda ABN 52 065 481 209 Mineral Resource Estimate - Arraias Phosphate Project, Para State, Brazil – MBAC Page: 30 Effective Date – 27 March 2013
6005 Australia
4.2 Tenement Status
MBAC, through its 100% owned Brazilian subsidiary Itafos Mineracao Ltda (Itafós), is the sole
registered and beneficial holder of 36 exploration permits, 5 mining applications and one
mining permit for a total of 69,561.17ha. Details of MBAC permits in the Arraias region are
found in Table 4.2_1 and Figure 4.2_1.
The exploration permits are valid for three years and are renewable for up to an equal period.
MBAC are required to pay $ 2.36 Brazilian Reais per hectare per year to the DNPM for permit
annual maintenance fee.
Table 4.2_1
Summary of MBAC Permits Status in the Arraias Region
Permit Type Permit No. Project Holder Area (Ha)
Comments
Mining Permit 864.113/03 ARRAIAS ITAFÓS 1,062.56 Mining Permit
Mining Application
864.173/04 ARRAIAS ITAFÓS 122.95 Mining Application
registered
Mining Application
864.174/04 ARRAIAS ITAFÓS 1,152.44 Mining Application
registered
Mining Application
864.175/04 ARRAIAS ITAFÓS 989.32 Mining Application
registered
Mining Application
864.176/04 ARRAIAS ITAFÓS 404.18 Mining Application
registered
Mining Application
861.009/04 ARRAIAS ITAFÓS 45.54 Mining Application
registered
Research Permit 860.101/09 ARRAIAS ITAFÓS 1,812.27 Research permit 3 yr
Research Permit 860.103/09 ARRAIAS ITAFÓS 1,053.09 Research permit 3 yr
Research Permit 860.125/09 ARRAIAS ITAFÓS 1,533.32 Research permit 3 yr
Research Permit 860.714/08 ARRAIAS ITAFÓS 78.54 Research permit 3 yr
Research Permit 860.821/08 ARRAIAS ITAFÓS 1,980.00 Research permit 2 yr
Research Permit 860.822/08 ARRAIAS ITAFÓS 1,949.23 Research permit 2 yr
Research Permit 860.823/08 ARRAIAS ITAFÓS 1,943.76 Research permit 2 yr
Research Permit 860.824/08 ARRAIAS ITAFÓS 1,608.01 Research permit 2 yr
Research Permit 860.825/08 ARRAIAS ITAFÓS 1,800.00 Research permit 3 yr
Research Permit 860.826/08 ARRAIAS ITAFÓS 1,978.98 Research permit 2 yr
Research Permit 861.111/08 ARRAIAS ITAFÓS 1,555.51 Research permit 2 yr
Research Permit 861.112/08 ARRAIAS ITAFÓS 1,980.00 Research permit 2 yr
Research Permit 864.347/09 ARRAIAS ITAFÓS 5,266.66 Research permit 3 yr
Research Permit 864.350/09 ARRAIAS ITAFÓS 7,500.90 Research permit 3 yr
Research Permit 861.463/09 ARRAIAS ITAFÓS 1,850.81 Research permit 2 yr
Research Permit 861.582/09 ARRAIAS ITAFÓS 1,043.05 Research permit 2 yr
Research Permit 860.979/10 ARRAIAS ITAFÓS 1,666.71 Research permit 3 yr
Research Permit 860.991/10 ARRAIAS ITAFÓS 1,696.84 Research permit 3 yr
Research Permit 860.126/11 ARRAIAS ITAFÓS 1,627.99 Research permit 3 yr
Research Permit 864.550/10 ARRAIAS ITAFÓS 321.17 Research permit 3 yr
Research Permit 864.551/10 ARRAIAS ITAFÓS 287.16 Research permit 3 yr
Research Permit 864.552/10 ARRAIAS ITAFÓS 98.69 Research permit 3 yr
Research Permit 864.553/10 ARRAIAS ITAFÓS 54.73 Research permit 3 yr
Research Permit 864.585/10 ARRAIAS ITAFÓS 4,249.69 Research permit 3 yr

Amazon GeoServices Ltda ABN 52 065 481 209 Mineral Resource Estimate - Arraias Phosphate Project, Para State, Brazil – MBAC Page: 31 Effective Date – 27 March 2013
6005 Australia
Research Permit 860.300/11 ARRAIAS ITAFÓS 791.56 Research permit 3 yr
Research Permit 860.303/11 ARRAIAS ITAFÓS 1,607.24 Research permit 3 yr
Research Permit 860.304/11 ARRAIAS ITAFÓS 1,889.52 Research permit 3 yr
Research Permit 860.516/11 ARRAIAS ITAFÓS 1,464.65 Research permit 3 yr
Research Permit 860.519/11 ARRAIAS ITAFÓS 1,974.79 Research permit 3 yr
Research Permit 860.520/11 ARRAIAS ITAFÓS 1,991.50 Research permit 3 yr
Research Permit 860.521/11 ARRAIAS ITAFÓS 1,959.44 Research permit 3 yr
Research Permit 860.522/11 ARRAIAS ITAFÓS 1,911.51 Research permit 3 yr
Research Permit 860.523/11 ARRAIAS ITAFÓS 1,962.79 Research permit 3 yr
Research Permit 860.524/11 ARRAIAS ITAFÓS 1,853.96 Research permit 3 yr
Research Permit 860.525/11 ARRAIAS ITAFÓS 1,908.95 Research permit 3 yr
Research Permit 860.526/11 ARRAIAS ITAFÓS 1,531.16 Research permit 3 yr
Total 69,561.17

Amazon GeoServices Ltda ABN 52 065 481 209 Mineral Resource Estimate - Arraias Phosphate Project, Para State, Brazil – MBAC Page: 32 Effective Date – 27 March 2013
6005 Australia
Figure 4.2_1 Permit Location

Amazon GeoServices Ltda ABN 52 065 481 209 Mineral Resource Estimate - Arraias Phosphate Project, Para State, Brazil – MBAC Page: 33 Effective Date – 27 March 2013
6005 Australia
4.3 Royalties and Agreements
There are no royalties or agreements in place for the Itafós Project which AMS are aware of.
4.4 Environmental Liabilities
AMS is unaware of any environmental liabilities to which the Itafós Project is subject.
4.5 Permitting
No additional permits are required at the current stage of development.
AMS is unaware of any other factors risking the development of the project.

Amazon GeoServices Ltda ABN 52 065 481 209 Mineral Resource Estimate - Arraias Phosphate Project, Para State, Brazil – MBAC Page: 34 Effective Date – 27 March 2013
6005 Australia
5 ACCESSIBILITY, CLIMATE, LOCAL RESOURCES, INFRASTRUCTURE
AND PHYSIOGRAPHY
5.1 Project Access
The project site can be easily accessed in 4-5 hours drive from Brasilia some 450 km distance
via paved highways (BR-020 and GO-118) to the town of Campos Belos and from there for a
few km via unpaved roads and small farm roads that are generally in good condition except
for a few days during the peak of the rainy season. Campos Belos can also be reached by
small aircraft landing at a 1,400m long, paved airstrip (Lat 13o 00’00” South [S] and Long 46
o
42’40” West [W]).
Campos Belos is a municipality of the Goiás state of Brazil with approximately 19,000
inhabitants, most living in the town. The town has one college and hotels and therefore has a
reasonable infrastructure base to support the MBAC workforce and day to day operations.
5.2 Physiography and Climate
The project is located in an area known as Central Brazilian Highlands at an average
elevation of 750 m above sea level. The local topography is usually flat to gentle slopes
underlain by siltstones and limestones with a few higher elevations of granitic and quartzitic
basement. Dolomite bodies form remnant hills with typical karstic dissection.
The climate is tropical with a well-defined dry winter (May to August) followed by a wet
summer season (September to April). Yearly average temperatures are 20 to 22 degrees
Celsius (oC) with rainfall typically 1,000 to 1,500 millimeters (mm) during the summer period.
Vegetation across this region of Brazil is typical of savannah regions of the world (known in
Brazil as “cerrado”) much of which has now been substituted by cattle or crop pasture; the
local economy depends largely on cattle grazing.
5.3 Local Infrastructure and Services
Campos Belos is a municipality of the Goiás state of Brazil with approximately 19,000
inhabitants, most living in the town. Skilled labour is readily available in Campos Belos.
Studies are now complete for initial mining areas, with a new processing facility currently
under construction. Purchase of surface rights over areas selected for open pit mining,
process plant, etc., began in April 2009 and to the best of the authors knowledge, negotiations
are now completed.

Amazon GeoServices Ltda ABN 52 065 481 209 Mineral Resource Estimate - Arraias Phosphate Project, Para State, Brazil – MBAC Page: 35 Effective Date – 27 March 2013
6005 Australia
6 HISTORY
The phosphate occurrences around the Campo Belos region were first explored in the 1960s
by METAGO, the Goiás State Mining Company. In 2004, MBAC acquired the mineral
properties and started mining operations, producing two low-cost pulverized rock products (24
% and 12 % P2O5), both for direct application to the soil; production of rock P2O5 products
from MBAC in 2008 was 70,000 tonnes (t).
As described earlier, MBAC (at that time a private company) acquired Itafós (the original local
owner of the high-grade quarry) in late 2008 and immediately started a grassroots mapping
and drilling campaign aimed at defining large volume but lower grade P2O5 resources. This
first campaign focused on the priority zones at Coité, Juscelino and São Bento, targets that
were initially explored using 50 m and 100 m spaced drilling (auger and core).
In March 2009, MBAC started a second mapping and drilling campaign (this time mainly in
Mateus and Gaucho targets using a 100 m and 200 m spaced grid drilling) while expanding its
regional holdings north (N) and south (S) along the 150 km long contact between granitic
basement to the west (W) and the favourable siltstone lithologies to the east (E). Exploration
drilling focused on the Near Mine Blocks where initial production of an expanded process
plant will be based, while exploration of the outlying Regional Blocks continued to expand the
extent of the siltstone host rock.
In addition to drilling, field work has included trench and pit sampling, geochemistry, and
geophysics including several tests of Ground Penetrating Radar (GPR), resistivity and seismic
methods without significant success in terms of providing a useful exploration tool to guide the
drilling programs.
A third drilling program using four RC drills began in late 2009. Around this same time, the
certified international laboratory ALS Chemex Ltd. (ALS) established a sample preparation
laboratory at the project site for handling core and RC drill samples. By early 2010, six RC
drills and three diamond drills were operating at the project.
In April and May 2010, additional drilling was completed by MBAC in the Canabrava and
Domingos zones. In November 2009, MCB Serviços e Mineração Ltda. (MCB) of Belo
Horizonte, Brazil prepared a mineral resource estimate for the Itafós Project, based on a 3.5
% P2O5 cut-off grade, summarized in Table 6_1.
Table 6_1
MCB Resource Estimate (3.5% P2O5 Cut-off Grade)
Near Mine Other Areas Totals
Mt % P2O5 Mt % P2O5 Mt % P2O5
M & I 12.84 5.23 - - 12.84 5.23
Inferred 21.37 - 70.19 5.23 91.56 5.23
A report prepared by MCB comprises information compiled for Sandwell on behalf of Itafós as
part of the due diligence requirement for the Reverse Take-Over business arrangement with
MBAC in November 2009. This report was submitted to and accepted by the regulatory
authorities in British Columbia in November 2009.

Amazon GeoServices Ltda ABN 52 065 481 209 Mineral Resource Estimate - Arraias Phosphate Project, Para State, Brazil – MBAC Page: 36 Effective Date – 27 March 2013
6005 Australia
In April 2010, Wardrop completed a Mineral Resource Estimate for the Itafós Project as
follows:
Table 6_2
Mineral Resources, Near Mine Blocks (2.8% Cut-off grade, April 2010)
Density Tonnage (Mt) P2O5 (%) Al2O3 (%) CaO (%) Fe2O3 (%) SiO2 (%)
Measured 1.54 16.5 4.4 9.1 7.8 4.4 63.4
Indicated 1.54 11.8 4.2 9.0 7.6 4.2 63.1
M & I 1.54 28.3 4.2 9.0 7.6 4.2 63.1
Inferred 1.55 4.2 4.1 8.7 6.5 4.6 65.0
In April 2010, Wardrop also issued Inferred Mineral Resources for five outlying areas
estimated using a 2D polygonal method:
Table 6_3
Inferred Mineral Resources for Five Outlying Areas
Tonnage (Mt) P2O5 (%)
Avião 554,000 5.66
Brejo 14,377,000 6.00
Canabrava 30,925,000 6.12
Cabeçuda 807,000 4.75
Domingos 10,897,000 6.04
Total 56,930,000 6.05
AMS has not reviewed these historical mineral resource estimates although significant drilling
and updated mineral resource estimates have been completed since the disclosure of the
mineral resource estimates listed in the tables above.

Amazon GeoServices Ltda ABN 52 065 481 209 Mineral Resource Estimate - Arraias Phosphate Project, Para State, Brazil – MBAC Page: 37 Effective Date – 27 March 2013
6005 Australia
7 GEOLOGICAL SETTING AND MINERALIZATION
7.1 Regional Geology
The western limits of the Bambuí basin along the Proterozoic crystalline basement are
marked by a N-S trending erosional discontinuity with the phosphate mineralization being
hosted in laminated and sub-horizontal siltstone, phosphorites and silexites (silica-rich units);
the sequence also includes lenses of dolomite, limestone and immature chemical sediments.
At this region, the Bambuí group was affected by asymmetrical folding, with eastward
convergence, formed under compressive ductile-brittle conditions developed as part of a thin
skinned crust and fold belt overlying the western margin of the São Francisco Craton. The
metamorphic grade in the craton basement varies from greenschist to mid-grade
metamorphism.
On a regional scale, the development of the higher-grade P2O5 mineralization in the Bambuí
sediments is associated with slumping and early diagenetic features.
According to the geological maps available at 1:100,000 scale (Monte Alegre de Goiás and
Nova Roma charts – CPRM 2007), from top down the Bambuí Group comprises the following
units:
Lagoa do Jacaré Formation: Marls, siltstone and limestone (oolites and
pisolites).
Serra de Santa Helena Formation: Siltstone (argillaceous and laminate) and
fine rhythmite, with massive siltstone and very fine sandstone intercalations.
This unit represents a relatively deep and calm water environment.
Sete Lagoas Formation (host to the mineralization): Comprises four sub-units
deposited in a sub-coastal environment primarily marls, dolomites, limestones
and a lower marl-siltstone sequence.
Jequitaí Formation: The lowest unit formed by diamictites with intercalations of pelites and sandstone (glacial deposition).

Amazon GeoServices Ltda ABN 52 065 481 209 Mineral Resource Estimate - Arraias Phosphate Project, Para State, Brazil – MBAC Page: 38 Effective Date – 27 March 2013
6005 Australia
7.2 Project Geology
Phosphate mineralization on the project property occurs in lower siltstone sections of the Sete
Lagoas Formation belonging to the Bambuí Group, a Neoproterozoic carbonate sequence
that developed in an intra-cratonic basin on the margins of granitic craton basement (São
Francisco craton). The favourable siltstone sequence has been identified for several tens of
kilometres to the N and S of the original Itafós mineralization and host several other
phosphate occurrences in addition to those around the Itafós Project.
In the project area, silica-rich boulders are common and have been mapped as silexites.
These areas were initially considered as sterile for phosphate mineralization, but samples
collected by MBAC have returned high-grade P2O5 results.
Despite the staged mineralization events contributing to the remobilization of silica and
phosphate, the overall geometry of the mineralization is stratiform with local zones of less
continuous breccia material.
Other occurrences of sedimentary phosphate close to the Arraias-Campos Belos area in
northeast of Goiás (also considered as part of the Sete Lagoas Formation) were found in
Monte Alegre de Goiás and Nova Roma (East, North and Central blocks). Other less
important occurrences of phosphate-rich rocks are known to occur within the Serra da
Saudade Formation (Bambuí Group), nearby the cities of Formosa and Cabeceiras, both in
Goiás and Coromandel in the Minas Gerais state of Brazil.

Amazon GeoServices Ltda ABN 52 065 481 209 Mineral Resource Estimate - Arraias Phosphate Project, Para State, Brazil – MBAC Page: 39 Effective Date – 27 March 2013
6005 Australia
Figure 7.2_1 Project Geology Map

Amazon GeoServices Ltda ABN 52 065 481 209 Mineral Resource Estimate - Arraias Phosphate Project, Para State, Brazil – MBAC Page: 40 Effective Date – 27 March 2013
6005 Australia
The phosphate mineralization is shown in the figure below hosted in a flat lying siltstone unit.
Figure 7.2_2 Outcrop showing main Phosphate Bearing Siltstone
7.3 Mineralization
Phosphate mineralization at Arraias is found exclusively within a basal siltstone unit of the
Sete Lagoas Formation of Neoproterozoic age lying directly on granitic basement. On
section, this basal contact appears as an undulating or locally rolling surface (possibly related
to local embayments or paleo-channels developed over basement structures); however the
overall pattern of mineralization can be described as stratiform. Within MBAC’s claim
boundaries (Near Mine and Regional), the host siltstone unit covers some 281 km2 of area,
with the principal Near Mine blocks approximated to have an area extent of ~48 km2.
Some broad geometric parameters of the siltstone-hosted phosphate mineralization in the
Near Mine Blocks of interest to define a mineral resource are summarised below:
Total Near Mine Siltstone defined: 48.2 km2
Siltstone Unit Thickness: 10 to 75 m
Mineralized Thickness: 2 to 35 m (2 % P2O5 cut-off)
High-Grade Breccia Thickness: 1 to 6 m (10 % P2O5 cut-off)

Amazon GeoServices Ltda ABN 52 065 481 209 Mineral Resource Estimate - Arraias Phosphate Project, Para State, Brazil – MBAC Page: 41 Effective Date – 27 March 2013
6005 Australia
8 DEPOSIT TYPES
The phosphate deposits in the project area are sedimentary-hosted, deposited in a restricted
marine environment during regressive-transgressive cycles of sea levels. Paleo-channels or
embayments within the granitic basement may have had some influence on the distribution of
the mineralization.
The depositional environment of the phosphorites was such that block collapse and disruption
in a compressive environment caused landslides on flank channels, which in turn promoted
escape features and reworking of sediments that generated sedimentary breccias. The
evolution of weathering processes led to lateritization of the phosphorites with phosphate
leaching and re-deposition.
Based on thin section descriptions, observation of the local geology and research
investigations, current opinion favours a syngenetic origin for the mineralization within the
siltstone horizons, with some secondary processes producing local zones of higher-grade
mineralization. This “secondary enrichment” has been attributed to:
1. Syn-sedimentary reworking of a portion of the chemical sediments;
2. early diagenetic circulation of low temperature (> 200 oC) hydrothermal fluids;
3. recent lateritization caused by weathering and/or
4. possible remobilization caused by hydrothermal fluids circulating along fracture and fault
structures.
Local “breccia” zones, principally in the Coité deposit, host the higher-grade mineralization
that has been the source of the small-scale production to date, however it is the adjacent and
lower grade mineralization that will be the source for MBAC’s expansion plans.
In summary; the phosphate deposits of Itafós Project can be classified as sedimentary-hosted
with some characteristics of upwelling models, with local secondary enrichment related to
weathering or possibly circulation of hydrothermal solutions along fracture structures into
lower crystalline basement rocks.

Amazon GeoServices Ltda ABN 52 065 481 209 Mineral Resource Estimate - Arraias Phosphate Project, Para State, Brazil – MBAC Page: 42 Effective Date – 27 March 2013
6005 Australia
9 EXPLORATION
In 2008, MBAC commenced regional exploration and claims staking along the favourable
siltstone-basement for approximately 50km to the N and 150km to the S of the Near Mine
blocks. Two new zones were discovered at Covanca and Lucia. Exploration activities
included:
Geological mapping at 1:20,000 scale and surface sampling along roads and
tracks to identify new exploration targets;
Acquisition of government-sponsored airborne geophysical survey data (with
radiometrics) to assist geological mapping
Regular surface sampling over the targets, trenches and isolated shallow pits;
Mechanical Auger drilling at 25 m x 25 m or 50 m x 50 m spacing, typically
down to 10 m depth, over sub-cropping phosphorites;
Aster satellite imagery acquired for regional exploration work;
Detailed topography surveying using total station units with accuracy to 1 m;
Several ground geophysical methods tried to assist with target screening
ahead of drill programs, basement mapping, etc., with inconclusive results.
Methods tested were GPR, resistivity and seismic, however none of these
produced conclusive results that could be used with confidence to assist
bedrock mapping or interpreting potential zones of mineralization, such as the
breccias zones, prior to drilling.
9.1 Bulk Density Determinations
MBAC has taken a total of 1238 bulk density determinations from weathered and fresh DC
(Mateus and Gaucho).
Bulk Density measurements were undertaken by MBAC technicians using the following
procedure:
20cm full core is wrapped in plastic film on the drill rig;
Sample is weighed wet and then dried in a small oven;
Dry core sample is weighed on electronic scale to determine mass of dry core
and then weighed immersed in water to determine the volume (Archimedes
method);
Both wet and dry bulk densities are then determined.

Amazon GeoServices Ltda ABN 52 065 481 209 Mineral Resource Estimate - Arraias Phosphate Project, Para State, Brazil – MBAC Page: 43 Effective Date – 27 March 2013
6005 Australia
AMS revised the density data utilised which prior consultants removed outlier data prior to
determining the average bulk density. The Dry bulk density used in the resource estimation is
summarized in the following table:
Table 9.1_1
Bulk Density for Itafós Project
Material Density g/cm3
Overburden 1.70
Siltstone 1.53
Breccia 2.28

Amazon GeoServices Ltda ABN 52 065 481 209 Mineral Resource Estimate - Arraias Phosphate Project, Para State, Brazil – MBAC Page: 44 Effective Date – 27 March 2013
6005 Australia
10 DRILLING
Table 10_1 sets out the Reverse Circulation (RC) and Diamond Core (DC) drilling completed
until November 28th, 2011 on the property. Drilling was completed by two principal
companies contracted in Brazil:
Geológica Serviços de Sondagem: Core drilling with Sandwick UDR 200 drill
rigs and HQ (67 mm) diameter core.
Servitec: RC using Atlas Copco R50 rigs and 5.375 inch (”) drill bits.
Table 10_1
Summary Drilling Statistics for Itafós Project
As of 28 November 2011
Method Campaign Number of Drillholes
Metres Drilled
Diamond Drilling
2008 198 7,013.6
2009 373 14,505.3
2010 - 2011 186 5,522.5
TOTAL 757 27,041.4
Reverse Circulation
2008 0 0
2009 3 63
2010 - 2011 1,158 41,903.9
TOTAL 1,161 41,966.9
Drilling has been completed on a square grid basis as follows:
Coité & Juscelino: 25 m x 25 m in the core areas of breccias mineralization, 50
m and 100 m towards the deposit fringes.
Mateus North & Central: Some 25 m grid for higher grade areas, balance at 50
m and 100m.
Mateus South: 100 m grid.
Gaucho: 50 m, 100 m and 200 m on fringes.
Canabrava and Domingos: 100 m grid, 400 m grid on fringes.
Avião, Brejo, Cabeçuda: 400 m grid.
All drilling has been undertaken and/or supervised by MBAC technical personnel.

Amazon GeoServices Ltda ABN 52 065 481 209 Mineral Resource Estimate - Arraias Phosphate Project, Para State, Brazil – MBAC Page: 45 Effective Date – 27 March 2013
6005 Australia
Figure 10_1 Typical Concrete Collar Marker - Twin Holes (DOMI-RC242 & DOMI-DD0020)
MBAC completed a Rotary Air Blast (RAB) drill program in 2006 to early 2007, to test for
mineralization at depth below the surface showings. This scout drilling campaign did not
follow a regular grid and usually reached no more than 20 m deep, often stopping due to high
moisture content. The results of this drilling campaign were not properly documented and
RAB results showed downhole contamination / smearing. Therefore, these results were not
included in the Mineral Resource Estimate.
10.1 RC Drilling
Drilling was contracted to Servitec Sondagens. RC Drill rigs used on the project included an
Explorak R50 RC rig and a 5.5 inch face sampling hammer.
Holes were drilled vertical and have not been surveyed downhole. AMS does not consider
that these holes would deviate enough to make a material difference.
Observations:
Samples taken and weighed on meter by meter basis;
Cyclone is cleaned on a rod by rod basis;
Samples split to around 3kg via a single tier splitter;
Logging of alteration, lithology and weathering;
Hole collar coordinates picked up utilising a hand held GPS (accuracy +/- 10m).

Amazon GeoServices Ltda ABN 52 065 481 209 Mineral Resource Estimate - Arraias Phosphate Project, Para State, Brazil – MBAC Page: 46 Effective Date – 27 March 2013
6005 Australia
10.1.1 RC Drilling Results and Quality
On inspection of the bag farm AMS noted that a large number of RC samples were saturated
(Figure 10.1.1_1below). The exact amount is not known as the sample humidity has not been
clearly identified in the database (This is now in progress as it has been recorded for new RC
drilling) AMS estimates that around 20% of RC samples are wet.
Figure 10.1.1_1 Wet RC Samples at bag farm
This is a material issue as wet RC samples in the saprolitic material can ultimately create a
sample bias. AMS has seen examples of phosphate being washed out of the sample (such
as Apatite mineralisation along fractures) which ultimately can result in underestimation of the
phosphate grade.
A total of 8 twin holes (RC and DC holes within 5m) have been undertaken to allow a
comparative analysis of the results to determine the precision of the RC versus the DC. The
comparative results can be seen in figures 10.1.1_2 to 10.1.1_9.
Figure 10.1.1_2 Twin Drill Results - (DOMI-RC-0124 & DOMI-DD-
0016, 2.78m apart)
Figure 10.1.1_3 Twin Drill Results - (DOMI-RC-0200 & DOMI-DD-
0014, 2.05m apart)

Amazon GeoServices Ltda ABN 52 065 481 209 Mineral Resource Estimate - Arraias Phosphate Project, Para State, Brazil – MBAC Page: 47 Effective Date – 27 March 2013
6005 Australia
Figure 10.1.1_4 Twin Drill Results - (DOMI-RC-0197 & DOMI-DD-
0015, 2.60m apart)
Figure 10.1.1_5 Twin Drill Results - (DOMI-RC-0241 & DOMI-DD-
0024, 3.15m apart)
Figure 10.1.1_6 Twin Drill Results - (DOMI-RC-0298 & DOMI-DD-
0036, 2.80m apart)
Figure 10.1.1_7 Twin Drill Results - (DOMI-RC-0198 & DOMI-DD-
0037, 1.60m apart)
Figure 10.1.1_8 Twin Drill Results - (SBEN-RC-0001 & SD-029,
1.05m apart)
Figure 10.1.1_9 Twin Drill Results - (SBEN-RC-0002 & SD-036,
2.11m apart)
The results of the twin holes as shown graphically in the figures above does not indicate any
material bias between the DC and RC.

Amazon GeoServices Ltda ABN 52 065 481 209 Mineral Resource Estimate - Arraias Phosphate Project, Para State, Brazil – MBAC Page: 48 Effective Date – 27 March 2013
6005 Australia
10.2 DC Drilling
DC drilling was initially conducted by Geosonda who utilised a Chinese rotary drill called Drill
XY-4. Productivity was poor after less than 900m drilled, so MBAC changed contractors to
Servitec Sondagens. Servitec utilised a Boart Longyear DB-525 and a Maquesonda FS-320.
Both Geosonda and Servitec drilling is dominantly HQ sized core with minor NQ sized core
utilised on holes greater than 100m in depth and HW utilised to collar some holes.
Holes were drilled vertical and have not been surveyed downhole. AMS does not consider
that these holes would deviate enough to make a material difference. Core has not been
oriented as all holes are vertical.
Observations:
Storage of all core in wooden core boxes at drill site and then transported to the base for
logging and sampling;
Run markers with metal tags indicating drilled depth and recovery;
Measurement and recording of core recovery for each drilling run;
Photography and detailed logging of core before splitting;
Detailed logging of alteration, lithology, structures and sulphides;
Hole collar picked up utilising a hand held GPS (accuracy +/- 10m).
10.2.1 DC Drilling Results and Quality
From observations of drilling and 6 drillholes reviewed during the site visit, AMS noted that
MBAC DC procedures are to high quality with > 85% recovery returned in both saprolite and
fresh material.
AMS considers the DC drilling procedures to be of an acceptable industry standard.
Significant drill results have not been individually reported as this is a mineral resource
estimate and would involve an extensive table that is summarised in the resource section of
this report. Drilling was orientated to enable perpendicular intercepts of the main trend of
mineralisation but once again the three dimensional modelling has ensured that this is
accounted for.

Amazon GeoServices Ltda ABN 52 065 481 209 Mineral Resource Estimate - Arraias Phosphate Project, Para State, Brazil – MBAC Page: 49 Effective Date – 27 March 2013
6005 Australia
11 SAMPLE PREPARATION, ANALYSES AND SECURITY
The Itafós Project sampling programs have followed acceptable industry good practices as
briefly summarized in the following paragraphs.
11.1 Sampling Method
11.1.1 Diamond Core
MBAC geologists supervised all core sampling undertaken. Core samples were taken
normally on 1m intervals with some taken between 0.75 m and 1.25 m intervals based on the
geological logging.
Core is split in half using a blade in the weathered material and via a diamond saw in the fresh
material. The ½ core is bagged and sent for preparation while the remaining ½ core is
returned to the core box and a ply wood lid is nailed on and the box is stored for future
reference.
AMS recommends that the practice of irregular sample intervals should not be continued. The
mineralization in the Itafós Project is often subtle with no clearly defined visible geological
controls and as such a regular 1m sample interval for all the drill core is recommended.
11.1.2 Reverse Circulation
MBAC utilise a single tier riffle splitter and pass the dry sample approximately 3 times to get a
3kg sample. AMS have recommended that MBAC purchase or fabricate a 3 tier riffle splitter
to reduce the work load and reduce potential error. The single tier splitter MBAC was utilising
was of poor design.
Figure 11.1.2_1 Single Tier Splitter
Figure 11.1.2_2 Typical 3 Tier Splitter Recommended by AMS
For wet RC samples MBAC are drying the full sample in an oven (on a flat galvanised tin
surface) and then using a quartering technique to determine a 3kg sample. AMS
recommended that they utilise the riffle splitter for all bar saturated samples. AMS also
recommended utilising a spear technique to sample the wet samples, but more importantly
AMS recommended that the wet samples be removed from contention by increasing the drill
rigs air capacity (by either employing a bigger compressor or adding a booster unit).

Amazon GeoServices Ltda ABN 52 065 481 209 Mineral Resource Estimate - Arraias Phosphate Project, Para State, Brazil – MBAC Page: 50 Effective Date – 27 March 2013
6005 Australia
Figure 11.1.2_3 Original Wet RC Sample
Figure 11.1.2_4 Wet Samples Drying in Oven
Figure 11.1.2_5 Manual Quartering

Amazon GeoServices Ltda ABN 52 065 481 209 Mineral Resource Estimate - Arraias Phosphate Project, Para State, Brazil – MBAC Page: 51 Effective Date – 27 March 2013
6005 Australia
11.2 Sample Security
All half core (HQ size) is kept in three row wooden boxes with an average capacity 3m of core
per box. Complete holes are stored according to hole/box number and by drill sector in core
rack modules. All drill holes are individually catalogued and their exact locations noted.
Figure 11.2_1 Core Storage at Site
Figure 11.2_2 Pulp Storage at ALS Site Lab
Core storage warehouses at site have the capacity for 40,000m of HQ core. Reject samples
are placed in bags and stored at the site. Pulp samples are kept at the assaying facility of
ALS in Belo Horizonte. Assaying is carried out at either ALS or SGS Geosol laboratories;
both recognized assay laboratories at an international level that operate within all the
necessary standards and certifications for the mineral exploration industry.

Amazon GeoServices Ltda ABN 52 065 481 209 Mineral Resource Estimate - Arraias Phosphate Project, Para State, Brazil – MBAC Page: 52 Effective Date – 27 March 2013
6005 Australia
Figure 11.2_3 Reject Sample Storage at Site
11.3 Laboratory Sample Preparation and Analysis
The drill samples from the 2008 and most from 2009 were securely sealed, bagged and
trucked by MBAC and ALS staff to the ALS laboratory located in Belo Horizonte. Here all
sample preparation from rock to final pulp was completed. Final pulps were then sent to the
ALS laboratory in Peru for assaying.
In late 2009, ALS was contracted to set up a sample preparation facility at the project site
under contract to MBAC; the preparation laboratory has a capacity of approximately 200-300
samples per day.
In brief, the preparation procedure involves:
Two stages of coarse and fine crushing to 2 mm (10 mesh), pulverising to -200 mesh
and followed by riffling to produce a 10 gram sub-sample for shipment;
The samples are prepared in a clean, covered facility in the MBAC office compound
facility near Campos Belos;
Cleaning of all equipment by compressed air is carried out after processing each
sample and additionally on a periodic basis using crushed quartz;
Composite rejects of each sample are bagged and stored at the sample preparation
facility.

Amazon GeoServices Ltda ABN 52 065 481 209 Mineral Resource Estimate - Arraias Phosphate Project, Para State, Brazil – MBAC Page: 53 Effective Date – 27 March 2013
6005 Australia
In early 2010, the drill programs were increased substantially with the introduction of up to six
RC drills during January, February and March. At this stage, sample preparation
requirements increased beyond the capacity of the facilities at site, so samples were sent out
to an additional 4 laboratories for preparation and subsequent assaying. These laboratories
were:
SGS Geosol, Belo Horizonte;
SGS Carajás;
ALS, Belo Horizonte;
ALS, Goiás.
11.3.1 Assay Laboratories
The assaying protocols used for assaying at each of these laboratories are summarised in the
Table below:
Table 11.3_1 – Assaying Protocols
ALS SGS
Location Belo Horizonte Goiás Belo Horizonte Carajás
Principal Method XRF XRF XRF XRF
Fusion Lithium
Tetraborate
Lithium
Tetraborate
Lithium
Tetraborate
Lithium
Tetraborate
Sample Size
Analysis Method XRF XRF XRF XRF
Detection Limit, P2O5 0.01% 0.01% 0.01% 0.01%
All laboratories use a common fusion step prior to analysis. Each laboratory produces a suite of
oxide analyses, plus a Loss-On-Ignition analysis (separate procedure).
11.4 Adequacy of Procedures
The sampling methods, chain of custody procedures, and analytical techniques are all
considered appropriate and are compatible with accepted industry standards.

Amazon GeoServices Ltda ABN 52 065 481 209 Mineral Resource Estimate - Arraias Phosphate Project, Para State, Brazil – MBAC Page: 54 Effective Date – 27 March 2013
6005 Australia
12 DATA VERIFICATION
12.1 Geological Database
AMS validated the Itafós Project access database using the Gemcom Surpac Software
System Database Audit tool with no inconsistencies noted.
A comparison of hardcopy assay and geological logging versus the digital database was
performed on a total of 10% of the MBAC drillholes. No errors were identified with the original
log and the digital database.
12.2 QAQC
MBAC has set in place a QAQC programme that included the submission of blanks, field
duplicates and standards.
MBAC undertake quality control at approximately 10% of the total samples prepared. This
includes three blanks, three duplicates and three certified standards for every 90 rock
samples. The first sample in each lot should be a blank to check that the system was clean.
Several control procedures have been in place to varying degrees of consistency during the
MBAC exploration programs beginning in early 2009. The earlier parts of the program in 2009
relied mainly on insertion of field blanks and internal laboratory procedures to monitor QA/QC.
Beginning in late 2009, a consulting company (Wardrop) provided input into this QAQC
procedure.
The quality control measures applied at MBAC have been as follows:
12.2.1 Certified Standards and Blanks
Certified Standards
In late 2009, an internal standard was prepared from siltstone mineralization collected from
São Bento pit outcrop and prepared as a pulp standard material at the laboratories of the
state laboratory facility in Brasilia, METAGO. In January 2010, homogenized sub-samples
were shipped to six round-labs laboratories (ALS and SGS) of which only two laboratories
have returned results. Until all the round-robin analyses are received from the external
laboratories, the METAGO internal assays of the six sub-samples shipped have been used as
the average standard values shown in Table 12.2.1_1.
Table 12.2.1_1
Series #1 Standard Statistics
Initial Standards
% P2O5
Average SD Variance
P1 1.31 0.015 0.0002
P2 5.93 0.047 0.002
P3 8.47 0.080 0.006

Amazon GeoServices Ltda ABN 52 065 481 209 Mineral Resource Estimate - Arraias Phosphate Project, Para State, Brazil – MBAC Page: 55 Effective Date – 27 March 2013
6005 Australia
With the significant increase in drilling for resource estimation (some 27,000 m between late
2009 and March 2010), additional standards material was required. With drill core again from
São Bento, the SGS Geosol laboratory (Belo Horizonte) was contracted to prepare and certify
three standards with sub-samples sent to 10 domestic and foreign labs for round-robin
analysis. Averages from results received to date have been used to monitor accuracy (one
standard every 25 samples), results are shown in Table 12.2.1_2 below.
Table 12.2.1_2
Series #2 Standards Statistics
Latest Standards (2010) Labs % P2O5
Average SD Variance
PFA 6 12.99 0.157 0.025
PFB 6 2.49 0.034 0.001
PFM 3 11.09 0.200 0.040
Note: Padrão Fosfato Alto (PFA), Padrão Fosfato Baixo (PFB) and Padrão Fosfato Médio
(PFM) refer to high, low and medium grade standards.
The control charts covering the most recent 2010 drilling are shown from Figure 12.2.1_1 to
Figure 12.2.1_9 for both RC and DD drilling campaign and show the one and two standard
deviations (SD) on either side of the average grade for the standard results.
In the case of RC drilling, the control charts demonstrate good accuracy within two standard
deviations either side of the mean for both low and high grade ranges. Monitoring using the
standards has not identified any samples or lots of samples requiring re-assaying.
AMS prepared the charts from data provided by MBAC staff and checked for accuracy against
the certificates for the corresponding sample data MBAC utilized mainly 3 standards (these
standards have been prepared and certified by SGS- Geosol) which were analysed by AMS.
Except for the PFB standard in the diamond drilling campaign, in general the standard assay
result indicated acceptable accuracy was being achieved, with the majority of standards falling
within 80% of the Standard Tolerance Values (Table 12.2.1_3). The problems observed with
PFB are potentially associated with poor equipment calibration. The minor outliers identified are
potentially associated with sample submission errors (mixing of samples).
Blanks
Blank sample inserted every 40 samples at the sample preparation stage. The blank sample
consists of silica quartz material collected from outcrop in the project area. A total of 399
blanks have been submitted in the sample stream since late March 2009.
AMS performed an analysis on blanks data provided by MBAC. The blank material was
sourced by MBAC from un-mineralized Itafós Project Granites collected at one specific site at
the project and submitted at a frequency of about five percent (in the beginning of every
hole/batch).

Amazon GeoServices Ltda ABN 52 065 481 209 Mineral Resource Estimate - Arraias Phosphate Project, Para State, Brazil – MBAC Page: 56 Effective Date – 27 March 2013
6005 Australia
There are results for blanks up to 0.27% of P2O3 with the average of the results being 0.012%
for RC and 0.015% (majority of the blank samples returning results <10ppb Au) as can be
seen in Table 12.2.1_3. The following causes are possible for the minor outliers:
The blank material used had variable background P2O3 values (this is the most likely
cause as the blank material was sourced from a local granite source);
There is contamination in the sample preparation stage;
There is sampling handling errors either in the field or at the laboratory.
Overall the blank data is within acceptable limits. The results are presented in Figure 12.2.1_1
and Figure 12.2.1_2 below.
Table 12.2.1_3
Standards Utilized by MBAC
Submitted Blanks and Standards (Date Range)
Standard Name
Expected Value (EV) (%)
+/- 2SD (EV) (%)
Drill Type
No of Analyses
Minimum (%)
Maximum (%)
Mean (%)
% Within +/- 2 SD of
EV
MBAC Submitted Blanks
Blank 0.01 0.00 to 0.045 RC 336 0.005 0.27 0.012 97.32
Blank 0.01 0.00 to 0.048 DD 63 0.005 0.16 0.015 95.24
SGS Certified Standards
PFA 12.99 12.74 to 13.24 RC 86 12.7 13.25 12.94 96.51
PFM 11.09 10.84 to 11.34 RC 115 10.77 11.50 11.18 86.08
PFB 2.49 2.42 to 2.56 RC 320 2.39 2.61 2.51 92.19
PFA 12.99 12.69 to 13.29 DD 3 12.7 13.00 12.85 100.00
PFM 11.09 10.90 to 11.27 DD 9 11.05 11.35 11.20 88.88
PFB 2.49 2.43 to 2.55 DD 21 2.48 2.57 2.53 61.90
Figure 12.2.1_1 RC Blank Results
00,05
0,10,15
0,20,25
0,3
DOMI-RC-…
DOMI-RC-…
DOMI-RC-…
DOMI-RC-…
DOMI-RC-…
DOMI-RC-…
DOMI-RC-…
DOMI-RC-…
DOMI-RC-…
DOMI-RC-…
DOMI-RC-…
DOMI-RC-…
DOMI-RC-…
DOMI-RC-…
DOMI-RC-…
DOMI-RC-…
DOMI-RC-…
DOMI-RC-…
DOMI-RC-…
DOMI-RC-…
DOMI-RC-…
DOMI-RC-…
DOMI-RC-…
DOMI-RC-…
DOMI-RC-…
SBEN
-RC-…
SBEN
-RC-…
SBEN
-RC-…
Itafos RC Blanks
% P2O5 EV 2 SD

Amazon GeoServices Ltda ABN 52 065 481 209 Mineral Resource Estimate - Arraias Phosphate Project, Para State, Brazil – MBAC Page: 57 Effective Date – 27 March 2013
6005 Australia
Figure 12.2.1_2 DD Blank Results
Figure 12.2.1_3 PFA Standard Results for RC Drilling
00,020,040,060,08
0,10,120,140,160,18
DO
MI-
DD
-00
07
DO
MI-
DD
-00
12
DO
MI-
DD
-00
15
DO
MI-
DD
-00
16
DO
MI-
DD
-00
18
DO
MI-
DD
-00
21
DO
MI-
DD
-00
24
DO
MI-
DD
-00
27
DO
MI-
DD
-00
30
DO
MI-
DD
-00
32
DO
MI-
DD
-00
35
DO
MI-
DD
-00
37
DO
MI-
DD
-00
38
DO
MI-
DD
-00
41
SBEN
-DD
-00
44
SBEN
-DD
-00
49
SBEN
-DD
-00
52
SD-0
19
SD-0
23
SD-0
30
SD-0
35
Itafos DD Blanks
% P2O5 EV 2 SD
12,412,512,612,712,812,9
1313,113,213,3
DO
MI-
RC
-00
01
DO
MI-
RC
-00
09
DO
MI-
RC
-00
17
DO
MI-
RC
-00
21
DO
MI-
RC
-00
30
DO
MI-
RC
-00
56
DO
MI-
RC
-00
65
DO
MI-
RC
-00
72
DO
MI-
RC
-00
80
DO
MI-
RC
-00
87
DO
MI-
RC
-00
94
DO
MI-
RC
-00
99
DO
MI-
RC
-01
05
DO
MI-
RC
-01
13
DO
MI-
RC
-01
22
DO
MI-
RC
-01
28
DO
MI-
RC
-01
38
DO
MI-
RC
-01
45
DO
MI-
RC
-01
51
DO
MI-
RC
-01
62
DO
MI-
RC
-01
72
DO
MI-
RC
-01
83
DO
MI-
RC
-01
89
DO
MI-
RC
-02
03
DO
MI-
RC
-02
10
DO
MI-
RC
-02
32
DO
MI-
RC
-02
40
DO
MI-
RC
-02
45
DO
MI-
RC
-02
49
Itafos PFA Standard - RC
% P2O5 EV 2 SD

Amazon GeoServices Ltda ABN 52 065 481 209 Mineral Resource Estimate - Arraias Phosphate Project, Para State, Brazil – MBAC Page: 58 Effective Date – 27 March 2013
6005 Australia
Figure 12.2.1_4 PFM Standard Results for RC Drilling
Figure 12.2.1_5 PFM Standard Results for DD Drilling
10,4
10,6
10,8
11
11,2
11,4
11,6
DO
MI-
RC
-01
57
DO
MI-
RC
-01
68
DO
MI-
RC
-01
72
DO
MI-
RC
-01
75
DO
MI-
RC
-01
80
DO
MI-
RC
-01
92
DO
MI-
RC
-02
11
DO
MI-
RC
-02
15
DO
MI-
RC
-02
26
DO
MI-
RC
-02
47
DO
MI-
RC
-02
52
DO
MI-
RC
-02
57
DO
MI-
RC
-02
61
DO
MI-
RC
-02
64
DO
MI-
RC
-02
66
DO
MI-
RC
-02
68
DO
MI-
RC
-02
72
DO
MI-
RC
-02
74
DO
MI-
RC
-02
80
DO
MI-
RC
-02
85
DO
MI-
RC
-02
90
DO
MI-
RC
-02
95
DO
MI-
RC
-03
03
Itafos PFM Standard - RC
% P2O5 EV 2 SD
10,610,710,810,9
1111,111,211,311,4
Itafos PFM Standard - DD
% P2O5 EV 2 SD

Amazon GeoServices Ltda ABN 52 065 481 209 Mineral Resource Estimate - Arraias Phosphate Project, Para State, Brazil – MBAC Page: 59 Effective Date – 27 March 2013
6005 Australia
Figure 12.2.1_6 PFB Standard Results for RC Drilling
Figure 12.2.1_7 PFB Standard Results for DD Drilling
2,252,3
2,352,4
2,452,5
2,552,6
2,65
DO
MI-
RC
-00
01
DO
MI-
RC
-00
11
DO
MI-
RC
-00
20
DO
MI-
RC
-00
30
DO
MI-
RC
-00
44
DO
MI-
RC
-00
56
DO
MI-
RC
-00
64
DO
MI-
RC
-00
73
DO
MI-
RC
-00
83
DO
MI-
RC
-00
89
DO
MI-
RC
-00
97
DO
MI-
RC
-01
06
DO
MI-
RC
-01
13
DO
MI-
RC
-01
24
DO
MI-
RC
-01
33
DO
MI-
RC
-01
41
DO
MI-
RC
-01
50
DO
MI-
RC
-01
61
DO
MI-
RC
-01
70
DO
MI-
RC
-01
79
DO
MI-
RC
-01
90
DO
MI-
RC
-02
15
DO
MI-
RC
-02
43
DO
MI-
RC
-02
73
DO
MI-
RC
-02
92
Itafos PFB Standards - RC
% P2O5 EV 2 SD
2,35
2,4
2,45
2,5
2,55
2,6
DO
MI-
DD
-00
07
DO
MI-
DD
-00
09
DO
MI-
DD
-00
10
DO
MI-
DD
-00
11
DO
MI-
DD
-00
12
DO
MI-
DD
-00
13
DO
MI-
DD
-00
15
DO
MI-
DD
-00
17
DO
MI-
DD
-00
19
DO
MI-
DD
-00
21
DO
MI-
DD
-00
23
DO
MI-
DD
-00
24
DO
MI-
DD
-00
25
DO
MI-
DD
-00
26
DO
MI-
DD
-00
33
DO
MI-
DD
-00
36
DO
MI-
DD
-00
37
DO
MI-
DD
-00
38
DO
MI-
DD
-00
41
SBEN
-DD
-00
54
SBEN
-DD
-00
55
Itafos PFB Standard - DD
% P2O5 EV 2 SD

Amazon GeoServices Ltda ABN 52 065 481 209 Mineral Resource Estimate - Arraias Phosphate Project, Para State, Brazil – MBAC Page: 60 Effective Date – 27 March 2013
6005 Australia
Figure 12.2.1_8 P-1 Standard Results from Series #1 for RC Drilling
Figure 12.2.1_9 P-2 Standard Results from Series #1 for RC Drilling
1,24
1,26
1,28
1,3
1,32
1,34
1,36
SBEN
-RC
-00
02
SBEN
-RC
-00
04
SBEN
-RC
-00
06
SBEN
-RC
-00
11
SBEN
-RC
-00
14
SBEN
-RC
-00
16
SBEN
-RC
-00
20
SBEN
-RC
-00
22
SBEN
-RC
-00
26
SBEN
-RC
-00
29
SBEN
-RC
-00
31
SBEN
-RC
-00
38
SBEN
-RC
-00
42
SBEN
-RC
-00
45
SBEN
-RC
-00
49
SBEN
-RC
-00
52
SBEN
-RC
-00
56
SBEN
-RC
-00
60
P-1 Series #1 Standards - RC
% P2O5 EV 2 SD
5,75,75
5,85,85
5,95,95
66,05
6,1
P-2 Series #1 Standards - RC
% P2O5 EV 2 SD

Amazon GeoServices Ltda ABN 52 065 481 209 Mineral Resource Estimate - Arraias Phosphate Project, Para State, Brazil – MBAC Page: 61 Effective Date – 27 March 2013
6005 Australia
12.2.2 Field Duplicates
The field duplicate data has been analysed by AMS using a number of graphical comparative
analyse methods. The objective of this is to determine relative precision levels between
various sets of assay pairs and the quantum of relative error. This directly reflects on the
precision of the sampling technique utilised.
Itafós Project field duplicates were inserted approximately every 40 samples. These field
duplicates consist of quartered core material for DC drill samples and coarse reject in the
case of the RC samples, both termed Coarse Duplicates here. A total of 562 field duplicates
have been re-assayed at a secondary laboratory for comparison against the primary
laboratory covering the period March 2009 to early 2010 shown graphically in Figure
12.2.2_1.
Figure 12.2.2_1 Field Duplicate Data (¼ NQ sized Core)
In late 2009, over 200 sample pulps stored at the onsite ALS preparation laboratory were
selected from cross-checking of the primary lab (ALS) against a secondary lab at SGS
Geosol; the results are shown graphically in Figure 12.2.2_2.

Amazon GeoServices Ltda ABN 52 065 481 209 Mineral Resource Estimate - Arraias Phosphate Project, Para State, Brazil – MBAC Page: 62 Effective Date – 27 March 2013
6005 Australia
Figure 12.2.2_2 Pulp Duplicate Data
AMS considers the practice of comparing ¼ core with ½ core to not be representative as it
does not represent the normal ½ NQ core submitted and creates a bias in the sample size
submitted. There is however no bias shown in the results suggesting there is no issue with
the precision of the assays.
12.2.3 Data Quality Summary
The QAQC measures employed during the drilling and sampling programs demonstrate good
reproducibility using a combination of standards, blanks, coarse field duplicates and pulp
duplicates.
The standards data has shown a high accuracy has been returned by the SGS Geosol
laboratory although it should be noted that SGS supplied the standards to MBAC.
The field duplicate data determined by the analysis of the ¼ NQ core returned relatively high
precision suggesting no sample bias is present.
AMS concludes that the sample database is of sufficient quality and accuracy for use in the
subsequent steps of resource estimation.

Amazon GeoServices Ltda ABN 52 065 481 209 Mineral Resource Estimate - Arraias Phosphate Project, Para State, Brazil – MBAC Page: 63 Effective Date – 27 March 2013
6005 Australia
13 MINERAL PROCESSING AND METALLURGICAL TESTING
13.1 Metallurgical Testwork
13.1.1 Crushing & Comminution
All of the grinding parameters for the Itafós Project were determined by HDA services in Brazil
(1). The mill sized by HDA services was a low aspect SAG mill with dimensions of 16.5’
Internal Diameter x 29’ EGL and with installed motor capacity of 3500 kW.
13.1.2 Process Flotation Definition
Studies were conducted to evaluate the flotation process route to recover phosphate
contained in the siltstone of the Itafos Project targets (Arraias Tocantins deposit) commenced
in the second quarter of 2008. Initially two samples from the surface of the Coité deposit were
utilised. The first sample had a grade of 6,6% P2O5 and underwent initial bench scale tests.
The second sample, weighting approximately 20 metric tonnes, had a P2O5 grade of 4,96%,
and was referred to as pile 6, was used initially for bench scale testing and subsequently for a
pilot plant campaign using both mechanical and column flotation cells.
The first bench scale campaign involved 300 tests and was conducted in the Goiais state of
Brazil at the FUNMINERAL laboratory. The tests conducted by “Geometal” showed that the
ore presented a large proportion of phosphate in the finer size fractions and that it was
necessary to grind the coarser size fractions to 95% passing in 53 micron. Various reagents
systems were tested and at different pH levels. The anionic flotation of the Apatite minerals in
the de-slimed ore after grinding showed promising results. Selected results reported for the
first cleaner concentrate of the de-slimed sample are presented below in Table 13.1_1.
Table 13.11_1 – Bench flotation results with a sample from Coité mine
Test Weight
Assay Flotation Overall
P2O5 (%) Recovery Recovery
(%) (%) P2O5(%) P2O5(%)
ITA 236 8,2 22,1 50,8 26,7
ITA 240 18,8 23,4 55,2 29,0
ITA 243 21,4 18,0 57,0 30,0
ITA 245 20,0 22,0 65,0 34,2
ITA 249 23,4 23,5 83,2 43,8
ITA 256 21,2 17,5 56,2 29,6
ITA 260 14,6 23,7 52,3 27,5
ITA 261 20,1 21,0 64,0 33,7
AVERAGE 18,5 21,4 60,5 31,8
The bench scale results presented a large variability and the results obtained were worse than
those achieved during the pilot plant campaign with the same sample as described below.

Amazon GeoServices Ltda ABN 52 065 481 209 Mineral Resource Estimate - Arraias Phosphate Project, Para State, Brazil – MBAC Page: 64 Effective Date – 27 March 2013
6005 Australia
Pilot Plant Tests Using Mechanical Cells
At the beginning of 2009, a pilot flotation plant campaign was conducted using mechanical
cells. The results of the testing showed that the separation of the natural fines and the
generated slimes after grinding the ore improved the concentrate grade of phosphate. One
hundred continuous tests were conducted varying the cut size of the de-sliming steps, the
amount and type of reagents added, circuit flow-sheet configuration and the grind size. The
conventional flotation feed size was at a size of 95% passing 44 micron. It was possible to
achieve concentrate grades over 28% of P2O5 during some of the tests conducted. The
average concentrate results for the best tests gave an overall P2O5 recovery of 46.5% and
with a concentrate grade of 26.2% after flotation of the conventional size fraction.
Table 13.11_1 – Pilot plant results with a sample from Coite Mine
Test Weight
Assay Flotation Overall
P2O5 Recovery Recovery
(%) (%) P2O5 (%) P2O5 (%)
T53 9,1 25,8 90,3 47,5
T57 9,1 25,2 84,4 44,4
T60 6,9 27,8 70,7 37,2
T61 12,0 24,7 95,7 57,4
T63 7,5 28,8 79,1 41,6
T64 9,4 25,7 91,1 47,9
T73 8,7 26,8 90,9 47,8
T74 9,4 25,1 92,4 48,6
AVERAGE 9,0 26,2 86,8 46,6
Flotation feed contained only 52% of the total contained P2O5 content of the sample. The
large amount of the phosphate contained in the finer size fractions indicated that it was
necessary to have a process to recover the P2O5 contained in the finer fractions. Flotation
tests using the mechanical cells for the natural slimes and the generated slimes gave
promising results.
Pilot Plant Tests Using Column Cells
Based on the tests from the mechanical cells, it was decided to test the ore in column flotation
cells, which are more appropriate for the treatment of fine minerals. Approximately 6 tonnes of
the sample (pile 6) was processed at the FUNMINERAL pilot plant to generate the natural
slimes, obtained from the 40 mm cyclone overflow of the crushed ore, the conventional
fraction obtained from the 40 mm cyclone underflow of the ground de-slimed ore, and the
generated slimes obtained from the 40 mm cyclone overflow of the ground ore. These slurry
samples were packed as received from the FUNMINERAL pilot plant and sent to Belo
Horizonte for column flotation cell continuous tests at the CDTN laboratory.
The columns tests commenced in May 2009. For each of the three fractions produced the
following variables were studied:
The reagents system;
Slurry pH;
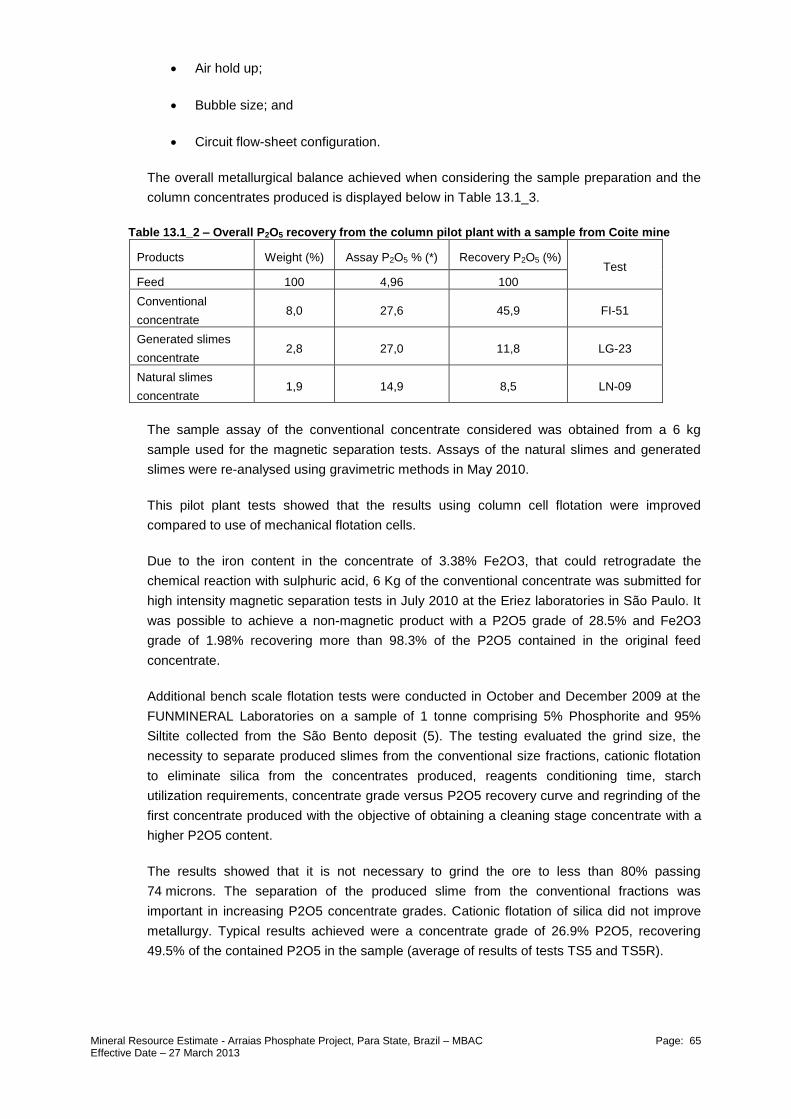
Amazon GeoServices Ltda ABN 52 065 481 209 Mineral Resource Estimate - Arraias Phosphate Project, Para State, Brazil – MBAC Page: 65 Effective Date – 27 March 2013
6005 Australia
Air hold up;
Bubble size; and
Circuit flow-sheet configuration.
The overall metallurgical balance achieved when considering the sample preparation and the
column concentrates produced is displayed below in Table 13.1_3.
Table 13.1_2 – Overall P2O5 recovery from the column pilot plant with a sample from Coite mine
Products Weight (%) Assay P2O5 % (*) Recovery P2O5 (%) Test
Feed 100 4,96 100
Conventional
concentrate 8,0 27,6 45,9 FI-51
Generated slimes
concentrate 2,8 27,0 11,8 LG-23
Natural slimes
concentrate 1,9 14,9 8,5 LN-09
The sample assay of the conventional concentrate considered was obtained from a 6 kg
sample used for the magnetic separation tests. Assays of the natural slimes and generated
slimes were re-analysed using gravimetric methods in May 2010.
This pilot plant tests showed that the results using column cell flotation were improved
compared to use of mechanical flotation cells.
Due to the iron content in the concentrate of 3.38% Fe2O3, that could retrogradate the
chemical reaction with sulphuric acid, 6 Kg of the conventional concentrate was submitted for
high intensity magnetic separation tests in July 2010 at the Eriez laboratories in São Paulo. It
was possible to achieve a non-magnetic product with a P2O5 grade of 28.5% and Fe2O3
grade of 1.98% recovering more than 98.3% of the P2O5 contained in the original feed
concentrate.
Additional bench scale flotation tests were conducted in October and December 2009 at the
FUNMINERAL Laboratories on a sample of 1 tonne comprising 5% Phosphorite and 95%
Siltite collected from the São Bento deposit (5). The testing evaluated the grind size, the
necessity to separate produced slimes from the conventional size fractions, cationic flotation
to eliminate silica from the concentrates produced, reagents conditioning time, starch
utilization requirements, concentrate grade versus P2O5 recovery curve and regrinding of the
first concentrate produced with the objective of obtaining a cleaning stage concentrate with a
higher P2O5 content.
The results showed that it is not necessary to grind the ore to less than 80% passing
74 microns. The separation of the produced slime from the conventional fractions was
important in increasing P2O5 concentrate grades. Cationic flotation of silica did not improve
metallurgy. Typical results achieved were a concentrate grade of 26.9% P2O5, recovering
49.5% of the contained P2O5 in the sample (average of results of tests TS5 and TS5R).

Amazon GeoServices Ltda ABN 52 065 481 209 Mineral Resource Estimate - Arraias Phosphate Project, Para State, Brazil – MBAC Page: 66 Effective Date – 27 March 2013
6005 Australia
Second Campaign of Pilot Plant Tests – Mechanical Flotation Cells
In January 2010 a second pilot plant campaign was conducted to evaluate the optimum feed
flotation grind size for a composite sample from the São Bento and Coité deposits.
Approximately 20 tonnes of mineralized siltstone from the surface of these deposits was
selected based upon the canal assays of the geology. It was used the FUNMINERAL pilot
plant and the CDTN column flotation plant as before. The same process flow-sheet was
utilized, except that the feed sample was ground coarser, around 80-85% passing 74 microns.
The ore was prepared in Goiais to generate the three size fractions which were packed and
then sent to Belo Horizonte for the column flotation tests. The following results were achieved.
See Table 13.1_4.
Table 13.11_3 – Pilot Plant Column Flotation Results (composite sample from São Bento and Coite)
Products Weight (%) Assay P2O5 % (*) Recovery P2O5 (%) Test
Feed 100 6,48 100
Conventional
concentrate 13,41 26,3 57,2 FI-55
Generated slimes
concentrate 3,71 14,0 7,0 LG-29
Natural slimes
concentrate 2,9 14,4 6,5 LN-13
Reduction on the grinding size promoted an increase of the P2O5 contained in the
conventional fraction. This made possible to produce a higher recovery on the conventional
concentrate.

Amazon GeoServices Ltda ABN 52 065 481 209 Mineral Resource Estimate - Arraias Phosphate Project, Para State, Brazil – MBAC Page: 67 Effective Date – 27 March 2013
6005 Australia
Third Pilot Plant Campaign – Mechanical Flotation Cells
In May and June 2010, another pilot plant campaign was conducted at FUNMINERAL with
two samples of siltstone from the base of the Coité deposit, collected at a depth of three
meters at various locations of the deposit, to evaluate the metallurgical response according to
the P2O5 feed grade. Each of the samples weighted around 15 tonnes, one sample with a
grade of 3.6% P2O5 referred to as the “poor” sample and the other sample with a grade of
6.5% P2O5 and referred to as the “rich” sample. The tests were conducted on different blends
of both the rich and poor samples. The recovery of P2O5 to the conventional concentrate was
also investigated based upon the feed grind size. Table 13.1.5 below presents the results:
Table 13.1.4 – Flotation Recovery of the Conventional Fraction (different blends of rich and poor samples from Coité Mine)
TEST SAMPLE FEED + 74 MICRA P2O5 FLOTATION
CONV CONCENTRATE
GRADE IN DISTRIB RECOVERY GRADE DISTR.
P2O5 (%) CONV (%) CONV(%) P2O5 (%) P2O5 (%) P2O5 (%)
3 6345 4,5 11,8 50,45 26,36 29,6 13,3
4 6345 4,2 19,5 43,4 73,04 24,1 31,7
5 6345 4,3 14,6 51,43 71,75 23,4 36,9
7 6345 4,9 17,9 50,82 71,23 24,5 36,2
8 RICH 6,1 7,9 54,9 90,71 22,2 49,8
9 RICH 7,0 6,3 53,1 91,34 22,7 48,5
10 POOR 3,6 28,4 58,3 75,13 22,3 43,8
11 POOR 4,0 20,4 54 72,59 23,0 39,2
12 RICH 6,1 10,3 56 80,54 25,1 45,1
13 RICH 6,6 6,6 57,5 84,17 24,0 48,4
14 3340 5,2 12,4 49 81,22 25,2 39,8
15 3340 5,0 7,8 49,2 75,20 25,3 37,0
16 3340 5,4 5 47,2 76,69 21,3 36,2
17 3340 5,3 3,4 39,6 83,84 23,9 33,2
18 3340 4,9 0,2 36,3 85,40 22,8 31,0
19 3340 5,3 0,1 43,8 85,84 22,9 37,6
20 3340 5,1 0,8 40,7 90,91 23,6 37,0
22 3340 4,7 2,1 55,7 85,46 26,1 47,6
23 3340 4,8 2,2 54,6 80,22 24,3 43,8
Tests 1 to 13 were done with the same rod charge used in the rod mill. The rod charge was
increased for tests 14 to 20. In tests 12, 13, 22 and 23, the ore was ground and de-slimed
once. The following observations were noted:
The poor sample is harder than the rich one. The weight% above 74 microns increased from
7% in tests 8 and 9 to 24% in tests 10 and 11;
Total P2O5 recovery in the conventional fraction does not increase with grind size;
Total P2O5 recovery and concentrate grade of the flotation of the conventional fraction did not
change with the different blends.
Better results were obtained when the ore was totally ground and de-slimed once.

Amazon GeoServices Ltda ABN 52 065 481 209 Mineral Resource Estimate - Arraias Phosphate Project, Para State, Brazil – MBAC Page: 68 Effective Date – 27 March 2013
6005 Australia
Variability Testing of the Different Resource Targets
With the evolution of the mineral resources evaluation a program was initiated to check the
variability of the new target materials compared to more developed process. In the beginning
of 2010 several mineralized diamond drill core samples from different depths of the Juscelino,
Mateus, Coité and São Bento deposits were obtained. These samples weighed around 2 kg
each and were separately crushed to minus 4 mm, de-slimed using hydrociclones and the
underflow was ground to 80% passing 75 microns and floated in a laboratory flotation cell at
the FUNMINERAL laboratories.
Table 13.1_6 below shows the results of selected tests.
Table 13.1_5 – Selected Tests
COITÉ TARGET
Sample Depth Head Rougher Concentrate Cleaner Concentrate
From (m)
To (m)
P2O5 (%)
P2O5(%) grade
P2O5(%) recovery
P2O5(%) grade P2O5(%) recovery
9497 9,8 12,4 7,4 12,8 63,9 19,2 49,8
9498 2,9 5,1 8,4 13,9 63,4 20,2 56,5
9501 9,7 12,7 5,5 13,3 52,7 21,4 44,8
9508 11,1 13,2 6,3 12,5 66,4 21,1 47,7
9511 17,0 20,6 6,8 14,8 58,1 22,1 48,1
9514 16,8 18,6 5,8 18,7 62,3 28,5 53,1
9518 17,3 19,3 7,7 16,2 65,7 21,6 21,6
9519 19,3 21,8 7,2 14,1 68,0 19,9 19,9
Averages 6,9 14,6 62,6 21,8 42,7
SÃO BENTO TARGET
Sample Depth Head Rougher Concentrate Cleaner Concentrate
From (m)
To (m)
P2O5 (%)
P2O5(%) grade
P2O5(%) recovery
P2O5(%) grade P2O5(%) recovery
9537 6,0 7,3 4,8 17,6 50,4 32,1 42,2
9541 20,9 22,2 8,6 14,7 63,6 23,3 50,5
Averages 6,7 16,1 57,0 27,7 46,4
MATEUS TARGET
Sample Depth Head Rougher Concentrate Cleaner Concentrate
From (m)
To (m)
P2O5 (%)
P2O5(%) grade
P2O5(%) recovery
P2O5(%) grade P2O5(%) recovery
9548 23,4 26,2 8,0 16,7 60,7 25,3 43,2
9550 45,6 48,3 4,5 14,3 56,9 24,4 37,2
9551 48,3 49,4 6,5 15,6 59,0 27,9 31,4
9555 29,7 32,5 7,5 15,8 66,8 23,7 33,3
9560 8,7 11,7 8,5 14,3 50,3 23,8 26,7
Averages 7,0 15,3 58,8 25,0 34,4

Amazon GeoServices Ltda ABN 52 065 481 209 Mineral Resource Estimate - Arraias Phosphate Project, Para State, Brazil – MBAC Page: 69 Effective Date – 27 March 2013
6005 Australia
JUSCELINO TARGET
Sample Depth Head Rougher Concentrate Cleaner Concentrate
From (m)
To (m)
P2O5 (%)
P2O5(%) grade
P2O5(%) recovery
P2O5(%) grade P2O5(%) recovery
9590 23,2 25,8 5,6 11,6 70,3 21,1 41,1
9591 31,9 33,6 9,0 16,5 85,4 22,4 44,1
9593 11,3 14,5 7,5 16,1 68,6 24,6 35,5
9597 46,7 49,0 6,4 16,2 54,7 22,1 19,2
Averages 7,1 15,1 69,8 22,6 35,0
DOMINGOS TARGET
Sample Depth Head Rougher Concentrate Cleaner Concentrate
From (m)
To (m)
P2O5 (%)
P2O5(%) grade
P2O5(%) recovery
P2O5(%) grade P2O5(%) recovery
T128 BLENDED 8,3 16,9 42,7 20,1 35,6
T131 BLENDED 8,3 14,8 49,3 19,1 43,4
Averages 8,3 15,9 46,0 19,6 39,5
CANA BRAVA TARGET
Sample Depth Head Rougher Concentrate Cleaner Concentrate
From (m)
To (m)
P2O5 (%)
P2O5(%) grade
P2O5(%) recovery
P2O5(%) grade P2O5(%) recovery
T137 BLENDED 5,6 12,6 42,1 19,5 35,6
Averages 5,6 12,6 42,1 19,5 35,6
From these tests results it was possible to conclude that the underground material from these
targets responded well to the flotation process selected for the original deposits tested.
The results obtained were similar or better than those achieved at bench scale for the first
sample, pile 6, indicating the projected metallurgical results at full scale should be similar or
better than those obtained for the first sample. Also the Fe2O3 content was low in these tests
(< 2.0%). The same processing route was used including a flotation rougher step and one
step of cleaning flotation.
Conclusions - Flotation
Several bench and pilot plant tests have been performed over the past two years using
material from the main defined resource targets of the Arraias Tocantins deposit. A consistent
and reproducible processing flotation flow-sheet was developed to treat the various sources
from the deposit. This process allows the beneficiation of phosphate ore containing 4.5% to
6.0% P2O5 to concentrates containing 28% P2O5 whilst recovering 55 to 58% of the
contained P2O5.
The pilot tests were conducted using material from the Coité and São Bento deposits, using
both mechanical and column flotation cells. In addition to this, samples of drilled material from
several other areas of the Arraias Tocantins mineral deposit were tested at bench scale with
the results confirming the validity of the process route selected for the entire Arraias Tocantins
deposit.

Amazon GeoServices Ltda ABN 52 065 481 209 Mineral Resource Estimate - Arraias Phosphate Project, Para State, Brazil – MBAC Page: 70 Effective Date – 27 March 2013
6005 Australia
13.1.3 Thickening and Filtration
MBAC commissioned FLSMIDTH to conduct solid-liquid separation tests (laboratory scale
tests) on the samples from the flotation concentrates (3) with the objective to direct the
technical-economic analysis on equipment purchase for the thickening stage.
Tests were performed on samples produced in the CDTN pilot plant in Belo Horizonte (MG)
during March and July 2009.
13.1.4 Technological Characterization
A characterization study on phosphate ore processing samples were conducted by
FUNDESPA (“Fundação de Estudos e Pesquisas Aquáticas”) via LCT (“Laboratório de
Caracterização Tecnológica da EPUSP”) for MBAC.
Liberation level studies indicated that approximately 50% of the apatite present is found to be
liberated in the conventional flotation feed and concentrate samples. It was also noted that the
liberation levels in the +53, -53+37, -37+20 and 20+10 micron size zones do not increase to
the finer size zones, indicating that a finer grinding will not be favorable in obtaining
concentrates with a higher P2O5 content and recovery.
13.1.5 Acidulation
Acidulation tests were conducted in Prosolo laboratories located in Catalão, state of Goiás
from May to September 2009, and in CELQA Analises Técnicas Ltda (which is accredited by
Agricultural Ministry located in Sorocaba), state of São Paulo from December 2009 to
February 2010.
The tests were aimed at checking the production of single super phosphate (“SSP”) from the
Itafós Project phosphate rock concentrate in a laboratory scale.
Test results showed that it would be viable to obtain the following single SSP products:
ammoniated SSP and sulphur acidulated phosphate and is dependent upon the phosphate
rock content.
Conclusions
Considering all the tests performed with several phosphate rock concentrations (P2O5,
Fe2O3/Al2O3 or Fluorine) with different granulometry, variations in the A/R ratio and sulphuric
acid concentration, it is possible to conclude the following:
9) The production of ammoniated SSP with 1% of nitrogen and 17% of soluble P2O5 in
NAC with Itafos’ rocks with of 27-28% of P2O5 is viable and it is the most suitable
solution for the specific acidulation process. It is possible, with the addition of the
ammonium (N), to obtain a product with its quality improved because of its reduced free
acidity and because the granules in the granulation plant become harder, allowing for
the SSP to be mixed with urea and other raw materials without creating parallel
reactions that can provoke the final NPK to become a paste

Amazon GeoServices Ltda ABN 52 065 481 209 Mineral Resource Estimate - Arraias Phosphate Project, Para State, Brazil – MBAC Page: 71 Effective Date – 27 March 2013
6005 Australia
10) It is also viable to obtain SSP (single superphosphate) with 18% of soluble P2O5 in
neutral ammonium citrate, without the addition of ammonia, from rocks with a grades of
28% of P2O5 and lower levels of Fe2O3 (1.5% or below). The solubility of P2O5 in
water is close to the limit of minimal guarantee of 15%. This solution was not chosen
because the lower flexibility and poor product physical quality.
11) At this point it must be considered that the ammoniated SSP production with 2% of
nitrogen and 16% of P2O5 NAC is also one possible option, as it allows for a greater
flexibility in regards to the grades of P2O5 and provides even lower free acidity when
compared to the chosen solution.
12) It is better to produce SSP from the “pulp” of a phosphate rock with the addition of
water before the sulphuric acid dosage, to optimize the process reactivity.
13) Rock with granulometry 95% below the 200# is adequate to the process reactivity.
14) With low fluorine levels in the phosphate rock, the emissions of this effluent are easier
to be absorbed in the gas scrubber system.
15) The sulphuric acid consumption is lower than the usually utilized in other rocks to
obtain the best possible conversion.
16) The optimum sulphuric acid concentration is equal or inferior to 65% to guarantee an
aqueous phase, appropriated to the process reactivity.

Amazon GeoServices Ltda ABN 52 065 481 209 Mineral Resource Estimate - Arraias Phosphate Project, Para State, Brazil – MBAC Page: 72 Effective Date – 27 March 2013
6005 Australia
14 MINERAL RESOURCE ESTIMATES
14.1 Introduction
AMS has reviewed the Mineral Resource Estimates competed for the Itafós Project as follows:
Near Mine Domain – Completed by Callum Grant (Wardrop) in July 2010;
Domingos Domain (includes Sao Bento) – Completed by Leandro Silva (MBAC) in
November 2011;
Canabrava Domain – Completed by Leandro Silva (MBAC) in November 2011.
Figure 14.1_1 Plan View of Block Model Domains
Canabravas Domain
Near Mine Domain
Domingos Domain
Sao Bento Domain
(part of the Domingos
Block Model)

Amazon GeoServices Ltda ABN 52 065 481 209 Mineral Resource Estimate - Arraias Phosphate Project, Para State, Brazil – MBAC Page: 73 Effective Date – 27 March 2013
6005 Australia
14.2 Near Mine Block
The original block model completed by Wardrop 2010 has been utilized for resource reporting
across the Near Mine domain discussed in the following section below.
14.2.1 Drill Hole Database
The original Near Mine domain was modelled by Wardrop on data received from MBAC
comprising of 612 diamond drill holes and 650 RC drill holes equalling 28,673 assays and
2,207 density values. At the time assay values for 135 drill holes were outstanding.
The updated block model by Wardrop in July 2010, includes this original data, plus the
outstanding assay values from the 135 RC drill holes, plus an additional 14 drill holes (12
diamond drill holes and two RC drill holes). Additionally, six drill holes were re-sampled and
the new values were updated in the database.
The complete database, received from Itafós, consisted of 624 diamond drill holes and 652
RC drill holes for a total of 1,276 drill holes.
The database consisted of a total of 33,795 assay results.
DATA VERIFICATION
Wardrop reviewed the 135 new assay results and the assay results of the 14 drill holes.
A 10% check was made of these assay values and found that the errors in the database were
<0.01%.
The errors were found in the sample interval lengths and corrected in the database.
14.2.2 Geological Interpretation
The deposit geology for the Near Mine Domain was modelled using the lithological coding
from the drill hole data to define three main rock types: Soil, Siltstone and Breccia.
Triangulated surfaces were modelled representing the base of the soil profile and the base of
the siltstone package. The two minor breccia units were modelled on section using lines to
create triangulated wireframes (Figures 14.2_1 and 14.2_2).
The topography surface was modelled using 1m contour data provided by Itafós which
covered most of the investigated area. Outside of the available contour data the elevations of
the drill hole locations were used to extend the topographic surface over the entire
investigated area.
The wireframes were used to code a block model with rock codes (soil, siltstone and breccia).
AMS reviewed the geological coding as specified by Wardrop (2010) and conclude the data is
sound with no material errors noted within the dataset.

Amazon GeoServices Ltda ABN 52 065 481 209 Mineral Resource Estimate - Arraias Phosphate Project, Para State, Brazil – MBAC Page: 74 Effective Date – 27 March 2013
6005 Australia
Figure 14.2_1 Near Mine Domain; Soil Wireframe (Clipped to topography)
Figure 14.2_2 Near Mine Domain; Siltstone and Breccia Wireframes (Clipped to Topography)
Soil Domain
Siltstone Domain
Breccia Domain

Amazon GeoServices Ltda ABN 52 065 481 209 Mineral Resource Estimate - Arraias Phosphate Project, Para State, Brazil – MBAC Page: 75 Effective Date – 27 March 2013
6005 Australia
14.2.3 Data Analysis
Assays
Wardrop completed descriptive statistics on the raw assays received from MBAC, and this
data is presented below in Table 14.2_1.
Table 14.2_1 – Descriptive Statistics on Raw Assay Drill Hole Data (No Zeroes)
Length % P2O5 % Al2O3 % CaO % Fe2O3 % SiO2
Valid cases 33,795 33,795 33,794 33,794 33,794 33,794
Mean 1.29 1.40 10.46 5.49 4.83 65.74
Variance 0.36 6.58 18.40 95.53 7.23 296.85
Standard Deviation 0.60 2.56 4.29 9.77 2.69 17.23
Variation Coefficient 0.47 1.83 0.41 1.78 0.56 0.26
Minimum 0.05 0.005 0.005 0.005 0.09 0.83
25th percentile 1.00 0.24 7.76 0.13 3.41 62.40
Median 1.00 0.44 10.90 0.65 4.77 70.00
75th percentile 1.40 1.43 13.70 5.18 6.00 75.90
Maximum 12.92 33.07 27.30 58.50 61.00 99.30
Capping
All assay data were reviewed prior to estimating resources for possible erratic high values or
outliers. The data were plotted on histograms and cumulative distribution curves as well as
being subjected to a decile analysis to identify possible outliers. Wardrop concluded that
capping was not warranted for the Itafós Project dataset.
Composites
In order to normalize the assay data, raw assay values are often composited to a standard
length. Wardrop composited the raw assay values to a 1m length starting at the base of the
drill holes and honouring the modelled geological boundaries. Any composite less than 0.5m
in length was deleted from the dataset. Intersections less than 1m but greater than 0.5m was
included, thereby creating a dataset of composites ranging from 0.5m to 1m in length.
Descriptive statistics of the composites are presented in Table 14.2_2.
Table 14.2_2 – Descriptive Statistics on 1m Composited Drill Hole Data (No Zeroes)
Length % P2O5 % Al2O3 % CaO % Fe2O3 % SiO2
Valid cases 37459 37459 37459 37459 37459 37459
Mean 1.00 1.49 11.15 3.44 5.22 68.66
Variance 0.00 6.49 13.21 42.50 5.91 148.91
Standard Deviation 0.03 2.55 3.63 6.52 2.43 12.20
Variation Coefficient 0.03 1.71 0.33 1.89 0.47 0.18
Minimum 0.50 0.0025 0.005 0.005 0.0245 0.55
25th
percentile 1.00 0.26 8.82 0.12 3.97 64.40
Median 1.00 0.49 11.35 0.40 5.08 70.60
75th
percentile 1.00 1.65 13.80 3.59 6.15 76.00
Maximum 1.00 30.30 27.30 49.20 59.00 98.70

Amazon GeoServices Ltda ABN 52 065 481 209 Mineral Resource Estimate - Arraias Phosphate Project, Para State, Brazil – MBAC Page: 76 Effective Date – 27 March 2013
6005 Australia
14.2.4 Spatial Analysis of Grades
Wardrop used Sage 2001 software, and completed variograms for P2O5 within each
mineralized zone at the Itafós Project deposit. Directional sample correlograms were
calculated along horizontal azimuths of 0, 30, 60, 90, 120, 150, 180, 210, 240, 270, 300 and
330 degrees. For each azimuth, sample correlograms were also calculated at dips of 30° and
60° in addition to horizontally. Lastly, a correlogram was calculated in the vertical direction.
Using the 37 correlograms, an algorithm determined the best-fit model. This model is
described by the nugget (C0), two nested structure variance contributions (C1, C2), ranges for
the variance contributions and the model type (spherical or exponential). After fitting the
variance parameters, the algorithm then fits an ellipsoid to the 37 ranges from the directional
models for each structure. The final models of anisotropy are given by the lengths and
orientations of the axes of the ellipsoids.
Table 14.2_3 – Correlogram Model
Element Model
Z
Rotation
Y
Rotation
Z
Rotation
X
Range
Y
Range
Z
Range
P2O5 C0=0.102
C1=0.725 65 35 18 11.2 61.1 18.6
C2=0.173 -82 0 27 1551.5 406.3 44.3
Note: Rotation angles were set to correspond to Gemcom Software’s rotational convention, which
follows the right hand rule with rotation about Z-axis being positive when X moves towards the Y-axis;
rotation about the Y-axis is positive when Z moves towards the X-axis.
14.2.5 Resource Block Model
The block model coordinates are in the Universal Transverse Mercator (UTM) NAD83
coordinate system and are oriented so that model north is parallel to true north.
The block model is comprised of blocks measuring 12.5m length by 12.5m width by 3m
thickness with an origin defined as:
x = 307587.5, y = 8569193.75, z = 900.
498 columns, 342 rows and 111 levels.
The origin in Gems software is defined as the minimum x, minimum y and maximum z point.
Interpolation Plan
Grades were interpolated within the block model using the Ordinary Kriging (OK) interpolation
method with weighting parameters based on the correlogram data presented in Table 14.2.3.
Grades were interpolated using the 1m composite values. The grades were interpolated in
three separate passes. Sample selection was based on search ellipse scaled to a proportion
of the ranges from the correlogram model for P2O5: Pass 1 at 60m (the full variogram range),
Pass 2 at 120m (twice the variogram range), and Pass 3 at 210m.

Amazon GeoServices Ltda ABN 52 065 481 209 Mineral Resource Estimate - Arraias Phosphate Project, Para State, Brazil – MBAC Page: 77 Effective Date – 27 March 2013
6005 Australia
Grades were only interpolated in the first two passes if at least four samples were found within
the search ellipse and a maximum of 18 samples were used to interpolate any block. The
third pass required a minimum of one sample and a maximum of 18 samples. Sample
selection for grade interpolation was also restricted by domain; thus, any siltstone block was
interpolated using only samples found within the siltstone, breccia blocks with breccia
samples and soil blocks with soil samples.
Mineral Resource Classification
Mineral resources were classified in accordance with definitions provided by the Canadian
Institute of Mining, Metallurgy, and Petroleum (CIM) as stipulated in NI 43-101.
The Itafós Project Mineral Resources for the five principal Near Mine Blocks were classified
by Wardrop as Measured, Indicated and Inferred based on the following interpolation criteria:
Measured: Blocks interpolated with at least four composites from two holes,
maximum of three per hole within a 60m search radius.
Indicated: Minimum of four composites from two holes, maximum of three per hole,
120m search radius.
Inferred: At least one composite per block, 210m search radius.
The classification model was visually examined for reasonableness. The classification was
modified to eliminate pockets of Measured Resources found within Indicated zones and
pockets of Indicated Resources found within Inferred zones.
Cut-off Grade
A cut-off grade of 2.8% P2O5 is used in the reporting of resource estimates as requested by
MBAC.
14.2.6 Mineral Resource Tabulation
The mineral resources for the Near Mine Block of the Itafós Project deposit have been
classified as Measured, Indicated and Inferred Resources based on the number of composite
samples and the number of drillholes used in the block estimation. No recoveries have been
applied to the resource estimates as the metallurgical testwork is incomplete for all grades of
fertilizer products.
Wardrop estimated that the Near Mine Block contains 27.59 Mt of Measured and Indicated
Resources averaging 4.35% P2O5 at a 2.8% P2O5 cut-off and 4.04 Mt of Inferred Resources
averaging 4.00% P2O5 at a 2.8% P2O5 cut-off. This resource includes portions of the Domingo
Domain (Sao Bento) as illustrated below in Figure 14.2_3.

Amazon GeoServices Ltda ABN 52 065 481 209 Mineral Resource Estimate - Arraias Phosphate Project, Para State, Brazil – MBAC Page: 78 Effective Date – 27 March 2013
6005 Australia
The mineral resources are reported in Table 14.2.4 as of July 9, 2010:
Table 14.2.4 – Near Mine Mineral Resources at a 2.8% P2O5 Cut-off
Density Tonnage
(Mt)
P2O5
(%)
Al2O3
(%)
CaO
(%)
Fe2O3
(%)
SiO2
(%)
Measured 1.54 17.48 4.46 9.00 7.81 4.30 63.81
Indicated 1.54 10.11 4.16 9.12 7.46 4.26 63.16
M & I 1.54 27.59 4.35 9.04 7.68 4.29 63.57
Inferred 1.58 4.04 4.00 8.41 6.29 4.88 66.94
Figure 14.2_3 Near Mine Mineral Resource Classification (Wardrop - July 9, 2010)
Sao Bento and Domingo
Domains Included

Amazon GeoServices Ltda ABN 52 065 481 209 Mineral Resource Estimate - Arraias Phosphate Project, Para State, Brazil – MBAC Page: 79 Effective Date – 27 March 2013
6005 Australia
14.2.7 Block Model Validation
AMS has reviewed the Wardrop mineral Resource Estimate and has the following comments
in the validation process:
Drilling and studies completed to date have defined a measured, indicated and
inferred mineral resource at the Near Mine Project. The drilling data collected, is
considered to be of moderate quality and suitable for mineral resource classification
to a measured and indicated status within a large portion of the mineralized domain
as illustrated below in Figure 14.2_4.
Figure 14.2_4 Near Mine Mineral Resource Classification with Drill Collar Locations
Resource classification is appropriate based on a sectional review of grades and
general distribution of drilling across the project area Figures 14.2_4 to 14.2_7),
however AMS recommends that the length of the search ellipse used for 1st pass
(60m) and 2nd pass (120m) Mineral Resources Estimates be reviewed in future
estimates. AMS believe the search distance should be extended for a continuous,
flat-lying P2O5 deposits such as this, and recommend construction of new variogram
graphs for the mineral resource estimate.
AMS note the Sao Bento domain was included as part of the mineral resource
estimation completed by Wardrop in July 2010 (Figure 14.2_4). AMS have removed
Sao Bento from the Near Mine block model and added this portion to the Domingo
mineral resource estimate for reporting purposes (Figures 14.2_5 to 14.2_7 below).
Drill Hole Collar Locations

Amazon GeoServices Ltda ABN 52 065 481 209 Mineral Resource Estimate - Arraias Phosphate Project, Para State, Brazil – MBAC Page: 80 Effective Date – 27 March 2013
6005 Australia
Figure 14.2_5 Near Mine Mineral Resource Classification with Sao Bento/Domingo Domain Removed
Figure 14.2_6 Near Mine Mineral Resource Classification with Near Mine Domain Wireframe
Sao Bento and Domingos
Domains Removed
Unclassified
Resource
Sao Bento and Domingo
Domains Removed

Amazon GeoServices Ltda ABN 52 065 481 209 Mineral Resource Estimate - Arraias Phosphate Project, Para State, Brazil – MBAC Page: 81 Effective Date – 27 March 2013
6005 Australia
Figure 14.2_7 Near Mine Mineral Resource Classification with P2O5 Grade Range Displayed
There is further upside for significant addition of measured and indicated resource
through programs of infill drilling.
Given increased geological knowledge from current mining (which will allow more
detailed domain modelling mainly focussed on the limits of breccia zones), along with
minor limitations identified in the current Wardrop mineral resource estimate, AMS
recommends that an updated mineral resource for all domains be undertaken.
Sao Bento and Domingos
Domains Removed

Amazon GeoServices Ltda ABN 52 065 481 209 Mineral Resource Estimate - Arraias Phosphate Project, Para State, Brazil – MBAC Page: 82 Effective Date – 27 March 2013
6005 Australia
14.3 Domingos Block
MBAC (December 2011) has refined the geological wireframe and subsequent block
modelling for the Domingos domain based on an initial interpretation and block model
provided by Wardrop in 2010.
As stated in the April 27th, 2011 press release, systematic drilling of high-potential areas has
led to identification of additional, shallower and higher than average grade phosphate
mineralization in the northern Domingos Block (new area termed Sao Bento).
The new drilling campaign totalled 4,551 m of reverse circulation drilling and 768 m of
diamond drilling.
14.3.1 Drill Hole Database
The original Domingos polygonal model was modelled on 60 drill holes drilled at
approximately 200m to 550m centres.
The updated Domingos block model was modelled on data received from Itafós from 210 drill
holes comprised of 13 diamond drill holes and 197 RC drill holes equalling 13,624 assay
values.
Drilling was completed at a nominal 100m by 100m spacing with portions of infill drilling to a
50m by 50m grid spacing.
DATA VERIFICATION
MBAC reviewed the assay results of the Domingos database where a 10% check was made
of these assay values and found that there were <0.01% errors in the database.
The errors were found in the sample interval lengths and corrected in the database.
14.3.2 Geological Modelling
The Domingos mineralized wireframe domain(s) was modelled using a minimum 1% P2O5
grade range boundary, which was tightly controlled around existing drill holes.
AMS note that MBAC have removed the original rock codes that were applied to the Wardrop
model completed in 2010. There is no longer any distinction between soil and siltstone rock
types as previously defined by Wardrop.
The bulk density is likely to have been smoothed throughout the model and subsequently may
be over estimating tonnage throughout the wireframe based on the removal of the soil profile
from the interpretation.
A review of the block model by AMS shows that a nominal 1.53 g/cm3 has been used as an
average density value throughout the Domingos mineralized wireframe.

Amazon GeoServices Ltda ABN 52 065 481 209 Mineral Resource Estimate - Arraias Phosphate Project, Para State, Brazil – MBAC Page: 83 Effective Date – 27 March 2013
6005 Australia
Figure 14.3_1 Domingos and Sao Bento Wireframe with Drill Hole Collars
The topographic surface was modelled using 2.5m contour data provided by Itafós which
covered the majority of the project area (Figure 14.3_2).
Figure 14.3_2 Domingos and Sao Bento Wireframe with Drill Hole Collars and Topography
Domingos Domain
Sao Bento Domain
50m x 50m
Drill Spacing
100m x 100m
Drill Spacing
Topographic Surface
Domingos
Wireframe
outside the
Topographic
Surface

Amazon GeoServices Ltda ABN 52 065 481 209 Mineral Resource Estimate - Arraias Phosphate Project, Para State, Brazil – MBAC Page: 84 Effective Date – 27 March 2013
6005 Australia
14.3.3 Data Analysis
Assays
Descriptive statistics on the raw assays received from Itafós for the Domingos domain are
presented below in Table 14.3.1.
Table 14.3.1 – Descriptive Statistics on Raw Assay Drill Hole Data (No Zeroes)
Length % P2O5 % Al2O3 % CaO % Fe2O3 % SiO2
Valid cases 13624 13624 13624 13624 13624 13624
Mean 1.08 1.35 10.35 5.39 4.60 65.02
Variance 0.09 8.01 29.68 91.37 8.97 400.61
Standard Deviation 0.29 2.83 5.45 9.56 3.00 20.02
Variation Coefficient 0.23 1.79 0.45 1.52 0.56 0.26
Minimum 0.10 0.01 0.01 0.01 0.01 0.66
25th
percentile 1.00 0.15 5.88 0.09 2.58 59.80
Median 1.00 0.31 10.50 0.31 4.38 68.60
75th
percentile 1.00 1.04 15.00 5.51 6.22 78.20
Maximum 4.70 30.7 31.1 53.9 57.3 99.4
Capping
No capping was applied to the Domingos Block database. All assay data was reviewed prior
to estimating resources for possible erratic high values or outliers.
Composites
Within the Domingos wireframe, MBAC composited the raw assay values to a 1m length
starting at the base of the drill hole and honouring the modelled geological and grade
boundaries. All composites were used in the mineral resource estimation. AMS have
presented a basic graph below (Figure 14.3_3) which shows the grade distribution for P2O5
based on 1m composites generated within the Domingos domain.
Figure 14.3_3 1m Composite Data Statistics for Domingos Domain (Includes Sao Bento)
AMS recommends that the highest outliers should have been capped to around 20% P2O5.

Amazon GeoServices Ltda ABN 52 065 481 209 Mineral Resource Estimate - Arraias Phosphate Project, Para State, Brazil – MBAC Page: 85 Effective Date – 27 March 2013
6005 Australia
14.3.4 Spatial Analysis of Grades
The interpolation method used to estimate the Domingos Block was Ordinary Kriging (OK).
Two separate domains are defined for the Domingos wireframe with a smaller higher grade
portion termed Sao Bento and the larger southern block known as Domingos.
14.3.5 Resource Block Model
The block model coordinates are in the UTM NAD83 coordinate system and are oriented so
that model north is parallel to true north.
The block model is comprised of blocks measuring 12.5m length by 12.5m width by 3m
thickness with an origin defined as:
x = 309302, y = 8566500, z = 910.
160 columns, 230 rows and 87 levels.
The origin in Gems software is defined as the minimum x, minimum y and maximum z point.
Interpolation Plan
Grades were interpolated within the block model using the OK interpolation method.
Grades were interpolated using the 1m composite values. The grades were interpolated in
three separate passes. Sample selection was based on search ellipse used for the Near Mine
Block; that is, scaled to a proportion of the ranges from the correlogram model for P2O5: Pass
1 at 60m (the full variogram range); Pass 2 at 120m (twice the variogram range) and Pass 3
at 210m.
Grades were only interpolated in the first two passes if at least four samples were found within
the search ellipse and a maximum of 18 samples were used to interpolate any block. The
third pass required a minimum of one sample and a maximum of 18 samples.
Sample selection for grade interpolation was also restricted by domain; thus, any Sao Bento
block was interpolated using only samples found within the Sao Bento wireframe and likewise
for the Domingos wireframe.
Mineral Resource Classification
Mineral resources were classified in accordance with definitions provided by CIM as stipulated
in NI 43-101.
The Itafós Project Mineral Resources for the Domingos Block were classified by MBAC as
Measured, Indicated and Inferred based on the following interpolation criteria:
o Measured: Blocks interpolated with at least four composites from two holes,
maximum of three per hole within a 60m search radius.
o Indicated: Minimum of four composites from two holes, maximum of three
per hole, 120m search radius.
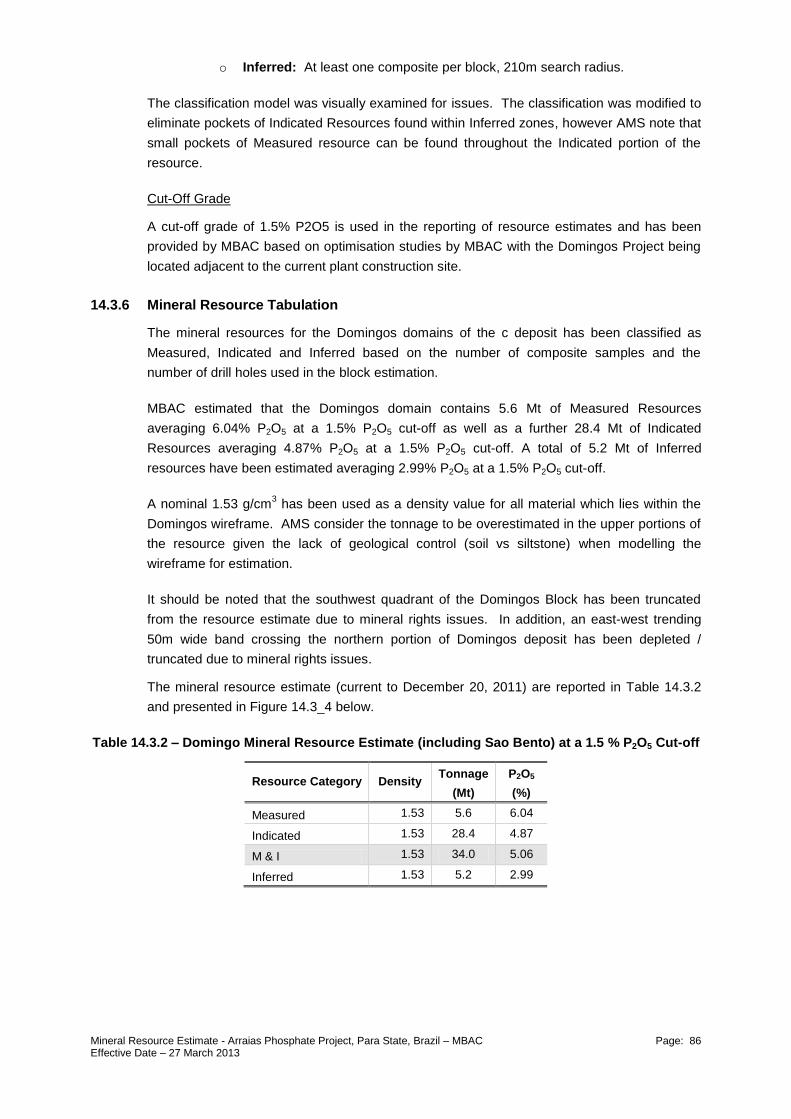
Amazon GeoServices Ltda ABN 52 065 481 209 Mineral Resource Estimate - Arraias Phosphate Project, Para State, Brazil – MBAC Page: 86 Effective Date – 27 March 2013
6005 Australia
o Inferred: At least one composite per block, 210m search radius.
The classification model was visually examined for issues. The classification was modified to
eliminate pockets of Indicated Resources found within Inferred zones, however AMS note that
small pockets of Measured resource can be found throughout the Indicated portion of the
resource.
Cut-Off Grade
A cut-off grade of 1.5% P2O5 is used in the reporting of resource estimates and has been
provided by MBAC based on optimisation studies by MBAC with the Domingos Project being
located adjacent to the current plant construction site.
14.3.6 Mineral Resource Tabulation
The mineral resources for the Domingos domains of the c deposit has been classified as
Measured, Indicated and Inferred based on the number of composite samples and the
number of drill holes used in the block estimation.
MBAC estimated that the Domingos domain contains 5.6 Mt of Measured Resources
averaging 6.04% P2O5 at a 1.5% P2O5 cut-off as well as a further 28.4 Mt of Indicated
Resources averaging 4.87% P2O5 at a 1.5% P2O5 cut-off. A total of 5.2 Mt of Inferred
resources have been estimated averaging 2.99% P2O5 at a 1.5% P2O5 cut-off.
A nominal 1.53 g/cm3 has been used as a density value for all material which lies within the
Domingos wireframe. AMS consider the tonnage to be overestimated in the upper portions of
the resource given the lack of geological control (soil vs siltstone) when modelling the
wireframe for estimation.
It should be noted that the southwest quadrant of the Domingos Block has been truncated
from the resource estimate due to mineral rights issues. In addition, an east-west trending
50m wide band crossing the northern portion of Domingos deposit has been depleted /
truncated due to mineral rights issues.
The mineral resource estimate (current to December 20, 2011) are reported in Table 14.3.2
and presented in Figure 14.3_4 below.
Table 14.3.2 – Domingo Mineral Resource Estimate (including Sao Bento) at a 1.5 % P2O5 Cut-off
Resource Category Density Tonnage
(Mt)
P2O5
(%)
Measured 1.53 5.6 6.04
Indicated 1.53 28.4 4.87
M & I 1.53 34.0 5.06
Inferred 1.53 5.2 2.99

Amazon GeoServices Ltda ABN 52 065 481 209 Mineral Resource Estimate - Arraias Phosphate Project, Para State, Brazil – MBAC Page: 87 Effective Date – 27 March 2013
6005 Australia
Figure 14.3_4 Plan View of Domingos Resource Classification
50m x 50m drill spacing
northern end of Domingos
and Sao Bento Domain(s)
Truncated Portion of
Resource due to mineral
rights issues as reported
by MBAC

Amazon GeoServices Ltda ABN 52 065 481 209 Mineral Resource Estimate - Arraias Phosphate Project, Para State, Brazil – MBAC Page: 88 Effective Date – 27 March 2013
6005 Australia
14.3.7 Block Model Validation
The Domingos block model was validated by querying the block model results and comparing
block values versus drill hole composites on sections; this visual validation of the block model
grades by section correlates well with the drill hole data (Figure 14.3_5).
Figure 14.3_5 Domingos Mineral Resource Classification with P2O5 Grade Range Displayed
Domingos Domain
Sao Bento Domain
8568100 N 8568100 N
Truncated Portion of
Resource due to mineral
rights issues as reported
by MBAC

Amazon GeoServices Ltda ABN 52 065 481 209 Mineral Resource Estimate - Arraias Phosphate Project, Para State, Brazil – MBAC Page: 89 Effective Date – 27 March 2013
6005 Australia
AMS has reviewed the wireframe and mineral resource estimate as presented by MBAC and
have the following comments in the validation process:
o Drilling and studies completed to date have defined a Measured, Indicated
and Inferred mineral resource at the Domingo and Sao Bento Project. The
drilling data collected, is considered to be of moderate quality and suitable for
mineral resource classification to a Measured and Indicated status within a
large portion of the mineralized domains as illustrated above in Figures
14.3_3 and 14.3_4;
o Resource classification is appropriate based on a sectional review of grades
and general distribution of drilling across the project area;
o AMS recommends the search ellipse used for 1st pass (60m) and 2nd pass
(120m) be revised in future estimates. AMS note here that the search
distance should be extended for a continuous, flat-lying P2O5 deposits such
as this, and suggest that the variograms need to be recalculated;
o AMS recommend that a review of some measured resources should be
undertaken given the large number of small areas that have been classified
as measured based on relatively limited drilling information (Figure 14.3_6);
Figure 14.3_6 Domingos Mineral Resource Classification with Drill Collar Locations
o AMS identified the geological coding originally completed by Wardrop (2010)
which included the coding of different rock types (soil and siltstone) has most
recently been removed by MBAC as part of the updated mineral resource
estimate completed for Domingos. There is a significant density difference
between these two domains and removal will result in an over estimate of
tonnage as well as grade smearing throughout the upper portions of the block
model (previously coded as soil);
Small Portions of
Measured which should be
classified as Indicated

Amazon GeoServices Ltda ABN 52 065 481 209 Mineral Resource Estimate - Arraias Phosphate Project, Para State, Brazil – MBAC Page: 90 Effective Date – 27 March 2013
6005 Australia
o AMS recommend that MBAC need to revise geological boundaries for the
wireframe based on rock codes, and that a more thorough review of various
densities applied to the block model should be undertaken;
o AMS recommend the topographic survey should be extended to cover the full
extent of the Domingos wireframe domain as previously illustrated in Figure
14.3_2;
o AMS recommend that there is further upside for significant addition of
measured resource through programs of infill drilling (50m by 50m spacing);
o AMS recommend that given the increase in geological knowledge that has
resulted from the current open pit mining along with current limitations
identified by AMS, that an updated mineral resource estimate be undertaken.

Amazon GeoServices Ltda ABN 52 065 481 209 Mineral Resource Estimate - Arraias Phosphate Project, Para State, Brazil – MBAC Page: 91 Effective Date – 27 March 2013
6005 Australia
14.4 Canabrava Block
MBAC (December 2011) has refined the geological wireframe and subsequent block
modelling for the Canabrava domain based on an initial interpretation and block model
provided by Wardrop in 2010.
The refined wireframe interpretation completed by MBAC, has increased the tonnage and
grade from the prior Wardrop interpretation. No additional drilling is expected for the
Canabrava block in the near future, but in the opinion of AMS, there is excellent potential to
increase the current mineral resources by completing further drilling in all directions.
14.4.1 Drill Hole Database
The original Canabrava polygonal model estimate completed by Wardrop (2010) was
modelled on 116 drill holes drilled at approximately 200m to 450m centres.
The updated Canabrava block model is modelled on data received from Itafós from 249 drill
holes comprised of 94 diamond drill holes and 155 RC drill holes equalling 6,861 assay
values. Drilling was completed at a nominal 100m by 100m spacing across the entire
Canabrava project area.
Data Verification
MBAC reviewed the assay results of the Canabrava database where a 10% check was made
of these assay values, and found that there were <0.01% errors in the database.
The errors were found in the sample interval lengths and corrected in the database.
14.4.2 Geological Modelling
The Canabrava mineralized wireframe domains was modelled using a minimum 1% P2O5
grade range boundary, which was tightly controlled around existing drill holes (Figure 14.4_1).
AMS note that MBAC have removed the original rock codes that were applied to the Wardrop
model completed in July 2010. There is no longer any distinction between soil and siltstone
rock types as previously defined. As part of the Wardrop 2010 model, a higher grade area of
siltstone was modelled and coded separately, however having reviewed the most recent
geological model provided by MBAC, AMS noted the distinction between these domains has
been removed, with only a single mineralized domain modelled. This issue was identified at
Domingos also.
The topographic surface was modelled using 5m contour data provided by Itafós which
covered the investigated area.
A review of the topographic surface by AMS shows no irregularities (Figure 14.4_2).

Amazon GeoServices Ltda ABN 52 065 481 209 Mineral Resource Estimate - Arraias Phosphate Project, Para State, Brazil – MBAC Page: 92 Effective Date – 27 March 2013
6005 Australia
Figure 14.4_1 Canabrava Wireframe with Drill Hole Collar Locations
Figure 14.4_2 Canabrava Wireframe with Drill Hole Collar Locations and Topography
Canabravas Domain
100m x 100m
Drill Spacing
Canabravas
Wireframe overlying
Topographic Surface

Amazon GeoServices Ltda ABN 52 065 481 209 Mineral Resource Estimate - Arraias Phosphate Project, Para State, Brazil – MBAC Page: 93 Effective Date – 27 March 2013
6005 Australia
14.4.3 Data Analysis
Assays
Descriptive statistics on the raw assays received from Itafós for the Canabrava domain are
presented below in Table 14.4.1.
Table 14.4_1 – Descriptive Statistics on Raw Assay Drill Hole Data (No Zeroes)
Length % P2O5
Valid cases 6861 6861
Mean 1.13 1.41
Variance 0.12 7.39
Standard Deviation 0.35 2.72
Variation Coefficient 0.31 1.93
Minimum 0.30 0.01
25th percentile 1.00 0.15
Median 1.00 0.31
75th percentile 1.00 1.33
Maximum 4.70 27.60
Capping
No capping was applied to the Canabrava Block database. All assay data was reviewed
prior to estimating resources for possible erratic high values or outliers. AMS recommends
that the highest outliers should have been capped to around 15% P2O5.
Composites
In the Canabrava block, MBAC composited the raw assay values to a 1m length starting at
the base of the drill holes and honouring the modelled geological (grade controlled)
boundaries. All composites were used in the mineral resource estimation. AMS have
presented a basic graph below (Figure 14.4_3) which shows the grade distribution for P2O5
based on 1m composites generated within the Canabrava domain.
Figure 14.4_3 1m Composite Data Statistics for Canabrava Domain

Amazon GeoServices Ltda ABN 52 065 481 209 Mineral Resource Estimate - Arraias Phosphate Project, Para State, Brazil – MBAC Page: 94 Effective Date – 27 March 2013
6005 Australia
14.4.4 Spatial Analysis of Grades
The interpolation methods used to estimate the Canabrava domain was Ordinary Kriging
(OK).
The Canabrava domain data was examined visually, and was determined to be similar in style
to that of the Near Mine block. Estimation parameters utilized for the Near Mine block model
were subsequently applied to the Canabrava block model.
14.4.5 Resource Block Model
The block model coordinates are in the UTM NAD83 coordinate system and are oriented so
that model north is parallel to true north.
The block model is comprised of blocks measuring 12.5m length by 12.5m width by 3m
thickness with an origin defined as:
x = 304,000, y = 8,275,200, z = 730
210 columns, 210 rows, and 70 levels
The origin in Gems software is defined as the minimum x, minimum y and maximum z point.
Interpolation Plan
Grades were interpolated within the block model using the OK interpolation method.
Grades were interpolated using 1m composite values. The grades were interpolated in three
separate passes. Sample selection was based on the search ellipse used for the Near Mine
Block; that is, scaled to a proportion of the ranges from the correlogram model for P2O5:
Pass 1 at 60m (the full variogram range), Pass 2 at 120m (twice the variogram range) and
Pass 3 at 210m.
Grades were only interpolated in the first two passes if at least four samples were found within
the search ellipse and a maximum of 18 samples were used to interpolate any block. The
third pass required a minimum of one sample and a maximum of 18 samples.
Mineral Resource Classification
Mineral resources were classified in accordance with definitions provided by CIM as stipulated
in NI 43-101.
The Itafós Project Mineral Resource Estimate for the Canabrava Block was classified by
MBAC as Indicated and Inferred based on the following interpolation criteria:
o Indicated: Minimum of four composites from two holes, maximum of three
per hole, 120m search radius;
o Inferred: At least one composite per block, 210m search radius.

Amazon GeoServices Ltda ABN 52 065 481 209 Mineral Resource Estimate - Arraias Phosphate Project, Para State, Brazil – MBAC Page: 95 Effective Date – 27 March 2013
6005 Australia
The resource model classification was visually examined for reasonableness by MBAC. The
classification was modified to eliminate pockets of Indicated Resources found within Inferred
zones.
Cut-off Grade
A cut-off grade of 2.8% P2O5 is used in the reporting of resource estimates as provided by
MBAC in their optimisation studies.
14.4.6 Mineral Resource Tabulation
The mineral resource estimate for the Canabrava Block of the Itafós Project deposit have
been classified as Indicated and Inferred based on the number of composite samples and the
number of drill holes used in the block estimation.
MBAC have estimated that the Canabrava Block contains 20.4 Mt of Indicated Resources
averaging 5.53% P2O5 at a 2.8% P2O5 cut-off and contains 3.7 Mt of Inferred Resources
averaging 4.94% P2O5 at a 2.8% P2O5 cut-off.
A nominal 1.53 g/cm3 has been used as a density value for all material which lies within the
Canabrava wireframe. AMS has identified that the tonnage will be slightly overestimated in
the upper portions of the mineral resource given the lack of geological control (soil vs
siltstone)
The mineral resource estimate is reported in Table 14.4_3 as of December 20, 2011 and
represented below in Table 14.4_3.
Table 14.4_2 – Canabrava Mineral Resources at a 2.8 % P2O5 Cut-off
Resource Category Density Tonnage
(Mt)
P2O5
(%)
Measured 1.53 - -
Indicated 1.53 20.4 5.53
M & I 1.53 20.4 5.53
Inferred 1.53 3.7 4.94
The Canabrava block model was validated by querying the block model results and
comparing block values versus drill hole composites on sections; this visual validation of the
block model grades by section correlated well with the drill hole data (Figure 14.4_4).
The resource classification is appropriate based on a sectional review of grades and general
distribution of drilling across the project area.
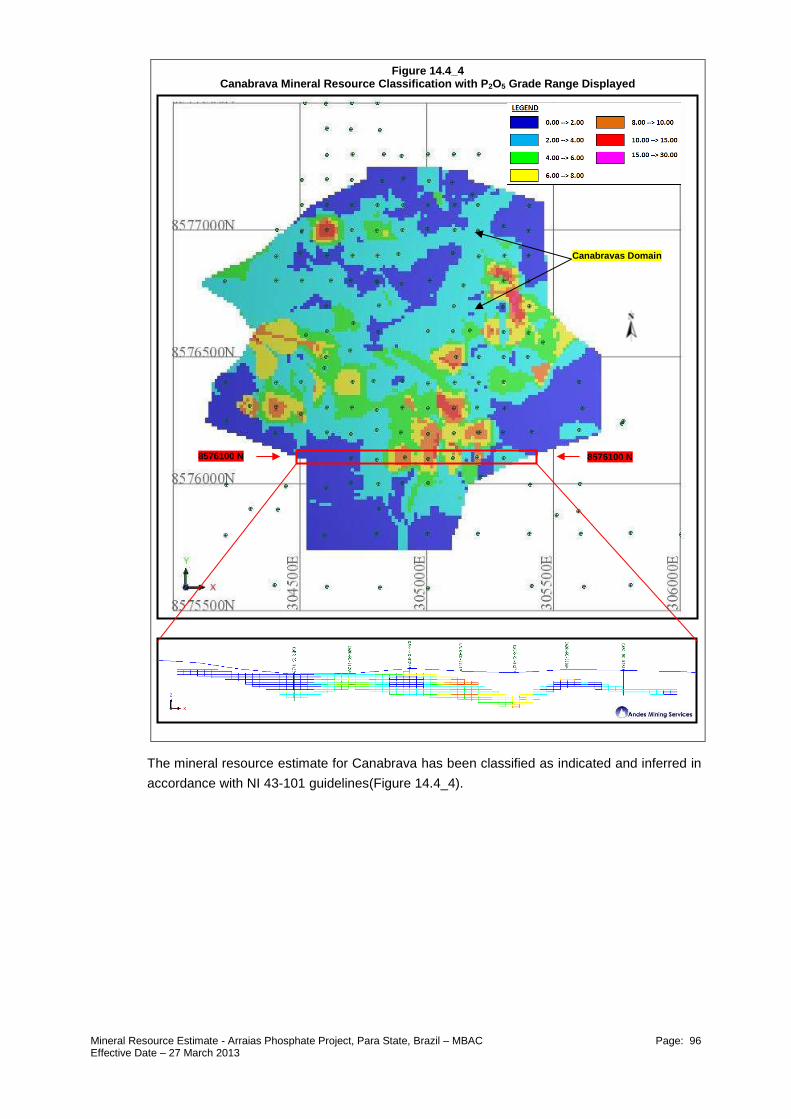
Amazon GeoServices Ltda ABN 52 065 481 209 Mineral Resource Estimate - Arraias Phosphate Project, Para State, Brazil – MBAC Page: 96 Effective Date – 27 March 2013
6005 Australia
Figure 14.4_4 Canabrava Mineral Resource Classification with P2O5 Grade Range Displayed
The mineral resource estimate for Canabrava has been classified as indicated and inferred in
accordance with NI 43-101 guidelines(Figure 14.4_4).
Canabravas Domain
8576100 N 8576100 N

Amazon GeoServices Ltda ABN 52 065 481 209 Mineral Resource Estimate - Arraias Phosphate Project, Para State, Brazil – MBAC Page: 97 Effective Date – 27 March 2013
6005 Australia
Figure 14.4_5 Plan View of Canabrava Resource Classification
14.4.7 Block Model Validation
AMS has reviewed the wireframe and block model resource estimate as presented by MBAC
and have the following recommendations in the validation process:
o Drilling and studies completed to date have defined an Indicated and Inferred
mineral resource at the Canabrava Project. The drilling data collected, is
considered to be of moderate quality and suitable for mineral resource
classification to an Indicated status within a large portion of the mineralized
domain as illustrated above in Figure 14.4_5;
o AMS identified that the geological coding originally completed by Wardrop
(2010) which included the coding of different domain types (soil and siltstone)
has not been utilised by MBAC in the updated mineral resource estimate.
There will be a significant density difference between these two domains
which will result in an over estimate of tonnage as well as grade smearing
throughout the upper portions of the block model (previously coded as soil);
o AMS recommend MBAC improve the accuracy of the geological boundaries
for the wireframe based on rock codes.
o AMS recommend that given the increased geological knowledge which has
been acquired by current open pit mining, that an updated mineral resource
estimate be completed;
100m x 100m drill spacing
across the Canabravas
Domain

Amazon GeoServices Ltda ABN 52 065 481 209 Mineral Resource Estimate - Arraias Phosphate Project, Para State, Brazil – MBAC Page: 98 Effective Date – 27 March 2013
6005 Australia
Figure 14.4_6 Canabrava Mineral Resource Classification with Drill Collar Locations

Amazon GeoServices Ltda ABN 52 065 481 209 Mineral Resource Estimate - Arraias Phosphate Project, Para State, Brazil – MBAC Page: 99 Effective Date – 27 March 2013
6005 Australia
14.5 Resource Estimates Summary
The statement has been classified by Qualified Person Bradley Ackroyd (MAIG (CP)) in
accordance with the Guidelines of National Instrument 43-101 and accompanying documents
43-101.F1 and 43-101.CP. It has an effective date of 20 December 2011. Mineral resources
that are not mineral reserves do not have demonstrated economic viability. AMS and MBAC
are not aware of any factors (environmental, permitting, legal, title, taxation, socio-economic,
marketing, political, or other relevant factors) that have materially affected the Mineral
Resource Estimate.
Table 14.5_1
Itafós Project
Measured, Indicated and Inferred Mineral Resource Grade Tonnage Report - 20 December 2011
Ordinary Kriging (OK) Block Model – 12.5mE X 12.5mN X 3mRL Target Tonnage (Mt) P2O5 %
Near Mine (Wardrop July 9, 2010) 2.8% cut off grade applied
Measured 15.2 4.38
Indicated 9.4 4.12
M&I 24.6 4.28
Inferred 3.8 3.99
Canabrava (MBAC - Nov 2011) 2.8% cut off grade applied
Measured
Indicated 20.4 5.53
M&I 20.4 5.53
Inferred 3.7 4.94
Domingos (MBAC Nov 2011) 1.5% cut off grade applied
Measured 5.6 6.04
Indicated 28.4 4.87
M&I 34.0 5.06
Inferred 5.2 2.99
TOTAL M&I 79.0 4.94
TOTAL Inferred 12.7 3.85
(2) The effective date of the Mineral Resource is December,20 2011 (2) The Mineral Resource Estimate for the Itafós Project deposit was constrained within lithological and grade based solids within the top 80m from surface. (3) Mineral Resources for the Itafós Project deposit has been classified according to the “CIM Standards on Mineral Resources and Reserves: Definitions and Guidelines (July 2011) by Bradley Ackroyd (BSc (Geo) MAIG) an independent Qualified Person as defined by National Instrument 43-101.
The Measured and Indicated mineral resource estimate comprises 79.0 Mt grading 4.94%
P2O5 (using a 1.5% cut-off for the Domingos target and a 2.8% cut-off for all other targets).

Amazon GeoServices Ltda ABN 52 065 481 209 Mineral Resource Estimate - Arraias Phosphate Project, Para State, Brazil – MBAC Page: 100 Effective Date – 27 March 2013
6005 Australia
14.6 Exploration Target - Avião, Brejo and Cabeçuda Domains
In May 2010, Wardrop completed a polygonal mineral resource estimate on three zones
outside of the Near Mine called Avião, Brejo and Cabeçuda Blocks (Figure 14.6_1).
Figure 14.6_1 Exploration Target Areas

Amazon GeoServices Ltda ABN 52 065 481 209 Mineral Resource Estimate - Arraias Phosphate Project, Para State, Brazil – MBAC Page: 101 Effective Date – 27 March 2013
6005 Australia
For the Avião, Brejo, Cabecuda Blocks, there was not sufficient drilling to develop a geological
interpretation and 3D block model. Composites were developed using two criteria:
Greater than or equal to 2.8 % P2O5;
Minimum 3m down hole length (in order to be approximately consistent with the 3m
block height used in the Block Model). For intervals less than 3m, adjacent intervals
were evaluated if they could be combined to form a 3m interval with a grade greater
than or equal to 2.8% P2O5.
Assays utilised were a combination of hand held XRF and laboratory analysis.
Wardrop prior reported an inferred mineral resource but AMS does not have sufficient
confidence to report these targets as a Mineral resource
An exploration target was generated by AGS based upon the criteria listed above. The
exploration target is summarised in the table below. It is important to point out that the
potential quantity and grade of the exploration target is conceptual in nature, and there has
been insufficient exploration to define a Mineral Resource and that it is uncertain if further
exploration will result in the determination of a Mineral Resource.
Table 14.6_1 – Exploration Target: Avião, Brejo and Cabeçuda Blocks
(modified from Wardrop, 2010)
Zone Tonnage P2O5
Mt %
Avião 0.3 to 0.7 5 to 7
Brejo 12 to 15 5 to 7
Cabeçuda 0.6 to 1 4 to 5.5
Total 14 to 16 5 to 7

Amazon GeoServices Ltda ABN 52 065 481 209 Mineral Resource Estimate - Arraias Phosphate Project, Para State, Brazil – MBAC Page: 102 Effective Date – 27 March 2013
6005 Australia
15 MINERAL RESERVE ESTIMATES
NCL was provided with three updated resource block models: Near Mine, dated July 2010
and developed by Wardrop; Cana Brava, dated December 2011 and developed internally by
Itafós personnel; and Domingos, dated December 2011 and developed by MBAC and
supervised by AMS.
Three dimensional block models were generated to enable grade estimation. The selected
block size was based on the geometry of the domain interpretation and the data configuration.
The block size of 12.5mE x 12.5mN x 3.0mRL was selected. The “percent” block modelling
technique was used to represent the volume of the interpreted wireframe models. Sufficient
variables were included in the block models construction to enable grade estimation and
reporting.
Resource estimation for the Near Mine deposit was undertaken using Ordinary Kriging (OK)
as the principal estimation methodology for P2O5. The estimation for Cana Brava and
Domingos was undertaken using the Inverse Distance methodology. The OK and the Inverse
Distance estimates were completed using Gems mining software.
The following corresponds to the list of variables contained in the received block model data:
Lithology code
Bulk density assigned by lithology type constant values (t/m3)
%P2O5
%Al2O3
%SiO2
A class code to distinguish measured, indicated, and inferred resource blocks.
Itafós personnel provided the initial topography and added by NCL to the model.
NCL did not audit the sampling data or the block model used for this project.
It is becoming common in the industry to develop resource models (particularly where
nonlinear estimation techniques are applied), which essentially take into account potential
dilution within the blocks, or adopt selective mining unit (SMU) as part of the resource
modelling process. NCL did not manipulate the provided block models as estimated to be
already diluted.
Block models included resources classified as measured, indicated and inferred. Contained
measured resources are transferred to proven reserves and contained indicated resources
are transferred to probable reserves. Inferred mineral resources are not converted to reserves
and are instead treated as waste for mine planning purposes.

Amazon GeoServices Ltda ABN 52 065 481 209 Mineral Resource Estimate - Arraias Phosphate Project, Para State, Brazil – MBAC Page: 103 Effective Date – 27 March 2013
6005 Australia
It is the opinion of NCL that the mine production schedule defines the mineral reserve for a
mining project. Table 15_1 reports the mineral reserve of the Itafós Project based on the
production schedule used for this study.
Table 15_1 – Total Mining Reserve Summary (1)(2)
Ore Source Ktonnes P2O5 (%)
Proven Reserve 15,954 5.09
Probable Reserve 48,857 5.07
Total Reserve 64,811 5.07
Total Material 253,017 Strip ratio 2.90
(1) The Mineral Reserves as set out in the table above have been estimated by Carlos Guzmán of NCL Brasil
Ltda, who is a Qualified Person under NI 43-101 and Member of the AusIMM.
(2) Numbers may not add up due to rounding.
The reserve estimate has been based upon economic parameters, geotechnical design
criteria and metallurgical recovery assumptions detailed in the sections above. Changes in
these assumptions will impact the reserve estimate. In general, increases in operating costs,
reductions in revenue assumptions or reductions in metallurgical recovery may result in
increased cutoff grades, reductions in reserves and increasing strip ratios. The converse is
also true. Reductions in operating costs, increases in revenue assumptions or increases in
metallurgical recovery may result in reduced cut-off grades and increases in reserves.

Amazon GeoServices Ltda ABN 52 065 481 209 Mineral Resource Estimate - Arraias Phosphate Project, Para State, Brazil – MBAC Page: 104 Effective Date – 27 March 2013
6005 Australia
16 MINING METHODS
16.1 Pit and Mining phase Design
16.1.1 Final Pit Design
The final pit design was based on the economic shells generated at a revenue factor equal to
1.0 and minimum cut-off grades of 1.8% P2O5 for Domingos and 2.8%P2O5 for Cana Brava
and Near Mine. A constant 49.0° inter ramp angle. Table 16.1_1 shows the key open pit
design parameters.
Table 16.1_1 – Open Pit Design Parameters
Bench Height 6 m (two stacked 3m benches)
Berm Width 3 m
Batter Angle 82.0°
Inter-ramp Angle 49.0°
Ramp Width 15 m
Ramp Gradient 10%
Geotechnical information is not available, but mining activity is already developed in the area
which supports the adopted parameters shown in Table 16.1.1 for the current stage of the
Project. During the previous stage of the project, several optimizations runs were performed
for different slope angles and results indicated variations smaller than 5% on ore and waste.
The ramps width of 15 meters can accommodate up to 50 tonne trucks. NCL used the 10%
road gradient, which is common in the industry for this type of trucks.
The current mine plan is designed with 3m benches stacked to 6 meters (i.e. two stacked
benches).
For the required mining rate the appropriate loading equipment is medium size front end
loaders or hydraulic excavators, ranging between 3.5 m3 to 4.3m3 capacities. The minimum
operating widths to achieve the required productivities with this equipment is about 25m.
Figure 16.1_1 shows the final pit design which is a result of different pits for the seven sectors
(five in Near Mine, Domingos and Cana Brava), designed according to the obtained pit shell of
the optimization process. The pit exits were orientated to the selected position of the
processing plant. The total area disturbed by the pits is about 670 hectares

Amazon GeoServices Ltda ABN 52 065 481 209 Mineral Resource Estimate - Arraias Phosphate Project, Para State, Brazil – MBAC Page: 105 Effective Date – 27 March 2013
6005 Australia
Figure 16.1_1 – Plan view – General Layout

Amazon GeoServices Ltda ABN 52 065 481 209 Mineral Resource Estimate - Arraias Phosphate Project, Para State, Brazil – MBAC Page: 106 Effective Date – 27 March 2013
6005 Australia
16.1.2 Tabulation of Pit Contained Resources
Table 16.1_2 summarizes the pit contained resources for the final design pit at several
different P2O5 cut-off grades.
Table 16.1_2 – Resources Contained in Final Pit at Various Cut-off Grades by Sector
Sector Total Ore Waste TOTAL
Cut-Off (%P2O5)
Kton %
P205 Kton Kton
Strip Ratio
TOTAL 61,252 5.3 191,765 253,017 3.1
WASTE 191,765
>COG 61,252 5.3
DOMINGOS 28,140 5.6 69,219 97,359 2.5
WASTE 69,219
1.8%-2.2% 1,709 2
2.2%-2.6% 2,052 2.4
2.6%-3.0% 2,083 2.8
>3.0% 22,297 6.4
CANA BRAVA
18,063 5.2 59,803 77,866 3.3
WASTE 59,803
2.8%-3.0% 1,343 2.9
3.0%-3.2% 1,380 3.1
>3;2% 15,340 5.6
NEAR MINE 15,049 4.7 62,743 77,792 4.2
WASTE 62,743
2.8%-3.0% 1,296 2.9
3.0%-3.2% 1,245 3.1
>3;2% 12,508 5.1
16.2 Mine Production Schedule
A mine production schedule was developed to show the ore tonnes, grades, total material and
waste material by year throughout of the life of the mine. The distribution of ore and waste
contained in each of the mining sectors was used to develop the schedule, assuring that
criteria such as continuous ore exposure, mining accessibility, and consistent material
movements were met.
16.2.1 Strip Mining Design
The pushbacks designs were defined using the concept of strip mining geometry, considering
widths of 100m to 200m, lengths between 700m to 1000m and variable depths according to
the ore body geometry and top waste layer.
The concept is to backfill with the waste of the current strip the one mined immediately before,
minimizing the hauling distances for the waste and permanent reclamation of the mined
areas.

Amazon GeoServices Ltda ABN 52 065 481 209 Mineral Resource Estimate - Arraias Phosphate Project, Para State, Brazil – MBAC Page: 107 Effective Date – 27 March 2013
6005 Australia
Figure 116.2_1 – Conceptual Design for Strip Mining
Figure 116.2_2 – Conceptual Sequence for Strip Mining
16.2.2 Mine Scheduling Methodology
NCL used an in-house developed system to evaluate several potential production mine
schedules. Required annual ore tonnes and user specified annual total material movements
are provided to the algorithm, which then calculates the mine schedule. Several runs at
various proposed total material movement schedules were done to determine a good
production schedule strategy. It is important to note that this program is not a simulation
package, but a tool for calculation of the mine schedule and haulage profiles for a given set of
phases and constraints that must be set by the user.
The mine plan developed by NCL does not include any special provisions for dilution because
the resource block models are considered as already diluted.
Nevertheless, careful grade control must be carried out during mining to minimize misplaced
ore due to the important effect of head grade on phosphate concentrate production. These
efforts should include the following standard procedures:
Implement an intense and systematic program of sampling, mapping, laboratory
analyses, and reporting.
Utilize specialized in-pit bench sampling drills for sampling well ahead of production.

Amazon GeoServices Ltda ABN 52 065 481 209 Mineral Resource Estimate - Arraias Phosphate Project, Para State, Brazil – MBAC Page: 108 Effective Date – 27 March 2013
6005 Australia
Use of excavators and benches no higher than 3 m (as presently planned) to
selectively mine ore zones.
Maintain top laboratory staff, equipment, and procedures to provide accurate and
timely assay reporting.
Utilize trained geologists and technicians to work with excavator operators in
identifying, marking, and selectively mining and dispatching ore and waste.
16.2.3 Mine Schedule
According to initial estimates for processing costs, metallurgical recovery and long term price
for obtained products, as detailed in Table 4.1_1, the marginal cut-off which defines the
separation between ore and waste is calculated as 0.7% P2O5. As the metallurgical testwork
had been carried out for material of higher grades, a value of 2.8% P2O5 was selected as the
cut-off for Cana Brava and Near Mine; and a 1.8% P2O5 for Domingos.
Table 16.2_1 shows the mine production of ore for each mining year. The schedule is based
on 3.9M tonnes per year to the processing plant and a production of 330 K tonnes of
phosphate concentrate at 28%P2O5. The table also shows the total material movement from
the mine by year, which peaks at 19.0 M tonnes per year during commercial production.
The mined waste considers several destinations for the material, to the closest possible
location outside of the pits and also to abandon areas within the pits, as a way to have lower
hauling distances, using the strip mining concept.
The preproduction period requires the mining of 1.1M tonnes of total material to expose
sufficient ore to make it a reliable ore source for the start of commercial production in Year 1.
The preproduction period will require approximately 6 months. The ore mined during
preproduction will be stockpiled in the ROM-pad area near the primary crusher and then
rehandled to make up part of the plant feed during commercial production.
The mining sequence was established in order to obtain the highest grade material at the
beginning and postpone those sectors with lower grades and high strip ratios. The general
adopted mining sequence was as follows:
a) Initiate in Domingos, area with highest grades and lowest strip ratio. Close to the plant
site (shorter hauling distances)
b) Continue with Cana Brava, which has grades similar to Domingos, but at a significant
higher distance from the plant (13km).
c) Finally, Near Mine, which contains the lowest grades. Mining at Near Mine begins in
Year 13.
Table 16.2_1 through Table 16.2_4 show the total mine schedule and divided by area
(Domingo, Cana Brava and Near Mine), considering a monthly basis from Pre-stripping to
Year 2 and yearly from Year 3.

Amazon GeoServices Ltda ABN 52 065 481 209 Mineral Resource Estimate - Arraias Phosphate Project, Para State, Brazil – MBAC Page: 109 Effective Date – 27 March 2013
6005 Australia
Table 116.2_1 – Mine Production Schedule
Period Total Ore Waste Total
Kt % P2o5 Kt Kt
apr-12 0 68 68
may-12 0 131 131
jun-12 0 203 203
jul-12 0 261 261
aug-12 0 254 254
sep-12 0 219 219
oct-12 36 10.15 171 207
nov-12 75 9.74 107 182
dec-12 119 9.15 66 185
ene-13 186 7.82 385 570
feb-13 247 5.89 473 720
mar-13 228 6.37 563 791
abr-13 266 5.46 674 940
apr-13 315 4.61 874 1,189
may-13 273 5.33 821 1,093
jun-13 247 5.88 887 1,134
jul-13 253 5.75 883 1,136
aug-13 255 5.7 841 1,096
sep-13 253 5.74 766 1,019
oct-13 238 6.1 519 757
nov-13 250 5.81 316 567
dec-13 236 6.15 329 565
feb-14 243 5.98 472 716
mar-14 250 5.8 528 778
apr-14 268 5.42 719 987
may-14 240 6.05 891 1,131
jun-14 272 5.35 822 1,093
jul-14 287 5.07 845 1,132
aug-14 247 5.9 898 1,145
sep-14 245 5.93 836 1,081
oct-14 259 5.62 764 1,023
nov-14 236 6.17 531 766
dec-14 243 5.99 332 576
2015 3,016 5.78 7,982 10,998
2016 3,016 5.78 7,982 10,997
2017 3,016 5.78 7,915 10,931
2018 3,013 5.79 8,056 11,070
2019 3,012 5.79 7,938 10,950
2020 3,015 5.78 8,056 11,071
2021 3,729 4.67 15,157 18,887
2022 3,720 4.7 15,333 19,052
2023 3,765 4.63 15,227 18,992
2024 3,734 4.67 15,280 19,014
2025 3,804 4.59 14,235 18,039
2026 3,772 4.62 14,193 17,965
2027 3,736 4.67 14,203 17,940
2028 3,788 4.63 8,769 12,557
2029 3,838 4.54 5,211 9,050
2030 3,760 4.64 4,731 8,491
2031 2,812 4.54 489 3,301
Total 64,811 5.07 188,207 253,017

Amazon GeoServices Ltda ABN 52 065 481 209 Mineral Resource Estimate - Arraias Phosphate Project, Para State, Brazil – MBAC Page: 110 Effective Date – 27 March 2013
6005 Australia
Table 116.2_2 – Mine Production Schedule – Domingos
Period Total Ore Waste Total
Kt % P2o5 Kt Kt
apr-12 0.3 3.794 68.3 68.6
may-12 0.4 3.794 130.9 131.3
jun-12 0.5 3.794 202.7 203.2
jul-12 1.6 4.943 260.9 262.5
aug-12 8.8 5.38 253.7 262.5
sep-12 35.2 9.281 218.8 254
oct-12 64.9 10.153 171.4 236.3
nov-12 70.9 9.782 106.9 177.8
dec-12 65.5 9.29 65.8 131.3
ene-13 181.6 7.798 384.6 566.2
feb-13 243.1 5.84 472.9 716
mar-13 229.9 6.374 562.8 792.7
abr-13 312.6 5.465 673.7 986.3
apr-13 258.3 4.283 874.1 1,132
may-13 275.1 5.33 820.8 1,096
jun-13 245.5 5.882 886.9 1,132
jul-13 249.8 5.745 882.6 1,132
aug-13 254.5 5.698 841.4 1,096
sep-13 253.1 5.74 766.1 1,019
oct-13 248.4 6.097 518.7 767.1
nov-13 249.7 5.805 316.5 566.2
dec-13 237.3 6.153 328.9 566.2
feb-14 243.5 5.976 472.5 716
mar-14 265 5.802 527.7 792.7
apr-14 267.1 5.422 719.2 986.3
may-14 241.2 6.046 891.2 1,132
jun-14 274 5.351 821.9 1,096
jul-14 286.9 5.067 845.5 1,132
aug-14 234.2 5.9 898.2 1,132
sep-14 259.9 5.926 836 1,096
oct-14 255.1 5.613 764.1 1,019
nov-14 236.5 6.168 530.6 767.1
dec-14 234 5.993 332.2 566.2
2015 3,018 5.781 7,982 11,000
2016 3,018 5.781 7,982 11,000
2017 3,085 5.781 7,915 11,000
2018 2,944 5.785 8,057 11,000
2019 3,062 5.788 7,938 11,000
2020 2,854 5.855 6,385 9,239
2021 2,382 4.591 6,634 9,016
2022 191.3 5.135 178.8 370.1
Total 26,838 5.7 70,521 97,359

Amazon GeoServices Ltda ABN 52 065 481 209 Mineral Resource Estimate - Arraias Phosphate Project, Para State, Brazil – MBAC Page: 111 Effective Date – 27 March 2013
6005 Australia
Table 116.2_3 – Mine Production Schedule – Cana Brava
Period Total Ore Waste Total
Kt % P2o5 Kt Kt
2020 90 3.5 1,671 1,761
2021 1,461 4.81 8,523 9,984
2022 3,476 4.67 15,154 18,630
2023 3,773 4.63 15,227 19,000
2024 3,444 4.72 8,206 11,650
2025 3,717 4.61 6,083 9,800
2026 2,846 5.08 1,336 4,182
2027 2,031 5.37 829 2,860
Total 20,837 4.79 57,029 77,866
Table 116.2_4 – Mine Production Schedule – Near Mine
Period Total Ore Waste Total
Kt % P2o5 Kt Kt
2024 276 4.03 7,074 7,350
2025 48 2.9 8,152 8,200
2026 961 3.26 12,857 13,818
2027 1,766 3.86 13,374 15,140
2028 3,731 4.63 8,769 12,500
2029 3,789 4.54 5,211 9,000
2030 3,769 4.64 4,731 8,500
2031 2,795 4.54 489 3,284
Total 17,135 4.42 60,657 77,793
Figure 16.2_3 and Figure 16.2_4 show the situation of the mine at the end of several periods.
Figure 116.2_1 – End of Periods – Domingos – Pre-Stripping through Year 2

Amazon GeoServices Ltda ABN 52 065 481 209 Mineral Resource Estimate - Arraias Phosphate Project, Para State, Brazil – MBAC Page: 112 Effective Date – 27 March 2013
6005 Australia
Figure 116.2_2 – End of Periods – Domingos –Year 3 through Year 11
The plant feed is close to 3.66 M tonnes per year to produce constantly 330 K tonnes of
concentrate (see Table 16.2.5.)
Table 116.2_5 – Plant Feed Schedule
Period
Crusher Stock
Processed In Out
kt %P2O5 Conc (Kt) kt %P2O5 Conc (Kt) kt %P2O5 Conc (Kt)
2012 230 9.52 41 76 9.01 13 57 8.98 10
2013 3,011 5.79 330 61 5.62 6 70 6.42 9
2014 3,027 5.77 330 36 5.84 4 26 5.89 3
2015 3,016 5.80 330 2 5.80 0 0 0.00 0
2016 3,016 5.80 330 3 5.80 0 0 0.00 0
2017 3,016 5.80 330 69 5.80 8 0 0.00 0
2018 3,013 5.80 330 0 0.00 0 70 5.81 8
2019 3,012 5.80 330 50 5.80 6 0 0.00 0
2020 3,015 5.80 330 0 0.00 0 71 5.79 8
2021 3,729 4.70 330 113 4.70 10 0 0.00 0
2022 3,720 4.70 331 0 0.00 0 52 4.70 5
2023 3,765 4.60 330 8 4.60 1 0 0.00 0
2024 3,734 4.70 330 0 0.00 0 14 4.69 1
2025 3,804 4.60 330 0 0.00 0 39 4.69 4
2026 3,772 4.60 330 35 4.60 3 0 0.00 0
2027 3,736 4.70 330 60 4.70 5 0 0.00 0
2028 3,788 4.60 332 0 0.00 0 57 4.66 5
2029 3,839 4.50 330 0 0.00 0 50 4.66 4

Amazon GeoServices Ltda ABN 52 065 481 209 Mineral Resource Estimate - Arraias Phosphate Project, Para State, Brazil – MBAC Page: 113 Effective Date – 27 March 2013
6005 Australia
Table 116.2_5 – Plant Feed Schedule
Period
Crusher Stock
Processed In Out
kt %P2O5 Conc (Kt) kt %P2O5 Conc (Kt) kt %P2O5 Conc (Kt)
2030 3,760 4.60 330 9 4.60 1 0 0.00 0
2031 2,812 4.50 241 0 0.00 0 17 5.22 1
TOTAL 64,815 5.07 6,225 523 5.76 57 523 5.76 57
16.2.4 Waste Storage Facilities
The proposed mining method considers the backfilling of the previously mined strips. This
concept can be theoretically applied for all of the mine life, except at the beginning of each
sector. Five waste storage facilities were designed, one for Domingos, one for Cana Brava
and three in Near Mine.
Table 16.2_6 shows the parameters used for the designs of the five waste dumps.
Table 116.2_6 – Geomechanichal parameters for waste Dump design
Bench height: 3 meters
Berm Width: 6 meters, every 4 benches
Batter Angle: 37°
Global Angle: 28.7°
Figure 116.2_3 – Waste Storage Facility - Domingos

Amazon GeoServices Ltda ABN 52 065 481 209 Mineral Resource Estimate - Arraias Phosphate Project, Para State, Brazil – MBAC Page: 114 Effective Date – 27 March 2013
6005 Australia
Figure 116.2_4 – Waste Storage Facility – Near Mine
Figure 116.2_5 – Waste Storage Facility – Cana Brava
16.3 Equipment Requirement
Mine equipment requirements were calculated based on the annual mine production
schedule, the mine work schedule, and equipment annual production capacity estimates.
The study is based on operating the Itafós Project mine with excavators of 3.5m3 capacities
for ore and excavators of 4.3m3 for waste. Trucks with a nominal capacity of 39 tonnes and
effective capacity of 27 tonnes were considered, for both, ore and waste. The difference in
capacity between nominal and effective is due to the low density of the material.
This type of equipment is able to develop the require productivity to achieve a maximum
annual total material movement of 20M tonnes from different pits; and also to have good
mining selectivity with the excavators as defined by the grade control activities. The
advantage of the smaller equipment is that it is produced in Brazil and does not have the large
transportation costs and import duties associated with large equipment and large equipment
parts. This aspect, combined with availability of spare parts and low local labour rates make
this equipment an attractive alternative to traditional larger open pit mining equipment.

Amazon GeoServices Ltda ABN 52 065 481 209 Mineral Resource Estimate - Arraias Phosphate Project, Para State, Brazil – MBAC Page: 115 Effective Date – 27 March 2013
6005 Australia
This fleet will be complemented with drilling rigs capable to drill 4½” diameter blast holes for,
as 10% of material is defined as hard rock.
Auxiliary equipment includes track dozers, wheel dozers, motor graders and water truck.
Additionally a reverse circulation drill rig is included for grade control purposes.
Table 16.3 provides a summary of the peak number of units required for preproduction and
commercial production. This represents the equipment necessary to perform the following
duties:
1. Construct roads to the initial mining areas as well as to the crusher, waste storage
areas. Construct additional roads as needed to support mining activity.
2. The preproduction development required to expose ore for initial production.
3. Mine and transport ore to the primary crusher area. Mine and transport waste material
from the pit to the appropriate storage areas.
4. Maintain all the mine work areas, in-pit haul roads, and external haul roads. Also
maintain the waste storage areas.
5. Rehandle the ore (load, transport and auxiliary equipment) from the ROM-pad to feed
the primary crusher.
6. Topsoil striping and disposal.
Table 16.3_1 – Initial and Maximum Equipment Fleet Requirement
Equipment Type Stripping Production
(MAX)
Atlas Copco Explorac R50 Drill Control 1 1
Liebherr 964 Shovel (3.5m3) 1 5
Liebherr 954 Shovel (4.3m3) 0 2
Scania Trucks (39t) 5 56
CATD8T Dozer 2 2
CAT140M Motor Grader 1 1
Scania Water Truck(20m³) 2 2
16.3.1 Drilling and Blasting Requirement
According to the geotechnical characteristics of the rock, was estimated that only 10% of the
material will require drill and blast. An allowance had made for the cost, considering US$2.0/t,
as part of the general mining cost.
Amazon GeoServices Ltda ABN 52 065 481 209 Mineral Resource Estimate - Arraias Phosphate Project, Para State, Brazil – MBAC Page: 116 Effective Date – 27 March 2013
6005 Australia
16.3.2 Loading and Hauling Requirement
The study is based on operating the Itafós Project mine with excavators of 3.5m3 capacities
for ore, operating in three meters benches. Excavators of 4.3m3 were considered for the
waste, operating in double benches (6m height).
The mine schedule allows the operation simultaneously in different faces, in order to achieve
the required total mining rate.
The loaded materials at the mine will be hauled to the different destinations by 39 tonnes
trucks: primary crusher, waste storage facilities and low-grade stockpile.
The general criteria used for designing the haul roads were the following:
Maximum gradient of 10%
Width of 15m.
Berms of 1.5m high and 1.0m wide
Maximum truck speed of 5km/hr
Clearance turning radius of 20m.
The effective capacity of the trucks corresponds to the number of passes, times the mass of
each pass. The number of passes is calculated as the rounded value of the minimum between
the limit of the volumetric capacity and the weight capacity limit. As an example, for the ore
loaded by the 3.5m3 excavator, the volumetric limit corresponds to 4.7 passes and the mass
limit to 7.4 passes. Therefore, the number of passes is 5 (4.7 rounded up to 5) and the
effective truck capacity is 26.1 tonnes.
16.3.3 Auxiliary and Support Equipment
Major auxiliary equipment refers to the major mine equipment that is not directly responsible
for production, but which is scheduled on a regular basis. Equipment operating requirements,
operating hours and personnel requirements were estimated for this equipment.
The primary function of the auxiliary equipment is to support the major production units, and
provide safe and clean working areas. Equipment types included in the auxiliary mine fleet
are:
Caterpillar D8T Track dozer
Caterpillar 140M Motor Grader
Scania Water Truck (20000 liter)
Atlas Copco Explorac 50 (RC Drill Rig)

Amazon GeoServices Ltda ABN 52 065 481 209 Mineral Resource Estimate - Arraias Phosphate Project, Para State, Brazil – MBAC Page: 117 Effective Date – 27 March 2013
6005 Australia
The primary duties assigned to the auxiliary equipment are as follows:
Mine development including access roads, drop cuts, temporary service ramps, safety
berms, etc.
Waste rock storage area control. This includes maintaining access to the dumping
and stockpile areas and maintaining the travel surfaces.
Ore stockpile storage area control. This includes maintaining access to the dumping
and stockpile areas and maintaining the travel surfaces.
Maintenance and cleanup in the mine and waste storage areas.
Drilling for grade control purposes, developed in advance in relation with production
drilling.
Additional equipment to support mining activities was estimated:
Flatbed Truck
Mechanics Truck (4x4)
Scania Fuel Truck (12000 litre)
Backhoe Loader (1 cu m)
Pickup Truck (4x4)
Light Plants

Amazon GeoServices Ltda ABN 52 065 481 209 Mineral Resource Estimate - Arraias Phosphate Project, Para State, Brazil – MBAC Page: 118 Effective Date – 27 March 2013
6005 Australia
17 RECOVERY METHODS
17.1 Beneficiation plant and drying
The mineral processing plant was designed based on the metallurgical test work completed
and consider the following main design parameters:
An ore with a feed grade of 5.32 % P2O5;
Production of 330,000 t/year of concentrate assaying 28% P2O5 with a metallurgical
recovery of 54% from the column flotation of the conventional and produced slimes
fractions;
Production of 94,000 t/year of concentrate assaying 15% P2O5 with a metallurgical
recovery of 8.4% from the column flotation of the natural slimes; and
Total availability of 89%.
The plant has been designed to treat 3.5 million tonnes/year of ROM, considering the
parameters above. The samples tested in the pilot plant had grades varying from 4.4 to 6.3%
P2O5 and the average mass and P2O5 partition obtained in the steps of the process was
used to calculate the material balance.
The process adopted consists of the following steps, as shown in the figure below:
Primary crushing of the ROM material;
Grinding of the coarse fractions in a SAG mill; and
Classification of the ore into three size fraction streams to produce the materials
denominated as natural slimes, produced slimes and conventional.

Amazon GeoServices Ltda ABN 52 065 481 209 Mineral Resource Estimate - Arraias Phosphate Project, Para State, Brazil – MBAC Page: 119 Effective Date – 27 March 2013
6005 Australia
Each one of these size fractions is floated in columns to produce the three concentrates.
Natural slimes concentrate with a grade of 15% will be dewatered in a thickener and a press
filter. The cake will be dried in rotary drier and sent for shipment.
Produced slimes concentrate will be thickened in a pond and the underflow will be pumped to
the acidulation plant.
Conventional concentrate will be reground to 95% passing 44 microns to improve reactivity,
submitted to magnetic separation to reduce iron content and then will be dewatered in a
thickener and a press filter. The cake will be stock piled and reclaimed to the acidulation plant
where it will be combined with the slimes concentrate produced.
All the tailings are combined and sent to the tailings dam by gravity. The crushing plant was
designed to avoid dry operations as much as possible in order to maximize plant availability,
due to the sticky characteristics of the Arraias Tocantins ore. Therefore, it was decided to use
only one crushing stage followed by a SAG milling circuit to avoid clogging conveyor belts and
screens which can occur when secondary and tertiary crushing stages are utilized.
Pilot plant results showed that column flotation presented a better performance than
mechanical cells. For this reason column cells were selected as the flotation equipment.

Amazon GeoServices Ltda ABN 52 065 481 209 Mineral Resource Estimate - Arraias Phosphate Project, Para State, Brazil – MBAC Page: 120 Effective Date – 27 March 2013
6005 Australia
The major equipment items including the crusher, SAG mill, thickeners and filters were sized
based upon specific laboratory test results conducted on samples of the ore, mill feed and
concentrates.
17.2 Sub processes Description
17.2.1 Crushing
ROM ore is discharged directly into a 160 m3 feed bin prior to screening or is alternatively
stockpiled on the ROM pad for reclamation at a later time using a FEL (front end loader). The
screen feed bin is fitted with a 500 mm aperture fixed grizzly. The grizzly undersize material
reports to the screen feed bin which is then directed to an apron feeder whilst a mobile rock
breaker is used to break down grizzly oversize material to below 600 mm in size. If the
quantity of the oversize rock in the ROM ore is high then the FEL relocates this oversize
material to an oversize rock stockpile for treatment at a later time.
17.2.2 Grinding/Classification/Desliming
The apron feeder product discharges to a 150 mm opening vibrating grizzly screen feeder.
The grizzly oversize material is then directed to an “MMD type” sizer, which is a patented rolls
type crusher. The grizzly undersize product and the product from the crusher are then
combined on a single conveyor and delivered by belt conveyor to two homogenization
stockpiles of approximately 23.333 m3 capacity each. This provides 8 days of available feed
to the primary grinding mill. The stockpiles feed will be made by stacker in the first year of
operation and It will be used a reclaimer after that.
A FEL will be used to reclaim the ore from the homogenization stockpiles in the first year in
operation. The reclaimed material will be directed to a bin and then to a belt conveyor fitted
with a weightometer device which records the throughput rate of the primary grinding mill.
The homogenization stockpile material is then conveyed and discharged onto a three deck
vibrating screen. The bottom deck undersize material of less than 6.35 mm (<¼”) is then
directed to an attrition scrubber fitted with two agitators. The attrition scrubber product
overflows by gravity into a slurry hopper. The slurry from the hopper is then pumped to a pre-
classification hydro-cyclone cluster of 15” diameter hydro-cyclones. A belt conveyor receives
the combined +6.35 mm (>¼”) material from the three screen decks and is directed to a low
aspect SAG mill. The SAG mill discharge material is then screened using a screening trommel
with oversize material (> ¼”) reporting back to SAG mill feed conveyor via two separate
conveyors. The trommel undersize material reports through to the SAG mill discharge hopper.
The material is then pumped to the classification hydro-cyclone cluster consisting of 15”
diameter hydro-cyclones.
The overflow from the pre-classification hydro-cyclone cluster is discharged via gravity into
another slurry hopper and is then pumped to a bank of natural slimes dewatering hydro-
cyclones. The underflow from the pre-classification hydro-cyclone cluster is then discharged
via gravity into the SAG mill discharge hopper where it is combined with SAG mill discharge
trammel undersize product. It is then combined with additional process water and pumped to
the grinding circuit classification hydro-cyclones which also consist of 15” diameter hydro-
cyclones.

Amazon GeoServices Ltda ABN 52 065 481 209 Mineral Resource Estimate - Arraias Phosphate Project, Para State, Brazil – MBAC Page: 121 Effective Date – 27 March 2013
6005 Australia
The overflow from the natural fines dewatering hydro-cyclones cluster returns to the attrition
scrubber slurry hopper as additional hopper process make-up water whilst the dewatering
cyclones underflow is directed to the natural slimes flotation circuit conditioning tank.
The overflow material from the grinding circuit classification hydro-cyclones is then directed to
another slurry hopper and then pumped to a bank of de-sliming hydro-cyclones, whilst the
grinding circuit classification hydro-cyclone underflow material returns by gravity to the feed of
the SAG mill and joins the mill re-circulating load.
The underflow from the de-sliming hydro-cyclones is then directed to a conventional flotation
circuit employing roughing and cleaning flotation whilst the overflow is collected in another
hopper and pumped to another set of dewatering hydro-cyclones. The overflow from the
dewatering hydro-cyclones cluster returns to the de-sliming hydro-cyclones cluster feed
hopper and the underflow from the dewatering cyclones is then directed to a conditioning tank
prior to flotation. The circuit is then described as produced slimes flotation circuit consisting of
roughing and scavenging.
17.3 Flotation
17.3.1 Conventional Flotation
The underflow from the de-sliming hydro-cyclones cluster flows by gravity directly to 2 flotation
conditioning tanks in series fitted with mechanical agitators. Slurry flows by gravity from one
conditioning tank to the next. Slurry from the 2nd conditioning tank overflows into a slurry
hopper and is pumped to 2 conventional rougher flotation column cells in series.
The rougher flotation concentrate from both column cells flows by gravity to a slurry hopper
and it is pumped to 2 conventional cleaner flotation columns in series while the rougher
flotation tailings is discharged into a slurry hopper and is pumped to the tailings dam and
sampled for process control purposes.
The concentrate from the conventional cleaner flotation columns flows by gravity to a slurry
hopper and is then pumped to the regrind classification hydro-cyclones cluster. The cleaner
flotation tailings are directed back to the slurry hopper that feeds rougher flotation columns as
a circulating load.
17.3.2 Produced slimes Flotation
The underflow from the produced slimes dewatering hydro-cyclones cluster flows by gravity
directly to the 2 conditioning tanks in series, each tank fitted with a mechanical agitator. Slurry
flows from one conditioning tank to the next after being conditioned with reagents. Slurry
overflowing from the second conditioning tank flows by gravity to a slurry hopper and then
pumped to a single fine product rougher flotation column.
The concentrate from the produced slimes rougher flotation column is then directed to the
concentrate slime produced pond.
The tailings from the produced slimes rougher flotation column then flows by gravity to a
conditioning tank fitted with a mechanical agitator where further reagents are introduced. The
conditioning tank product is then pumped at the fine products scavenger flotation column.
Amazon GeoServices Ltda ABN 52 065 481 209 Mineral Resource Estimate - Arraias Phosphate Project, Para State, Brazil – MBAC Page: 122 Effective Date – 27 March 2013
6005 Australia
The concentrate from the produced slimes scavenger flotation column then combined with the
produced slimes rougher flotation concentrate and flows concentrate slime produced pond.
The tailings from the scavenger flotation column are then sampled and pumped to the tailings
dam.
17.3.3 Natural slimes Flotation
The underflow from the dewatering hydro-cyclones cluster reports to 2 conditioning tanks in
series fitted with mechanical agitators. Slurry overflows from the 1st first conditioning tank to
the 2nd conditioning tank. Slurry from the 2nd conditioning tank overflows and flows by gravity
to a slurry hopper and pumped to the natural fines rougher flotation columns. Two rougher
flotation columns are fitted in series.
The concentrate from the natural slimes rougher flotation columns flows by gravity to the
natural slimes thickener whilst the tailings from the natural slimes rougher flotation column
reports to a slurry hopper via gravity and is then pumped to the tailings dam after being
sampled.
17.3.4 Regrind and Magnetic Separation
The conventional cleaner flotation concentrate will be directed to regrind mill. It will combine
with the regrind mill discharge in the to the regrind mill discharge hopper. This combined
slurry is then pumped to the regrind mill classification hydro-cyclone. The cyclone underflow
flows by gravity to the regrind mill which closes the circuit. The regrind mill hydro-cyclone
overflow will be directed to a slurry tank and will be pumped to the magnetic separation circuit.
The magnet material from the roll magnetic separator reports via gravity to the tailings dam.
The non-magnetic material then flows to a slurry tank via gravity and is then pumped to the
main concentrate thickener.
17.3.5 Thickening and Filtration
The overflow water from the natural fines thickener flows by gravity to the tank and is then
pumped to the process water system tank. The underflow from the natural fines thickener is
then pumped to a conditioning tank fitted with a mechanical agitator and then pumped through
a conventional press filter. The filtrate water combines with the thickener overflow water from
the natural fines thickener. Two belt conveyors in series transfer the moist cake to the dryer
chute.
The overflow from the main concentrate thickener flows by gravity to a tank and is combined
with the natural fines thickener overflow and filtrate water. Filtrate water from the main
concentrate filter system is then combined into a single tank and pumped to the process water
system tank. The main thickener underflow is pumped to a conditioning tank fitted with a
mechanical agitator and then pumped to a conventional press filter. Three belt conveyors in
series deliver the filter cake to the phosphate rock concentrate stockpile.
A FEL reclaims material from the phosphate rock concentrate stockpile onto to belt conveyor,
which then feeds to a conditioning tank fitted with a mechanical agitator which also receive the
fines from the concentrate produced slime pond, achieving 70% wt. The phosphate rock
concentrate is then pumped from the conditioning tank to the acidulation section of the plant.

Amazon GeoServices Ltda ABN 52 065 481 209 Mineral Resource Estimate - Arraias Phosphate Project, Para State, Brazil – MBAC Page: 123 Effective Date – 27 March 2013
6005 Australia
17.3.6 Drying
The filter cake from the natural fines filter is fed to the dryer chute via a belt conveyor. Gas
from the furnace which burns firewood is used to heat the dryer. The firewood is transported
to the furnace by hand. The furnace operates with the assistance of exhaust fans and a screw
conveyor to remove ashes from the furnace. The filter cake material with 10% moisture or less
is then withdrawn from the dryer to a conveyor system and discharged forming a cake pile.
The hot air expelled from the dryer passes through a cyclone process to capture ultrafine
material. The cyclone underflow is discharged back to the conveyor feeding the cake pile and
the cyclone overflow reports to a sleeve filter. Ultra fines captured in the sleeve filter are also
fed to the cake pile conveyor using a screw feeder system. The filtered air that has passed
through the filter is then released to the environment after passing through an exhaust fan and
stack.
17.4 Reagents Plant & Equipment
17.4.1 Caustic Soda
Thirty tonne trucks transport the caustic soda at 50% w/w in solution. A reagent transfer pump
then transfers this caustic from the trucks to the caustic storage tank with a capacity of
approximately seven days production.
Part of the caustic stored in the tank is pumped to the soy oil emulsion preparation tank.
Water may be introduced to the caustic soda circuit to clean the transfer piping and prevent
from scaling with crystallized caustic soda.
The remaining caustic soda is pumped to a tank fitted with mechanical agitator to prepare a
10% w/w caustic soda where water is added to dilute the caustic soda. After being diluted to
10% w/w, the caustic soda solution is then pumped to a storage tank and then pumped to the
first conditioning tanks in each of the three flotation circuits for pH control.
17.4.2 Soy Bean Oil
Thirty tonne trucks transport the pure soy oil to the plant. A reagent transfer pump then
transfers the oil to a soy oil storage tank which has a residence time of seven days production
capacity. This tank then feeds to a soy oil emulsion preparation tank fitted with a mechanical
agitator using another transfer pump. Caustic soda at 50% w/w in solution and hot water (90 a
95 ºC) from the boiler are introduced to this tank.
Before the soy oil and caustic soda at 50% w/w are added, water is added to the preparation
tank to one third full. After this water is added a reagent pump adds the soy oil for
approximately five minutes and then the caustic transfer pump transfers the caustic soda to
complete the batch. The transfer valve remains closed until the operation of emulsion
preparation is complete. During the emulsion preparation, the mechanical agitator is running
to facilitate saponification. The preparation takes approximately two hours to be complete
which includes the batch mix period. Once saponification is completed, further water is added
until a 10% w/w concentration of soy oil is completed. It is assumed that two batches per 8
shift will be conducted and consequently two transfers to the distribution tank will be
completed and capable of plant supply for 8 hours.

Amazon GeoServices Ltda ABN 52 065 481 209 Mineral Resource Estimate - Arraias Phosphate Project, Para State, Brazil – MBAC Page: 124 Effective Date – 27 March 2013
6005 Australia
When the required residence time is completed, the transfer valve is opened and a pump
delivers the emulsion to a distribution tank. The final proportion of the preparation tank will be
an emulsion consisting of 0.3 parts caustic soda, 1 part of soy oil and 18.7 parts water
(resulting in a concentration at 10%). This solution remains in the distribution tank and is
delivered continuously to the both of the conditioning tanks in the conventional flotation circuit,
the second conditioning tank in the fines flotation circuit and the second conditioning tank in
the natural fines flotation circuit using a transfer pump.
17.4.3 Flocculants
Flocculant will be delivered in bulker bags and when required be fed to the conditioning tank
hopper manually and then subsequently report to the flocculant mixing tank where water will
be introduced to prepare the solution at 1% w/w. The conditioned flocculant solution is then
transferred to the flocculant distribution tank with seven days of production residence time.
Then a pump transfers the flocculant solution to the natural fines thickener and the
concentrate thickener after passing through the dilution mixing system which adds further
water and dilutes the solution to 0.05% w/w. In the case of pump failure a reserve pump is
installed to distribute the solution.
17.4.4 Sodium Silicate
Thirty tonne trucks will deliver a 50% w/w sodium silicate solution. A reagent pump transfers
the sodium silicate to a storage tank with seven days production capacity. The sodium silicate
storage tank solution is then pumped to a sodium silicate preparation tank fitted with a
mechanical agitator (5075-AG-001).
Before the sodium silicate solution is added, water is added to the preparation tank up to 30%
of the tank volume. Subsequently, a reagent pump adds the sodium silicate solution for
approximately five minutes to prepare the batch. The transfer valve remains closed until this
operation is complete. During the sodium silicate preparation, water is introduced continuously
to the preparation tank whilst the agitator operates continuously during the solution
preparation process. The time required to prepare the solution is one hour which includes the
batch preparation time. It has been assumed two batches per shift will be made and
consequently two transfers to the distribution tank will be capable of supplying the plant for 8
hours.
When the batch preparation process is completed, water and reagent feed to the tank
preparation will be cut off. The transfer valve will be opened by the finalization of the required
residence time and a pump delivers to the distribution solution tank.
The final proportion in the preparation tank will be a solution at four parts of water to one part
of sodium silicate (resulting in a final concentration at 10%). The sodium silicate solution in the
distribution tank will have approximately eight hours of residence time at production capacity
with solution being continuously transferred to the first conditioning tanks in each of the three
separate flotation circuits.
Amazon GeoServices Ltda ABN 52 065 481 209 Mineral Resource Estimate - Arraias Phosphate Project, Para State, Brazil – MBAC Page: 125 Effective Date – 27 March 2013
6005 Australia
17.5 Sulphuric Acid Plant
Process phases are as follows:
Storage of sulphur;
Sulphur melting and filter;
Sulphur burning in reaction with oxygen air;
SO2 conversion into SO3
SO3 gases scrubber and absorption in appropriate tower;
Cooling and storage of acid product.
Storage of sulphur:
The solid sulphur with purity grade higher than 99.5% is unloaded from the delivery trucks to
the reception unity, equipped with hopper and conveyor belts, and from that point to the
stacker which sends it to the stockyard, with capacity for 30,000 tonnes of sulphur. The floor
of the stockyard is made with concrete and is impermeable to avoid that acid pluvial waters
touch the soil. The stockyard is also canted so that the acid pluvial water can be canalized to
a sump where it is neutralized.
Sulphur melting and filter
The solid sulphur is removed from the stockpile and transferred to the melting tank where it
receives a quantity of lime to reduce the acidity of the sulphur. Inside the tank, equipped with
steam coils, the sulphur is melted at 120 degrees Celsius. From the melting tank, the liquefied
sulphur is pumped to another tank where is added the diatomite, and agent that aids filtering
the sulphur, allowing the removal of impurities.
Sulphur Burning
The filtered liquid sulphur is pumped to the burner, termically isolated oven, where in contact
with dry air starts the combustion and creates SO2. Chemical reaction as follows:
S + O2 ------- SO2 + Heat
The oxidation of sulphur is an exothermic reaction and the heat released is used for energy
generation.
The dry air that fuels the burner is captured from the atmosphere by a blower that sends the
humid air into a drying tower. These tower uses sulphuric acid, with 98% concentration, that
when in contact with the air removes the humidity of the air using ceramic fillings.

Amazon GeoServices Ltda ABN 52 065 481 209 Mineral Resource Estimate - Arraias Phosphate Project, Para State, Brazil – MBAC Page: 126 Effective Date – 27 March 2013
6005 Australia
The gas generated in the burner reach 1000 degrees Celsius and goes to a recovery boiler
where, by thermal exchange, generates steam and has its temperature decreased to 430
degrees Celsius.
SO2 conversion into SO3
After the boiler, the SO2 gas and the O2 gas go to the converter where by catalytic action of
the Vn2O5 (Vanadium Pentoxide) reacts generating SO3. Chemical reaction as follows:
SO2 + ½ O2 -------- SO3 + Heat
The oxidation of sulphur dioxide is an exothermic reaction and the heat released is used for
energy generation.
The converter has 4 catalytic layers and in every layer the reaction above is realized until
exiting the final layer with SO3 concentration of 99.75%
The heat released in the layers is used to generate steam and electric power.
At full capacity, the plant can generate up to 7.5MW of power.
SO3 Absorption
The plant has two absorption towers of SO3 with similar function as the dryer tower. However,
their function is to absorb the SO3 using the sulphuric acid, with 98% concentration, that was
used in the dryer tower to absorb the humidity.
Cooling and storage of acid product
The sulphuric acid is now sent to a mixing tank where it is added water to adjust its
concentration to 98.5%. From the mixer tank, most of the acid goes to a heat exchanger
where it is cooled and returns to the towers. The residual acid goes to another heat
exchanger, cooled and finally to a storage tank, as the final product, the sulphuric acid with
98.5% concentration.
The storage tank has a capacity of 6000 tonnes of sulphuric acid. The tank is also equipped
with pumping systems that sends the sulphuric acid to the fertilizing area or load it to delivery
trucks.
17.6 Acidulation
The phosphate rock from the stockpile will be reclaimed by a front end loader to a belt
conveyor to feed the repulping tank.
After being repulped, the slurry will be pumped to the intensive mixer where sulphuric acid
(H2SO4) will be introduced. The reactional slurry product from the intensive mixer will direct to
the curing belt (DEN). After 10 to 15 minutes residence time, the reactional slurry will solidify
and it will pass through a lump breaker before being transferred to the cure warehouse by belt
conveyors.

Amazon GeoServices Ltda ABN 52 065 481 209 Mineral Resource Estimate - Arraias Phosphate Project, Para State, Brazil – MBAC Page: 127 Effective Date – 27 March 2013
6005 Australia
During the chemical reaction in the DEN, silicon tetrafluoride (SiF4) will be released. The
gases with fluorine content will be transferred to the absorption system where it will transform
into fluosilicic acid (H2SiF6) and hydrated silica (SiO2.2H2O) by counter current contact with
water. The concentration of this suspension will be 18 to 20% H2SiF6 and it will be withdrawn
from the gas treatment system to the surge tank
The scrubbers will be fitted with sealing tanks and liquor circulation pumps. Reposition water
will be fed onto the final stage tank and a chimney will release the gases to the atmosphere
after being treated according to relevant environmental standards.
Subsequently, the suspension with 3 to 6% solid content will be pumped to the press filter to
remove the hydrated silica. The silica cake will combine with the acidulate material from the
DEN and both will be transferred to the cure warehouse. The filtered fluosilicic acid will report
to the reservoir tank and then to shipment and/or neutralization.
The flow-sheet for the acidulation plant is showed in Figure 17.6_1.
Figure 17.6_1 – Acidulation Flow-Sheet
17.7 Granulation
The single superphosphate powder (SSP) from the cure warehouse will be transferred to the
granulator drum where ammonia, water, and slurry from the gas treatment system will be
introduced. The gases produced in the granulator will direct to the gas treatment system while
the product will direct to the rotary dryer.
Heat from the combustion chamber which burns firewood will be used in the dryer. The ashes
from the furnace will be disposed accordingly.

Amazon GeoServices Ltda ABN 52 065 481 209 Mineral Resource Estimate - Arraias Phosphate Project, Para State, Brazil – MBAC Page: 128 Effective Date – 27 March 2013
6005 Australia
The gas generated when granulated SSP passes through the dryer will be treated in the gas
treatment system consisting of a pneumatic cyclones and venturi scrubber before being
released to the atmosphere.
When drying operation is completed, the granulated SSP will report to the hot screening. The
oversize from the hot screening will direct to the cold screening after passing through the
rotary cooler. Gases produced in the cooler will report to a bag filter to remove the particulate
material, which will return to the process. Conveyors will withdraw the undersize from the hot
screening and feed the recycle bin as circulating load.
The cold screening screens will be fitted with two decks. The oversize from the upper decks
will feed a chain mill and the product will be delivered to the recycle bin. The undersize from
the upper decks will combine with the oversize from the lower decks and will be stockpile in
the granular product pile.
The undersize from the lower decks will combine with the hot screening undersize and chain
mill product in the recycle bin. The material from the bin will be the circulating load to feed the
granulator.
All dust collecting points located along the granulation plant will report to the bag filter. Then
the clean air will be released to the environment after passing through an exhaust fan and
chimney. Conveyors will transport the powder retained in the filtering process to the recycle
bin.
Granulation stage flow-sheet is shown in Figure 17.7_1.
Figure 17.7_1 – Granulation Flow Sheet

Amazon GeoServices Ltda ABN 52 065 481 209 Mineral Resource Estimate - Arraias Phosphate Project, Para State, Brazil – MBAC Page: 129 Effective Date – 27 March 2013
6005 Australia
17.8 Gas Treatment System
Gases from granulator and dryer will feed the gas treatment system. Gases from the
granulator will report to the gas scrubber to absorb ammonia and fluorine as well as
particulate material removal in a venturi scrubber.
Gases from the dryer will report to pneumatic cyclones to remove the particulate material. A
conveyor will withdraw the underflow material from the cyclone to the recycle bin. The
overflow will report to the gas scrubber to absorb fluorine and remove the remaining
particulate material in a venturi scrubber.
The scrubbers will be fitted with sealing tank and liquor circulation pumps.
Reposition water of the system will be fed into the dryer scrubber sealing tank. The granulator
and the dryer scrubber sealing tanks will be purged and the resulting slurry will report to the
liquid effluent treatment station locate at granulation plant battery limits.
The purged slurry will report to a lamella thickener. The overflow will be recirculated in the
sealing tanks while the underflow (slurry) will be pumped to the granulator.
Gas treatment system flow-sheet is shown in Figure 17.8_1.
Figure 17.8_1 – Gas Treatment System Flow Sheet

Amazon GeoServices Ltda ABN 52 065 481 209 Mineral Resource Estimate - Arraias Phosphate Project, Para State, Brazil – MBAC Page: 130 Effective Date – 27 March 2013
6005 Australia
17.9 Shipment
Primarily, a front end loader will transfer the granulate product from the stockpile into a hopper
fitted with a belt conveyor to feed the big bags system located on the trucks. The trucks will be
positioned in a road scale to assure the load correct weight.
It is proposed that, in the future, a front end loader will reclaim the material from the granulate
stockpile to a two-deck vibrating screens. The oversize from the first deck will report to a chain
mill and return as circulating load.
The oversize from the second deck will direct to a coating drum where coating additive will be
introduced. The undersize from the second deck will flow by gravity to a hopper for further
reprocessing.
The coating agent will be transported by 30 t trucks and pumps will transfer it to the storage
tank. Then pumps will transfer the coating agent to the coating drum passing through a heat
exchanger to reduce viscosity as required.
Later this material will feed four bins and after being properly weighed, it will be directed by
gravity to bags positioned in the trucks or directly to trucks.
All dust collecting points located along the shipment plant will report to the dedusting system
comprised of a bag filter. Then the clean air will be released to the environment after passing
through an exhaust fan and chimney. Conveyors will transport the powder retained in the
filtering process to bags to be re-processed.
Shipment flow-sheet is shown in Figure 17.9_1.
Figure 17.9 – Shipment Flow Sheet

Amazon GeoServices Ltda ABN 52 065 481 209 Mineral Resource Estimate - Arraias Phosphate Project, Para State, Brazil – MBAC Page: 131 Effective Date – 27 March 2013
6005 Australia
17.10 Water accumulation and Tailings Disposal
The study of the dams for waste disposal and pickup of new water for the ITAFÓS enterprise,
located in the municipality of Campos Belos, State of Goiás, was completed by Pimenta de
Ávila Consultoria Ltda.
The location studies of the dam axis were comprised in the location of 03 (three) axes for
picking up raw water and 10 (ten) axes for the one of waste containment. Drawing IO-100-DS-
20599 depicts the location of the 13 located axes.
The typical sections of the two dams (pickup and waste) are even, composed by compacted
filling and internal drainage designed in carpet and vertical filter in sand.
The Pickup dam project was designed for implementing in a configuration stage, whereas the
waste containment dam was designed in two configuration stages: the first configuration is the
initial dam, corresponding to the first three years of plant operation. The second configuration
is the final dam corresponding to the 20 years of the enterprise’s working life. The plant’s
water demand lies at 700 m³/hr (0.194 m³/s), working during 7,776 hours/year.
The axis defined as the best option for the phosphate project is located at the drainage of the
(stream) Córrego Bezerra downstream from the confluence of the (stream) Córrego Poção.
The dam crest was projected at the elevation El. 607 m and 10.0 m wide. The upstream talus
inclination is 1V:2H in all its extension and it is coated by rip-rap 1 m thick. The downstream
talus has an inclination equal to 1V:2H between shoulders, located at every 10.0 m of
difference of level and 5.0 meters wide. These shoulders are protected with a laterite layer
0.15 m thick and the talus between them must be protected by grass.
The reservoir inundation area is approximately 97.2 hectares, considering up to the overflow
sill elevation. The vegetation suppression area, comprising the massif and reservoir area and
accesses make up, approximately, 127.4 ha.
The foreseen axis of the dam is, in average, 7.8 km distant from the refining plant. The
reservoir volume is 7.3 x 10⁶ m³ and the compacted massif volume is 180,000 m³, making up
a total CAPEX cost of R$ 4,263,836.70. The operating costs of the Dam consist in
maintenance, such as, cleaning of the surface drainages, allocation of the staff responsible for
monitoring and maintaining the structure in wood working conditions. A dam operation annual
cost in the order of R$ 260,000.00 is estimated.
The waste containment dam is located on the drainage of the (stream) Córrego Bezerra
upstream from the pickup dam and corresponds to the first three years of plant operation.
The crest for the initial dam was projected at the elevation El. 650 m and 10.0 m wide. The
upstream talus inclination is 1V:2H in all its extension and it is coated by rip-rap de 1 m wide.
The upstream talus inclination is 1V:2H between shoulders, located at every 10.0 m of
difference of level and 5.0 meters wide. These shoulders are protected with a laterite layer
0.15 m thick and the talus between them must be protected by grass.
The foreseen axis of the dam is, in average, 8.5 km distant from the refining plant. The
reservoir volume is 7.5 x 10⁶ m³ and the compacted massif volume is 465,000 m³. The

Amazon GeoServices Ltda ABN 52 065 481 209 Mineral Resource Estimate - Arraias Phosphate Project, Para State, Brazil – MBAC Page: 132 Effective Date – 27 March 2013
6005 Australia
reservoir inundation area is approximately 270 hectares, considering up to the overflow sill
elevation. The vegetation suppression area, comprising the massif and reservoir area and
accesses make up, approximately, 277.4 ha.
The final waste dam configuration corresponds in wall-raising downstream from the initial
configuration axis. The final dam crest was projected at the elevation El. 660 m and 10.0 m
wide. The upstream talus inclination is 1V:2H in all its extension and it is coated by rip-rap 1 m
thick. The downstream talus has an inclination equal to 1V:2H between shoulders, located at
every 10.0 m of difference of level and 5.0 meters wide. These shoulders are protected with a
laterite layer 0.15 m thick and the talus between them must be protected by grass.
The foreseen axis of the dam is, in average, 8.5 km distant from the refining plant. The
reservoir volume is 53.1 x 10⁶ m³ and the compacted massif volume to raise the dam is 1.34
x 106 m³, making up a total CAPEX cost of R$ 11,161,601.88. The costs referent to operating
and OPEX the Dam consist in the construction of wall-raising with a volumetric capacity of a
5-year operation and in maintenance, such as, cleaning of the surface drainages, allocation of
the staff responsible for monitoring and maintaining the structure in wood working conditions.
Four raisings are foreseen for the project in question in the years 2, 6, 11, 15 and 19. The
investment for each wall-building is estimated in R$ 4,059,900.00; additionally, the annual
cost of maintenance in the order of R$ 130,000.00.
The reservoir inundation area is approximately 433.2 hectares, considering up to the overflow
sill elevation. The vegetation suppression area, comprising the massif and reservoir area and
accesses make up, approximately, 737.1 ha.
For both dams, overflow structures of the open channel on surface type were designed. The
hydrological simulation of the dam is based on the daily operation of the reservoir for a certain
critical year. For defining the critical year, the year with a smaller annual average specific
efficiency is adopted. According to the surface geological-geotechnical mapping, the spillways
will be excavated in fractured rock, which results in using a protection layer in sprayed
concrete and reinforced concrete in the swift segment.
Amazon GeoServices Ltda ABN 52 065 481 209 Mineral Resource Estimate - Arraias Phosphate Project, Para State, Brazil – MBAC Page: 133 Effective Date – 27 March 2013
6005 Australia
18 PROJECT INFRASTRUCTURE
18.1 Access Roads
Access Road 1: this 198.01 m in length road will connect the dam plateau to the
treated water plateau;
Access Road 2: this road will connect the workshop of the access road to the ROM
plateau and its length will be 203.51 m;
Access Road 3: this road will commence at the chemical plant plateau close to the
cooling tower, will pass through the ramp 08, ending at the chemical plant plateau
close to the workshop. The length will be 388.73 m;
Access Road 4: this road will access the ROM plateau from the homogenization
plateau and its length will be 193.57 m;
Access to ROM plateau: this road will connect the crushing plateau to the ROM
plateau and its length will be 1370.72 m.
18.2 Earthworks
The following assumptions have been taken into consideration to develop the earthworks
design:
Studies based on the layout drawings as defined by the mechanical arrangement and
topography developed by Pimenta de Ávila;
An allowance of 30 cm thickness layer was made for cleaning;
Borrow material will come from the pit;
Earth distribution considered the transportation average distance and reuse of cut off
material.
18.3 Drainage
The drainage system design will incorporate environmental protection requirements and will
provide gutter, drains, culverts, stairs for descending water, water collecting box and ditches
capable to impound and conduct water flows properly.
18.4 Plant Buildings
Plant buildings will consist of:
Workshop;
Central Stores.

Amazon GeoServices Ltda ABN 52 065 481 209 Mineral Resource Estimate - Arraias Phosphate Project, Para State, Brazil – MBAC Page: 134 Effective Date – 27 March 2013
6005 Australia
18.5 Administrative Buildings
Administrative buildings will encompass:
Main Entrance;
Weigh Control;
Administrative Office;
Ambulatory and Fire Brigade;
Restaurant;
Change Room;
Laboratory and Process Office.
18.6 Water System
Water system for the Itafós Project will encompass the following water systems:
Waste water treatment system: capable to process 30,000 l/d;
Raw water impoundment and distribution;
Recycled water system;
Water treatment system;
Fire water.
18.7 Compressed Air
Compressed air system will supply service, instrument and process air as follows:
Service and instrument air to the plant;
Service and instrument air to the workshop;
Air for flotation.
18.8 Electrical system
Electrical power will be supplied to the main substation via a 60 kV transmission line with
approximately 16.3 km from CELG (Goias State Energy Co.) substation in Campos Belos
municipality, state of Goiás. The transmission line will be a single radial circuit and it will feed
all secondary substations to be located in the plan as follows:
Chemical Plant Substation;
Beneficiation Plant Substation;
Water Intake Substation;
Sulphuric Acid Plant Substation;
Mill Substation.

Amazon GeoServices Ltda ABN 52 065 481 209 Mineral Resource Estimate - Arraias Phosphate Project, Para State, Brazil – MBAC Page: 135 Effective Date – 27 March 2013
6005 Australia
19 MARKET STUDIES AND CONTRACTS
In order to analyse the fertilizer market in the MBAC target region, MB Agro, a consulting
company specialized in the Brazilian Fertilizer Market, has prepared a study, forecasting
future fertilizer demand and analysing domestic supply as well as local infrastructure.
MBAC target region is represented by the central-northern and north-eastern Brazil, including
the main MBAC potential regions as western Bahia state, Northern Goiás state, North-eastern
Mato Grosso State and Tocantins state as marked in blue in Figure 19_1.
Figure 19_1 – Selected Region for the Demand Estimate
The study includes (i) the agricultural potential; (ii) an overview of the global and domestic
fertilizer supplement and demand; (iii) the assumptions and calculations of MBAgro model; (iv)
the forecast of future fertilizer and crops consumption; and (v) an prospect of the domestic
infrastructure.
The first topic shows current information about the size of the target region’s agricultural
market, contemplating an overview of micro-regions soil characteristics, crops’ production &
productivity and cultivation areas.
The second section explains the composition of MBAgro model and the model results.
Assumptions and calculations are detailed describes, showing all numbers used for the model
development. As the results are presented, the numbers are analysed and compared in order
to describe MBAC opportunities and threats.
19.1 Agricultural Potential of the Area
Within the Brazilian territory which has 851 million hectares, the present study focuses its
analysis on states with important agricultural potential. Composed by Northeast Area, plus
Tocantins, Mato Grosso and Goiás states delimited as the region of interested to the project,
the area under consideration totals 308 million hectares. Table 19_1 shows the states in the
interest region.

Amazon GeoServices Ltda ABN 52 065 481 209 Mineral Resource Estimate - Arraias Phosphate Project, Para State, Brazil – MBAC Page: 136 Effective Date – 27 March 2013
6005 Australia
Table 19.1_1 – States in the Interest Region
Of this total, some regions in the states of Mato Grosso, Bahia and Goiás are excluded for not
belonging to the radius of influence of plants on question. Therefore, the rest of those states
were considered in the analysis, as well as throughout Northeast, the northeast of Mato
Grosso, the North of Goiás and the West of Bahia.
The project would have a target area of approximately 188.49 million hectares, distributed
among the states as shown in Table 19.1_2.
Table 19.1_2 – Area Covered by the Study (in 1000 hectares)
Brazil, being one of the countries with the world’s largest agricultural area and one of the few
countries that still has room to expand the production area, is facing growing global demand
for food and biofuel. All of these factors are very favourable for growth in agriculture in Brazil.
Considering the agricultural potential of the soils, taking into account factors such as fertility,
characteristics physical and morphology, main constraints and topography, the territory is
classified as having 46.5% of this area with good potential, 23.5% with average potential and
30% with poor potential. The map on Figure 19_2 shows the agricultural potential of soils.
Area (1000 ha) Maranhão 33,198 Piauí 25,153 Ceará 14,883 Rio Grande do Norte 5,280 Paraíba 5,644 Pernambuco 9,831 Alagoas 2,777 Sergipe 2,191 Tocantins 27,762 Bahia 56,469 Mato Grosso 90,336 Goiás 34,589 Total 308,112 Source: IBGE
Area considered
TO 27,762
MA 33,198
PI 25,153
CE 14,883
RN 5,280
PB 5,644
PE 9,831
AL 2,777
SE 2,191
West BA 16,465
North MT 26,917
North GO 18,389
Total 188,490
Source: IBGE. Prepared by MB Agro

Amazon GeoServices Ltda ABN 52 065 481 209 Mineral Resource Estimate - Arraias Phosphate Project, Para State, Brazil – MBAC Page: 137 Effective Date – 27 March 2013
6005 Australia
Figure 19.1_1 – Agricultural Potential of the Soils
In the region considered in the study, about 58% of the area is classified as good agricultural
potential, 9% as average and 34% as poor. Table 19_3 shows the agricultural potential.
Table 19.1_3 – Agricultural Potential
An important part of the area covered in the study is located in the Brazilian Grassland. The
region boasts two well-marked seasons: dry winter and rainy summer. The soils of the
grassland have great variation in their morphologic and physical characteristics.
However, some chemical characteristics such as high quantity of iron and aluminium,
deficiency of nutrients and high capacity of fixation of phosphorus are present throughout its
extension. Therefore, the soils are poor and the fertility is created by applying fertilizer and
limestone.
The consumption of fertilizers in Brazil has increased 5.0% every year for the last 23 years. In
2008, it reached, according to the National Association for the Promotion of Fertilizers
(“ANDA”), 9.4 million tonnes of nutrients (NPK), which means a volume of 22.4 million tonnes
of intermediate products. The internal production made up 40% of this demand totalling 8.8
million tonnes.
CERRADO
Agricultural potential:
Good
Regular
Bad
Source: IBGE, Elaboration MBAgro
Agricultural potencial
Good 396 47% 253 58%
Regular 200 24% 38 9%
Bad 255 30% 148 34%
Total 851 100% 439 100%
Selected regionBR

Amazon GeoServices Ltda ABN 52 065 481 209 Mineral Resource Estimate - Arraias Phosphate Project, Para State, Brazil – MBAC Page: 138 Effective Date – 27 March 2013
6005 Australia
The ports of Paranaguá, Santos and Rio Grande are the main gateways into the country.
Though these ports and others, the products are directed to main consumer states including
São Paulo, Paraná, Rio Grande do Sul, Mato Grosso, Minas Gerais and Goiás. Bahia, Mato
Grosso do Sul and Maranhão are also becoming major consumers of these inputs.
19.2 Market Model
To design the NPK and Sulphur Brazilian demand, we developed a model that combines
economic information with plant nutrition for each product.
The structure of the model is in the production projection for each crop (cotton, corn,
soybeans, coffee, bean and sugarcane) which make up most of the domestic demand for
NPK. Figure 19_3 shows the participation of the farming in Brazilian fertilizer consumption
(2008).
Although there is available area for expansion in Brazil, the traditional regions, especially the
South region, there is no more room for expansion. In these states, the supply growth will be
driven by productivity more than area. This variable was also controlled in our projections and
results. Production for the selected region are presented in Table 19.2_1:
Table 19.2 – Projection and Results and Production
For the region, it was estimated that the total cultivated area should rise from 10.6 million
hectares, in 2008, to 22.4 million ha in 2040. The region known as MAPITO+BA should
Soybeans33%
Corn20%
Sugar Cane13%
Coffee6%
Other28%
Fertilizer Consumption per Crop - Harvest 2008
Source: ANDA - Elaboration: MB Agro
Area (1000 ha) Year TO MA PI CE RN PB PE AL SE BA MT GO Total 2008 591 1,381 967 1,405 591 534 1,059 623 308 308 1,433 1,013 10,214 2012 667 1,459 1,146 1,681 667 550 1,263 702 316 316 1,659 1,368 11,793 2017 755 1,634 1,187 1,595 755 577 1,290 745 316 316 1,959 1,523 12,653 2020 819 1,776 1,221 1,535 819 605 1,310 777 318 318 2,171 1,633 13,303 2025 950 2,093 1,310 1,449 950 664 1.361 835 324 324 2,590 1,864 14,713 2030 1,119 2,546 1,446 1,381 1,119 739 1,425 901 332 332 3,107 2,156 16,601 2035 1,336 3,195 1,640 1,324 1,336 831 1,506 975 341 341 3,747 2,538 19,109 2040 1,614 4,127 1,910 1,280 1,614 944 1,.598 1,057 353 353 4,538 3,026 22,414
Source: MB Agro

Amazon GeoServices Ltda ABN 52 065 481 209 Mineral Resource Estimate - Arraias Phosphate Project, Para State, Brazil – MBAC Page: 139 Effective Date – 27 March 2013
6005 Australia
represent almost 5 million hectares in growth of cultivated area and the States of Mato Grosso
and Goiás, 3 and 2 million of hectares, respectively.
In relation to the cultivated area, although we have taken into consideration the potential of
area for agriculture in each State, we considered the area actually cultivated and not the
available area.
Table 19.21.2_2 – Culture Analysis
In the cultivations analysed, the crops that should provide further growth of area are
sugarcane and soybean. For the sugarcane, the projection shows that the area should reach
2.8 million hectares in the selected region, an increase of 144%. The soybean crop is also
important for the region. The area should increase 3 million hectares and reach 9.2 million ha.
For production, it is estimated that the region should increase from 96 million tonnes to 360
million until 2040, with sugarcane and soy primarily responsible for the increase. To meet
expected demand, the sugarcane production should grow 260% and soybean, 435% in the
target region of the study.
Table 19.2_3 – Production
Area (1000 ha)
Year Cotton Coffee Sugarca
ne Beans Corn (1°) Corn (2°) Soybean Total
2008 385 31 1,143 1,611 2,478 238 3,023 8,909 2012 423 32 1,235 1,686 2,557 195 3,343 9,471 2017 440 39 1,502 2,058 2,808 402 3,644 10,894 2020 458 35 1,597 2,064 2,723 441 4,041 11,359 2021 466 40 1,632 2,049 2,699 455 4,189 11,530 2025 505 42 1,792 2,039 2,619 519 4,865 12,382 2030 572 38 2,047 2,037 2,553 616 5,945 13,807 2035 661 46 2,374 2,056 2,514 735 7,365 15,751 2040 776 42 2,791 2,101 2,498 879 9,237 18,324
Source: IBGE, MB Agro
Production (1000 t)
Year Cotton Coffee Sugarcane Beans Corn (1°)
Corn (2°)
Soybean Total
2008 1,382 33 80,856 912 3,245 448 9,566 96,443
2012 1,594 35 91,922 945 4,575 1,474 11,570 112,115
2017 1,918 37 109,155 989 4,774 1,826 14,863 133,563
2020 2,148 39 121,778 1,017 4,902 2,079 17,326 149,288
2025 2,600 41 147,850 1,067 5,127 2,587 22,488 181,760
2030 3,161 44 182,327 1,120 5,372 3,229 29,384 224,638
2035 3,861 47 228,588 1,178 5,637 4,042 38,662 282,016
2040 4,738 50 291,478 1,241 5,926 5,073 51,230 359,737
Var 3,356 17 210,622 329 2,682 4,625 41,664 263,294
Source: IBGE, MB Agro

Amazon GeoServices Ltda ABN 52 065 481 209 Mineral Resource Estimate - Arraias Phosphate Project, Para State, Brazil – MBAC Page: 140 Effective Date – 27 March 2013
6005 Australia
Given the areas and expected productivities in question, we estimated that demand for NPK
should rise from 1 million tonnes in 2008 to 4.7 million tonnes in 2040. The demand will
continue to grow driven largely by the need for phosphate and potash.
The values for nutrients are shown in the Table 19.2_4 which also provides information on
sulphur demand, which is expected to grow 255% and reach 689 thousand tonnes in 2040.
Table 19.29.2_4 – NPK Consumption – Target Region (thousand tonnes)
The Sulphur Demand and the Potential Market of SSP
The Brazilian soils are known to be poor in nutrients especially in the grassland region, as
mentioned previously. These soils have a deficit of sulphur. It can be affirmed that there are
few alternatives for sulphur nutrition. In practice, basically you have the option of the SSP and
the gypsum, which is a scarce product in a lot of areas of the country, especially in the interest
area of the project.
Looking more closely at the sulphur demand, it is noted from the table above that there is
today respectable extraction of S by crops considered in our study. If we consider that the
demand of 194 thousand tonnes of sulphur for the region in question in 2008 was only
supplied by SSP, we would have in the area an equivalent demand to 1.85 million tonnes of
this product (Scenario I).
However, also based on the table 16.17, which also shows the estimated P2O5 demand at
the region, a different scenario was indicated. Based on a non official estimative 50% of the
total demand of P2O5 could be reached just by the SSP product. Therefore, considering that
the SSP has 18% of P2O5 (which is the most common SSP grade), it is possible to inferred
that the SSP demand at the region in 2008 could be, approximately, 1.12 million tonnes
(Scenario II).
Comparing both assumptions, it is possible to note that there is a gap of 0.73 million tonnes
between both possible demands. This difference, however, can prove that the Scenario II
(which is being considered as base case) is conservative, because there is evidence to
assume that the sulphur demand will be mainly supplied by SSP.
The geographical location of the gypsum (the other sulphur supply alternative) is really a
disadvantage for the target region crops’ producers, because the product are produce kindly

Amazon GeoServices Ltda ABN 52 065 481 209 Mineral Resource Estimate - Arraias Phosphate Project, Para State, Brazil – MBAC Page: 141 Effective Date – 27 March 2013
6005 Australia
far away and the product has a low S content by tonne, resulting in a large freight costs by S
content.
Table 19.2_5 shows the comparison between both SSP demand scenarios due to illustrate
the SSP potential market at the target region:
Table 19.2_5 – SSP Demand by both Scenarios (1000 tonnes)
It can thus be seen that even with relative easy access to the port (what could facilitate MAP
import), the development of the agricultural area in the region will require much greater use of
SSP compared to MAP and gypsum.
20 ENVIROMENTAL STUDIES, PERMITTINGS AND SOCIAL OR
COMMUNITY IMPACT
20.1 Environmental Study (“EIS”), Impact Report (“RIMA”) and Public Hearing
An Environmental Impact Study (EIS) about the potential impacts over the project’s site,
including a detailed Operations Plan description, is required by the NATURATINS
(Environmental Agency of Tocantins State) before any construction and mine operations can
begin. The Operations Plan consists of the basic mine plan, infrastructure, and operational
aspects of the Project. The EIS consists in the reviewing of the Plan of Operations to
understand the project impact over the natural resources, fauna, flora and the neighbouring
communities, including its cultural and historical heritage. The Environmental Impact Report
(EIR) consists of a document that presents only the most important parts of all content of the

Amazon GeoServices Ltda ABN 52 065 481 209 Mineral Resource Estimate - Arraias Phosphate Project, Para State, Brazil – MBAC Page: 142 Effective Date – 27 March 2013
6005 Australia
Environmental Study, written in a colloquial language, in order the matter to be easily
understood and discussed by the population.
The Environmental Study was submitted to NATURATINS, in July, 2010. The NATURATINS
has up to six months to evaluate the Environmental Study and deliver the Impact Report to
National Environmental Agencies i.e. IBAMA and other environmental related regulatory
agencies that are required to review the project viability.
The Public Hearing, in accordance with the CONAMA 009/1987 (the Federal Council that
rules the Brazilian environmental licensing process) have the objective to show to all the
people living near from the project area, the environmental impacts and other changes that
will be potentially caused by the project. In this Public Hearing the Company must be present
to present information about the project and answer all questions from the people who live
around the project and representatives of governmental and nongovernmental organizations,
and collect comments and suggestions about the project. The public hearing shall occur
according to the criteria of the NATURATINS. Additional Public Hearings could occur if
requested by authority of the civil prosecutor or by manifestation signed from more than 50
people from the community that live near from the project. The company has the responsibility
to facilitate the location and transportation to the proposed Public Hearing site.
Actually, the Public Hearings occurred in September 21, 2010, at the Arraias Church Hall,
when were present almost 600 people, discussing and debating about the EIR of Arraias
Project. Based on this event and after the studies presented evaluation, the NATURATINS
issued the Preliminary License (permit) in December 2010. This document means that the
project is feasible from an environmental standpoint.
The next step was to present the Basic Environmental Project (BEP) which consists of a set of
actions, plans and programs that aims to prevent, reduce or avoid the environmental impacts
that could be caused by the project’s construction over the surrounding natural resources and
the communities.
The BEP was approved after review by NATURATINS, which issued the Installation License
(permit) for the project by March 2011, which enabled the start of construction. Others permits
were necessary and obtained, like water grant from National Water Agency, because the
project uses a federal water to obtain water, and deforestation permits.
During the construction, environmental teams were working to ensure compliance with the
environmental commitments. Thus, with the approaching end of construction and
environmental commitments executed, the company requested the NATURATINS the
Operating License (permit) to start to produce. Itafós has received operating permits for the
water dam, the tailings dam and the beneficiation plant. The remaining licenses will be issued
in the next weeks as construction is completed.
20.1.1 Environmental Study (“EIS”) Conclusions
The EIS study was prepared to substantiate the environmental licensing process of the
phosphate project at Arraias, Tocantins state. The study objective is to present a diagnosis of
the area impacted by the project, as well as identifying future scenarios considering

Amazon GeoServices Ltda ABN 52 065 481 209 Mineral Resource Estimate - Arraias Phosphate Project, Para State, Brazil – MBAC Page: 143 Effective Date – 27 March 2013
6005 Australia
phosphate plant set up or not, seeking a discussion on the environmental based on evaluation
of the environmental impacts on the region.
According to the concept of “environmental impact” presented at the CONAMA 001/1986 it is
clear that the project will have a series of adverse impacts on the region, given its interference
with the fauna and flora, and to the surface water of the Bezerra River, a tributary to the
Paranã River, member of the Tocantins River Basin.
The Project has considered large investments, roughly R$ 350 million, in a region that is
mostly underdeveloped. For this reason it is expected that the impact of this investment will
significantly benefit the socio-economic aspects of the Arraias city. Jobs generated will range
up to 2,500 during the construction phase and 328 direct and 800 indirect jobs during
operations. A virtuoso cycle is expected, compounded by the employment increase, services
demand and wealth distribution. This cycle will attract companies to relocate to the region and
supply the demands generated by the project, affecting all sectors of the city economy,
especially the services sector.
Other benefits include tax generation. The tax, “CFEM - Contribuição Financeira sobre a
Exploração Mineral” or financial contribution on Mineral Exploration has to be paid to the
Union monthly. This tax rate is 2% of the total revenue from a mineral product. In case, the
mineral product is used internally as raw material for another industrial process this amount is
calculated based upon the total producing cost of the mineral product. The tax revenue is
divided 65% to the city, 23% to the State and 12% remaining with the Union. The city must
comply with certain fiscal requirements in order to receive this amount.
Other taxes and contributions are also due, as determined by the Brazilian Fiscal Law. Among
them is, the Social Contribution on Net Earnings (CSLL), the contribution to the Social
Integration Program (PIS), the Contribution for the Financing of the Social Security
(CONFINS), the contribution for the National Institute for the Social Security and the Income
Tax.All these contributions are due to the Federal Government, as the Income Tax. The ICMS
(or VAT tax) is charged by the State and transferred to the cities. Third party services are
provided by companies located at Arraias and the Services Tax is due to the city.
The Study estimates that 71% of the identifiable impacts are reversible, meaning that a
significant portion of the impacts defined for the Project will not be to the detriment of the
future generations. This would only occur in the event of any compromise on the current
environmental resources.
It is clear from the final evaluation of this Study that the Project is evenly balanced considering
the environmental impacts at all levels.
During the implementation phase, for example, there will be a concentration of important
impacts related to the interference with various mediums. This is usually expected in the
implementation phases of new projects, in regions where pasture and agriculture are
predominant, or even in unexplored regions. As the project has a large dimension it is
considered that a large area will be affected and most of these impacts will happen during the
implementation phase.

Amazon GeoServices Ltda ABN 52 065 481 209 Mineral Resource Estimate - Arraias Phosphate Project, Para State, Brazil – MBAC Page: 144 Effective Date – 27 March 2013
6005 Australia
Almost all these impacts can be mitigated, reduced or compensated by measures described
in the Environmental Impact Study presented to Naturatins. Relating to the socio-economic
impact, it is clear that most of the impacts are beneficial, such as employment generation, tax
generation, and commercial development of the region, among others.
The eventual adverse aspects as increase in crime rate, prostitution and drug problems can
and will be mitigated by preventive actions promoted by the company and by the city. As long
as these measures are adopted these adverse impacts can be controlled.
In the case of low and medium impacts, it can be viewed as the same effect. The Project may
have eventual adverse impact on the Environment, but it will offer compensations in the socio
economic area, promoting the regional development.
Another important fact is that the Project is considered as “Public Utility”, according to the
resolution CONAMA 369 from March, 28th, 2006.
By the end of life of the Project the mined areas, the water and tailing dams would have
modified the landscape, although they will be prepared for minimize this impact. It is important
to say that although some restrictions for future utilization of these areas may apply, some
other opportunities can be foreseen in the strategy adopted for closure.
The industrial area of the Project, after disassembly, residue removal and other activities, the
site can be used for new industrial activities that will utilize a portion of the infrastructure
(power supply, dams, administrative buildings, etc.).
The reservoirs can be reused as they will be monitored. At the end of the Project this data can
be used for appropriate designation of these structures, be it for water supply, leisure,
agriculture use, human consumption etc.
In the case of non-approval of the Project this end up will denying the North, Northeast and
Mid-East region of Brazil a supply of domestic fertilizer to be used in agribusiness, as well as
denying the much awaited socio economic development of the Arraias city and the Tocantins
State. At the Federal level, the Project is expected to save the country from importing
approximately US$ 3 billion in fertilizers, during the life of the mine.
Finally, it can be said that the Project may interfere with the environmental. However with the
implementation of appropriate management, control, mitigation, recovery and compensation
measures it can be concluded that the Project is viable in its socio environmental focus.
20.2 Impact Generation and Mitigating Actions
(Solid waste, liquid discharge and gas emission)
20.2.1 Reclaim Ponds
Rain in the region is concentrated in the period from October to March. Rain water that falls in
the project area and in the vicinity will drain directly to a containment system for rainwater,
and will be treated and returned to the process. To control potential problems of sediment
being carried from the access roads at the project site during the rainy season, a drainage
plan will be developed. All plant equipment plant will have a containment system to avoid

Amazon GeoServices Ltda ABN 52 065 481 209 Mineral Resource Estimate - Arraias Phosphate Project, Para State, Brazil – MBAC Page: 145 Effective Date – 27 March 2013
6005 Australia
possible leaks in the liquid process, which will be neutralized and directed to correct disposal
and return to the process.
20.2.2 Tailings Facility
The tailings will be positioned naturally to maximize water reuse. The dam project will allow
the settling of the solids, while promoting a recovery of the liquid part contained in the waste.
The advantages of tailings disposal in this area is the ability to maximize the use of water or
during periods of excessive evaporation, the ability to use a source of clean water containing
limited fines and the ability to intercept and detain the full potential of formed acid solutions.
20.2.3 Mining Waste
The mining waste will be arranged within the limits of the tailings dam. The tailings will be
used in the first three years of operation until the area is filled to the maximum level, after
which the tailing dam capacity will be increased.
20.2.4 Solid Waste
A plan for management of hazardous solid waste will be developed so that all materials that
are acid-generating or that can impact the groundwater and surface water will be dispersed
with a high potential for burnout to prevent the generation of acid as by-products.
20.2.5 Granulation Process
Single Super Phosphate (“SSP”) powder from the curing barn will be transported to the drum
granulator. Ammonia, water and mud from the gas treatment system will also be added to the
granulator. The granulator will generate gases that will be sent for gas treatment. The dryer
will receive heat from the furnace that is fuelled by wood through the drag conveyor. The
ashes of the furnace will return to the process. When the SSP granules pass through the
dryer, this will also generate gases that will be sent to the gas treatment, so they can receive
proper treatment before being released into the atmosphere, according to environmental
standards. In the granulation area all captured dust will be directed to the system of bag
filters. After filtration, clean air will be released to the atmosphere through exhaust fans and
stacks. The powder resulting from filtration will be transported by screw conveyors to be
reused.
20.2.6 Acidulation Plant
The material from the pile of rock phosphate will be taken over by loader and will be sent to
the conditioning tank. After this conditioning, the pulp will pass through the thinner, where
dilution occurs with the addition of sulphuric acid (H2SO4). During the chemical reaction, the
release of silicon tetrafluoride (SiF4) occurs. The gases containing fluorine will be transferred
to the gas treatment system. Gases properly handled and under the best environmental
standards are sent to the atmosphere through the chimney. The filtered hydrofluosilicic acid
will go to the storage tank and then it will be transferred to the dispatch and or to
neutralization. The most pronounced advantages are energy efficiency and no generation of
by-products.

Amazon GeoServices Ltda ABN 52 065 481 209 Mineral Resource Estimate - Arraias Phosphate Project, Para State, Brazil – MBAC Page: 146 Effective Date – 27 March 2013
6005 Australia
20.2.7 Gas Treatment System
The gas processing system will receive the gases from the granulator and dryer. Gas from the
granulator will go to the gas scrubber for absorption of fluorine and ammonia in cross flow with
water. The gases from the dryer will go to the pneumatic cyclones to remove particulate
material. The underflow goes to a screw conveyor and is subsequently recycled. The overflow
will go to the gas scrubber for absorption of fluorine and removal of particulate material in
cross flow with water. A makeup water system will be fed in the last stage of gas cleaning and
finally the properly treated gas (under the best environmental standards) is sent to the
atmosphere through the chimney. There will be a permanent monitoring system in all
chimneys in order to guarantee that the air released to the atmosphere will be according to
the parameters established by the Brazilian federal law.
20.2.8 Dust Control Measures
Engineering controls, such as good design and proper implementation, will provide the
primary control for dust as they will prevent dust emission. Physical controls will provide an
additional protection to ensure that dust is managed in accordance with regulatory
requirements.
20.2.9 Ore Haulage and Waste Dumping Dust Control
Waste dumping is not expected to create dust as the material will be wet coming out of the
mine. The moisture will not separate from the rock until after the material has been dumped
into the facility located in the bottom of the current pit structure.
20.2.10 Access Road Dust Control
The roads connecting Campos Belos to the main cities and commercial centres are paved
and in good condition. The main access road into the project is of gravel construction.
Recycled water will be used to humidify the main roads to minimize dust emission.
20.3 Area Description
20.3.1 Hydrograph
The area on the project belongs to the basin of the Amazon River. The study area is part of
the vast Amazon River basin. The area is drained by Bezerra River, a tributary of the Paraná
River, which flows into the Tocantins River, which in turn is a tributary of the Amazon.
20.3.2 Flora
Located in the extreme southeast of the state of Tocantins in Arraias, the region is within the
domain of the Cerrado. Cerrado is the second largest biome of Brazil and occupies an area of
about 213 million hectares, mainly in central Brazil but also reaching areas in the north,
northeast and southeast. This biome is characterized by great diversity and heterogeneity of
different vegetation types. Environmental diversity is the predominant feature, considering the
diversity of soils, geology, geomorphology and climatic conditions and where we can find
vegetation heterogeneity, such as riparian vegetation, and dry savannah. The Cerrado, a
Brazilian version of the savannah, is the typical vegetation of that region and has virtually all
been substituted by pasture.

Amazon GeoServices Ltda ABN 52 065 481 209 Mineral Resource Estimate - Arraias Phosphate Project, Para State, Brazil – MBAC Page: 147 Effective Date – 27 March 2013
6005 Australia
20.3.3 Fauna
The fauna species in the region of Arraias are typically of the Brazilian Savannah (“Cerrado”),
but also found in other habitats, where the availability of resources are greater, reflecting the
high diversity and endemism. The group of terrestrial vertebrates that have a higher rate of
endemism are the reptiles and amphibians. The mammal fauna of the savannah has about
194 species, 18 of which are just found in that biome. Many of these species are considered
threatened with extinction due to habitat loss. They need large areas for their survival and the
management of these species depends on thorough knowledge of their behavior. The
Savannah has an extremely rich and diverse fauna with numerous species, representing
almost 50% of all species occurring in Brazil. Most of birds that live in the Cerrado use it for
breeding. The quantity of species which are found particulary in the Cerrado biome are not
very numerous. These species are mostly associated with open habitats, but most of these
species are somehow dependent on forest habitats. Birds that reproduce in the Cerrado are
dependent or semi dependent on dry forest.
20.3.4 Sociology
The municipality of Arraias has its history linked to the exploitation of gold. In the mid-
eighteenth century, a Jesuit mission settled in a village with the name of Boqueirão Tapuio
near where the city of Arraias is today. People from a destroyed Quilombo (community of
former slaves’ descendants, where the land was donated by the government and protected by
federal legislation) started to arrive in the region, occupying an area known as Chapada dos
Negros.
The municipality has a population of 10,984 inhabitants ethnically mixed but predominantly
black, spread over an area of 5,398 km ². Of this population, approximately 55% live in urban
areas. The most significant age group ranges between 0 and 14 years, representing 37% of
the population.
The city’s economy, as in most small Brazilian cities, is concentrated in the services sector,
followed by the agriculture and industry sectors. The city has great untapped tourism
potential.
21 CAPITAL AND OPERATING COSTS
The Capital Cost Expenditure (CAPEX) and Operating Cost Expenditure (OPEX) have been
updated since the previous report. The new estimative for Itafós project development have
been estimated to February/2013 rates. The accuracy assumed to prepare the CAPEX and
the OPEX is ±5% due the advanced stage of the plant construction. The exchange rates
applied to the CAPEX calculation was US$ 1.00 = R$ 2.086 and the OPEX was US$ 1.00 =
2.10.
The CAPEX and OPEX assumed for the Itafós Project are summarised in table 21_1 and
table 21_2 below (see appendix 1 for detailed CAPEX):

Amazon GeoServices Ltda ABN 52 065 481 209 Mineral Resource Estimate - Arraias Phosphate Project, Para State, Brazil – MBAC Page: 148 Effective Date – 27 March 2013
6005 Australia
Table 21_1 – Capex Assumptions
Table 21_2 – Opex Assumptions
22 ECONOMIC ANALYSIS
MBAC team used the discounted cash flow model to estimate the “fair value” of the Arrais
project relying on the technical, commercial and economic information and data available by
the time of this release.
The DCF model uses the discounted free cash flow of every future year to determine the most
accurate value of the project in a specific date. For the purpose of our model we are using
January 2013 as the initial date of the project and any expenditure from previous years are
capitalized by the rate of discount.
Equipment Electrical 29,457,000R$ 4.4%
Mechanical 198,385,000R$ 29.4%
Spare Parts 366,780R$ 0.1%
Materials Electrical 6,041,424R$ 0.9%
Miscelaneous, including electrical equipment 7,736,800R$ 1.1%
Steel Structure 53,450,000R$ 7.9%
Instrumentation / Telecommunication 5,104,029R$ 0.8%
Miscelaneous 34,234,123R$ 5.1%
Piping 19,765,345R$ 2.9%
Cataliser 7,507,200R$ 1.1%
Erection Electro-mechanical erection 103,000,000R$ 15.3%
Civil Works Civil 53,000,000R$ 7.9%
Archtecture 16,453,423R$ 2.4%
Dams 29,000,000R$ 4.3%
Infrastructure 27,456,987R$ 4.1%
Indirect Comissioning and training 1,557,390R$ 0.2%
Land Acquisition 8,000,000R$ 1.2%
MECS Technology 4,311,200R$ 0.6%
Engineering 29,000,000R$ 4.3%
First fill / Start Up 1,356,197R$ 0.2%
Management 11,342,999R$ 1.7%
Engineering Insurance 2,100,000R$ 0.3%
Erection Supervision 1,302,413R$ 0.2%
Owner team 15,171,690R$ 2.3%
Social projects 1,600,000R$ 0.2%
Legal Costs 1,800,000R$ 0.3%
Environment 5,500,000R$ 0.8%
-R$ 0.0%
674,000,000R$ 100%
323,106,424USD
OVERALL TOTAL %
%
Contingency
Account Description
Total
DESCRIPTION UNIT 2013 2014 2015 2016 2017 2018 2019
Mining Cost USD/t SSP 56.20 31.98 31.11 33.08 38.04 33.86 35.28
Labour Cost USD/t SSP 26.22 12.53 12.55 12.55 12.59 12.83 12.59
Maintenance Cost USD/t SSP 8.52 4.26 4.26 4.26 4.28 4.36 4.28
Energy Cost USD/t SSP 15.39 10.46 10.54 10.55 10.55 10.54 10.55
Reagents Cost USD/t SSP 39.99 35.08 34.96 34.96 34.97 34.94 34.96
Sulfur Cost USD/t SSP 36.62 28.05 26.97 26.97 26.97 26.95 26.97
Ammonia Cost USD/t SSP 13.02 14.64 14.62 14.62 14.63 14.61 14.62
CFEM USD/t SSP 2.19 1.29 1.28 1.32 1.42 1.33 1.36
TOTAL USD/t SSP 198.15 138.29 136.29 138.30 143.44 139.44 140.61

Amazon GeoServices Ltda ABN 52 065 481 209 Mineral Resource Estimate - Arraias Phosphate Project, Para State, Brazil – MBAC Page: 149 Effective Date – 27 March 2013
6005 Australia
22.1 Principal Assumptions
When constructing the model we considered all prices FOB MBAC site (Arrais – TO). The
current Single Super Phosphate (“SSP”) price is considered in the model as a projected price
for the life of the mine levied by 2% inflation (CPI) on a yearly basis after 2014. All costs in
Brazilian Reais were levied by the estimated inflation of 4.5% (IGPM) on a yearly basis.
We are also assuming that the recovery of P2O5 during the mine life is 53% and that the
increase in the operating cost after the first years is a result of the estimated decrease of the
P2O5 grade during the mine life.
The principal assumptions made in the DCF model are summarised in Table 22_1:
Table 22_1 – Input Factors for DCF Model
DESCRIPTION Value Proven and probable reserves (million tonnes) 64.8
Mine life (years) 19
CAPEX ($ millions) $323.1
Payback period (years) 4.5
SSP Selling Price 2013 per tonne (FOB Arraias – US$) $280
SSP Selling Price 2014 per tonne (FOB Arraias – US$) $325
Sulphur Price per tonne (CIF Arraias – US$) $240
Ammonia Price per tonne (CIF Arraias – US$) $1,200
Grinding Ball Price per tonne (CIF Arraias – US$) $1,781
Sodium Silicate Price per tonne (CIF Arraias – US$) $352
Caustic Soda Price per tonne (CIF Arraias – US$) $467
Soybean Oil Price per tonne (CIF Arraias – US$) $1,514
Energy (US$/Mwh) $87
Operating cost (SSP) p/tonne – first 5 years (excl. 2013) 139
Operating cost (SSP) p/tonne – over mine life (US$ 2013) 1612
Foreign exchange (BRL/USD) 2.1
Average run-of-mine (“ROM”) P2O5 grade – first 10 years 5.56%
Average run-of-mine (“ROM”) P2O5 grade – over mine life 5.08%
Discount Rate (WACC) 10.00%
CPI per year 2.00%
Brazilian CPI per year (IGPM) 4.50%
Plant Recovery for P2O5 53.0%
22.2 Cash Flow forecast
After applying all the assumptions, the DCF model has a NPV of USD 254.2m, an IRR of 21%
and payback period of 4.5 years. The cash flow forecast can be seen in Table 22_2.
22.3 Taxes and Royalties
The Brazilian corporate income tax rate is 34%, but because of fiscal incentives the tax will be
reduced to 15.25% for the next 10 years, between 2013 and 2022. The DCF model already
incorporates these fiscal incentives.

Amazon GeoServices Ltda ABN 52 065 481 209 Mineral Resource Estimate - Arraias Phosphate Project, Para State, Brazil – MBAC Page: 150 Effective Date – 27 March 2013
6005 Australia
The royalties for the Brazilian government are 2% of the revenue of the selling of mineral
products. However, considering the fact that MBAC is selling SSP that have already been
transformed through a chemical process, MBAC royalties on the Itafós Project are calculated
based on the cost of the mineral products. This refers to the productions cost up to the
beneficiation of that ore.
22.4 Sensitivity Analysis
Although the Itafós Project is now in its final stage of construction there are always
uncertainties in any new venture. That is why it was necessary to present the effect of
changes in the major components that can still affect the project, in the form of sensitivity
analyses.
The NPV is most sensitive to changes in SSP price than any other factor, but changes in
variable cost also significantly impact the NPV. If facing lower SSP prices the company should
focus on variable cost reductions to lower the impact on the NPV.
-10% -5% 0% +5% +10%
375 443.4 430.2 417.0 403.8 390.6
350 361.5 348.4 336.3 323.1 309.9
325 280.6 267.4 254.2 240.9 227.7
300 198.3 185.1 171.9 158.7 145.5
275 116.0 103.9 90.6 77.3 64.0
PROJECT NPV (USD m)
SSP PRICE
CAPEX Variation (%)
-10% -5% 0% +5% +10%
375 483.3 450.2 417.0 384.7 351.7
350 401.4 368.3 336.3 303.0 269.6
325 319.5 287.4 254.2 220.8 187.4
300 238.4 205.2 171.9 138.6 106.2
275 156.2 122.9 90.6 57.0 23.2
Total Cost Variation (%)
SSP PRICE
PROJECT NPV (USD m)

Amazon GeoServices Ltda ABN 52 065 481 209 Mineral Resource Estimate - Arraias Phosphate Project, Para State, Brazil – MBAC Page: 151 Effective Date – 27 March 2013
6005 Australia
Table 22_2: DCF Model
PRODUCTION UNITS 2013 2014 2015 2016 2017 2018 2019 2020 2021 2022 2023 2024 2025 2026 2027 2028 2029 2030 2031
Ore Available (000 tonnes) 64,811 62,561 59,526 56,508 53,490 50,405 47,462 44,400 41,456 37,613 33,946 30,172 26,453 22,688 18,881 15,084 11,353 7,564 3,795
Processed Ore (000 tonnes) 2,250 3,035 3,018 3,018 3,085 2,944 3,062 2,944 3,843 3,667 3,773 3,720 3,765 3,807 3,797 3,731 3,789 3,769 3,795
Processed P2O5 Grade (%) 5.79% 5.77% 5.78% 5.78% 5.78% 5.79% 5.79% 5.78% 4.67% 4.70% 4.63% 4.67% 4.59% 4.62% 4.67% 4.63% 4.54% 4.64% 4.54%
Plant Recovery Factor P2O5 (%) 33.7% 53.0% 53.0% 53.0% 53.0% 53.0% 53.0% 53.0% 53.0% 53.0% 53.0% 53.0% 53.0% 53.0% 53.0% 53.0% 53.0% 53.0% 53.0%
Concentrate Phosphate Produced (000 tonnes) 156.8 312.8 311.8 311.9 310.8 304.7 310.8 304.2 301.7 301.7 301.7 301.7 301.7 301.7 301.7 301.7 301.7 301.7 298.0
Sulphuric Acid Consumed (000 tonnes) 84.3 180.4 173.1 173.2 172.5 169.2 172.5 168.9 167.5 167.5 167.5 167.5 167.5 167.5 167.5 167.5 167.5 167.5 165.4
SSP Produced (000 tonnes) 220.2 518.4 516.8 516.9 515.0 505.0 515.0 504.1 500.0 500.0 500.0 500.0 500.0 500.0 500.0 500.0 500.0 500.0 493.9 CASH FLOW
Sales Revenue (USD '000) 93,033 203,418 209,647 214,340 219,084 219,988 228,856 229,666 234,926 239,172 244,947 250,353 255,902 262,253 268,501 273,864 280,030 287,024 290,844
(-) Sales Costs and Expenses (USD '000) (15,022) (24,153) (25,815) (26,800) (27,940) (28,635) (30,090) (30,863) (32,395) (33,352) (34,754) (36,066) (37,434) (39,059) (40,673) (42,030) (43,650) (45,555) (47,119)
Net Revenue (USD '000) 78,011 179,266 183,832 187,540 191,144 191,354 198,765 198,804 202,531 205,820 210,193 214,287 218,468 223,194 227,828 231,835 236,380 241,470 243,726
(-) Fixed Costs (USD '000) (3,058) (2,508) (2,661) (2,714) (2,775) (2,864) (2,887) (2,983) (3,057) (3,118) (3,180) (3,244) (3,309) (3,375) (3,442) (3,511) (3,581) (3,653) (3,753)
(-) Variable Costs (USD '000) (53,723) (79,505) (79,823) (81,710) (85,097) (82,606) (85,602) (87,474) (100,028) (102,019) (104,988) (107,132) (107,978) (106,799) (111,337) (105,979) (100,099) (101,845) (100,152)
(-) CFEM (USD '000) (155) (160) (163) (166) (178) (169) (183) (176) (200) (189) (198) (200) (201) (213) (220) (214) (216) (228) (228)
(-) G&A (USD '000) (6,565) (7,718) (7,873) (8,030) (8,191) (8,354) (8,522) (8,692) (8,866) (9,043) (9,224) (9,408) (9,597) (9,789) (9,984) (10,184) (10,388) (10,595) (10,807)
EBITDA (USD '000) 14,510 89,374 93,312 94,919 94,904 97,361 101,573 99,479 90,380 91,452 92,603 94,302 97,383 103,019 102,844 111,947 122,095 125,148 128,786
(-) Depreciation & Depletion (USD '000) (23,850) (24,732) (25,080) (25,453) (25,886) (26,161) (26,651) (26,960) (28,086) (28,366) (28,878) (29,272) (29,753) (30,240) (30,695) (8,908) (8,619) (8,241) (7,094)
EBIT (USD '000) -9,340 64,642 68,232 69,466 69,018 71,200 74,922 72,520 62,294 63,086 63,725 65,031 67,631 72,779 72,149 103,039 113,477 116,907 121,692
(-) Income Taxes (USD '000) (118) (5,337) (8,750) (9,404) (9,783) (10,449) (11,338) (11,017) (9,504) (9,625) (21,676) (22,120) (23,004) (24,755) (24,540) (35,043) (38,592) (39,758) (41,115)
(+) Depreciation & Amortization (USD '000) 23,850 24,732 25,080 25,453 25,886 26,161 26,651 26,960 28,086 28,366 28,878 29,272 29,753 30,240 30,695 8,908 8,619 8,241 7,094
(+/-) Change in Working Capital (USD '000) (13,448) (1,813) (3,495) (390) (444) 83 (743) (85) (837) (360) (491) (433) (386) (347) (578) (113) (137) (500) 22,278
(-) Capital Expenditures (USD '000) (83,667) (4,979) (5,450) (5,559) (5,670) (5,783) (5,899) (6,017) (6,137) (6,260) (6,385) (6,513) (6,643) (6,776) (6,912) (7,050) (7,191) (7,335) -
Project Cash Flow (82,721.83) 77,245.45 75,617.86 79,566.38 79,007.15 81,210.76 83,592.77 82,360.38 73,901.95 75,207.34 64,050.92 65,236.49 67,349.77 71,140.59 70,814.03 69,740.56 76,175.94 77,555.52 109,949.25
(-) CAPEX 2012 (USD '000) (242,800)
WACC (%) 10%
PROJECT NPV (USD '000) 254,155
IRR (%) 21%

Amazon GeoServices Ltda ABN 52 065 481 209 Mineral Resource Estimate - Arraias Phosphate Project, Para State, Brazil – MBAC Page: 152 Effective Date – 27 March 2013
6005 Australia
23 ADJACENT PROPERTIES
There are no adjacent or nearby phosphate permits to those of MBAC.
24 OTHER RELEVANT DATA AND INFORMATION
MBAC is not aware of other relevant data pertaining to the Itafós Project.

Amazon GeoServices Ltda ABN 52 065 481 209 Mineral Resource Estimate - Arraias Phosphate Project, Para State, Brazil – MBAC Page: 153 Effective Date – 27 March 2013
6005 Australia
25 INTERPRETATION AND CONCLUSIONS
MBAC has undertaken a systematic exploration program that has been successful in defining
significant resources of phosphate in close proximity to one of the largest agricultural centres
in Brazil.
Further scope exists to improve the geological and mineral resource estimation confidence in
the regions currently defined as an inferred mineral resource.
Given increased geological knowledge from current mining activity along with minor limitations
identified by AMS in the current mineral resource estimate, AMS recommends that an
updated mineral resource for all domains be undertaken.
AMS concludes that there are no fatal flaws in the current resource data.
The pertinent observations and interpretations which have been developed in producing this
report are detailed in the sections above.
The Itafós Project deposit, encompassing Domingos, Canabrava and Near Mine, represents a
significant ore reserve.
The mine plan has not been fully optimized and it is likely that further scheduling work will
smooth out some of the grade and ore extraction variations seen in this study. The optimized
mine plan may mean that higher-grade ore is available to the mill sooner in the schedule, thus
having a positive effect on the discounted cash flow.
Finally, the economics of the project present a very positive rate of return for the investment.
Even considering possible variations in the sales price, operating costs and others as seen in
the sensitivity analysis the project economics can be considered very attractive

Amazon GeoServices Ltda ABN 52 065 481 209 Mineral Resource Estimate - Arraias Phosphate Project, Para State, Brazil – MBAC Page: 154 Effective Date – 27 March 2013
6005 Australia
26 RECOMMENDATIONS
26.1 Exploration and Resources
Drilling and studies completed to date have defined a mineral resource at the Itafós Project.
The data collected is considered to be of moderate quality and suitable for resource
estimation.
Further scope exists to improve the geological and mineral resource estimation confidence in
the regions currently defined as an inferred mineral resource. AMS makes the following
specific recommendations:
Infill drilling across the Domingos and Canabravas domains to a 50m by 50m spacing in
order to quantify further Measured resource category material.
Given increased geological knowledge from current mining activity (which will allow more
detailed domain modelling mainly focussed on the limits of breccia zones), along with
minor limitations identified by AMS in the current mineral resource estimate, AMS
recommends that an updated mineral resource for all domains be undertaken.
26.2 Mineral Resource and Evaluation Budget
MBAC has also provided AMS with an ongoing exploration and evaluation budget,
summarised in Table 26.2_1 below.
Table 26.2_1
Itafós Project
Proposed Resource and Evaluation Expenditure
Activity Total (US$)
Infill Drilling (50 x 50m Grid) $ 300,000
Assay Testwork $ 30,000
Updated Resource Studies $ 40,000
Travel and accommodation $ 20,000
Field supervision and support $ 30,000
Administration $ 30,000
Sub-total $ 450,000
The proposed expenditure of US$ 450,000 is considered to be consistent with the potential of
the Itafós Project and is adequate to cover the costs of the proposed programs.
Other recommendations as mine plan optimization will be pursued by the own team of the
project management, and the costs are already included as operating costs.

Amazon GeoServices Ltda ABN 52 065 481 209 Mineral Resource Estimate - Arraias Phosphate Project, Para State, Brazil – MBAC Page: 155 Effective Date – 27 March 2013
6005 Australia
27 REFERENCES
AusIMM. 1995. Code and Guidelines for Assessment and Valuation of Mineral Assets and
Mineral Securities for Independent Expert Reports (The Valmin Code) Issued April
1998. AusIMM.
AusIMM. 1998. Code and Guidelines for Assessment and Valuation of Mineral Assets and
Mineral Securities for Independent Expert Reports (The Valmin Code), issued April
1998. The Australasian Institute of Mining and Metallurgy.
MBAC (Oct, 2010) - Technical Report on Arraias Tocantins Feasability Study

Amazon GeoServices Ltda ABN 52 065 481 209 Mineral Resource Estimate - Arraias Phosphate Project, Para State, Brazil – MBAC Page: 156 Effective Date – 27 March 2013
6005 Australia
28 DATE AND SIGNATURE PAGE
The “qualified persons” (within the meaning of NI43-101) for the purposes of this report are
Beau Nicholls, who is an associate of AMS and Bradley Ackroyd, who is an employee of
AMS, Carlos Guzmán from NCL and Homero Delboni from HDA.
The effective date of this report is 27 March, 2013.
(signed by)
Beau Nicholls B.Sc Geol.
MAIG
Associate Consulting Geologist Andes Mining Services Ltd.
Signed on the 27 March 2013
(signed by)
Bradley Ackroyd B.Sc Geol.
MAIG
Principal Consulting Geologist Andes Mining Services Ltd.
Signed on the 27 March 2013
(signed by)
Carlos Guzmán Principal Mining Engineer
NCL Brasil Ltda
Signed on the 27 March 2013
(signed by)
Homero Delboni HDA Serviços S/SLtda
Signed on the 27 March 2013

Amazon GeoServices Ltda ABN 52 065 481 209 Mineral Resource Estimate - Arraias Phosphate Project, Para State, Brazil – MBAC Page: 157 Effective Date – 27 March 2013
6005 Australia
29 CERTIFICATES OF QUALIFIED PERSONS
Andes Mining Services Ltd.
Certificate of Qualified Person
I, Beau Nicholls, do hereby certify that:
1. I have been working since 2010 as an Associate Consulting Geologist with the firm Andes Mining Services
Ltd. of Avenue Diagonal 550, Departmento 203, Miraflores, Lima, Peru 18. . My residential address is 463
Alameda Das Quaresmeiras, Rio Acima - MG, Brazil, CEP - 34300-000
2. I am a practising geologist with 18 years of Mining and Exploration geological experience. I have worked in
Australia, Eastern Europe, West Africa and the Americas. I am a member of the Australian Institute of
Geoscientists (“MAIG”)
3. I am a graduate of Western Australian School of Mines – Kalgoorlie and hold a Bachelor of Science Degree
in Mineral Exploration and Mining Geology (1994)
4. I have practiced my profession continuously since 1995
5. I am a “qualified person” as that term is defined in National Instrument 43-101 Standards of Disclosure for
Mineral Projects (the “Instrument”)
6. I have not visited the Itafos Arraias SSP Project Project.
7. I am responsible for sections 7 to 12, and jointly responsible for sections 1 to 7 and 23 to 26 of the technical
report dated effective 27 March 2013 and titled “Updated Technical Report Itafós Arraias SSP Project,
Tocantins State, Brazil”(the “Report”)
8. I am independent of MBAC Fertilizer Corp pursuant to section 1.5 of the Instrument
9. I have read the Instrument and Form 43-101F1 (the “Form”) and the Report has been prepared in
compliance with the Instrument and the Form
10. I do not have nor do I expect to receive a direct or indirect interest in the Itafos Arraias SSP Project of
MBAC Fertilizer Corp and I do not beneficially own, directly or indirectly, any securities of MBAC Fertilizer
Corp or any associate or affiliate of such company
11. I have been involved with MBAC Fertilizer Corp for two years
12. As of the date of this certificate, to the best of my knowledge, information and belief, the Report contains all
scientific and technical information that is required to be disclosed to make the Report not misleading.
Dated at Belo Horizonte, Brazil, on March 27th, 2013
(signed by)
Beau Nicholls BSc(Geology) MAIG
Associate Consulting Geologist

Amazon GeoServices Ltda ABN 52 065 481 209 Mineral Resource Estimate - Arraias Phosphate Project, Para State, Brazil – MBAC Page: 158 Effective Date – 27 March 2013
6005 Australia
Andes Mining Services Limited
Certificate of Qualified Person
I, Bradley Ackroyd, do hereby certify that:
1. I have been working since 2012 as a Principal Consulting Geologist with the firm Andes Mining Services
Ltd. of Avenue Diagonal 550, Departmento 203, Miraflores, Lima, Peru 18. My residential address is Jose
Pardo 1040, Miraflores, Lima, Peru 27.
2. I am a practising geologist with 12 years of Mining and Exploration geological experience. I have worked in
Australia, PNG, West Africa and the Americas. I am a member of the Australian Institute of Geoscientists -
Member (MAIG).
3. I am a graduate of the University of Western Australia (UWA) and hold a Bachelor of Science Degree in
Geology (Hons) (2000).
4. I have practiced my profession continuously since 2001.
5. I am a “qualified person” as that term is defined in National Instrument 43-101 Standards of Disclosure for
Mineral Projects (the “Instrument”).
6. I have visited the Itafos Arraias SSP Project between the 25th and 27th February 2013.
7. I am responsible for section 14, and jointly responsible for sections 7 to 12 of the technical report dated
effective 27 March 2013 and titled “Updated Technical Report Itafós Arraias SSP Project, Tocantins State,
Brazil”(the “Report”)
8. I am independent of MBAC Fertilizer Corp pursuant to section 1.5 of the Instrument.
9. I have read the Instrument and Form 43-101F1 (the “Form”) and the Report has been prepared in
compliance with the Instrument and the Form.
10. I do not have nor do I expect to receive a direct or indirect interest in the Itafós Arraias SSP Project of
MBAC Fertilizer Corp and I do not beneficially own, directly or indirectly, any securities of MBAC Fertilizer
Corp or any associate or affiliate of such company.
11. I have been involved with MBAC Fertilizer Corp for one year.
12. As of the date of this certificate, to the best of my knowledge, information and belief, the Report contains all
scientific and technical information that is required to be disclosed to make the Report not misleading.
Dated in Lima, Peru, on March 27th
, 2013
(signed by)
Bradley Ackroyd BSc(Geo) Member (MAIG)
Principal Consulting Geologist

Amazon GeoServices Ltda ABN 52 065 481 209 Mineral Resource Estimate - Arraias Phosphate Project, Para State, Brazil – MBAC Page: 159 Effective Date – 27 March 2013
6005 Australia
Certificate of Qualified Person
I, Homero Delboni Junior of HDA Serviços S/S Ltda., together with Bradley Ackroyd and Beau Nichols from
Andes Mining and Carlos Guzman from NCL, prepared the report entitled "Updated Technical Report
Itafós Arraias SSP Project, Tocantins State, Brazil " dated March 27, 2013 prepared for MBAC Fertilizer
Corp. (the "Technical Report") do hereby certify that:
1. I am the Owner of HDA Serviços S/S Ltda. with registration number of CNPJ 01.750.221/0001-40 of
Rua Cel. Raul Humaitá Vila Nova, 44 cj.61 – Indianópolis São Paulo, SP 04522-010.
2. I graduated with a Bachelor of Engineering Degree in Mining and Minerals Processing from USP
(Brazil) in 1983, concluded a Masters in Engineering in Minerals Processing in USP (Brazil) in
1989 and obtained a Ph.D. in Minerals Processing Engineering at UQ – Julius Kruttschnitt Mineral
Research Centre, Brisbane (Australia) in 1999.
3. I am a Member of the CIM - Canadian Institute of Mining, Metallurgy and Petroleum; and a
registered member of SME - Society for Mining, Metallurgy and Exploration.
4. I have worked as a Minerals Processing engineer for a total of 30 years since my graduation from
university.
5. I have read the definition of "qualified person" set out in National Instrument 43-101 ("NI 43-101") and
certify that by reason of my education, affiliation with a professional association (as defined by NI 43-
101), and my past relevant work experience, I fulfill the requirements to be a "qualified person" for the
purposes of NI 43-101.
6. I have read the NI43-101 and this Independent Technical Report titled "Updated Technical Report
Itafós Arraias SSP Project, Tocantins State, Brazil” (the "Technical Report"), dated March 27th, 2013
has been prepared in compliance with the NI 43-101 guidelines.
7. I am responsible for the preparation required under NI 43-101 for section 13 and sections 17 to 22 of
the report entitled “Updated Technical Report Itafós Arraias SSP Project, Tocantins State, Brazil”
8. As of the amendment date of the Technical Report, to the best of my knowledge, information and belief
the Technical Report contains all the scientific and technical information that is required to be disclosed
to make the Technical Report not misleading.
9. I am independent of MBAC Fertilizer Corp pursuant to section 1.5 of the Instrument.
10. As of the date of this certificate, to the best of my knowledge, information and belief, the Report contains
all scientific and technical information that is required to be disclosed to make the Report not misleading. Signed and dated this 27th day of March, 2013
Homero Delboni Junior, Ph.D. HDA Serviços S/S Ltda.

Amazon GeoServices Ltda ABN 52 065 481 209 Mineral Resource Estimate - Arraias Phosphate Project, Para State, Brazil – MBAC Page: 160 Effective Date – 27 March 2013
6005 Australia
Certificate of Qualified Person
I, Carlos Guzmán of NCL Brasil Ltda, do hereby certify that:
1. I am a Principal Mining Engineer of NCL Brasil Ltda, with a business address at Alameda da
Serra 500/315, Nova Lima, Minas Gerais, Brazil.
2. I am a graduate of the Universidad de Chile and hold a Mining Engineer title (1995).
3. I am a practicing mining engineer registered with the Australasian Institute of Mining and
Metallurgy (FAusIMM 229036) and Registered Member of the Chilean Mining Commission.
4. I have practiced my profession continuously since 1995.
5. I have read the definition of "qualified person" set out in National Instrument 43-101 ("NI 43-
101") and certify that by reason of my education, affiliation with a professional association (as
defined by NI 43-101), and my past relevant work experience, I fulfill the requirements to be a
"qualified person" for the purposes of NI 43-101.
6. I have read the Canadian National Instrument 43-101 and this Independent Technical
Report titled “Updated Technical Report Itafós Arraias SSP Project, Tocantins State, Brazil”
(the "Technical Report"), dated March 27th, 2013 has been prepared in compliance with this
Instrument and Form 43-101F1.
7. My most recent visit to the Project was on April 6th, 2010, for the purposes of inspection on the
Property.
8. I am responsible for the reserves estimate and mining study, specifically sections 15 and 16 and
also jointly responsible for sections 23 to 26 of the Technical Report.
9. As of the date of the Technical Report, to the best of my knowledge, information and belief the
Technical Report contains all scientific and technical information that is required to be disclosed
to make the Technical Report not misleading. I am not aware of any material fact or material
change with respect to the subject matter of the Technical Report that is not reflected in the
Report, the omission to disclose which makes the Technical Report misleading.
10. I am independent of MBAC Fertilizer Corp. as defined by Section 1.5 of NI 43-101.
11. I have had prior involvement with the Property that is subject of the Technical Report and MBAC
Fertilizer Corp for three years.
Dated and signed, March 27th, 2013
(signed by)
Carlos Guzmán – NCL Brasil Ltda.
Principal Mining Engineer (FAusIMM , RM Chilean Mining Commission)

Amazon GeoServices Ltda ABN 52 065 481 209 Mineral Resource Estimate - Arraias Phosphate Project, Para State, Brazil – MBAC Page: 161 Effective Date – 27 March 2013
6005 Australia
A P P E N D I C E S

Amazon GeoServices Ltda ABN 52 065 481 209 Mineral Resource Estimate - Arraias Phosphate Project, Para State, Brazil – MBAC Page: 162 Effective Date – 27 March 2013
6005 Australia
A P P E N D I X 1 – C A P E X
0050 -
Infrastructure 2000 - Beneficiation 2700 - Shipment 3000 - Acidulation 4000 - Granulation 5000 - Acid Plant
5050 - Inputs /
Reagents
6000 - Utility
Systems
7000 - Administration
and Plant Ancillary
Facilities
8000 - Power,
Automation and
Telecommunication
Equipment Electrical - 2,253,606 - 868,962 - - - 187,781 - 26,146,651 29,457,000R$ 4.4%
Mechanical - 73,602,306 533,160 10,343,611 25,591,498 76,301,049 3,641,001 8,173,476 198,898 - 198,385,000R$ 29.4%
Spare Parts - - - - - 366,780 - - - - 366,780R$ 0.1%
Materials Electrical - - - - - - - - - 6,041,424 6,041,424R$ 0.9%
Miscelaneous, including electrical equipment - - - - - 7,736,800 - - - - 7,736,800R$ 1.1%
Steel Structure 5,165,650 16,982,730 5,554,920 5,021,288 17,982,745 - 714,457 - 2,028,210 - 53,450,000R$ 7.9%
Instrumentation / Telecommunication - 1,540,335 531,549 391,466 385,702 - 669,347 507,890 - 1,077,740 5,104,029R$ 0.8%
Miscelaneous - 19,621,590 141,074 3,097,912 7,820,124 - 1,061,299 2,434,412 57,713 - 34,234,123R$ 5.1%
Piping - 9,050,529 - 146,948 - - 226,721 10,341,147 - - 19,765,345R$ 2.9%
Cataliser - - - - - 7,507,200 - - - - 7,507,200R$ 1.1%
Erection Electro-mechanical erection - 30,046,958 1,460,364 4,909,975 12,315,055 35,521,613 1,768,777 7,241,633 431,216 9,304,410 103,000,000R$ 15.3%
Civil Works Civil 3,630,739 20,236,475 1,049,313 1,863,510 5,401,251 15,396,196 1,578,976 88,316 1,142,471 2,612,753 53,000,000R$ 7.9%
Archtecture - - - - - - - - 16,453,423 - 16,453,423R$ 2.4%
Dams 29,000,000 - - - - - - - - - 29,000,000R$ 4.3%
Infrastructure 27,456,987 - - - - - - - - - 27,456,987R$ 4.1%
Indirect Comissioning and training 206,419 722,810 35,143 107,611 275,197 - 45,301 138,252 26,656 - 1,557,390R$ 0.2%
Land Acquisition 8,000,000 - - - - - - - - - 8,000,000R$ 1.2%
MECS Technology - - - - - 4,311,200 - - - - 4,311,200R$ 0.6%
Engineering 2,551,517 8,934,581 434,394 1,330,172 3,401,683 9,749,275 559,961 1,708,919 329,497 - 29,000,000R$ 4.3%
First fill / Start Up 121,434 425,222 20,674 63,307 161,896 440,000 26,650 81,332 15,682 - 1,356,197R$ 0.2%
Management 1,503,417 5,264,474 255,955 783,770 2,004,355 - 329,943 1,006,937 194,148 - 11,342,999R$ 1.7%
Engineering Insurance 278,337 974,645 47,387 145,104 371,079 - 61,084 186,421 35,944 - 2,100,000R$ 0.3%
Erection Supervision - 746,490 5,367 117,858 297,511 - 40,376 92,616 2,196 - 1,302,413R$ 0.2%
Owner team 1,810,986 4,554,094 238,905 696,395 1,810,355 3,571,349 259,109 778,902 469,748 981,847 15,171,690R$ 2.3%
Social projects 1,600,000 1,600,000R$ 0.2%
Legal Costs 1,800,000 1,800,000R$ 0.3%
Environment 5,500,000 5,500,000R$ 0.8%
- - - - - - - - - - -R$ 0.0%
88,625,485R$ 194,956,846R$ 10,308,204R$ 29,887,890R$ 77,818,450R$ 160,901,462R$ 10,983,001R$ 32,968,035R$ 21,385,802R$ 46,164,825R$ 674,000,000R$ 100%
13% 29% 2% 4% 12% 24% 2% 5% 3% 7% 323,106,424USD
OVERALL TOTAL
AREA
%
%
Contingency
Account Description
Total