updates and future directions of indian power sector · updates and future directions of indian...
TRANSCRIPT

Updates and Future
Directions of Indian
Power Sector
Rajeev Kumar
Director, TPRM Division
Central Electricity Authority
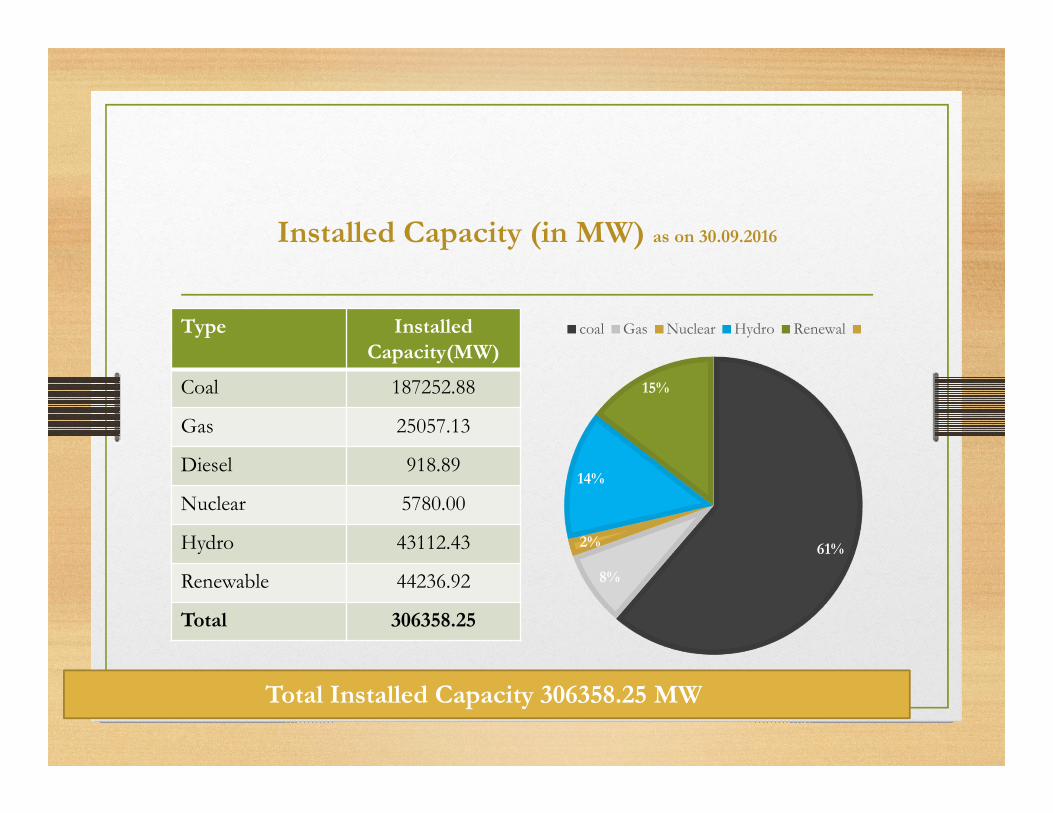
Type Installed
Capacity(MW)
Coal 187252.88
Gas 25057.13
Diesel 918.89
Nuclear 5780.00
Hydro 43112.43
Renewable 44236.92
Total 306358.25
61%
8%
2%
14%
15%
coal Gas Nuclear Hydro Renewal
Total Installed Capacity 306358.25 MW
Installed Capacity (in MW) as on 30.09.2016
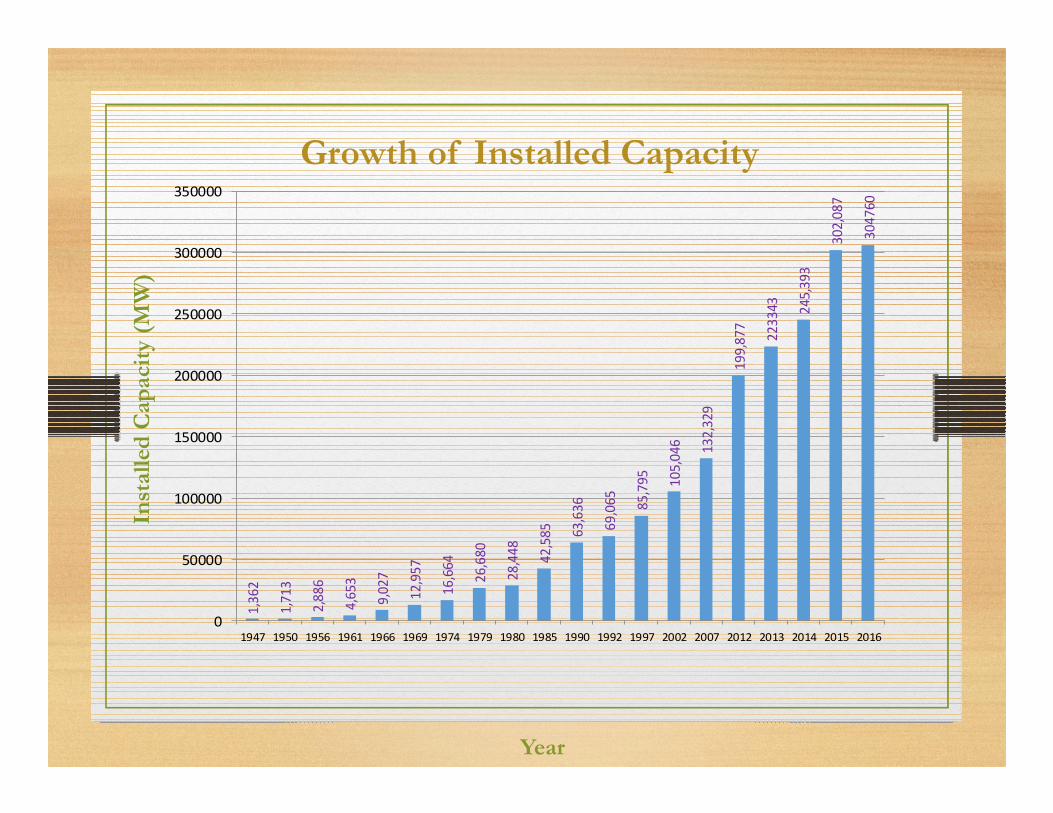
1,362
1,713
2,886
4,653
9,027
12,957
16,664
26,680
28,448
42,585
63,636
69,065
85,795
105,046
132,329
199,877
223343
245,393
302,087
304760
0
50000
100000
150000
200000
250000
300000
350000
1947 1950 1956 1961 1966 1969 1974 1979 1980 1985 1990 1992 1997 2002 2007 2012 2013 2014 2015 2016
Installed
Capacity (MW)
Year
Growth of Installed Capacity

Power Supply Position in India September 2016
Requirement Availability Deficit(MU) Deficit
(%)
Northern
Region 33300 32646 -654 -2
Western Region 28683 28679 -4 0.0
Southern
Region24689 24686 -3 0.0
Eastern
Region10976 10964 -12 -0.1
North-Eastern
Region1373 1336 -37 -2.7
All India 99021 98310 -711 -0.7
Energy(MU)

Power Supply Position in India September 2016
Requirement Availability Deficit(MW) Deficit
(%)
Northern
Region 52772 51816 -956 -1.8
Western Region 46100 46000 -100 -0.2
Southern
Region40654 40592 -61 -0.2
Eastern
Region18227 18210 -17 -0.1
North-Eastern
Region2430 2373 -57 -2.3
All India 159243 158059 -1185 -0.7
Peak(MW)

Capacity Addition Plan during 12th(2012-17) Plan
Hydro1089712%
Nuclear53006%
Thermal7234082%
CAPACITY(EXCLUDING RENEWABLE) IN MW

Capacity Addition Target Vs Achievements in the 12th Plan
Target Achievement
Type Figure in MW %
Thermal 72340 83788.20 115.5
Hydro 10897 4140.02 78
Nuclear 5300 1000 18.8
Total 88537 88928.22 100.44 0
10000
20000
30000
40000
50000
60000
70000
80000
90000
100000
Thermal Hydro Nuclear Total
12th Plan Target Vs Achievement
Target Achivement

Solar17,82351%
Wind13,60939%
Small Hydro1,1043%
Biomass
2,2197%
TOTAL :34,755
LIKELY CAPACITY ADDITION
Solar1000033%
Wind1500050%
Small Hydro
+ Bioma
ss500017%
Target
TOTAL: 30,000
FIGURES in MW
Renewable Capacity Addition During 12th Plan

All India PLF Sector-wise for Sept., 2016
% PLF
Sector Sept’2015 Sept’2016
Central 69.92 70.85
State 58.99 40.09
Private 64.21 57.29
All India 64.18 58.13
0
10
20
30
40
50
60
70
80
Central State Private All India
Chart Title
Sept'15 Sept'16

Capacity Addition(in MW) Plan during 13th
Plan (2017-22) (tentative )
Type Capacity in
MW
Coal 56400
Nuclear 18000
Hydro 12000
Hydro Import 8040
Total 86400
60%19%
13%
8%
Coal Nuclear Hydro Hydro Import

Unit Size (MW) Steam Parameters Design Efficiency (%)
Share in capacity
(%)
<100 60/ 482, 90/ 535 ~31 5%
100 to150 130/ 535/535 35-36 9%
200/210 130,150/535/535 36.3,37.8 26%
250 150/535/535 38.3 9%
300-350 170/ 538/538 38.5 6%
500 170/ 538/538 (565) 38.5 (38.7) 27%
600 170/ 538/538 38.5 8%
660/700/800 247/565/593 40.5 10%
Total100%
Efficiency - Gross efficiency based on HHV
Coal Fired Units – Sizes, Efficiency & Share

12
Capacity
Range (in
MW)
> 15 years
but <20
years
>20 years
but < 30
years
> 30 years Total
200/210 LMZ 1 25 40 66
200/210 KWU 24 52 9 85
250 7 - - 7
500 5 16 - 21
TOTAL 37 93 49 169
Age Profile of Potential
Thermal Units for R&M/Retirement/Replacement (as on March-2016)

Unit Size (MW)
Parameters Design Efficiency
* Gross on HHV
660 247kg/cm2 538/565 O C 39.5 %
247kg/cm2 565/593 O C 40.5 %
700/ 800 247kg/cm2 565/593 O C 40.5 %
Expected Efficiency Gain of ~ 5% over sub- critical 500 MW
Units (170 kg/cm2 535/535 oC)

Unit Size (MW) No. of units Total Capacity (MW)
660 40 26400
685/700 2/3 3470
800 8 6400
Total: 53 36270

Unit Size (MW)
No. of Units Total Capacity (MW)
660 51 33660
800 19 15200
Total: 70 48860

INDIA AIMING EMISSION REDUCTION IN POWER SECTOR
In continuing efforts to safeguard the environment and reduce emissions frompower sector, India has made the following commitments in COP 21:
� India intends to reduce the emissions intensity of its GDP by 33 to 35 % by 2030
from 2005 level.
� To achieve about 40 percent cumulative electric power installed capacity
from non-fossil fuel based energy resources by 2030 with the help of
transfer of technology and low cost international finance.
� Introducing new, more efficient and cleaner technologies in thermal power
generation
� Further, to reduce emissions from Thermal Power Stations, Ministry of
Environment, Forest and Climate Change has also issued new environmental
norms in December 2015 regarding Suspended Particulate matter (SPM), SOx,
NOx, Mercury. Norms for specific water consumption by Thermal Power
Stations have also been notified to conserve water.� The present installed capacity of coal based thermal power plants is 1,87,252
MW as on 30.09.2016 and around 70000 MW is under construction. Theimpact of the environmental norms on thermal power generation is understudy

Govt’s Thrust Areas
• Solar Mission
• Rural Electrification
• Distribution reform

� Government of India revised target of Jawaharlal Nehru National Solar Mission (JNNSM) to generate 100,000 MW by 2022 — five times the previous target.
�The target will comprise 40 GW power generated through rooftop units and 60 GW through large and medium scale grid connected solar power projects.
�JNNSM was launched in 2009 with a target for grid connected solar projects of 20,000 Mw by 2022.
�The total investment in setting up projects with capacity of 100 GW will be around Rs 6 lakh crore
�The new Solar target of 100 GW is expected to abate over 170 million tonnes of co2 over its life cycle.
Solar Mission

� With 50,025 MW of coal based capacity expected between 2017-22 along
with the committed capacity of 22,470 MW from Hydro, Nuclear and
Gas, there may not be any further requirement of additional capacity
during 2017-22.Further,for 2022-27, capacity addition requirement will be
assessed based on Mid term Review of Demand.
� The Plant load factor of the coal based power plants may vary between
50% to 60% depending upon variation in Electricity Demand and
achievement in capacity addition from conventional and Renewable
Energy Sources.
� Total coal requirement may be around 730-800 MT in 2021-22
Road Ahead for Thermal Generation Planning

� Renewable Energy Sources to contribute around 20% of the Total
Energy Requirement by 2021-22.
� Share of Non-fossil fuel installed capacity to increase to 47% by
March,2022.
� Coal power plants need to have enhanced ramping capability
� Minimum technical limit for Coal power plants may have to be revised
downward.
� Gas and Hydro Power Plants need to play a major role in meeting the
ramping & balancing requirement
Road Ahead for Thermal Generation Planning contd

CEA-JCOAL Co-Operation

MoU between CEA and JCOAL
1st MOU between CEA and JCOAL for Pre-Prinary Study for Efficiencyand Environment Improvement of Coal Fired Power Plants was signed on30.4.2010.
The 2nd MoU between CEA and JCOAL was signed on 11.06.2012 forcarrying out detail diagnostic study for energy efficiency oriented R&Mactivities in thermal power units.
The 3rd MoU between CEA and JCOAL on Japan - India Cooperation forProject on Efficiency and Environmental Improvement for Sustainable,Stable and Low-carbon Supply of Electricity has been signed on22.01.2016.

� Joint identification of relevant issues such as condition based monitoring(predictive/risk based maintenance) of USC/SC units.
� Study on adoption of available technologies to meet new environmentstandards and the economic viability of using such technologies in existingplants on Indian coal. The study in progress.
� Study to explore the feasibility of replacement of old inefficient small sizeunits by new units based SC/USC technologies atleast at one site.
� Conductance of RLA and CA studies by JCOAL in One (1) 210 MW coalbased unit of thermal power station and submission of report.
� Consideration of financial viability and provide advice and support for theconcerned utility to utilize finance schemes for implementation
� Jointly organize and conduct CCT Transfer Program in Japan.
� Jointly organize and conduct an annual workshop in India.
Highlights of the MoU Works

� Under CEA- JCOAL Co-operation a study on replacement of oldunits of Badarpur TPS by highly efficient super critical units ofhigher size has been carried out.
� JCOAL has carried out RLA/CA diagnostic study at Unit-3 ofDadri TPS of NTPC
� Under Clean Coal Technology (CCT) Programme three study toursto Japan have been organised in which participants from differentpower utilities participated in the study tour
� Under CEA- JCOAL Co-operation a study is being carried out byJCOAL on adoption of available technologies to meet newenvironment standards and the economic viability of using suchtechnologies in existing power plants.
Achievement Under 3rd Phase MoU

� Exposure to the best practices in R&M of old Thermal Power Plants
� Exposure to the Ultra Supercritical Technology for Thermal PowerGenerating Units
� Exposure to Japanese experience in replacement old inefficient thermalgenerating units by SC/USC units
� Technology up gradation for Compliance of Environmental norms
� Experience sharing in O&M of Supercritical Units
� Visit to selected TPS in Japan viz. Isogo, Henikan
� Exposure to manufacturing facility for power plant equipments
Major Benefits of CCT Program

Schedule of CCT Program
• Group 1: Course for Senior Engineers and Managers
Entire period: From October 19 to 27, 2016 Period
of stay in Japan: October 20 to 27 (morning), 2016
• Group 2: Course for Senior Engineers and Managers
Entire period: From January 11 to 19, 2017 Period of
stay in Japan: From January 12 to 19 (morning), 2016


Thank you For the attention
नम�कार