uploads/annual report/aldar 34114 … · aldar annual report 2019 1 aldar properties pjsc is the...
TRANSCRIPT

Ald
ar An
nu
al Rep
ort 20
19
2019A N N UA L R E P O R T
FIND YOUR PLACE IN
ABU DHABI


Ald
ar A
nnua
l Rep
ort 2
019
1
Aldar Properties PJSC is the leading real estate developer, manager and owner in Abu Dhabi and, through its iconic developments, it is one of the most well known in the United Arab Emirates and the wider Middle East region.
Since Aldar was established, it has continued to shape and enhance the urbanisation of the UAE’s capital city by delivering desirable destinations where communities can work, live and visit. Those destinations include Yas Island, Al Reem Island, Al Raha Beach and now Saadiyat Island.
STRATEGIC REPORT
2 Financial Highlights
4 Highlights of 2019
8 At a Glance
10 Chairman’s Statement
12 CEO’s Statement
15 Why Abu Dhabi?
18 Market Overview
22 Our Strategy
26 Operational Review
50 KPIs
52 Financial Review
56 Risk Management
62 Sustainability
GOVERNANCE
76 Board of Directors
80 Executive Management
82 Corporate Governance Report
116 Board of Directors’ Report
FINANCIAL STATEMENTS
118 Independent Auditors’ Report
124 Consolidated Statement of Financial Position
125 Consolidated Income Statement
126 Consolidated Statement of Comprehensive Income
127 Consolidated Statement of Changes in Equity
128 Consolidated Statement of Cash Flows
130 Notes to the Consolidated Financial Statements
184 Supplementary Information
Contents
2St
rate
gic
Rep
ort
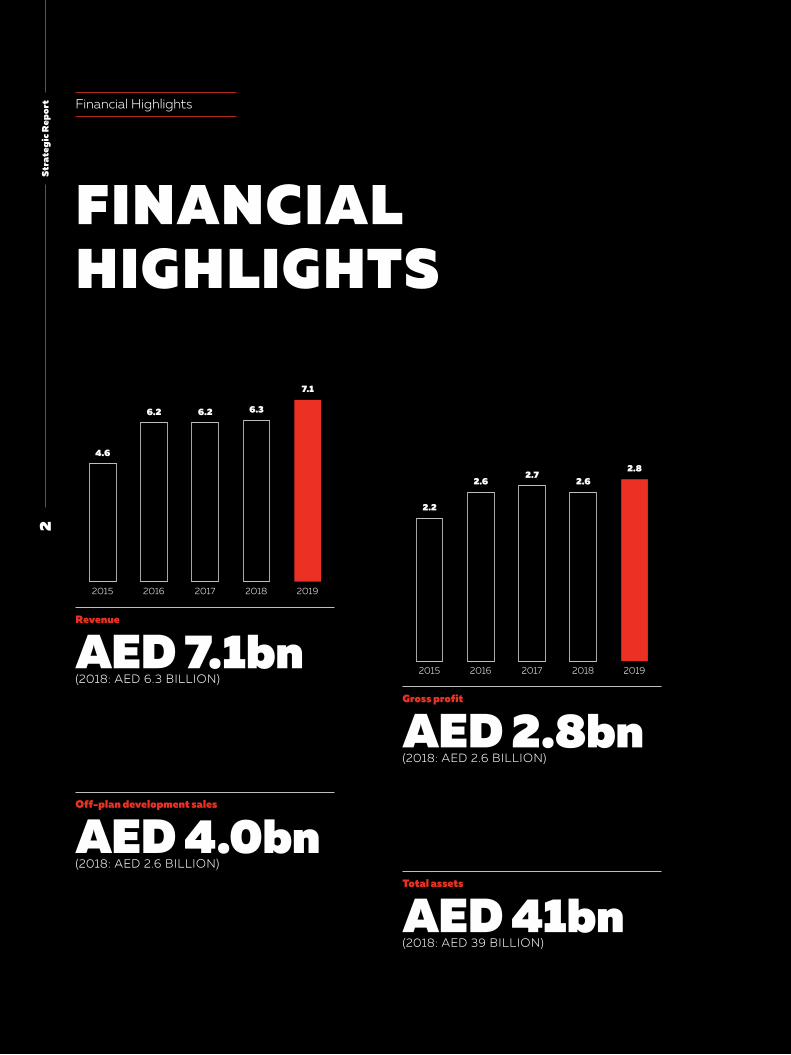
20192018201720162015
7.1
6.36.26.2
4.6
20192018201720162015
2.82.6
2.72.6
2.2
FINANCIAL HIGHLIGHTS
Financial Highlights
Revenue
AED 7.1bn(2018: AED 6.3 BILLION)
Gross profit
AED 2.8bn(2018: AED 2.6 BILLION)
Off-plan development sales
AED 4.0bn(2018: AED 2.6 BILLION)
Total assets
AED 41bn(2018: AED 39 BILLION)
Ald
ar A
nnua
l Rep
ort 2
019
3
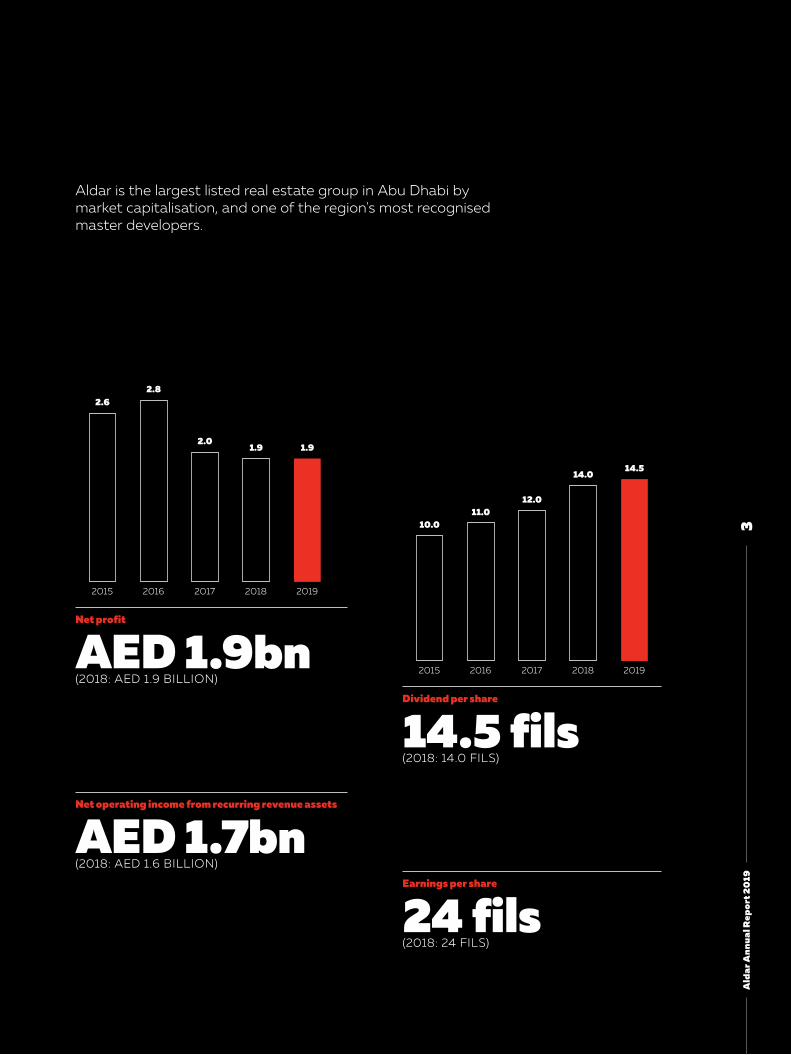
20192018201720162015
1.91.92.0
2.82.6
20192018201720162015
14.514.0
12.011.0
10.0
Aldar is the largest listed real estate group in Abu Dhabi by market capitalisation, and one of the region's most recognised master developers.
Net profit
AED 1.9bn(2018: AED 1.9 BILLION)
Dividend per share
14.5 fils(2018: 14.0 FILS)
Net operating income from recurring revenue assets
AED 1.7bn(2018: AED 1.6 BILLION)
Earnings per share
24 fils(2018: 24 FILS)
4St
rate
gic
Rep
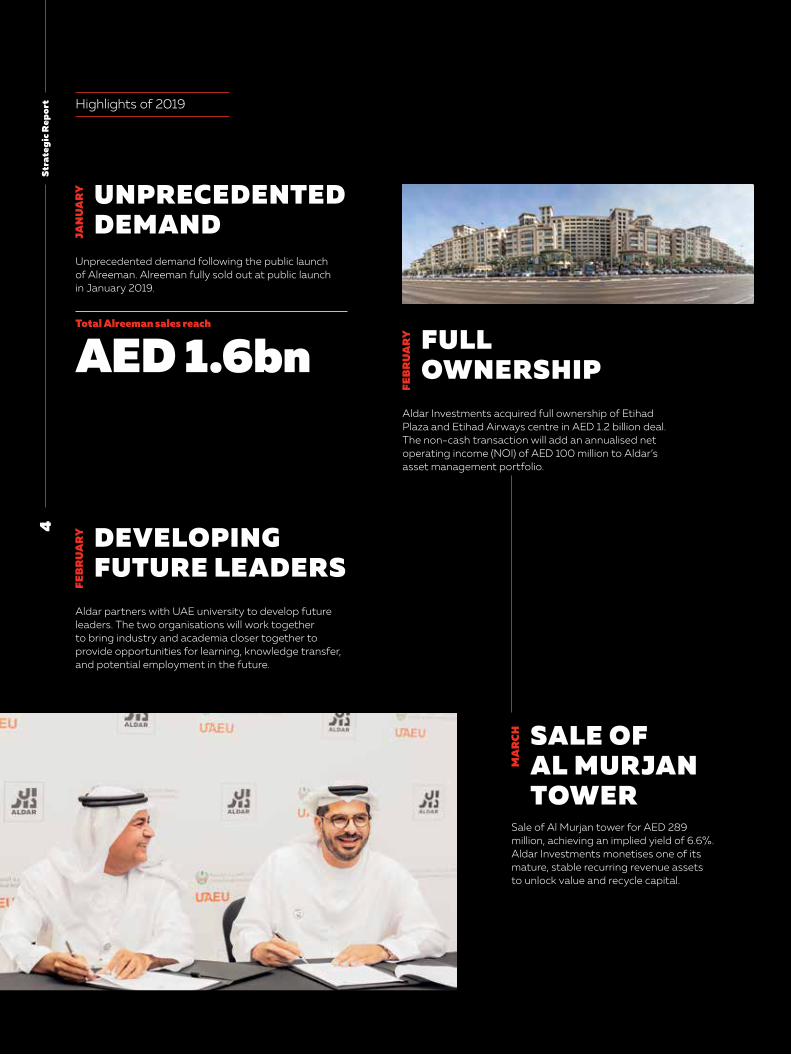
ort Highlights of 2019
UNPRECEDENTED DEMAND
Unprecedented demand following the public launch of Alreeman. Alreeman fully sold out at public launch in January 2019.
JAN
UA
RY
FULL OWNERSHIP
Aldar Investments acquired full ownership of Etihad Plaza and Etihad Airways centre in AED 1.2 billion deal. The non-cash transaction will add an annualised net operating income (NOI) of AED 100 million to Aldar’s asset management portfolio.
FEB
RU
AR
Y
DEVELOPING FUTURE LEADERS
Aldar partners with UAE university to develop future leaders. The two organisations will work together to bring industry and academia closer together to provide opportunities for learning, knowledge transfer, and potential employment in the future.
FEB
RU
AR
Y
SALE OF AL MURJAN TOWER
Sale of Al Murjan tower for AED 289 million, achieving an implied yield of 6.6%. Aldar Investments monetises one of its mature, stable recurring revenue assetsto unlock value and recycle capital.
MA
RC
H
Total Alreeman sales reach
AED 1.6bn

Ald
ar A
nnua
l Rep
ort 2
019
5
AL JIMI MALL EXPANSION OPENING
The new AED 400 million expansion and renovation adds 30,000 sqm gross leasable area (GLA) to Aldar’s second largest retail asset and secures Al Jimi Mall’s position as Al Ain’s prime retail destination.
MA
RC
H
LEA SELLS OUTLea sells out during Cityscape generating over AED 400 million in sales. Successful launch of Lea at Cityscape Abu Dhabi, demonstrating the demand for high-quality, infrastructure enabled land plots across prime Abu Dhabi locations.
Abu Dhabi Government announces that foreign nationals can acquire freehold title on land within investment zones.
AP
RIL
AED 420 MILLION LAUNCH SALES
Alreeman II generates AED 420 million in sales on launch day. Following the successof Alreeman, Aldar launched Alreeman II.
JUN
E
23 NEW STORESANNOUNCED
Aldar finalises major deal for 23 stores across its retail portfolio with Apparel group. The deal is to bring new brands across our retail portfolio.
JUN
E

6St
rate
gic
Rep
ort
AED 5 BILLION DEVELOPMENT AWARDED BY ABU DHABI GOVERNMENT
The deal includes three major development projects; a new national housing development at Al Falah, the new twofour54 media and entertainment free-zone and key infrastructure works at Saadiyat Island.
JULY
ALDAR CONTRIBUTES AED 36 MILLION TO SANDOOQ AL WATAN
Total contribution to Sandooq Al Watan reaches AED 120 million.
OC
TOB
ER
SAADIYAT RESERVE MARKS ALDAR’S FIRST RESIDENTIAL LAND COMMUNITY ON SAADIYAT ISLAND
The AED 722 million community features 306 infrastructure enabled land plots open to buyers of all nationalities.
SEP
TEM
BER
THE PERFECT 10
Aldar announces its first major promotional event with 10 days of ‘one off’ discounts across its development portfolio inventory.
SEP
TEM
BER
ALDAR INVESTMENTS SUCCESSFULLY RAISES US$ 500 MILLION SUKUK
Supported by Aldar Investments’ credit rating, the highest non-government rating in the region, Aldar issued the first 10-year sukuk offering by an Abu Dhabi-based issuer. It was more than six times oversubscribed, with global investors accounting for 71% of the final allocation.
OC
TOB
ER
Highlights of 2019 (continued)

Ald
ar A
nnua
l Rep
ort 2
019
7
ALDAR ANNOUNCES ITS MOST ICONIC DEVELOPMENT, SAADIYAT GROVE
Sheik Khalid Bin Mohammed Bin Zayed, Member of the Abu Dhabi Executive Council and Chairman of the Abu Dhabi Executive Office, launched the Saadiyat Grove project, an AED 8 billion landmark destination in the heart of Abu Dhabi’s Culture District on Saadiyat Island.
NO
VEM
BER
IN COLLABORATION WITH ABU DHABI NATIONAL OIL COMPANY (ADNOC), ALDAR ESTABLISHED ITS NEW PROCUREMENT IN-COUNTRY VALUE (ICV) PROGRAMME
ICV programme to anchor new procurement sustainability strategy to unlock value within the UAE economy.
NO
VEM
BER
ALDAR LAUNCHES INAUGURAL SUSTAINABILITY REPORT
The report focuses on the Company’s efforts to improve the way it does business and ensure that it has a positive impact on the economy, environment and in the communities where Aldar operates.
NO
VEM
BER
ALDAR ANNOUNCES A LAND SWAP DEAL WITH THE GOVERNMENT OF ABU DHABI
A move which saw Al Raha Beach East and Lulu Island exchanged in a swap deal with the Government of Abu Dhabi for infrastructure enabled land in Saadiyat Island and Mina Zayed.
DEC
EMB
ER

8St
rate
gic
Rep
ort
LEADING REAL ESTATE GROUP
At a Glance
ALDAR
DEVELOPMENT MANAGEMENT ASSET MANAGEMENT
OUR STRATEGYWe use our experience and knowledge of theAbu Dhabi real estate market to create long-term shareholder value through the development and monetisation of our land bank and through maximising the value of our asset management business.
OUR MARKETSRESIDENTIALAldar predominantly sells residential property through its development business, where itactively launches in-demand off-plan residential developments on payment plans to buyers. The asset management business also owns a significant residential portfolio across Abu Dhabi, which is leased to a mix of individual and corporate tenants.
RETAILAldar has developed a substantial retail footprint within Abu Dhabi that addresses both destination retail, such as Yas Mall and Al Jimi Mall, and the convenient community-focused retail locatedaround our residential developments.
COMMERCIALAldar has developed and, in more recent years, acquired a high-quality, predominantly Grade A commercial office portfolio that attracts top-tier tenants. The commercial portfolio is principally located across Abu Dhabi islands and has a significant exposure to the Government of Abu Dhabi as a tenant.
HOTELSAldar owns a unique cluster of hotels on Yas Island that benefit from their proximity to the airport and continued activation of Yas Island as the leisure and entertainment centre of Abu Dhabi, which most recently included the opening of Warner Bros. World, Abu Dhabi in 2018.
MARKET OVERVIEWRead more on page 18.
OUR STRATEGYRead more on page 22.
BUSINESS STRUCTURE

9A
ldar
Ann
ual R
epor
t 20
19
Aldar’s primary activities are based within the Emirate of Abu Dhabi, where it owns a significant land bank and diversified real estate property portfolio. The activities of the Group are split into two main areas, Development Management and Asset Management.
DEVELOPMENT MANAGEMENTAldar is the largest developer within Abu Dhabi and, since inception, has completed approximately 26,000 residential units across the Emirate. As at 31 December 2019, a further 8,000 residential units were under development.
ASSET MANAGEMENTAldar owns and manages a diverse asset management portfolio of AED 20 billion of assets, all within Abu Dhabi. The portfolio is predominantly split across four main real estate asset classes; residential, retail, commercial and hotels.
OPERATIONAL REVIEWRead more on page 26.
Seih Sdeirah, Alghadeer
Al Merief
Motor WorldAlreemanAlreeman ii
Nareel Island Al Bateen Park
Al Gurm Daman House International Tower
North Park
Sas Al Nakhl
Al Rayyana
Al Raha Plaza
Westin Abu Dhabi Golf Club
Baniyas Towers
Al Mamoura
Anantara Eastern Mangroves
Meera The Bridges Reflection Sun & Sky Towers Shams BOUTIK The Gate Towers and The Arc Boutik Gate Reem Central Park SAADIYAT
ISLAND
KEY
AL AIN
YAS ISLAND
AL RAHA BEACH
AL REEM ISLAND
West Yas Mayan Yas Acres Water’s Edge Ansam Lea
Yas Links Yas W Hotel Yas Mall IKEA ACE Hardware Yas Plaza Hotels
Burj Mohammed Bin Rashid and Worldtrade Center Abu Dhabi
Khalidiya village
Mamsha Al Saaiyat Jawaher Saadiyat Reserve Saadiyat Grove Cranleigh Abu Dhabi Saadiyat Beach Club Saadiyat Beach Golf Club Saadiyat district cooling assets Saadiyat retail
Al Raha Beach Community Retail HQ Building Etihad Plaza Al Muneera Al Zeina Al Bandar Al Hadeel
Al Oyoun Village Shabhat Plaza Al Jimi Mall Remal Mall
KEY DESTINATIONS
Mina Zayed

10St
rate
gic
Rep
ort
SUSTAINABLE LONG-TERM GROWTH
Chairman’s Statement
Dear Valued Shareholder, It gives me great pleasure to report on a remarkable year for Aldar, which marks our 15th year since inception.
In 2019, Abu Dhabi took several major strides towards elevating its status as a world class destination to invest, work, visit and live in and Aldar has played an active role in contributing to the Emirate’s continuing progress.
As the AED 50 billion socio-economic accelerator programme, Ghadan 21, came into effect in January of 2019, the impact on the economy and community was immediate. Incentivised investors and businesses, who understand the unique proposition of Abu Dhabi, have started strengthening their roots in the Emirate.
Ghadan 21 and other Government policies introduced over the last two years, have translated in Abu Dhabi moving up 23 places to rank 12th worldwide in the World Bank’s 2019 ‘Doing Business’ Report.
In tandem, Abu Dhabi has emerged as a premium, safe, tolerant and culturally diverse destination, gaining several prestigious accolades for tourism. Already home to leading cultural attractions such as the Qasr Al Hosn historical site and the Louvre Abu Dhabi, the Emirate’s continued investment in a broader array of truly world-class museums, entertainment parks and other attractions will continue to grow Abu Dhabi’s appeal and strengthen its global reputation.
As the Emirate’s main real estate developer and investor, Aldar is both a contributor to and a beneficiary of a vibrant Abu Dhabi.
The Company is focusing current and future developments on the high-value Saadiyat Island and Yas Island destinations – both are investment zones included in the game-changing law introduced in 2019 to allow non-Emiratis to own the freehold of land and properties they purchase in these zones.
Saadiyat, one of Abu Dhabi’s most sought-after locations, represents a particularly exciting opportunity for Aldar, which today owns the majority of prime land on the Island. The development of the beachfront through Mamsha Al Saadiyat, Saadiyat Reserve and Saadiyat Grove, along with a newly-awarded AED 2 billion infrastructure mandate, will allow Aldar to create further long-term value for its shareholders. It will also enhance the attractiveness of the Island as a premier destination for tourists, businesses and investors. Saadiyat Grove, a mixed-use project that connects Louvre Abu Dhabi and future prominent cultural landmarks such as the Zayed National Museum and the Guggenheim Museum, is set to transform the urban landscape of Abu Dhabi. Standing in middle of this project, visitors will be able to see all museums, which are just a short walk away – this is a unique experience we are excited to share with the world.

11A
ldar
Ann
ual R
epor
t 20
19
As our development management arm continuesto grow, our asset management arm, Aldar Investments, continues to thrive. Benefitting from a maturing asset market, Aldar Investments has significant opportunity to create value at existing assets, and to expand its portfolio through yield-accretive acquisitions. It will be a major engine of growth in the years ahead and will ensure that weare able to protect and enhance shareholder value through varying stages of the market cycle and macroeconomic conditions.
Our strategy focused on maximising operational excellence and maintaining growth momentum which enabled us to deliver robust financial and operational performance in 2019. Our commitment to delivering exceptional shareholder value is reflected in another year of uninterrupted dividend growth. Our Board has proposed a cash dividend distribution of 14.5 fils per share for 2019.
Looking ahead, the uplift in market sentiment will carry into 2020 and will get a further boost as the Government continues to focus efforts on economic diversification. The UAE has dedicated 2020 asthe year to prepare for the next fifty years and
coordinate efforts to make giants leaps in the areas of economy, education, infrastructure, health and media. This requires careful planning, a focus on sustainability, dynamism and openness – and Aldaris proud to play an active role in supporting this plan.
We are grateful for the endorsement and guidance of our Nation’s leadership, the unwavering trust of our shareholders, the loyalty of our customers and the passion and dedication of our employees. Our achievements are only possible because of this solid support base, and on behalf of the Board and executive management team, I thank you all.
H.E. Mohamed Khalifa Al MubarakChairman
“Our strategy focused on maximising operational excellence and maintaining growth momentum which enabled us to deliver robust financial and operational performance in 2019.”

12St
rate
gic
Rep
ort
PRIMED FOR GROWTH
CEO’s Statement
Aldar produced a strong performance in 2019, demonstrating an ability to create value through market cycles, while conducting major transactionsto prepare for continued growth in the coming years.
The Company is benefitting from our robust business model, designed to deliver growth and stable income through an optimal balance of property investment and development.
Aldar’s portfolio of mature, income-generating assets is the foundation for consistent delivery of solid dividends to shareholders. In parallel, well-planned development of the Company’s diverse and valuable land bank creates significant surplus capital to drive further expansion across our businesses.
In 2019, we reported record development sales of AED 4.0 billion, up 53%, driven by a series of new launches, while making strong progress across our development pipeline, with Mamsha Al Saaiyat, Jawaher and Yas Acres entering the customer-handover phase.
The land exchange with the Abu Dhabi Government in December 2019, supported the strategic focus of our development business on key locations such as Yas Island and Saadiyat Island, which will benefit from well-developed infrastructure. The transaction enhanced Aldar’s prime position in the Saadiyat Cultural District, which is central to Abu Dhabi’s emergence as a regional business hub and high-end lifestyle and cultural destination.
The development business is very well placed to take advantage of new opportunities for growth in our home market of Abu Dhabi, as well as through partnerships in other promising markets such as Saudi Arabia and Egypt.
Meanwhile, Aldar Investments, our AED 20 billion property investment business, which is now contributing 60% to the gross profit, is gainingin importance and the business sees significant opportunity to expand and diversify through yield-accretive acquisitions.In 2019, net operating income from asset
management, which includes the Aldar Investments business, increased 6% to AED 1.7 billion. This growth was driven by the value accretive additions of Etihad Plaza, Etihad Airways Centre and the Al Jimi Mall extension, while the sale of Al Murjan Tower allowed Aldar to realise value and reallocate capital. Average occupancy remained resilient at approximately 89%, reflecting the quality of this large and unique asset portfolio.
Aldar Investments received a strong vote of confidence from international institutional investors in October, when its $500 million 10-year sukuk was six times oversubscribed.
Aldar Investments' contribution to gross profit
60%

13A
ldar
Ann
ual R
epor
t 20
19
Aldar’s adjacent businesses are also developing well and are becoming significant contributors to our financial performance. Our real estate management solutions business, Provis, now has 15,000 properties under management, while Aldar Academies has tripled student numbers in thelast two years to over 22,000.
SUSTAINABILITY INTEGRAL TO STRATEGYAldar’s strategy for value creation focuses on three pillars: customer centricity, operational excellence and expansion. We have emphasised robust governance as a driver for success, ensuring structures and decision-making processes comply with best practice, and enhance transparency by instituting improved reporting standards.
We also recognise that conducting business in a sustainable manner is crucial if we are to retain the trust of all our stakeholders. As the leading property company in Abu Dhabi, we serve the Emirate’s development and growth ambitions. We are determined to lead by example on sustainability, to support our communities and reduce our carbon footprint. That will mean reconsidering and taking action on every element of our operations - from architecture and materials, to building processesand the use of smart and new property industry technologies.
In 2019, we took an important first step in establishing a robust framework by launching an inaugural Sustainability Report that documents
Aldar’s initiatives and intentions. The Company will continue to step up its efforts, setting targets and measuring ourselves against best-practice metrics.
POSITIVE MARKET DYNAMICSAldar has remained highly resilient in recent years during a downturn in the economic cycle, and we now see clear signs that the Abu Dhabi real estate market is turning a corner. Supply has been well managed in recent years, and the market is approaching equilibrium at a time when the Government’s pro-growth agenda is startingto stimulate business activity.
A wide-ranging fiscal stimulus programme is starting to filter into the real economy, as evidenced by Aldar’s award of contracts to manage AED 5 billion of infrastructure and other development. Meanwhile, a range of business-friendly policies, including regulatory and visa reforms, are making the Emirate an even more attractive place to set up a business, invest and live in.
I am confident in Aldar’s capacity to create significant shareholder value. The Company is at the centreof the exciting and well-planned economic transformation that is being driven by Abu Dhabi’s visionary leaders, and we have set a clear path for the deployment of our financial resources and expertise to achieve optimal results.
Talal Al DhiyebiChief Executive Officer

14St
rate
gic
Rep
ort

Ald
ar A
nnua
l Rep
ort 2
019
15
Why Abu Dhabi?
INVESTING IN ONE OF THE WORLD’S LEADING CITIESWHERE WE OPERATE Abu Dhabi is the largest of the seven emirates that make up the United Arab Emirates (UAE). Occupying over 80% of the country’s territory on 700 kilometres of Arabian Gulf coastline, the island-city of Abu Dhabi is the UAE’s federal capital and second most populous emirate in the UAE with close to three million people. Rapid development and urbanisation, coupled with population growth and relatively high income, has transformed Abu Dhabi in to a large and thriving city.
The Emirate holds 8% of the world’s oil reserves and 5% of the world’s gas reserves and makes up around half of Abu Dhabi’s GDP. Abu Dhabi maintains one of the highest GDP per capita levels in the world, estimated by S&P Global Ratings at about $87,000 per capita in 2019. S&P estimates the population increased by 80% between 2008 and 2017 to 3.0 million people and is expected to reach 3.7 millionby 2020.
Abu Dhabi has a flexible and agile approach thanks to its strong fiscal reserves in the form of sovereign wealth funds allowing it to adapt and navigate economic headwinds. Abu Dhabi has one of the best
credit ratings in the region, having been rated AA by S&P and Fitch and Aa2 by Moody's, with a stable outlook on the Emirate’s fiscal and external strengths. Abu Dhabi’s fiscal position is one of the highest in the world, with substantial sovereign foreign assets of 281% to GDP and low Government debt of only 7% to GDP, according to S&P.
According to the IMD World Competitiveness Index 2019, the UAE ranked first overall in the MENA region and fifth worldwide. The UAE ranked first globally for business efficiency, and second for government efficiency.
Abu Dhabi world oil reserves
8%(2018: 6%)
Abu Dhabi world gas reserves
5%(2018: 3%)

16St
rate
gic
Rep
ort Why Abu Dhabi? (continued)
Real GDP growth is estimated to reach 2.9% in 2019 (UAE Central Bank), Growth is expected to average 2.5% through 2019-22 (S&P)
2.9%(2018: 1.9%)
The Emirate’s long-term strategy is to diversify its economy away from its dependence on oil and gas as the major revenue source. The Government is currently investing heavily in innovation and development to create a knowledge-driven economy to support its vision across nine policy pillars, which are intended to form the framework of the Emirate’s social, political and economic future. Real estate, manufacturing, banking and finance, aviation and tourism are integral elements of today’s Abu Dhabi economy and will continue to play a greater role in the Emirate’s expansion.
Leading this transformation is the Abu Dhabi Vision 2030, a blueprint to guide the Emirate’s growthto achieve its vision. With 25 goals across five strategically important sectors, the blueprint sets out 83 programmes which are continuously monitored to deliver the overall plan and ensure the Emirate’s sustainable development.
Many of the initiatives which support the Abu Dhabi plan feed positively into the real estate market. There are a number of attractions on both Yas Island – for example Warner Bros. World theme park – and Saadiyat Island – for example The Louvre Abu Dhabi – that will continue to drive tourism into the Emirate and further diversify non-hydrocarbon revenue streams.
The new Midfield Terminal will serve the rising numbers of passengers flying through Abu Dhabi International Airport and provide a lift to the transport, aviation and retail sectors, that caterfor tourists and residents alike.
17A
ldar
Ann
ual R
epor
t 20
19
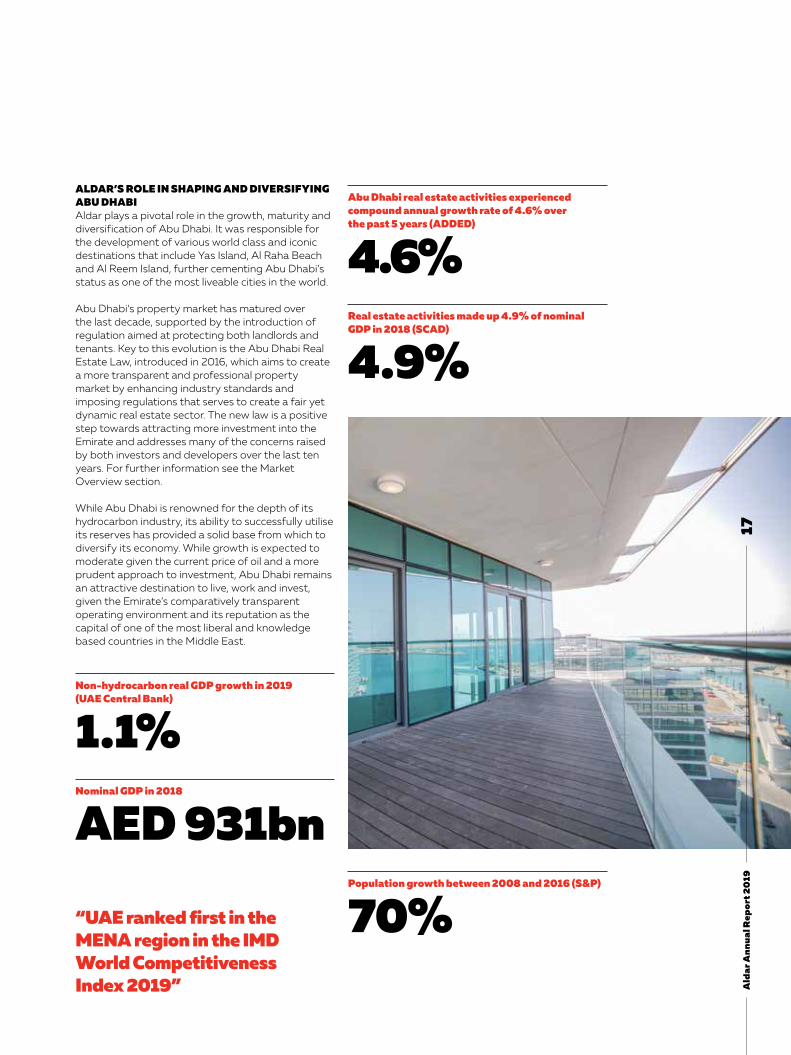
Abu Dhabi real estate activities experienced compound annual growth rate of 4.6% over the past 5 years (ADDED)
4.6%
Population growth between 2008 and 2016 (S&P)
70%
Nominal GDP in 2018
AED 931bn
Non-hydrocarbon real GDP growth in 2019 (UAE Central Bank)
1.1%
Real estate activities made up 4.9% of nominal GDP in 2018 (SCAD)
4.9%
ALDAR’S ROLE IN SHAPING AND DIVERSIFYING ABU DHABIAldar plays a pivotal role in the growth, maturity and diversification of Abu Dhabi. It was responsible for the development of various world class and iconic destinations that include Yas Island, Al Raha Beach and Al Reem Island, further cementing Abu Dhabi’s status as one of the most liveable cities in the world.
Abu Dhabi’s property market has matured overthe last decade, supported by the introduction of regulation aimed at protecting both landlords and tenants. Key to this evolution is the Abu Dhabi Real Estate Law, introduced in 2016, which aims to create a more transparent and professional property market by enhancing industry standards and imposing regulations that serves to create a fair yet dynamic real estate sector. The new law is a positive step towards attracting more investment into the Emirate and addresses many of the concerns raised by both investors and developers over the last ten years. For further information see the Market Overview section.
While Abu Dhabi is renowned for the depth of its hydrocarbon industry, its ability to successfully utilise its reserves has provided a solid base from which to diversify its economy. While growth is expected to moderate given the current price of oil and a more prudent approach to investment, Abu Dhabi remains an attractive destination to live, work and invest, given the Emirate’s comparatively transparent operating environment and its reputation as the capital of one of the most liberal and knowledge based countries in the Middle East.
“UAE ranked first in the MENA region in the IMD World Competitiveness Index 2019”

18St
rate
gic
Rep
ort Market Overview
Over the past several years, the Abu Dhabi Government has made a series of fiscal announcements and legislative changes to support economic growth and foreign direct investment (FDI). This has included ‘Ghadan 21’, which translates to English as ‘Tomorrow 21’, a programme that aims to support the development of small and medium sized enterprises (SMEs) and to enhance the Emirate’s long-term economic growth.
Whilst diversification is at the forefront of the UAE’s economic strategy, the hydrocarbon industry remains the key driver of GDP, with the Government
Aldar predominantly operates within Abu Dhabi’s four main real estate asset classes: residential, retail, office and hospitality. This section provides an overview on sector performance and an outlook on what to expect in 2020 and beyond.
GHADAN 21Ghadan 21 is an AED 50 billion fiscal package designed to stimulate growth over the 2019-2021 period and build a sustainable knowledge-based economy. The programme focuses on activities across four strategic pillars: business and investment, society, knowledge and innovation and liveability. Its aim is to promote growth ofSMEs and private sector participation, foster employment growth, increase consumer expenditure and improve the overall standard of living within the Emirate. Since the announcement of Ghadan 21, the Government has pledged spending of AED 19 billion in 2019, AED 20 billion in 2020 and AED 11 billion in 2021.
Case study
AED 520 MILLION TECH HUB ‘HUB 71’ TO SUPPORT STARTUPSHub 71 is an initiative under the Ghadan 21 framework, which comprises partnerships between Mubadala, Microsoft, SoftBank and Abu Dhabi Global Markets (ADGM). Its mission is to help start-ups and entrepreneurs develop, build scale and establish transformational businesses in the region.
With Mubadala Investment Company leading Hub 71, Microsoftwill play a central role as a global technology partner, while the SoftBank Vision Fund will leverage its investment network to create a focal point for tech innovation in the region. ADGM, the business enabler, completes the ecosystem, creating an environment for innovation and entrepreneurial success.
Case study
AGREEMENT WITH SENSETIMETO ESTABLISH ITS REGIONAL HEADQUARTERS IN ABU DHABIA decision by SenseTime to establish its regional headquarters in Abu Dhabi forms part of a Ghadan 21 initiative to promote and further cement Abu Dhabi’s tech ambitions.
The agreement marks a huge leap forward into the tech ecosystem. The deal is projected to bring 600 highly skilled jobs into the workforce over the next 5 years, supporting Abu Dhabi’s journey towards economic diversification.
announcing its commitment to increase oil production capacity from approximately 3 million barrels per day (bpd) in 2018 to 4 million bpd by 2020 and 5 million bpd by 2030. The Supreme Petroleum Council also approved Abu Dhabi National Oil Company’s (ADNOC) proposed investment strategy into mid-stream and petrochemicals in 2018, which could provide a significant uplift in the country’s future GDP. Furthermore, the UAE Cabinet of Ministers announced amendments to visa legislations, with the goal of encouraging expatriates to become long-term residents.
19A
ldar
Ann
ual R
epor
t 20
19
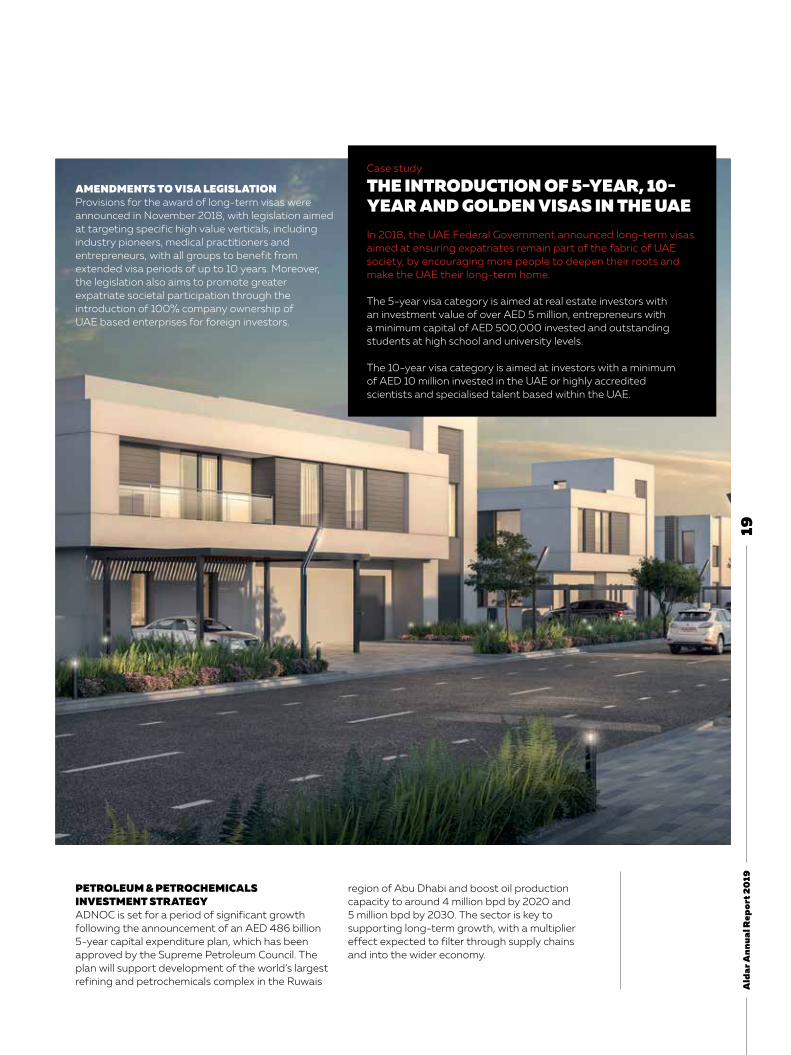
AMENDMENTS TO VISA LEGISLATIONProvisions for the award of long-term visas were announced in November 2018, with legislation aimed at targeting specific high value verticals, including industry pioneers, medical practitioners and entrepreneurs, with all groups to benefit from extended visa periods of up to 10 years. Moreover, the legislation also aims to promote greater expatriate societal participation through the introduction of 100% company ownership ofUAE based enterprises for foreign investors.
PETROLEUM & PETROCHEMICALS INVESTMENT STRATEGY ADNOC is set for a period of significant growth following the announcement of an AED 486 billion 5-year capital expenditure plan, which has been approved by the Supreme Petroleum Council. The plan will support development of the world’s largest refining and petrochemicals complex in the Ruwais
region of Abu Dhabi and boost oil production capacity to around 4 million bpd by 2020 and5 million bpd by 2030. The sector is key to supporting long-term growth, with a multiplier effect expected to filter through supply chains and into the wider economy.
Case study
THE INTRODUCTION OF 5-YEAR, 10-YEAR AND GOLDEN VISAS IN THE UAEIn 2018, the UAE Federal Government announced long-term visas aimed at ensuring expatriates remain part of the fabric of UAE society, by encouraging more people to deepen their roots and make the UAE their long-term home.
The 5-year visa category is aimed at real estate investors withan investment value of over AED 5 million, entrepreneurs with a minimum capital of AED 500,000 invested and outstanding students at high school and university levels.
The 10-year visa category is aimed at investors with a minimum of AED 10 million invested in the UAE or highly accredited scientists and specialised talent based within the UAE.
20St
rate
gic
Rep
ort
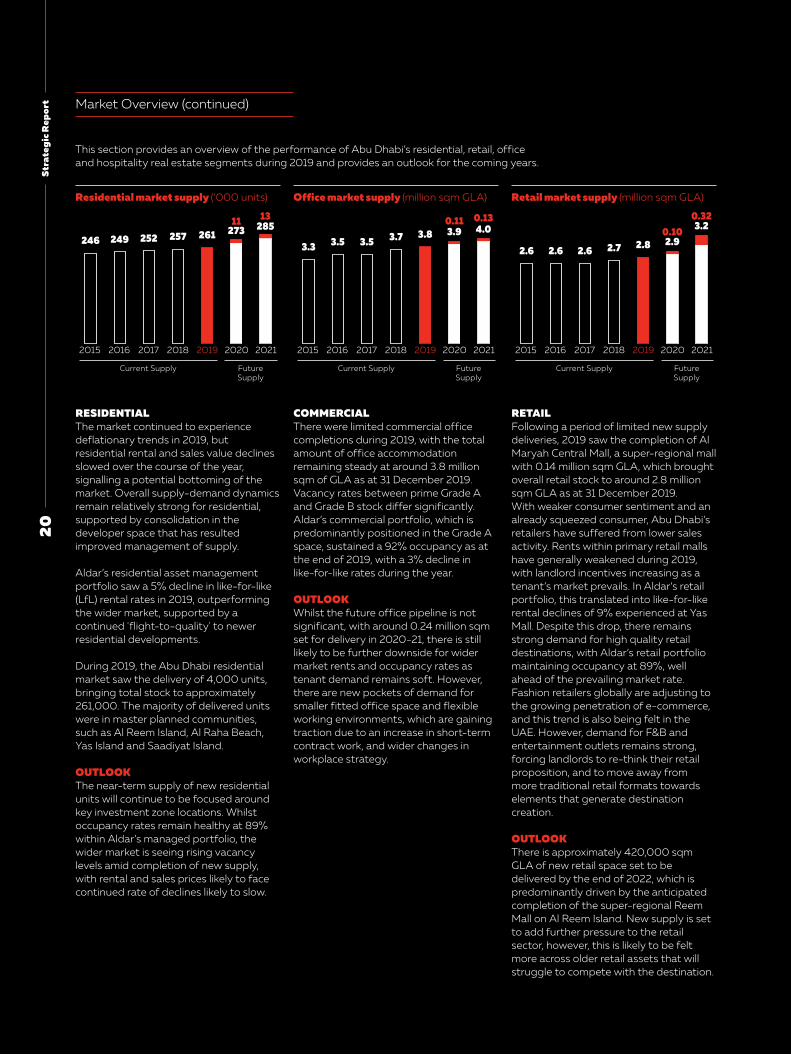
11 13
246 249 252 257 261 273 285
20212018 20202019201720162015
Current Supply FutureSupply
0.100.32
2.6 2.6 2.6 2.7 2.8 2.93.2
20212018 20202019201720162015
Current Supply FutureSupply
0.11 0.13
3.3 3.5 3.5 3.7 3.8 3.9 4.0
20212018 20202019201720162015
Current Supply FutureSupply
Market Overview (continued)
RESIDENTIAL The market continued to experience deflationary trends in 2019, but residential rental and sales value declines slowed over the course of the year, signalling a potential bottoming of the market. Overall supply-demand dynamics remain relatively strong for residential, supported by consolidation in the developer space that has resulted improved management of supply.
Aldar’s residential asset management portfolio saw a 5% decline in like-for-like (LfL) rental rates in 2019, outperforming the wider market, supported by a continued 'flight-to-quality' to newer residential developments.
During 2019, the Abu Dhabi residential market saw the delivery of 4,000 units, bringing total stock to approximately 261,000. The majority of delivered units were in master planned communities, such as Al Reem Island, Al Raha Beach, Yas Island and Saadiyat Island.
OUTLOOKThe near-term supply of new residential units will continue to be focused around key investment zone locations. Whilst occupancy rates remain healthy at 89% within Aldar’s managed portfolio, the wider market is seeing rising vacancy levels amid completion of new supply, with rental and sales prices likely to face continued rate of declines likely to slow.
COMMERCIAL There were limited commercial office completions during 2019, with the total amount of office accommodation remaining steady at around 3.8 million sqm of GLA as at 31 December 2019. Vacancy rates between prime Grade A and Grade B stock differ significantly. Aldar’s commercial portfolio, which is predominantly positioned in the Grade A space, sustained a 92% occupancy as at the end of 2019, with a 3% decline in like-for-like rates during the year.
OUTLOOKWhilst the future office pipeline is not significant, with around 0.24 million sqm set for delivery in 2020-21, there is still likely to be further downside for wider market rents and occupancy rates as tenant demand remains soft. However, there are new pockets of demand for smaller fitted office space and flexible working environments, which are gaining traction due to an increase in short-term contract work, and wider changes in workplace strategy.
RETAIL Following a period of limited new supply deliveries, 2019 saw the completion of Al Maryah Central Mall, a super-regional mall with 0.14 million sqm GLA, which brought overall retail stock to around 2.8 million sqm GLA as at 31 December 2019. With weaker consumer sentiment and an already squeezed consumer, Abu Dhabi’s retailers have suffered from lower sales activity. Rents within primary retail malls have generally weakened during 2019, with landlord incentives increasing as a tenant’s market prevails. In Aldar’s retail portfolio, this translated into like-for-like rental declines of 9% experienced at Yas Mall. Despite this drop, there remains strong demand for high quality retail destinations, with Aldar’s retail portfolio maintaining occupancy at 89%, well ahead of the prevailing market rate.Fashion retailers globally are adjusting to the growing penetration of e-commerce, and this trend is also being felt in the UAE. However, demand for F&B and entertainment outlets remains strong, forcing landlords to re-think their retail proposition, and to move away frommore traditional retail formats towards elements that generate destination creation.
OUTLOOKThere is approximately 420,000 sqm GLA of new retail space set to be delivered by the end of 2022, which is predominantly driven by the anticipated completion of the super-regional Reem Mall on Al Reem Island. New supply is set to add further pressure to the retail sector, however, this is likely to be felt more across older retail assets that will struggle to compete with the destination.
Residential market supply (‘000 units) Office market supply (million sqm GLA) Retail market supply (million sqm GLA)
This section provides an overview of the performance of Abu Dhabi’s residential, retail, office and hospitality real estate segments during 2019 and provides an outlook for the coming years.

21
Ald
ar A
nnua
l Rep
ort 2
019
1 1
27 27 28 30 30 31 32
20212018 20202019201720162015
Current Supply FutureSupply
HOSPITALITYThe hotel sector was Aldar’s top performing real estate asset class during 2019, supported by an active events calendar, which included Formula 1, Special Olympics, UFC, ADIPEC and various other sporting, entertainment, and conferences that brought visitors into the Emirate.
Aldar’s hotel portfolio, which includes over 2,900 hotel keys, witnessed strong average daily rate (ADR) and occupancy growth, which translated into stronger revenues and profits.
Performance was also supported by limited new supply entering the market, with only one major new property delivered to the market during 2019, while two hotels closed. The total number of keys remained relatively stable at approximately 30,000.
OUTLOOKAbu Dhabi’s hospitality pipeline for 2020 and 2021 comprises new rooms in the Marina Peninsula and Saadiyat Island areas, which will bring approximately 2,000 new keys to the market.
The Government of Abu Dhabi is investing heavily in the tourism sector to help drive diversification and move away from an oil-based economy. This includes the new airport and cultural investments such as the Zayed National Museum.As a result, we expect the hospitality sector to continue to grow strongly during 2020 and 2021, albeit the sector is recovering from a low point in the market.
Hotel market supply (‘000 keys) Abu Dhabi prime rental clock
RENTAL GROWTH SLOWING
RENTAL GROWTH ACCELERATING
Source: JLL
RENTS FALLING
RENTS BOTTOMING
OUT
RS
RS
RT
C
C
H
H
RT
Q4 2019
RS Residential
C Commercial
Q4 2018
H Hotel
RT Retail
22
Stra
tegi
c R
epor
t Our Strategy
SUSTAINABLE RETURNS THROUGH SOUNDINVESTMENTS AND INNOVATIVE STRATEGIESOur vision demonstrates what we aim to achieve, while our Mission defines our DNA and what we stand for. These form the cornerstone of our strategic intent and commitment to stakeholders.
Vision brings aspirations, a desire to uphold the values Aldar stands for. These form the cornerstone of our strategic intent and commitment to stakeholders.
OUR VISIONBecome a leading regional real estate developer and manager that creates memorable experiences and value for our customers and shareholders.
OUR MISSIONPlace our customers first by embedding sustainability, quality, technology and innovationin everything we do.
OUR VALUESCUSTOMER CENTRICWe engage and deliver an exceptional customer journey.
DIVERSE & INCLUSIVEWe value diversity and treat everyone with respect, inclusiveness and dignity.
AGILEWe are responsive, dynamic and committed.
INNOVATIVEWe differentiate ourselves by going above and beyond in everything we do.
COLLABORATIVEWe are one team, we work together, acrossboundaries, to achieve our mutual objectives.

Ald
ar A
nnua
l Rep
ort 2
019
2
3
FINANCIAL HORIZON
CUSTOMER VALUE PROPOSITION
OUR STRATEGIC THEMES
FIND OUT MORE ON THE NEXT PAGE
MAXIMISE SHAREHOLDER
VALUE
GROW PROFITS AND ENHANCE
MARGINS
EXPAND AND DRIVE
SUSTAINABLE GROWTH
WE ARE A TRUSTED
REAL ESTATE COMPANY…
FINANCIALHORIZON
OPERATIONAL EXCELLENCE
… THAT CREATES MEMORABLE
EXPERIENCES…
CUSTOMER CENTRICITY
… WHICH YIELD SUSTAINABLE
RETURNS.
GROWTH AND EXPANSION
PEOPLE, INNOVATION& DIGITAL TRANSFORMATION

24St
rate
gic
Rep
ort Our Strategy (continued)
STRATEGIC THEMES STRATEGIC OBJECTIVES 2019 ACHIEVEMENTS 2020 PLANS
FINANCIAL HORIZONOur objective is to drive maximum financial returns for our shareholders by continually growing our portfolio and improving efficiencies.
• Maximise shareholder value. • Grow profits and enhance margins. • Expand and drive sustainable growth.
• Headline financial growth delivered across revenue (+14%), gross profit (+5%) and net profit (+4%).
• Achieved record development sales of AED 4.0 billion, up 53%. • Highest ever net operating income (NOI) from recurring income assets of
AED 1.7 billion, up 6%. • Gross debt maintained well within financial policies for asset management
and development management businesses at 38.0% and 13.3% respectively. • Grew development revenue backlog to AED 4.4 billion, providing visibility on
future earnings. • Launched the first ever 10-year public sukuk offering by an Abu Dhabi-based
issuer. • Board recommended a dividend of 14.5 fils per share, representing a 4%
growth on 2018 (14.0 fils per share).
• Target AED 4.0 billion in development sales, in line with 2019.
• Target AED 1.8 billion NOI from recurring revenue assets, driven by 2019 asset additions and growth across adjacent businesses.
• Maintain gross debt levels in line with financial policies for both asset management and development management businesses.
• Recommend a dividend based on underlying performance of both asset management and development management businesses.
OPERATIONAL EXCELLENCEAims to achieve agility through optimising operational processes and supply chain efficiency to ensure that we deliver our developments on time and within budget, and manage our assets and investments in an effective and efficient manner.
• Ensure our projects are delivered on time, within budget and agreed quality.
• Maximise and unlock the potential of our assets. • Optimise our processes and strengthen our value chain. • Embed environment and quality in all aspects of the business. • Drive value and synergy through investment.
• Establishment of a sustainability department to develop, govern and enable sustainability across the business.
• Establishment of our ICV programme and workers welfare policy. • Establishment of a procurement sustainability function. • Average occupancy maintained at 89% across investment properties portfolio. • Implemented Robotic Process Automation in Finance & Treasury operations. • Automated the workflows for 1,000+ tenants and 300+ contractors across
work permit and network operations centre processes, improving the service level agreements and service excellence.
• Implemented operating model enhancements across the business.
• Launch our ICV programme and workers welfare policy.
• Implement process efficiency through Robotic Process Automation across the business.
• Revisit and improve more than 21+ workflows across 19 functions to ensure agility and effectiveness of our internal processes.
CUSTOMER CENTRICITYEncompasses our corporate customer value proposition that creates trust through engaging our customers and delivering exceptional customer experience.
• Engage customers and end users in all aspects of the business. • Deliver exceptional customer experiences. • Create customer intimacy through loyalty programmes
and unified marketing. • Integrate and promote social and environmental sustainability.
• Aldar Customer App enabled with AI based chatbot 'Zeina' that can assist customers with buying or renting, accessing their portfolio of investments, post sales services and general queries.
• Implemented a self-service customer portal for third-party developers and landowners, and automated development service processes, improving our customer experience and engagement.
• Successfully implemented Qualtrics to gather, analyse and report the voice of our customers to improve overall customer experience, gain insights and understand feedback.
• Agile customer portal implemented with all services. More than 80% of these services made available to all community owners of Aldar.
• Issuing Aldar’s 2018 Sustainability Report and inaugurating our sustainability pillars: people, community, environment and economy.
• Launch Aldar’s Loyalty Programme across our portfolio.
• Implement our Energy Monitoring Programme. • Drive insights from our customers and deliver
more centric services and products. • Streamlining and enhancing all our customer
facing and fulfilment platforms/services. • Implement our sustainability programme across
our portfolio.
GROWTH AND EXPANSIONAims to increase the value of our assets through sustainable growth into new markets; quicker turnaround on quality developments and acquisitions; and innovative marketing strategies.
• Explore and invest in regional/international expansion. • Grow our local portfolio in a sustainable and agile manner. • Ensure optimal utilization and growth ratios of our assets. • Actively engage with our key stakeholders to drive growth.
• Strategic land swap with the Government of Abu Dhabi enabled Aldar to consolidate development focus on key destinations including Saadiyat Island
• Acquisition of Etihad Plaza and Etihad Airways Centre. • Launched AED 8 billion project, Saadiyat Grove, to transform the urban
landscape of Abu Dhabi. • Aldar was awarded AED 5.0 billion of development projects by the
Government of Abu Dhabi across national housing, infrastructure and development of a new commercial hub.
• Aldar Academies tripled student numbers to 22,000 over last two academic years.
• Khidmah and Provis transformation drove revenue and profit growth.
• Ensure regional business presence. • Execute our international sales strategy. • Execute on acquisition transactions. • Drive more growth in our adjacencies.
PEOPLE, INNOVATION AND DIGITAL TRANSFORMATIONAttract and maintain high performing talent; nurture an innovative and creative culture; and adopt disruptive technology.
• Leverage data for more informed decision making. • Deploy disruptive and leading technology in all aspects
of the business. • Empower and embed innovation in all aspects of the business. • Attract and retain high-performing talent. • Develop and engage our people. • Nurture an innovative and creative culture.
• More than 70% of employee self-services were digitised through the Aldar employee app.
• First property developer in the UAE to adopt 'UAE Pass' with a vision to create real estate smart services using state-of-the-art technology.
• Partnered with Hub 71, MITEF, UAEU, Techstars, TAMM/ADDA and StartAD to foster innovation and support SMEs.
• Invested in 12 out of 192 employee innovation ideas. • Undertook rigorous succession assessment process to identify potential
successors for critical roles throughout the organisation.
• Partner with leading global proptech venture capital funds.
• Digitise our innovation management platform. • Delivering VDC (Virtual Design & Construction)/
BIM programme focused on digitally enabled design and delivery of our developments.
• Implement big data and analytics platform to drive smarter intelligent insights and informed decision making.
• Implement a strategy to continuously engage, develop and retain our people.

25
Ald
ar A
nnua
l Rep
ort 2
019
KEY PERFORMANCE INDICATORSRead more on page 50.
RISK MANAGEMENTRead more on page 56.
STRATEGIC THEMES STRATEGIC OBJECTIVES 2019 ACHIEVEMENTS 2020 PLANS
FINANCIAL HORIZONOur objective is to drive maximum financial returns for our shareholders by continually growing our portfolio and improving efficiencies.
• Maximise shareholder value. • Grow profits and enhance margins. • Expand and drive sustainable growth.
• Headline financial growth delivered across revenue (+14%), gross profit (+5%) and net profit (+4%).
• Achieved record development sales of AED 4.0 billion, up 53%. • Highest ever net operating income (NOI) from recurring income assets of
AED 1.7 billion, up 6%. • Gross debt maintained well within financial policies for asset management
and development management businesses at 38.0% and 13.3% respectively. • Grew development revenue backlog to AED 4.4 billion, providing visibility on
future earnings. • Launched the first ever 10-year public sukuk offering by an Abu Dhabi-based
issuer. • Board recommended a dividend of 14.5 fils per share, representing a 4%
growth on 2018 (14.0 fils per share).
• Target AED 4.0 billion in development sales, in line with 2019.
• Target AED 1.8 billion NOI from recurring revenue assets, driven by 2019 asset additions and growth across adjacent businesses.
• Maintain gross debt levels in line with financial policies for both asset management and development management businesses.
• Recommend a dividend based on underlying performance of both asset management and development management businesses.
OPERATIONAL EXCELLENCEAims to achieve agility through optimising operational processes and supply chain efficiency to ensure that we deliver our developments on time and within budget, and manage our assets and investments in an effective and efficient manner.
• Ensure our projects are delivered on time, within budget and agreed quality.
• Maximise and unlock the potential of our assets. • Optimise our processes and strengthen our value chain. • Embed environment and quality in all aspects of the business. • Drive value and synergy through investment.
• Establishment of a sustainability department to develop, govern and enable sustainability across the business.
• Establishment of our ICV programme and workers welfare policy. • Establishment of a procurement sustainability function. • Average occupancy maintained at 89% across investment properties portfolio. • Implemented Robotic Process Automation in Finance & Treasury operations. • Automated the workflows for 1,000+ tenants and 300+ contractors across
work permit and network operations centre processes, improving the service level agreements and service excellence.
• Implemented operating model enhancements across the business.
• Launch our ICV programme and workers welfare policy.
• Implement process efficiency through Robotic Process Automation across the business.
• Revisit and improve more than 21+ workflows across 19 functions to ensure agility and effectiveness of our internal processes.
CUSTOMER CENTRICITYEncompasses our corporate customer value proposition that creates trust through engaging our customers and delivering exceptional customer experience.
• Engage customers and end users in all aspects of the business. • Deliver exceptional customer experiences. • Create customer intimacy through loyalty programmes
and unified marketing. • Integrate and promote social and environmental sustainability.
• Aldar Customer App enabled with AI based chatbot 'Zeina' that can assist customers with buying or renting, accessing their portfolio of investments, post sales services and general queries.
• Implemented a self-service customer portal for third-party developers and landowners, and automated development service processes, improving our customer experience and engagement.
• Successfully implemented Qualtrics to gather, analyse and report the voice of our customers to improve overall customer experience, gain insights and understand feedback.
• Agile customer portal implemented with all services. More than 80% of these services made available to all community owners of Aldar.
• Issuing Aldar’s 2018 Sustainability Report and inaugurating our sustainability pillars: people, community, environment and economy.
• Launch Aldar’s Loyalty Programme across our portfolio.
• Implement our Energy Monitoring Programme. • Drive insights from our customers and deliver
more centric services and products. • Streamlining and enhancing all our customer
facing and fulfilment platforms/services. • Implement our sustainability programme across
our portfolio.
GROWTH AND EXPANSIONAims to increase the value of our assets through sustainable growth into new markets; quicker turnaround on quality developments and acquisitions; and innovative marketing strategies.
• Explore and invest in regional/international expansion. • Grow our local portfolio in a sustainable and agile manner. • Ensure optimal utilization and growth ratios of our assets. • Actively engage with our key stakeholders to drive growth.
• Strategic land swap with the Government of Abu Dhabi enabled Aldar to consolidate development focus on key destinations including Saadiyat Island
• Acquisition of Etihad Plaza and Etihad Airways Centre. • Launched AED 8 billion project, Saadiyat Grove, to transform the urban
landscape of Abu Dhabi. • Aldar was awarded AED 5.0 billion of development projects by the
Government of Abu Dhabi across national housing, infrastructure and development of a new commercial hub.
• Aldar Academies tripled student numbers to 22,000 over last two academic years.
• Khidmah and Provis transformation drove revenue and profit growth.
• Ensure regional business presence. • Execute our international sales strategy. • Execute on acquisition transactions. • Drive more growth in our adjacencies.
PEOPLE, INNOVATION AND DIGITAL TRANSFORMATIONAttract and maintain high performing talent; nurture an innovative and creative culture; and adopt disruptive technology.
• Leverage data for more informed decision making. • Deploy disruptive and leading technology in all aspects
of the business. • Empower and embed innovation in all aspects of the business. • Attract and retain high-performing talent. • Develop and engage our people. • Nurture an innovative and creative culture.
• More than 70% of employee self-services were digitised through the Aldar employee app.
• First property developer in the UAE to adopt 'UAE Pass' with a vision to create real estate smart services using state-of-the-art technology.
• Partnered with Hub 71, MITEF, UAEU, Techstars, TAMM/ADDA and StartAD to foster innovation and support SMEs.
• Invested in 12 out of 192 employee innovation ideas. • Undertook rigorous succession assessment process to identify potential
successors for critical roles throughout the organisation.
• Partner with leading global proptech venture capital funds.
• Digitise our innovation management platform. • Delivering VDC (Virtual Design & Construction)/
BIM programme focused on digitally enabled design and delivery of our developments.
• Implement big data and analytics platform to drive smarter intelligent insights and informed decision making.
• Implement a strategy to continuously engage, develop and retain our people.
26St
rate
gic
Rep
ort Operational Review
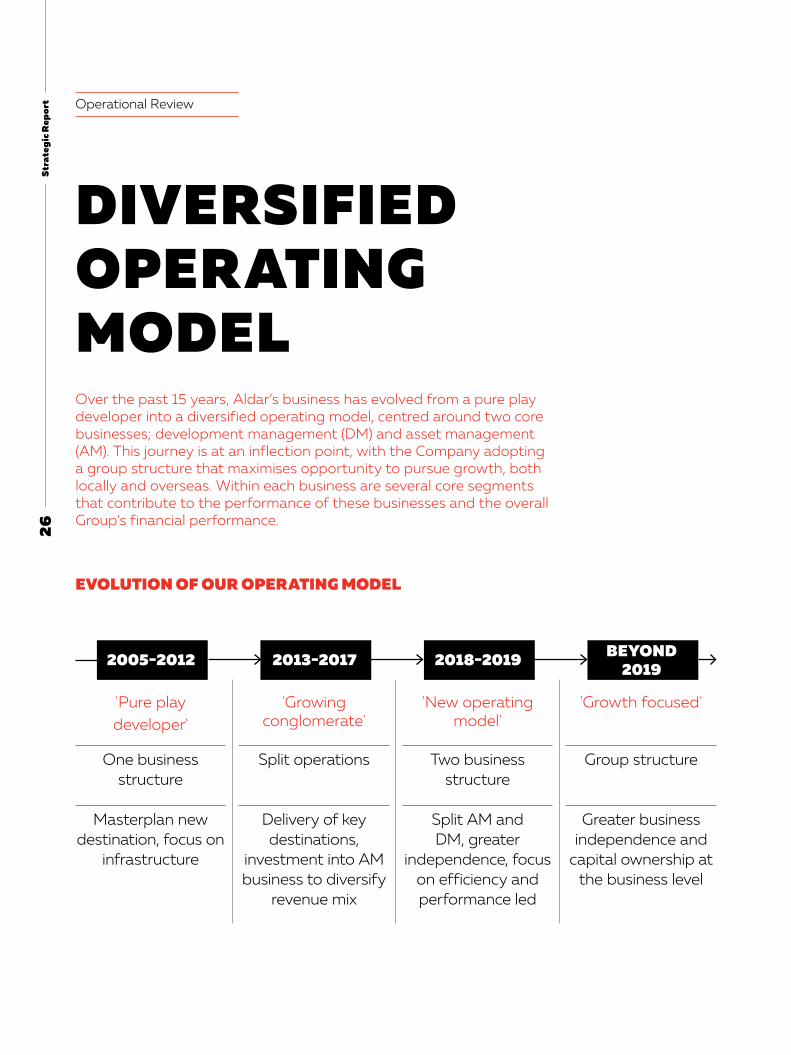
DIVERSIFIED OPERATING MODELOver the past 15 years, Aldar’s business has evolved from a pure play developer into a diversified operating model, centred around two core businesses; development management (DM) and asset management (AM). This journey is at an inflection point, with the Company adopting a group structure that maximises opportunity to pursue growth, both locally and overseas. Within each business are several core segments that contribute to the performance of these businesses and the overall Group’s financial performance.
'Pure playdeveloper'
'Growing conglomerate'
'New operating model'
'Growth focused'
One business structure
Split operations Two business structure
Group structure
Masterplan new destination, focus on
infrastructure
Delivery of key destinations,
investment into AM business to diversify
revenue mix
Split AM and DM, greater
independence, focus on efficiency and performance led
Greater business independence and
capital ownership at the business level
2005-2012 2013-2017 2018-2019 BEYOND 2019
EVOLUTION OF OUR OPERATING MODEL

27A
ldar
Ann
ual R
epor
t 20
19
ALDAR
ASSET MANAGEMENT
INVESTMENT PROPERTIES
HOSPITALITY
ADJACENT BUSINESSES
DEVELOPMENT MANAGEMENT
PROPERTY DEVELOPMENT
DEVELOPMENT MANAGEMENT
DEVELOPMENT MANAGEMENT PROPERTY DEVELOPMENT Aldar is one of the largest land bank owners in Abu Dhabi. This business is focused on the activation of its land bank through strategically developing land to support the growth of the city. The business model is focused on off-plan residential development but also works closely with the asset management business to deliver some of their growth ambitions through build-to-lease development.
DEVELOPMENT MANAGEMENTFurther to developing Aldar’s own land bank, the development management business works closely with third parties, predominantly the Government of Abu Dhabi, to project manage external real estate projects. This mandate captures projects such as infrastructure, national housing and strategic assets such as the new twofour54 media and entertainment free-zone.
ASSET MANAGEMENT INVESTMENT PROPERTIES Investment properties collectively holds Aldar’s retail, residential and commercial properties. These assets are leased to tenants and collect a rental income. Collectively these assets contribute just over 80%of the asset management business’s net operating income. Each year these assets are externally valued by a third-party independent valuer to ensure their values reflect current market conditions.
HOSPITALITY Aldar owns a portfolio of hotel and leisure assets which are anchored around Yas Island, Abu Dhabi’s entertainment and leisure destination.
ADJACENT BUSINESSES Aldar owns several strategic businesses that work in parallel and support the broader offering of Aldar’s two principle businesses, development and asset management. This segment, that forms part ofthe asset management business includes severalkey businesses within the education, property management, facilities management, districtcooling and construction sectors.
This section takes a closer look at the operating highlights across the development management and asset management businesses.

28St
rate
gic
Rep
ort Operational Review (continued)
DEVELOPMENT MANAGEMENTSince Aldar’s inception, development has been at the heart of the business. Over the past 15 years, Aldar has created some of the most iconic development projects and destinations across Abu Dhabi. The principal activities of the development management business today are off-plan residential property development and third-party development management.
2019 HIGHLIGHTSAED 4.0 billion development sales (+53% versus 2018)
Strategic land swap with the Government of Abu Dhabi enabling Aldar to consolidate development focus on key destinations, including Saadiyat Island
Four development project launches comprising 1,506 units
2019 development management business revenue and gross profit up 27% and 4% respectively
AED 5 billion awards from the Government of Abu Dhabi across national housing, infrastructure works and development of the new twofour54 media free-zone on Yas Island
Announcement of Saadiyat Grove, a mixed-use development located within the Saadiyat Island Cultural District
Over AED 3 billion in contract awards made over 2019
Increased revenue backlog to AED 4.4 billion as at 31 December 2019, giving further visibility on future cash flows
83% sold across all projects currently under construction

29A
ldar
Ann
ual R
epor
t 20
19
78%
4%
12%
3%3%
LAND BANK Aldar’s original business model stems from taking raw land, developing infrastructure and creatinga masterplan that sets out a clear vision for the destination. Aldar’s exceptional experience in creating Abu Dhabi’s key destinations continuesto be a driver of value generation and will servethe Company well in the future.
As at 31 December 2019, Aldar’s land bank comprises a diverse portfolio of approximately 70 million sqm of land at various stages of development. The land bank stretches across the Emirate of Abu Dhabi, ranging from key destinations such as Yas Island, Shams Abu Dhabi on Al Reem Island and Saadiyat Island, established locations on Abu Dhabi Island and in the broader Abu Dhabi mainland region, which includes Seih Sdeirah on the border with Dubai.
This diversified land bank has allowed Aldar to offer a broad range of residential product through thereal estate cycle. Over the past five years, Aldar has
launched over 9,000 off-plan residential units across 19 development projects catering to key segments of the market.
DESTINATION DEVELOPMENT In its role as a master developer, Aldar is responsible for the long-term vision and development of strategic destinations that are instrumental in supporting the long-term development of Abu Dhabi. These developments include the important locations of Al Raha Beach, Al Reem Island andYas Island. Most recently, Aldar acquired new destinations that include Saadiyat Island andMina Zayed, to further cement its position as one of the leading destination masterplan developersin the world.
In addition to developing its own land bank,Aldar has pursued an active programme to attract third-party developers to co-develop key destinations to spread risk and widen the range of products on offer to end-users and investors.
Development sales
AED 4.0bn2019 Buyer demographics
UAE Middle East Europe Asia Other
20192018201720162015
4.0
2.6
3.53.5
3.0

30St
rate
gic
Rep
ort
YAS ISLANDYas Island has been at the centre of Aldar’s development strategy since the Company’s inception. The original masterplan concept behind Yas Island was to develop a world class leisure and entertainment hub that includesa Formula 1 circuit, theme parks, golf courses, marinas, retail and concert arenas. The delivery of these attractions has played an important role in supporting the tourism growth witnessed in Abu Dhabi over the past decade.
Yas Island remains central to Aldar’s strategy for the development management and asset management businesses. To date, Aldar has delivered nearly 2,000 residential units to customers and currently has more than 3,000 units under development, which will significantly increase the island’s population in the coming years. Aldar is also developing the new twofour54 media and entertainment free-zone that will bring approximately 10,000 permanent workers onto Yas Island following its scheduled completion in 2022.
From an asset management perspective, the majority of Aldar’s hotel portfolio is located on Yas Island, with the Yas Plaza complex and Yas W hotels accounting for close to 2,000 keys. Aldar’s flagship retail asset, Yas Mall, which sits at the centre of the island, is Abu Dhabi’s premier shopping destination with over 400 international brands and the region’s largest international department store.
SAADIYAT ISLAND
Mamsha Al Saaiyat Jawaher Saadiyat Reserve Saadiyat Grove Cranleigh Abu Dhabi Saadiyat Beach Club Saadiyat Beach Golf Club Saadiyat district cooling
assets Saadiyat retail
YAS ISLAND
West Yas Mayan Yas Acres Water’s Edge Ansam Lea
Yas Links Yas W Hotel Yas Mall IKEA ACE Hardware Yas Plaza Hotels
Operational Review (continued)
DEVELOPMENT MANAGEMENT CONTINUED
SAADIYAT ISLANDFollowing the acquisition of land from Tourism Development & Investment Company (TDIC) in 2018 and the land swap with the Government ofAbu Dhabi in late 2019, Saadiyat Island now sits at the heart of Aldar’s development business. Saadiyat Island is a premier island destination, spanning 27 sqkm and created around an environmentally sensitive philosophy and low-density masterplan. The island is home to three main areas, Saadiyat Cultural District, Saadiyat Beach District and Saadiyat Marina District.
Saadiyat’s vibrant Cultural District will bring together The Louvre Abu Dhabi, Zayed National Museum and The Guggenheim Abu Dhabi – all designed by Pritzker prize winners. The area is also home to the purpose-built art and culture centre, Manarat Al Saadiyat and the UAE Pavilion.
With a pristine beachfront, home to several 5-star hotels, a golf course and beach club, the island is a prestigious address in Abu Dhabi, which offers a discerning lifestyle. The island also hosts world-class educational offerings, including The Redwood Nursery, Cranleigh Abu Dhabi and New York University Abu Dhabi.
Aldar delivered both the Mamsha Al Saadiyat and Jawaher developments in 2019, bringing new residential options to the market and this will soon be complemented by the launch of Saadiyat Grove, a mixed-use development in the heart of the Cultural District.

31A
ldar
Ann
ual R
epor
t 20
19
AL RAHA BEACH
Al Muneera Al Zeina Al Bandar Al Hadeel HQ Building Al Raha Plaza Al Raha Beach
Community Retail
Meera The Bridges Reflection Sun & Sky Towers Shams BOUTIK The Gate Towers and The Arc Boutik Gate Reem Central Park
REEM BEACH
DM ASSETS AM ASSETS
SHAMS ABU DHABI, AL REEM ISLANDAl Reem Island is closely connected to the traditional centre of Abu Dhabi city and the new financial centre on Maryah Island by five bridges and is only a 20-minute drive from Abu Dhabi International Airport. The island offers the very best in capital living in a beautiful setting with breathtaking views of the city and its surroundings.
Key amenities include Repton School, Sorbonne University, Boutik Mall, Gate Towers, Sun & Sky Towers and Reem Central Park. Aldar’s master-planned community on Al Reem Island includes The Gate Towers and The Arc and Sun & Sky Towers. Following completion of Aldar’s first mid-market positioned residential product, Meera, in 2019, Aldar’s next handover on the island will be The Bridges development.
AL RAHA BEACH Al Raha Beach is a mix of premium residential, commercial, cultural, entertainment and public amenities.
Incorporating 5.2 million sqm of natural beachfront, Al Raha Beach is also conveniently located next to the main highway linking Abu Dhabi and Dubai. Accommodating over 3,000 completed Aldar units, Al Raha Beach contains four flagship landmarks, each one distinct from the next – Al Bandar, Al Hadeel, Al Muneera and Al Zeina.
These diverse precincts are all residential and mixed-use developments with an array of facilities including an exclusive clubhouse, retail outlets and swimming pools. Al Raha Beach also offers a welcoming ambience to residents and guests through an abundance of dining choices, landscaped lawns and peaceful water fountains. This is a destination that offers something for everyone.
KEY

32St
rate
gic
Rep
ort Operational Review (continued)
DEVELOPMENT MANAGEMENT CONTINUED
As part of the land swap with the Abu Dhabi Government, Aldar exchanged its longer-term land opportunities located within Al Raha Beach that required significant investment with infrastructure-enabled land plots on Saadiyat Island. WhileAl Raha Beach is no longer an active development destination for Aldar, it has played an instrumental role in making Aldar what it is today.
69%
17%
6%4%
4% 1%
Buyer nationalities
UAE MENA Asia Europe American Other
Units sold in 2019 to first time buyers of Aldar
76%Total sold units under development
5,388Total sales value (AED mn)
13,910Total units launched
6,509Sold units under development
83%
PROPERTY DEVELOPMENT Aldar’s core development business is focused on off-plan residential property development through activation of Aldar’s diverse land bank. As at 31 December 2019, Aldar had close to 7,000 residential units under development, of which83% had been sold.
During 2019, Aldar launched four new developments to the market: Alreeman, Alreeman II, Lea and Saadiyat Reserve. These projects predominantly focused on offering well located, infrastructure- enabled land plots for villa development. All four developments were extremely well received by the market and contributed significantly to achieving 2019’s development sales of AED 4 billion.
In late November, Aldar announced Saadiyat Grove,a mixed-use development located within the cultural district of Saadiyat Island that will connect all three museums together on completion. Saadiyat Grove is expected to be launched to the market in the first half of 2020.

33A
ldar
Ann
ual R
epor
t 20
19
2019-21E2016-18201720162015
150
100
DM segmental gross profit guidance increase following 2017 awards
+50%
DEVELOPMENT MANAGEMENT Further to developing its own land bank through off-plan residential development and developing assets to lease through the asset management business, Aldar works closely with third partiesto tender for large scale projects, utilising the Company’s development capabilities and procurement know how.
In 2019, Aldar was awarded three major development management projects worth AED 5 billion to develop a national housing scheme, a new media and entertainment free-zone on Yas Island and key remaining infrastructure works on Saadiyat Island. The first two are based on fixed-price contracts where Aldar will recognise the full revenue and costs associated with the development whilst the infrastructure project will be recognised on a fee-only basis.
AL FALAH
Type National housing
Land Non-investment zone
Location Al Falah
TWOFOUR54
Type Media free-zone
Land Investment zone
Location Yas Island
SAADIYAT INFRASTRUCTURE
Type Infrastructure work
Land Investment zone
Location Saadiyat Island
AE
D m
n
34St
rate
gic
Rep
ort Operational Review (continued)
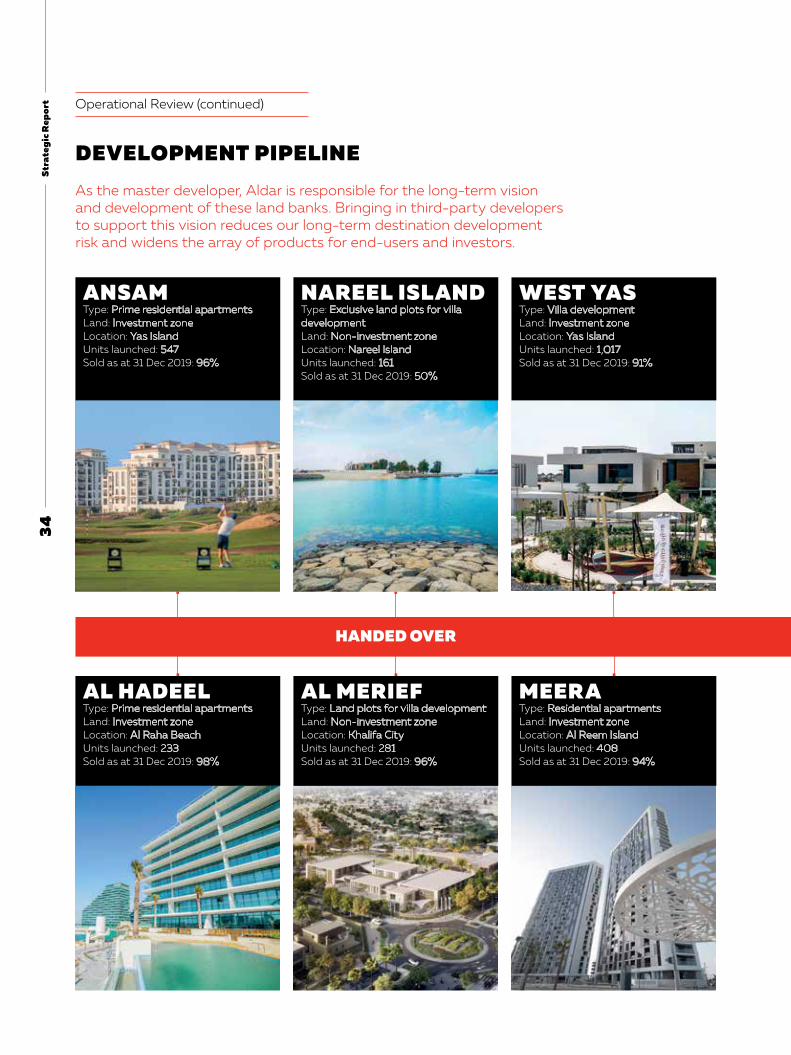
DEVELOPMENT PIPELINE
ANSAM Type: Prime residential apartmentsLand: Investment zoneLocation: Yas IslandUnits launched: 547Sold as at 31 Dec 2019: 96%
AL HADEEL Type: Prime residential apartmentsLand: Investment zoneLocation: Al Raha BeachUnits launched: 233Sold as at 31 Dec 2019: 98%
NAREEL ISLAND Type: Exclusive land plots for villa development Land: Non-investment zoneLocation: Nareel IslandUnits launched: 161Sold as at 31 Dec 2019: 50%
AL MERIEF Type: Land plots for villa developmentLand: Non-investment zoneLocation: Khalifa CityUnits launched: 281Sold as at 31 Dec 2019: 96%
WEST YAS Type: Villa developmentLand: Investment zoneLocation: Yas IslandUnits launched: 1,017 Sold as at 31 Dec 2019: 91%
MEERA Type: Residential apartmentsLand: Investment zoneLocation: Al Reem IslandUnits launched: 408Sold as at 31 Dec 2019: 94%
HANDED OVER
As the master developer, Aldar is responsible for the long-term vision and development of these land banks. Bringing in third-party developers to support this vision reduces our long-term destination development risk and widens the array of products for end-users and investors.
35A
ldar
Ann
ual R
epor
t 20
19
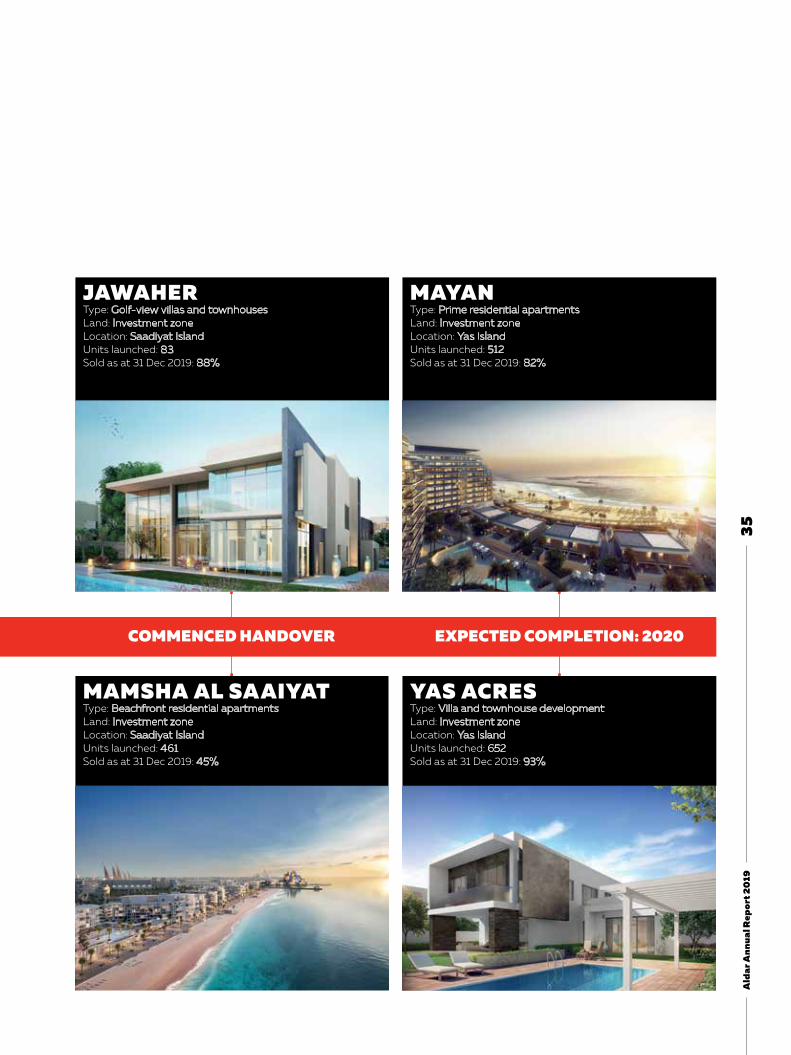
JAWAHER Type: Golf-view villas and townhousesLand: Investment zoneLocation: Saadiyat IslandUnits launched: 83 Sold as at 31 Dec 2019: 88%
MAYAN Type: Prime residential apartmentsLand: Investment zoneLocation: Yas IslandUnits launched: 512 Sold as at 31 Dec 2019: 82%
MAMSHA AL SAAIYATType: Beachfront residential apartmentsLand: Investment zoneLocation: Saadiyat IslandUnits launched: 461Sold as at 31 Dec 2019: 45%
YAS ACRES Type: Villa and townhouse developmentLand: Investment zoneLocation: Yas IslandUnits launched: 652Sold as at 31 Dec 2019: 93%
COMMENCED HANDOVER EXPECTED COMPLETION: 2020

36St
rate
gic
Rep
ort Operational Review (continued)
DEVELOPMENT PIPELINE CONTINUED
THE BRIDGES Type: Mid-market residential apartmentsLand: Investment zoneLocation: Al Reem IslandUnits launched: 636Sold as at 31 Dec 2019: 97%
ALGHADEER Type: Residential land plotsLand: Investment zoneLocation: Seih SdeirahUnits launched: 707 Sold as at 31 Dec 2019: 60%
WATER’S EDGE Type: Mid-market residential apartmentsLand: Investment zoneLocation: Yas IslandUnits launched: 1,236 Sold as at 31 Dec 2019: 96%
REFLECTION Type: Mid-market residential apartmentsLand: Investment zoneLocation: Al Reem IslandUnits launched: 192 Sold as at 31 Dec 2019: 79%
EXPECTED COMPLETION: 2021EXPECTED COMPLETION: 2020/21

37A
ldar
Ann
ual R
epor
t 20
19
ALREEMAN Type: Mid-market residential land plots Land: Investment zoneLocation: Al ShamkaUnits launched: 1,012Sold as at 31 Dec 2019: 90%
SAADIYAT RESERVE Type: Residential land plotsLand: Investment zoneLocation: Saadiyat IslandUnits launched: 223 Sold as at 31 Dec 2019: 49%
ALREEMAN II Type: Mid-market residential apartmentsLand: Non-Investment ZoneLocation: Al ShamkhaUnits launched: 557Sold as at 31 Dec 2019: 85%
LEA Type: Residential land plotsLand: Investment zoneLocation: Yas IslandUnits launched: 238 Sold as at 31 Dec 2019: 87%
EXPECTED COMPLETION: 2021
38St
rate
gic
Rep
ort Operational Review (continued)
ASSET MANAGEMENT Aldar’s asset management business is focused on a diverse asset portfolio that is complemented by several key adjacent businesses to support Aldar’s offering.
In 2018, Aldar carved out the long-term rental real estate assets into a 100% owned subsidiary, Aldar Investment Properties LLC ('Aldar Investments'). The basis for this new entity was to create the most efficient platform for real estate ownership in the region.
One immediate benefit from the new structure, was a standalone credit rating for Aldar Investments, which achieved a Baa1 credit rating, one notch higher than the parent company (Aldar Properties PJSC) credit rating of Baa2, and the highest credit rating for a non-government corporate in the region. This translates into significant value for Aldar as it is able to efficiently raise long-term debt at lower cost than the traditional structure under Aldar.
Assets across 4 sectors
79Recurring revenues
7%GROWTH TO AED 3.4 BILLION
Net operating income
6%GROWTH TO AED 1.7 BILLION

39A
ldar
Ann
ual R
epor
t 20
19
17%
20%
14%21%
28% 29%
29%
25%
7%
11%
ALDAR ASSET MANAGEMENT OVERVIEW
FY 2019 revenue split by sector FY 2019 NOI split by sector
Residential Retail Commercial Hospitality Adjacent businesses
Residential Retail Commercial Hospitality Adjacent businesses
Portfolio weighted average unexpired lease term (WAULT)
4.7 yearsOccupancy across hospitality portfolio
75%
Gross asset value (GAV) (AED)
18.5bnGross leasable area (GLA) ( sqm)
2.1mnOccupancy across investment properties portfolio
89%Gross debt (loan-to-value ratio (LTV))
38%

40
Stra
tegi
c R
epor
t Operational Review (continued)
ASSET MANAGEMENT CONTINUED
RESIDENTIAL HIGHLIGHTS
RESIDENTIAL
Sqm GLA across 12 assets (5,620 units)
829,282Rental declines
5% LfLBulk leases
49%
WAULT
6.1 yearsGross profit margins
85%Occupancy
88%Etihad JV assets acquired in Q2 2019
Al Murjan Tower sold in Q2 2019

41
Ald
ar A
nnua
l Rep
ort 2
019
84%
16%
36%
32%
5%
19%
8%
49%51%
7%
52%34%
8%
Unit type
Unit type split
Lease type split
Location
Apartments Villa
Studio 1-bed 2-bed 3-bed 4-bed
Bulk Individual
Abu Dhabi mainland
Abu Dhabi Island Al Reem Island Other
RESIDENTIAL ASSET BREAKDOWN
The residential asset management portfolio includes 5,620 residential units across 12 high-quality developments featuring excellent amenities and facilities. All of the residential units are located within Abu Dhabi, with a concentration of units positioned between Abu Dhabi mainland and Al Reem Island.
The residential portfolio has grown significantly over the last five years following two major completions in 2014, Al Rayyana and The Gate Towers, collectively adding approximately 3,000 units to the portfolio. In 2019, this was further supported with the acquisition of 789-unit Etihad Plaza, partly offset by the sales of Al Murjan Tower. Today, the residential units in our portfolio appeal to a broad demographic spectrum as it includes a wide array of high-quality units ranging from studio apartments to large four and four plus bedroom villas.
As at 31 December 2019, two further projects are under development that will drive further growth of the portfolio and add over 1,110 units to the portfolio. The Bridges and Water’s Edge will also expand
Aldar’s offering to provide a high-quality mid-income targeted rental product with the latter also increasing capacity on Yas Island.
TOP RESIDENTIAL TENANTS
Tenant % of Rent
Cleveland Clinic Abu Dhabi LLC 10-15%
Defense Conseil International Servicesand Assistance Real Estate LLC 10-15%
Department of Education and Knowledge <5%
Aldar Academies <5%
ADNOC Schools <5%
RESIDENTIAL LEASE TERMS AND DURATIONWAULT stands at 6.1 years as at 31 December 2019. This is supported by the fact that 49% of the residential units are leased on a bulk, long-term basis. Typical terms for individual tenants are done on rolling 12-months leases. For bulk tenants, these leases typically range from 3 to 30 years.

42
Stra
tegi
c R
epor
t
45%
20%
35%
55%
18%2%
27%
Type split Location split
Destination Community Big box
Yas Island Al Ain Community Saadiyat Island
Operational Review (continued)
ASSET MANAGEMENT CONTINUED
RETAIL
RETAIL ASSET BREAKDOWN
Sqm GLA across 32 assets (1,236 retail units)
485,060Rental declines
9% LfLSqm GLA extension to Al Jimi Mall opened in Q2 2019
30,000Sqm GLA added to portfolio by acquisition of Etihad Plaza
8,000
WAULT
3.7 yearsGross profit margins
70%Trading occupancy
89%
RETAIL HIGHLIGHTS

43
Ald
ar A
nnua
l Rep
ort 2
019
47%
8%
22%
4%
19%
Tenant split
Anchor Large space Line shop Major space F&B
Our retail portfolio includes 485,060 sqm gross leasable area (GLA) across 32 assets within theAbu Dhabi metropolitan area and Al Ain.
The retail strategy is split between communityretail, which offers residents key amenities such as supermarkets and restaurants, and destination retail, which provides a much broader retail, entertainment and leisure offering.
The community retail predominantly includes on-site convenience retail, based around many of Aldar’s residential communities. Destination retail includes Aldar’s two largest retail assets, Yas Mall and Al Jimi Mall.
In 2019, we delivered a AED 400 million expansion and renovation to Al Jimi Mall, adding 30,000 sqm GLA to that asset.
YAS MALL Yas Mall is the flagship asset in the retail and asset management portfolio. Yas Mall is located in the centre of Yas Island, within close proximity of the key leisure and entertainment offerings on the island, such as Ferrari World and Warner Bros. World
Opened in November 2014, Yas Mall lifted the Abu Dhabi retail offering as the first super-regional mall. The mall has now completed six years of operations and occupancy stands at 88% as at 31 December 2019.
RETAIL LEASE TERMS AND DURATIONWAULT stands at 3.7 years as at 31 December 2019. Typical lease terms for line shops and anchor tenants range from 3 to 5 years to 7 to 10 years respectively.
TOP 5 RETAIL TENANTS
Tenant % of Rent
Dareen International Co LLC 10-15%
Landmark Retail Group <5%
Hamad & Mohamad Al-Futtaim Company <5%
Allied Enterprise Llc <5%
Fucom LLC <5%
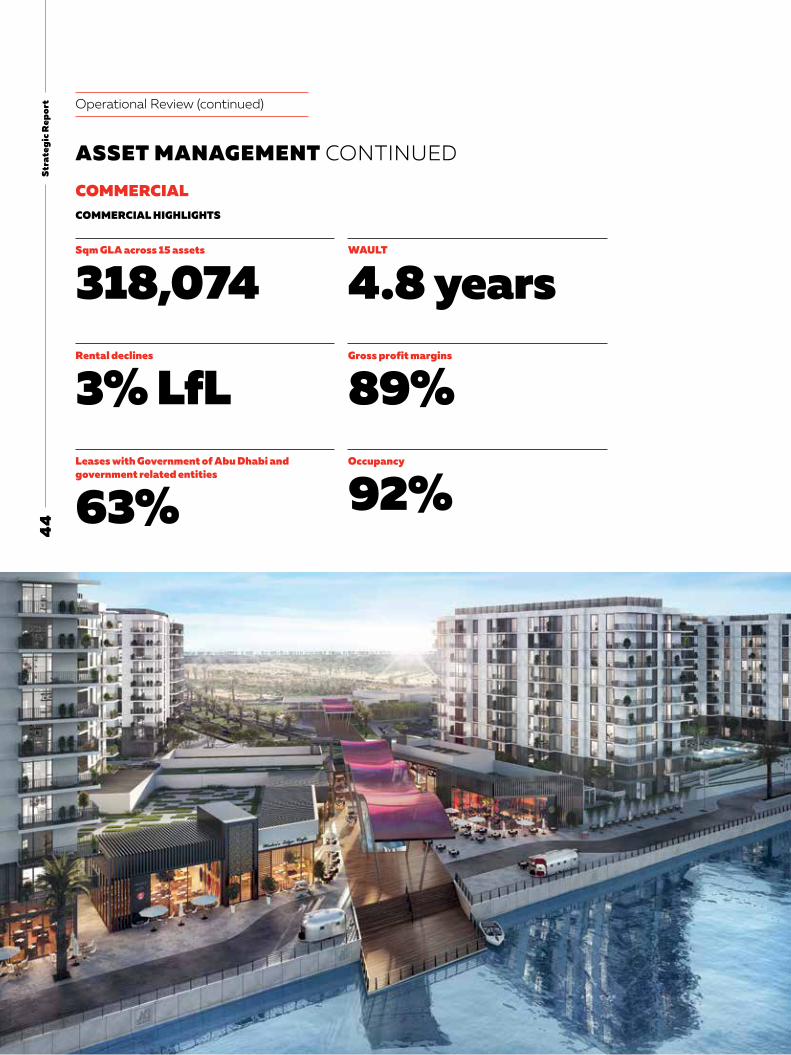
44
Stra
tegi
c R
epor
t Operational Review (continued)
ASSET MANAGEMENT CONTINUED
COMMERCIAL
Sqm GLA across 15 assets
318,074 Rental declines
3% LfLLeases with Government of Abu Dhabi and government related entities
63%
WAULT
4.8 yearsGross profit margins
89%Occupancy
92%
COMMERCIAL HIGHLIGHTS

45
Ald
ar A
nnua
l Rep
ort 2
019
63%
37%
57%
21%
10%
12%
Tenant split Location split
Government Reporting Entity (GRE) Corporate and others
Al Raha Beach Abu Dhabi Island Al Reem Island Other
54%
27%
18%
Type split
Grade A Grade B Other
COMMERCIAL ASSET BREAKDOWN
Our office portfolio includes 318,074 sqm GLA, predominantly focused on Grade A office spaces within Abu Dhabi Island.
The office portfolio is predominantly leased on a long-term basis to government and government-related entities, which is representative of the Abu Dhabi commercial office tenant market. Aldar’s commercial asset portfolio strategy is to maintain high-quality commercial space and build long-term relationships with tenants.
The most recent additions to the portfolio is Etihad Airways Centre in Q2 2019 and the acquisition of 39,000 sqm GLA International Tower in 2017.
COMMERCIAL OFFICE LEASE TERMS AND DURATIONWAULT stands at 4.8 years as at 31 December 2019. This is supported by the fact that 63% of the commercial space is leased on long term contracts to government and government related entities. Typical lease structures range from 3 to 5 or 5 to 10 years for small and large entities.
TOP 5 COMMERCIAL TENANTS
Tenant % of Rent
Department of Economic Development 15-20%
National Health Insurance Company 5-10%
Mubadala Development Company 5-10%
The Department of Urban Planning and Municipalities (DPMO) 5-10%
Etihad Airways <5%
Sqm GLA added to portfolio in Q2 2019 by addition of Etihad Airways Centre
+18,000

46
Stra
tegi
c R
epor
t
30%
42%
11%
16%
77%
10%
13%
5-star 4-star 3-star Serviced
Hotel type by keys Location split by keys
Yas Island Abu Dhabi Island Other
55%
45%
Hospitality revenue split
Room rates F&B and other
Operational Review (continued)
ASSET MANAGEMENT CONTINUED
HOSPITALITY
HOSPITALITY ASSET BREAKDOWN
Sqm GLA across 11 assets (2,930 keys)
436,313ADR growth
5% LfL
Complimentary leisure assets including golf courses and a beach club
4
Keys located on Yas Island
70%
Gross profit margins
18%Occupancy
75%
HOSPITALITY HIGHLIGHTS

Ald
ar A
nnua
l Rep
ort 2
019
4
7
Our hotels portfolio includes 2,930 keys across 11 hotels and serviced apartments across Abu Dhabi. The hotel portfolio includes a broad range of product offerings including 5-star, 4-star and 3-star hotel rooms and serviced apartments.
With 77% of our hotel keys located on Yas Island,our core strategy remains focused on continued activation of the island through major events and promotion, working alongside the relevant partners to achieve this strategy.
Aldar does not operate five of its hotel properties. Instead, it employs reputable international operators through hotel management agreements to manage
the day-to-day operation of these assets. Aldar’s five other hotels and serviced apartment properties, which are clustered together at Yas Plaza, on Yas Island, are operated on a franchise model through franchise agreements, whereby Aldar has createda hotel management platform comprising hotel management experts to oversee these assets.
HOSPITALITY LEASE TERMS AND DURATIONAldar’s agreements with its hotel management companies or operators have initial terms ranging from 15 to 20 years, and typically can be extended either at the management company's or operator's option or reduced automatically, subject to notice to terminate.

48
Stra
tegi
c R
epor
t
20192018201720162015
465
379
20192018201720162015
98
54
Operational Review (continued)
ASSET MANAGEMENT CONTINUED
ADJACENT BUSINESSES
In addition to asset management’s core business of real estate ownership, it owns a number of strategic adjacent businesses. These businesses complement Aldar’s core skill set and bring in significant value to the Group.
FY 2019 Revenue
+23%FY 2019 Gross profit
+80%EDUCATION Aldar Academies LLC ('Aldar Academies') is a wholly owned subsidiary of Aldar. Aldar Academies is the leading operator and provider of private educationin the Emirate of Abu Dhabi with the largest networkof schools, delivering the English, International Baccalaureate and American curriculums adapted for the UAE. Aldar Academies is licensed by the Abu Dhabi Department of Education and Knowledge (ADEK) and with many schools rated as 'Outstanding' and the remaining 'Very Good' with outstanding features. Further to organic expansion, more recently Aldar Academies has been the only academic group in the region to have championed the charter school model for Abu Dhabi. In addition to Al Rayanna School, five new charter schools are being managed by Aldar Academies for the 2019/20 academic year that further complement the management of ADNOC schools, that were brought under Aldar Academies management in 2017.
In total, Aldar Academies has tripled student numbers to c.22,000 students in last two academic years driving revenue and profit growth.
AE
D m
n
AE
D m
n

49
Ald
ar A
nnua
l Rep
ort 2
019
20192018201720162015
405368
20192018201720162015
85
57
20192018201720162015
41
8
20192018201720162015
42
27
PROPERTIES AND FACILITIES MANAGEMENTOver the past decade, Aldar has developed a leading properties and facilities management business, Khidmah, to support the operational asset management of its portfolio.
In 2018, Aldar separated the properties and facilities management business into two, property management (named Provis) and facilities management (retaining the Khidmah name). This followed a move to acquire the minority stake in the business (40%) to take full control and ownership of these strategic investments.
Whilst Provis and Khidmah are independently managed from Aldar, they play a significant role in the asset management business. Provis is specifically focused on sales and leasing, property management and consultancy services whilst Khidmah remains focused specifically on domestic, commercial and retail facility management solutions.
DISTRICT COOLINGAldar owns two district cooling plants on Saadiyat Island in Abu Dhabi that service hotels, NYU Abu Dhabi, Louvre Abu Dhabi and other key assets. The assets were acquired as part of the TDIC asset acquisition in 2018 and provide a stable income, which sees steady growth in the medium-term driven by capacity requirements from new key Saadiyat Island assets.
FY 2019 Revenue
+10%
FY 2019 Revenue
+48%
FY 2019 Gross profit
+80%
FY 2019 Gross profit
+54%
AE
D m
nA
ED
mn
AE
D m
nA
ED
mn

50St
rate
gic
Rep
ort
20192018201720162015
7.1
6.36.26.2
4.6
20192018201720162015
1.91.92.0
2.82.6
20192018201720162015
2.82.62.72.6
2.2
20192018201720162015
4.0
2.6
3.53.5
3.0
KPIs
MEASURING OUR SUCCESS
Revenue (AED bn)
AED 7.1bn(2018: AED 6.3 BILLION)
Gross profit (AED bn)
AED 2.8bn(2018: AED 2.6 BILLION)
Net profit (AED bn)
AED 1.9bn(2018: AED 1.9 BILLION)
Development sales (AED bn)
AED 4.0bn(2018: AED 2.6 BILLION)

51A
ldar
Ann
ual R
epor
t 20
19
20192018201720162015
1.71.61.61.6
1.5
20192018201720162015
8990919396
20192018201720162015
14.514.0
12.011.0
10.0
20192018201720162015
7573787779
AM NOI (AED bn)
AED 1.7bn(2018: AED 1.6 BILLION)
Dividend per share (fils)
14.5(2018: 14 FILS)
Investment properties occupancy (%)
89%(2018: 90%)
Hospitality occupancy (%)
75%(2018: 73%)

52St
rate
gic
Rep
ort
Time
AlreemanReflection
LeaAlreeman IISaadiyat Reserve
Alghadeer
Water’s Edge
The Bridges
Yas Acres
JawaherMamsha Al Saaiyat
AnsamAl HadeelNareel IslandAl MeriefWest YasMeera
0%
100
%R
even
ue re
cogn
ised
Launcheddevelopment
for sale
Tender contractand early works
Main construction
stage
Final stages ofconstruction
Handover
Launch date c.2-2.5 years
Mayan
Financial Review
Aldar produced a strong financial performance in 2019 and achieved progress on a number of strategic initiatives designed to generate further growth in 2020 and beyond.
The Company recorded 17% growth in revenue and solid increases in gross profit and net income, of 5% and 4% respectively.
The Company operates a straight-forward business model, with two major, complementary platforms: development management and asset management. Over several years we have progressively enhanced our disclosure, policies and guidance to underline the distinctive nature of these businesses.
Our development management business continues to deliver a positive performance, posting a fourth consecutive year of over AED 1 billion of gross profit in 2019. Aldar benefits from a diverse development pipeline of projects at various stages of construction
DM revenue based on progress of completion
Fourth consecutive year of AED 1 billion or higher DM gross profits delivered
AED 1bn
Development Management Read more on page 28.
that fuel property development revenue recognition on off-plan sales over the project construction lifecycle with newly launched development projects providing visibility on future revenues over the coming years. This primary revenue driver is supplemented by fee income from managing third-party projects and sales from land and completed inventory. As at 31 December 2019, the contracted revenue backlog stood at AED 4.4 billion, up 5% from a year earlier.

53A
ldar
Ann
ual R
epor
t 20
19
This core property development activity drivesa high proportion of the profit generated by the development management business. It is complemented by a management franchise, which leverages Aldar’s development and procurement capabilities to provide services to third-parties fora fixed management fee or on a fixed-price basis.
In 2019, Aldar received tender awards for AED 5 billion worth of projects from the Government of Abu Dhabi to manage the development of infrastructure, national housing and a commercial free-zone onYas Island. These awards were testament to the capability of Aldar’s franchise, and have driven an upward adjustment to this segment’s standalone profit guidance to AED 150 million per year from the previous AED 100 million.
Our development pipeline now includes over 6,500 residential units and is 83% sold across all projects currently under development. Over the past two years, this business has shifted from solely launching new projects to having a consistent stream of handovers to customers. In 2019, this was predominantly driven by the Meera, Mamsha Al Saaiyat and Jawaher projects. This development pipeline as illustrated in the chart opposite demonstrates where each project is within its development cycle.
% sold across all developments launched for sale
83%
Development sales backlog as at 31 Dec 2019
AED 4.4bn
% increase in DM segmental profit guidance to AED 150 million per year over 2019-2022
50%
“The Perfect 10 event – a 10-day event that generatedAED 0.5 billion in new development sales in Q4 2019.”
Development sales during 2019 reached a record AED 4.0 billion, up 53% from 2018. This was driven by four highly successful launches and a proactive sales strategy for existing inventory under development and nearing completion, which included 'The Perfect 10' campaign.
The strategic TDIC asset acquisition, which included Saadiyat Island land plots and several projects under development, was an important driver of 2019 development performance as we advanced these key projects to handover and launched the Saadiyat Reserve development.
Consolidation among Abu Dhabi developers overthe last decade has resulted in a more constructive supply dynamic within Abu Dhabi, and we see important macro-economic drivers emerging that will create demand for real estate in the coming years. In 2020, we will continue to assess new opportunities for well designed, thoughtful product, that addresses under-served segments of the market. As such, we have maintained our development sales guidance at AED 4 billion.
Our asset management business achieved a resilient performance in 2019, with 6% growth in net operating income, supported by recent asset additions including the Etihad JV assets, the opening of the Al Jimi Mall extension and the full-year impact of the acquired TDIC operating assets. While we saw continued pressure on our like-for-like rates in key segments, such as retail and residential, the quality and diversity of this unique portfolio ensured that our income streams remained robust despite a challenging environment.
This growth and resilience is a credit to the unique scale and sector diversification of our platform, which we believe to be the most efficient platform forreal estate ownership in the region. Following the transfer of all long-term real estate assets into our 100% owned subsidiary Aldar Investments in 2018, that business achieved a credit rating of Baa1 from Moody’s – the highest for any non-GRE (government-related entity) in the region.

54St
rate
gic
Rep
ort
Debt policy (As at 31 Dec 19)
DEVELOPMENT MANAGEMENT
ASSET MANAGEMENT
ALDAR INVESTMENTS
(BAA1 – MOODY'S)
ALDAR PROPERTIES PJSC
35-40% LTV (38.0%)
100% owned
<25% LTV (13.3%)
Prudent capital management and governance in place
Financial Review (continued)
Gross cash stood at AED 5.7 billion as at 31 December 2019, of which AED 2.6 billion is free cash, AED 2.3 billion restricted cash and AED 0.8 billion in escrow. The Group remains well funded and has strong liquidity through existing undrawn debt facilities of AED 3.4 billion.
Our dividend policy provides transparency and visibility on shareholder returns. This pay-out is based on the underlying performance of both the asset management and development management businesses.
The Board has recommended a 4% increase in dividend for 2019 to 14.5 fils per share, with a proposed total pay-out of AED 1.14 billion. This increase was supported by the resilient performance of our asset management business, which generated approximately 80% of the total proposed dividend, and the realisation of cash profits from development projects moving into handover phase.
The dividend policy is based on a 65-80% pay-out on distributable free cash flow from the asset management business plus a 20-40% pay-out on realised cash profit from the development business upon handover of developments.
Aldar Investments subsequently successfully raised better priced, longer duration bullet debt, allowing for the generation of strong cash flows to deliver attractive dividends and for reinvestment to drive future growth.
The asset management business now owns closeto AED 20 billion in high-quality real estate assets, diversified across the residential, retail, office, hotel and education segments. The portfolio representsa unique portfolio of income-generating real estate in Abu Dhabi, one of the few remaining ‘AA’ rated economies globally. Abu Dhabi will remain at the core of Aldar’s growth strategy and we see attractive opportunities to expand this business through development to hold investment in the portfolioand via acquisitions.
In 2020, we expect to see growth from our asset management business, driven by the full year impact of the Etihad asset acquisition and Al Jimi Mall extension that opened in early 2019, as well as growth across our key adjacent businesses, Aldar Academies, Khidmah and Provis. As such we haveset our net operating income guidance for 2020 at AED 1.8 billion.
Our financial position as at 31 December 2019 remains solid. The Group continues to generate strong operating cash inflows across both businesses and maintaining gross debt levels well within the debt policy levels for both asset management and development management businesses.
Highest net operating income achieved to date
AED 1.7bn
Eighth consecutive progressive dividend declared
8th
“Aldar Investment has the highest credit rating for a non-GRE corporate in the region at Baa1.”

55A
ldar
Ann
ual R
epor
t 20
19
Development Management business
Asset Management business
Distribute free cash flow Realised profit
65-80%
~80%
+
20-40%
~30%
Net operatingincome less:
Interest expense Maintenance capex
Overheads
Upon completion and handover
of developmentMETHODOLOGY/KEY DRIVERS
PAY-OUT FACTOR
RANGE
2019 DIVIDEND: 14.5 FILS PER SHARE
POLICY
Dividend policy
20192018201720162015
13% CAGR (2012-2019)
201420132011 2012
14.514.0
12.011.0
10.09.0
7.06.0
0
Dividend policy (fils)
In 2019, we launched our first Sustainability Report. Sustainability is a key priority for Aldar as we seek to improve our performance across our four key sustainability pillars – the economy, people, community and environment. We are committed to driving a strong performance culture because we believe that by conducting ourselves respectfully and creating value for all our shareholders is best achieved by balancing the needs of today with the needs of tomorrow. Launching this report marks a significant step towards greater transparency and constructive engagement with our stakeholders and reaffirms our commitment towards sustainable development.
In the first few months of 2020 we saw Covid-19 quickly escalate to become a global pandemic. Our priority remains the health and safety of our employees, communities and customers. We continue to monitor the situation, closely, guided by UAE authorities and global organisations such as the World Health Organisation.
While it is too soon to assess the impact the virus will have on our business, Aldar is entering this challenging period from a position of strength. We have a robust balance sheet and conservative debt position and we maintain a comfortable liquidity position, with over AED 5 billion unrestricted free cash and undrawn committed credit facilities as well as near term debt maturities.
Greg FewerChief Financial & Sustainability Officer
Sustainability Report Read more on page 62.

56St
rate
gic
Rep
ort Risk Management
Aldar has an established Enterprise Risk Management (ERM) function to ensure effective management of all risks that have the potential to hinder the Company from achieving its strategic objectives.
A dedicated ERM team is responsible for helping the Company’s business units to identify, assess and put in place control plans for existing and emerging risks.It regularly conducts comprehensive reviews of best practices and benchmarks against other companies in the market with robust ERM activities.
Primarily, a bottom-up approach is used for business unit-specific risks, while enterprise-wide risks rely on a top-down approach.
Each risk is identified and assessed through an impact and likelihood matrix to prioritise its importance. The identified risks with their relevant mitigation plans are escalated to different hierarchical committees according to pre-defined criteria and mandates. The ERM team continuously monitors, liaises and follows up with risk owners for updates and progress on mitigation plans until the risk matches the agreed risk appetite.
Aldar has a Board-approved ERM Charter and Policy & Procedure documents in place, which are periodically reviewed and updated. The meetings of the various mandated committees are convened periodically, which has helped to improve the function across the Company. Aldar’s Board and management firmly believe in continuous improvement and will persist to build on this solid foundation to strengthen risk management.
RISK MANAGEMENT
Risk management procedure
INITIATE RISK MANAGEMENT EXERCISERisk Management Plan
RECEIVE & REVIEW RISKS FROM FUNCTIONSDepartmental Risks
Project RisksAdjacency Risks
RISK ASSESSMENT AND PRIORITISATIONLikelihood of occurring
Impact on the organisationRisk Matrix of Impact vs. Likelihood
Risks tolerance appetite (Critical, High, Medium, Low)
ENGAGE WITH RISK OWNERSValidate the risks with the respective headsAgree on mitigation plans and time frame
RMC = Risk Management CommitteeMC = Executive Management CommitteeAC = Audit Committee
Process
Document
Decision
SUBMIT FINAL PRESENTATION TO RMC & MCKey risks with mitigation plans are presented by risk owners
for review and approval
Present critical risks to AC for review and approval

57A
ldar
Ann
ual R
epor
t 20
19
Aldar’s Risk Management Framework is highly linked and adapted to its business model, using the widely-accepted COSO enterprise risk management framework as its foundation.
Risks are classified into the following four categories:
• Strategic: High-level risks that can have a direct impact on the Company’s strategic objectives.
• Operational: Risks related to performance, customers, and the effective and efficient use of resources.
• Financial: Risks that can have a direct impact on the Company’s earnings and cash flow.
• Reporting & Compliance: Risks related to the reliability of reporting and compliance with applicable real estate-related laws and regulations.
Critical Risks Report to Audit Committee
High & Critical RisksReport to Executive Management Committee
All Levels of Risks Report to Risk Management Committee
Level C
Level B
Level A
THREE LEVEL COMMITTEE STRUCTUREAldar’s ERM Charter specifies three levels of reporting. The business units, through the ERM team, raise the risks and updates to be considered by the Risk Management Committee according to certain defined thresholds. These risks are presented to the Executive Management Committee and thereafter to the Audit Committee in line with risk level hierarchy. The ERM team continuously liaise with the risk owners and periodically report to relevant committees.
Risk Management Framework
Risk Governance
Board • Sets the tone and culture towards effective risk management • Approves ERM framework • Agrees on the entity’s risk appetite
Top-downIdentification,
assessment, mitigation and
oversight of risk at
Company level
Three level committees
Risk Management Committee (RMC) • Develops Risk
Management Framework
• Reviews the presented risks along with relevant assessments and mitigation plans
• Monitors the effectiveness and progress of mitigation plans
• Approves deliverables and recommendations to the MC
Executive Management Committee (MC) • Reviews high and
critical risks • Evaluates the existing
action plans and the proposed mitigation plans
• Assists in identification of principal and emerging risks
• Reviews and endorses internal controls in treatment plans for operational effectiveness
• Makes requisite recommendations to the AC
Audit Committee (AC) • Reviews critical risks • Monitors the effective
functioning of the RMC • Provides key highlights
to the Board as part of the AC’s annual report
Bottom-upIdentification,assessment
and mitigationof risk at
a business unitand functional
level
Risk ownership
Business units and risk owners • Identify and assess risks • Monitor the risks • Ensure effective and
timely mitigation plans
The periodic reporting mechanism as per risk level hierarchy is as follows:

58St
rate
gic
Rep
ort
Cer
tain
(5)
Like
ly (4
)P
ossi
ble
(3)
Unl
ikel
y (2
)Lo
w (1
)
Insignificant (1) Minor (2) Moderate (3) Major (4) Severe (5)
Principal risks heat map
LIK
ELIH
OO
D
IMPACT
Market cyclicality
Geographical concentration in the Emirate of Abu Dhabi
Talent retention
Health and safety
Information systems and cyber threat
Before mitigation plans
After mitigation plans
Risk Level Score Mitigation Plan Requirement Recommended Actions
Critical 20 to 25 • Mandatory for all risks • Treat (Reduce) • Transfer • TerminateHigh 10 to 16
Medium 4 to 9 • Risks rated ≥8 are assessed on a case-by-case basis
• Not mandatory for risks rated <6 as risks can be tolerated
• Tolerate (Accept)
Low 1 to 3 • Not mandatory as risks can be tolerated
Risk Management (continued)
PRINCIPAL RISKS

59A
ldar
Ann
ual R
epor
t 20
19
The Risk Risk Analysis Treatment Plan
Strategic: High-level risks that can have a direct impact on the Company’s strategic objectives.
1. Market cyclicality
• Ability for Aldar to effectively respond to local and regional changing market conditions.
Consequences • Potential negative impact on
launching of new developments and performance of asset portfolio.
• Potential negative impact on sales revenue, cash flows, asset valuations, debt/capital and credit rating.
The Board mitigates market risk through the review of the Group’s strategy on a regular basis and discussions are held to ensure the strategy is still appropriate or if it needs updating.
The Company is also actively implementing the risk treatment plan:
Developments Projects • Ensure accurate and appropriate business plans are in place
to anticipate customer preferences. • Launch projects in phases to reduce cash flow exposure. • Product diversification. • Enhanced market readiness to capitalise on any opportunity
via infrastructure enabled lands.
Asset Portfolio • Combined focus on tenant selection and improving their trading
performance through proactive leasing and targeted marketing initiatives.
• Full merchandising strategy in retail assets; zoning and category optimisation, sustainable pricing and innovative re-purposing.
• Continued focus on corporate deals to provide long term revenue visibility and de-risk residential portfolio revenue streams.
• Sustainability initiatives leading to cost saving through energy audit and energy saving initiatives.
• Enhancing customer experience through cross-selling across asset classes and introduction of loyalty programmes.
2. Geographical concentration in the Emirate of Abu Dhabi
• Geographical concentration from only operating in Abu Dhabi.
Consequences • Exposure to Abu Dhabi as a
single market will potentially constrain Aldar’s ability to grow and achieve its strategic objectives to deliver sustainable returns for shareholders.
The Company realises the inherent risk of geographical concentration of operations and is steadily mitigating it by: • Entering joint ventures within the wider UAE and in Gulf
Cooperation Council markets. • Developing regional and international sales and marketing
capability to expand the investor pool.

60
Stra
tegi
c R
epor
t
The Risk Risk Analysis Treatment Plan
Operational: Risks related to performance, customers, and the effective and efficient use of resources.
3. Talent retention
• Ability to attract and retain a talented pool of employees with the right skills and experience.
Consequences • Potentially a negative impact on
Company’s ability to deliver the business plan.
The People and Performance strategy and treatment plan encompasses: • Long term incentive programme to assist retention of
critical personnel. • Succession planning and career path programmes for high
potential personnel. • Organisation-wide Employee Satisfaction Survey conducted
annually to identify areas for improvements. • Exit interviews to identify critical areas of improvement for
People and Performance policy and practices. • Proactively identifying employee’s satisfaction parameter
by conducting annual survey 'Great place to work' to identify potential gaps.
4. Health and safety
• Serious OSH (Occupational Safety and Health) incident.
Consequences • Potentially material impact on
Company’s vision and brand locally and internationally with consequential financial implication due to project delays, civil suit and fines.
The Company has a comprehensive and integrated health and safety strategy and implementation plan: • All PMCs, consultants and principal contractors must register
with OSHAD (Abu Dhabi Occupational Safety and Health Centre), comply with Aldar OSH Policy and abide by their standards.
• Produce monthly OSH statistics to monitor performance across the projects and the portfolio of assets, develop lesson learnt and analyse trends to ensure and promote safest practices.
• Proactive integration between QHSE (Quality, Health, Safety & Environment) and project teams for an effective implementation of the OSH monitoring programme, i.e. internal and external OSH audit, committee meeting, OSH meeting and periodic inspections.
• Raising staff awareness by conducting training and OSH campaigns, updating and communicating the Company’s OSH/EHS (Environment, Health and Safety) Management System (EHSMS) and regulatory requirements.
• Publishing OSH alerts to prevent incident.
5. Information Systems and Cyber Threat
• System vulnerabilities and control weaknesses are exploited by malicious actors over the internet.
Consequences: • If digital assets are not
adequately protected from cyber threats, this can lead to disruption of business operations, financial losses and loss of reputation.
The information Security & Compliance function continues to assess and strengthen the security and compliance readiness of its IT function. The unit undertakes but not limited to the tasks below: • DT achieved ISO 27001 certification in 2017. ISO 27001
surveillance audit is conducted by the Lead Auditors annually. • Security Baseline controls implemented and regularly reviewed
to mitigate threats from known vulnerabilities. • Advanced Threat Protection deployed to detect and mitigate
cyber threats based on artificial intelligence and machine learning. • DNS Security controls in place to proactively identify, block
and mitigate targeted threats such as malware, ransomware, phishing and data exfiltration.
• Security monitoring system, including Data Loss Prevention control, in place to correlate security events and trigger alerts.
• Disaster recovery strategy and plan in place, reviewed and tested on regular basis.
• Organisation-wide mandatory security awareness training programme in place.
• Vulnerability management programme in place to identify and mitigate system weakness.
Risk Management (continued)
PRINCIPAL RISKS CONTINUED

Ald
ar A
nnua
l Rep
ort 2
019
6
1

62
Stra
tegi
c R
epor
t Sustainability
SHAPING A BETTER FUTUREAldar remains focused on continuously improving the way we do business and engaging with our diverse stakeholders, as we create a sustainable legacy built on the positive impact we have on our people, communities, economy and environment.
Following the launch of our sustainability reporting journey in 2018, we are proud to report significant progress in our activities, engagement and reporting across each of our four sustainability pillars during 2019, providing new benchmarks for even greater success in the future.
Aldar is committed to embedding sustainabilityat the core of its business and ensuring that it isa priority across every aspect of our Company, reflecting our overarching focus on pursuing long-term economic and social value rather than short-term returns.
We strive to be a role model for sustainable practices across the region, by identifying and tackling the environmental, social and governance issues and
opportunities that matter most to our Company and our stakeholders.
We view our ongoing strategic and proactive sustainability transformation as fundamental to our success. It is a key driver for continuous improvement of our business practices, while also reducing our impact on the environment, creating economic value for our nation and strengthening the communities where we operate.
As a leading regional real estate developer, owner and manager, we understand and embrace our responsibility to create the right balance of social, environmental and commercial conditions for our communities, customers and shareholders, in order to shape a better future for all our stakeholders.
ECONOMYPage 64.
COMMUNITIESPage 66.
PEOPLEPage 68.
ENVIRONMENTPage 72.

63
Ald
ar A
nnua
l Rep
ort 2
019
Our sustainability strategy and framework
Aldar is proud to be a positive force in the lives of millions of people across the UAE, while supporting the growth of Abu Dhabi, as the Emirate fulfils its vision and upholds the great legacy of His Highness Sheikh Zayed bin Sultan Al Nahyan.
With this overarching ambition, and in order to achieve our own business and sustainability objectives, we have put in place a comprehensive sustainability strategy and framework. We executethis strategy through a wide range of
integrated programmes and initiatives, in collaboration with relevant stakeholders, with a view to progressively increaseour impact across material areas while contributing to achieving our corporate vision.
Fully integrated into our business strategy, to ensure we maintainour competitive advantages and deliver shared value to all our stakeholdersour four sustainability pillars are:
• Economy • Community • People • Environment
By applying our time, focus and resources to drive positive change across thesefour pillars, Aldar are well positioned to continue driving our sustainability agenda forward with passion and purpose.
OUR VISIONBecome a leading regional real estate developer and manager that creates memorable experiences and value for our customers and shareholders.
OUR MISSIONPlace our customers first by embedding sustainability, quality, technology and innovation in everything we do.
BUSINESS STRATEGYIntegrate sustainability into how we maximise stakeholder value through:
Operational excellenceEmbed environment and quality in all aspects of the business.
Customer centricityIntegrate and promote social and environmental sustainability.
Growth and expansionActively engage with our key stakeholders to drive growth.
PEO
PLE
, IN
NO
VA
TIO
N A
ND
D
IGIT
AL
TRA
NS
FOR
MA
TIO
NOUR SUSTAINABILITY FRAMEWORK
EconomySustainable growth and value creation
CommunityMaximise the quality of life
PeopleSupportive environment in all of our work places
EnvironmentInnovative solutions to minimise our environmental footprint
GovernanceRobust risk management and best-practice governancePlease refer to key topics on page 82 for more details.

64
Stra
tegi
c R
epor
t Sustainability (continued)
SUSTAINING AN INNOVATIVE VALUE CHAIN
ECONOMY
Our economic sustainability and contributions are vital to everyone who depends on our Company, including our customers, communities, employees, supply chain, shareholders and investors. We strive to provide our shareholders with secure, growing distributions derived from sustainable business practices.
At Aldar, we believe that in order to develop and deliver a future-proofed business model that will achieve the growth and diversification we seek,it must be built upon the solid foundations of innovation, sustainability and efficiency.
By managing our human and economic capital efficiently, we will maximise our shareholder value and ensure the long-term sustainability of our operations and our ability to sustain employment, environmentally positive development and strong governance for decades to come.
BUILDING CUSTOMER RELATIONSHIPSAND TRUSTFrom the early days of our Company, we havealways put our customers first. This customer focus continues to be one of our points of difference, creating lasting relationships with them builtover time and helping us to stand out from our competitors. We continue to explore and improve how we engage with our customers to more effectively deliver on our promises to them eachday and into the future.
EMBEDDING SUSTAINABILITY ACROSS OUR SUPPLY CHAIN Aldar’s values extend to every link along our supply chain, and the criteria of our business ethics model are written into our supplier contracts and Requests for Proposals (RFPs) tenders.
In 2018, we committed to supporting and improving local spend, in compliance with Abu Dhabi Government directives to prioritise Abu Dhabi-registered vendors. As of 2019, 99% of our suppliers held Abu Dhabi-based commercial licenses.
Sustainability is increasingly being taken into consideration throughout our design, tendering and contracting process. This is evident in the inclusionof sustainability- and social impact-related clausesin our contracts, purchase orders and work orders, aimed at creating a positive impact for the community and society at large. We are also enhancing supplier selection and evaluation criteria by including both environment and social aspects, with a formal mechanism for enforcing Aldar’s sustainability criteria in all our projects.
In 2019, we began developing our ICV programme to promote local businesses and boost the local economy. We also maintained an open and interactive dialogue across our supply chain, and welcomed suppliers’ ideas and insights on achieving mutual sustainability targets, in order to capture, evaluate and implement, whenever possible, the best sustainability ideas and suggestions.

Ald
ar A
nnua
l Rep
ort 2
019
6
5
OUR ECONOMIC SUSTAINABILITY COMMITMENTS • Embed sustainability into our day-to-day
operations (innovation and optimisation). • Increase customer satisfaction. • Foster innovation. • Support SMEs, the local economy and
In-Country Value.
FOSTERING INNOVATION AT EVERY LEVELInnovation is at the centre of our business and sustainability strategies, as we continue to find more efficient ways to do business, invest in technologies that support our priorities, and minimise our impact on the environment. We actively encourage and support all our employees and suppliers to find innovative solutions to challenges big and small, from improving customer experience and achieving operational excellence to developing new products, processes and services.
In addition to investing in innovation through external ideas and partnerships, we also foster a culture that propels homegrown employee innovation. Our Ibtikar Innovation Programme encourages our employees to play an active role in Aldar’s future growth and direction. This yearly challenge invites all employees to submit innovative ideas that address key issues facing our business and stakeholders. Any employee is then welcome to join the project teams implementing successful Ibtikar ideas. Teams are built to ensure a balanced representation of knowledge and skills, with participation counting towards employee performance reviews.
66
Stra
tegi
c R
epor
t Sustainability (continued)
SHAPING SUSTAINABLE COMMUNITIES
COMMUNITY
Healthy, dynamic communities are at the heart of our business. These multi-faceted environments – where citizens, residents and visitors live, learn, work and play – can be powerful catalysts of sustainable change, not just through the sustainability of the buildings themselves but also by encouraging sustainable lifestyles for everyone within them.
At Aldar, we work closely with our communitiesto bring everyone together and improve quality of life. To this end, we engage with our community members through interactive campaigns, educational initiatives and CSR activities to promote inclusion and ensure a sustainable lifestyle and high quality of life.
As a responsible business, we build vibrant destinations, empower the next generation, and enrich the daily lives and experiences of everyone in our communities. We aim to use our influence to help shape a future in which our diverse and inclusive communities are supported and nurtured so they can prosper and thrive.
CREATING A POSITIVE SOCIAL IMPACT During 2019, Aldar carried out over 100 CSR activities across our business operations, destinations and communities – enriching the lives of residents and visitors alike whilst creating a positive impact on the environment. Our CEO and Executive Management Board were proud and visible participants in a range of major CSR events, including the Special Olympics World Games Abu Dhabi and the Sandooq Al Watan Initiative.
SANDOOQ AL WATANDuring 2019, Aldar contributed AED 36 million to Sandooq Al Watan, the national fund charged with promoting sustainable development, a decent life and a bright future for all the people of the UAE. The contribution reflects our commitment to be a socially responsibility corporate leader in the community. This year’s contribution to Sandooq Al Watan brings our total contribution to AED 120 million.
SPECIAL OLYMPICSBuilding on our role as an Official Partner of the recent Special Olympics IX MENA Games held in the UAE capital, Aldar signed up to be an Official Partner of the Special Olympics World Games Abu Dhabi 2019.
Held for the first time in the MENA region, under the patronage of His Highness Sheikh Mohamed Bin Zayed Al Nahyan, Crown Prince of Abu Dhabi and Deputy Supreme Commander of the UAE Armed Forces, the Special Olympics World Games Abu Dhabi 2019 made history as the largest sportingand humanitarian event in the world.
OUR COMMUNITY SUSTAINABILITY COMMITMENTS • Develop communities that support diversity
and promote inclusivity. • Enhance the quality of education through
our communities. • Support NGOs and community funds
(i.e. Sandooq Al Watan). • Promote community awareness through
campaigns on recycling and sustainability.

67
Ald
ar A
nnua
l Rep
ort 2
019
Through the sponsorship, our venues and hospitality assets played a key role throughout the Games, as venues for events and as accommodation sites. We also engaged with our communities, schools and malls to create awareness about the event, and recruited volunteers to support the Games.
The message of the Special Olympics movement – to create a better world by fostering acceptance and inclusion of all people – resonates strongly with us, and we look forward to continuing our strategic partnership with the Special Olympics UAE.
ENCOURAGING VOLUNTEERING Giving back to the community has always been important to Aldar. This year, we enhanced our focus on volunteering by providing our employees with the opportunity to volunteer for worthy causes on Company time.
We developed an updated internal Volunteering Policy that encourages all staff from across the Company to give back to the local community. This Policy aims to promote a culture of giving withinand beyond the workplace, while empowering our employees to make a difference.
Our Aldar Academies also developed a volunteering programme to encourage students to gain personal and professional experiences while making positive changes in their communities.
ENSURING SUSTAINABILITY GOVERNANCEIn 2019, Aldar’s Sustainability Council waslaunched to advise on the integration and leadthe implementation of sustainability within the Company’s operations. The Council appointed Sustainability Champions throughout the business, who are responsible for promoting sustainability across our workforce and embedding our sustainability pillars into day-to-day operations.
LEADING IN LEARNING AND DEVELOPMENT We believe that education is the key to unlockinga more sustainable future for all. As such, we aimto use our position and resources to instil the knowledge and means to create a more sustainable future in everyone we reach through our business, from the young learners in our Aldar Academies to our customers and diverse stakeholders.
We have taken a holistic approach – providing children with an international standard of learning, empowering the next generation to become global citizens, enabling our workforce to reach theirfull potential, and sharing our knowledge on sustainability issues with the wider community.
This is in line with our nation’s focus on education through the UAE Education 2020 Strategy, another strategic stepping-stone in the national journey to become a more diversified, innovative and knowledge-based economy. In addition, the UAE Ministry of Education’s 2017-2021 Strategic Plan has further developed the concept of an innovative education system for a competitive, knowledge-based global society. Based around values such as citizenship and responsibility, equality and justice, and science, technology and innovation, it has set a series of goals to be achieved by 2021, which we are proud to contribute to achieving through our Aldar Academies.
More broadly, as a member of the United Nations, the UAE is committed to achieving the Sustainable Development Goals (SDGs), as part of the UN 2030 Agenda. Aldar’s efforts are aligned with SDG 4 ‘Quality Education’, whereby a good educationcan not only improve quality of life but also equip citizens with the necessary tools to develop innovative solutions to many of the problems facing the world today.
EMPOWERING THE NEXT GENERATION Through our internship programmes, we are committed to cultivating and empowering the next generation of leaders and entrepreneurs. These mutually-beneficial programmes enable recent graduates to gain important first steps in employment, giving them invaluable experiencesto help them find their passion and launch a rewarding and fulfilling career. We also hire recent university graduates, giving them the training, experience and encouragement to excel in their new positions – contributing to the success of our Company, economy and nation.
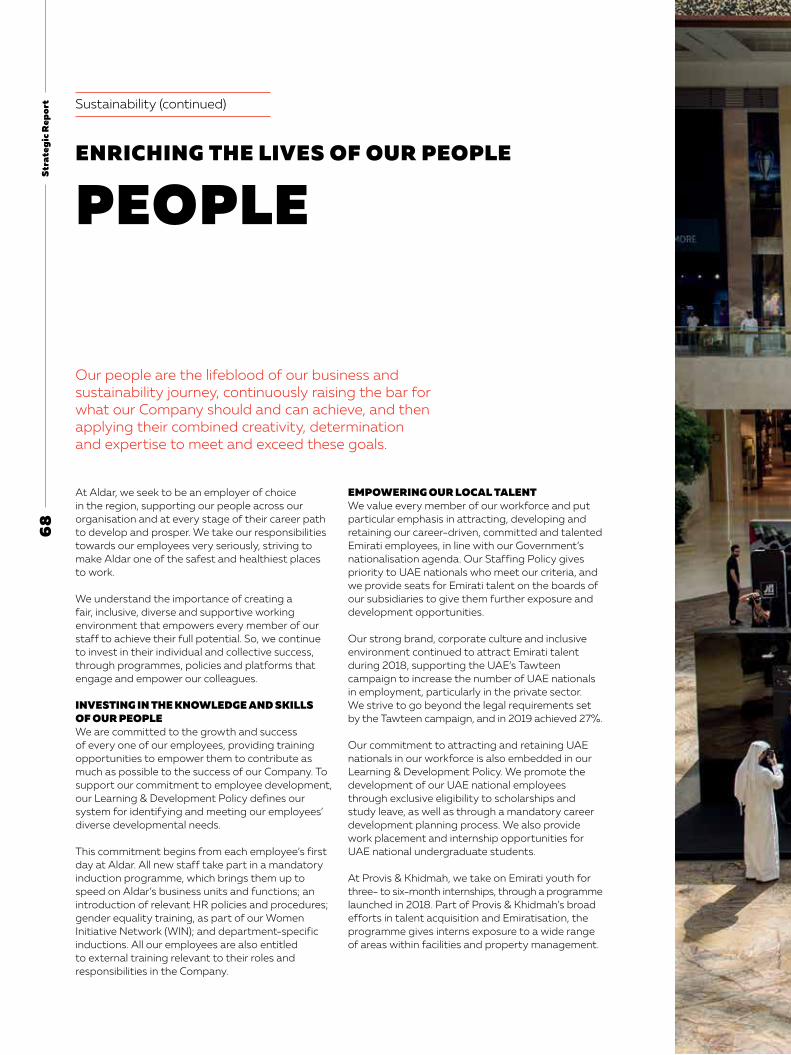
68
Stra
tegi
c R
epor
t Sustainability (continued)
ENRICHING THE LIVES OF OUR PEOPLE
PEOPLE
Our people are the lifeblood of our business and sustainability journey, continuously raising the bar for what our Company should and can achieve, and then applying their combined creativity, determination and expertise to meet and exceed these goals.
At Aldar, we seek to be an employer of choice in the region, supporting our people across our organisation and at every stage of their career path to develop and prosper. We take our responsibilities towards our employees very seriously, striving to make Aldar one of the safest and healthiest places to work.
We understand the importance of creating afair, inclusive, diverse and supportive working environment that empowers every member of our staff to achieve their full potential. So, we continueto invest in their individual and collective success, through programmes, policies and platforms that engage and empower our colleagues.
INVESTING IN THE KNOWLEDGE AND SKILLSOF OUR PEOPLE We are committed to the growth and successof every one of our employees, providing training opportunities to empower them to contribute as much as possible to the success of our Company. To support our commitment to employee development, our Learning & Development Policy defines our system for identifying and meeting our employees’ diverse developmental needs.
This commitment begins from each employee’s first day at Aldar. All new staff take part in a mandatory induction programme, which brings them up to speed on Aldar’s business units and functions; an introduction of relevant HR policies and procedures; gender equality training, as part of our Women Initiative Network (WIN); and department-specific inductions. All our employees are also entitled to external training relevant to their roles and responsibilities in the Company.
EMPOWERING OUR LOCAL TALENT We value every member of our workforce and put particular emphasis in attracting, developing and retaining our career-driven, committed and talented Emirati employees, in line with our Government’s nationalisation agenda. Our Staffing Policy gives priority to UAE nationals who meet our criteria, and we provide seats for Emirati talent on the boards of our subsidiaries to give them further exposure and development opportunities.
Our strong brand, corporate culture and inclusive environment continued to attract Emirati talent during 2018, supporting the UAE’s Tawteen campaign to increase the number of UAE nationals in employment, particularly in the private sector. We strive to go beyond the legal requirements set by the Tawteen campaign, and in 2019 achieved 27%.
Our commitment to attracting and retaining UAE nationals in our workforce is also embedded in our Learning & Development Policy. We promote the development of our UAE national employees through exclusive eligibility to scholarships andstudy leave, as well as through a mandatory career development planning process. We also provide work placement and internship opportunities for UAE national undergraduate students.
At Provis & Khidmah, we take on Emirati youth for three- to six-month internships, through a programme launched in 2018. Part of Provis & Khidmah’s broad efforts in talent acquisition and Emiratisation, the programme gives interns exposure to a wide range of areas within facilities and property management.

69
Ald
ar A
nnua
l Rep
ort 2
019

70St
rate
gic
Rep
ort
PROMOTING EQUAL OPPORTUNITY At Aldar, we strongly believe in equal opportunity employment for all candidates, regardless of race, religion, gender or nationality, in line with the Discrimination (Employment and Occupation) Convention of 1958 of the International Labour Organization, ratified by the UAE.
This commitment does not affect our objective of increasing our Emirati workforce, which is a targeted recruitment to address a national and regional challenge. We treat all applicants and employees professionally and equally in terms of assessment, employment and promotion, based on the technical and behavioural skills and performance relevant to their respective roles and responsibilities.
Our Code of Business Conduct provides behavioural guidelines that prohibit harassment of our colleagues, as well as their relatives. We also encourage all Aldar directors, officers, employees, consultants and contractors to report instances of harassment through our whistleblower programme. Harassment, in any form and regardless of intent, is a form of discrimination that hinders our commitment to equal employment opportunity and will not be tolerated.
SUPPORTING DIVERSITY AND INCLUSIONEmployee diversity and inclusion are both vital to Aldar’s success and sustainability. We champion diversity and the positive impact it has across our organisation, including the key role it plays in bringing greater innovation and creativity. As of 2019, we had 376 employees representing over 35 nationalities.
At Provis & Khidmah, we launched a Workforce Diversity Policy, setting out our commitment to create a workplace that is fair and inclusive while building a workforce that positively reflects the diversity of our community. Khidmah’s workforce is currently composed of 27% women and 73% men of 47 nationalities.
In addition, in our retail units, we have integrated people of determination into our labour force and guaranteed them equal employment opportunities across several sectors.
YOUTH COUNCILIn line with their vision for a more sustainablenation, the leaders of the UAE have spearheaded a movement aimed at developing the nation’s youth and applying their skills to build a better future. Supporting this vision, the Aldar Youth Council was created to empower our Company’s youth, by providing a platform to unlock their full career potential and support organisational change, with the support and guidance of a range of internal stakeholders.
WOMEN’S INITIATIVE NETWORKThe Women’s Initiative Network (WIN) was created to support all the women across our Company, in line with our wider commitment to inclusion and diversity. WIN’s agenda is to implement equality initiatives that will fast-track a more balanced representation of Aldar women and to achieve gender balance within the Company. WIN is madeup of a dynamic and diverse group of exceptional women working across all areas of the organisation, who are collectively responsible for determining the Network’s focus and initiatives.
ENRICHING THE LIVES OF OUR PEOPLE CONTINUED
Sustainability (continued)

71A
ldar
Ann
ual R
epor
t 20
19
DIVERSITY & INCLUSION BOARDReflecting the huge variety of talent, culture, race and gender within our organisation, we introduceda Diversity & Inclusion Board (DIB) to build a culture that embraces differences, celebrates uniqueness and unleashes the potential of our diverse groups. The DIB will help empower our people and support our diverse and inclusive culture to achieve business excellence.
ENSURING HEALTH AND SAFETYWe are committed to providing a safe working environment that promotes the health and wellbeing of all our employees and contractors. To this end, we operate Health and Safety (H&S) practices in line with the Abu Dhabi Occupational Safety and Health System Framework (OSHAD-SF, 2017), a management tool that enables us to integrate our Occupational Safety and Health (OSH) management components into one coherent system that governs the way we do business.
OCCUPATIONAL SAFETY AND HEALTH (OSH) POLICY Our OSH Policy sets out our main objectives for continuous improvement in this vital area, while defining the standard against which all our business units and employees are continually measured, including through employee performance reviews.
The Policy covers all areas of our operations, including offices, construction sites, assets, consultants, outsourced staff and communities, outlining clear safety and health goals for operations, communications and evaluation.
WORKER'S WELFARE POLICYTo ensure the safety and wellbeing of our project workforce, our focus on worker welfare runs from procurement through all stages of each project’s lifecycle. On site, we ensure that all workers are operating within the requirements of our own Code of Ethics and the UAE Labour Law.
We are also implementing a vendor selection prequalification procedure that includes compliance with the standards set in our OSH Policy and OSH Management System, all applicable UAE OSH laws, and the UAE Labour Law. UAE OSH laws include OSHAD requirements and Code of Practice (CoP) 8.0 on General Workplace Amenities, with requirements on designated rest areas, sanitary facilities, and more.
We consider a wide range of worker welfare criteria when prequalifying vendors, including the provision of medical insurance and first aid equipment, adequate means of transport to remote sites, adequate accommodation, drinking water and food, and entertainment and sports amenities. Non-compliance of a vendor to our requirements may lead to their removal from our prequalified vendor list.
OUR PEOPLE SUSTAINABILITY COMMITMENTS • Foster a culture of innovation and
sustainability. • Look after, develop, engage and reward
our people. • Promote diversity, inclusion, health
and wellbeing. • Ensure worker safety and welfare. • Provide sustainability training to 100%
of employees.

72St
rate
gic
Rep
ort Sustainability (continued)
PROTECTING OUR ENVIRONMENT
ENVIRONMENT
We aim to reduce our environmental impact and improve the efficiency of our use of resources over time, in recognition that our stewardship of the environment is our greatest responsibility to future generations.

73A
ldar
Ann
ual R
epor
t 20
19
At Aldar, we are proud to have a diverse portfolio of assets made up of iconic developments, residential neighbourhoods, leading educational establishments, world-class retail destinations and community-focused retail centres.
In planning, building, managing and operating our portfolio, we make sure that each asset has the health and wellbeing of its users at its core, and that we manage the environmental impact of each asset throughout its lifecycle.
This responsible approach can range from meeting the stringent sustainability rating requirements for our new developments and making the most of opportunities to reduce energy and water consumption, to investing in innovative technologies that improve energy, water and waste management across our portfolio.
ACHIEVING OUR ENVIRONMENTAL OBJECTIVES AND RATINGSWe recognise the value of formal certifications in helping our business to achieve its strategic and sustainability objectives. They are beneficial in providing multi-criteria tools and a systematic process to enhance our design, construction and operational performance.
We have therefore applied Estidama certifications for all our Abu Dhabi developments since it was mandated by the Executive Council of Abu Dhabi in 2010, achieving at least the mandatory 1 Pearl rating requirement. We are proud to have been the first developer in the UAE to receive Estidama rating approvals in 2011, for Yas Mall, Yas Island Water Park and Al Bateen Park.
Estidama provides guidance and detailed requirements for rating a project’s potential performance in relation to four pillars – environmental, economic, cultural and social– across seven categories: • Development process • Natural systems • Liveable communities or buildings • Precious water • Resourceful energy • Stewarding materials • Innovative practice
Our sustainability commitments for developments are in line with our own development procedures and Estidama requirements. We have developed the Aldar Bronze, Silver and Gold ratings, which categorise our projects in line with Estidama requirements: • Aldar Bronze = 1 Pearl Building (PBRS) – Minimum
12% energy reduction from ASHRAE 901-2007 baseline; minimum 14% interior water use reduction from Estidama baseline 1 Pearl Villa (PVRS); minimum 5% energy reduction from Estidama baseline; minimum 3% interior water usage reduction from Estidama baseline.
• Aldar Silver/Gold = 2 Pearl Building (PBRS) – Minimum 22% energy reduction from ASHRAE 901-2007 baseline; minimum 35% interior water usage reduction from Estidama baseline 2 Pearl Villa (PVRS); minimum 15% energy reduction from ASHRAE 901-2007 baseline; minimum 15% interior water usage reduction from Estidama baseline.
Pearl Building Rating System (PBRS)Pearl Villa Rating System (PVRS)Pearl Community Rating System (PCRS)
In 2018, our projects that underwent the Estidama process included: • Al Ghadeer Phase 2 – PCRS & PVRS • Reflections Tower A – PBRS • Reflections Tower B – PBRS • Yas Island E3, Car Showroom – PBRS • Yas Island RA, Staff Accommodation – PBRS • Yas Island Zone IB, Water’s Edge – PBRS
In addition, some of our developments have exceeded the mandatory minimum requirements to achieve a 2 Pearl rating, including our Ansam project on Yas Island in 2018.
APPLYING BEST PRACTICES TO ENVIRONMENT, HEALTH AND SAFETY MANAGEMENTWe work to continuously improve our EHS performance in order to enhance the benefits and minimise any negative impact of our operations on the environment and all our stakeholder groups. In 2018, we launched the Aldar EHSMS for all our employees, partners and suppliers across our residential communities, schools and commercial properties. Our EHSMS is designed to enhance and enforce the safe management of work activities and effective protection of the environment.

74St
rate
gic
Rep
ort
Our EHSMS complies with the high standards ofthe Abu Dhabi Environmental Health and Safety Management System (AD EHSMS) regarding the environment, health, safety and risk. It incorporates the key features of the relevant international EHS standards (ISO 14001 and OHSAS 18001); requirements of other standards, such as quality standards (ISO 9001); auditing standards (ISO 19011); and risk management standards (ISO 31000). The requirements, stated under our EHSMS, apply to all our assets, whether managed directly by us or by our third-party contractors.
BRINGING OUR SUSTAINABILITY STRATEGIES AND COMMITMENTS TO LIFEENHANCING SUPPLY CHAIN SUSTAINABILITYWe launched the Aldar Sustainability Strategy Implementation Plan–Procurement (SSIP-P) in 2014 to promote sustainability across our supply chain, incorporating lessons learned through Estidama certification and mitigating long construction industry project cycles. This established: • Standard Scope of Service for Estidama 1 and 2
Pearl design services to be included in all our RFPs • Reporting procedure for all contractors as part
of our standard specifications. • Service strategies related to Estidama and in
line with our established procurement process. • Transition strategy for projects from design
to construction.
Since then, sustainability has taken an even more prominent role within our design, tendering and contracting processes. Each year, we screen an increasing number of suppliers against environmental criteria, and we are working to builda sustainability function within the Procurement department, along with a formal mechanism for evaluating our suppliers’ negative environmental and social impacts.
DEVELOPING GREEN SPACES Every one of our developments includes dedicated spaces and facilities to enhance the health, happiness and wellbeing of residents and visitors. These open spaces, green areas and public parksare carefully designed and located to address community needs and provide natural environments for everyone to enjoy. On average, over 21% of our developed land is dedicated to open spaces.
PROTECTING OUR ENVIRONMENT CONTINUED
Sustainability (continued)
OUR ENVIRONMENTAL SUSTAINABILITY COMMITMENTS • Become carbon neutral across our assets. • Develop a comprehensive Environment
Management System (EMS) for water, waste and energy.
• Commit to reporting in line with the Carbon Disclosure Project (CDP).
• Avoid negative impact on the environment in everything we do.
• Protect biodiversity. • Implement pilot projects for recycling
and waste.

75A
ldar
Ann
ual R
epor
t 20
19
PROMOTING AND PROTECTING BIODIVERSITYThe Environment Agency – Abu Dhabi (EAD) has put in place clear standards of conduct for all public and private entities to promote environmentally sound management practices for development and infrastructure projects across Abu Dhabi.
Aldar is committed to meeting, or exceeding wherever possible, these EAD requirements. By undertaking thorough environmental assessments and integrating international best practices in our activities, with the help of expert external consultants, we work to protect the natural environment and life within all our communities.
We are aligned with EAD’s guidelines to protect and enhance the air quality, groundwater and biodiversity of Abu Dhabi’s desert and marine ecosystems. To achieve this, we prioritise initiatives that raise environmental awareness, facilitate sustainable development and ensure community protection.
To better understand and protect the biodiversity across our key destinations, including Saadiyat Island, Yas Island, Al Reem Island and Al Raha Beach, we have mapped them out in relation to EAD environmentally protected areas designated as areas of high biodiversity value. All our projects under design, construction or operation abide by local and federal environmental standards and requirements. We partner with leading regional environmental consultants to undertake thorough environmental assessments of our projects and develop plans to meet or exceed all applicable standards and requirements.
Our West Yas development exemplifies our commitment to protecting Abu Dhabi’s natural environment. Located within the Mangrove Protected Area it covers 150,703 sqm of protected natural habitat. To protect these mangroves,we established and implemented a Mangrove Management Plan in 2017, which included the removal of 23 residential plots from the construction area, replacing them with a public park.
Another example is our masterplan for Al Ghadeer Phase 2, which took into consideration the cultural heritage of the Sheikh Zayed Farms located within the boundaries of the development. With leading experts in the field, we developed measures to protect wildlife in the vicinity before the construction work began, including putting in place detailed environmental management plans for our contractors to abide by. As a result, we preserved the farm area for community farming projects and local produce markets.
Preserving the Emirate’s environmental and cultural heritage is among our key priorities, and we will continue to do everything possible to ensure that it remains secure and thriving for the benefit of future generations.

76G
over
nanc
e Board of Directors
HE MOHAMED KHALIFA AL MUBARAK CHAIRMAN
H.E. Mohamed Khalifa Al Mubarak is Chairman of Aldar Properties PSJC and prior to that, he was Chief Executive Officer and Chief Portfolio Management Officer at Aldar. H.E. Al Mubarak has been integral to the development of Aldar’s operational businesses as well as that of the fast-growing Sales & Leasing, Property & Asset Management and Facilities Management units within the organisation.
Prior to joining Aldar, H.E. Al Mubarak worked with the corporate and investment bank Barclays Capital in London, focusing on investment and finance in the MENA region.
H.E. Al Mubarak is a Member of the Executive Council of the Emirate of Abu Dhabi. H.E. Al Mubarak is the Chairman of the Department of Culture & Tourism of Abu Dhabi as well as the Chairman of Tourism Development & Investment Company, Miral Properties Assets Management L.L.C, Image Nation Company & Aldar Academies LLC. In addition to that, H.E. Al Mubarak is a Board member of Etihad Airways Group, Al Qattara Investment Company, Media Zone Authority and Al Jazeera Investment & Real Estate Development Co.
H.E. Al Mubarak is a holds Dual specialisation in economics and political science from North Eastern University, USA.
MR. WALEED AHMED ALMOKARRAB AL MUHAIRI VICE CHAIRMAN
Mr. Waleed Al Muhairi is the Deputy Group CEO of Mubadala Investment Company. As Deputy Group CEO, Waleed Al Mokarrab Al Muhairi has strategic oversight of the company’s broad investment portfolio and special projects at the group level while ensuring that the company’s four platforms are coordinating efficiently.
He is also Chief Executive Officer of the Alternative Investments & Infrastructure platform and leads Mubadala’s healthcare, real estate & infrastructure, and capital investment portfolios. Waleed is a member of Mubadala’s Investment Committee, which is mandated to develop the company’s investment policies, establish investment guidelines and review all proposed projects and investments to ensure they are in line with business objectives. He currently serves as Chairman of Cleveland Clinic Abu Dhabi and is a Member of the Board of Trustees of Cleveland Clinic in the United States.
He is also the Vice Chairman of Aldar Properties and a board member of Abu Dhabi Global Market, Emirates Investment Authority, Mubadala Petroleum, Abu Dhabi Future Energy Company (Masdar), and InvestCorp Bank, Bahrain.
Waleed was one of the principal architects behind the Abu Dhabi 2030 Economic Vision. Prior to joining Mubadala, Waleed worked with the UAE Offsets Program Bureau as a Senior Project Manager. Past roles also include working with McKinsey & Company as a commercial and governmental consultant. Waleed holds a Master’s Degree in Public Policy from Harvard University, USA, and a Bachelor of Science Degree in Foreign Service from Georgetown University, USA.
77A
ldar
Ann
ual R
epor
t 20
19
MARIAM SAEED AHMED SAEED GHOBASH BOARD MEMBER
Ms. Mariam Ghobash is Director in the Global Special Situations Department at the Abu Dhabi Investment Council. Prior to joining the Council, she worked as an investment professional in HSBC Middle East whereby she was a member of the private equity team.
Ms. Ghobash currently serves as a member of the Board of Directors of Emirates Telecommunications Group Co “Etisalat”, Emirates Development Bank and is Vice Chairman of Invest AD. Previously, she has also served on the boards of National Bank of Abu Dhabi, Al Hilal Bank and National Takaful Co. “Watania”.
Ms. Ghobash holds a Bachelor of Science in Economics from The Wharton School, University of Pennsylvania in the United States of America. She has also successfully completed the General Management Program at Harvard Business School.
MANSOUR MOHAMED AL MULLA BOARD MEMBER
Mansour is the CFO for the Petroleum & Petrochemicals Platform in Mubadala Investment Company (Mubadala). His prime responsibilities revolve around advising and appraising the CEO and Senior Executives of the Platform on all financial matters pertaining to platform’s assets, which include investments in prime global companies such as CEPSA, Borealis, Nova Chemicals, Mubadala Petroleum and OMV, with assets under management of circa $40bn.
Throughout his career with Mubadala, Mansour has played an instrumental role in negotiating and closing numerous award-winning financing transactions. He led the team in closing the $1.3 billion Dolphin 21' project bonds in February 2012. He also led the efforts on closing and funding the multi-tranche $4.1 billion debt financing for the Dolphin Project in July 2009. Both deals won numerous awards by leading publications in the Project Finance field. Mansour also supported a number of other transactions, including the leveraged buyout debt financing for the acquisition of Zurich based Maintenance, Repair and Overhaul operator SR Technics and financing Mubadala’s stake in the Dutch fleet management company LeasePlan Corporation. The latter has been exited with a profit. Additionally, Mansour has advised and supported a number of Mubadala related assets on raising standalone debt financing as well as other strategic initiatives. Mansour serves as a board member of Aldar Properties PJSC, Anglo Arabian Healthcare Investments FZ LLC and Gulf Energy Maritime PJSC. Over the last 10 years, Mansour served on the Boards of Waha Capital PJSC, Dunia Finance LLC, Abu Dhabi Finance PJSC and Abu Dhabi Terminals PJSC.
Prior to joining Mubadala in 2004, Mansour spent three years with the UAE Offsets Group. He was exposed to a number of sectors including aerospace, real-estate, infrastructure, healthcare, finance and oil & gas.
Mansour holds a Bachelor of Science in Business Administration (Information Systems) from Portland State University, Portland, Oregon, USA.

78G
over
nanc
e Board of Directors (continued)
MARTIN LEE EDELMAN BOARD MEMBER
Mr. Edelman is on the Board of Blackstone Mortgage Trust, AMD and Equity Commonwealth Trust. Mr. Edelman concentrates his practice on large complex international real estate developments, corporate mergers and acquisitions transactions.
He is an advisor to Grove Real Estate Partners, The Related Companies and Mubadala, the strategic investment arm of the Government of Abu Dhabi. He is also on the boards of the Jackie Robinson Foundation, The Intrepid Fallen Heroes Fund, the Fisher House Foundation and Tribeca Film Institute and Festival.
Mr. Edelman holds a BA in Politics from Princeton University and SJD in Law from Columbia University, USA.
ALI SAEED ABDULLA SULAYEM AL FALASI BOARD MEMBER
Mr. Al Falasi has extensive experience in the real estate sector and has been Chief Executive Officer of Hydra Properties since 2009. He is also a member of the Board of Directors of Risco LLC and a Member of the Audit Committee of the Royal Group.
Mr. Al Falasi worked as under-secretary of the operations department of the Private Department of Sheikh Zayed Bin Sultan Al Nahyan. He supervised all the operations department’s activities in that capacity.
Mr. Al Falasi joined Royal Group after his term at the Private Department and took on the role of director of the internal audit of the Group. He is a Board member of Sorouh Real Estate PJSC and The International Commercial Bank, as well as large other numbers of companies in the industrial, real estate, finance and trading fields. He was also the Chairman of Al Rayan Investment Company.
Mr. Al Falasi holds a Master’s degree in business administration from University of Sharjah, UAE, a Bachelor’s Degree in Science - Production and Operations Management from California State University, USA and Bachelor’s degree in accounting from UAE University.

79A
ldar
Ann
ual R
epor
t 20
19
HAMAD SALEM MOHAMED AL AMERI BOARD MEMBER
Eng. Hamad Salem Al Ameri brings significant experience from the construction industry as well as in the fields of business growth and management.
Eng. Al Ameri joined the Aldar Properties Board of Directors in November 2015 adding to a portfolio of appointments which among others includes his role as Vice Chairman of the Board and Managing Director of Trojan Holding. In this role he leads the growth strategy of both the holding company and its subsidiaries, which has resulted in the Company expanding from a small base to a team of over 25,000 employees.
In addition to his role at Aldar and Trojan Holding, Eng. Al Ameri is the Chief International Investment Counsel at the Royal Group and a Board Member of International Holding Company PJSC, Mina Holding Company LLC, Tamouh Investments Company LLC, Royal Development Company LLC, Eltizam Asset Management Group LLC, Al Reem Building Materials Co. LLC, Al-Jazeera Technical Solutions Investment Co. LLC and Hydra Properties LLC.
Eng. Al Ameri is a graduate in Civil Engineering from the American University in Dubai, UAE, and also holds a Master’s in Business Administration from the Canadian University, UAE.

80
Gov
erna
nce Executive Management
JASSEM SALEH BUSAIBECHIEF INVESTMENT OFFICER
Mr. Busaibe has over 15 years of experience in the fields of finance and investment, having held a number of high profile roles at several private and public companies in Abu Dhabi. He was most recently the CFO of SENAAT and prior to that served as CEO of Arady Properties, an investment company focused on the private equity and real estate sectors in the GCC, and was formerly Senior Vice President of Private Equities at Invest AD – the Abu Dhabi Investment Company. Prior to that, he spent seven years at the Abu Dhabi Investment Authority (ADIA), where he worked as a Portfolio Manager focusing on European Equities. Mr. Busaibe is a CFA Charter holder and holds a M.Sc. in Finance from London Business School, UK.
TALAL AL DHIYEBICHIEF EXECUTIVE OFFICER
Talal is the Chief Executive Officer at Aldar having previously held the position of Chief Development Officer and Executive Director of Asset Management since the merger with Sorouh in 2013. He held several senior positions at Aldar and currently serves on the boards of several companies including Abu Dhabi Motorsports Management, Al Jazira Capital, Aldar Academies and Aldar Hotels & Hospitality. Talal is a graduate of Electrical Engineering (Honors) from the University of Melbourne, Australia.
GREG FEWERCHIEF FINANCIAL & SUSTAINABILITY OFFICER
As Chief Financial & Sustainability Officer, Greg Fewer is responsible for a broad remit including, Finance, Corporate Finance, Treasury, Sustainability, Digital Transformation, Strategy & Innovation and Enterprise Risk Management.
Having been set up in 2019 ahead of launching the Company’s first sustainability report, Aldar’s dedicated sustainability department ensures that there is a company wide focus on making the business more sustainable with an emphasis on the economy, community, people, environment, and governance.
Aldar’s Digital Transformation and Strategy & Innovation teams work to position Aldar for the future, enhance performance and embed a culture of innovation. Our new enterprise risk management team will facilitate sustainable growth within both Aldar, and its subsidiary businesses.

81
Ald
ar A
nnua
l Rep
ort 2
019
BRETT SCRYMGEOURGENERAL COUNSEL AND COMPANY SECRETARY
Brett Scrymgeour is General Counsel and Company Secretary at Aldar Properties, positions he has held since 2012. In this role he facilitates all business activities of the Company, ensuring that they proceed in compliance with the local regulatory environment. A key aspect of his role is as an advisor to the Board of Directors, Senior Management and their respective teams with regards to strategic legal and regulatory issues. A commercially focused lawyer, Brett has played a key leadership role in many of the Company’s most important corporate activities and transactions. Prior to joining Aldar, Brett was Senior Legal Counsel at Mubadala Development Company, having spent the first decade of his career in Law Firms in both his native Australia and the UK, namely; Macrossans Lawyers, Hickey Lawyers, Mallesons Stephen Jaques, and Clifford Chance. Brett holds a Bachelor of Arts, and a Bachelor of Laws, both from Queensland University of Technology, and was admitted as a Solicitor of the Supreme Court of Queensland in 2002, and as a Solicitor of the Supreme Court of England and Wales in 2008.
BAYAN HASSAN AL HOSANIPEOPLE AND PERFORMANCE EXECUTIVE DIRECTOR
An accomplished and results oriented HR professional with over 20 years of experience in the private and government sectors. Bayan has extensive knowledge and experience in Strategic and Operational HR Management with expertise in Change Management - Leading organizational change and Organizational development, Talent Acquisition, Performance Management, Talent Transformation, Employee Relations, Budget forecasting and Compensation and Benefits. Bayan is a CIPD Professional, helping the company to achieve its business objectives and improve corporate performance. She is an innovative, motivational leader with a strong record of team building. Her abilities lie in strengthening the link between people and strategy, as well as manage, motivate and retain talent, and continue to develop HR services and the administrative infrastructure necessary to support the long term success of the organization. Bayan is a Graduate of Business Administration from the Higher Colleges of Technology. She is also a member of the Board of Directors of Aldar Academies.

82
Gov
erna
nce
INTRODUCTIONAldar Properties PJSC (Aldar or the Company) is committed to adhere to the decision of the Chairman of the Securities and Commodities Authority No. (7/RM) of 2016 on the standards of corporate discipline and governance of public joint stock companies. The Company annually issues a Corporate Governance Report, which reflects the Company’s keenness on the optimal and proper application of governance rules, and clearly demonstrates joint efforts and synergy among the Company’s Board of Directors, Executive Management and employees.
The Board of Directors considers the existence of a strong governance system as one of the cornerstones of the Company’s sustainable and long-term growth. The Board of Directors is committed to continuously enhancing the value of the Company for its shareholders, taking into account the interests of all stakeholders, including its employees, suppliers, customers, business partners, as well as the communities in which the Company operates.
Shareholders represent the highest levels of governance and the Company’s Articles of Association define the framework through which Aldar Properties PJSC shall operate as a public joint stock company. The Company’s governance framework takes into consideration the application of the principles and standards set by both the Securities and Commodities Authority and Abu Dhabi Securities Exchange, as well as the Federal Law No. (20) of 2015 on commercial companies, as amended, in order to develop the Company’s policy, requirements and aspirations.
1. GOVERNANCE APPLICATION IN ALDAR PROPERTIES The Board of Directors is accountable to the shareholders for ensuring that the Company’s objectives are in line with shareholders’ expectations and aspirations. They are also responsible for ensuring the effectiveness of the Company’s management in managing the Company’s businesses, with the emphasis that the Company’s objectives are consistent with the legislative requirements and codes of professional conduct defined by both the Securities and Commodities Authority and Abu Dhabi Securities Exchange.
The first step in implementing an effective governance system was the preparation and development of the governance framework and ensuring its effective implementation. In the context of constant monitoring efforts to measure the effectiveness of the application of the governance system, the Board of Directors periodically reviews the governance framework and amends its elements (where necessary) to ensure its consistency with the regulatory controls and changing business environment.
The following diagram illustrates the governance framework and key elements resulting from the application of the Company’s governance system:
SECURITIES AND COMMODITIES AUTHORITY AND ABU DHABI SECURITIES EXCHANGE
Shareholders
Nomination and Remuneration Committee
Board of Directors
Audit Committee
Executive CommitteeInternal Control Management
Auditor
Executive Management
Corporate Governance Report
For the year ended 31 December 2019

83
Ald
ar A
nnua
l Rep
ort 2
019
As indicated above, the application of the governance system involves different levels, including: Board of Directors, Executive Management, and the Internal Control System.
The Board of Directors performs periodic reviews regarding the application of standards and systems of governance in the Company, taking into consideration the legal and regulatory requirements and controls of these systems, and the application of the highest international standards in this field. The following is an overview of the governance elements at the levels of Board of Directors, Executive Management, Internal Control System and Compliance Officer.
1.1 GOVERNANCE ELEMENTS RELATED TO THE BOARD OF DIRECTORSKey elements of the governance of Company at Board level include a set of regulations that define the overall framework for the objectives, responsibilities and framework of the Board and its Committees, which elements include the following: • Charter of the Board of Directors. • Charter of the Audit Committee. • Charter of the Nomination and Remuneration Committee. • Charter of the Executive Committee. • Code of Business Conduct. • Table of Delegations of Authority. The Board of Directors has developed and implemented the Table of Delegations of Authority
as one of the other important complementary elements. The Table of Delegations of Authority is a tool through which all Executive Management Members are delegated to perform their duties and tasks to the fullest extent, and which contributes to the creation of an organised working environment characterised by the optimal conduct of the works and activities exercised by the Company. To ensure the efficiency and effectiveness of the Table of Delegations of Authority, the Board of Directors periodically reviews and amends it according to the Company’s business requirements. The last comprehensive review of the Table of Delegations of Authority was conducted by the Board of Directors at its meeting No. (05/2018) held on 14 May 2018.
1.2 GOVERNANCE ELEMENTS RELATED TO THE EXECUTIVE MANAGEMENTThe Executive Management shall implement the Company’s strategy and conduct its day-to-day business in accordance with the business plan developed by the Board of Directors. The Executive Management shall have the authority to manage the affairs and business of the Company, taking into consideration the protection of the interests of shareholders, the application of the best international practices and meeting the needs of daily operations practically. In addition to the Table of Delegations of Authority, the key elements of governance at the Executive Management level include a set of regulations that define the overall framework for the objectives, responsibilities and tasks of the Executive Management as follows: • Charter of the Management Committee. • Charter of the Tender Committee. • Charter of the Risk Management Committee. • Code of Business Conduct.
1.3 GOVERNANCE ELEMENTS RELATED TO THE INTERNAL CONTROL SYSTEMThe Board of Directors of the Company has set the rules and regulations of the Company’s business in such a way that makes all employees fully aware of the importance of the Internal Control System, contributing to their participation in ensuring the continuity of this system effectively.
The key elements of the Internal Control System include: • Development and approval of policies, charters and regulations that regulate the Company’s activities and works at all
departmental and divisional levels. • External auditor and the Internal Control Department. • Shareholders of the Company and the General Assembly. • Company’s Social Responsibility. • Whistleblower Policy. • Continuous market disclosure.

84
Gov
erna
nce
2. TRANSACTIONS AND TRADINGS OF THE COMPANY’S DIRECTORS AND THEIR DIRECT RELATIVES IN THE COMPANY’S SHARES DURING 2019
The Board of Directors (along with all employees and insiders of the Company) firmly believes in the importance and necessity of compliance with rules and regulations controlling their transactions and tradings in the shares and securities of the Company. In addition to their timely declarations and disclosures based on the adoption of the principles of equal opportunities, they are also prohibited to use any undisclosed internal information for personal interest or to remove a harm that may affect them as a result of any undisclosed material information. This enhances the confidence of investors and shareholders, and encourages them to further consider and study the Company’s projects and invest in its shares, assets, current and future projects.
Based on the foregoing, and in the light of the disclosures made by the Board of Directors, the following table shows the shares and securities owned by the Directors and their first-degree relatives (their spouses and children) in the Company’s share capital as of 31 December 2019:
Name Position/Relationship
Shares owned as of
31 December 2019
(Share)
Shares owned by first-degree relatives in the
capital of the Company
(Share)
Total Sales Transactions
(Share)
Total Purchases Transactions
(Share)
H.E. Mohamed Khalifa Al Mubarak Chairman of Board of Directors 1,275 – – –
Mr. Waleed Ahmed Salem Al Moqarrab Al Mehairy
Vice-Chairman of the Board 431,466 – – –
Mr. Hamad Salem Mohammed Al-Amerii
Member – – – –
Mr. Mansour Mohamed Al Mulla Member 100,000 – – –
Mrs. Mariam Saeed Ahmed Ghobash Member – – – –
Mr. Ali Saeed Abdullah Sulayem Al Falasi
Member 211,580 314,560(Relation
“Wife”)
– –
Mr. Martin Lee Edelman Member – – – –
3. BOARD OF DIRECTORSThe role of the Board of Directors is to supervise the Company’s business affairs. The Board of Directors is responsible for monitoring the effectiveness of the governance framework, controlling and supervising the management and controls applied in the Company. The Board has delegated some of its authorities to its Committees (Audit Committee, Nomination and Remuneration Committee, Executive Committee, as stated below), which operate according to their relevant charters and regulations.
The Board of Directors also delegated tasks of the day-to-day management of the Company to the Chief Executive Officer, in accordance with its specific authority in this regard, for a renewable three-year term. These mandates shall be documented in the Table of Delegations of Authority, which in turn is subject to periodic review to ensure balance and suitability between the level of control, risk management and dynamics of work requirements within the Company with regard to its developments, changes in its activities and operations. A comprehensive and material review was conducted to the Table of Delegations of Authority, which was approved by the Board of Directors at its meeting No. (05/2018) held on 14 May 2018. In addition, some partial amendments and revisions were conducted to the items on the Table of Delegations by the Board of Directors and its Executive Committee during the meetings held during 2019 according to the requirements and business interests of the Company.
Corporate Governance Report (continued)
For the year ended 31 December 2019

85
Ald
ar A
nnua
l Rep
ort 2
019
3.1 CHAIRMANH.E. Mohamed Khalifa Al Mubarak undertakes the position of Chairman of the Board of Directors of Aldar Properties PJSC according to the Board of Directors’ decision at its meeting No. (02/2019) held on 20 March 2019, following the process of re-election and formation of the Board of Directors of the Company, and was in accordance with the decision issued by the shareholders in the General Assembly meeting that was held on 20 March 2019. The Chairman of the Board shall be responsible for leading the Board and ensuring that he carries out his responsibilities and duties effectively, and the Chairman of the Board shall be considered a key link between the Board and the Executive Management. He continuously works with the Executive Management of the Company. In particular, the Chairman has the following tasks and responsibilities: • Ensuring that the Board works effectively, fulfils its responsibilities and discusses all key and proper issues on time. • Development and adoption of agendas of all meetings of the Board of Directors, taking into account any issues the Directors,
Executive Management, Company Secretary, Compliance Officer or Director of Internal Control proposes to be included in the agenda. The Chairman has the authority to assign such responsibility to a particular Director or to the Company Secretary under his supervision.
• Encouraging all Directors to fully and effectively participate in order to ensure that the Board is managed in a manner that ensures the achievement of the Company’s interests.
• Taking appropriate actions to ensure effective communication with shareholders and communicate their views to the Board of Directors.
• Facilitating the effective contribution of the Board’s Non-Executive Directors, and creating constructive relationships between the executive and non-executive members.
3.2 COMPETENCIES OF THE BOARD OF DIRECTORSThe Board set a list of matters under its control (in addition to the duties and responsibilities stipulated in the Company’s Memorandum of Association, its Articles of Association, Federal Law No. (02) of 2015 concerning commercial companies, as amended, and the decision of the Chairman of Securities and Commodities Authority No. (7) of 2016 on standards of institutional discipline and governance of public joint stock companies), which are of a strategic nature and characterised by high sensitivity. At the same time, such matters exceed the limits of the power vested in the Executive Management of the Company.
SUCH MATTERS INCLUDE: • Development and review of the Company’s strategic policies and plans. • Supervision and control of the Company’s operations and following up the exercise by the Executive Management of the tasks
vested in them. • Enhancement of the Company’s culture and core values as the ideal destination for job-seekers. • Development and implementation of the necessary policies, procedures and controls of the Company. • Adoption and follow-up of balance sheets, business plans and financial statements and policies. • Monitoring the appropriateness and effectiveness of the risk management and governance framework of the Company. • Approval of proposals for major investments and expenditure policies proposed by the Executive Management. • Monitoring the appropriateness of the administrative resource policy to ensure the adequacy of such resources and the
appropriateness of the administrative management plans, in coordination with the Nomination and Remuneration Committee in this regard.
• Providing timely and accurate information to shareholders and ensuring that the investors are generally able to trade in the Company’s securities listed in the exchange market, which is characterised by a high degree of efficiency, competitiveness, knowledgeability and transparency.
• Monitoring the process of nominating and appointing the Members of the Board of Directors in accordance with the Securities and Commodities Authority, in coordination with the Nomination and Remuneration Committee.
• Appointment or dismissal each of: Chief Executive Officer, Compliance Officer, Company Rapporteur, Director of Internal Audit Management.
• Providing recommendations to the Annual General Assembly on the appointment of the external auditor (upon a recommendation issued by the Audit Committee).

86
Gov
erna
nce
3. BOARD OF DIRECTORS (CONTINUED)3.3 FORMATION OF THE BOARD OF DIRECTORSThe Board of Directors of Aldar Properties currently includes seven Members, namely:
SN Members Position
1 H.E. Mohamed Khalifa Al Mubarak Chairman of the Board of Directors
2 Mr. Waleed Ahmed Salem Al Moqarrab Al Mehairy Vice-Chairman of the Board
3 Mr. Hamad Salem Mohammed Al-Ameri Member
4 Mr. Mansour Mohamed Al Mulla Member
5 Mrs. Mariam Saeed Ahmed Ghobash Member
6 Mr. Ali Saeed Abdullah Sulayem Al Falasi
Member
7 Mr. Martin Lee Edelman Member
Notes:• The current Board of Directors assumed its duties and responsibilities in accordance with the decision issued by the General Assembly meeting of the
Company held on 20 March 2019.• The number of the Company’s Directors has been reduced from nine members to seven members according to the decision issued by the shareholders of
the Company in the General Assembly meeting held on 20 March 2019.• Up to 20 March 2019, the Company’s Board of Directors included nine members, namely: H.E. Mohamed Khalifa Al Mubarak, Chairman, and Mr. Abubaker
Siddiq Al Khoori, First Vice-Chairman, and Mr. Waleed Ahmed Salem Al Muqarrab Al Mehairi, Second Vice-Chairman, and Mr. Hamad Salem Mohamed Al Ameri, Member, and Mr. Mansour Mohamed Al Mulla, Member, and Mr. Ahmed Khalifa Mohamed Al Mehairi, Member, and Mr. Ali Saeed Abdullah Sulayem Al Falasi, Member, and Mr. Mohamed Haji Al Khoori, Member, and Mr. Martin Lee Edelman, Member.
• H.E. Mohamed Khalifa Al Mubarak was elected as a Chairman by virtue of the Board of Directors’ decision at its meeting No. (02/2019) held on 20 March 2019, by secret voting.
• During the Board of Directors’ Meeting No. (02/2019) held on 20 March 2019, Mr. Waleed Ahmed Salem Al Moqarrab Al Mehairy was elected as the Vice-Chairman, and this was made, by secret voting.
In this regard, it should be noted that the membership of the Board of Directors consisted mostly of the independent members since the establishment of the Company according to the decision of the Chairman of Securities and Commodities Authority No. (7) of 2016 on standards of institutional discipline and governance of public joint stock companies, and the Charter of the Board of Directors approved by the Board of Directors.
All Members of the Board are independent. The Board has adopted a policy on the independency of Members, under which the independence of each Member is assessed annually, which falls under the responsibilities of the Nomination and Remuneration Committee, according to the decision of the Chairman of the Securities and Commodities Authority No. (7/RM) of 2016 on standards of institutional discipline and governance of public joint stock companies. Accordingly, the conflict of interests and the emergence of relationships that may arise on independent members, which may lead to a breach of independency, shall be reported and the relevant procedures shall be taken into account if the Board finds any defect or a decline in the capacity of independency.
The following table shows the classification of the Board’s Member (executive/non-executive/independent/non-independent) and year of appointment for each Member:
Members Position
Status Year of AppointmentIndependent Executive
H.E. Mohamed Khalifa Al Mubarak Chairman of Board of Directors Yes No 2017
Mr. Waleed Ahmed Salem Al Moqarrab Al Mehairy Vice-Chairman of the Board Yes No 2016
Mr. Hamad Salem Mohammed Al-Ameri Member Yes No 2015
Mr. Mansour Mohamed Al Mulla Member Yes No 2011
Mrs. Mariam Saeed Ahmed Ghobash Member Yes No 2019
Mr. Ali Saeed Abdullah Sulayem Al Falasi
Member Yes No 2013
Mr. Martin Lee Edelman Member Yes No 2011
Notes:• H.E. Mohamed Khalifa Al Mubarak was elected as a Chairman by the Board of Directors at its meeting No. (02/2019) held on 20 March 2019.• Mr. Waleed Ahmed Salem Al Moqarrab Al Mehairy was elected as a Vice-Chairman by the Board of Directors at its meeting No. (02/2019) held on
20 March 2019.
Corporate Governance Report (continued)
For the year ended 31 December 2019

87
Ald
ar A
nnua
l Rep
ort 2
019
3.4 MEMBERSHIP OF THE DIRECTORS IN OTHER COMPANIES AND CORPORATIONSThe following table shows the membership of the Board’s Members in other public bodies and companies, and their current positions in the supervisory, governmental, economic and commercial bodies, as of 31 December 2019:
Member Company/Body Position
H.E. Mohamed Khalifa Al Mubarak (Chairman)
Executive Council of Abu Dhabi Member of the Executive Council
Department of Culture & Tourism – Abu Dhabi Chairman
Miral Properties Assets Management L.L.C. Chairman
Tourism Development & Investment Company Chairman
Etihad Airways Group Member of the Board of Directors
Image Nation Company Chairman
Al Qattara Investment Company Member of the Board of Directors
Media Zone Authority Member of the Board of Directors
Al Jazeera Investment & Real Estate Development Co. Member of the Board of Directors
Mr. Waleed Ahmed Salem Al Moqarrab Al Mehairy(Vice-Chairman of the Board)
Mubadala Investment Company P.J.S.C Group’s Deputy Chief Executive Officer and Chief Executive Officer of the Alternative Sector Investments & Infrastructure Sector
Waha Capital Company PJSC Chairman of the Board of Directors
Cleveland Clinic Hospital – Abu Dhabi Chairman
Cleveland Clinic Hospital – USA Member of the Board of Trustees
Abu Dhabi Global Market Member of the Board of Directors
Mubadala Petroleum Member of the Board of Directors
Tamouh Investments Company L.L.C. Member of the Board of Directors
Investcorp Bank Member of the Board of Directors
Tamkeen Abu Dhabi Company Member of the Board of Directors
Emirates Investment Authority Member of the Board of Directors
Mr. Hamad Salem Mohamed Al Ameri (Member)
Trojan Holding Vice-Chairman and Managing Director
International Holdings Company P.J.S.C Member of the Board of Directors
Mina Holding Company L.L.C. Member of the Board of Directors
Tamouh Investments Company L.L.C. Member of the Board of Directors
Royal Development Company L.L.C. Member of the Board of Directors
Eltizam Asset Management Group L.L.C. Member of the Board of Directors
Al Reem Building Materials Co. L.L.C. Member of the Board of Directors
Al-Jazeera Technical Solutions Investment Co. L.L.C. Member of the Board of Directors
Mr. Mansour Mohamed Al Mulla (Member)
Mubadala Investment Company P.J.S.C Chief Financial Officer of Petroleum & Petrochemicals Sector
OMV Company Member of the Board of Directors
Mubadala Petroleum Company LLC Member of the Board of Directors
Gulf Energy Maritime (GEM) P.S.C. Member of the Board of Directors
Mrs. Mariam Saeed Ahmed Ghobash (Member)
Abu Dhabi Investment Council Director in the Global Special Opportunities Department
Abu Dhabi Invest Company “Invest AD” Vice-Chairman of the Board
Emirates Telecommunications Corporation PSC “Etisalat” Member of the Board of Directors
Emirates Development Bank Member of the Board of Directors
Zayed University Member of the University Council
Mr. Ali Saeed Abdullah Sulayem Al Falasi (Member)
Risco L.L.C Member of the Board of Directors
Hydra Properties L.L.C. Chief Executive Officer
Royal Group Member of the Audit Committee
Mr. Martin Lee Edelman (Member)
Mubadala Investment Company PJSC Adviser
Note:• This information is based on the disclosures made by the Board’s Members as on 31 December 2019.

88
Gov
erna
nce
3. BOARD OF DIRECTORS (CONTINUED)3.4 MEMBERSHIP OF THE DIRECTORS IN OTHER COMPANIES AND CORPORATIONS (CONTINUED)According to the Charter of the Board of Directors, all Members have vast experiences in business and management, particularly in the real estate sector. The following table shows the educational qualifications and experiences of the Board’s Members:
Members Educational Qualifications
Experience period in the field of business and management (in years)
Experience Field
Rea
l Est
ate
and
C
ons
truc
tio
ns
Oil,
Ene
rgy
and
Fa
cilit
ies
Ban
ks, F
inan
ce
and
Insu
ranc
e
Tele
com
mun
icat
ions
Gov
ernm
ent
and
no
npro
fit,
pub
lic a
nd
othe
r org
aniz
atio
nsH
ealt
hcar
e an
d
Pha
rmac
euti
cal
Ind
ustr
ies
Med
ia
H.E. Mohamed Khalifa Al Mubarak
- Dual specialisation in economics and political science from North Eastern University, USA.
12+
Mr. Waleed Ahmed Salem Al Moqarrab Al Mehairy
- Master of Public Policy with a specialisation in Business Administration and Government from Harvard University, USA.
- Bachelor of Science in International Affairs from Georgetown University, USA.
18+
Mr. Hamad Salem Mohamed Al Ameri
- MBA from the Canadian University.- Bachelor of Civil Engineering from the
American University in Dubai (AUD).
15+
Mr. Mansour Mohamed Al Mulla
- Bachelor of Business Administration from Portland State University, Oregon, USA.
20+
Mrs. Mariam Saeed Ahmed Ghobash
- Bachelor’s degree in Economics from Wharton, from Pennsylvania State University in the United States of America.
12+
Mr. Ali Saeed Abdullah Sulayem Al Falasi
- MBA from the University of Sharjah.- Bachelor of Science – Production
and Operations Management from California State University, USA.
- Bachelor of Accounting from UAE University.
23+
Mr. Martin Lee Edelman - PhD in Legal Science from Columbia University, USA.
- Bachelor in Political Science from Princeton University, USA.
46+
3.5 FEMALE REPRESENTATION ON THE BOARD OF DIRECTORS DURING 2019In its current formation, the Board of Directors includes one woman (one member), represented in the joining of Mrs. Mariam Saeed Ahmed Ghobash to the Company’s Board of Directors, through the process and procedures for re-election and formation of the Company’s Board of Directors in accordance with the decision issued by the Company’s shareholders at the General Assembly held on 20 March 2019.
Corporate Governance Report (continued)
For the year ended 31 December 2019
89
Ald
ar A
nnua
l Rep
ort 2
019
3.6 ORIENTATION PROGRAMMEThe new Directors are subject to an orientation programme, during which their rights, duties and responsibilities are defined as Directors. The new Directors joined this orientation programme, which aims to obtain comprehensive information from the management and to conduct field visits to the Company’s sites. In addition, the Company has provided all tools and means of communication that would provide the Directors with comprehensive information regarding the Company and its activities, so that the Directors can properly perform their responsibilities, as well as provide them with the latest developments communicated by the Executive Management during the Board’s meetings. The Directors also receive periodic information from specialists inside and outside the Company regarding major business, sector developments and core issues associated with their functions as Directors.
3.7 ELIGIBILITY TO OBTAIN AN INDEPENDENT CONSULTATIONAccording to the Charter of the Board of Directors, each Director shall be entitled to seek an independent external consultation based on non-conflict of interests after consultation with the Board or its Committees. The cost of such external consultations shall be borne by the Company as determined by the Board or its Committees.
3.8 REMUNERATIONS OF THE DIRECTORS AND ALLOWANCES OF ATTENDANCE AT THE MEETINGS OF THE BOARD AND ITS COMMITTEES
Article (28) of the Articles of Association of Aldar Properties provides that:
“The remunerations of the Directors shall be a percentage of the net profit of the Company, provided that it shall not exceed 10% of such profits for the fiscal year. The Company may pay additional expenses, fees or remunerations or monthly salary determined by the Board of Directors to any of its Members if such Member works in any Committee, makes special efforts or performs additional works to serve the Company above his normal duties as a Directors.
Fines imposed on the Company due to violations by the Board of Directors of the Law or the Company’s Articles of Association during the ended fiscal year shall be deducted from the remunerations of the Board. The General Assembly shall be entitled not to deduct such fines if it knew that such fines were imposed not due to default or omission by the Board of Directors.”
Article (48) of the Articles of Association defines the distribution method of net profits. The net annual profits of the Company are distributed after deduction of all general expenses and other costs as follows:
• Ten percent (10%) shall be deducted and allocated to the legal reserve. This deduction shall be stopped when the total reserve amounts to 50% of the Company’s paid-up capital. If the reserve decreased, the deduction shall be resumed. The legal reserve may not be distributed to the shareholders. If the reserve exceeded 50% of the Company’s paid-up capital, such excess may be used to distribute profits to the shareholders in the years when the Company does not achieve net profits enough for distribution.
• The General Assembly shall determine the percentage of the net profit to be distributed to the shareholders after deduction of the legal reserve, provided that if the net profits in a year are not enough for distribution, such profits may not be claimed from profits of subsequent years.
• The Directors shall receive a remuneration to be determined by the General Assembly annually, provided that such remunerations shall not exceed 10% of the net profit of the financial year ended after deducting both depreciation and legal reserve.
• The remainder of the net profit or any part thereof shall be distributed to the shareholders, carried out to the next year or allocated for the establishment of an optional reserve as determined by the Board.
• The Company may distribute annual, semi-annual or quarterly profits to the shareholders in accordance with the policy and/or decisions of profit distributions proposed by the Board of Directors and approved by the General Assembly.
• Total remuneration of the members of the Board of Directors for the year 2018 Based on the decision issued by the General Assembly of the Company at its meeting held on 20 March 2019, the total remuneration received by the Members of the Company’s Board of Directors for the fiscal year ending 31 December 2018 amounted to AED 16,075,000.00 million This amount includes the fees for attending the meetings of the Committees emanating from the Board of Directors during the year 2018 as per the detail which was disclosed in the Corporate Governance Report of Aldar Properties PJSC for the year 2018.
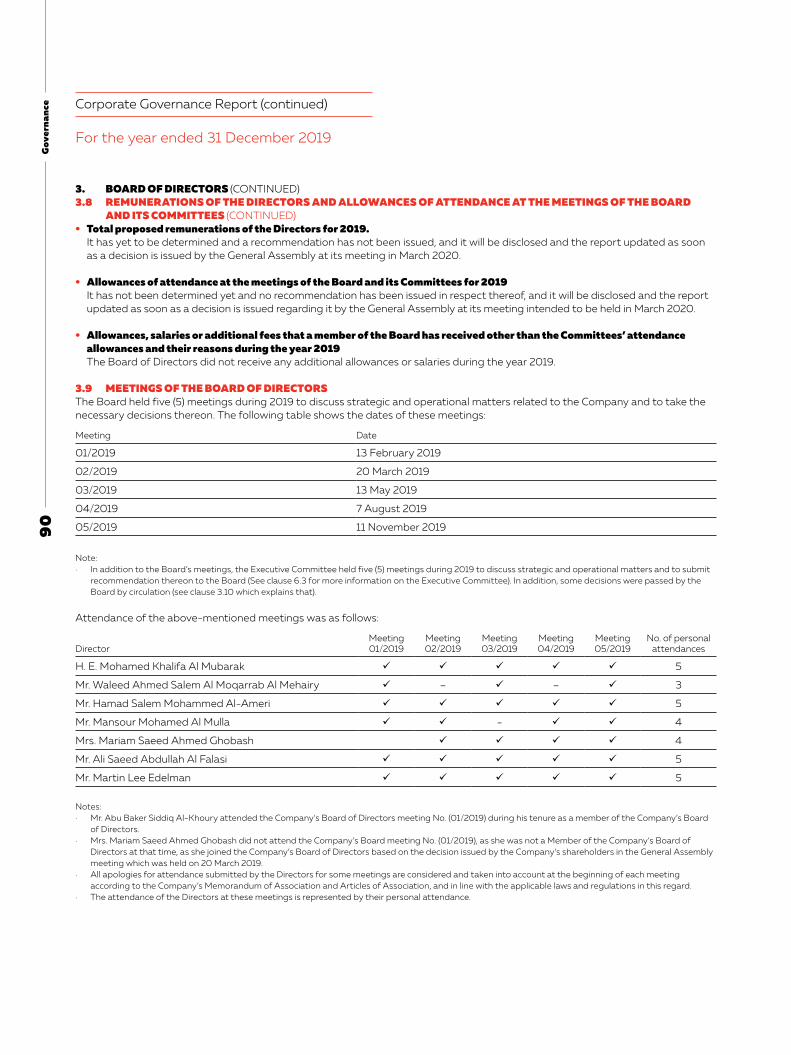
90
Gov
erna
nce
3. BOARD OF DIRECTORS (CONTINUED) 3.8 REMUNERATIONS OF THE DIRECTORS AND ALLOWANCES OF ATTENDANCE AT THE MEETINGS OF THE BOARD
AND ITS COMMITTEES (CONTINUED) • Total proposed remunerations of the Directors for 2019.
It has yet to be determined and a recommendation has not been issued, and it will be disclosed and the report updated as soon as a decision is issued by the General Assembly at its meeting in March 2020.
• Allowances of attendance at the meetings of the Board and its Committees for 2019 It has not been determined yet and no recommendation has been issued in respect thereof, and it will be disclosed and the report updated as soon as a decision is issued regarding it by the General Assembly at its meeting intended to be held in March 2020.
• Allowances, salaries or additional fees that a member of the Board has received other than the Committees’ attendance allowances and their reasons during the year 2019 The Board of Directors did not receive any additional allowances or salaries during the year 2019.
3.9 MEETINGS OF THE BOARD OF DIRECTORSThe Board held five (5) meetings during 2019 to discuss strategic and operational matters related to the Company and to take the necessary decisions thereon. The following table shows the dates of these meetings:
Meeting Date
01/2019 13 February 2019
02/2019 20 March 2019
03/2019 13 May 2019
04/2019 7 August 2019
05/2019 11 November 2019
Note:· In addition to the Board’s meetings, the Executive Committee held five (5) meetings during 2019 to discuss strategic and operational matters and to submit
recommendation thereon to the Board (See clause 6.3 for more information on the Executive Committee). In addition, some decisions were passed by the Board by circulation (see clause 3.10 which explains that).
Attendance of the above-mentioned meetings was as follows:
DirectorMeeting 01/2019
Meeting 02/2019
Meeting 03/2019
Meeting 04/2019
Meeting 05/2019
No. of personal attendances
H. E. Mohamed Khalifa Al Mubarak 5
Mr. Waleed Ahmed Salem Al Moqarrab Al Mehairy – – 3
Mr. Hamad Salem Mohammed Al-Ameri 5
Mr. Mansour Mohamed Al Mulla - 4
Mrs. Mariam Saeed Ahmed Ghobash 4
Mr. Ali Saeed Abdullah Al Falasi 5
Mr. Martin Lee Edelman 5
Notes:· Mr. Abu Baker Siddiq Al-Khoury attended the Company’s Board of Directors meeting No. (01/2019) during his tenure as a member of the Company’s Board
of Directors.· Mrs. Mariam Saeed Ahmed Ghobash did not attend the Company’s Board meeting No. (01/2019), as she was not a Member of the Company’s Board of
Directors at that time, as she joined the Company’s Board of Directors based on the decision issued by the Company’s shareholders in the General Assembly meeting which was held on 20 March 2019.
· All apologies for attendance submitted by the Directors for some meetings are considered and taken into account at the beginning of each meeting according to the Company’s Memorandum of Association and Articles of Association, and in line with the applicable laws and regulations in this regard.
· The attendance of the Directors at these meetings is represented by their personal attendance.
Corporate Governance Report (continued)
For the year ended 31 December 2019

91
Ald
ar A
nnua
l Rep
ort 2
019
3.10 RESOLUTIONS PASSED BY CIRCULATIONDuring 2019, the Board of Directors passed four (4) resolutions by circulation, taking into consideration the relevant controls stipulated in Article (24) of the Company’s Articles of Association and the decision of the Chairman of the Securities and Commodities Authority No. (7/RM) of 2016 on standards of institutional discipline and governance of public joint stock companies, where: • The majority of the Board of Directors agreed that the cases for which the resolutions were passed are considered emergency. • The Directors have been given the resolutions in writing, with all necessary documents, for review and approval. • The resolutions passed by the Board were approved in writing by majority, and were presented at the next meeting of the Board
to be included in the minutes of such meeting. • The passed resolutions by circulation shall not be considered as a meeting of the Board of Directors. Therefore, the minimum
number of the Board’s meetings specified in the Company’s Articles of Associations has been complied with (see clause 3.9 which explains that).
3.11 BUSINESS TRANSACTIONS WITH RELATED PARTIESThe following table shows the transactions done with related parties during 2019:
Related partyNature (type) of the transaction
Transaction value (in AED thousand)
The Government of Abu Dhabi Revenue 1,770,831
A main shareholder Revenue 45,786
Finance Income 8,982
Financing projects and Joint Ventures Finance Income 7,553
Banks Controlled by the Government of Abu Dhabi & Major shareholderInterest Income 36,530
Interest Costs 176,910
4. ORGANISATIONAL STRUCTURE AND EXECUTIVE MANAGEMENT4.1 ORGANISATIONAL STRUCTURE OF THE COMPANYSince its inception, Aldar Properties has been developing and implementing an efficient and effective organisational structure at all departmental and divisional levels in order to ensure a high level of coordination and management interaction, and to ensure a high level of disclosure, transparency and interaction with markets, which is reviewed continuously by the relevant Committee. The following diagram represents the Company’s organisational structure:
Chairman
Board of DirectorsInternal Control
DepartmentAudit Committee
Executive Committee
Nomination and Remuneration
Committee Chief Executive Officer
Development Management
Finance, Administration
and IR
Asset and Investments

92
Gov
erna
nce
4. ORGANISATIONAL STRUCTURE AND EXECUTIVE MANAGEMENT (CONTINUED)4.2 EXECUTIVE MANAGEMENT TEAMThe Executive Management Team (which includes the Chief Executive Officer and Executive Officers of its departments and divisions) work according to their authorities specified by the Board of Directors, and within the approved strategic plan. They are responsible for managing the day-to-day operations of the Company and key business issues, in line with the strategic plan framework of the Company. The Chief Executive Officer periodically meets with the Executive Management Team directly. It should be noted that in the absence of the Chief Executive Officer for any reason, the Management Committee shall follow up all operations and activities of the Company, as this Committee holds its meetings weekly.
The following table shows the Members of the Executive Management Team, and their appointment dates, salaries and remunerations received during 2019:
Position Date of appointment
Total salaries and allowances
during 2019 (in AED)
2019 Short Term Incentives
Remunerations during 2019
(in AED)(A)
Any other remunerations
in cash for 2019 or will be payable
in the future (B)
Chief Executive Officer 15 April 2006 (C) 2,712,564.00 3,895,500.00 629,077.00 See Note (B)
Deputy Chief Executive Officer 27 June 2013 (D) 1,072,152.00 (E) N/A 0.00 Nil
Chief Financial Officer 1 November 2011 2,216,316.00 1,557,500.00 559,947.00 See Note (B)
Chief Investment Officer 17 April 2016 1,934,964.00 1,234,800.00 401,383.00 See Note (B)
Notes:(A) The amounts in AED are combined figures based on the value of RSU units that vested in the relevant year as per the Long-term incentive plan
vesting criteria.(B) The eligible Executive Management Team members are part of a Long-term incentive plan, where applicable RSUs will vest over a period of
four years as follows: Chief Executive Officer: 935,463 RSU, Chief Financial Officer: 374,017 RSU, Chief Investment Officer: 296,524 RSU.(C) The Chief Executive Officer occupied his position on 12 November 2017 according to the Board of Directors’ decision at its meeting No. (06/2017)
held on 12 November 2017, as he was the Chief Development Officer of the Company until that date.(D) The Deputy Chief Executive Officer occupied his position on 28 January 2018 according to the Board of Directors’ decision at its meeting No. (01/2018)
held on 28 January 2018, as he was the Chief Operations Executive Officer with the Company until that date.(E) The Deputy Chief Executive Officer continued to hold his position with the Company until he submitted his resignation from this position as from 30 June 2019.(F) The position of the Chief Development Management Officer remained through the year 2019.
4.3 RESPONSIBILITIES AND AUTHORITIES OF EXECUTIVE MANAGEMENT TEAMThe Chief Executive Officer has the authority to act within the framework of the operational plan and the budget of operating income and expenses discussed and approved by the Board, according to the authorities granted thereto under the Table of Delegations of Authority. The Chief Executive Officer may delegate some of his duties to the Executive Management Team, according to the current policies of the Board, Table of Delegations of Authority and legal requirements which determines the powers of such delegation. The validity of responsibilities and duties vested in the Chief Executive Officer is three (3) renewable years.
Following are the duties and responsibilities assigned by the Board of Directors to the Chief Executive Officer and the members of the Executive Management Team:
A. LEADERSHIP, BUSINESS STRATEGY AND MANAGEMENT • Providing integrated management of the Company, including the provision of adequate and comprehensive information about
the Company to customers, suppliers, shareholders, financial institutions, employees and media. • Development of the Company’s projects and operations, taking into account the responsibilities of the Company towards its
shareholders, customers and employees. • Putting recommendations to the Board of Directors on the development of performance strategies, operations and day-to-day
management. • Management of the Company in line with the strategies, business plans and policies approved by the Board of Directors. • Management of operations and daily affairs, taking into consideration the matters on which the Board of Directors reserves
the right to decide. • Ensuring coordination and integration between the Company’s divisions and departments, and establishment of institutional
culture, Code of Business Conduct, and integrity in the Company, including the matters related to its bids, contracts and other practices.
• Periodic review of the organisational structure of the Company, and making the necessary amendments in this regard. • Directing the Members of the Executive Management in their daily management tasks, and supervising their performance. • Consulting the Board of Directors in matters of strategic or sensitive nature, or which are essential matters, to draw the Board’s
attention to it and take the necessary decisions.
Corporate Governance Report (continued)
For the year ended 31 December 2019

93
Ald
ar A
nnua
l Rep
ort 2
019
B. RISK MANAGEMENT AND INTERNAL CONTROL • Ensuring compliance by the employees with the Code of Business Conduct. • Risk management. • Effective application and management of all essential aspects of risk management, internal control and compliance, to support
policies adopted by the Board of Directors. • Compliance with the legislative and legal requirements of the Securities and Commodities Authority, Abu Dhabi Securities
Exchange, and Federal Law No. (02) of 2015 on commercial companies, as amended.
C. FINANCIAL SUPERVISION AND ASSETS MANAGEMENT • Studying the efficiency and cost effectiveness of all operations of the Company. • Ensuring the integrity of data, records and financial system. • Protecting funds and assets managed by the Company, and ensuring the efficient utilisation thereof. • Ensuring the credibility, accuracy and reliability of financial and administrative information related to the Company’s activity. • Development of annual Financial Statement for approval by the Board of Directors. • Ensuring that the financial reports of the Company reflect a true and fair financial position of the Company and the results
of its businesses and operations. • Verification of all investments and major expenditure of the Company’s capital, and development of appropriate proposals
and recommendations thereon and submission thereof to the Audit Committee, the Executive Committee and/or the Board of Directors for approval.
In addition, the Board of Directors instructed to form a number of Management Committees, which include a number of Members of the Executive Management Team. The Board has delegated to them a set of authorities and powers that will support and enhance the Executive Management functions, which positively reflect on the daily activities and operations of the Company. Each of these Committees shall be subject to a special charter specifying their members and the way of their appointment, their powers, responsibilities, function, the mechanism of action, reporting and periodic performance assessment, etc. Such charters are periodically reviewed by the Board of Directors to ensure the efficiency and effectiveness of these Committees. The Board of Directors conducted a comprehensive review of all the charters of these Committees at its meeting No. (07/2018) held on 14 November 2018. These Committees are as follows:
• Management Committee: chaired by the Chief Executive Officer, and includes in its membership a number of the Members of Executive Management Team. The meetings of the Committee are held on a weekly basis and when necessary. This Committee specialises in ensuring that the Company’s practices, business and operational activities comply with the charters and policies adopted by the Board of Directors, and that they are exercised and carried out in a manner that ensures the interest of the related parties, including customers, shareholders, investors, suppliers, employees, etc. In addition, it reviews and follows up the performance of various divisions, ensures the achievement of key performance indicators and issues the necessary recommendations to the Board and/or its Committees, where necessary with regard to the framework of governance, Table of Delegations of Authority, policies and procedures of the Company, work plan, the Company’s vision, values , objectives, strategy, initiatives and key performance indicators, business environment plans, as well as the Company’s needs of human resources and privileges, allowances and incentives granted thereto, in addition to the investment control process adopted by the Company and issues, recommendations and opportunities related thereto, acquisitions and available investment opportunities, matters related to the subsidiaries and joint projects, and other competencies delegated to the Committee from time to time as per the business requirements.
• Tenders Committee: It is divided into two Committees as follows:- Tenders Committee (A): chaired by the Chief Executive Officer, and includes in its membership a number of the Members
of the Executive Management Team. The meetings of the Committee are held on a weekly basis and when necessary.- Tender Committee (B) is chaired by the General Legal Counsel, and it includes in its membership a number of the Executive
Management Team of the Company, and the Committee holds its membership number of its meetings on a weekly basis and when necessary
This Committee specialises in following up and considering the activities and practices related to contracts and purchase management and lists of service providers and bidders, making the necessary recommendations regarding the awarding of tenders and commissioning works related to the management of development projects, management of assets and contracts, according to the limits, controls and standards established in the Table of Delegations of Authority, and other competencies delegated to the Committee from time to time as per the business requirements.

94
Gov
erna
nce
4. ORGANISATIONAL STRUCTURE AND EXECUTIVE MANAGEMENT (CONTINUED)4.3 RESPONSIBILITIES AND AUTHORITIES OF EXECUTIVE MANAGEMENT TEAM (CONTINUED) • Investment Committee: chaired by the Chief Executive Officer and includes in its membership a number of the Members of the
Executive Management Team. The meetings of the Committee are held on a weekly basis and when necessary. This committee specialises in the review, approval and/or recommendation (according to the Table of Delegations of Authority) on issues related to the investment control, opportunities and strategic investments of the Company, liquidity issues, and other competencies delegated to the Committee from time to time as per the business requirements.
• Risk Management Committee: chaired by the Chief Executive Officer, and it includes in its membership a number of the Members of Executive Management Team. The meetings of the Committee are held quarterly and when necessary (see clause 9.0 of this Report for more information on this Committee).
Members of these Committees acknowledge such Committees’ responsibilities for their responsibilities in the Company, and for reviewing their work mechanisms and ensuring their effectiveness.
5. EXTERNAL AUDITORDeloitte & Touche (M.E.) was appointed as an external auditor of Aldar Properties for the fiscal year ending 31 December 2019 under a decision issued by the Ordinary General Assembly of the Company at its meeting held on 20 March 2019. Deloitte & Touche is considered as one of the leading external audit firms with extensive experience in the field of audit. It is accredited by the Ministry of Economy and operates independently from the Board of Directors and the Executive Management of the Company. Deloitte & Touche has offices in Abu Dhabi, Dubai, Sharjah, Ras Al Khaimah and Fujairah.
The following table shows the services provided by the external auditor during 2019 and the fees charged for these services:
Name of audit firm Deloitte & Touche
Name of partner auditor George Najim
Number of years spent as an external auditor of the Company One year
Total audit fees for the financial statements for the year ended on 31 December 2019 (In AED)
894,000
Other services provided by the external auditor during 2019 and fees charged therefore
Service Details and nature of the serviceAmount (in AED)
Other Advisory Works Other Financial Statements Audit 415,000
Other Audit Works Agreed Upon Procedures & Advisory Services 822,638
Total 1,237,638
In addition, during 2019, Aldar Properties received financial and accounting consultation services as follows:
Company Details and nature of the service Amount (in AED)
1 Ernst & Young Consulting and Advisory Services 728,737
2 UBS Financial Advisor 3,858,750
3 Knight Frank UAE Market Study & Consultancy Services 504,222
4 Ardent Advisory & Accounting LLC Professional Consultancy Services 775,000
5 JLL Valuation Advisory Services 460,000
6 CBRE Valuation Advisory Services 490,000
7 PWC Hospitality Market Assessment and Property Portfolio Review & VAT Audit Services
615,700
Total 7,432,409
The Company’s auditor did not submit any reservations regarding the interim and/or annual financial statements of the Company during 2019.
Corporate Governance Report (continued)
For the year ended 31 December 2019

95
Ald
ar A
nnua
l Rep
ort 2
019
6. BOARD OF DIRECTORS’ COMMITTEESThe Board of Directors has formed three (3) Committees to contribute to the implementation of its functions, and has delegated powers and responsibilities to them to ensure the implementation of its decisions. The following are the Board of Directors’ Committees: • Audit Committee. • Nomination and Remuneration Committee. • Executive Committee.
Each Committee has a charter defining its objectives, responsibilities, structure, framework and reporting mechanism. The charters of these Committees are periodically reviewed to be updated and amended to ensure the efficiency and effectiveness of these Committees. The Board restructured all Committees to ensure the compatibility and harmony of their functions and responsibilities with the decision of the Chairman of the Securities and Commodities Authority No. (7/RM) of 2016 on the standards of corporate discipline and governance of public joint stock companies. In addition, the Board restructured these Committees at its meeting No. (02/2019) held on 20 March 019, following the Board of Directors election process by the Shareholders at the General Assembly meeting held on 20 March 2019.
6.1 AUDIT COMMITTEEMr. Mansour Muhammad Al-Mulla, Chairman of the Audit Committee, acknowledges his responsibility for the Committee’s system in the Company, his review of its work mechanism, and ensuring its effectiveness.
The Audit Committee contributes to the performance by the Board of Directors of the responsibilities imposed by the Company’s governance with respect to risk management, Internal Control Systems, accounting policies, financial reporting and internal and external audits. The Audit Committee ensures that the main objectives of the Company are achieved effectively and efficiently, within a tight framework of internal controls, risk management and governance.
The Audit Committee consists of three non-executive independent members. The charter of the Audit Committee requires that all members of the Committee shall be familiar with financial aspects, and at least one of its members shall have experience in accounting and finance. On the other hand, the Chairman of the Committee shall hold periodic meetings with the Executive Management and the Director of Internal Control Department to ensure that the members of the Committee are informed of the main issues. The Committee shall also meet with the external auditor, without the presence of the Members of the Executive Management, as the Committee deems appropriate.
The following are the members of the Audit Committee:
Audit Committee members Position
Mr. Mansour Mohamed Al Mulla Chairman of the Committee
Mr. Ali Saeed Abdullah Sulayem Al Falasi Member
Mr. Hamad Salem Mohamed Al Ameri Member
Notes:• The Audit Committee was restructured pursuant to the decision issued by the Board of Directors at its meeting No. (02/2019) held on 20 March 2019.• Mr. Mansour Mohamed Al Mulla was elected as Chairman of the Audit Committee pursuant to the decision of the Audit Committee at its meeting
No. (03/2019) held on 7 August 2019.• Up to 20 March 2019, the Audit Committee consisted of the following: Mr. Mansour Mohammed Al Mulla as Chairman of the Committee, Mr. Ali Saeed
Al Falasi, Member and Mr. Ahmed Khalifa Al-Muhairi, Member.

96
Gov
erna
nce
6. BOARD OF DIRECTORS’ COMMITTEES (CONTINUED)6.1 AUDIT COMMITTEE (CONTINUED)The Audit Committee’s Charter defines the responsibilities of the Audit Committee as follows:
A) FINANCIAL REPORTS • Considering any significant and unusual items that are or should be included in the annual, semi-annual and quarterly financial
reports and statements, paying due attention thereto, discussing them with the Executive Management and the external auditor, and making recommendations thereon to the Board of Directors for approval.
• Ensuring a mechanism of continuous disclosure to the Securities and Commodities Authority and Abu Dhabi Securities Exchange. • Ensuring the integrity of the Company’s financial statements and reports (annual, semi-annual and quarterly), reviewing them as
part of their normal work during the year and focusing on: – Any changes in accounting policies and practices. – Highlighting aspects which are subject to the management’s discretion. – Significant amendments resulting from the audit. – Presumption of business continuity. – Compliance with accounting standards established by the Securities and Commodities Authority and Abu Dhabi Securities
Exchange. – Compliance with rules of incorporation, disclosure and other legal requirements related to financial reporting.
B) COMPANY’S GOVERNANCE – Supervising and controlling the internal application of the governance framework and ensuring full compliance with the
relevant legal and legislative systems. – Regular periodic review of the Company’s management compliance with the governance framework approved and adopted
by the Company’s Board of Directors. – Review of the Corporate Governance Report sent annually to the Securities and Commodities Authority and Abu Dhabi
Securities Exchange, and making recommendations to the Board of Directors in this regard.
C) INTERNAL CONTROL SYSTEM AND RISK MANAGEMENT – Appointment of any external party to perform internal audit functions according to the business requirements, determining
their fees, considering their resignation and termination applications. – Periodic review of the Company’s Internal Control Systems, to assess their efficiency and effectiveness. – Discussing the Internal Control System with the Executive Management, evaluating its effectiveness and efficiency in
performing its mission and tasks in a manner that contributes to the development of the Internal Control Systems of the Company.
– Discussing and reviewing the policies and procedures of the Company with its Executive Management, to ensure performing its mission effectively, in a manner that contributes to the development of such policies and procedures.
– Monitoring and following up the implementation of risk management framework and Internal Control Systems according to its policy and working strategies, follow-up and evaluation of efficiency and effectiveness of such policies and strategies by auditing the records and databases, network security and control systems of the operational and strategic units of such departments.
– Studying the results of the key audits on internal control issues (including fraud cases within the Company) previously assigned by the Board of Directors or through an initiative by the Committee upon the approval of the Board.
Corporate Governance Report (continued)
For the year ended 31 December 2019

97
Ald
ar A
nnua
l Rep
ort 2
019
D) EXTERNAL AUDITOR – Development and application of the external auditor appointment policy, submission of the report and recommendations
to the Board of Directors identifying issues on which it considers necessary to take actions and making recommendations on the steps to be taken.
– Coordinating with the Company’s Board of Directors, the Executive Management and the Chief Financial Officer in order to perform its duties. The Committee shall meet with the external auditor at least once a year.
– Discussing the nature, scope and effectiveness of audits, taking into account their compliance with the approved auditing standards.
– Monitoring and following up the independency and objectivity of the external auditor and discussing the nature and scope of audits and its effectiveness according to the approved auditing standards.
– Discussing with the external auditor on the appropriateness of the accounting policies applied in the financial statements. – Reviewing the performance of the external auditor and making recommendations to the Board of Directors in this regard. – Reviewing the external auditor’s mission and work plan and any essential questions raised by the auditor to the Board of
Directors or the Executive Management on the accounting records, financial accounts or control systems, and ensuring that they have been reviewed and discussed, that the necessary actions were taken thereon, and that responses were timely provided thereon.
– Discussing any problems that the external auditor may face during his audit, including restrictions that may limit the scope of work or obtaining information needed to complete the work.
– Ensuring coordination between internal and external auditors, availability of resources necessary to manage internal control, and review and control of the efficiency of such management.
E) INTERNAL CONTROL DEPARTMENT – Reviewing the activities, resources and organisational structure of the Internal Control Department, reviewing the framework
of the Internal Control Department, reviewing and approving annual audit plan. – Considering the process of selecting and appointing the Director of Internal Control Department and the internal audit
providers, their resignation or termination. – Reviewing the reports submitted to the Committee by the Director of the Internal Control Department and the responses
received by the Company’s management thereon, ensuring that the findings and recommendations submitted by the internal auditor and suggestions and responses issued by the Executive Management have been received and discussed and the necessary actions were taken thereon, and discussing the Director of the Internal Control Department on any difficulties encountered in carrying out audit functions such as restrictions on the scope of his work or difficulty in obtaining the information necessary to exercise its responsibilities.
– Evaluation of the quality of functions of Internal Control Department and internal auditor (if any), particularly with regard to planning, follow-up and reporting, and evaluating the performance of the Director of the Internal Control Department and providing him with advice and guidance on the time.
– Ensuring that the Internal Control Department has adequate employees and the appropriate authority and position within the Company.
– Meeting with the Director of Internal Control Department at least once a year to ensure that there are no outstanding issues which may be of interest.
– Reporting to the Board of Directors on all matters considered by the Committee.
F) COMPLIANCE – Reviewing the employees’ compliance with the Code of Business Conduct. – Considering the appointment, resignation or dismissal of the Compliance Officer. – Reviewing the appropriateness of practices and procedures for compliance with applicable laws, regulations and systems. – Reviewing and following up:
– Effectiveness of the follow-up system of compliance with inclusion and disclosure requirements and other legal and legislative requirements related to the Company’s activities (including internal rules, regulations and systems).
– Developments and updates in legislative and legal systems, which may substantially affect the Company. – Efforts made by the Company’s Management to ensure compliance with the Code of Business Conduct.
– Obtaining regular updates from the Management (and the General Counsel or the Compliance Officer when required) on compliance matters, as well as investigating and considering issues that affect the integrity of the Company’s Management Team, including cases of conflict of interests or violation of the Code of Business Conduct, according to the policies and regulations of the Company.

98
Gov
erna
nce
6. BOARD OF DIRECTORS’ COMMITTEES (CONTINUED)6.1 AUDIT COMMITTEE (CONTINUED)G) OTHER RESPONSIBILITIES AND COMPETENCIES
– Creating channels of free and open communication between: Audit Committee, external auditors, internal auditors and Company management.
– Consideration of any other matters or subjects as directed by the Board of Directors in this regard.
H) EMPLOYEES’ REPORTS AND DISCLOSURES – Development of policies, procedures and controls that enable the employees to report any potential violations in the financial
reporting, internal control or other matters in secret, identifying the steps to conduct independent and fair investigations on such violations, and conducting periodic reviews of such policies and procedures.
– Following up the procedures of investigations of such violations to ensure the independency and impartiality of investigations.
– Reviewing the investigation procedures taken by the Company’s management in dealing with the reported violations, and correcting any deviations therein.
The Audit Committee, at its meeting No. (04/2013), reviewed the whistleblower policy of reporting violations, followed up the development and implementation of the relevant regulations to ensure their effectiveness, and submitted a recommendation to the Board of Directors in this regard, which in turn approved it at its meeting No. (06/2013) held on 6 November 2013.
The Audit Committee held five (5) meetings during 2019 as follows:
Meeting No. Date
01/2019 12 February 2019
02/2019 12 May 2019
03/2019 7 August 2019
04/2019 17 October 2019
05/2019 11 November 2019
The above-mentioned meetings’ attendees were as follows:
Member PositionMeeting 01/2019
Meeting 02/2019
Meeting 03/2019
Meeting 04/2019
Meeting 05/2019
No. of attendances
Mr. Mansour Mohamed Al Mulla Chairman of the Committee
5
Mr. Ali Saeed Abdullah Sulayem Al Falasi Member 5
Mr. Hamad Salem Al Ameri Member - 3
Note:· Mr. Ahmed Khalifa Al Mehairi attended the Audit Committee meeting No. (01/2019) in his capacity as a member of the Committee at that time, where the
committee was reconstituted pursuant to the decision issued by the Board of Directors at its meeting No. (02/2019) held on 20 March 2019· Mr. Hamad Salem Mohamed Al Ameri did not attend the Audit Committee meeting No. (01/2019), as he was not yet a member of the Audit Committee
at that time. He became a member of the Audit Committee pursuant to the decision issued by the Company’s Board of Directors in its meeting number (02/2019) that was held on 20 March 2019 regarding the restructuring of this Committee.
· All apologies for attendance submitted by the Committee members for some meetings are considered and taken into account at the beginning of each meeting according to the Company’s Memorandum of Association and Articles of Association, and in line with the applicable laws and regulations in this regard.
· The attendance of the members at these meetings is represented by their personal attendance.
Corporate Governance Report (continued)
For the year ended 31 December 2019

99
Ald
ar A
nnua
l Rep
ort 2
019
6.2 NOMINATION AND REMUNERATION COMMITTEEMr. Martin Lee Edelman, Chairman of the Nomination and Remunerations Committee, acknowledges his responsibility for the Committee’s system in the Company, his review of its work mechanism, and verification of its effectiveness.
The Nomination and Remuneration Committee reports to the Board on human resources management and compensation policies that reflect best practices, and makes recommendations on the succession plans of the Board, taking into account the challenges and opportunities facing the Company and the skills and experience needed in the future.
The Nomination and Remuneration Committee consists of three (3) independent non-executive members. The Chairman of the Committee holds periodic meetings with the Executive Management and the Director of Human Resources Department, to ensure that the members of the Committee are familiar with the substantive matters falling within the competencies of the Committee.The Nomination and Remuneration Committee includes the following members:
Members of Nomination and Remuneration Committee Position
Mr. Martin Lee Edelman Chairman of the Committee
Mr. Mansour Mohamed Al Mulla Member
Mrs. Mariam Saeed Ahmed Ghobash Member
Notes:• The Nomination and Remunerations Committee was reconstituted pursuant to the Board of Directors’ decision issued at its meeting No. (02/2019) held
on 20 March 2019.• Mr. Martin Lee Edelman was elected as the Chairman of the Nominations & Remunerations Committee pursuant to the decision issued by the Committee
at its meeting No. (02/2019) held on 11 March 2019.• Up to 20 March 2019, the Nomination and Remuneration Committee consisted of the following: Mr. Martin Lee Edelman, Chairman, Mr. Mansour Mohamed
Al-Mulla, Member and Mr. Muhammad Haji Al-Khoury, Member.
The Charter of the Nomination and Remuneration Committee defines the responsibilities of the Committee as follows: • Ensuring the independence of the independent members. If the Committee found that a member had lost the requirements for
independence, it shall present the matter to the Board to take the necessary actions in this regard in accordance with applicable laws and regulations.
• Development of the policy for the granting of remunerations, benefits, incentives and salaries of the Directors and employees, and reviewing it annually. The Committee shall ensure that the remunerations and benefits granted to the Senior Executive Management are reasonable and proportionate to the performance of the Company.
• Identifying the Company’s needs of competencies at the level of Senior Executive Management and employees, and the basis of their selection.
• Development, monitor, follow-up and periodically review the human resource and training policy. • Development and approval of the policy and mechanism of nomination for the Board of Directors, organisation and follow-up
of the procedures for nomination for the Board of Directors according to the applicable laws and regulations. • Review of the required skills for the membership of the Board of Directors, and preparation of a description of the capabilities
and qualifications required for membership of the Board. • Review of the structure of the Board of Directors and making recommendations regarding changes that may be made to the
Board of Directors for approval. • Any other competencies and functions determined by the Board of Directors from time to time.

100
Gov
erna
nce
6. BOARD OF DIRECTORS’ COMMITTEES (CONTINUED)6.2 NOMINATION AND REMUNERATION COMMITTEE (CONTINUED)Based on the decision of the Board of Directors at its meeting No. (04/2013) held on 1 July 2013, the Board decided that the Nomination and Remuneration Committee shall hold at least one meeting annually to perform its responsibilities and to fulfil its legislative requirements in accordance with the applicable laws and regulations of the Securities and Commodities Authority. Therefore, the Nomination and Remuneration Committee held three (3) meetings during 2019 as follows:
Meeting No. Date
01/2019 13 February 2019
02/2019 11 November 2019
The above-mentioned meetings’ attendees were as follows:
Member PositionMeeting 01/2019
Meeting 02/2019
No. of attendances
Mr. Martin Lee Edelman Chairman of the Committee 2
Mr. Mansour Mohamed Al Mulla Member 2
Mr. Mariam Saeed Ahmed Ghobash Member 1
Notes:• Mr. Mohamed Haji Al-Khoori attended the Nomination and Remunerations Committee meeting No. (01/2019 in his capacity as a member of the Committee
at that time, where the Nomination and Remunerations Committee was reconstituted pursuant to the decision issued by the Board of Directors at its meeting No. (02/2019) that was held on 20 March 2019.
• Mrs. Mariam Saeed Ahmed Ghobash did not attend the Nomination and Remunerations Committee meeting No. (01/2019) as she was not yet a member of the Committee at that time, as she joined the Nomination and Remunerations Committee pursuant to the decision issued by the Company’s Board of Directors at its meeting No. (02/2019) which took place on 20 March 2019, regarding the restructuring of this Committee
• The attendance of the Members at these meetings is represented by their personal attendance.
6.3 EXECUTIVE COMMITTEEMr. Waleed Ahmed Salem Al-Muqarrab Al-Mehairi, Chairman of the Executive Committee, acknowledges his responsibility for the Committee’s system in the Company, his review of its work mechanism, and verification of its effectiveness.
The Executive Committee plays an advisory role in the Board of Directors. It provides assurance and control of the Company’s strategy and sets priorities for projects and performance.
The Executive Committee consists of three (3) independent non-executive members. The Chairman of the Committee holds periodic meetings with the Executive Management to ensure that the members of the Committee are familiar with the substantive matters.
The Executive Committee includes the following members:
Members of the Executive Committee Position
Mr. Waleed Ahmed Salem Al Moqarrab Al Mehairy Chairman of the Committee
Mr. Hamad Salem Mohamed Al Ameri Member
Mrs. Mariam Saeed Ahmed Ghobash Member
Notes:• The Executive Committee was reconstituted pursuant to the decision issued by the Board of Directors at its meeting No. (02/2019) held on 20 March 2019.• Mr. Waleed Ahmed Salem Al Moqarrab Al Mehairy was elected as Chairman of the Executive Committee pursuant to the decision of the Committee at its
meeting No. (01/2019) held on 8 April 2019.• Up to 20 March 2019, the Executive Committee consisted of the following: Mr. Walid Ahmed Salem Al Muqrab Al Muhairi as Chairman, Mr. Abu Baker Siddiq
Al-Khoori, Member and Mr. Hamad Salem Muhammad Al-Amiri, member of the Committee.
Corporate Governance Report (continued)
For the year ended 31 December 2019
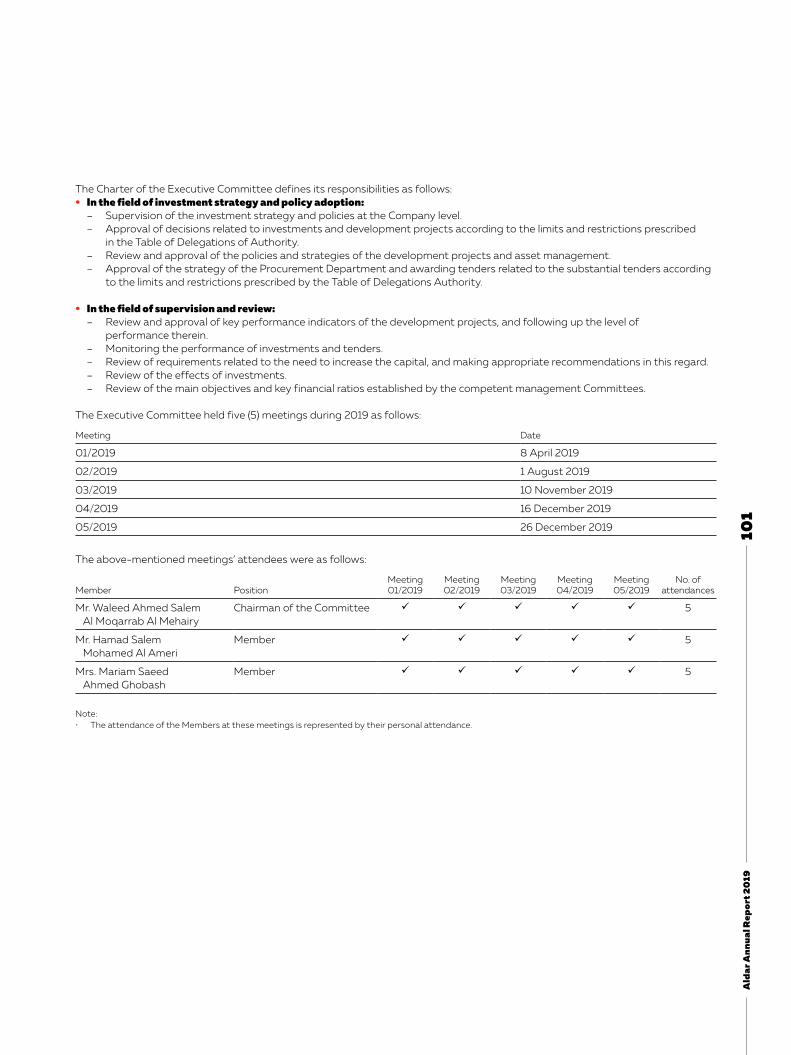
101
Ald
ar A
nnua
l Rep
ort 2
019
The Charter of the Executive Committee defines its responsibilities as follows: • In the field of investment strategy and policy adoption:
– Supervision of the investment strategy and policies at the Company level. – Approval of decisions related to investments and development projects according to the limits and restrictions prescribed
in the Table of Delegations of Authority. – Review and approval of the policies and strategies of the development projects and asset management. – Approval of the strategy of the Procurement Department and awarding tenders related to the substantial tenders according
to the limits and restrictions prescribed by the Table of Delegations Authority.
• In the field of supervision and review: – Review and approval of key performance indicators of the development projects, and following up the level of
performance therein. – Monitoring the performance of investments and tenders. – Review of requirements related to the need to increase the capital, and making appropriate recommendations in this regard. – Review of the effects of investments. – Review of the main objectives and key financial ratios established by the competent management Committees.
The Executive Committee held five (5) meetings during 2019 as follows:
Meeting Date
01/2019 8 April 2019
02/2019 1 August 2019
03/2019 10 November 2019
04/2019 16 December 2019
05/2019 26 December 2019
The above-mentioned meetings’ attendees were as follows:
Member PositionMeeting 01/2019
Meeting 02/2019
Meeting 03/2019
Meeting 04/2019
Meeting 05/2019
No. of attendances
Mr. Waleed Ahmed Salem Al Moqarrab Al Mehairy
Chairman of the Committee 5
Mr. Hamad Salem Mohamed Al Ameri
Member 5
Mrs. Mariam Saeed Ahmed Ghobash
Member 5
Note:• The attendance of the Members at these meetings is represented by their personal attendance.
102
Gov
erna
nce
7. INSIDER AFFAIRS COMMITTEE, AND THE POLICY OF TRADES OF INSIDERS AND MEMBERS OF BOARD OF DIRECTORS IN THE COMPANY’S SHARES
7.1 TRADING POLICY OF INSIDERSThe Board of Directors has developed a policy of insiders in the Company’s shares in accordance with the decision of the Chairman of the Securities and Commodities Authority No. (7) of 2016 on standards of institutional discipline and governance of public joint stock companies and Bylaw No. (5/2009) of the Abu Dhabi Securities Exchange. This policy enables the Board of Directors and the employees to fulfil their legal obligations when they have material information that may affect the Company’s share price in the financial market. It includes a breakdown of the controls regulating to the trades of the insiders, and sets limits on the securities issued by Aldar Properties.
This policy prohibits trading if there is a reasonable possibility of exploiting undisclosed or unpublished information related to the business of the Company and if it has an effect on the trading price. This policy applies to the Board of Directors, Executive Management and all employees who have access to material information and data. It is worth mentioning that the Company is fully committed to conduct a periodic review of the list of its insiders and to update it through the Abu Dhabi Securities Exchange website (the latest update was in November 2019) in line with the Company’s strategic and operational projects and plans.
Under this policy, trading by insiders in the Company’s shares is prohibited during the trading prohibition periods imposed by the Securities and Commodities Authority and Abu Dhabi Securities Exchange. The Members of the Board of Directors, Executive Management and employees of the Company and the subsidiaries shall inform the Market Department before submitting their applications to Abu Dhabi Securities Exchange for insider trading, regardless of the value and type of the transaction (sale or purchase).
Aldar Properties reserves the right to prohibit or restrict any trading if it considers that there is a possibility of exploitation of unpublished (undisclosed) information in respect of the Company’s business, which may affect the trading price of the shares. In addition, an additional prohibition period may be imposed, during which no trading by insiders is allowed, whether they are Members of the Board of Directors, Executive Management or employees of the Company or its subsidiaries, such as the prohibition period that took place in conjunction with the period spent in the merge negotiations and discussions between Aldar Properties and Sorouh Real Estate.
The Members of the Board of Directors are aware of their commitments regarding the requirements for disclosure of their trading in the Company’s shares, and are committed to all requirements prescribed by Securities and Commodities Authority and Abu Dhabi Securities Exchange.
7.2 FOLLOW-UP COMMITTEE OF INSIDER AFFAIRS AND TRADING IN THE COMPANY’S SHARE AND SECURITIES AND ITS DUTIES
In implementation of the decision of the Chairman of the Securities and Commodities Authority No. (7) of 2016 on standards of institutional discipline and governance of public joint stock companies, the Management of the Company formed a committee specialized in the affairs of insiders and their trading in the Company’s shares and securities. In addition, the Management of the Company identified the duties and competencies of such committee as follows:
7.2.1 INSIDER AFFAIRS AND TRADING FOLLOW-UP COMMITTEEThe Insider Affairs and Trading Follow-up Committee includes the following members: • Chief Financial Officer. • General Counsel. • Head of Internal Control Department.
Committee members acknowledge their responsibility for the Committee’s system in the Company, their review of its work mechanism, and verification of its effectiveness.
Corporate Governance Report (continued)
For the year ended 31 December 2019
103
Ald
ar A
nnua
l Rep
ort 2
019
7.2.2 DUTIES AND COMPETENCIES OF THE COMMITTEEThe Insider Affairs and Trading Follow-Up Committee has the following duties and competencies:
• Development of a special and integrated register that includes the insiders’ names and details, including persons who may be considered as temporary insiders and those who have access to the Company’s internal information prior to publication. The record also includes the prior and subsequent disclosures of the insiders.
• Management, follow-up and supervision of the insiders’ transactions and ownerships, and maintaining their record. • Quarterly review of the records and lists of the insiders for continuous update, and consultation with the Executive Management
on any updates required to such records and lists according to the requirements of the business of the Company. • Submission of periodic reports and statements to the Securities and Commodities Authority and Abu Dhabi Securities Exchange. • Ensuring continuous update of the list of insiders on the Abu Dhabi Securities Exchange website, and making any updates to such
list as soon as it occurs. • Continuous communication with the insiders, and raising awareness of their trading in the Company’s shares and securities,
including informing and reminding them of the trading prohibition periods, according to the regulations and rules prescribed by both the Securities and Commodities Authority and Abu Dhabi Securities Exchange, to ensure compliance therewith and avoid any violations.
• Periodic review of the insider trading policy, and raising recommendations on any amendments thereto to the Board for approval on time.
• Any other competencies or tasks delegated to the Committee from time to time by the Management of the Company.
During the year 2019, the Committee developed and drafted the Charter governing its work and regulating its competencies and responsibilities. In addition, the Committee reviewed the insider trading policy to ensure that it complies with the applicable laws and regulations. The Committee plays an important and effective role in managing the insiders’ affairs and raising awareness among them, by educating them with the controls and procedures that govern them and the internal and organisational policies and charters to which they are subject, and informing them of the trading prohibition periods imposed by the relevant authorities and the need not to directly or indirectly exploit any internal or material information for personal interest by trading in the Company’s securities. Furthermore, the Committee continuously works and coordinates with Abu Dhabi Securities Exchange to ensure the continuous update of the Company’s insiders list through the e-services of the Abu Dhabi Securities Exchange, ensuring continuous compliance with the applicable laws and regulations.
7.3 TRANSACTIONS AND TRADING OF THE MEMBERS OF THE BOARD OF DIRECTORS AND THEIR DIRECT RELATIVES IN THE COMPANY’S SHARES DURING 2019
Please refer to clause (2) of this report.
8. INTERNAL CONTROL SYSTEM8.1 BOARD OF DIRECTORS’ RESPONSIBILITY FOR THE INTERNAL CONTROL SYSTEMAs explained in clause (3) of this report, the Board of Directors is responsible for supervision of the Company’s Internal Control System and reviewing its adequacy, effectiveness and efficiency. In addition, the Board formed the Audit Committee and the Internal Control Department to contribute to the performance of governance responsibilities that fall under its responsibility, with regard to the risk management and the Internal Control Systems. In addition, the Board of Directors authorised and delegated the Audit Committee to be functionally responsible for the Internal Control Department under an official authorisation issued by the Board of Directors in this regard. The results of such authorisation shall be presented to the Board according to the regulations and legislation prescribed by the Securities and Commodities Authority, which contributes to increase the effectiveness of this Department, and thus reflects positively on the Board of Directors in exercising its authorities and responsibilities.
8.2 HEAD OF INTERNAL CONTROL DEPARTMENTThe Internal Control Department is headed by Mr. Haider Najim pursuant to a decision issued by the Board of Directors at its meeting No. (05/2013) held on 6 August 2013. Mr. Haider Najim conducts internal audits and reviews independently and regularly. In addition, he advises the Executive Management to ensure the adequacy, effectiveness and efficiency of the Company’s internal control and governance processes. Mr. Haider Najim has over 21 years of experience in internal and external auditing. It should be noted that Mr. Haider Najim holds a bachelor’s degree in commerce from McGill University, Montreal, Canada. In addition, he is a Certified Public Accountant (CPA) licensed by the State of Delaware in the USA, and obtained certificates of Certified Internal Auditor (CIA) and Certified Fraud Examiner (CFE).
8.3 COMPLIANCE OFFICERThe Compliance Officer has been appointed by virtue of a decision issued by the Board of Directors. He is responsible for ensuring compliance by the Company and its employees with the issued laws, regulations and decisions, as well as other internal policies and measures. This step was under the decision of the Chairman of Securities and Commodities Authority No. (7) of 2016 on the standards of institutional discipline and governance of public joint stock companies.

104
Gov
erna
nce
8. INTERNAL CONTROL SYSTEM (CONTINUED)8.3 COMPLIANCE OFFICER (CONTINUED)Mr. Mohammad Hatim Abedalrahman was appointed as Compliance Officer by virtue of a decision issued by the Board of Directors at its meeting No. (05/2013) held on 6 August 2013. Mr. Mohammad Hatim Abedalrahman has working experience in the field of legal, compliance and institutional discipline for more than 11 years. He holds a bachelor’s degree from the Faculty of Sharia and Law at the United Arab Emirates University.
8.4 COMPANY’S DEALINGS WITH MATERIAL ISSUES OR PROBLEMS DISCLOSED IN THE ANNUAL ACCOUNTS AND REPORTS
The Board of Directors has established standards and principles of internal control in the Company, which aim at providing objective, independent and reliable advice, as well as providing an ideal environment for internal control that meets the requirements of the Board of Directors and contributes to enhancing the role of the Board of Directors, the Audit Committee and the Executive Committee, in order to contribute to the proper performance of their duties, functions and responsibilities. It should also be noted that the responsibilities of the Internal Control Department are governed by the Charter approved by the Audit Committee and the Board of Directors, in accordance with the decision of the Chairman of Securities and Commodities Authority No. (7) of 2016 on standards of institutional discipline and governance of public joint stock companies. This charter is the mandate through which the Internal Control Department operates, and contributes to achieving the objectives of the Company and keeping up with its aspirations.
The Internal Control Department reports to the Audit Committee and, as mentioned above, works under its supervision, which enables it to operate independently and objectively, and allows it to distinctively interact with the Chief Executive Officer and the Executive Management Team, making it easier to identify performance improvement initiatives and business development, as well as providing guarantees that the Company’s objectives are effectively achieved. To ensure a high degree of independence in the Internal Control Department’s implementation of its activities and performance of its duties, the Head of Internal Control Department communicates directly with the Members of the Board of Directors. Functionally, he is accountable to the Audit Committee. Administratively, he is accountable to the Chief Executive Officer.
When the Company faces certain material issues, urgent matters or issues disclosed in the annual financial statements or any other means of disclosure, the role of the Internal Control Department in this regard is as follows: • Inclusion of such issues and matters into the audit planning phases. • Providing advice and advisory services (as necessary) to contribute to the identification and resolution of such issues and matters. • Ensuring systematic follow-up of steps and actions taken to address such issues and matters. • Submission of periodic reports to the Board of Directors and the Audit Committee on the development of such issues
and matters.
8.5 REPORTS ISSUED BY THE INTERNAL CONTROL DEPARTMENT OF THE COMPANY’S BOARD OF DIRECTORS.The Internal Control Department carries out its activities and tasks entrusted to it, under the direct supervision of the Audit Committee, in an effective and constructive manner, which contributes to creating an ideal work environment characterised by agreement, effectiveness, compliance, discipline, efficiency in performance and productivity, and encourages attracting qualified professional staff with expertise and efficiency. The Internal Control Department conducts its audit and prepares its reports in accordance with the internal audit standards and applicable laws and regulations, where this department exercises its duties with integrity and impartiality without any interference or influences that may affect the quality and efficiency of its reports. The Internal Control Department reports to the Audit Committee regularly (and when necessary) to present it, discuss it and submit a recommendation in this regard to the Board of Directors to take the appropriate decisions in respect thereof. It is worth noting in this regard that the Internal Control Department prepared and presented 17 reports to the Audit Committee and the Board of Directors during the year 2019, encompassing 26 auditable business units across the Company, and the necessary recommendations have been issued in respect thereof.
9. RISK MANAGEMENTAldar considers that effective risk management is a good management practice. The Company is committed to providing a risk management system to protect shareholders’ investments, the rights of the stakeholders, the assets of the Company, and the prevention of violations of the applicable laws and regulations. The Board of Directors is responsible for approval of the risk management policy, determining their risk tolerance, review of the effectiveness of risk management. The Risk Management Committee applies, in direct coordination with the Executive Management and the Audit Committee, the framework of risk management in the Company, and ensures the continuity of the effective performance thereof. The Committee provides advice to the Board of Directors regarding the efficiency and effectiveness of risk management activities and efforts. In addition, the udit Committee enhances the role of the Board of Directors in fulfilling its obligations and duties related to risk management, in accordance with a decision issued by the Board of Directors at its meeting No. (04/2013) held on 1 July 2013, under which the Risk Management Committee shall be functional subordinate of the Audit Committee, as expressly stated in the Charter of the Audit Committee and the Charter of the Risk Management Committee, approved and adopted at the above-mentioned meeting.
Corporate Governance Report (continued)
For the year ended 31 December 2019

105
Ald
ar A
nnua
l Rep
ort 2
019
The Risk Management Committee has established special risk management standards, developed a risk record, and adapted them to conform to the highest standards in this field. The risk management system ensures consistency of methods of assessing, controlling and communicating risks, and ensures that management efforts are consistent with the strategic objectives and business of the Company.
The Risk Management Policy of Aldar Properties is one of the most important components of the risk management system. A Risk Management Committee was established in 2013 to serve as an administrative committee, whose functions are as follows: • Identification and assessment of risks that may face the Company’s business. • Considering the practices of mitigation of current risks. • Development of the Company’s risk management framework, which includes:
– Risk identification and assessment. – Risk record. – Determining risk tolerance. – Prioritisation of risks. – Risk mitigation and management. – Supervision, follow-up and reporting.
This Committee is presided by the Chief Executive Officer, and includes Members of the Executive Management. The Committee held two meetings during 2019. The Risk Management Committee also: • Reviewed and discussed the Charter of the Risk Management Committee. • Strengthened the risk management framework and policies. • Developed and updated the Company’s risk record.
10. COMMUNICATION WITH SHAREHOLDERSThe Company applies a market disclosure policy, based on corporate governance standards and related requirements and procedures aimed at providing all shareholders and investors in the market with accurate information in a timely manner. The policy adopted by the management of the Company shows the actions that the Board directed to implement and is keen to adhere to, to ensure continuous compliance and disclosure according to the requirements of the Securities and Commodities Authority and Abu Dhabi Securities Exchange.
In addition, as the Company is keen to apply the highest degree of disclosure, transparency and credibility in the information disclosed, only the following position-holders are authorised to disclose any public statements on behalf of the Company, or any other statements attributable thereto: • Chairman and Members of the Board of Directors. • Chief Executive Officer. • Executive Management Team. • Company Secretary.
From time to time, the Company holds meetings with analysts and investors to provide them with necessary information. In such cases, no information shall be disclosed unless it was disclosed to the market previously or at the same time. Aldar Properties does not make any comments about market expectations or rumours, unless they are related to an official question issued by regulatory bodies such as the Securities and Commodities Authority and Abu Dhabi Securities Exchange.
The General Assembly is the primary opportunity for shareholders to meet face-to-face with the Board of Directors and Executive Directors. The shareholders receive notices of the meetings, specifying the time and place of the meeting, in addition to the subjects on the agenda of this meeting. The notice is accompanied by a form of power of attorney and instructions on how to fill it in an envelope sent by the Company to the shareholders by registered mail, in order to encourage as many shareholders as possible to participate in the meetings.
During the meetings, the attendees are given the opportunity to ask questions, and the chairman of the meeting shall discuss as many issues and subjects as possible during the available time. The members are encouraged to be present after the meeting to discuss with shareholders. In addition, the external auditor shall attend the General Assembly meeting to answer any questions raised.
In addition, and as embodiment of the Company’s keenness to effectively communicate with the shareholders, the election of the nominated Directors in 2019 was carried out during the General Assembly meeting held on 20 March 2019 who shall undertake the management of Aldar Properties PJSC. All necessary procedures and requirements that allow shareholders to obtain basic and important information that helps them in choosing their candidates for membership of the Board, and information was also published on the candidates and their CVs through the Abu Dhabi Securities Exchange website and the Company’s website. In addition, relevant coordination has been made with the Securities and Commodities Authority regarding the election, obtaining their approval of these procedures and adhering to the timetable set by them in a manner that controls the this process.

106
Gov
erna
nce
11. CODE OF BUSINESS CONDUCTThe success of the Company depends on its reputation in implementing projects, integrity in its dealings and professional ability. It adheres to the highest standards of professional and legal conduct, taking into consideration all applicable laws and regulations in conducting its business.
Professional and ethical conduct is a duty and commitment for the Board of Directors and the employees, and an integrated part of their working method. The required conduct is summarised in the Company’s Code of Business Conduct applied by the Company and approved by the Board of Directors. It should be noted that the Board of Directors, at its meeting No. (06/2013) held on 6 November 2013, has reviewed and approved this Code of Business Conduct.
12. EMPLOYEES DISCLOSURE MECHANISMIn accordance with the Code of Business Conduct, the Company has developed a disclosure policy for employees, to ensure employees are able to disclose their fears and concerns about any inappropriate conduct without being subjected to persecution, harassment or discrimination, as well as to ensure the confidentiality of the investigations. The Audit Committee, at its meeting No. (04/2013) held on 6 November 2013, has reviewed the whistleblower policy, as stated in paragraph (H) of clause (6.1) above.
This disclosure mechanism allows employees to express their concerns in a responsible and confidential manner, without disclosing their personal data (as they wish), and without fear of being subjected to discrimination. In addition, the Company takes appropriate measures to independently investigate any matters relating to this mechanism.
13. CONFLICT OF INTERESTSThe Company requires the Directors and Senior Executives to report any conflict of interests that may be involved in their acts and to refrain from participating in discussion of or voting on such matters whenever necessary, in addition to the general guidelines contained in the Company’s Articles of Association, Code of Business Conduct and the Charter of the Board of Directors, in accordance with the decisions, laws and regulations issued by the Securities and Commodities Authority and other regulatory and legislative bodies. A series of procedures for compliance with laws with regard to conflict of interest management have been developed. The Company urges the Directors to raise any issue that may lead to a conflict of interest before the Chairman and the Directors.
14. VIOLATIONS COMMITTED BY THE COMPANY DURING 2019The Company did not commit any material violations with respect to the regulations during the year ended 31 December 2019.
15. COMPANY’S SOCIAL RESPONSIBILITYThrough its social responsibility, the Company aims to create a sustainable value for shareholders, employees, suppliers, customers, business partners and the communities in which it operates, by maintaining the sustainability of business and supporting the local community of UAE and other communities, taking into account the social, environmental, ethical and economic aspects in all the activities of the Company.
The Company also aims at fulfilling all social, environmental and corporate responsibilities imposed by the regulations and legislation in the environment through which it operates. For this purpose, Aldar Properties integrates the environmental and social considerations into its decision-making and operational processes, helping to understand both direct and indirect impact of its operations, which in turn lead to better decisions, improving the effectiveness of the work and adding value to the Company’s works, by reducing risks, improving operational efficiency and creating an ideal working environment.
The Company’s social responsibility policy is implemented by focusing on the following aspects: • Governance – through the Code of Business Conduct and accountability. • Employees – by creating an ideal working environment. • Environment – by the management of the impact of the Company’s operations on the environment. • Suppliers – by working with a group of experienced suppliers and service providers to enhance the Company’s social responsibility. • Customers – by providing them with expertise and added value. • Community – by supporting and investing in the local communities through which the Company operates.
Social responsibility has been categorised into community and corporate initiatives to focus and effectively strengthen Aldar Properties’ efforts. Aldar Properties has participated in a number of activities and events in the context of its efforts to contribute to the building of local communities and preserving its environment. These activities include the following: • Al-Watan Fund: Aldar Properties has provided AED 36 million as support to Al-Watan Fund during the year 2019. This initiative
aims to achieve sustainable development, a decent life and a promising future for all citizens of the United Arab Emirates. It also embodies the importance which Aldar gives to its social responsibility, and its pioneering role in encouraging national projects.
Corporate Governance Report (continued)
For the year ended 31 December 2019

107
Ald
ar A
nnua
l Rep
ort 2
019
• These contributions made by Aldar Properties Company to Al-Watan Fund during the year 2019, as well as the voluntary contributions that the Company made earlier to Al-Watan Fund reached a total of AED 120 million. Al Watan Fund is considered as a community initiative that seeks to promote the sense of aid and social affiliation in the Emirati society, as this initiative is in line with our rational government’s vision to support sustainability projects and achieve a better future for the country and the citizen. Moreover, this initiative creates in the minds of the people of the country the values of love for good and giving and promotes social solidarity. It also seeks to set future plans and goals. Al Watan Fund also seeks to direct investments in the UAE human element, through the projects and initiatives which focus on the investment and strategic sectors that have an effective and direct impact on the life of the citizens.
• Special Olympics World Games, Abu Dhabi 2019: Aldar Properties joined the Special Olympics World Games, which took place in Abu Dhabi from 14 – 21 March 2019, as an official partner. This sponsorship comes as a continuation of the sponsorship provided by Aldar Company as an official partner in the Olympics Regional Games hosted by the UAE Capital, Abu Dhabi, recently. The capital, Abu Dhabi, hosted the Special Olympics World Games 2019 under the patronage of His Highness Sheikh Mohammed bin Zayed Al Nahyan, Crown Prince of Abu Dhabi, Deputy Supreme Commander of the Armed Forces, for the first time in the Middle East and North Africa. The Special Olympics is considered the largest athletic and humanitarian event in the world, and the support of Aldar to this exceptional event reflects the Company’s commitment to spreading the message of tolerance, solidarity and charitable work.
• Sponsorship of a flight: Aldar Company sponsored a flight to Kuwait, to transport an audience group to encourage the Emirates national team in the final of the Gulf Cup competition.
• Inviting a group of orphans from the Red Crescent to attend the Aloha Festival event, which is organised by Aldar Company in Al Raha Beach area, during which the Company provided gifts and food vouchers to them.
• Aldar Company provides breakfast meals for its employees and workers who are on the work-sites during breakfast time in the month of Ramadan.
• Aldar Properties Company has minimised the use of plastic products at its headquarters. • An environmental initiative to reduce plastic consumption in Yas Mall, and the mall in Abu Dhabi World Trade Center: the
commercial centres of Aldar Properties launched an environmental awareness campaign to encourage the public to reduce plastic consumption, by distributing reusable fabric bags and displaying sustainable local products.
• Aldar Properties Company organised weekly sports programmes for employees, in the interest of public health and fitness, and to achieve a balance between work and positive energy, in addition to allocating sports programmes for female employees working for the Company in the health club located in the Company’s headquarters.
• Volunteering policy: Within the framework of establishing the Corporate Social Responsibility division, Aldar Properties is looking to involve its employees in volunteer community work. Therefore, volunteer initiatives have been developed to enhance the culture of “giving” and give the Company employees an opportunity to participate in making a difference in society. The policy was approved by some of them to consolidate and establish the importance of the values and initiatives of social responsibility in the hearts of the Company’s employees as an essential part of the life of the Company’s management, in the belief of daily concerns.
• Investment in infrastructure: During the two years of 2018 and 2019, Aldar Properties created a positive impact by carrying out more than 100 activities within the Company’s social responsibility activities through the Company’s operational units, destinations and complexes, which aim to enrich the lives of residents and visitors alike. Either, besides creating positive environmental impacts, the Company’s Board of Directors and the Executive Management Team were an essential part of the responsibility in relation to a number of key social activities, including Special Olympics Middle East events and Al Watan Fund initiatives.
• Supporting and promoting sustainability: During the year 2019, Aldar Properties PJSC selected a number of its qualified and experienced personnel, who are qualified in the field of sustainability.
• Protecting our society: The Environment Agency of Abu Dhabi has developed a series of standards for all public and private sector institutions aimed at promoting sound environmental management practices in all development projects and infrastructure works throughout the Emirate of Abu Dhabi. Al-Dar always meets the requirements and standards of the Environmental Authority, and the Company applies these requirements in its broadest sense to exceed its limits in a manner that contributes more effectively to serving the environment and protecting society and its constituents, through conducting comprehensive environmental assessments, and applying the highest international practices and standards in all of the Company’s activities, and the use of external experts and consultants in order to preserve the environment and society.
• Aldar Youth Council: As part of building a sustainable country, the leadership of the United Arab Emirates has endeavoured to create an initiative that aims to develop the youth segment, and benefit from their skills and capabilities in building a better future for the country. Al Dar Youth Council was launched as an initiative aimed at empowering the youth of the home by providing awareness of the job capabilities available to them, and supporting substantive change through cooperation with the parties concerned, announcing youth from the platform that enables the Company’s level and its various departments.
• Women Initiative Network: Aldar Properties Company launched the “Women Initiative Network”, a distinct internal initiative aiming to enhance the position of women and integrate them in the labour market, and this initiative was launched to support female employees working for the Company, and to promote the principle of equality that contributes to achieving gender balance in the work environment. This initiative is managed by a distinguished elite of women working for the various departments of the Company, who define the areas of this initiative, and the main activities related to it, and collectively agree to develop the relevant strategy. In addition to that, due to the difference and disparity in talents, cultures, races and sexes within Aldar Properties,the Company has launched a Committee for Equality and Integration, which has a clear mission and vision represented in building a culture based on removing differences and achieving equality, and allowing for all talents and creativity. This supports achieving the Company’s vision and enhancing its values, goals and culture, in a way that contributes to achieving business excellence.

108
Gov
erna
nce
16. GENERAL INFORMATION16.1 THE COMPANY’S SHARE PERFORMANCE DURING 2019Trading in the Company’s shares witnessed strong activity during the year ended 31 December 2019. The following table provides an overview of the Company’s share price at the end of each month of the year ended 31 December 2019:
Change
DateOpening
(AED)
Highest price
(AED)
Lowest price
(AED)Closing
(AED)Quantity
(share) Value (AED)No. of
transactions AED %
January 2019 1.56 1.64 1.50 1.59 139,182,706 217,829,089.24 3,620 0.010 0.63
February 2019 1.58 1.86 1.43 1.78 267,149,372 448,092,628.11 5,002 0.190 11.95
March 2019 1.79 1.97 1.76 1.78 323,229,184 606,995,557.65 5,209 0.000 0.00
April 2019 1.78 1.93 1.70 1.78 200,337,986 361,651,107.49 3,875 0.000 0.00
May 2019 1.78 1.82 1.63 1.82 128,573,919 221,148,915.36 3,424 0.040 2.25
June 2019 1.82 1.90 1.76 1.89 135,752,143 252,916,585.22 3,741 0.070 3.85
July 2019 1.89 2.37 1.86 2.31 262,934,139 564,569,468.28 6,750 0.420 22.22
August 2019 2.30 2.35 2.07 2.24 233,939,006 519,545,241.19 6,710 0.070 3.03
September 2019 2.24 2.26 2.08 2.09 157,003,280 342,299,985.64 4,956 0.150 6.70
October 2019 2.09 2.37 1.98 2.35 223,531,491 489,940,620.98 6,388 0.26 12.44
November 2019 2.35 2.17 2.15 2.35 124,613,233 279,479,507.22 3,682 0.18 7.66
December 2019 2.18 2.21 2.15 2.16 159,795,166 346,747,825.75 3,798 0.010 0.46
Source: Abu Dhabi Securities Exchange
Corporate Governance Report (continued)
For the year ended 31 December 2019

109
Ald
ar A
nnua
l Rep
ort 2
019
16.2 COMPARATIVE PERFORMANCE OF ALDAR PROPERTIES’ SHARE PRICE WITH THE GENERAL MARKET INDEX AND SECTOR INDEX DURING 2019
The following diagram shows the comparative performance of the Company’s share price with the general market index and the real estate sector index during the year ended on 31 December 2019:
Jul 19 Aug 19 Sep 19 Nov 19 Dec 19Oct 19Apr 19
Aldar Properties
Jun 19May 19
ADSMI Index ADRE Index
Mar 19Feb 19Jan 19
40
50
60
30
20
10
0
-10
-20
Source: Bloomberg
16.3 STATEMENT OF DISTRIBUTION OF SHAREHOLDERS’ OWNERSHIP AS OF 31 DECEMBER 2019 (INDIVIDUALS – COMPANIES – GOVERNMENTS), CATEGORISED AS FOLLOWS: (LOCAL – GULF – ARABIC – FOREIGN)
The following table shows the distribution of shareholders’ ownership (Individuals – Companies – Governments), categorised as follows: (Local – Gulf – Arabic – Foreign) as of 31 December 2019:
Investor/Shareholder Customer type No. of shareholders No. of shares (share)
Ownership percentage in the capital as per the
category Total shares
Local Government 14 3,133,067,629 39.85%
5,828,180,986Companies 454 1,332,789,233 16.95%
Individuals 42,779 1,362,324,124 17.33%
Gulf Government 2 13,466,763 0.17%
146,360,927Companies 62 116,477,475 1.48%
Individuals 160 16,416,689 0.21%
Arabic Government 0 0 0.00%
72,552,465Companies 19 8,780,483 0.11%
Individuals 999 63,771,982 0.81%
Foreign Government 1 102,654,590 1.31%
1,815,535,225Companies 604 1,664,583,540 21.17%
Individuals 794 48,297,095 0.61%
Total 45,888 7,862,629,603 100% 7,862,629,603Shares (100%)
Source: Abu Dhabi Securities Exchange

110
Gov
erna
nce
16. GENERAL INFORMATION (CONTINUED)16.4 OVERVIEW OF SHAREHOLDERS WHOSE OWNERSHIP PERCENTAGE EXCEEDS 5% OF THE COMPANY’S CAPITAL
AS OF 31 DECEMBER 2019The following table shows the shareholders whose ownership percentage exceeds 5% of the Company’s capital as of 31 December 2019:
Shareholder No. of shares Ownership percentage
Al Mamoura Diversified Global Holding 2,339,464,326 29.8%
Al Sariya Commercial Investment LLC 595,944,021 7.6%
Source: Abu Dhabi Securities Exchange
16.5 STATEMENT OF DISTRIBUTION OF SHAREHOLDERS ACCORDING TO THEIR OWNERSHIP PERCENTAGE AS OF 31 DECEMBER 2019
The following table shows the distribution of shareholders according to their ownership percentage as of 31 December 2019:
Shares ownership (Share) No. of shareholders No. of owned sharesOwned percentage of
the capital
Less than 50,000 43,000 120,132,986 1.52%
From 50,000 to less than 500,000 1,988 347,676,729 4.42%
From 500,000 to less than 5,000,000 720 1,093,142,703 13.90%
More than 5,000,000 180 6,301,677,185 80.14%
Total 45,888 7,862,629,603 100%
Source: Abu Dhabi Securities Exchange
16.6 CONTROLS OF INVESTORS RELATIONSHIPS WITH THE LISTED COMPANIESAccording to the decision of the Chairman of the Securities and Commodities Authority No. (7/RM) on standards of institutional discipline and governance of public joint stock companies, and the circular issued by the Authority on the controls of investor relationships with listed companies, and on the basis of Aldar Properties’ keenness on the optimal application of the applicable rules and regulations in this regard, the Company, during 2017 – 2019, has stimulated and developed the Investor Relations Department and strengthened its role through the fulfilment of the primary and secondary requirements of the Investor Relations Department, in a manner that contributes to raising the consistency and quality in response to the external inquiries of analysts, investors and shareholders. It also strengthens the Company’s investment relations and market linkages, and enhances the knowledge and awareness of the stakeholders and their understanding of the data on the performance of the Company through the application and enforcement of the best ways to communicate with the Company. It further improves the quality of submitted reports by ensuring a high level of disclosure, transparency and interaction with markets through efficient structure at the Senior Management level.
From this viewpoint, the Company has developed and updated its Investor Relations’ website to promote efficiency and effectiveness in accordance with the Securities and Commodities Authority’s applicable requirements and controls of investor relations management. The shareholders, investors, stakeholders and the public can visit this website through the following link:
http://www.aldar.com/en/article/investor-relations/investor-relations-overview.html
In addition, to ensure efficient and effective realisation of the role and objectives of the Investor Relations Department, the Company appointed officials specialised in investor relationships management who have the required qualifications and experience in the fields of business, accounting and public relations, full knowledge of the Company’s activities and opportunities, and familiar with the relevant legal and legislative requirements of the relevant authorities. In addition, they have the skills and ability to interact with customers and provide them with the technical and financial information of the Company easily and smoothly, in both Arabic and English, through various channels of communication. In 2019, the officials of this Department conducted a series of meetings with current shareholders and potential investors, at local and international levels, to enhance awareness and knowledge of the Company’s projects and financial position, in a manner that enhances the confidence in the Company’s performance, projects and portfolio of assets, as well as the Company’s future expansion and growth prospects.
Corporate Governance Report (continued)
For the year ended 31 December 2019

111
Ald
ar A
nnua
l Rep
ort 2
019
The following table shows the details and contact information of the Investor Relations Department officials:
Investor Relations Department officials • Mr. Christopher Wilson • Mr. Mohamed A Maazmi
Contact Information
Telephone 00971 2 8105624 or 00971 2 8105555 or 00971 2 8105866
Fax 00971 2 8105550
P.O. Box 51133 – Abu Dhabi
Email [email protected]@aldar.com
Address Aldar Properties Headquarters (ALDAR HQ)– Al Raha Beach – Abu Dhabi
16.7 SPECIAL DECISIONS TAKEN IN THE GENERAL ASSEMBLY MEETINGS OF SHAREHOLDERS DURING 2019, AND ACTIONS TAKEN IN RESPECT THEREOF
In accordance with the applicable laws and regulations, the special decision is: the decision issued by a majority vote of shareholders who own at least three-quarters of the shares represented in the General Assembly meeting of the joint stock company.
The agenda of Aldar Properties’ General Assembly meeting held on 21 March 2019 included three clauses requiring a special decision by the shareholders, which have been unanimously approved by the shareholders present at this meeting. These clauses are as follows:
• Approval of provision of voluntary community contributions by the Company during 2019, and authorising the Board of Directors to determine the entities to whom such amounts will be allocated, provided that such voluntary contributions shall not exceed 2% of the average net profit of the Company achieved during the fiscal years (2017 and 2018), and provided that such voluntary contributions are made for the purposes of community service and subject to the provisions of Federal Law No. (02) of 2015 on commercial companies in this regard.
• Based on the approval issued by consensus of the shares represented at the General Assembly meeting of the Company, the Board of Directors approved and allocated amounts of money and voluntary contributions to serve the community, within the powers and standards granted to it, and in accordance with the legal requirements in this regard, the most important of which what was announced by the Company on 1 October 2019 for its contribution of AED 36 million to support Sandooq Al Watan (National Fund).
• Agreeing to reduce the number of the Company’s Directors from nine (9) Members to seven (7) Members, and to amend the Article (17 – Election of Directors) (Chapter 4 – The Board of Directors of the Company) of the Company’s Memorandum of Association as follows, subject to obtaining the approval of the Competent Authority:
Article text before amendment Article text after amendment
Article (17)Election of Directors
Article (17)Election of Directors
The Company shall be managed by a Board of Directors composed of nine (9) Directors who shall be elected by the General Assembly in a secret ballot using the cumulative voting procedure. The candidates for Board membership must satisfy the conditions specified by the Nomination and Remunerations Committee and in all cases, the majority of the Directors, including the Chairman, must be United Arab Emirates nationals. Conditions specified by the Nomination and Remunerations Committee may require a candidate to hold (for nomination purposes only) a specific number of shares in the Company or be nominated by one or more shareholders holding a specific number of shares, in both cases the Nomination and Remunerations Committee shall determine that specific number of shares provided that such specific number shall not exceed five million shares.
The Company shall be managed by a Board of Directors composed of nine (7) Directors who shall be elected by the General Assembly in a secret ballot using the cumulative voting procedure. The candidates for Board membership must satisfy the conditions specified by the Nomination and Remunerations Committee and in all cases, the majority of the Directors, including the Chairman, must be United Arab Emirates nationals. Conditions specified by the Nomination and Remunerations Committee may require a candidate to hold (for nomination purposes only) a specific number of shares in the Company or be nominated by one or more shareholders holding a specific number of shares, in both cases the Nomination and Remunerations Committee shall determine that specific number of shares provided that such specific number shall not exceed five million shares.
112
Gov
erna
nce
16. GENERAL INFORMATION (CONTINUED)16.7 SPECIAL DECISIONS TAKEN IN THE GENERAL ASSEMBLY MEETINGS OF SHAREHOLDERS DURING 2019,
AND ACTIONS TAKEN IN RESPECT THEREOF (CONTINUED)Based on the approval issued by the unanimous shares represented in the Company’s General Assembly meeting, the Company has commenced the necessary measures to meet the procedures and legal requirements necessary to activate this decision, amend the Company’s Articles of Association, and publish it in the Official Gazette. Also, contact has been made with the relevant departments of the Securities and Commodities Authority and Abu Dhabi Stock Exchange until the actual implementation and execution of this decision is completed.
16.8 THE COMPANY SECRETARY AND THE DATE OF APPOINTMENT THEREOFAldar Properties, its Board of Directors and Executive Management believe in the role played by the Rapporteur of the Board of Directors’ meetings in organising the work of the Board of Directors and its Committees and the ongoing coordination of matters and issues relating to the meetings of the Board and its Committees, from scheduling meetings, organising the agenda, organisation and coordination of the Members before and during the meetings, preparing their minutes, arranging for the signature and adoption thereof, as well as the Rapporteur’s role in coordination of communication between the different Departments of the Company in relation to decisions issued by the Board and its Committees, to ensure the optimal implementation of such decisions. In addition, he contributes to the continuous communication with the Members of the Board and provision of various information and requirements related thereto, in a manner that ensures that they perform an effective role in their duties as Members of the Board of Directors, according to the applicable laws, regulations and decisions.
Mr. Brett Alexander Scrymgeour was appointed as Rapporteur by virtue of the decision issued by the Board of Directors at its meeting No. (04/2013) held on 1 July 2013. Mr. Brett Alexander Scrymgeour has experience in the legal affairs and institutional compliance for approximately 17 years. He holds a bachelor’s degree in Law and bachelor’s degree in Arts from Queensland University of Technology, Australia.
16.9 MATERIAL EVENTS EXPERIENCED BY THE COMPANY DURING 2019The year 2019 witnessed a significant demand for sales of housing units in all projects launched by Aldar Properties, and this was due to the lack of high-quality housing projects that were put on the market during that period, along with the actual application of the new real estate law for the Emirate of Abu Dhabi. The new real estate law announced in mid-2015, which came into effect from the beginning of 2017, contributes to the regulation of the real estate market in the Emirate of Abu Dhabi and attracts investors to this vital sector. Likewise, the steady growth in asset management activity. Among the most significant events that Aldar Properties experienced during the year 2019 are the following:
• “Aldar” launches new property management solutions in the United Arab EmiratesOn 25 February 2019, and within the framework of the Company’s vision to provide exceptional destinations, Aldar Properties PJSC announced the establishment of “Provis”, with the aim of providing pioneering and innovative solutions in the field of properties management to clients throughout the United Arab Emirates, in a step to reorganise a “service company” strategy to focus on facilities management and home maintenance.
• Aldar Investment fully acquires “Etihad Plaza” and “Etihad Airways Center” through a deal worth AED 1.2 billion On 27 February 2019, Aldar Properties Investment Company PJSC (affiliated to Aldar Properties PJSC) announced the acquisition
of Etihad Plaza and Etihad Airways Center in a commercial deal with Etihad Airways PJSC, with a value of AED 1.2 billion. Within the framework of this transaction, Etihad Airways will fully own its headquarters complex at a percentage of 100%. The ownership of the three blocks prior to this acquisition was jointly owned by Aldar Properties PJSC and Etihad Airways at the rate of 50% each.
• Aldar official opens the huge expansion of the Al Jimi Mall, bringing its total value to a billion Dirhams. On 13 March 2019, Aldar Properties PJSC announced the official opening of the huge expansion of Al Jimi Mall and the
Retail Park area, which will add about 100 brands and restaurants to the preferred and first destination for shopping and entertainment in Al Ain. The total number of shops in Al Jimi Mall shall be more than 200 stores, and the total value of Aldar properties from retail assets in Al Ain becomes more than one billion dirhams.
• Aldar Investment Properties sells Al Murjan Tower through a deal worth AED 289 Million On 19 March 2019, Aldar Properties Investment Company PJSC (affiliated to Aldar Properties PJSC) announced the completion of
the sale deal of Al Murjan Residential Tower in Abu Dhabi with a value of AED 289 million, and this is the second deal for Aldar Investment Properties LLC since its launch in September 2018, after the Company announced the acquisition of real estate assets from Etihad Airways last February 2019.
Corporate Governance Report (continued)
For the year ended 31 December 2019
113
Ald
ar A
nnua
l Rep
ort 2
019
• Aldar launches “Lea” Waterfront Project On 10 April 2019, Aldar Properties PJSC announced the launch of “Lea” project, which overlooks the waterfront of the northern
coast of Yas Island. The project provides plots of land with prices starting from 990 Thousand Dirhams, with areas ranging from 405 square meters to 1800 square meters. The project was available to all nationalities and was launched between 16-18 April 2019 during the Cityscape Abu Dhabi event.
• Aldar sells all plots of the Lea Project during the Cityscape Exhibition On 16 April 2019, Aldar Properties PJSC announced the sale of all plots of the Lea Project located on the northern coast of
Yas Island during the Cityscape Abu Dhabi exhibition, with sales amounted to AED 400 million.
• New legislations allowing the ownership of land by foreign investors in the investment areas of the Emirate of Abu Dhabi On 17 April 2019, Abu Dhabi government issued a decision in respect of enabling all foreign investors to own land and properties
in investment areas in the Emirate of Abu Dhabi. It should be noted that the right of ownership was previously restricted only to the citizens of United Arab Emirates and the GCC countries. In accordance with this decision, real estate units will be registered in the designated investment areas under Abu Dhabi Freehold Law, in addition to issuing property title deeds to investors, according to a statement issued by the Abu Dhabi Government.
• Resignation of the Company’s Deputy CEO On 19 June 2019, Aldar Properties PJSC announced the resignation of Mr. Fahd Saeed Al Ketbi from his position as the Deputy
CEO of the Company effective 30 June 2019 due to personal reasons.
• “Aldar Properties” enters the Indian market through a strategic partnership with the “Anarock” Group On 25 June 2019, Aldar Properties PJSC announced the conclusion of a strategic partnership with “Anarock Property Services
Group”, the leading Indian company in the field of consulting and real estate services, to display the most prominent and most attractive real estate projects in Abu Dhabi to investors and buyers in India. This partnership comes in line with the Company’s strategy to boost international presence and attract foreign investment to Abu Dhabi real estate market.
• Abu Dhabi government assigns Aldar Properties to execute projects worth AED 5 billion On 10 July 2019, and within the framework of the Abu Dhabi Government’s vision to promote the Emirate’s position as one of the
best places in the world for business, investment, living and tourism, Aldar Properties PJSC was selected to execute three social, economic and infrastructure projects for a number of government agencies in Abu Dhabi. The selected projects to be executed by Aldar on behalf of Abu Dhabi government at a total cost of five billion dirhams includes major destinations in the Emirate that include: Saadiyat Island, Yas Island and Al Falah District, which host a number of the most prominent modern residential complexes, and the most important commercial centres and thriving business destinations in the Emirate of Abu Dhabi.
• Aldar Real Estate launches “Saadiyat Reserve” project On 8 September 2019, Aldar Properties PJSC launched the “Saadiyat Reserve” project, which is considered its first project aiming
to sell residential plots in the heart of Saadiyat Island. The value of the project is AED 722 million, and includes 306 plots of land equipped with the necessary infrastructure for construction, available for buyers of all nationalities. The Saadiyat Reserve project is the first plot project to be launched on Saadiyat Island since the government issued, in April 2019, new laws allowing foreign buyers to purchase land under the freehold system in the investment areas in Abu Dhabi.
• Aldar Real Estate contributes AED 36 million in favour of Al Watan Fund On 1 October 2019, Aldar Properties PJSC announced that it has provided additional support of AED 36 million to Al Watan Fund,
the initiative to finance national projects, bringing the total contributions to the fund to AED 120 million. This is in line with the Company’s commitment to support innovative entrepreneurial projects in the country, in compliance with the guidance of rational leadership.
• “Aldar” holds meetings with fixed income investors to promote the issuance of “Aldar Investment” Bonds On 9 October 2019, Aldar Properties PJSC announced that the fully owned “Aldar Investment Company” held a series of
meetings with fixed income investors in Europe, Asia and the Middle East on 10 October 2019 to issue bonds denominated in US dollars, for 10 years. The result of this issue is subject to market conditions, and the proceeds will be used for the purpose of refinancing existing debts.

114
Gov
erna
nce
16. GENERAL INFORMATION (CONTINUED)16.9 MATERIAL EVENTS EXPERIENCED BY THE COMPANY DURING 2019 (CONTINUED) • Strong demand for Aldar Investment Bonds worth USD 500 million each, for 10 years
On 16 October 2019, Aldar Investment Company LLC (wholly owned by Aldar Properties PJSC) announced its success in selling US dollar denominated bonds with a nominal value of USD 500 million, at a fixed profit rate for 10 years. The bonds were priced at a profit rate of 3.875%, the lowest in the history of the issues of Aldar. Thanks to strong investor demand, these bonds constitute the first general issue for a term of 10 years of an issuer based in Abu Dhabi. The subscription applications exceeded the amount offered by more than six times, and 71% of the total bonds was allocated to international investors.
• Aldar Properties begins handing over residential units gradually in Al Mamsha and Jawaher projects of Saadiyat Island On 5 November 2019, Aldar Properties PJSC announced the phased handover commencement of two of its pioneering
development projects in Saadiyat Island, which are “Saadiyat Walk” and “Jawaher”. The Saadiyat Walk is a mixed-use destination in the Saadiyat Cultural District, and offers luxurious overlooking the beachfront with access to many retail stores, restaurants and leisure facilities along the beach. The “Jawaher” project is also considered as an exclusive gated complex located in the prestigious Saadiyat Beach area.
• Aldar Properties cooperates with ADNOC to implement its new programme for issuing local value-added enhancement certificates
On 13 November 2019, Aldar Properties PJSC announced that it has signed a partnership agreement with Abu Dhabi National Oil Company, ADNOC, to launch its new programme to issue ICV certificates, with the aim of promoting the Company’s sustainable procurement strategy. This partnership is in line with the Company’s commitment by adopting the best practices of sustainable environment and integrated infrastructure, which is one of the six priorities set by the UAE National Agenda 2021, which was launched in 2010 by His Highness Sheikh Mohammed bin Rashid Al Maktoum, Vice President of the UAE and Prime Minister and Ruler of Dubai, may God protect him.
The Memorandum of Understanding between Aldar and ADNOC companies was signed on the sidelines of “Abu Dhabi International Petroleum Exhibition and Conference (“ADIPEC”). In addition to launching the certification programme, the Memorandum of Understanding aims at enhancing cooperation efforts between the two parties to provide new job opportunities for skilled Emirati resource within the private sector, in addition to identifying local sources of goods and services from inside the UAE. The new programme also supports the Company’s contribution to the ongoing process of economic growth and diversification in the country.
• Khalid Bin Mohammed Bin Zayed launches “Saadiyat Grove”, the latest integrated destination in the heart of the cultural area, “Aldar” project developed with a cost of AED 8 billion on an area of 242 thousand square metres
On 25 November 2019, His Highness Sheikh Khalid Bin Mohammed Bin Zayed Al Nahyan, Member of the Executive Council of the Emirate of Abu Dhabi and Chairman of the Abu Dhabi Executive Office, launched the “Saadiyat Grove” project in the heart of the cultural area of Saadiyat Island in Abu Dhabi, which is being developed by Aldar Properties with a total value of AED 8 billion, on an area of 242 thousand square metres, and it is characterised by an integrated culture identity that enhances the style of living in the capital, Abu Dhabi.
His Highness Sheikh Khalid Bin Mohammed Bin Zayed Al Nahyan made a tour in the interactive ‘Saadiyat Grove Experience” Center, located in the Saadiyat Walk, during which he was briefed on the main plan and design models of the project. His Highness was accompanied during the tour by H.E. Mohamed Khalifa Al Mubarak, Chairman of the Board of Directors of Aldar Properties PJSC, and Mr. “Talal Al Dhibi” CEO of the Company.
The project enhances the culture of living in Abu Dhabi through an integrated system of residential and commercial spaces. The project is being developed in phases, and is expected to hand over the first phase in 2022.
• Abu Dhabi Government concludes a strategic agreement to exchange land with Aldar Properties On 25 December 2019, Abu Dhabi Government concluded an agreement to exchange with Aldar Properties PJSC under which
parcels of land for development shall be redistributed in line with the parties’ strategic priorities. The implementation of the agreement started in December 2019, when the two parties will exchange parcels of land in the Emirate of Abu Dhabi, without any consideration. According to the agreement, the Company will acquire a land equipped with infrastructure with a floor area of three million square metres, distributed equally between the cultural area of Saadiyat Island and the Port of Zayed region, while Abu Dhabi Government will acquire parcels of land with a similar area in the western region of Al Raha Beach and LuluIsland, in addition to a group of land inside Abu Dhabi Island that are not covered by Aldar’s strategic development plans for the foreseen future.
In addition, other material events have been disclosed to the Securities and Commodities Authority, Abu Dhabi Securities Market and various media outlets during 2019.
Corporate Governance Report (continued)
For the year ended 31 December 2019

115
Ald
ar A
nnua
l Rep
ort 2
019
16.10 EMIRATISATION PERCENTAGE IN THE COMPANY FOR THE YEARS 2017, 2018 AND 2019Aldar Properties has adopted a policy that contributes to attracting national, experienced and qualified personnel who play a fundamental and effective role in supporting the Company’s progress, projects and business, in a way that enhances the Company’s capabilities and resources, and contributes to support the development process witnessed by the Emirate of Abu Dhabi under the stewardship of the Company’s leadership. In this regard, it is worth mentioning that the Company succeeded in raising the Emiratisation percentage during the 2019. The following table shows the Company’s Emiratisation ratios for the years 2017, 2018 and 2019:
Year 2017 2018 2019
Emiratisation ratio 27.30% 28.20% 27.00%
16.11 PROJECTS AND INNOVATIVE INITIATIVES PERFORMED BY THE COMPANY DURING 2019Aldar Properties firmly believes in the importance of adopting projects and innovative initiatives that would meet the needs and requirements of communities, customers, shareholders, investors and stakeholders in general. The Company is keen to provide a transparent and competitive investment environment to enhance the efficiency of the real estate sector through which the Company operates, and to enhance and encourage the attractiveness of professional expertise and capital to work and invest in this vital sector. During 2019 (in line with what was initiated in 2017), Aldar Properties played an important and substantial role in adopting many initiatives and continuous coordination with real estate customers in Abu Dhabi (individuals, companies and governmental and non-governmental entities) as follows:
• Development of policies, procedures and foundations that contribute to the optimal application of the new Real Estate Law of the Emirate of Abu Dhabi, in a manner that contributes to enhancing the efficiency of this vital sector, achieves a high degree of integration and coordination between public and private companies and institutions, and contributes to push the wheel of progress and prosperity based on the principles and foundations adopted by the Company’s leadership.
• Aldar Properties launched a smart electronic application that includes all services related to the employees making it easier for them to submit their requests related to human resources management and performance evaluation, sales management and commercial affairs and other departments and business units within the Company, to facilitate the application process and obtain the necessary service as quickly as possible and from anywhere through this application.
• Aldar Properties launched a direct electronic application that includes all options and products that the Company launches and places into the market. This application facilitates the process of communication with shareholders, investors, customers and stakeholders interested in investing in real estate, by providing comprehensive and adequate information regarding real estate products (units, villas, lands, townhouses, etc.), whether for sale or leasing. In addition, the Company provides early booking services by visiting this application and/or the Company’s website.
Signature:
Chairman of the Nomination and Remuneration Committee
Chairman of the Audit Committee
Director of the Internal Control Department
Mr. Martin Lee Edelman Mr. Mansour Mohammed Al-Mulla Mr. Haider Najm
Approval of the Board of Directors
Approved by the Board of Directors at its meeting No. (02/2020) held on12 February 2020
H.E. Mohamed Khalifa Al MubarakChairman of the Board

116
Gov
erna
nce Board of Directors’ Report
For the year ended 31 December 2019
The Directors present their report together with the audited consolidated financial statements of Aldar Properties PJSC (the “Company”) and its subsidiaries (together referred to as the “Group”) for the year ended 31 December 2019.
PRINCIPAL ACTIVITIESThe Group is engaged in various businesses primarily the development, sales, investment, construction, leasing, management and associated services for real estate. In addition, the Group is also engaged in development, construction, management and operation of hotels, schools, marinas, cooling station operations, restaurants, beach club and golf courses.
FINANCIAL RESULTSThe financial results of the Group have been presented on page 11 of these consolidated financial statements.
DIRECTORS
H.E. Mohamed Khalifa Al Mubarak ChairmanH.E. Waleed Ahmed Al Mokarrab Al Muhairi Vice ChairmanMr. Ali Saeed Abdulla Sulayem Al Falasi DirectorMr. Mansour Mohamed Al Mulla DirectorMs. Mariam Saeed Ahmed Ghobash DirectorMr. Martin Lee Edelman DirectorEng. Hamad Salem Mohamed Al Ameri Director
RELEASEThe Directors release from liability management and the external auditor in connection with their duties for the year ended 31 December 2019.

117
Ald
ar A
nnua
l Rep
ort 2
019

118
Fina
ncia
l Sta
tem
ents
REPORT ON THE AUDIT OF THE CONSOLIDATED FINANCIAL STATEMENTS OPINIONWe have audited the consolidated financial statements of Aldar Properties P.J.S.C (the “Company”) and its subsidiaries (together, the “Group”), which comprise the consolidated statement of financial position as at 31 December 2019 and the consolidated income statement, consolidated statement of comprehensive income, consolidated statement of changes in equity and consolidated statement of cash flows for the year then ended, and a summary of significant accounting policies and other explanatory information.
In our opinion, the accompanying consolidated financial statements present fairly, in all material respects, the consolidated financial position of the Group as at 31 December 2019, and its consolidated financial performance and its cash flows for the year then ended in accordance with International Financial Reporting Standards (IFRS).
BASIS FOR OPINIONWe have conducted our audit in accordance with International Standards on Auditing (ISAs). Our responsibilities under those standards are further described in the Auditor’s responsibilities for the audit of the consolidated financial statements section of our report. We are independent of the Group in accordance with the International Ethics Standards Board for Accountants’ Codes of Ethics for Professional Accountants (IESBA Code) together with the other ethical requirements that are relevant to our audit of the Group’s consolidated financial statements in the United Arab Emirates, and we have fulfilled our other ethical responsibilities in accordance with these requirements and the IESBA Code. We believe that the audit evidence we have obtained is sufficient and appropriate to provide a basis for our opinion.
KEY AUDIT MATTERSKey audit matters are those matters that, in our professional judgement, were of most significance in our audit of the consolidated financial statements of the current year. We have communicated the key audit matters to the Audit Committee but they are not a comprehensive reflection of all matters that were identified by our audit and that were discussed with the Audit Committee. On the following pages, we have described the key audit matters we identified and have included a summary of the audit procedures we performed to address those matters.
Independent Auditor’s Report
To the Shareholders of Aldar Properties PJSC

119
Ald
ar A
nnua
l Rep
ort 2
019
The key audit matters were addressed in the context of our audit of the consolidated financial statements as a whole, and in forming our opinion thereon, and we do not provide a separate opinion on these matters.
Key audit matter How the matter was addressed in our audit
Net realisable value of land held for sale
The Group’s land held for sale amounted to AED 4,797 million as at 31 December 2019 (2018: AED 3,806 million). The Group recognised a loss of AED 525 million in the consolidated income statement which represents difference between the cost of certain plots of land and their net realisable values.
An assessment of the net realisable value of the Group’s land held for sale is carried out at each reporting date based on external valuation exercise. Key inputs used by management in their assessment include forecast selling prices, site planning (including planning consent), build costs, cost recoveries, sales rates (per square meter) and discount rates, which are influenced by prevailing market conditions and the specific characteristic of the land in the portfolio.
The Group appointed professionally qualified external valuers to determine the fair value of the Group’s portfolio of land held for sale.
In the event that the carrying amount of land held for sale is higher than its net realisable value, the Group adjusts the carrying values to net realisable value and recognises a net realisable value write down.
We considered valuation of the land held for sale as a key audit matter because of the quantitative materiality of the balance and the significant estimates made by management in determining the net realisable value.
Refer to note 12 for disclosures relating to this matter.
We assessed the design and implementation of controls in this area.
We considered if there was any plots of land which had not been considered for an assessment for net realisable value by management.
We assessed the valuer’s competence and capabilities and read their terms of engagement with the Group to determine that the scope of their work was sufficient.
We sample tested data provided to the valuer by the Group.
We involved our internal real estate valuation specialist to review selected properties valued by the external valuer and assessed whether the net realisable value of the plots of land was performed in accordance with the requirements of IAS 2 Inventories.
Where we identified estimates that were outside acceptable parameters, we discussed these with the valuers and management to understand the rationale behind the estimates made.
We performed sensitivity analyses on the significant assumptions to evaluate the extent of their impact on the determination of fair values.
We reperformed the arithmetical accuracy of the determination of net realisable value.
We assessed the disclosures made to determine if they were in accordance with the requirements of IFRSs.

120
Fina
ncia
l Sta
tem
ents
REPORT ON THE AUDIT OF THE CONSOLIDATED FINANCIAL STATEMENTS (CONTINUED)KEY AUDIT MATTERS (CONTINUED)
Key audit matter How the matter was addressed in our audit
Valuation of investment properties
The Group’s investment property portfolio amounted to AED 16,783 million as at 31 December 2019 (2018: AED 16,408 million) and the net fair value loss recorded in the consolidated income statement amounted to AED 375 million (2018: AED 671 million). The Group measures its investment properties at fair value.
The determination of fair value of these investment properties is based on external valuations using income approach of valuation.
The Group’s undiscounted future cash flows analysis and the assessment of the expected remaining holding period and income projections on the existing operating assets requires management to make significant estimates and assumptions related to future rental rates, capitalisation rates and discount rates.
The valuation of the portfolio is a significant judgement area and is based on a number of assumptions. The existence of significant estimation uncertainty warrants specific audit focus in this area as any bias or error in determining the fair value could lead to a material misstatement in the consolidated financial statements.
In the event that the fair value of a real estate asset is higher or lower than its carrying amount, the Group will recognise a fair value adjustment in its consolidated income statement.
We have identified the valuation of investment properties as a key audit matter as the fair value is determined based on level 3 valuation methodologies and it requires management to make significant estimates in determining the fair value of investment property.
Refer to note 8 for disclosures relating to this matter.
We evaluated the design and implementation of controls in this area.
We assessed the valuer’s competence and capabilities and read their terms of engagement with the Group to determine that the scope of their work was sufficient.
We agreed the total valuation in the valuers report to the amount reported in the consolidated statement of financial position.
We tested the data provided to the valuer by the Group, on a sample basis.
We involved our internal real estate valuation specialist to review selected properties valued by external valuers and internally by management and assessed whether the valuation of the properties was performed in accordance with the requirements of IFRS 13 Fair Value Measurement.
Where we identified estimates that were outside acceptable parameters, we discussed these with the valuers and management to understand the rationale behind the estimates made.
We performed sensitivity analyses on the significant assumptions to evaluate the extent of their impact on the determination of fair values.
We reperformed the arithmetical accuracy of the determination of recoverable amounts.
We assessed the disclosures made to determine if they were in accordance with the requirements of IFRSs.
Independent Auditor’s Report
To the Shareholders of Aldar Properties PJSC (continued)

121
Ald
ar A
nnua
l Rep
ort 2
019
Key audit matter How the matter was addressed in our audit
Revenue recognition for property development and sales
Revenue recognition on property development and sales required significant judgements to be applied and estimates to be made. The Group assesses for each of its contracts with customers for property development and sales, whether to recognise revenue over time or at a point in time based on a consideration of whether the Group has created a real estate asset with no alternative use and whether the Group has an enforceable right for payment related to performance completed at any time during the life of the contract as disclosed in Note 3.7 and Note 4 to the consolidated financial statements.
Where revenue is recognised over time, the Group estimates total development and infrastructure costs required to meet performance obligations under the contract and recognises proportionate revenue to the extent of satisfaction of performance obligations as at the end of the reporting period.
Revenue recognition on property development and sales was assessed as a key audit matter due to the significance of the assessment of satisfaction of performance obligations and judgements made in assessing the timing of revenue recognition.
Refer to note 4 for details about judgements applied and estimates made in determining the amount of revenue to be recognized.
We obtained an understanding of the process implemented by the Group for revenue recognition and measurement in respect of property development and sales.
We tested the design, implementation and operating effectiveness of controls established by the Group over revenue recognition and measurement for property development and sales.
We inspected a sample of contracts with customers for property development and sales and assessed management’s identification of performance obligations and their determination of whether revenue should be recognised over time or at a point in time in accordance with the requirements of IFRS 15 Revenue from Contracts with Customers by making reference to the terms and conditions specified in the contracts.
We determined to what extent the resultant performance obligations had been satisfied through the inspection of supporting documentation.
We examined approved project cost budgets for significant on-going real estate developments and reviewed the projects’ completion percentages as a percentage of total costs incurred. We also inspected supplier invoices, on a sample basis, to substantiate the costs incurred. For a sample of significant projects, we recalculated the amount of revenue to be recognised.
We evaluated the governance around approval of project budgets and held discussions with management where significant variances against the approved budgets were noted to understand the underlying reason.
We assessed the disclosures made in the consolidated financial statements in this area against the requirements of IFRSs.
OTHER MATTERThe consolidated financial statements of the Group for the year ended 31 December 2018 were audited by another auditor who expressed an unmodified opinion on those statements on 13 February 2019.
OTHER INFORMATION The Board of Directors are responsible for the other information. The other information comprises the Board of Directors’ Report, which we obtained prior to the date of this auditor’s report, and the Group’s Annual Report, which are expected to be made available to us after that date. The other information does not include the consolidated financial statements and our auditor’s report thereon.
Our opinion on the consolidated financial statements does not cover the other information and we do not and will not express any form of assurance conclusion thereon.
In connection with our audit of the consolidated financial statements, our responsibility is to read the other information and, in doing so, consider whether the other information is materially inconsistent with the consolidated financial statements or our knowledge obtained in the audit, or otherwise appears to be materially misstated.
If, based on the work we have performed on the other information that we obtained prior to the date of this auditor’s report, we conclude that there is a material misstatement of this other information, we are required to report that fact. We have nothing to report in this regard.

122
Fina
ncia
l Sta
tem
ents
REPORT ON THE AUDIT OF THE CONSOLIDATED FINANCIAL STATEMENTS (CONTINUED)When we will read the Group’s Annual Report, if we conclude that there is a material misstatement therein, we will be required to communicate the matter to those charged with governance and consider whether a reportable irregularity exists in terms of the auditing standards, which must be reported.
RESPONSIBILITIES OF MANAGEMENT AND THOSE CHARGED WITH GOVERNANCE FOR THE CONSOLIDATED FINANCIAL STATEMENTS Management is responsible for the preparation and fair presentation of the consolidated financial statements in accordance with International Financial Reporting Standards and the applicable provisions of the articles of association of the Company and the UAE Federal Law No. (2) of 2015, and for such internal control as management determine is necessary to enable the preparation of consolidated financial statements that are free from material misstatement, whether due to fraud or error.
In preparing the consolidated financial statements, management is responsible for assessing the Group’s ability to continue as a going concern, disclosing, as applicable, matters related to going concern and using the going concern basis of accounting unless management either intends to liquidate the Group or to cease operations, or have no realistic alternative but to do so.
AUDITOR’S RESPONSIBILITIES FOR THE AUDIT OF THE CONSOLIDATED FINANCIAL STATEMENTSOur objectives are to obtain reasonable assurance about whether the consolidated financial statements as a whole are free from material misstatement, whether due to fraud or error, and to issue an auditor’s report that includes our opinion. Reasonable assurance is a high level of assurance, but is not a guarantee that an audit conducted in accordance with ISAs will always detect a material misstatement when it exists. Misstatements can arise from fraud or error and are considered material if, individually or in the aggregate, they could reasonably be expected to influence the economic decisions of users taken on the basis of these consolidated financial statements.
As part of an audit in accordance with ISAs, we exercise professional judgement and maintain professional skepticism throughout the audit. We also: • Identify and assess the risks of material misstatement of the consolidated financial statements, whether due to fraud or error,
design and perform audit procedures responsive to those risks, and obtain audit evidence that is sufficient and appropriate to provide a basis for our opinion. The risk of not detecting a material misstatement resulting from fraud is higher than for one resulting from error, as fraud may involve collusion, forgery, intentional omissions, misrepresentations, or the override of internal control;
• Obtain an understanding of internal control relevant to the audit in order to design audit procedures that are appropriate in the circumstances, but not for the purpose of expressing an opinion on the effectiveness of the Group’s internal control;
• Evaluate the appropriateness of accounting policies used and the reasonableness of accounting estimates and related disclosures made by management;
• Conclude on the appropriateness of management’ use of the going concern basis of accounting and based on the audit evidence obtained, whether a material uncertainty exists related to events or conditions that may cast significant doubt on the Group’s ability to continue as a going concern. If we conclude that a material uncertainty exists, we are required to draw attention in our auditor’s report to the related disclosures in the consolidated financial statements or, if such disclosures are inadequate, to modify our opinion. Our conclusions are based on the audit evidence obtained up to the date of our auditors’ report. However, future events or conditions may cause the Group to cease to continue as a going concern;
• Evaluate the overall presentation, structure and content of the consolidated financial statements, including the disclosures, and whether the consolidated financial statements represent the underlying transactions and events in a manner that achieves fair presentation; and
• Obtain sufficient appropriate audit evidence regarding the financial information of the entities or business activities within the Group to express an opinion on the consolidated financial statements. We are responsible for the direction, supervision and performance of the group audit. We remain solely responsible for our audit opinion.
We communicate with those charged with governance regarding, among other matters, the planned scope and timing of the audit and significant audit findings, including any significant deficiencies in internal control that we identify during our audit.
We also provide those charged with governance with a statement that we have complied with relevant ethical requirements regarding independence, and to communicate with them all relationships and other matters that may reasonably be thought to bear on our independence, and where applicable, related safeguards.
From the matters communicated with those charged with governance, we determine those matters that were of most significance in the audit of the consolidated financial statements of the current period and are therefore the key audit matters. We describe these matters in our auditors’ report unless law or regulation precludes public disclosure about the matter or when, in extremely rare circumstances, we determine that a matter should not be communicated in our report because the adverse consequences of doing so would reasonably be expected to outweigh the public interest benefits of such communication.
Independent Auditor’s Report
To the Shareholders of Aldar Properties PJSC (continued)

123
Ald
ar A
nnua
l Rep
ort 2
019
REPORT ON OTHER LEGAL AND REGULATORY REQUIREMENTSFurther, as required by the UAE Federal Law No. (2) of 2015, we report that: • We have obtained all the information we considered necessary for the purposes of our audit; • The consolidated financial statements have been prepared and comply, in all material respects, with the applicable provisions
of the UAE Federal Law No. (2) of 2015; • The Company has maintained proper books of account; • The financial information included in the Board of Directors’ Report is consistent with the books of account and records
of the Group; • Note 3.2 reflects the disclosures relating to shares purchased or invested by the Group during the financial year ended
31 December 2019; • Note 35 reflects the disclosures relating to related party transactions and the terms under which they were conducted; • Note 40 reflects the disclosures relating to social contributions made during the year; and • Based on the information that has been made available to us nothing has come to our attention which causes us to believe that
the Company has contravened during the financial year ended 31 December 2019 any of the applicable provisions of the UAE Federal Law No. (2) of 2015 or, its Memorandum and Articles of Association which would materially affect its activities or its financial position as at 31 December 2019.
Deloitte & Touche (M.E.)
Georges F. Najem Registration No. 809
12 February 2020Abu DhabiUnited Arab Emirates

124
Fina
ncia
l Sta
tem
ents
Notes2019
AED ‘0002018
AED ‘000
ASSETSNon-current assetsProperty, plant and equipment 6 3,504,590 3,600,971Intangible assets and goodwill 7 192,223 198,117Investment properties 8 16,782,476 16,408,303Investment in associates and joint ventures 9 198,979 993,531Financial assets at fair value through other comprehensive income (“FVTOCI”) 10 55,202 96,116Derivative financial instruments 22 – 14,024Trade and other receivables 11 238,926 399,002
Total non-current assets 20,972,396 21,710,064
Current assetsLand held for sale 12 4,796,967 3,806,071Development work in progress 13 2,546,972 2,473,374Inventories 14 1,052,786 469,144Trade and other receivables 11 6,211,360 5,070,445Cash and bank balances 15 5,686,242 5,014,607
Total current assets 20,294,327 16,833,641
Total assets 41,266,723 38,543,705
EQUITY AND LIABILITIESEquityShare capital 16 7,862,630 7,862,630Statutory reserve 17 3,931,315 3,931,315Cash flow hedging reserve 17 (33,482) 70,547Investment revaluation reserve 17 19,439 34,729Retained earnings 13,057,604 12,163,947
Equity attributable to owners of the Company 24,837,506 24,063,168Non-controlling interests 113,744 172,662
Total equity 24,951,250 24,235,830
Non-current liabilitiesNon-convertible sukuk 18 3,628,113 1,810,140Bank borrowings 19 4,407,417 4,865,481Retentions payable 260,210 304,702Lease liabilities 20 431,559 430,703Employees benefits 21 167,464 150,710Derivative financial instruments 22 10,760 5,802
Total non-current liabilities 8,905,523 7,567,538
Current liabilitiesNon-convertible sukuk 18 36,377 21,811Bank borrowings 19 75,226 358,512Retentions payable 604,694 409,493Lease liabilities 20 80,781 99,195Advances from customers 487,658 362,276Trade and other payables 23 6,125,214 5,489,050
Total current liabilities 7,409,950 6,740,337
Total liabilities 16,315,473 14,307,875
Total equity and liabilities 41,266,723 38,543,705
Mohamed Al Mubarak Talal Al Dhiyebi Greg FewerChairman Chief Executive Officer Chief Financial Officer
The accompanying notes form an integral part of these consolidated financial statements.
Consolidated Statement of Financial Position
At 31 December 2019

125
Ald
ar A
nnua
l Rep
ort 2
019
Notes2019
AED ‘0002018
AED ‘000
Revenue 24 7,147,881 6,286,533Direct costs 25 (4,378,237) (3,654,846)
Gross profit 2,769,644 2,631,687Selling and marketing expenses 26 (109,522) (85,440)General and administrative expenses
Staff costs 27 (237,423) (218,948)Depreciation and amortisation 6,7 (268,550) (230,142)Provisions, impairments and write-downs, net 28 (152,675) (50,048)Others (126,407) (139,235)
Share of (loss)/profit from associates and joint ventures 9 (3,096) 49,863Gain on disposal of joint venture 9 – 30,319Gain on disposal of property, plant and equipment 6 22,964 –Fair value loss on investment properties, net 8 (374,751) (671,046)Gain on disposal of investment properties 8 23,856 –Gain on exchange of properties, net of write-downs 32 388,384 –Finance income 29 84,087 79,735Finance costs 30 (349,719) (309,749)Other income 31 258,387 767,868
Profit for the year 1,925,179 1,854,864
Profit for the year attributable to:Owners of the Company 1,984,097 1,855,808Non-controlling interests (58,918) (944)
1,925,179 1,854,864
Basic and diluted earnings per share 33 0.252 0.236
The accompanying notes form an integral part of these consolidated financial statements.
Consolidated Income Statement
For the year ended 31 December 2019

126
Fina
ncia
l Sta
tem
ents
2019AED ‘000
2018AED ‘000
Profit for the year 1,925,179 1,854,864
Other comprehensive income:Item that will not be reclassified subsequently to profit or loss:Fair value loss on investments in equity instruments designated as at FVTOCI (note 10) (4,962) (9,355)Items that may be reclassified subsequently to profit or loss:Fair value (loss)/gain arising on hedging instruments during the year classified under cash flow hedges, net of reclassification to profit or loss (note 22) (105,466) 82,951Share of other comprehensive income of joint venture (note 9) (280) 4,620Cumulative loss arising on hedging instruments of a joint venture reclassified to profit or loss upon
derecognition (note 9) 1,717 –
Other comprehensive (loss)/income for the year (108,991) 78,216
Total comprehensive income for the year 1,816,188 1,933,080
Total comprehensive income for the year attributable to:Owners of the Company 1,875,106 1,934,024Non-controlling interests (58,918) (944)
1,816,188 1,933,080
The accompanying notes form an integral part of these consolidated financial statements.
Consolidated Statement of Comprehensive Income
For the year ended 31 December 2019

127
Ald
ar A
nnua
l Rep
ort 2
019
Share capital
AED ‘000
Statutory reserve
AED ‘000
Cash flowhedgingreserve
AED ‘000
Investmentrevaluation
reserveAED ‘000
Retained earnings
AED ‘000
Equity attributable to owners of
the companyAED ‘000
Non-controlling
interestsAED ‘000
Total equityAED ‘000
Balance at 1 January 2018 7,862,630 3,931,315 (17,024) 44,084 11,200,549 23,021,554 213,611 23,235,165
Profit for the year – – – – 1,855,808 1,855,808 (944) 1,854,864Other comprehensive
income/(loss) – – 87,571 (9,355) – 78,216 – 78,216
Total comprehensive income/(loss) for the year – – 87,571 (9,355) 1,855,808 1,934,024 (944) 1,933,080
Dividends paid for the year 2017 – – – – (943,516) (943,516) – (943,516)
Acquisition of non-controlling interests (i) – – – – 51,106 51,106 (81,106) (30,000)
Non-controlling interests recognised on acquisition of a subsidiary (note 5) – – – – – – 41,101 41,101
Balance at 31 December 2018 7,862,630 3,931,315 70,547 34,729 12,163,947 24,063,168 172,662 24,235,830
Profit for the year – – – – 1,984,097 1,984,097 (58,918) 1,925,179Other comprehensive
loss – – (104,029) (4,962) – (108,991) – (108,991)
Total comprehensive (loss)/income for the year – – (104,029) (4,962) 1,984,097 1,875,106 (58,918) 1,816,188
Dividends paid for the year 2018 (note 34) – – – – (1,100,768) (1,100,768) – (1,100,768)
Transfer of investment revaluation reserve upon disposal of investments in equity instruments designated as at FVTOCI (note 10) – – – (10,328) 10,328 – – –
Balance at 31 December 2019 7,862,630 3,931,315 (33,482) 19,439 13,057,604 24,837,506 113,744 24,951,250
(i) This represent acquisition of remaining 40% shares in Khidmah LLC (a subsidiary) effective 25 September 2018 resulting in the Group holding 100% shares of the investee. The difference between consideration paid and carrying value of the non-controlling interests acquired amounting to AED 51,106 thousand is recognised directly in equity.
The accompanying notes form an integral part of these consolidated financial statements.
Consolidated Statement of Changes in Equity
For the year ended 31 December 2019

128
Fina
ncia
l Sta
tem
ents
Notes2019
AED ‘0002018
AED ‘000
Operating activities Profit for the year 1,925,179 1,854,864Adjustments for:
Depreciation and amortisation 6,7 278,009 242,807Finance income 29 (84,087) (79,735)Dividend income 10 (1,400) (5,415)Finance costs 349,719 287,520Fair value loss on investment properties, net 8 374,751 671,046Share of profit from associates and joint ventures 9 3,096 (49,863)(Release)/provision for onerous contracts 28 (6,842) 12,126Provisions/impairment (trade receivables and development work in progress) 77,581 59,325Reversal of accruals, net (36,357) (144,528)Bargain purchase gain on business combinations 31 – (132,791)Reversal of impairment on property, plant and equipment, net 28 (29,186) (22,507)Gain on disposal of property, plant and equipment 6 (22,964) –Gain on disposal of investment properties 8 (23,856) –Cumulative loss arising on hedging instruments of a joint venture reclassified to
profit or loss upon derecognition 10 1,717 –Gain on exchange of properties, net of write-downs 32 (388,384) –Provision for employees’ end of service benefits 21 39,154 36,687
Operating cash flows before movements in working capital 2,456,130 2,729,536Movement in working capital:Increase in trade and other receivables (1,002,762) (98,008)Increase in development work in progress(i) (878,199) (998,350)Increase in inventories and land held for sale(i) (196,966) (1,760,190)Increase in retentions payable 150,709 92,630Increase/(decrease) in advances from customers 125,382 (107,578)Increase in trade and other payables 694,613 71,247
Cash generated from/(used in) operations 1,348,907 (70,713)Employees’ end of service benefits paid 21 (29,539) (36,675)
Net cash generated from/(used in) operating activities (i) 1,319,368 (107,388)
(i) The net cash outflows for operating activities for the year ended 31 December 2018 include AED 2,050,000 thousand relating to the acquisition of land and projects under development as part of the acquisitions from Tourism Development & Investment Company (note 5).
(ii) Refer note 41 for details of non-cash transactions excluded from the consolidated statement of cash flows.
The accompanying notes form an integral part of these consolidated financial statements.
Consolidated Statement of Cash Flows
For the year ended 31 December 2019

129
Ald
ar A
nnua
l Rep
ort 2
019
Notes2019
AED ‘0002018
AED ‘000
Investing activitiesPurchases of property, plant and equipment 6 (127,518) (94,170)Purchases of intangible assets 7 (6,422) (4,064)Additions to investment properties 8 (113,278) (732,277)Acquisition of businesses, net of cash acquired 5.3 – (928,337)Acquisition of cash and cash equivalents 9 89,783 –Proceeds from disposal of investment properties 295,215 –Proceeds from disposal of property, plant and equipment 23,058 –Proceeds from disposal of financial assets at FVTOCI 10 30,799 –Acquisition of non-controlling interests in a subsidiary – (30,000)Movement in term deposits with original maturity of greater than three months 586,456 2,408,578Movement in restricted bank balances (362,337) (60,249)Capital call contributions made against investment in financial assets at FVTOCI 10 (2,452) (14,420)Capital distributions received against investment in financial assets at FVTOCI 10 7,605 28,338Finance income received 113,682 125,541Dividends received 9,10 31,100 34,775
Net cash from investing activities 565,691 733,715
Financing activitiesRepayments of lease liabilities 36.2 (42,011) (54,851)Partial settlement of interest rate swaps (77,121) 58,466Proceeds from bank borrowings and sukuk 2,329,149 8,171,250Repayments of bank borrowings and sukuk (1,742,500) (7,075,014)Directors’ remuneration paid 35 (16,075) (19,279)Finance costs paid (338,937) (283,830)Dividends paid (1,101,810) (945,618)
Net cash used in financing activities (989,305) (148,876)
Net increase in cash and cash equivalents 895,754 477,451Cash and cash equivalents at beginning of the year 1,394,358 916,907
Cash and cash equivalents at end of the year 15 2,290,112 1,394,358
The accompanying notes form an integral part of these consolidated financial statements.
130
Fina
ncia
l Sta
tem
ents
1 GENERAL INFORMATIONThe establishment of Aldar Properties pjsc (the “Company”) was approved by Decision No. (16) of 2004 of the Abu Dhabi Department of Planning and Economy dated 12 October 2004. The Company’s incorporation was declared by Ministerial Resolution No. (59) of 2005 issued by the UAE Minister of Economy dated 23 February 2005.
The Company is domiciled in the United Arab Emirates (UAE) and its registered office address is P.O. Box 51133, Abu Dhabi.
The Company’s ordinary shares are listed on the Abu Dhabi Securities Exchange.
As of 31 December 2019, Mubadala Investment Company through its wholly owned subsidiaries has an indirect 37.4% shares of the Company.
The Company and its subsidiaries (together referred to as the “Group”) are engaged in various businesses primarily the development, sales, investment, construction, leasing, management and associated services for real estate. In addition, the Group is also engaged in development, construction, management and operation of hotels, schools, marinas, cooling station operations, restaurants, beach club and golf courses.
2 ADOPTION OF NEW AND REVISED INTERNATIONAL FINANCIAL REPORTING STANDARDS (“IFRSs”)2.1 NEW AND AMENDED IFRSs THAT ARE EFFECTIVE FOR THE CURRENT YEARThe following new and revised IFRSs and interpretations, which became effective for annual periods beginning on or after 1 January 2019, have been adopted in these consolidated financial statements:
IFRIC 23 UNCERTAINTY OVER INCOME TAX TREATMENTSThe interpretation addresses the determination of taxable profit (tax loss), tax bases, unused tax losses, unused tax credits and tax rates, when there is uncertainty over income tax treatments under IAS 12. It specifically considers: • Whether tax treatments should be considered collectively; • Assumptions for taxation authorities' examinations; • The determination of taxable profit (tax loss), tax bases, unused tax losses, unused tax credits and tax rates; and • The effect of changes in facts and circumstances.
This Interpretation does not have any impact on the Group’s consolidated financial statements.
AMENDMENTS IN IFRS 9 FINANCIAL INSTRUMENTS RELATING TO PREPAYMENT FEATURES WITH NEGATIVE COMPENSATIONAmends the existing requirements in IFRS 9 regarding termination rights in order to allow measurement at amortised cost (or, depending on the business model, at fair value through other comprehensive income) even in the case of negative compensation payments. This amendment does not have any impact on the Group’s consolidated financial statements.
AMENDMENT TO IAS 19 EMPLOYEE BENEFITS RELATING TO AMENDMENT, CURTAILMENT OR SETTLEMENT OF A DEFINED BENEFIT PLAN
The amendments in Plan Amendment, Curtailment or Settlement (Amendments to IAS 19) are: • If a plan amendment, curtailment or settlement occurs, it is now mandatory that the current service cost and the net interest
for the period after the remeasurement are determined using the assumptions used for the remeasurement; and • In addition, amendments have been included to clarify the effect of a plan amendment, curtailment or settlement on the
requirements regarding the asset ceiling.
This amendment does not have any impact on the Group’s consolidated financial statements.
AMENDMENTS IN IAS 28 INVESTMENTS IN ASSOCIATES AND JOINT VENTURES RELATING TO LONG-TERM INTERESTS IN ASSOCIATES AND JOINT VENTURESThe amendment clarifies that an entity applies IFRS 9 Financial Instruments to long-term interests in an associate or joint venture that form part of the net investment in the associate or joint venture but to which the equity method is not applied. This amendment does not have any impact on the Group’s consolidated financial statements.
Notes to the Consolidated Financial Statements
For the year ended 31 December 2019
131
Ald
ar A
nnua
l Rep
ort 2
019
ANNUAL IMPROVEMENTS TO IFRSs 2015–2017 CYCLE • IFRS 3 and IFRS 11 – The amendments to IFRS 3 clarify that when an entity obtains control of a business that is a joint operation,
it remeasures previously held interests in that business. The amendments to IFRS 11 clarify that when an entity obtains joint control of a business that is a joint operation, the entity does not remeasure previously held interests in that business.
• IAS 12 – The amendments clarify that the requirements in paragraph 52B (to recognise the income tax consequences of dividends where the transactions or events that generated distributable profits are recognised) apply to all income tax consequences of dividends by moving the paragraph away from paragraph 52A that only deals with situations where there are different tax rates for distributed and undistributed profits.
• IAS 23 – The amendments clarify that if any specific borrowing remains outstanding after the related asset is ready for its intended use or sale, that borrowing becomes part of the funds that an entity borrows generally when calculating the capitalisation rate on general borrowings.
The application of these amendments did not have a material impact on the consolidated financial statements of the Group.
2.2 NEW AND AMENDED IFRSs IN ISSUE BUT NOT YET EFFECTIVE AND NOT EARLY ADOPTED At the date of authorisation of these consolidated financial statements, the Group has not applied the following new and revised IFRSs that have been issued but are not yet effective:
New and revised IFRSs
Effective for annual periods
beginning on or after
Amendments to References to the Conceptual Framework in IFRS Standards – amendments to IFRS 2, IFRS 3, IFRS 6, IFRS 14, IAS 1, IAS 8, IAS 34, IAS 37, IAS 38, IFRIC 12, IFRIC 19, IFRIC 20, IFRIC 22, and SIC-32 to update those pronouncements with regard to references to and quotes from the framework or to indicate where they refer to a different version of the Conceptual Framework
1 January 2020
Amendment to IFRS 3 Business Combinations relating to definition of a business
The amendments in Definition of a Business (Amendments to IFRS 3) are changes to Appendix A Defined terms, the application guidance, and the illustrative examples of IFRS 3 only.
Business combinations for which the acquisition date
is on or after the beginning of the first annual reporting
period beginning on or after 1 January 2020
Amendments to IAS 1 and IAS 8 relating to Definition of Material
The amendments in Definition of Material (Amendments to IAS 1 and IAS 8) clarify the definition of ‘material’ and align the definition used in the Conceptual Framework and the standards.
1 January 2020
Interest Rate Benchmark Reform (Amendments to IFRS 9, IAS 39 and IFRS 7)
The amendments in Interest Rate Benchmark Reform (Amendments to IFRS 9, IAS 39 and IFRS 7) clarify that entities would continue to apply certain hedge accounting requirements assuming that the interest rate benchmark on which the hedged cash flows and cash flows from the hedging instrument are based will not be altered as a result of interest rate benchmark reform.
1 January 2020
IFRS 17 Insurance Contracts 1 January 2021
Classification of Liabilities as Current or Non-Current (Amendments to IAS 1) 1 January 2022
Amendments to IFRS 10 Consolidated Financial Statements and IAS 28 Investments in Associates and Joint Ventures (2011) relating to the treatment of the sale or contribution of assets from and investor to its associate or joint venture.
Effective date deferred indefinitely. Adoption is still
permitted.
Except the amendments to Interest rate Benchmark Reform, management do not expect that the adoption of the above amendments in the future will have a material impact on the Group’s consolidated financial statements. Management is in the process of determining the impact of these amendments on the Group’s consolidated financial statements.
132
Fina
ncia
l Sta
tem
ents
3 SUMMARY OF SIGNIFICANT ACCOUNTING POLICIES3.1 STATEMENT OF COMPLIANCE AND BASIS OF PREPARATIONThese consolidated financial statements have been prepared in accordance with International Financial Reporting Standards (“IFRS”s) and applicable provisions of the U.A.E. Federal Law No. (2) of 2015. These consolidated financial statements have been prepared on the historical cost basis except for the revaluation of investment properties, revaluation of the financial assets at fair value through other comprehensive income and measurement of derivative financial instruments at fair values at the end of each reporting period, as explained in the accounting polices given below. Historical cost is generally based on the fair value of the consideration given in exchange for goods and services.
Fair value is the price that would be received on sale of an asset or paid on transfer of a liability in an orderly transaction between market participants at the measurement date, regardless of whether that price is directly observable or estimated using another valuation technique. In estimating the fair value of a financial asset or liability, the Group takes into account the characteristics of the asset or liability if market participants would take those characteristics into account when pricing the asset or liability at the measurement date.
In addition, for financial reporting purposes, fair value measurements are categorised into level 1, 2 or 3 based on the degree to which the inputs to the fair value measurements are observable and the significance of the inputs to the fair value measurement in its entirety, which is described as follows: • Level 1 input are quoted price (unadjusted) in active markets for identical assets or liabilities that the entity can access at the
measurement date; • Level 2 inputs are inputs, other than quoted prices included within level 1, that are observable for the asset or liability, either
directly or indirectly; and • Level 3 inputs are unobservable inputs for the asset or liability.
These consolidated financial statements are presented in UAE Dirhams (AED) which is the functional and presentation currency of the Group and all values are rounded to the nearest thousand except when otherwise indicated.
3.2 BASIS OF CONSOLIDATIONThe consolidated financial statements incorporate the financial statements of the Company and entities controlled by the Company and its subsidiaries. Control is achieved when the Company: • has power over the investee; • is exposed, or has rights, to variable returns from its involvement with the investee; and • has the ability to use its power to affect its returns.
The Company reassesses whether or not it controls an investee if facts and circumstances indicate that there are changes to one or more of the three elements of control listed above.
When the Company has less than a majority of the voting rights of an investee, it has power over the investee when the voting rights are sufficient to give it the practical ability to direct the relevant activities of the investee unilaterally.
The Company considers all relevant facts and circumstances in assessing whether or not the Company's voting rights in an investee are sufficient to give it power, including: • the size of the Company's holding of voting rights relative to the size and dispersion of holdings of the other vote holders; • potential voting rights held by the Company, other vote holders or other parties; • rights arising from other contractual arrangements; and • any additional facts and circumstances that indicate that the Company has, or does not have, the current ability to direct the
relevant activities at the time that decisions need to be made, including voting patterns at previous shareholders’ meetings.
Consolidation of a subsidiary begins when the Company obtains control over the subsidiary and ceases when the Company loses control of the subsidiary. Specifically, income and expenses of a subsidiary acquired or disposed of during the year are included in the consolidated income statement and consolidated statement of other comprehensive income from the date when the Company gains control until the date when the Company ceases to control the subsidiary.
Profit or loss and each component of other comprehensive income (OCI) are attributed to the owners of the Company and to the non-controlling interests even if this results in the non-controlling interest having deficit balance. Where necessary, adjustments are made to the financial statements of subsidiaries to bring their accounting policies into line with the Group accounting policies. All intragroup assets and liabilities, equity, income, expenses and cash flows relating to transactions between members of the Group are eliminated in full on consolidation.
Notes to the Consolidated Financial Statements (continued)
For the year ended 31 December 2019

133
Ald
ar A
nnua
l Rep
ort 2
019
Non-controlling interests in subsidiaries are identified separately form the Group’s equity therein. Those interest of non-controlling shareholders that are present ownership interests entitling their holders to a proportionate share of net assets upon liquidation may initially be measured at fair value or at the non-controlling interests’ proportionate share of the fair value of the acquiree’s identifiable net assets. The choice of measurement is made on an acquisition-by-acquisition basis. Other non-controlling interests are initially measured at fair value. Subsequent to acquisition, the carrying amount of non-controlling interests is the amount of those interests at initial recognition plus the non-controlling interests’ share of subsequent changes in equity.
Changes in the Group’s interests in subsidiaries that do not result in a loss of control are accounted for as equity transactions. The carrying amount of the Group’s interests and the non-controlling interests are adjusted to reflect the changes in their relative interests in the subsidiaries. Any difference between the amount by which the non-controlling interest are adjusted and the fair value of the consideration paid or received is recognised directly in equity and attributed to the owners of the Company.
When the Group losses control of a subsidiary, the gain or losses on disposal recognised in profit or loss is calculated as the difference between (i) the aggregate of the fair value of the consideration received and the fair value of any retained interest and (ii) the previous carrying amount of the assets (including goodwill), less liabilities of the subsidiary and any non-controlling interests. All amounts previously recognised in other comprehensive income in relation to that subsidiary are accounted for as if the Group had directly disposed of the related assets or liabilities of the subsidiary (i.e. reclassified to profit or loss or transferred to another category of equity as required/permitted by applicable IFRS). The fair value of any investment retained in the former subsidiary at the date when control is lost is regarded as the fair value on initial recognition for subsequent accounting under IFRS 9 when applicable, or the cost on initial recognition of an investment in an associate or joint venture.
Details of the Company significant subsidiaries are given below:
Name of subsidiary
Ownership interest Country ofincorporation Principal activity2019 2018
Al Raha Gardens Property LLC 100% 100% UAE Development, sale and management of properties
Al Jimi Mall LLC 100% 100% UAE Development and management of investment property
Aldar Real Estate Services LLC 100% 100% UAE Property development
Al Raha Infrastructure Company LLC 100% 100% UAE Development, sale and management of properties
Aldar Education – Sole Proprietorship LLC(i) 100% – UAE Investment in, and management of entities providing educational services
Aldar Academies LLC 100% 100% UAE Investment in, and management of entities providing educational services
Aldar Commercial Property Developments LLC
100% 100% UAE Ownership, management and development of buildings
Aldar Hotels and Hospitality LLC 100% 100% UAE Investment in, and management of, entities providing hotels and hospitality services
Aldar Marinas LLC 100% 100% UAE Managing and operating marinas, sports clubs and marine machinery
Abu Dhabi World Trade Centre LLC 100% 100% UAE Development and management of, and investment in, properties and related activities
Provis Real Estate Management – Sole Proprietorship LLC(i)
100% – UAE Management and leasing of real estate
134
Fina
ncia
l Sta
tem
ents
3 SUMMARY OF SIGNIFICANT ACCOUNTING POLICIES (CONTINUED)3.2 BASIS OF CONSOLIDATION (CONTINUED)Details of the Company significant subsidiaries are given below:
Name of subsidiary
Ownership interest Country ofincorporation Principal activity2019 2018
Yas Hotel LLC 100% 100% UAE Ownership, development and management of hotels
Yas Links LLC 100% 100% UAE Ownership and management of golf courses and golf clubs
Tilal Liwa Real Estate Investment LLC 100% 100% UAE Property, rental and management
Al Seih Real Estate Management LLC 91.4% 91.4% UAE Management and leasing of real estate; real estate projects investment
Seih Sdeirah Real Estate LLC 91.4% 91.4% UAE Property rental and management; real estate projects investment
Pivot Engineering & General Contracting Co. (WLL)
65.2% 65.2% UAE Engineering and general construction works
Aldar Investment Properties LLC 100% 100% UAE Investment, management and associated services for real estate assets and the operation of hotels
Aldar Investment Holding Restricted Limited 100% 100% UAE Special purpose vehicle, proprietary asset management company
Khidmah – Sole Proprietorship LLC 100% 100% UAE Management and leasing of real estate
TDIC Food & Beverage – Sole Proprietorship LLC
100% 100% UAE Restaurant management
TDIC Education – Sole Proprietorship LLC 100% 100% UAE Educational activities
Saadiyat Cooling LLC 85% 85% UAE Cooling station operations
Saadiyat District Cooling LLC 100% 100% UAE Cooling station operations
Saadiyat Grove – Sole Proprietorship LLC(i) 100% – UAE Real estate
Saadiyat Accommodation Village LLC 100% 100% UAE Accommodation village
Aldar Sukuk Ltd. 100% 100% Cayman Islands
Funding company
Aldar Sukuk (No. 2) Ltd.(i) 100% – Cayman Islands
Funding company
Cloud Spaces – Sole Proprietorship LLC(i) 100% – UAE Real estate lease and management services
Provis Real Estate Brokers LLC(i) 100% – UAE Real estate brokerage
(i) These entities were incorporated by the Group during the year.
3.3 BUSINESS COMBINATIONS AND GOODWILLAcquisition of business are accounted for using the acquisition method. The cost of an acquisition is measured as the aggregate of the consideration transferred, which is measured at acquisition date fair value, and the amount of any non-controlling interests in the acquiree. For each business combination, the Group elects whether to measure the non-controlling interests in the acquiree at fair value or at the proportionate share of the acquiree’s identifiable net assets. Acquisition-related costs are expensed as incurred and included in administrative expenses.
When the Group acquires a business, it assesses the financial assets and liabilities assumed for appropriate classification and designation in accordance with the contractual terms, economic circumstances and pertinent conditions as at the acquisition date. This includes the separation of embedded derivatives in host contracts by the acquiree.
Any contingent consideration to be transferred by the acquirer will be recognised at fair value at the acquisition date. Contingent consideration classified as equity is not remeasured and its subsequent settlement is accounted for within equity. Contingent consideration classified as an asset or liability that is a financial instrument and within the scope of IFRS 9 Financial Instruments, is measured at fair value with the changes in fair value recognised in the consolidated income statement in accordance with IFRS 9.
For the year ended 31 December 2019
Notes to the Consolidated Financial Statements (continued)

135
Ald
ar A
nnua
l Rep
ort 2
019
Other contingent consideration that is not within the scope of IFRS 9 is measured at fair value at each reporting date with changes in fair value recognised in profit or loss.
Goodwill is initially measured at cost (being the excess of the aggregate of the consideration transferred and the amount recognised for non-controlling interests and any previous interest held over the net identifiable assets acquired and liabilities assumed). If the fair value of the net assets acquired is in excess of the aggregate consideration transferred, the Group re-assesses whether it has correctly identified all of the assets acquired and all of the liabilities assumed and reviews the procedures used to measure the amounts to be recognised at the acquisition date. If the reassessment still results in an excess of the fair value of net assets acquired over the aggregate consideration transferred, then the gain is recognised in profit or loss.
Goodwill is not amortised but is reviewed for impairment at least annually. After initial recognition, goodwill is measured at cost less any accumulated impairment losses. For the purpose of impairment testing, goodwill acquired in a business combination is, from the acquisition date, allocated to each of the Group’s cash-generating units that are expected to benefit from the combination, irrespective of whether other assets or liabilities of the acquiree are assigned to those units. On disposal of a cash generating unit, the attributable amount of goodwill is included in the determination of profit or loss on disposal.
When a business combination is achieved in stages, the Group's previously held equity interest in the acquiree is remeasured to fair value at the acquisition date (i.e. the date when the Group obtains control) and the resulting gain or loss, if any, is recognised in income statement. Amounts arising from interests in the acquiree prior to the acquisition date that have previously been recognised in other comprehensive income are reclassified to income statement where such treatment would be appropriate if that interest were disposed of.
If the initial accounting for a business combination is incomplete by the end of the reporting period in which the combination occurs, the Group reports provisional amounts for the items for which the accounting is incomplete. Those provisional amounts are adjusted during the measurement period, or additional assets or liabilities are recognised, to reflect new information obtained about facts and circumstances that existed at the acquisition date that, if known, would have affected the amounts recognised as of that date.
The measurement period ends as soon as the Group receives the necessary information about the facts and circumstances that existed as of the acquisition date or learns that the information is not obtainable. However, the measurement period cannot exceed one year from the acquisition date.
3.4 INVESTMENT IN ASSOCIATES AND JOINT VENTURESAn associate is an entity over which the Group has significant influence that is neither a subsidiary nor an interest in a joint venture. Significant influence is the power to participate in the financial and operating policy decisions of the investee but is not control or joint control over those policies.
A joint venture is a type of joint arrangement whereby the parties that have joint control of the arrangement have rights to the net assets of the joint arrangement. Joint control is the contractually agreed sharing of control of an arrangement, which exists only when decisions about the relevant activities require unanimous consent of the parties sharing control. The considerations made in determining significant influence or joint control are similar to those necessary to determine control over subsidiaries.
The Group’s investments in its associate and joint venture are accounted for using the equity method, except when the investment is classified as held for sale, in which case it is accounted for under IFRS 5 Non-current Assets Held for Sale and Discontinued Operations. Under the equity method, the investment in an associate or a joint venture is initially recognised at cost. The carrying amount of the investment is adjusted to recognise changes in the Group's share of net assets of the joint venture since the acquisition date. Goodwill relating to the associate or the joint venture is included in the carrying amount of the investment and is not tested for impairment individually.
The consolidated income statement reflects the Group’s share of the results of operations of associates and joint ventures. Any change in other comprehensive income of those investees is presented as part of the Group’s other comprehensive income. In addition, when there has been a change recognised directly in the equity of the associates or joint ventures, the Group recognises its share of any changes, when applicable, in the consolidated statement of changes in equity. Unrealised gains and losses resulting from transactions between the Group and the investees are eliminated to the extent of the interest in the investees.
The aggregate of the Group’s share of profit or loss of an associate and a joint venture is shown on the face of the consolidated income statement outside operating profit and represents profit or loss and non-controlling interests in the subsidiaries of the associate or joint venture.
Losses of an associate or joint venture in excess of the Group’s interest in that associate or joint venture (which includes any long term interests that, in substance, form part of the Group’s net investment in associate or joint venture) are recognised only to the extent that the Group has incurred legal or constructive obligations or made payments on behalf of the associate or joint venture.

136
Fina
ncia
l Sta
tem
ents
3 SUMMARY OF SIGNIFICANT ACCOUNTING POLICIES (CONTINUED)3.4 INVESTMENT IN ASSOCIATES AND JOINT VENTURES (CONTINUED)The financial statements of the associate or joint venture are prepared for the same reporting period as the Group. When necessary, adjustments are made to bring the accounting policies in line with those of the Group.
After application of the equity method, the Group determines whether it is necessary to recognise an impairment loss on its investment in its associate or joint venture. At each reporting date, the Group determines whether there is objective evidence that the investment in the associate or joint venture is impaired. If there is such evidence, the Group calculates the amount of impairment as the difference between the recoverable amount of the associate or joint venture and its carrying value, and then recognises the loss within ‘Share of profit of an associate and a joint venture’ in the consolidated income statement.
Upon loss of significant influence over the associate or joint control over the joint venture, the Group measures and recognises any retained investment at its fair value. Any difference between the carrying amount of the associate or joint venture upon loss of significant influence or joint control and the fair value of the retained investment and proceeds from disposal is recognised in the consolidated income statement.
When a Group entity transacts with an associate or a joint venture of the Group, profit and loss (unrealised gain/(loss)) arising from the transaction with the associate or joint venture are recognised in the Group’s consolidated financial statements only to the extent of interest in the associate or join venture that are not retained by the Group.
3.5 INTEREST IN JOINT OPERATIONSA joint operation is a joint arrangement whereby the parties that have joint control of the arrangement have rights to the assets, and obligations for the liabilities, relating to the arrangement. Joint control is the contractually agreed sharing of control of an arrangement, which exists only when decisions about the relevant activities require unanimous consent of the parties sharing control.
When a group entity undertakes its activities under joint operations, the Group as a joint operator recognises in relation to its interest in a joint operation: • its assets, including its share of any assets held jointly; • its liabilities, including its share of any liabilities incurred jointly; • its revenue from the sale of its share of the output arising from the joint operation; • its share of the revenue from the sale of the output by the joint operation; and • its expenses, including its share of any expenses incurred jointly.
The Group accounts for the assets, liabilities, revenues and expenses relating to its interest in a joint operation in accordance with IFRSs applicable to the particular assets, liabilities, revenues and expenses.
When a group entity transacts with a joint operation in which a group entity is a joint operator (such as a sale or contribution of assets), the Group is considered conducting the transaction with other parties to the joint operation and profits and losses resulting from the transactions are recognised in the Group’s consolidated financial statements only to the extent of other parties' interests in the joint operation. When a group entity transacts with a joint operation in which a group entity is a joint operator (such as a purchase of assets), the Group does not recognise its share of the gains and losses until it resells those assets to a third party.
3.6 CURRENT VERSUS NON-CURRENT CLASSIFICATIONThe Group presents assets and liabilities in the statement of financial position based on current/non-current classification. An asset is current when it is: • Expected to be realised or intended to be sold or consumed in the normal operating cycle; • Held primarily for the purpose of trading; • Expected to be realised within twelve months after the reporting period; or • Cash or cash equivalent unless restricted from being exchanged or used to settle a liability for at least twelve months after the
reporting period
All other assets are classified as non-current.
A liability is current when: • It is expected to be settled in the normal operating cycle; • It is held primarily for the purpose of trading; • It is due to be settled within twelve months after the reporting period; or • There is no unconditional right to defer the settlement of the liability for at least twelve months after the reporting period
The Group classifies all other liabilities as non-current.
For the year ended 31 December 2019
Notes to the Consolidated Financial Statements (continued)

137
Ald
ar A
nnua
l Rep
ort 2
019
3.7 REVENUE RECOGNITIONFor contracts determined to be within the scope of revenue recognition, the Group is required to apply a five-step model to determine when to recognise revenue, and at what amount. Revenue is measured based on the consideration to which the Group expects to be entitled in a contract with a customer and excludes amounts collected on behalf of third parties. The Group recognises revenue when it transfers control of a product or service to a customer.
The Group recognises revenue from the following major sources: • Sale of properties, construction contracts and provision of services • Service charges and expenses recoverable from tenant • Hospitality revenue • Income from leisure businesses • Revenue from cooling assets • Fee income from school • Management fee
REVENUE FROM CONTRACTS WITH CUSTOMERS FOR SALE OF PROPERTIES, CONSTRUCTION CONTRACTS AND PROVISION OF SERVICESThe Group recognises revenue from contracts with customers based on a five-step model as set out in IFRS 15:
Step 1 Identify contract(s) with a customer: A contract is defined as an agreement between two or more parties that creates enforceable rights and obligations and sets out the criteria for every contract that must be met.
Step 2 Identify performance obligations in the contract: A performance obligation is a promise in a contract with a customer to transfer a good or service to the customer.
Step 3 Determine the transaction price: The transaction price is the amount of consideration to which the Group expects to be entitled in exchange for transferring promised goods or services to a customer, excluding amounts collected on behalf of third parties.
Step 4 Allocate the transaction price to the performance obligations in the contract: For a contract that has more than one performance obligation, the Group allocates the transaction price to each performance obligation in an amount that depicts the amount of consideration to which the Group expects to be entitled in exchange for satisfying each performance obligation.
Step 5 Recognise revenue when (or as) the Group satisfies a performance obligation.
The Group satisfies a performance obligation and recognises revenue over time, if one of the following criteria is met: • The Group’s performance does not create an asset with an alternate use to the Group and the Group has as an enforceable right
to payment for performance completed to date. • The Group’s performance creates or enhances an asset that the customer controls as the asset is created or enhanced. • The customer simultaneously receives and consumes the benefits provided by the Group’s performance as the Group performs.
For performance obligations where one of the above conditions are not met, revenue is recognised at the point in time at which the performance obligation is satisfied.
When the Group satisfies a performance obligation by delivering the promised goods or services it creates a contract-based asset on the amount of consideration earned by the performance. Where the amount of consideration received from a customer exceeds the amount of revenue recognised this gives rise to a contract liability. Revenue is measured at the fair value of the consideration received or receivable, taking into account contractually defined terms of payment and excluding taxes and duty. The Group assesses its revenue arrangements against specific criteria to determine if it is acting as principal or agent. Revenue is recognised to the extent it is probable that the economic benefits will flow to the Group and the revenue and costs, if applicable, can be measured reliably.
SERVICE CHARGES AND EXPENSES RECOVERABLE FROM TENANTIncome arising from cost recharged to tenants is recognised in the period in which the cost can be contractually recovered. Service charges and other such receipts are included gross of the related costs in revenue as the Group acts as principal in this respect.
HOSPITALITY REVENUEHotel revenue corresponds to all the revenues received from guests of the hotels. The services rendered (including room rentals, food and beverage sales and other ancillary services) are distinct performance obligations, for which prices invoiced to the guests are representative of their stand-alone selling prices. These obligations are fulfilled over time when they relate to room rentals, that is over the stay within the hotel, and at a point in time for other goods or services, when they have been delivered or rendered.

138
Fina
ncia
l Sta
tem
ents
3 SUMMARY OF SIGNIFICANT ACCOUNTING POLICIES (CONTINUED)3.7 REVENUE RECOGNITION (CONTINUED)INCOME FROM LEISURE BUSINESSESIncome from leisure businesses comprises revenue from goods sold and services provided at golf courses, beach clubs and marinas, and is recognised at the point when the goods are sold or services are rendered.
INCOME FROM SCHOOLSRegistration fee is recognised as income when it is received. Tuition fee income is recognised over the period of tuition. Tuition fees received in advance are recorded as deferred income.
REVENUE FROM COOLING ASSETSRevenue is recognised for supply of chilled water based on the agreements. The revenue in respect of the contracted capacity is recognised at the fixed rate, whereas the revenue in respect of the consumption of chilled water is recognised as these are consumed by the customer at agreed rates. In addition, customers are charged a one-time connection fee.
3.8 LEASESThe Group had early adopted IFRS 16 “Leases” with effect from 1 January 2016.
THE GROUP AS LESSEEThe Group assesses whether a contract is or contains a lease, at inception of the contract. The Group recognises a right-of-use asset and a corresponding lease liability with respect to all lease arrangements in which it is the lessee, except for short-term leases (defined as leases with a lease term of 12 months or less) and leases of low value assets (such as tablets and personal computers, small items of office furniture and telephones). For these leases, the Group recognises the lease payments as an operating expense on a straight-line basis over the term of the lease unless another systematic basis is more representative of the time pattern in which economic benefits from the leased assets are consumed.
The lease liability is initially measured at the present value of the lease payments that are not paid at the commencement date, discounted by using the rate implicit in the lease. If this rate cannot be readily determined, the Group uses its incremental borrowing rate.
Lease payments included in the measurement of the lease liability comprise: • Fixed lease payments (including in-substance fixed payments), less any lease incentives receivable; • Variable lease payments that depend on an index or rate, initially measured using the index or rate at the commencement date; • The amount expected to be payable by the lessee under residual value guarantees; • The exercise price of purchase options, if the lessee is reasonably certain to exercise the options; and • Payments of penalties for terminating the lease, if the lease term reflects the exercise of an option to terminate the lease.
The lease liability is presented as a separate line in the consolidated statement of financial position.
The lease liability is subsequently measured by increasing the carrying amount to reflect interest on the lease liability (using the effective interest method) and by reducing the carrying amount to reflect the lease payments made.
The Group remeasures the lease liability (and makes a corresponding adjustment to the related right-of-use asset) whenever: • The lease term has changed or there is a significant event or change in circumstances resulting in a change in the assessment
of exercise of a purchase option, in which case the lease liability is remeasured by discounting the revised lease payments using a revised discount rate.
• The lease payments change due to changes in an index or rate or a change in expected payment under a guaranteed residual value, in which cases the lease liability is remeasured by discounting the revised lease payments using an unchanged discount rate (unless the lease payments change is due to a change in a floating interest rate, in which case a revised discount rate is used).
• A lease contract is modified and the lease modification is not accounted for as a separate lease, in which case the lease liability is remeasured based on the lease term of the modified lease by discounting the revised lease payments using a revised discount rate at the effective date of the modification.
The right-of-use assets comprise the initial measurement of the corresponding lease liability, lease payments made at or before the commencement day, less any lease incentives received and any initial direct costs. They are subsequently measured at cost less accumulated depreciation and impairment losses.
For the year ended 31 December 2019
Notes to the Consolidated Financial Statements (continued)

139
Ald
ar A
nnua
l Rep
ort 2
019
Whenever the Group incurs an obligation for costs to dismantle and remove a leased asset, restore the site on which it is located or restore the underlying asset to the condition required by the terms and conditions of the lease, a provision is recognised and measured under IAS 37. To the extent that the costs relate to a right-of-use asset, the costs are included in the related right-of-use asset, unless those costs are incurred to produce inventories.
After initial recognition, the Group applies fair value model to right-of-use assets that meet the definition of investment property. For assets that meet the definition of property, plant and equipment, right of use asset is carried at cost net of depreciation and impairment and is amortised over the term of the lease. Right-of-use assets are depreciated over the shorter period of lease term and useful life of the underlying asset. If a lease transfers ownership of the underlying asset or the cost of the right-of-use asset reflects that the Group expects to exercise a purchase option, the related right-of-use asset is depreciated over the useful life of the underlying asset. The depreciation starts at the commencement date of the lease.
The right-of-use assets are presented along with the underlying asset in the consolidated statement of financial position. The Group applies IAS 36 to determine whether a right-of-use asset associated with property, plant and equipment is impaired and accounts for any identified impairment loss as described in the ‘Property, Plant and Equipment’ policy.
Variable rents that do not depend on an index or rate are not included in the measurement the lease liabilityand the right-of-use asset. The related payments are recognised as an expense in the period in which the event or condition that triggers those payments occurs and are included in the line “Other expenses” in profit or loss.
For a contract that contains a lease component and one or more additional lease or non-lease components, the Group allocates the consideration in the contract to each lease component on the basis of the relative stand-alone price of the lease component and the aggregate stand-alone price of the non-lease components.
The relative stand-alone price of lease and non-lease components is determined on the basis of the price the lessor, or a similar supplier, would charge an entity for that component, or a similar component, separately. If an observable stand-alone price is not readily available, the Group estimates the stand-alone price, maximising the use of observable information.
The non-lease components are accounted for in accordance with the Group’s policies. For determination of the lease term, the Group reassesses whether it is reasonably certain to exercise an extension option, or not to exercise a termination option, upon the occurrence of either a significant event or a significant change in circumstances that: • is within the control of the Group; and • affects whether the Group is reasonably certain to exercise an option not previously included in its determination of the lease
term, or not to exercise an option previously included in its determination of the lease term.
At the commencement date, the Group recognises a right-of-use asset and a corresponding lease liability under the lease contract with respect to all leases arrangements in which it is the lessor, except for leases (defined as leased with a lease term of 12 months or less) and leases of low values. For these leases, the Group recognise the lease payments as an operating expense on a straight line basis over the terms of the lease unless another systematic basis is more representative of the time pattern in which economic benefits from the leased assets are consumed.
THE GROUP AS LESSORThe Group enters into lease arrangements as a lessor with respect to some of its investment properties. Leases for which the Group is a lessor are classified as finance or operating leases. Whenever the terms of the lease transfers substantially all the risks and rewards of ownership to the lessee, the contract is classified as finance lease. All other leases are classified as operating leases.
When the Group is an intermediate lessor, it accounts for the head lease and the sub-lease as two separate contracts. The sub-lease is classified as finance or operating lease by reference to the right-of-use asset arising from the head lease.
Rental income from operating leases is recognised on a straight-line basis over the term of the relevant lease. Initial direct costs incurred in negotiating and arranging an operating lease are added to the carrying amount of the leased asset and recognised on a straight-line basis over the lease term.
Amounts from leases under finance lease are recognised as receivables at the amount of the Group’s net investment in the leases. Finance lease income is allocated to accounting periods so as to reflect a constant periodic rate of return on the Group’s net investment outstanding in respect of the leases.
When a contract includes both lease and non-lease components, the Group applies IFRS 15 to allocate the consideration under the contract to each component.

140
Fina
ncia
l Sta
tem
ents
3 SUMMARY OF SIGNIFICANT ACCOUNTING POLICIES (CONTINUED)3.9 FOREIGN CURRENCIESTransactions in currencies other than AED (foreign currencies) are recorded at the rates of exchange prevailing at the dates of the transactions. At the end of each reporting period, monetary items denominated in foreign currencies are retranslated at the rates prevailing at that date. Non-monetary items carried at fair value that are denominated in foreign currencies are retranslated at the rates prevailing at the date when the fair value was determined. Non-monetary items that are measured in terms of historical cost in a foreign currency are not retranslated.
3.10 BORROWING COSTSBorrowing costs directly attributable to the acquisition, construction or production of qualifying assets, which are assets that necessarily take a substantial period of time to get ready for their intended use or sale, are added to the cost of those assets, until such time as the assets are substantially ready for their intended use or sale. All other borrowing costs are recognised in profit or loss in the period in which they are incurred.
3.11 PROPERTY, PLANT AND EQUIPMENT Property, plant and equipment are stated at historical cost less accumulated depreciation and accumulated impairment losses. Historical cost includes expenditure that is directly attributable to the acquisition of the asset.
Subsequent costs are included in the asset’s carrying amount or recognised as a separate asset, as appropriate, only when it is probable that future economic benefits associated with the item will flow to the Group and the cost of the item can be measured reliably. All other repairs and maintenance expenses are charged to the consolidated income statement in the period in which they are incurred.
Depreciation is calculated using the straight-line method to allocate the assets’ cost to their residual values over their estimated useful lives as follows:
Years
Buildings 20 – 30
Plants and machinery 15 – 20
Labour camps 5 – 10
Furniture and fixtures 5
Office equipment 3 – 5
Computers 3
Motor vehicles 4
Leasehold improvements 3 – 4
Freehold land is not depreciated.
The estimated useful lives, residual values and depreciation method are reviewed at each year end, with the effect of any changes in estimate accounted for on a prospective basis.
An asset’s carrying amount is written down immediately to its recoverable amount if the asset’s carrying amount is greater than its estimated recoverable amount.
Right-of-used assets are depreciated over the shorter period of lease term and the useful life of the underlying asset.
An item of property, plant and equipment is derecognised upon disposal (i.e., at the date the recipient obtains control) or when no future economic benefits are expected from its use or disposal. Any gain or loss arising on derecognition of the asset (calculated as the difference between the net disposal proceeds and the carrying amount of the asset) is included in the consolidated income statement when the asset is derecognised.
3.12 CAPITAL WORK IN PROGRESSProperties or assets in the course of construction for production, supply or administrative purposes, are carried at cost, less any recognised impairment loss. Cost includes all direct costs attributable to the acquisition of the property including related staff costs, and for qualifying assets, borrowing costs capitalised in accordance with the Group’s accounting policy. When the assets are ready for intended use, the capital work in progress is transferred to the appropriate property, plant and equipment category and is accounted in accordance with the Group’s policies.
For the year ended 31 December 2019
Notes to the Consolidated Financial Statements (continued)

141
Ald
ar A
nnua
l Rep
ort 2
019
3.13 INVESTMENT PROPERTIES Investment properties comprise completed properties and properties under development. Completed properties are properties held to earn rentals and/ or for capital appreciation and properties under development are properties being constructed or developed for future use as investment property.
Investment properties are measured initially at cost including transaction costs and for properties under development all direct costs attributable to the design and construction including related staff costs. Subsequent to initial recognition, investment properties are measured at fair value, which reflects market conditions at the reporting date. Gains or losses arising from changes in the fair value of investment properties are included in the consolidated income statement in the period in which they arise. Fair values are determined based on annual valuations performed by accredited external independent valuers applying valuation models recommended by the International Valuation Standards Committee.
Transfers are made to (or from) investment property only when there is a change in use. For a transfer from investment property to owner-occupied property, the deemed cost for subsequent accounting is the fair value at the date of change in use. If owner-occupied property becomes an investment property, the Group accounts for such property in accordance with the policy stated under property, plant and equipment up to the date of change in use.
Upon completion of construction or development, a property is transferred from properties under development to completed properties. Investment properties are derecognised either when they have been disposed of (i.e., at the date the recipient obtains control) or when they are permanently withdrawn from use and no future economic benefits are expected from the disposal. The difference between the net disposal proceeds and the carrying amount of the asset is recognised in the consolidated income statement in the period of derecognition.
3.14 DEVELOPMENT WORK IN PROGRESSDevelopment work in progress consists of property being developed principally for sale and is stated at the lower of cost or net realisable value. Cost comprises all direct costs attributable to the design and construction of the property including direct staff costs, and for qualifying assets, borrowing costs capitalised in accordance with the Group’s accounting policy. Net realisable value is the estimated selling price in the ordinary course of the business less estimated costs to complete and applicable variable selling expenses.
3.15 INVENTORIESInventories comprise completed properties held for sale in the ordinary course of business and other operating inventories. Inventories are stated at the lower of cost and net realisable value. Cost is calculated using the weighted average cost method and comprises construction/ acquisition costs and other charges incurred in bringing inventory to its present location and condition. Net realisable value represents the estimated selling price less all estimated selling and marketing costs to be incurred.
3.16 LAND HELD FOR SALELand held for sale is stated at the lower of cost and net realisable value. Costs include the cost of land acquired and all direct costs attributable to the infrastructure works of the land. Net realisable value represents the estimated selling price of the land less all estimated costs necessary to make the sale.
3.17 INTANGIBLE ASSETS Intangible assets acquired separately are measured on initial recognition at cost. The cost of intangible assets acquired in a business combination is their fair value at the date of acquisition and are recognised separately from goodwill. Following initial recognition, intangible assets are carried at cost less any accumulated amortisation and accumulated impairment losses. Amortisation is charged on a straight-line basis over the useful economic life and assessed for impairment whenever there is an indication that the intangible asset may be impaired. The amortisation period and the amortisation method for an intangible asset with a finite useful life are reviewed at least at the end of each reporting period. Changes in the expected useful life or the expected pattern of consumption of future economic benefits embodied in the asset are considered to modify the amortisation period or method, as appropriate, and are treated as changes in accounting estimates. The amortisation expense on intangible assets with finite lives is recognised in the income statement in the expense category that is consistent with the function of the intangible assets. An intangible asset is derecognised upon disposal (i.e., at the date the recipient obtains control) or when no future economic benefits are expected from its use or disposal. Any gain or loss arising upon derecognition of the asset (calculated as the difference between the net disposal proceeds and the carrying amount of the asset) is included in the consolidated income statement.
COMPUTER SOFTWAREAcquired computer software licences are capitalised on the basis of the costs incurred to acquire and bring to use the specific software. These costs are amortised on a straight-line basis over their estimated useful lives which is normally a period of three to five years.

142
Fina
ncia
l Sta
tem
ents
3 SUMMARY OF SIGNIFICANT ACCOUNTING POLICIES (CONTINUED)3.17 INTANGIBLE ASSETS (CONTINUED)CUSTOMER CONTRACTSCustomer contracts have a finite useful life and are carried at cost less accumulated amortisation and impairment and mainly represent long term non-cancellable contracts with customers for the supply of district cooling services which were acquired during the year ended 31 December 2018 (note 5). Amortisation is calculated using the straight-line method to allocate the cost over their estimated useful lives, which is in the range of 22 to 29 years.
3.18 IMPAIRMENT OF NON-FINANCIAL ASSETSAt each reporting date, the Group reviews the carrying amounts of its property, plant and equipment and intangible assets to determine whether there is any indication that those assets have suffered an impairment loss. If any such indication exists, the recoverable amount of the asset is estimated to determine the extent of the impairment loss (if any). Where the asset does not generate cash flows that are independent from other assets, the Group estimates the recoverable amount of the cash-generating unit to which the asset belongs. When a reasonable and consistent basis of allocation can be identified, corporate assets are also allocated to individual cash-generating units, or otherwise they are allocated to the smallest group of cash-generating units for which a reasonable and consistent allocation basis can be identified.
Intangible assets with an indefinite useful life are tested for impairment at least annually and whenever there is an indication at the end of a reporting period that the asset may be impaired.
Recoverable amount is the higher of fair value less costs of disposal and value in use. In assessing value in use, the estimated future cash flows are discounted to their present value using a pre-tax discount rate that reflects current market assessments of the time value of money and the risks specific to the asset for which the estimates of future cash flows have not been adjusted. In determining fair value less costs of disposal, recent market transactions are taken into account. If no such transactions can be identified, an appropriate valuation model is used. The Group bases its impairment calculation on detailed budgets and forecast calculations, which are prepared separately for each of the Group’s CGUs to which the individual assets are allocated.
If the recoverable amount of an asset (or cash-generating unit) is estimated to be less than its carrying amount, the carrying amount of the asset (or cash-generating unit) is reduced to its recoverable amount. An impairment loss is recognised immediately in profit or loss.
Where an impairment loss subsequently reverses, the carrying amount of the asset (or cash-generating unit) is increased to the revised estimate of its recoverable amount, but so that the increased carrying amount does not exceed the carrying amount that would have been determined had no impairment loss been recognised for the asset (or cash-generating unit) in prior years. A reversal of an impairment loss is recognised immediately in profit or loss to the extent that it eliminates the impairment loss which has been recognised for the asset in prior years.
Goodwill is tested for impairment annually and when circumstances indicate that the carrying value may be impaired. Impairment is determined for goodwill by assessing the recoverable amount of each CGU (or group of CGUs) to which the goodwill relates. When the recoverable amount of the CGU is less than its carrying amount, an impairment loss is recognised. Impairment losses relating to goodwill cannot be reversed in future periods.
3.19 CASH AND CASH EQUIVALENTSFor the purpose of consolidated statement of cash flows, cash and cash equivalents comprise cash at banks and on hand and short-term deposits with a maturity of three months or less, which are subject to an insignificant risk of changes in value, net of outstanding bank overdrafts as they are considered an integral part of the Group’s cash management policy.
3.20 PROVISIONSProvisions are recognised when the Group has a present obligation (legal or constructive) as a result of a past event, it is probable that an outflow of resources embodying economic benefits will be required to settle the obligation and a reliable estimate can be made of the amount of the obligation. The amount recognised as a provision is the best estimate of the consideration required to settle the present obligation at the reporting date, taking into account the risks and uncertainties surrounding the obligation. When the Group expects some or all of a provision to be reimbursed, for example, under an insurance contract, the reimbursement is recognised as a separate asset, but only when the reimbursement is virtually certain. The expense relating to a provision is presented in the income statement net of any reimbursement. If the effect of the time value of money is material, provisions are discounted using a current pre-tax rate that reflects, when appropriate, the risks specific to the liability. When discounting is used, the increase in the provision due to the passage of time is recognised as a finance cost.
For the year ended 31 December 2019
Notes to the Consolidated Financial Statements (continued)

143
Ald
ar A
nnua
l Rep
ort 2
019
ONEROUS CONTRACTSIf the Group has a contract that is onerous, the present obligations under onerous contracts are recognised and measured as a provision. However, before a separate provision for an onerous contract is established, the Group recognises any impairment loss that has occurred on assets dedicated to that contract. An onerous contract is a contract under which the unavoidable costs (i.e., the costs that the Group cannot avoid because it has the contract) of meeting the obligations under the contract exceed the economic benefits expected to be received under it. The unavoidable costs under a contract reflect the least net cost of exiting from the contract, which is the lower of the cost of fulfilling it and any compensation or penalties arising from failure to fulfil it.
CONTINGENT LIABILITIES ACQUIRED IN A BUSINESS COMBINATIONContingent liabilities acquired in a business combination are initially measured at fair value at the acquisition date. At the end of subsequent reporting periods, such contingent liabilities are remeasured at the higher of the amount that would be recognised in accordance with IAS 37 and the amount recognised initially less cumulative amount of income recognised in accordance with the principles of IFRS 5.
3.21 PROVISION FOR EMPLOYEES’ BENEFITS An accrual is made for estimated liability for employees’ entitlement to annual leave and leave passage as a result of services rendered by eligible employees up to the reporting date. Provision is also made for the full amount of end of service benefits due to employees in accordance with the Group’s policy, which is at least equal to the benefits payable in accordance with UAE Labour Law, for their period of service up to the reporting date. The accrual relating to annual leave is disclosed as a current liability, while the provision relating to end of service benefits is disclosed as a non-current liability.
Pension contributions are made in respect of UAE national employees to the UAE General Pension and Social Security Authority in accordance with the UAE Federal Law no. (2) of 2000 for Pension and Social Security; such contributions are charged to profit or loss during the employees' period of service.
3.22 SHARE-BASED PAYMENTSFor cash-settled share-based payments to employees, a liability is recognised for the services acquired, at the fair value which is measured initially at grant date and at each reporting date up to and including the settlement date, with changes in fair value net of any changes in investments held, are recognised in the consolidated income statement. The Group does not have any equity-settled share-based payments.
3.23 GOVERNMENT GRANTSGovernment grants are not recognised until there is reasonable assurance that the Group will comply with the conditions attaching to them and that the grants will be received.
Government grants are recognised in income statement on a systematic basis over the periods in which the Group recognises as expenses the related costs for which the grants are intended to compensate. Specifically, government grants whose primary condition is that the Group should purchase, construct or otherwise acquire non-monetary assets are recognised as deferred government grant in the consolidated statement of financial position and transferred to the consolidated income statement on a systematic and rational basis over the useful lives of the related assets.
Government grants that are receivable as compensation for expenses already incurred or for the purpose of giving immediate financial support to the group with no future related costs are recognised in the consolidated income statement in the period in which they become receivable. The benefit of a government loan at a below-market rate of interest is treated as a government grant, measured as the difference between proceeds received and the fair value of the loan based on prevailing market interest rates.
Land granted by the Government is recognised at nominal value where there is reasonable assurance that the land will be received and the Group will comply with any attached conditions, where applicable.
144
Fina
ncia
l Sta
tem
ents
3 SUMMARY OF SIGNIFICANT ACCOUNTING POLICIES (CONTINUED)3.24 FINANCIAL INSTRUMENTSA financial instrument is any contract that gives rise to a financial asset of one entity and a financial liability or equity instrument of another entity.
FINANCIAL ASSETSAll financial assets under the scope of IFRS 9 are required to be subsequently measured at amortised cost or fair value on the basis of the Group’s business model for managing the financial assets and the contractual cash flow characteristics of the financial assets.
A financial asset is measured at amortised cost, if both the following conditions are met: • the financial asset is held within a business model whose objective is to hold financial assets in order to collect contractual cash
flows; and • the contractual terms of the financial asset give rise on specified dates to cash flows that are solely payments of principal and
interest on the principal amount outstanding.
A financial asset is measured at fair value through other comprehensive income, if both of the following conditions are met: • the financial asset is held within a business model whose objective is achieved by both collecting contractual cash flows and
selling financial assets; and • the contractual terms of the financial asset give rise on specified dates to cash flows that are solely payments of principal and
interest on the principal amount outstanding.
A financial asset is measured at fair value through profit or loss, unless it is measured at amortised cost or at fair value through other comprehensive income. However, the Group may make an irrevocable election at initial recognition for particular investments in equity instruments that would otherwise be measured at fair value through profit or loss to present subsequent changes in fair value in other comprehensive income.
FINANCIAL LIABILITIESAll financial liabilities are classified and subsequently measured at amortised cost, except for: • financial liabilities at fair value through profit or loss. Such liabilities, including derivatives that are liabilities, are subsequently
measured at fair value • financial liabilities that arise when a transfer of a financial asset does not qualify for derecognition or when the continuing
involvement approach applies • financial guarantee contracts • commitments to provide a loan at a below-market interest rate
At initial recognition, the Group may irrevocably designate a financial liability as measured at fair value through profit or loss when permitted, or when doing so results in more relevant information, because either: • it eliminates or significantly reduces a measurement or recognition inconsistency (sometimes referred to as 'an accounting
mismatch') that would otherwise arise from measuring assets or liabilities or recognising the gains and losses on them on different bases; or
• a group of financial liabilities or financial assets and financial liabilities is managed and its performance is evaluated on a fair value basis, in accordance with a documented risk management or investment strategy, and information about the Group is provided internally on that basis to the entity's key management personnel.
LOANS AND BORROWINGSAfter initial recognition, interest-bearing loans and borrowings are subsequently measured at amortised cost using the effective interest rate (EIR) method. Gains and losses are recognised in profit or loss when the liabilities are derecognised as well as through the EIR amortisation process. Amortised cost is calculated by taking into account any discount or premium on acquisition and fees or costs that are an integral part of the EIR. The EIR amortisation is included as finance costs in the consolidated income statement. This category generally applies to interest-bearing loans and borrowings.
SUKUKThe sukuk are stated at amortised cost using the effective profit rate method. The profit attributable to the sukuk is calculated by applying the prevailing market profit rate, at the time of issue, for similar sukuk instruments and any difference with the profit distributed is added to the carrying amount of the sukuk.
For the year ended 31 December 2019
Notes to the Consolidated Financial Statements (continued)

145
Ald
ar A
nnua
l Rep
ort 2
019
EMBEDDED DERIVATIVESWhere a hybrid contract contains a host that is a financial asset under the scope of IFRS 9, the policy in relation to classification and measurement, including impairment relating to the financial assets applies to the entire hybrid contract.
Where a hybrid contract contains a host that is not a financial asset within the scope of IFRS 9, the embedded derivative is separated from the host and accounted for as a derivative if, and only if: • the economic characteristics and risks of the embedded derivative are not closely related to the economic characteristics and
risks of the host; • a separate instrument with the same terms as the embedded derivative would meet the definition of a derivative; and • the hybrid contract is not measured at fair value with changes in fair value recognised in profit or loss (i.e. a derivative that is
embedded in a financial liability at fair value through profit or loss is not separated).
Where a contract contains one or more embedded derivatives and the host is not a financial asset within the scope of IFRS 9, the Group may designate the entire hybrid contract as at fair value through profit or loss unless: • the embedded derivatives do not significantly modify the cash flows that otherwise would be required by the contract; or • it is clear with little or no analysis when a similar hybrid instrument is first considered that separation of the embedded derivatives
is prohibited, such as a prepayment option embedded in a loan that permits the holder to prepay the loan for approximately its amortised cost.
Where it is required to separate an embedded derivative from its host, but is unable to measure the embedded derivative separately either at acquisition or at the end of a subsequent financial reporting period, it shall designate the entire hybrid contract as at fair value through profit or loss.
RECLASSIFICATION OF FINANCIAL ASSETS AND FINANCIAL LIABILITIESWhere the Group changes its business model for managing financial assets, it reclassifies all affected financial assets. An entity shall not reclassify any financial liability.
MEASUREMENT OF FINANCIAL ASSETS AND LIABILITIESINITIAL MEASUREMENTAt initial recognition, financial assets and financial liabilities are measured at fair value plus or minus, in the case of a financial asset or financial liability not at fair value through profit or loss, transaction costs that are directly attributable to the acquisition or issue of the financial asset or financial liability.
SUBSEQUENT MEASUREMENT OF FINANCIAL ASSETSAfter initial recognition, an entity shall measure a financial asset in accordance with its classification at: • amortised cost less impairment; • fair value through other comprehensive income less impairment; or • fair value through profit or loss.
Impairment is assessed on the financial assets measured at amortised cost and at fair value through other comprehensive income as disclosed below.
Hedge accounting requirements disclosed below applies to financial assets designated as hedged item.

146
Fina
ncia
l Sta
tem
ents
3 SUMMARY OF SIGNIFICANT ACCOUNTING POLICIES (CONTINUED)3.24 FINANCIAL INSTRUMENTS (CONTINUED)IMPAIRMENT OF FINANCIAL ASSETSIn relation to the impairment of financial assets, the Group applies the Expected Credit Loss (“ECL”) model as opposed to an incurred credit loss model. Under the expected credit loss model, the Group accounts for expected credit losses and changes in those expected credit losses at the end of each reporting period to reflect changes in credit risk since initial recognition of the financial assets. It is not necessary for a credit event to have occurred before credit losses are recognised.
A loss allowance for expected credit losses is recognised on all classes of financial assets, other than those that are measured as fair value through profit or loss and equity instruments classified and measured at fair value through other comprehensive income. The financial assets subject to impairment requirements of IFRS 9, include: • debt investments subsequently measured at amortised cost or at fair value through other comprehensive income; • trade receivables; • lease receivables; • contract assets; and • loan commitments and financial guarantee contracts.
The Group has adopted the simplified approach for measuring the impairment on trade receivables, lease receivables and contract assets. Under the simplified approach, the Group measures the loss allowance at an amount equal to lifetime ECL.
For all other financial instruments, the Group recognises lifetime ECL when there has been a significant increase in credit risk since initial recognition. If, on the other hand, the credit risk on the financial instrument has not increased significantly since initial recognition, the Group measures the loss allowance for that financial instrument at an amount equal to 12 months ECL. The assessment of whether lifetime ECL should be recognised is based on significant increases in the likelihood or risk of a default occurring since initial recognition instead of on evidence of a financial asset being credit-impaired at the end of the reporting period or an actual default occurring.
In assessing whether the credit risk on a financial instrument has increased significantly since initial recognition, the Group compares the risk of a default occurring on the financial instrument as at the end of the reporting period with the risk of a default occurring on the financial instrument as at the date of initial recognition. In making this assessment, the Group considers both quantitative and qualitative information that is reasonable and supportable, including historical experience and forward-looking information that is available without undue cost or effort. Irrespective of the outcome of the above assessment, the Group presumes that the credit risk on a financial asset has increased significantly since initial recognition when contractual payments are more than 30 days past due, unless the Group has reasonable and supportable information that demonstrates otherwise.
Despite the foregoing, the Group assumes that the credit risk on a financial instrument has not increased significantly since initial recognition if the financial instrument is determined to have low credit risk at the reporting date. A financial instrument is determined to have low credit risk if: • the financial instrument has a low risk of default; • the borrower has a strong capacity to meet its contractual cash flow obligations in the near term; and • adverse changes in economic and business conditions in the longer term may, but will not necessarily, reduce the ability of the
borrower to fulfil its contractual cash flow obligations.
The Group considers a financial asset to have low credit risk when it has an internal or external credit rating of ‘investment grade’ as per globally understood definition.
The Group regularly monitors the effectiveness of the criteria used to identify whether there has been a significant increase in credit risk and revises them as appropriate to ensure that the criteria are capable of identifying significant increase in credit risk before the amount becomes past due.
The Group considers the following as constituting an event of default for internal credit risk management purposes as historical experience indicates that receivables that meet either of the following criteria are highly doubtful of collection, unless the Group has reasonable and supportable information to demonstrate that a more lagging default criterion is more appropriate: • when there is a breach of financial covenants by the counterparty; or • information developed internally or obtained from external sources indicates that the debtor is unlikely to pay its creditors,
including the Group, in full.
For the year ended 31 December 2019
Notes to the Consolidated Financial Statements (continued)
147
Ald
ar A
nnua
l Rep
ort 2
019
The measurement of expected credit losses is a function of the probability of default, loss given default (i.e. the magnitude of the loss if there is a default) and the exposure at default. The assessment of the probability of default and loss given default is based on historical data adjusted by forward-looking information as described above. As for the exposure at default for financial assets, this is represented by the assets’ gross carrying amount at the reporting date.
Where lifetime ECL is measured on a collective basis to cater for cases where evidence of significant increases in credit risk at the individual instrument level may not yet be available, the financial instruments are grouped for the assessment of the expected credit loss. The grouping is regularly reviewed by management to ensure the constituents of each group continue to share similar credit risk characteristics.
DERECOGNITIONA financial asset (or, where applicable, a part of a financial asset or part of a group of similar financial assets) is primarily derecognised (i.e., removed from the Group’s consolidated statement of financial position) when: • The rights to receive cash flows from the asset have expired; or • The Group has transferred its rights to receive cash flows from the asset or has assumed an obligation to pay the received cash
flows in full without material delay to a third party under a ‘pass-through’ arrangement and either (a) the Group has transferred substantially all the risks and rewards of the asset, or (b) the Group has neither transferred nor retained substantially all the risks and rewards of the asset, but has transferred control of the asset.
When the Group has transferred its rights to receive cash flows from an asset or has entered into a pass-through arrangement, it evaluates if, and to what extent, it has retained the risks and rewards of ownership. When it has neither transferred nor retained substantially all of the risks and rewards of the asset, nor transferred control of the asset, the Group continues to recognise the transferred asset to the extent of its continuing involvement. In that case, the Group also recognises an associated liability. The transferred asset and the associated liability are measured on a basis that reflects the rights and obligations that the Group has retained.
Continuing involvement that takes the form of a guarantee over the transferred asset is measured at the lower of the original carrying amount of the asset and the maximum amount of consideration that the Group could be required to repay.
OFFSETTING OF FINANCIAL INSTRUMENTSFinancial assets and financial liabilities are offset and the net amount is reported in the consolidated statement of financial position if there is a currently enforceable legal right to offset the recognised amounts and there is an intention to settle on a net basis, to realise the assets and settle the liabilities simultaneously.
HEDGING ARRANGEMENTSThe Group uses derivative financial instruments, such as interest rate swaps, to hedge its interest rate risks, respectively. Such derivative financial instruments are initially recognised at fair value on the date on which a derivative contract is entered into and are subsequently remeasured at fair value. Derivatives are carried as financial assets when the fair value is positive and as financial liabilities when the fair value is negative.
For the purpose of hedge accounting, hedges are classified as: • Fair value hedges when hedging the exposure to changes in the fair value of a recognised asset or liability or an unrecognised
firm commitment. • Cash flow hedges when hedging the exposure to variability in cash flows that is either attributable to a particular risk associated
with a recognised asset or liability or a highly probable forecast transaction or the foreign currency risk in an unrecognised firm commitment.
• Hedges of a net investment in a foreign operation.
At the inception of a hedge relationship, the Group formally designates and documents the hedge relationship to which it wishes to apply hedge accounting and the risk management objective and strategy for undertaking the hedge.

148
Fina
ncia
l Sta
tem
ents
3 SUMMARY OF SIGNIFICANT ACCOUNTING POLICIES (CONTINUED)3.24 FINANCIAL INSTRUMENTS (CONTINUED)FAIR VALUE HEDGESThe change in the fair value of a hedging instrument is recognised in the consolidated income statement as other expense. The change in the fair value of the hedged item attributable to the risk hedged is recorded as part of the carrying value of the hedged item and is also recognised in the consolidated income statement as other expense. For fair value hedges relating to items carried at amortised cost, any adjustment to carrying value is amortised through profit or loss over the remaining term of the hedge using the EIR method. The EIR amortisation may begin as soon as an adjustment exists and no later than when the hedged item ceases to be adjusted for changes in its fair value attributable to the risk being hedged. If the hedged item is derecognised, the unamortised fair value is recognised immediately in profit or loss.
When an unrecognised firm commitment is designated as a hedged item, the subsequent cumulative change in the fair value of the firm commitment attributable to the hedged risk is recognised as an asset or liability with a corresponding gain or loss recognised in profit or loss.
CASH FLOW HEDGESThe effective portion of the gain or loss on the hedging instrument is recognised in OCI in the cash flow hedge reserve, while any ineffective portion is recognised immediately in the consolidated income statement. The cash flow hedge reserve is adjusted to the lower of the cumulative gain or loss on the hedging instrument and the cumulative change in fair value of the hedged item.
If cash flow hedge accounting is discontinued, the amount that has been accumulated in OCI must remain in accumulated OCI if the hedged future cash flows are still expected to occur. Otherwise, the amount will be immediately reclassified to profit or loss as a reclassification adjustment. After discontinuation, once the hedged cash flow occurs, any amount remaining in accumulated OCI must be accounted for depending on the nature of the underlying transaction as described above.
4 CRITICAL ACCOUNTING JUDGMENTS AND KEY SOURCES OF ESTIMATION UNCERTAINTYIn applying the Group’s accounting policies, which are described in note 3, management is required to make judgments, estimates and assumptions about the carrying amounts of assets and liabilities that are not readily apparent from other sources. The estimates and associated assumptions are based on historical experience and other factors that are considered to be relevant. Actual results may differ from these estimates.
The estimates and underlying assumptions are reviewed on an ongoing basis. Revisions to accounting estimates are recognised in the period in which the estimate is revised if the revision affects only that period or in the period of the revision and future periods if the revision affects both current and future periods.
CRITICAL JUDGMENT IN APPLYING ACCOUNTING POLICIESThe following are the critical judgments, apart from those involving estimations (which are presented below separately), that management have made in the process of applying the Group’s accounting policies and that have the most significant effect on the amounts recognised in the consolidated financial statements.
DISCOUNT RATE USED FOR INITIAL MEASUREMENT OF LEASE LIABILITYThe Group, as a lessee, measures the lease liability at the present value of the unpaid lease payments at the commencement date. The lease payments are discounted using the interest rate implicit in the lease, if that rate can be readily determined. If that rate cannot be readily determined, the Group uses its incremental borrowing rate.
Incremental borrowing rate is the rate of interest that the Group would have to pay to borrow over a similar term, and with a similar security, the funds necessary to obtain an asset of a similar value to the right-of-use assets in similar economic environment.
The Group determines its incremental borrowing rate with reference to its existing and historical cost of borrowing adjusted for the term and security against such borrowing.
CLASSIFICATION OF PROPERTIESIn the process of classifying properties, management has made various judgements. Judgement is needed to determine whether a property qualifies as an investment property, property, plant and equipment and/or property held for sale. The Group develops criteria so that it can exercise that judgement consistently in accordance with the definitions of investment property, property, plant and equipment and property held for sale. In making its judgement, management considered the detailed criteria and related guidance for the classification of properties as set out in IAS 2, IAS 16 and IAS 40, and in particular, the intended usage of property as determined by management.
For the year ended 31 December 2019
Notes to the Consolidated Financial Statements (continued)

149
Ald
ar A
nnua
l Rep
ort 2
019
EXCHANGE OF PROPERTIESAs disclosed in Note 32, during the year, the Executive Council of the Government of Abu Dhabi resolved to exchange plots of land with the Group in a transaction that exchanges developable land resources in line with the parties’ strategic priorities. In line with the requirements of IAS 16 Property, Plant and Equipment, the Group assessed that the transaction was undertaken on commercial terms and had commercial substance as: • The properties being transferred by the Group are at different locations and have different cash flow characteristics than
properties being received by the Group. Also, plots of land obtained by the Group are in line with the Group’s strategic priorities to develop key destinations of Saadiyat Island and Yas Island, especially considering that the Group is the master developer of the various projects on Saadiyat Island; and
• The plots given by the Group were not part of the Group’s development strategy in the foreseeable future. The Group received infrastructure-enabled land with high potential for development in the coming years, as the Group consolidate development focus on their key destinations, in particular Saadiyat Island.
JUDGEMENTS IN RELATION TO CONTRACTS WITH CUSTOMERSSATISFACTION OF PERFORMANCE OBLIGATIONSThe Group is required to assess each of its contracts with customers to determine whether performance obligations are satisfied over time or at a point in time in order to determine the appropriate method for recognising revenue. The Group has assessed that based on the contracts entered into with customers and the provisions of relevant laws and regulations, the Group recognises revenue over time in the following circumstances: • where contracts are entered into for development (sale of properties to customers), the Group does not create an asset with
an alternative use to the Group and has an enforceable right to payment for performance completed to date; • where contracts are entered into for construction (to construct an asset for the customer), the Group’s performance creates
or enhances an asset that the customer controls as the asset is created or enhanced; and • where contracts are entered into to provide services (property management and facility management), the customer
simultaneously receives and consumes the benefits provided by the Group’s performance as the Group performs.
Where the above criteria are not met, revenue is recognised at a point in time. Where revenue is recognised at a point of time, the Group assesses each contract with customers to determine when the performance obligation of the Group under the contract is satisfied.
DETERMINATION OF TRANSACTION PRICESThe Group is required to determine the transaction price in respect of each of its contracts with customers. In making such judgement the Group assesses the impact of any variable consideration in the contract, due to discounts or penalties, the existence of any significant financing component and any non-cash consideration in the contract.
In determining the impact of variable consideration, the Group uses the “most-likely amount” method in IFRS 15 whereby the transaction price is determined by reference to the single most likely amount in a range of possible consideration amounts.
TRANSFER OF CONTROL IN CONTRACTS WITH CUSTOMERSIn cases where the Group determines that performance obligations are satisfied at a point in time, revenue is recognised when control over the assets is transferred to the customer or benefits of the services being provided is received and consumed by the customer. In the case of contracts to sell real estate assets this is generally when the consideration for the unit has been substantially received and there are no impediments in the handing over of the unit to the customer.
IDENTIFYING WHETHER AN ACQUISITION IS A BUSINESS OR AN ASSETFor acquisitions made by the Group, the Group needs to make significant judgement to assess whether the assets acquired and liabilities assumed constitutes a business and whether it has acquired control of one or more businesses. Where such an acquisition does not constitute a business, the acquisition is accounted for as an asset acquisition. In making this assessment, the Group applies the definition of business under IFRS 3 which requires that the Group determines whether it has acquired integrated processes which when applied to inputs, have the ability to produce outputs.
KEY SOURCES OF ESTIMATION UNCERTAINTYThe key assumptions concerning the future, and other key sources of estimation uncertainty at the reporting date, that have a significant risk of causing a material adjustment to the carrying amounts of assets and liabilities within the next financial year, are discussed below:

150
Fina
ncia
l Sta
tem
ents
4 CRITICAL ACCOUNTING JUDGMENTS AND KEY SOURCES OF ESTIMATION UNCERTAINTY (CONTINUED)KEY SOURCES OF ESTIMATION UNCERTAINTY (CONTINUED)ALLOCATION OF TRANSACTION PRICE TO PERFORMANCE OBLIGATION IN CONTRACTS WITH CUSTOMERSThe Group has elected to apply the input method in allocating the transaction price to performance obligations where revenue is recognised over time. The Group considers that the use of the input method, which requires revenue recognition on the basis of the Group’s efforts to the satisfaction of performance obligation, provides the best reference of revenue actually earned. In applying the input method, the Group estimates the efforts or inputs to the satisfaction of a performance obligation. In addition to the cost of meeting contractual obligation to the customers, these estimates mainly include: • For development contracts, the cost of development and related infrastructure; • For construction contracts, the certified works as evaluated by project consultant; and • For services contracts, the time elapsed.
CALCULATION OF LOSS ALLOWANCEThe Group assesses the impairment of its financial assets based on the ECL model. Under the expected credit loss model, the Group accounts for expected credit losses and changes in those expected credit losses at the end of each reporting period to reflect changes in credit risk since initial recognition of the financial assets. The Group measures the loss allowance at an amount equal to lifetime ECL for its financial instruments.
When measuring ECL, the Group uses reasonable and supportable forward looking information, which is based on assumptions for the future movement of different economic drivers and how these drivers will affect each other.
Loss given default is an estimate of the loss arising on default. It is based on the difference between the contractual cash flows due and those that the lender would expect to receive, taking into account cash flows from collateral and integral credit enhancements.
Probability of default constitutes a key input in measuring ECL. Probability of default is an estimate of the likelihood of default over a given time horizon, the calculation of which includes historical data, assumptions and expectations of future conditions.
FAIR VALUE OF INVESTMENT PROPERTIES AND INVESTMENT PROPERTIES UNDER DEVELOPMENTThe fair value of investment properties is determined by independent real estate valuation experts using recognised valuation methods. These methods comprise the residual value method and the income capitalisation method.
The residual value method requires the use of estimates such as future cash flows from assets (comprising of selling and leasing rates, future revenue streams, construction costs and associated professional fees, and financing cost, etc.), targeted internal rate of return and developer’s risk and targeted profit. These estimates are based on local market conditions existing at the end of the reporting period.
Under the income capitalisation method, the income receivable under existing lease agreements and projected future rental streams are capitalised at appropriate rates to reflect the investment market conditions at the valuation dates.
The Group’s undiscounted future cash flows analysis and the assessment of expected remaining holding period and income projections on the existing operating assets requires management to make significant estimates and judgements related to future rental yields and capitalisation rates.
The key assumptions used are as follows:
Range %
Capitalisation rates 5.5 – 12.2
ESTIMATION OF NET REALISABLE VALUE FOR INVENTORY, LAND HELD FOR SALE AND DEVELOPMENT WORK IN PROGRESSInventory, land held for sale and properties classified under development work in progress are stated at the lower of cost or net realisable value (NRV). NRV is assessed with reference to sales prices, costs of completion and advances received, development plans and market conditions existing at the end of the reporting period. For certain properties, NRV is determined by the Group having taken suitable external advice and in the light of recent market transactions, where available.
The determination of net realisable value of land held for sale is based on external valuations using various valuation methodologies and techniques that take into account property-specific information such as forecast selling prices, site planning (including planning consent), build costs, cost recoveries, sales rates (per square meter) and discount rates etc., all of which contain an element of judgement and uncertainty. Forecast selling prices have inherent uncertainty due to changes in market conditions. Forecast build costs can vary with market conditions and may also be incorrectly estimated due to changes in site planning, style of build or unforeseen circumstances arising during construction.
For the year ended 31 December 2019
Notes to the Consolidated Financial Statements (continued)

151
Ald
ar A
nnua
l Rep
ort 2
019
IMPAIRMENT OF PROPERTY, PLANT AND EQUIPMENT AND CAPITAL WORK IN PROGRESSProperties classified under property, plant and equipment and capital work in progress are assessed for impairment when there is an indication that those assets have suffered an impairment loss. An impairment review is carried out by determining the recoverable amount which takes into account the fair value of the property under consideration. The fair value of hotel properties classified under property, plant and equipment is determined by an independent real estate valuation expert using Discounted Cash Flow method.
Cash flows are determined with reference to recent market conditions, prices existing at the end of the reporting period, contractual agreements and estimations over the useful lives of the assets and discounted using a range of discount rates that reflects current market assessment of the time value of money and the risks specific to the asset. The net present values are compared to the carrying amounts to assess any probable impairment.
USEFUL LIVES OF PROPERTY, PLANT AND EQUIPMENT AND INTANGIBLE ASSETSManagement reviews the residual values and estimated useful lives of property, plant and equipment and intangible assets at the end of each annual reporting period in accordance with IAS 16 and IAS 38. Management determined that current year expectations do not differ from previous estimates based on its review.
IMPAIRMENT OF INVESTMENTS IN/RECEIVABLE FROM JOINT VENTURES AND ASSOCIATESManagement regularly reviews its investments in joint ventures and associates for indicators of impairment. This determination of whether investments in joint ventures and associates are impaired, entails Management’s evaluation of the specific investee’s profitability, liquidity, solvency and ability to generate operating cash flows from the date of acquisition and until the foreseeable future. The difference between the estimated recoverable amount and the carrying value of investment and/ or receivable is recognised as an expense in income statement. Management is satisfied that no additional impairment is required on its investments in associates and joint ventures and it’s receivables from associates and joint ventures in excess of amount already provided.
5 BUSINESS COMBINATIONDuring the year ended 31 December 2018, the Company signed a framework agreement (the “Agreement”) with Tourism Development & Investment Company (“TDIC”) to acquire a portfolio of real estate assets, including limited liability companies, operating businesses and other assets for a total consideration AED 3,625,000 thousand as given below:
AED’000
Operating Businesses (Notes 5.1 and 5.2) and other assets 1,575,000Projects under development and lands 2,050,000
3,625,000
The acquisition comprised of assets and businesses across hospitality, retail, residential, district cooling and education sectors. The aforementioned acquisition is a part of the Group’s strategic plan to profitably deploy capital to expand its portfolio. Based on the Agreement, the effective date of acquisition of assets and control over the operating businesses acquired had been determined as 1 May 2018.
5.1 OPERATING BUSINESSESUnder the Agreement, the operating businesses acquired, included the acquisition of certain legal entities (listed in 5.1.1 below) and other businesses (listed in note 5.1.2 below) acquired from TDIC. The operating businesses met the definition of “Business” under IFRS 3.
5.1.1 LEGAL ENTITIES ACQUIRED
Name OwnershipInterest
Country ofincorporation/operation Principal activity
TDIC Food & Beverage – Sole Proprietorship LLC 100% UAE Restaurant managementTDIC Education – Sole Proprietorship LLC 100% UAE Educational activitiesSaadiyat District Cooling LLC 100% UAE Cooling station operationsSaadiyat Cooling LLC 85% UAE Cooling station operations

152
Fina
ncia
l Sta
tem
ents
5 BUSINESS COMBINATION (CONTINUED)5.1 OPERATING BUSINESSES (CONTINUED)5.1.2 OTHER BUSINESSES ACQUIRED
Name Principal activity
Saadiyat Beach Club Beach clubEastern Mangroves Hotel & Spa Hotel and hospitality servicesThe Westin Abu Dhabi Golf Resort & Spa Hotel and hospitality servicesAbu Dhabi Golf Club Golf clubSaadiyat Beach Golf Club Golf clubEastern Mangroves Retail and Marina Retail units and marinaAl Bateen Marina Retail and Marina Retail units and marina
For the above operating businesses, as per the Agreement, the Group acquired control from the effective date. The country of incorporation and operation of all the other businesses is UAE.
The operating businesses acquired represent business combinations under IFRS 3 Business Combinations and have been accounted for using the acquisition method of accounting, and accordingly, the identifiable assets acquired and liabilities assumed forming part of business combination, has been recognised at its respective fair values, as of 1 May 2018. The remaining assets were accounted for and classified as additions of assets by their nature.
The Group elected to measure the non-controlling interest in the acquiree at the proportionate share of its interest in the acquiree's identifiable net assets at fair value.
5.2 ASSETS ACQUIRED AND LIABILITIES ASSUMED OF THE OPERATING BUSINESSESAcquisition date fair values of the identifiable assets acquired and liabilities assumed of the operating Businesses, as well as the fair value of the non-controlling interest in one of the acquired entity, Saadiyat Cooling LLC were determined as follows:
Notes
Fair value recognised on
acquisition date
AED '000
AssetsProperty, plant and equipment 6 810,145Intangible assets(i) 7 179,809Investment properties 8 166,053Inventories 6,220Trade and other receivables 103,190Cash and bank balances 5.3 136,663
Total assets 1,402,080
LiabilitiesAdvances from customers 8,110Trade and other payables 167,562
Total liabilities 175,672
Total identifiable net assets at fair value 1,226,408Non-controlling interest(ii) (41,101)
Group's share of net assets acquired 1,185,307Less: Purchase consideration (1,070,376)
Gain on bargain purchase, net of goodwill 114,931
Goodwill(iii) 7 (17,860)Gain on bargain purchase(iv) 31 132,791
114,931
(i) The fair value of the acquired identifiable intangible assets of AED 179,809 thousand (note 7), recognised as part of business combination, represents long term non-cancellable contracts with customers for the supply of district cooling services that are valued based on the present value of expected future cash flows that will be generated over its remaining useful life.
(ii) This represent non-controlling interest in Saadiyat Cooling LLC which is measured at 15% of net assets at fair value.
For the year ended 31 December 2019
Notes to the Consolidated Financial Statements (continued)

153
Ald
ar A
nnua
l Rep
ort 2
019
iii) Goodwill of AED 17,860 thousand arising from the acquisition comprises largely of the sales growth, new customers and expected synergies. Goodwill is allocated to asset management segment only.
(iv) The gain on bargain purchase is included in other income and arises from the difference between the fair value of the net assets acquired of the operating businesses, forming part of business combination and consideration paid.
The fair value of the contingent consideration of AED 60,990 thousand was estimated by applying an income approach. The fair value measurement is based on significant inputs that are not observable in the market, which IFRS 13 Fair Value Measurement refers to as level 3 inputs. Key assumptions include a discount rate of 9.7% and probable revenue of AED 60,990 thousand. As of 31 December 2018 and 2019, neither the amount recognised for the contingent consideration arrangement, nor the range of outcomes, or the assumptions used to develop the estimates, had changed.
During the year ended 31 December 2019, in line with the Agreement, the Company entered into warranty claim settlement with TDIC whereby a plot of land with a fair value of AED 60,942 thousand was transferred to the Company (Note 31).
5.3 ANALYSIS OF CASH FLOWS ON ACQUISITION OF OPERATING BUSINESSES
AED '000
Cash paid for the acquisition (note 5) (1,065,000)Net cash acquired on business combination (note 5.2) 136,663
Acquisition of Operating Business – net of cash acquired (included in cash flows from investing activities) (928,337)
Transaction costs of the acquisition (included in cash flows from operating activities) (4,406)
Net cash outflow on acquisition (932,743)
Acquisition related costs amounted to AED 4,406 thousand in relation to acquisition of Operating Businesses were expensed during the year ended 31 December 2018 and were included in general and administrative expenses.

154
Fina
ncia
l Sta
tem
ents
6
P
RO
PER
TY
, PLA
NT
AN
D E
QU
IPM
ENT La
nd a
nd
build
ings
AED
‘00
0
Labo
urca
mps
AED
‘00
0
Furn
itur
e an
d fi
xtur
es
AED
‘00
0
Pla
ntan
d m
achi
nery
AED
‘00
0
Off
ice
equi
pmen
tA
ED ‘0
00
Com
pute
rsA
ED ‘0
00
Mot
or
vehi
cles
AED
‘00
0
Leas
e im
prov
emen
tsA
ED ‘0
00
Cap
ital
w
ork
in
prog
ress
AED
‘00
0To
tal
AED
‘00
0
Cos
tA
t 1
Janu
ary
2018
6,2
26,9
111,
65
4,0
47
69
8,9
63
–8
6,8
5013
9,2
225,
693
16,2
04
47,
284
8,8
75,1
74A
dd
itio
ns3
,059
–31
,477
14,2
43
7,77
314
,572
84
014
622
,06
09
4,1
70A
cqui
siti
on
of s
ubsi
dia
ries
(not
e 5)
44
7,22
0–
2,0
54
293
,259
7,3
65
373
–53
,65
46
,220
810
,14
5Tr
ansf
ers
fro
m d
evel
op
men
t w
ork
in
pro
gre
ss (n
ote
13)
––
2,14
8–
––
––
1,0
703
,218
Tran
sfer
s to
inve
stm
ent
pro
per
ties
(n
ote
8)
––
––
––
––
(25,
700
)(2
5,70
0)
Dis
po
sals
(5,2
06
)–
(10
,58
5)–
(28
7)(9
24)
(126
)–
–(1
7,12
8)
At
1 Ja
nuar
y 20
196
,671
,98
41,
65
4,0
47
724
,057
30
7,50
210
1,70
115
3,2
43
6,4
07
70,0
04
50,9
34
9,7
39,8
79
Ad
dit
ions
29,8
112,
211
36
,09
86
09
8,6
40
9,4
44
3,2
89
10,1
42
27,2
7412
7,51
8Tr
ansf
ers
fro
m in
vest
men
t p
rop
erti
es
(not
e 8
)10
,737
––
––
––
––
10,7
37D
isp
osa
ls–
(226
,99
0)
(13
,14
8)
(5,6
12)
(2,5
15)
(3,7
02)
(1,2
51)
(2,3
83)
–(2
55,6
01)
At 3
1 D
ecem
ber 2
019
6,7
12,5
321,
429
,26
874
7,0
07
302,
49
910
7,8
2615
8,9
85
8,4
45
77,7
63
78,2
08
9,6
22,5
33
Acc
umul
ated
dep
reci
atio
n an
d im
pair
men
t lo
sses
At
1 Ja
nuar
y 20
183
,529
,10
11,
619
,933
591,
68
7–
75,6
95
108
,68
85,
49
513
,63
4–
5,9
44
,233
Cha
rge
for
the
year
15
0,3
98
45
40
,173
12,6
7711
,318
11,3
9314
87,
935
–23
4,0
87
Imp
airm
ent/
(reve
rsal
) (no
te 2
8)
(29
,416
)6
,90
9–
––
––
––
(22,
507)
Dis
po
sals
(5,2
06
)–
(10
,36
2)–
(28
7)(9
24)
(126
)–
–(1
6,9
05)
At
1 Ja
nuar
y 20
193
,64
4,8
771,
626
,88
76
21,4
98
12,6
778
6,7
2611
9,1
575,
517
21,5
69
–6
,13
8,9
08
Cha
rge
for
the
year
16
5,9
08
2,9
42
43
,78
819
,070
11,5
939
,56
771
212
,113
–26
5,6
93Im
pai
rmen
t/(re
vers
al) (
note
28
)(3
6,7
87)
7,6
01
––
––
––
–(2
9,1
86
)D
erec
og
nise
d o
n tr
ansf
ers
to in
vest
men
t p
rop
erti
es (n
ote
8)
(2,9
28)
––
––
––
––
(2,9
28)
Dis
po
sals
–(2
26,9
84
)(1
2,75
5)(5
,48
7)(2
,425
)(3
,64
6)
(1,2
07)
(2,0
40
)–
(25
4,5
44
)
At 3
1 D
ecem
ber 2
019
3,77
1,0
701,
410
,44
66
52,5
3126
,26
09
5,8
94
125,
078
5,0
2231
,64
2–
6,1
17,9
43
Car
ryin
g am
ount
31
Dec
embe
r 20
192,
94
1,4
62
18,8
229
4,4
7627
6,2
3911
,932
33,9
07
3,4
234
6,1
2178
,20
83,
504
,59
0
At
31 D
ecem
ber
20
183
,027
,10
727
,16
010
2,55
929
4,8
2514
,975
34
,08
68
90
48
,435
50,9
34
3,6
00
,971
Fo
r th
e ye
ar e
nded
31
Dec
emb
er 2
019
Not
es t
o th
e C
ons
olid
ated
Fin
anci
al S
tate
men
ts (c
ont
inue
d)

155
Ald
ar A
nnua
l Rep
ort 2
019
The depreciation charge for the year has been allocated as follows:
2019AED ‘000
2018AED ‘000
Direct costs 9,459 12,665General and administrative expenses 256,234 221,422
265,693 234,087
Capital work in progress mainly represent the cost incurred on the development and enhancement of hospitality and leisure facilities which were under progress at the reporting date and will be transferred to the relevant asset category of property, plant and equipment when ready for intended use.
During the year, the Group sold property, plant and equipment resulting in a gain on disposal of AED 22,964 thousand (2018: nil).
Property, plant and equipment include right-of-use assets with respect to land leases of AED 71,784 thousand (2018: AED 74,476 thousand). Depreciation charge of AED 2,692 thousand was recorded against the right-of-use assets during the year (2018: AED 2,692 thousand). The average lease term is 30 years. There were no additions to right-of-use assets during the year. There are no extension or termination options on the lease.
Certain property, plant and equipment are pledged as security against bank borrowings as disclosed under note 19.
During the year, the Group carried out a review of recoverable value of its property, plant and equipment. The review led to a net reversal of impairment of AED 29,186 thousand (2018: AED 22,507 thousand) (note 28), which has been recorded in the consolidated income statement. The reversal of impairment mainly relates to improved cashflows and profitability resulting from the rebranding, franchise switch and improved market conditions. The recoverable value of relevant assets is based on fair value less cost to sell determined by independent valuer and has been determined by reference to the discounted cash flow method using exit yield of 7.3% to 9.0% (2018: 7.0% to 9.0%) and a discount rate of 10.01% to 16.0% (2018: 10.25% to 15.0%).
The Group conducted a sensitivity analysis for all its hotel properties classified under property, plant and equipment. The sensitivity has been conducted on the Revenue Per Available Room (RevPAR), and discount rate and exit yield. Based on this sensitivity analysis: • a decrease in the discount rates and exit yields by 50bps would result in AED 142,370 thousand or 6.1% increase in the recoverable
value, whilst an increase in the discount rates and exit yields by 50bps would result in AED 127,170 thousand or 5.4% decrease in the recoverable value; and
• an increase in the RevPAR by 10% would result in AED 266,710 thousand or 11.4% increase in the recoverable value, whilst a decrease in the RevPAR by 10% would result in a similar decrease in the recoverable value.
7 INTANGIBLE ASSETS AND GOODWILLGoodwill
AED ‘000
Customer contractsAED ‘000
Computer software
AED ‘000Total
AED ‘000
CostAt 1 January 2018 – – 82,949 82,949Additions – – 4,064 4,064Acquisition of subsidiaries (note 5) 17,860 179,809 – 197,669Disposals – – (1,101) (1,101)
At 1 January 2019 17,860 179,809 85,912 283,581Additions – – 6,422 6,422
At 31 December 2019 17,860 179,809 92,334 290,003
Accumulated amortisationAt 1 January 2018 – – 77,845 77,845Charge for the year – 5,648 3,072 8,720Disposals – – (1,101) (1,101)
At 1 January 2019 – 5,648 79,816 85,464Charge for the year – 8,313 4,003 12,316
At 31 December 2019 – 13,961 83,819 97,780
Carrying amount31 December 2019 17,860 165,848 8,515 192,223
At 31 December 2018 17,860 174,161 6,096 198,117

156
Fina
ncia
l Sta
tem
ents
7 INTANGIBLE ASSETS AND GOODWILL (CONTINUED)The Group tests goodwill annually for impairment, or more frequently if there are indications that goodwill might be impaired.
The goodwill recognised by the Group relates to its hospitality and leisure business and the recoverable amount of the goodwill has been determined using a fair value less cost to sell calculation. The calculation of fair value less costs to sell was based on the following assumptions: • Gross margins – gross margins were based on the expectations of past performance and future market conditions; • Discount rates – discount rates reflect estimate of the specific risks and assumed 12%; and • Growth rate – this is based on the 5 year business plan and management expectation of future results and assumed a growth
rate of 2 to 4%.
The Group believes that no reasonably possible change in a key assumption would cause the carrying value of the goodwill to materially exceed the recoverable amount. During the year and as at 31 December 2019, there was no indication of impairment for customer contracts or computer software.
8 INVESTMENT PROPERTIES Investment properties comprise completed properties and investment properties under development (IPUD). The movement during the year is as follows:
2019 2018
Completed propertiesAED ‘000
Properties under
developmentAED ‘000
TotalAED ‘000
Completed propertiesAED ‘000
Properties under
developmentAED ‘000
TotalAED ‘000
Balance at the beginning of the year 15,126,557 1,281,746 16,408,303 15,126,457 950,092 16,076,549Additions during the year 1,170,875 53,883 1,224,758 549,425 182,852 732,277Additions as part of business
combinations (note 5) – – – 166,053 – 166,053Disposals (271,080) – (271,080) (102) – (102)Transfer from/(to):
Inventories 2,846 – 2,846 83,544 – 83,544Property, plant and equipment
(note 6) (13,665) – (13,665) 25,700 – 25,700Development work in progress
(note 13) – (205,635) (205,635) – (4,672) (4,672)Land held for sale 11,700 – 11,700 – – –From properties under development
to completed properties (note 14) 445,691 (445,691) – – – –Fair value (loss)/gain, net (246,639) (128,112) (374,751) (824,520) 153,474 (671,046)
Balance at the end of the year 16,226,285 556,191 16,782,476 15,126,557 1,281,746 16,408,303
All investment properties are located in the United Arab Emirates.
During the year, the Group sold investment properties and realised a net gain of AED 23,856 thousand (2018: nil).
Investment properties include right-of-use assets with respect to leases of plots of land of AED 349,826 thousand (2018: AED 361,023 thousand). The average lease term is 25 years. During the year, due to change in the scope of a lease agreement, the Group recorded additional right-of-use asset amounting to AED 7,662 thousand (2018: nil). There are no extension or termination options on these leases.
For the year ended 31 December 2019
Notes to the Consolidated Financial Statements (continued)

157
Ald
ar A
nnua
l Rep
ort 2
019
Certain investment properties are pledged as security against bank borrowings as disclosed under note 19.
The fair values of the investment properties including properties under development are arrived at on the basis of a valuation carried out by independent valuers not connected with the Group. The valuers are members of professional valuers’ associations and have appropriate qualifications and experience in the valuation of properties at the relevant locations. In estimating the fair value of the investment properties, the highest and best use of the properties is their current use. The valuations were mainly determined by using the income capitalisation method. The valuation has been conducted as at 31 October 2019, management believes that there have been no significant changes to the fair values of investment properties’ from 31 October 2019 to 31 December 2019. There has been no change to the valuation techniques during the year. Refer to note 4 for the key assumptions used.
The Group conducted a sensitivity analysis for thirteen largest assets in its investment property portfolio with an aggregate value of AED 13,508,960 thousand. The sensitivity has been conducted on the capitalisation rates and rental rates. Based on this sensitivity analysis: • a decrease in the capitalisation rates by 50bps would result in a AED 1,030,148 thousand or 7.6% increase in the valuation,
whilst an increase in the capitalisation rates by 50bps would result in AED 833,480 thousand 6.2% decrease in the valuation; and • an increase in the rental rates by 10% would result in an AED 1,515,658 thousand or 11.2% increase in the valuation,
whilst a decrease in the rental rates by 10% would result in AED 1,450,701 thousand or 10.7% decrease in the valuation.
It should be noted that discount rates and capitalisation rates are different than interest rates as commonly applied to borrowing rates or cost of short term and long-term debt. Discount rates and capitalisation rates are carefully derived by professional valuers in determining the fair market value of properties by using multiple valuation factors. There are interrelationships between the unobservable inputs which are generally determined by market conditions. The valuation may be affected by the interrelationship between the two noted unobservable inputs; for example, an increase in rent may be offset by an increase in the capitalisation rate, thus resulting in no net impact on the valuation. Similarly, an increase in rent in conjunction with a decrease in the capitalisation rate would amplify an increase in the value. The investment properties are categorised under Level 3 in the fair value hierarchy.
The rental income earned by the Group from its investment properties, all of which is leased out under operating leases, amounted to AED 1,719,240 thousand (2018: AED 1,731,594 thousand) and direct operating cost relating to these properties amounted to AED 344,360 thousand (2018: AED 341,482 thousand).

158
Fina
ncia
l Sta
tem
ents
9
IN
VES
TMEN
T IN
AS
SOC
IATE
S A
ND
JO
INT
VEN
TUR
ES
Ow
ners
hip
inte
rest
Vot
ing
pow
erP
lace
of
reg
istr
atio
n
Shar
e in
un
der
lyin
g
net
asse
ts
at
1 Ja
nuar
y 20
19A
ED
‘00
0
Shar
e in
cu
rren
t ye
ar’s
p
rofi
t/(lo
ss)
AE
D ‘0
00
Shar
e in
he
dg
ing
re
serv
eA
ED
‘00
0
Div
iden
ds
rece
ived
AE
D ‘0
00
Allo
cate
d
to c
urre
nt
acco
unt
of
the
asso
ciat
e/
join
ve
ntur
esA
ED
‘00
0D
isp
osal
sA
ED
‘00
0
Shar
e in
un
derl
ying
ne
t ass
ets a
t 31
Dec
embe
r 20
19A
ED ‘0
00
INV
ESTE
EA
ssoc
iate
sA
bu
Dha
bi F
inan
ce P
JSC
32%
32%
Ab
u D
hab
i14
7,8
322,
90
0–
(3,2
00
)–
–14
7,53
2A
l Sd
eira
h R
eal E
stat
e In
vest
men
t LL
C3
0%
30
%A
bu
Dha
bi
36
,652
(1,2
25)
–(1
0,5
00
)–
–24
,927
Dim
arco
Ele
ctro
nic
Syst
ems
LLC
34
%3
4%
Ab
u D
hab
i–
––
––
––
Bun
ya E
nter
pris
es L
LC33
%33
%A
bu
Dha
bi
––
––
––
–Is
kand
ar H
old
ing
s Li
mit
ed *
19%
19%
Cay
man
Isla
nds
6,0
86
––
––
–6
,08
6
190
,570
1,6
75–
(13
,70
0)
––
178
,54
5
Join
t ven
ture
sA
ldar
Bes
ix L
LC51
%50
%A
bu
Dha
bi
16,3
1375
––
––
16,3
88
Al R
aha
Inte
rnat
iona
l Int
egra
ted
Fa
cilit
ies
Man
agem
ent
LLC
(u
nder
liq
uid
atio
n)50
%50
%A
bu
Dha
bi
21,4
97
(1,4
51)
–(1
6,0
00
)–
–4
,04
6A
ldar
Eti
had
Inve
stm
ent
Pro
per
ties
LL
C50
%50
%A
bu
Dha
bi
579
,524
3,5
33(2
80
)–
–(5
82,
777)
–A
ldar
Eti
had
Firs
t In
vest
men
t P
rop
erti
es L
LC50
%50
%A
bu
Dha
bi
85,
815
1,18
9–
––
(87,
00
4)
–A
ldar
Eti
had
Dev
elo
pm
ent
LLC
50
%50
%A
bu
Dha
bi
99
,812
2,3
83
––
–(1
02,
195)
–R
oyal
Ho
use
LLC
50%
50%
Ab
u D
hab
i–
(10
,50
0)
––
10,5
00
––
Gal
axy
Bui
ldin
g M
ater
ials
LLC
(u
nder
liq
uid
atio
n)4
5%50
%A
bu
Dha
bi
––
––
––
–
80
2,9
61
(4,7
71)
(28
0)
(16
,00
0)
10,5
00
(771
,976
)20
,434
993
,531
(3,0
96
)(2
80
)(2
9,7
00
)10
,50
0(7
71,9
76)
198
,979
* Is
kan
dar
Ho
ldin
gs
Lim
ited
is c
lass
ifie
d a
s an
ass
oci
ate
of
the
Gro
up
alt
ho
ug
h th
e G
rou
p o
wn
s a
19%
ow
ner
ship
inte
rest
, as
the
Gro
up
has
sig
nifi
cant
infl
uen
ce b
y vi
rtu
e o
f it
s co
ntra
ctu
al r
ight
to
ap
po
int
2 o
ut
of
6 d
irect
ors
to
the
bo
ard
of
dire
cto
rs o
f th
e in
vest
ee.
Fo
r th
e ye
ar e
nded
31
Dec
emb
er 2
019
Not
es t
o th
e C
ons
olid
ated
Fin
anci
al S
tate
men
ts (c
ont
inue
d)

159
Ald
ar A
nnua
l Rep
ort 2
019
Latest available financial information in respect of the Group’s associates is summarised below:
2019AED ‘000
2018AED ‘000
Total assets 2,015,365 2,050,296Total liabilities (1,461,122) (1,456,112)
Net assets 554,243 594,184
Group’s share of net assets of associates 178,545 190,570
Total revenue 93,849 104,731
Total profit for the year 4,980 23,041
Latest available financial information in respect of the Group’s joint ventures is summarised below:
2019AED ‘000
2018AED ‘000
Total assets 136,985 2,453,647Total liabilities (285,749) (1,471,641)
Net (liabilities)/assets (148,764) 982,006
Group’s share of net assets of joint ventures 20,434 802,961
Total revenue 35,540 307,560
Total (loss)/profit for the year (23,650) 84,785
SHARE OF LOSSES
2019AED ‘000
2018AED ‘000
The unrecognised share of loss of an associate for the year (3,528) (8,168)
Cumulative share of loss of an associate (29,729) (26,201)
The Group has discontinued recognising share of losses from few associates as the Group does not have any legal or constructive obligation.
LOSSES ADJUSTED AGAINST THE RECEIVABLESThe Group considers that its amount receivable from one of the joint venture is part of the Group’s interest in the joint venture and, accordingly, loss recognised using the equity method in excess of the Group’s investment in ordinary shares amounting to AED 10,500 thousand (2018: AED 10,826 thousand) was applied to the Group’s receivable from the joint venture.
DISPOSAL OF JOINT VENTURESEffective 1 March 2019, the Company entered into a framework agreement with respect to share transfer whereby: • The Company acquired additional 50% ownership of Aldar Etihad Investment Properties LLC and Aldar Etihad First Investment
Properties LLC resulting in holding the entire share capital of these entities. The acquired entities did not meet the definition of business under IFRS 3 Business Combinations and hence the acquisitions have been accounted for as assets acquisitions effective 1 March 2019; and
• The Company sold its entire 50% ownership of Aldar Etihad Development LLC, a joint venture.
The above transaction resulted in derecognition of investment in joint ventures accounted for using equity method of AED 771,976 thousand. As per the agreement, the Group will receive an additional asset of AED 30,000 thousand. The Group also assumed bank borrowings in the acquired entities amounting to AED 507,601 thousand. As a result of the above transaction, the Group has also recycled to profit or loss the hedging reserve that was recorded by Aldar Etihad Investment Properties LLC as at the date of the transaction amounting to AED 1,717 thousand.
During 2018, the Company sold one of its investments in joint ventures and recognised a gain on sale of AED 30,319 thousand. As per the agreement, the Group is entitled to further compensation which is contingent based on performance of the investee. As of 31 December 2019 and 31 December 2018, fair value of the contingent consideration amounted to nil.

160
Fina
ncia
l Sta
tem
ents
10 FINANCIAL ASSETS AT FAIR VALUE THROUGH OTHER COMPREHENSIVE INCOME
2019AED ‘000
2018AED ‘000
Investment in UAE quoted securities 40,000 38,950Investment in UAE unquoted securities 15,202 15,202Investment in international unquoted securities – 41,964
55,202 96,116
Movement during the year is as follows:
2019AED ‘000
2018AED ‘000
At 1 January 96,116 119,389Additions 2,452 14,420Loss on revaluations during the year (4,962) (9,355)Capital redemptions (7,605) (28,338)Disposal (30,799) –
At 31 December 55,202 96,116
During the year, dividend income received from these investments amounted to AED 1,400 thousand (2018: AED 5,415 thousand).
During the year, the Group sold the investments in international unquoted securities having a fair value of AED 30,799 thousand. Investment revaluation reserve credit of AED 10,328 thousand was reclassified to retained earnings. The loss for the year amounted to AED 6,012 thousand.
11 TRADE AND OTHER RECEIVABLES
2019AED’000
2018AED’000
Non-current portionReceivables relating to project finance (note 11.3) 141,985 136,016Receivables from the Government of Abu Dhabi (note 11.4) – 95,000Due from associates and joint ventures (note 11.5) 174,597 176,776Others 73,601 88,914
390,183 496,706Less: allowance for expected credit loss (note 11.8) (151,257) (97,704)
238,926 399,002
2019AED’000
2018AED’000
Current portionTrade receivables (note 11.1) 2,284,156 1,827,753Refundable costs (note 11.2) 138,990 478,923Receivables relating to project finance (note 11.3) 6,938 14,941Receivables from the Government of Abu Dhabi (note 11.4) 440,907 279,258Due from associates and joint ventures (note 11.5) 25,889 25,707Gross amounts due from customer on contracts for sale of properties (note 11.6) 1,987,629 1,096,306Gross amounts due from customer on contracts to construct an asset (note 11.7) 49,397 49,397Advances and prepayments 868,320 1,109,827Accrued interest 32,767 42,572Others 649,737 475,259
6,484,730 5,399,943Less: allowance for expected credit loss (note 11.8) (273,370) (329,498)
6,211,360 5,070,445
For the year ended 31 December 2019
Notes to the Consolidated Financial Statements (continued)

161
Ald
ar A
nnua
l Rep
ort 2
019
11.1 TRADE RECEIVABLESTrade receivables mainly represent the amounts due in respect of sales of plots of land, properties and revenue from construction contracts. As at 31 December 2019, 21% of the trade receivables (2018: 25% of the trade receivables) are due from its top five customers (2018: five customers). Concentration of credit risk is mitigated by the fact that the customers have already made instalment payments, in some cases substantial, on the plots, which the Group would contractually be entitled to retain in the event of non-completion of the remaining contractual obligations in order to cover losses incurred by the Group.
2019AED’000
2018AED’000
Trade receivables 2,284,156 1,827,753Less: allowance for expected credit loss (note 11.8) (257,239) (313,367)
2,026,917 1,514,386
Interest is charged at 12% per annum on the past due amounts in respect of sales of plots and properties.
AGEING OF TRADE RECEIVABLESThe ageing of non-impaired receivables is as follows:
2019AED’000
2018AED’000
Not past due 975,216 518,843Past due (up to 180 days) 386,401 550,777Past due (more than 180 days) 665,300 444,766
2,026,917 1,514,386
11.2 REFUNDABLE COSTSRefundable costs represent costs incurred on behalf of the Government of Abu Dhabi in relation to development of infrastructure of various projects and real estate developments.
11.3 RECEIVABLES RELATING TO PROJECT FINANCE
Minimum paymentsPresent value of minimum
payments2019
AED’0002018
AED’0002019
AED’0002018
AED’000
Amounts receivable from project finance:Within one year 13,737 24,535 6,938 14,941In the second to fifth year 60,120 58,657 24,959 26,308After five years 239,201 254,401 117,026 109,708
313,058 337,593 148,923 150,957Less: unearned finance income (164,135) (186,636) – –
Present value of minimum payments receivable 148,923 150,957 148,923 150,957
11.4 RECEIVABLE FROM THE GOVERNMENT OF ABU DHABIReceivables from the Government of Abu Dhabi represent the amounts receivable against infrastructure handed over and land plots sold.

162
Fina
ncia
l Sta
tem
ents
11 TRADE AND OTHER RECEIVABLES(CONTINUED)11.5 DUE FROM ASSOCIATES AND JOINT VENTURES
Non-current Current2019
AED’0002018
AED’0002019
AED’0002018
AED’000
Gross receivables 174,597 176,776 25,889 25,707Less: allowance for expected credit loss (151,258) (97,704) (16,131) (16,131)
23,339 79,072 9,758 9,576
11.6 CONTRACTS FOR SALE OF PROPERTIESWhere contract costs incurred to date plus recognised profits less recognised losses exceed progress billings, the surplus is shown as amounts due from customers for contract work. For contracts where progress billings exceed contract costs incurred to date plus recognised profits less recognised losses, the surplus is shown as the amounts due to customers for contract work. Amounts received before the related work is performed are included in the consolidated statement of financial position, as a liability, as gross amount due to customers. Amounts billed for work performed but not yet billed to the customer are included in the consolidated statement of financial position under gross amount due from customers.
2019AED‘000
2018AED‘000
Amount due from customers included in trade and other receivables (note 11) 1,987,629 1,096,306Amount due to customers included in trade and other payables (note 23) (10,055) –
1,977,574 1,096,306
The above amount represents unbilled revenue arising from contracts for sale or properties. With respect to the above contracts, revenue aggregating to AED 4,368,000 thousand is expected to be recognised over the term of these contracts.
11.7 CONSTRUCTION CONTRACTS
2019AED‘000
2018AED‘000
Amount due from customers included in trade and other receivables (note 11) 49,397 49,397Amount due to customers included in trade and other payables (note 23) (500,670) (41,478)
(451,273) 7,919
Total contracts cost incurred plus recognised profits less recognised losses to date 4,679,263 3,859,198Less: total progress billings to date (5,130,536) (3,851,279)
(451,273) 7,919
The above amount represents (deferred)/unbilled revenue arising from contracts. With respect to the above contracts, revenue aggregating to AED 3,719,519 thousand is expected to be recognised over the period of these contracts.
11.8 ALLOWANCE FOR EXPECTED CREDIT LOSSMovement during the year in allowance of expected credit loss:
TRADE RECEIVABLES
2019AED‘000
2018AED‘000
Balance at the beginning of the year 313,367 302,466Charge for the year (note 28) 61,078 28,970Write off of provision, net (117,206) (18,069)
Balance at the end of the year 257,239 313,367
For the year ended 31 December 2019
Notes to the Consolidated Financial Statements (continued)
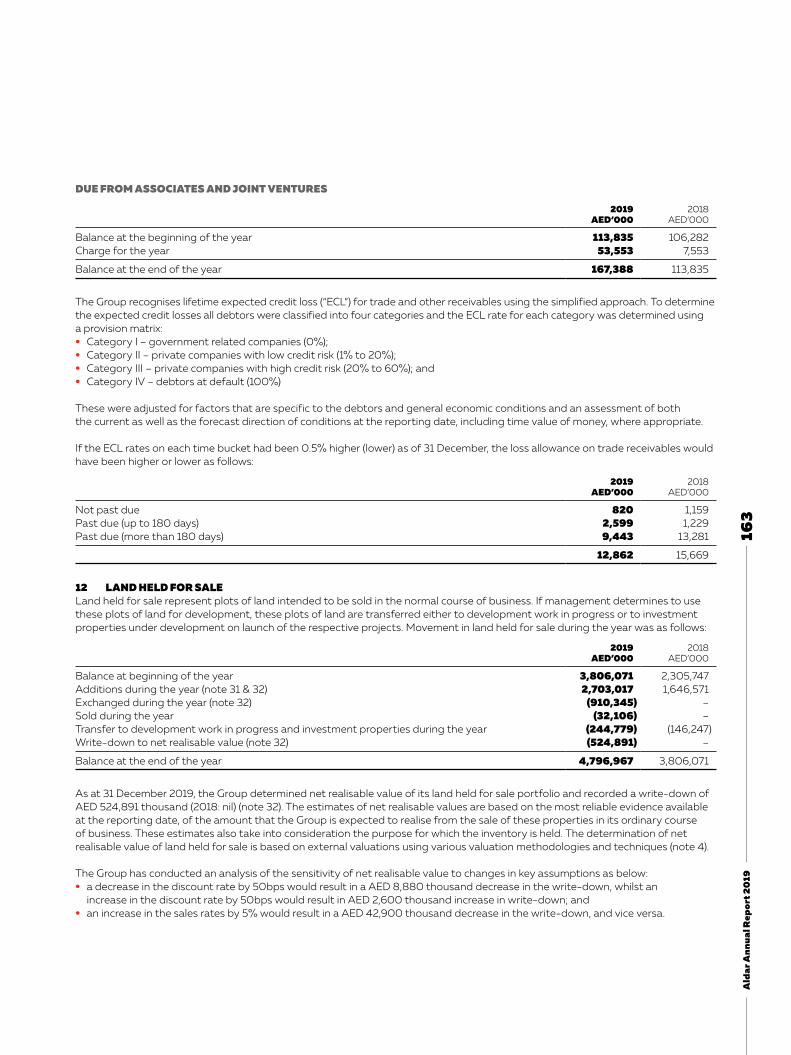
163
Ald
ar A
nnua
l Rep
ort 2
019
DUE FROM ASSOCIATES AND JOINT VENTURES
2019AED‘000
2018AED‘000
Balance at the beginning of the year 113,835 106,282Charge for the year 53,553 7,553
Balance at the end of the year 167,388 113,835
The Group recognises lifetime expected credit loss (“ECL”) for trade and other receivables using the simplified approach. To determine the expected credit losses all debtors were classified into four categories and the ECL rate for each category was determined using a provision matrix: • Category I – government related companies (0%); • Category II – private companies with low credit risk (1% to 20%); • Category III – private companies with high credit risk (20% to 60%); and • Category IV – debtors at default (100%)
These were adjusted for factors that are specific to the debtors and general economic conditions and an assessment of both the current as well as the forecast direction of conditions at the reporting date, including time value of money, where appropriate.
If the ECL rates on each time bucket had been 0.5% higher (lower) as of 31 December, the loss allowance on trade receivables would have been higher or lower as follows:
2019AED’000
2018AED’000
Not past due 820 1,159Past due (up to 180 days) 2,599 1,229Past due (more than 180 days) 9,443 13,281
12,862 15,669
12 LAND HELD FOR SALE Land held for sale represent plots of land intended to be sold in the normal course of business. If management determines to use these plots of land for development, these plots of land are transferred either to development work in progress or to investment properties under development on launch of the respective projects. Movement in land held for sale during the year was as follows:
2019AED’000
2018AED’000
Balance at beginning of the year 3,806,071 2,305,747Additions during the year (note 31 & 32) 2,703,017 1,646,571Exchanged during the year (note 32) (910,345) –Sold during the year (32,106) –Transfer to development work in progress and investment properties during the year (244,779) (146,247)Write-down to net realisable value (note 32) (524,891) –
Balance at the end of the year 4,796,967 3,806,071
As at 31 December 2019, the Group determined net realisable value of its land held for sale portfolio and recorded a write-down of AED 524,891 thousand (2018: nil) (note 32). The estimates of net realisable values are based on the most reliable evidence available at the reporting date, of the amount that the Group is expected to realise from the sale of these properties in its ordinary course of business. These estimates also take into consideration the purpose for which the inventory is held. The determination of net realisable value of land held for sale is based on external valuations using various valuation methodologies and techniques (note 4).
The Group has conducted an analysis of the sensitivity of net realisable value to changes in key assumptions as below: • a decrease in the discount rate by 50bps would result in a AED 8,880 thousand decrease in the write-down, whilst an
increase in the discount rate by 50bps would result in AED 2,600 thousand increase in write-down; and • an increase in the sales rates by 5% would result in a AED 42,900 thousand decrease in the write-down, and vice versa.

164
Fina
ncia
l Sta
tem
ents
13 DEVELOPMENT WORK IN PROGRESSDevelopment work in progress represents development and construction costs incurred on properties being constructed for sale in the ordinary course of business. Movement during the year is as follows:
2019AED’000
2018AED’000
Balance at beginning of the year 2,473,374 1,476,818Development costs incurred during the year 2,571,976 2,520,606Recognised in costs of properties sold (1,693,776) (1,307,628)Exchanged during the year (note 32) (772,197) –Write-off of project costs (note 28) (16,503) (3,348)Transfers from/(to):
Land held for sale (note 12) 233,079 144,505Inventories (note 14) (454,616) (359,033)Investment properties (note 8) 205,635 4,672Property, plant and equipment (note 6) – (3,218)
Balance at the end of the year 2,546,972 2,473,374
All development work in progress projects are located in the United Arab Emirates.
14 INVENTORIES
2019AED ‘000
2018AED ‘000
Completed properties 1,005,499 402,190Other operating inventories 47,287 66,954
1,052,786 469,144
During the year, completed properties with an aggregate value of AED 454,616 thousand (2018: AED 359,033 thousand) were transferred to inventories from development work in progress upon completion (note 13).
During the year, an amount of AED 90,539 thousand was recognised as direct costs (2018: AED 93,023 thousand). Completed properties in inventories are located in the United Arab Emirates.
During the year, in line with terms of sales purchase agreements for development projects, the Group reacquired properties with a fair value of AED 248,485 thousand (2018: AED 15,775 thousand) due to contractual non-performance of counter parties. These properties were classified as inventory based on their nature.
15 CASH AND CASH EQUIVALENTS
2019AED ‘000
2018AED ‘000
Cash and bank balances 3,161,327 3,313,498Short term deposits held with banks 2,524,915 1,701,109
Cash and bank balances 5,686,242 5,014,607Short term deposits with original maturities greater than three months (291,544) (878,000)Restricted bank balances (3,104,586) (2,742,249)
Cash and cash equivalents 2,290,112 1,394,358
During the previous year, the Group held amounts related to one of its associate in addition to community service charges and security deposits on behalf of the owners of units in certain buildings or communities that are managed by the Group. As at 31 December 2019, cash at banks amounting to AED 650,968 thousand (2018: AED 624,421 thousand) are not included in the Group’s bank balances as it is held by the Company on behalf of third parties since the Group is not acting as a principal. Restricted cash and bank balances include balances amounting to AED 834,080 thousand (2018: AED 1,159,502 thousand) which are deposited into escrow accounts representing cash received from customers against sale of development properties. The remaining balance of restricted cash balances mainly represents cash balances designated against government projects and dividend payables for which separate bank accounts are maintained.
For the year ended 31 December 2019
Notes to the Consolidated Financial Statements (continued)
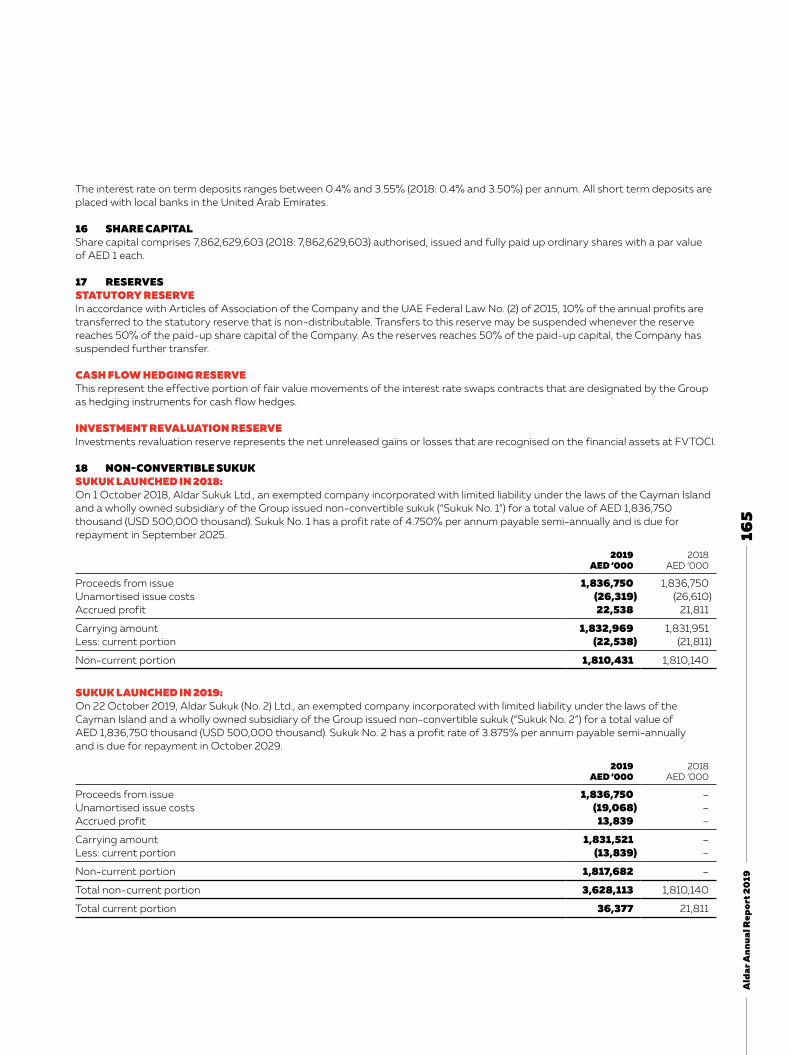
165
Ald
ar A
nnua
l Rep
ort 2
019
The interest rate on term deposits ranges between 0.4% and 3.55% (2018: 0.4% and 3.50%) per annum. All short term deposits are placed with local banks in the United Arab Emirates.
16 SHARE CAPITALShare capital comprises 7,862,629,603 (2018: 7,862,629,603) authorised, issued and fully paid up ordinary shares with a par value of AED 1 each.
17 RESERVESSTATUTORY RESERVEIn accordance with Articles of Association of the Company and the UAE Federal Law No. (2) of 2015, 10% of the annual profits are transferred to the statutory reserve that is non-distributable. Transfers to this reserve may be suspended whenever the reserve reaches 50% of the paid-up share capital of the Company. As the reserves reaches 50% of the paid-up capital, the Company has suspended further transfer.
CASH FLOW HEDGING RESERVEThis represent the effective portion of fair value movements of the interest rate swaps contracts that are designated by the Group as hedging instruments for cash flow hedges.
INVESTMENT REVALUATION RESERVEInvestments revaluation reserve represents the net unreleased gains or losses that are recognised on the financial assets at FVTOCI.
18 NON-CONVERTIBLE SUKUKSUKUK LAUNCHED IN 2018:On 1 October 2018, Aldar Sukuk Ltd., an exempted company incorporated with limited liability under the laws of the Cayman Island and a wholly owned subsidiary of the Group issued non-convertible sukuk (“Sukuk No. 1”) for a total value of AED 1,836,750 thousand (USD 500,000 thousand). Sukuk No. 1 has a profit rate of 4.750% per annum payable semi-annually and is due for repayment in September 2025.
2019AED ‘000
2018AED ‘000
Proceeds from issue 1,836,750 1,836,750Unamortised issue costs (26,319) (26,610)Accrued profit 22,538 21,811
Carrying amount 1,832,969 1,831,951Less: current portion (22,538) (21,811)
Non-current portion 1,810,431 1,810,140
SUKUK LAUNCHED IN 2019:On 22 October 2019, Aldar Sukuk (No. 2) Ltd., an exempted company incorporated with limited liability under the laws of the Cayman Island and a wholly owned subsidiary of the Group issued non-convertible sukuk (“Sukuk No. 2”) for a total value of AED 1,836,750 thousand (USD 500,000 thousand). Sukuk No. 2 has a profit rate of 3.875% per annum payable semi-annually and is due for repayment in October 2029.
2019AED ‘000
2018AED ‘000
Proceeds from issue 1,836,750 –Unamortised issue costs (19,068) –Accrued profit 13,839 –
Carrying amount 1,831,521 –Less: current portion (13,839) –
Non-current portion 1,817,682 –
Total non-current portion 3,628,113 1,810,140
Total current portion 36,377 21,811

166
Fina
ncia
l Sta
tem
ents
19
BA
NK
BO
RR
OW
ING
S
Out
stan
ding
am
ount
Cur
rent
AED
’00
0N
on-c
urre
ntA
ED’0
00
Tota
lA
ED’0
00
Secu
rity
Inte
rest
rate
Mat
urit
yP
urpo
se
31 D
ecem
ber 2
019
:Ija
rah
faci
lity
–4
20,0
00
420
,00
0Se
cure
dre
leva
nt E
IBO
R +
1.5
0%
Mar
ch 2
023
Gen
eral
cor
pora
te p
urpo
seTe
rm lo
an–
500
,00
050
0,0
00
Secu
red
rele
vant
EIB
OR
+ 1
.00
%Se
ptem
ber 2
023
Gen
eral
cor
pora
te p
urpo
seR
evo
lvin
g C
red
it
Faci
lity
62,
500
1,6
02,
00
01,
66
4,5
00
Uns
ecur
edre
leva
nt E
IBO
R +
1.0
0%
Dec
embe
r 20
22G
ener
al c
orpo
rate
pur
pose
Term
loan
–50
0,0
00
500
,00
0Se
cure
dre
leva
nt U
SD L
IBO
R +
1.2
5%A
ugus
t 20
21G
ener
al c
orpo
rate
pur
pose
Term
loan
–4
00
,00
04
00
,00
0Se
cure
dre
leva
nt E
IBO
R +
1.0
0%
Aug
ust 2
023
Gen
eral
cor
pora
te p
urpo
seTe
rm lo
an–
500
,00
050
0,0
00
Secu
red
rele
vant
USD
LIB
OR
+ 1
.30
%A
ugus
t 20
23G
ener
al c
orpo
rate
pur
pose
Term
loan
–50
0,0
00
500
,00
0Se
cure
dre
leva
nt E
IBO
R +
1.0
0%
Sept
embe
r 20
23G
ener
al c
orpo
rate
pur
pose
Una
mo
rtis
ed
bo
rrow
ing
co
st–
(14
,58
3)(1
4,5
83)
Acc
rual
fo
r in
tere
st
and
pro
fits
12,7
26–
12,7
26
75,2
264
,40
7,4
174
,48
2,6
43
31 D
ecem
ber
20
18:
Ijara
h fa
cilit
y28
0,0
00
–28
0,0
00
Secu
red
rele
vant
EIB
OR
+ 1
.40
%Ju
ly 2
019
Gen
eral
co
rpo
rate
pur
po
seTe
rm lo
an–
500
,00
050
0,0
00
Secu
red
rele
vant
USD
LIB
OR
+ 1
.25%
Aug
ust
2021
Gen
eral
co
rpo
rate
pur
po
seR
evo
lvin
g C
red
it
Faci
lity
62,
500
2,0
84
,50
02,
147,
00
0U
nsec
ured
rele
vant
EIB
OR
+ 1
.00
%D
ecem
ber
20
22G
ener
al c
orp
ora
te p
urp
ose
Term
loan
–4
00
,00
04
00
,00
0Se
cure
dre
leva
nt E
IBO
R +
1.8
0%
Aug
ust
2023
Gen
eral
co
rpo
rate
pur
po
seTe
rm lo
an–
500
,00
050
0,0
00
Secu
red
rele
vant
USD
LIB
OR
+ 1
.30
%A
ugus
t 20
23G
ener
al c
orp
ora
te p
urp
ose
Term
loan
–50
0,0
00
500
,00
0Se
cure
dre
leva
nt E
IBO
R +
1.0
0%
Sep
tem
ber
20
23G
ener
al c
orp
ora
te p
urp
ose
Term
loan
–50
0,0
00
500
,00
0Se
cure
dre
leva
nt E
IBO
R +
1.0
0%
Sep
tem
ber
20
23G
ener
al c
orp
ora
te p
urp
ose
Term
loan
–4
00
,00
04
00
,00
0Se
cure
dre
leva
nt E
IBO
R +
2.1
2%A
ugus
t 20
26G
ener
al c
orp
ora
te p
urp
ose
Una
mo
rtis
ed
bo
rrow
ing
co
st–
(19
,019
)(1
9,0
19)
Acc
rual
fo
r in
tere
st
and
pro
fits
16,0
12–
16,0
12
358
,512
4,8
65,
48
15,
223
,993
Fo
r th
e ye
ar e
nded
31
Dec
emb
er 2
019
Not
es t
o th
e C
ons
olid
ated
Fin
anci
al S
tate
men
ts (c
ont
inue
d)

167
Ald
ar A
nnua
l Rep
ort 2
019
As at 31 December 2019, the Group had AED 3.43 billion of undrawn, committed revolving credit facilities in the form of bilateral agreements with two financial institutions having a maturity for AED 3.19 billion in December 2022 and for AED 240 million in March 2023. As at 31 December 2019, all these facilities remained committed and undrawn.
In May 2018, the Group entered into a transaction with a financial institution of AED 5,000,000 thousand (“Revolving Credit Facility”). The Revolving Credit Facility involves a borrowing that is collateralised against a deposit with the same financial institution in line with the facility documents. The facility documents provide a right to the lender whereby the Group has authorised and directed the financial institution to set off the deposit and any interest accrued against any amount due and payable by the Group. The arrangement met the requirements of offsetting under IAS 32 Financial Instruments: Presentation since the Group has an enforceable right to set off the recognised amounts and the Group intends to settle on net basis, or to realise the asset and settle the liability simultaneously. This resulted in the presentation of a net borrowing in the consolidated statement of financial position. As at 31 December 2019, the net borrowing was AED 1,664,500 thousand (borrowing of AED 4,850,000 thousand less deposit of AED 3,185,500 thousand). The net borrowing is unsecured, carries interest at relevant EIBOR + 1%, drawn for general corporate purposes and repayable in semi-annual instalments of AED 31,250 thousand each. The deposit earns interest at 0.75% plus 3 months EIBOR.
Certain bank borrowings are secured in the form of mortgage over plots of land (AED 827,714 thousand) and operating assets (AED 2,913,377 thousand) and carry a net worth covenant.
Borrowings repaid during the year amounted to AED 1,162,500 thousand (2018: AED 4,319,889 thousand).
20 LEASE LIABILITIES
2019AED‘000
2018AED‘000
Year 1 87,711 103,015Year 2 68,293 69,534Year 3 41,713 44,175Year 4 37,106 38,879Year 5 37,136 33,910Onwards 341,198 371,546
Balance at the end of the year 613,157 661,059Less unearned interest (100,817) (131,161)
512,340 529,898
Non-current 431,559 430,703
Current 80,781 99,195
21 EMPLOYEES BENEFITS
2019AED‘000
2018AED‘000
Employees’ end-of-service benefits 155,094 145,479Long term incentive scheme 12,370 5,231
Balance at the end of the year 167,464 150,710
END-OF-SERVICE BENEFITSMovements in the provision for employees’ end of service benefits are as follows:
2019AED‘000
2018AED‘000
Balance at the beginning of the year 145,479 141,763Acquired through business combination (note 5) – 3,704Charge for the year 39,154 36,687Paid during the year (29,539) (36,675)
Balance at the end of the year 155,094 145,479
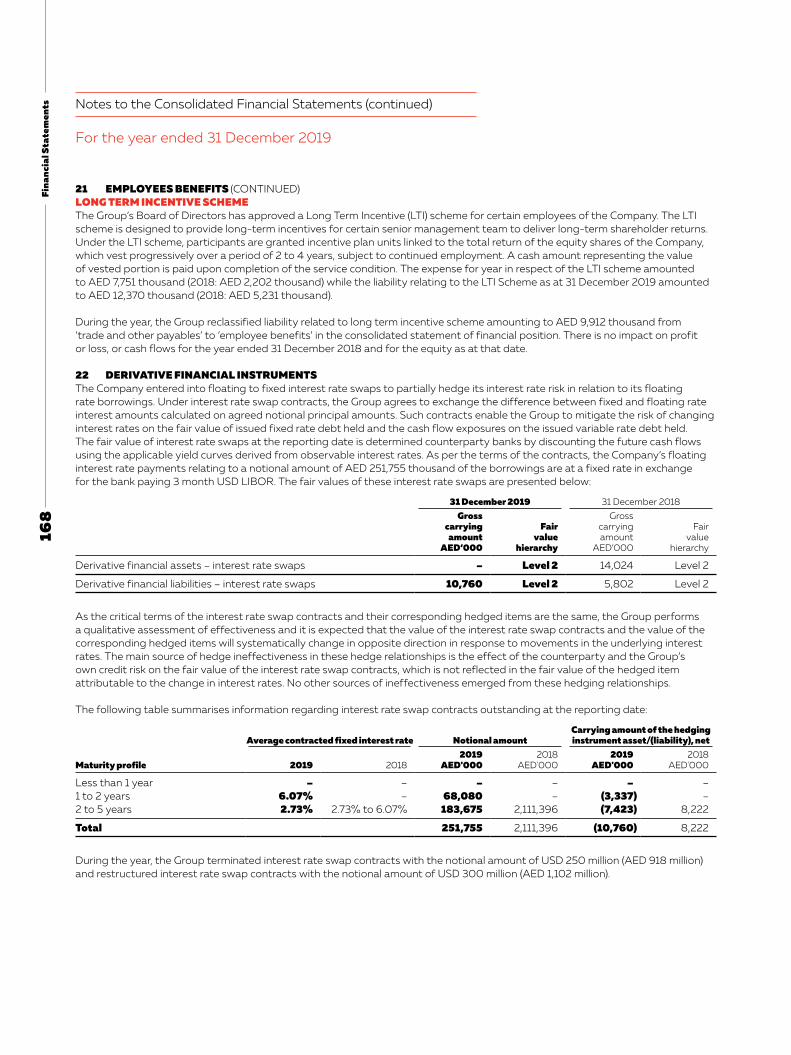
168
Fina
ncia
l Sta
tem
ents
21 EMPLOYEES BENEFITS (CONTINUED)LONG TERM INCENTIVE SCHEMEThe Group’s Board of Directors has approved a Long Term Incentive (LTI) scheme for certain employees of the Company. The LTI scheme is designed to provide long-term incentives for certain senior management team to deliver long-term shareholder returns. Under the LTI scheme, participants are granted incentive plan units linked to the total return of the equity shares of the Company, which vest progressively over a period of 2 to 4 years, subject to continued employment. A cash amount representing the value of vested portion is paid upon completion of the service condition. The expense for year in respect of the LTI scheme amounted to AED 7,751 thousand (2018: AED 2,202 thousand) while the liability relating to the LTI Scheme as at 31 December 2019 amounted to AED 12,370 thousand (2018: AED 5,231 thousand).
During the year, the Group reclassified liability related to long term incentive scheme amounting to AED 9,912 thousand from ‘trade and other payables’ to ‘employee benefits’ in the consolidated statement of financial position. There is no impact on profit or loss, or cash flows for the year ended 31 December 2018 and for the equity as at that date.
22 DERIVATIVE FINANCIAL INSTRUMENTSThe Company entered into floating to fixed interest rate swaps to partially hedge its interest rate risk in relation to its floating rate borrowings. Under interest rate swap contracts, the Group agrees to exchange the difference between fixed and floating rate interest amounts calculated on agreed notional principal amounts. Such contracts enable the Group to mitigate the risk of changing interest rates on the fair value of issued fixed rate debt held and the cash flow exposures on the issued variable rate debt held. The fair value of interest rate swaps at the reporting date is determined counterparty banks by discounting the future cash flows using the applicable yield curves derived from observable interest rates. As per the terms of the contracts, the Company’s floating interest rate payments relating to a notional amount of AED 251,755 thousand of the borrowings are at a fixed rate in exchange for the bank paying 3 month USD LIBOR. The fair values of these interest rate swaps are presented below:
31 December 2019 31 December 2018
Grosscarrying
amount AED’000
Fair value
hierarchy
Grosscarrying amount
AED’000
Fair value
hierarchy
Derivative financial assets – interest rate swaps – Level 2 14,024 Level 2
Derivative financial liabilities – interest rate swaps 10,760 Level 2 5,802 Level 2
As the critical terms of the interest rate swap contracts and their corresponding hedged items are the same, the Group performs a qualitative assessment of effectiveness and it is expected that the value of the interest rate swap contracts and the value of the corresponding hedged items will systematically change in opposite direction in response to movements in the underlying interest rates. The main source of hedge ineffectiveness in these hedge relationships is the effect of the counterparty and the Group’s own credit risk on the fair value of the interest rate swap contracts, which is not reflected in the fair value of the hedged item attributable to the change in interest rates. No other sources of ineffectiveness emerged from these hedging relationships.
The following table summarises information regarding interest rate swap contracts outstanding at the reporting date:
Maturity profile
Average contracted fixed interest rate Notional amountCarrying amount of the hedging instrument asset/(liability), net
2019 20182019
AED'000 2018
AED'0002019
AED'000 2018
AED'000
Less than 1 year – – – – – – 1 to 2 years 6.07% – 68,080 – (3,337) – 2 to 5 years 2.73% 2.73% to 6.07% 183,675 2,111,396 (7,423) 8,222
Total 251,755 2,111,396 (10,760) 8,222
During the year, the Group terminated interest rate swap contracts with the notional amount of USD 250 million (AED 918 million) and restructured interest rate swap contracts with the notional amount of USD 300 million (AED 1,102 million).
For the year ended 31 December 2019
Notes to the Consolidated Financial Statements (continued)

169
Ald
ar A
nnua
l Rep
ort 2
019
Movement in the cash flow hedging reserve was as following:
2019AED‘000
Balance at the beginning of the year 70,547Cumulative fair value loss arising on hedging instruments during the year classified under cash flow hedges (96,104)Cumulative loss arising on hedging instruments reclassified to profit or loss (note 30) (9,362)Fair value loss arising on hedging instruments during the year classified under cash flow hedges of a joint
venture (note 9) (280)Cumulative loss arising on hedging instruments of a joint venture reclassified to profit or loss upon
derecognition (note 9) 1,717
Balance at the end of the year (33,482)
23 TRADE AND OTHER PAYABLES
2019AED‘000
2018AED‘000
Trade payables 431,239 467,694Accrual for contractors’ costs 2,375,587 1,738,118Advances from the Government of Abu Dhabi 416,559 1,285,612Deferred income 305,191 363,082Dividends payable 90,659 91,701Provision for onerous contracts 14,880 31,501Gross amount due to customers on contracts for sale of properties (note 11.6) 10,055 –Gross amount due to customers on contracts to construct an asset (note 11.7) 500,670 41,478Due to the Government of Abu Dhabi 1,123,868 640,657Other liabilities 856,506 829,207
6,125,214 5,489,050
The Group has financial and risk management policies in place to ensure that all payables are paid within the pre-agreed credit terms.
24 REVENUE
2019AED‘000
2018AED‘000
Property development and management 3,097,018 2,440,058Asset management and adjacencies 4,050,863 3,846,475
7,147,881 6,286,533
25 DIRECT COSTS
2019AED‘000
2018AED‘000
Property development and management 1,944,745 1,344,714Asset management and adjacencies 2,433,492 2,310,132
4,378,237 3,654,846
26 SELLING AND MARKETING EXPENSES
2019AED‘000
2018AED‘000
Corporate advertising 37,272 19,782Exhibitions and sponsorships 22,919 17,494Project marketing 49,331 48,164
109,522 85,440

170
Fina
ncia
l Sta
tem
ents
27 STAFF COSTS
2019AED‘000
2018AED‘000
Salaries, bonuses and other benefits 847,380 799,943Employees’ end of service benefits (note 21) 39,154 36,687Staff training and development 3,639 2,740
890,173 839,370
Staff costs allocated to:Direct costs 625,049 604,207General and administrative expenses 237,423 218,948Projects under development 27,701 16,215
890,173 839,370
28 PROVISIONS, IMPAIRMENTS AND WRITE-DOWNS, NET
2019AED‘000
2018AED‘000
Reversal of impairment of property, plant and equipment, net (note 6) (29,186) (22,507)Provision for expected credit losses, net (note 11.8) 61,078 28,970Provision on due from associates and joint ventures 46,000 –Receivables written-off 1,167 21,143(Release)/provision for onerous contracts (6,842) 12,126Write-off of development work in progress (note 13) 16,503 3,348Others 63,955 6,968
152,675 50,048
Others mainly include provisions recorded in respect of cost overruns on certain projects.
29 FINANCE INCOME
2019AED‘000
2018AED‘000
Interest/profit earned on:Islamic deposits 22,321 27,236Bank fixed deposits 14,172 11,942Call and current accounts 24,231 18,536
Total interest/profit earned 60,724 57,714Financing income earned on receivables from project finance 12,238 12,904Other finance income 11,125 9,117
84,087 79,735
Finance income earned on financial assets, analysed by category of asset is as follows:
2019AED‘000
2018AED‘000
Loans and receivables 23,363 22,021Bank balances and deposits 60,724 57,714
84,087 79,735
For the year ended 31 December 2019
Notes to the Consolidated Financial Statements (continued)

171
Ald
ar A
nnua
l Rep
ort 2
019
30 FINANCE COSTS
2019AED‘000
2018AED‘000
Finance costs on bank borrowings and non-convertible sukuk 317,152 287,547Unwinding of finance cost on operating lease liability (note 36.2) 23,205 19,002
340,357 306,549Cumulative loss arising on hedging instruments reclassified to profit or loss 9,362 3,200
349,719 309,749
31 OTHER INCOME
2019AED‘000
2018AED‘000
Government grant income recorded upon handover of infrastructure assets (note 35) 115,707 466,932Release of infrastructure accruals and other accruals 44,752 127,088Gain on business combination (note 5) – 132,791Others 97,928 41,057
258,387 767,868
Others include an amount of AED 60,942 thousand representing fair value of a plot of land acquired from TDIC pursuant to a warranty claim settlement under the framework agreement (note 5).
32 GAIN ON EXCHANGE OF PROPERTIES, NET OF WRITE-DOWNS
2019AED‘000
2018AED‘000
Gain on exchange of properties (i) 913,275 –Write-down of land held for sale to net realisable value (note 12) (524,891) –
388,384 –
(i) During the year, the Executive Counsel of the Government of Abu Dhabi resolved to exchange plots of land with the Group in a transaction that exchanged developable land resources in line with the parties’ strategic priorities. The Group received infrastructure enabled land that has a gross floor area (“GFA”) of approximately 3 million sqm split equally between the prime areas of Saadiyat Cultural District and Mina Zayed, both properties situated in the Emirate of Abu Dhabi. The Government of Abu Dhabi received plots of land with a comparable GFA in Al Raha Beach West, Lulu Island along with certain plots inside the Abu Dhabi Island that were not part of the Group’s development strategy in the foreseeable future. The fair value of the plots of land received amounted to AED 2,606,443 thousand while the carrying values of the plots of land given were AED 1,683,167 thousand (inclusive of plots with nominal carrying value of AED 1), resulting in a gain of AED 913,275 thousand which was recorded in the consolidated income statement as gain on exchange of properties.
33 EARNINGS PER SHAREBasic earnings per share amounts are calculated by dividing profit for the year attributable to ordinary equity holders of the parent by the weighted average number of ordinary shares outstanding during the year. As there are no dilutive instruments outstanding, basic and diluted earnings per share are identical.
The calculation of basic and diluted earnings per share attributable to the owners of the Company is based on the following data:
2019 2018
Earnings (AED ‘000)Earnings for the purpose of basic and diluted earnings per share (profit for the year
attributable to owners of the Company) 1,984,097 1,855,808
Weighted average number of sharesWeighted average number of ordinary shares for the purpose of basic and diluted earnings
per share 7,862,629,603 7,862,629,603
Basic and diluted earnings per share attributable to Owners of the Company in AED 0.252 0.236

172
Fina
ncia
l Sta
tem
ents
34 DIVIDENDSAt the annual general assembly held on 20 March 2019, the shareholders approved the recommendation of the Board of Directors to distribute dividends of 14 fils per share for a total of AED 1,100,768 thousand. The Board of Directors, in their meeting held on 12 February 2020, proposed a cash dividend of 14.5 fils per share for the year ended 31 December 2019. The proposed dividend is subject to approval of the Shareholders at the annual general assembly.
35 TRANSACTIONS AND BALANCES WITH RELATED PARTIESParties are considered to be related if one party has the ability to control the other party or exercise significant influence over the other party in making financial or operational decisions. Related parties comprise of major shareholder, associated companies, the Government of Abu Dhabi, directors, key management personnel of the Group and their related entities. The terms of these transactions are approved by the Group's management and are made on terms agreed by the Board of Directors or management. The Government of Abu Dhabi is an indirect major shareholder of the Company.
RELATED PARTY BALANCES:
2019AED‘000
2018AED‘000
Government of Abu DhabiTrade and other receivables 883,884 1,066,984Trade and other payables (1,485,707) (640,657)Advances received (note 23) (416,559) (1,285,612)
Major shareholder and its affiliatesTrade and other receivables 29,759 47,685Trade and other payables (12,571) (13,229)
Due from associates and joint ventures 33,098 88,648
Due to joint ventures for project-related work (32,692) (32,692)
The amounts outstanding are unsecured and will be settled in cash. No guarantees have been given or received. Other than as disclosed in note 11.8 for allowance of expected credit losses against due form associates and joint ventures, no provision have been made for doubtful debts in respect of the amounts owned by related parties. Certain receivables from joint ventures carry interest of 9% per annum and are repayable within 2 to 5 years.
Significant transactions with related parties during the year are as follows in addition to transactions described in note 9:
2019AED‘000
2018AED‘000
Government of Abu DhabiRevenue 741,849 444,435Government grant income recorded upon handover of infrastructure assets (note 35.1) 115,707 466,932Gain on exchange of properties (note 32) 913,275 –
Major shareholder and its affiliatesRevenue 45,786 24,876
Finance income 8,982 6,798
Finance income from project finance and joint ventures 7,553 12,150
Key management compensationSalaries, bonuses and other benefits 9,366 10,805Post-employment benefits 2,013 1,435Long term incentives 6,270 1,717
17,649 13,957
Directors’ remuneration 16,075 19,279
35.1 The amount and timing of the infrastructure cost reimbursement is subject to the completion of certain audit and technical inspections and assessments to be performed by the relevant government authority. Once these activities are completed, there will be reasonable assurance that the grant will be received and at that point it will be recognised as a deferred government grant. Once the conditions of the grant are met, i.e. infrastructure assets are handed over to the designated authorities, the deferred government grant will be recognised income statement. During the year, an amount of AED 115,707 thousand was recognised as government grant income upon handover of infrastructure assets (2018: AED 466,932 thousand) (note 31).
For the year ended 31 December 2019
Notes to the Consolidated Financial Statements (continued)

173
Ald
ar A
nnua
l Rep
ort 2
019
35.2 Outstanding borrowings of AED 3,064,500 thousand (2018: AED 3,947,000 thousand) are due to the banks controlled by the Government and major shareholder. Finance cost on these borrowings amounted to AED 176,910 thousand for the year ended 31 December 2019 (2018: AED 110,760 thousand).
35.3 Deposits and bank balances of AED 4,135,072 thousand (2018: AED 3,527,049 thousand) are kept with banks controlled by the Government and major shareholder. Finance income on these deposits amounted to AED 36,530 thousand for the year ended 31 December 2019 (2018: AED 30,415 thousand).
35.4 Letter of credits and bank guarantees issued through banks controlled by the Government and major shareholder amounted to AED 130,847 thousand for the year ended 31 December 2019 (2018: AED 361,645 thousand).
36 CONTINGENCIES AND COMMITMENTS 36.1 CAPITAL COMMITMENTS
Capital expenditure contracted but not yet incurred at the end of the year is as follows:
2019AED‘000
2018AED‘000
Projects under development 2,600,863 4,135,230Reimbursable projects works in progress 2,239,164 1,135,018Others – 4,357
4,840,027 5,274,605
The above commitments are spread over a period of one to five years.
The Group has outstanding advances to the suppliers and contractors amounting to AED 642,826 thousand (2018: AED 905,749 thousand) against the above commitments.
36.2 OPERATING LEASE COMMITMENTSThe Group has leased out certain properties. The amounts of committed future lease inflows are as follows:
THE GROUP AS LESSOR
2019AED‘000
2018AED‘000
Buildings:Within one year 835,379 762,555In the second to fifth year 1,950,133 1,434,533After five years 1,426,485 507,262
4,211,997 2,704,350
THE GROUP AS A LESSEE
2019AED‘000
2018AED‘000
Unwinding of interest expense on lease liabilities during the period (note 30) 23,205 19,002
Expense relating to short-term leases – 2,638
Total cash outflow in respect of leases 42,011 54,851
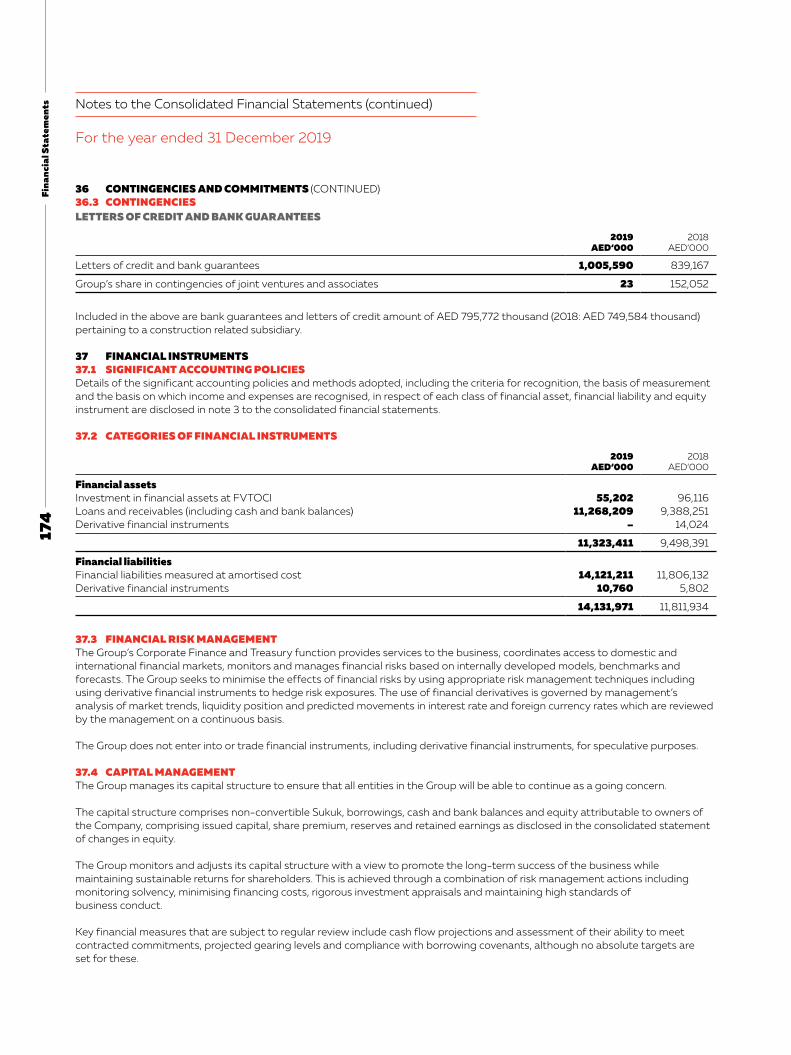
174
Fina
ncia
l Sta
tem
ents
36 CONTINGENCIES AND COMMITMENTS (CONTINUED)36.3 CONTINGENCIESLETTERS OF CREDIT AND BANK GUARANTEES
2019AED‘000
2018AED‘000
Letters of credit and bank guarantees 1,005,590 839,167
Group’s share in contingencies of joint ventures and associates 23 152,052
Included in the above are bank guarantees and letters of credit amount of AED 795,772 thousand (2018: AED 749,584 thousand) pertaining to a construction related subsidiary.
37 FINANCIAL INSTRUMENTS37.1 SIGNIFICANT ACCOUNTING POLICIESDetails of the significant accounting policies and methods adopted, including the criteria for recognition, the basis of measurement and the basis on which income and expenses are recognised, in respect of each class of financial asset, financial liability and equity instrument are disclosed in note 3 to the consolidated financial statements.
37.2 CATEGORIES OF FINANCIAL INSTRUMENTS
2019AED‘000
2018AED‘000
Financial assetsInvestment in financial assets at FVTOCI 55,202 96,116Loans and receivables (including cash and bank balances) 11,268,209 9,388,251Derivative financial instruments – 14,024
11,323,411 9,498,391
Financial liabilitiesFinancial liabilities measured at amortised cost 14,121,211 11,806,132Derivative financial instruments 10,760 5,802
14,131,971 11,811,934
37.3 FINANCIAL RISK MANAGEMENTThe Group’s Corporate Finance and Treasury function provides services to the business, coordinates access to domestic and international financial markets, monitors and manages financial risks based on internally developed models, benchmarks and forecasts. The Group seeks to minimise the effects of financial risks by using appropriate risk management techniques including using derivative financial instruments to hedge risk exposures. The use of financial derivatives is governed by management’s analysis of market trends, liquidity position and predicted movements in interest rate and foreign currency rates which are reviewed by the management on a continuous basis.
The Group does not enter into or trade financial instruments, including derivative financial instruments, for speculative purposes.
37.4 CAPITAL MANAGEMENTThe Group manages its capital structure to ensure that all entities in the Group will be able to continue as a going concern.
The capital structure comprises non-convertible Sukuk, borrowings, cash and bank balances and equity attributable to owners of the Company, comprising issued capital, share premium, reserves and retained earnings as disclosed in the consolidated statement of changes in equity.
The Group monitors and adjusts its capital structure with a view to promote the long-term success of the business while maintaining sustainable returns for shareholders. This is achieved through a combination of risk management actions including monitoring solvency, minimising financing costs, rigorous investment appraisals and maintaining high standards of business conduct.
Key financial measures that are subject to regular review include cash flow projections and assessment of their ability to meet contracted commitments, projected gearing levels and compliance with borrowing covenants, although no absolute targets are set for these.
For the year ended 31 December 2019
Notes to the Consolidated Financial Statements (continued)

175
Ald
ar A
nnua
l Rep
ort 2
019
The Group monitors its cost of debt on a regular basis. At 31 December 2019, the weighted average cost of debt was 3.84% (2018: 4.01%). Investment and development opportunities are evaluated against an appropriate equity return in order to ensure that long-term shareholder value is created.
The covenants of seven (2018: seven) borrowing arrangements require maintaining a minimum tangible net worth. Three loans require a minimum tangible net worth of AED 6 billion of the Group and four loans require a minimum tangible net worth of AED 4 billion of a subsidiary.
37.5 MARKET RISK MANAGEMENTMarket risk is the risk that the fair value or future cash flows of a financial asset or liability will fluctuate because of changes in market prices. Market risk comprises three types of risk: foreign currency risk, interest rate risk and other price risk.
A) FOREIGN CURRENCY RISK MANAGEMENTThe Group has no significant cross-border trading transactions and therefore, foreign exchange transaction exposure is negligible. However, it does borrow money in foreign currencies primarily in US Dollars. The Group's currency exposure therefore is in relation to the repayment of loans and also the translation risk associated with converting outstanding loan balances back into UAE Dirhams in the Group consolidated financial statements at the end of each reporting period. The exchange rate between UAE Dirhams and US Dollars is fixed and therefore the Group considers foreign exchange risk associated with repayment of loans and translation as minimum.
FOREIGN CURRENCY SENSITIVITY ANALYSISThe carrying amounts of the Group’s foreign currency denominated monetary assets and liabilities at the end of the reporting period are as follows:
Liabilities Assets2019
AED’0002018
AED’0002019
AED’0002018
AED’000
US Dollar 4,708,877 2,849,652 418,969 682,291Saudi Riyal 9,762 9,185 41,682 42,230Euro 276 89 – –Pound Sterling – 60 – –
4,718,915 2,858,986 460,651 724,521
There is no significant impact of the US Dollar as the UAE Dirham is pegged to the US Dollar. Also, the Saudi Riyal is pegged to the US Dollar.
B) INTEREST RATE RISK MANAGEMENTThe Group is exposed to interest rate risk as the Group is funded with both fixed and floating interest rate debt. The risk is managed by the Group by maintaining an appropriate mix between fixed and floating rate borrowings, by the use of interest rate swap contracts.
The Group’s exposures to interest rates on financial assets and financial liabilities are detailed in notes 15, 18, and 19.
INTEREST RATE SENSITIVITY ANALYSISThe sensitivity analyses below have been determined based on the exposure to interest rates for non-derivative instruments at the end of the reporting period. For floating rate assets and liabilities, the analysis is prepared assuming the amount of asset or liability outstanding at the end of the reporting period was outstanding for the whole year.
If interest rates had been 100 basis points higher/lower and all other variables were held constant, the Group’s profit for the year ended 31 December 2019 would increase/decrease by AED 25,156 thousand (2018: increase/ decrease by AED 35,345 thousand).
INTEREST RATE SWAP CONTRACTSUnder interest rate swap contracts, the Group agrees to exchange the difference between fixed and floating rate interest amounts calculated on agreed notional principal amounts. Such contracts enable the Group to mitigate the risk of changing interest rate on the fair value of issued fixed rate debt and the cash flow exposures on the issued variable rate debt.

176
Fina
ncia
l Sta
tem
ents
37 FINANCIAL INSTRUMENTS (CONTINUED)37.5 MARKET RISK MANAGEMENT (CONTINUED)CASH FLOW HEDGESAll interest rate swap contracts exchanging floating rate interest amounts for fixed rate interest amounts are designated as cash flow hedges in order to reduce the Group’s cash flow exposure resulting from variable interest rates on borrowings. The interest rate swaps and the payments on the loan occur simultaneously.
The Group’s derivative financial instruments were contracted with counterparties operating in the United Arab Emirates.
37.6 CREDIT RISK MANAGEMENTCredit risk in relation to the Group, refers to the risk that a counter party will default on its contractual obligations resulting in financial loss to the Group.
Key areas where the Group is exposed to credit risk are trade and other receivables and bank balances and derivative financial assets (liquid assets).
The Group has adopted a policy of only dealing with creditworthy counterparties as a means of mitigating the risk of financial loss from defaults. The Group attempts to control credit risk by monitoring credit exposures, limiting transactions with specific non-related counterparties, and continually assessing the creditworthiness of such non-related counterparties.
Credit approvals and other monitoring procedures are also in place to ensure that follow-up action is taken to recover overdue debts. Furthermore, the Group reviews the recoverable amount of each trade debt and debt investment on an individual basis at the end of the reporting period to ensure that adequate loss allowance is made for irrecoverable amounts. In this regard, management considers that the Group’s credit risk is significantly reduced. Trade receivables consist of a large number of customers. Ongoing credit evaluation is performed on the financial condition of accounts receivable.
CONCENTRATION OF CREDIT RISKConcentration of credit risk arise when a number of counterparties are engaged in similar business activities, or activities in the same geographic region, or have similar economic features that would cause their ability to meet contractual obligations to be similarly affected by changes in economic, political or other conditions. Concentration of credit risk indicates the relative sensitivity of the Group’s performance to developments affecting a particular industry or geographic location. Details on concentration of trade receivable balances are disclosed in note 11.1. Management believes that the concentration of credit risk is mitigated by having received instalment payments, in some cases substantial, which the Group would contractually be entitled to retain in the event of non-completion of the remaining contractual obligations in order to cover the losses incurred by the Group.
At 31 December 2019, 100% (2018: 100%) of the deposits were placed with 10 local banks and 1 foreign bank in KSA. Balances with banks are assessed to have low credit risk of default since these banks are among the major banks operating in the UAE & KSA and are regulated by the Central bank of the respective countries.
The amount that best represents maximum credit risk exposure on financial assets at the end of the reporting period, in the event counter parties fail to perform their obligations generally approximates their carrying value.
COLLATERAL HELD AS SECURITY AND OTHER CREDIT ENHANCEMENTSThe Group does not hold any collateral or other credit enhancements to cover its credit risks associated with its financial assets, except that the credit risk associated with receivables related to property development is mitigated because they are secured over the underlying property units. The Group is not permitted to sell or repledge the underlying properties in the absence of default by the counterparty. There have not been any significant changes in the quality of the underlying properties.
37.7 LIQUIDITY RISK MANAGEMENTThe responsibility for liquidity risk management rests with the management of the Group, which has built an appropriate liquidity risk management framework for the management of the Group’s short, medium and long term funding and liquidity management requirements. The Group manages liquidity risk by maintaining adequate reserves, banking facilities and committed borrowing facilities, by continuously monitoring forecast and actual cash flows and matching the maturity profiles of financial assets and liabilities.
The table below summarises the maturity profile of the Group’s financial assets and liabilities at 31 December 2019 and 2018 based on contractual undiscounted maturities.
For the year ended 31 December 2019
Notes to the Consolidated Financial Statements (continued)

177
Ald
ar A
nnua
l Rep
ort 2
019
<1 monthAED’000
1 to 3 months
AED’000
3 months to 1 year
AED’000
1 to 5 years
AED’000>5 years
AED’000Total
AED’000
31 December 2019Financial liabilitiesNon-interest bearing instruments(i) 134,396 3,206,659 683,890 581,302 156,837 4,763,084Non-convertible sukuk – 22,538 13,839 – 3,673,500 3,709,877Variable interest rate instruments 3,752 8,975 62,500 4,422,000 – 4,497,227Operating lease liability 24,324 2,692 53,764 239,307 192,252 512,339Derivative instruments – – – 10,760 – 10,760
Total 162,472 3,240,864 813,993 5,253,369 4,022,589 13,493,287
31 December 2018Financial liabilitiesNon-interest bearing instruments(i) 62,038 2,573,435 1,094,782 304,702 – 4,034,957Non-convertible sukuk – – 21,811 – 1,810,140 1,831,951Variable interest rate instruments 4,154 11,858 342,500 4,484,500 400,000 5,243,012Operating lease liability 56,164 7,608 35,423 223,045 207,657 529,897Derivative instruments – – – 5,802 – 5,802
Total 122,356 2,592,901 1,494,516 5,018,049 2,417,797 11,645,619
(i) Including security deposits from customers.
38 FAIR VALUE OF FINANCIAL INSTRUMENTSFAIR VALUE OF FINANCIAL ASSETS AND FINANCIAL LIABILITIES THAT ARE NOT MEASURED AT FAIR VALUE (BUT FAIR VALUE DISCLOSURES ARE REQUIRED)Except as disclosed in the following table, management considers that the carrying amounts of financial assets and financial liabilities recognised at amortised cost in the consolidated financial statements approximate their fair values.
2019 2018
Gross carrying
amountAED’000
Fair value
AED’000
Gross carrying amount
AED’000
Fair value
AED’000
Financial liabilities at amortised costSukuk No.1 (note 18) 1,832,969 1,989,274 1,831,951 1,839,285Sukuk No.2 (note 18) 1,831,521 1,887,555 – –
The non-convertible sukuk are categorised under Level 1 in the fair value hierarchy.
FAIR VALUE OF THE GROUP’S FINANCIAL ASSETS THAT ARE MEASURED AT FAIR VALUE ON A RECURRING BASISSome of the Group’s financial assets are measured at fair value at the end of each reporting period. The following table gives information about the fair values of these financial assets as at 31 December 2019 and 31 December 2018:
Level 1AED’000
Level 2AED’000
Level 3AED’000
TotalAED’000
31 December 2019Investments in financial assets at FVTOCIEquities 40,000 – 15,202 55,202
31 December 2018Investments in financial assets at FVTOCIEquities 38,950 – 15,202 54,152Funds – – 41,964 41,964
38,950 – 57,166 96,116
There were no transfers during the period from level 1 and level 2. Movement in the financial assets categorised under Level 3 is additional investment of AED 2,451 thousand, fair value loss recognised in other comprehensive income of AED 481 thousand and disposal of AED 43,935 thousand.

178
Fina
ncia
l Sta
tem
ents
39 SEGMENT INFORMATION39.1 BUSINESS SEGMENTSSegment information about the Group’s continuing operations is presented below:
31 DECEMBER 2019
Property development and management Asset management
Property development
and salesAED’000
Development management
AED’000
Investment properties
AED’000
Hospitality and leisure
AED’000Adjacencies
AED’000Eliminations
AED’000Consolidated
AED’000
Revenue from external customers
– Over a period of time 2,493,694 318,043 – 364,563 1,624,175 – 4,800,475– At a point in time 237,751 47,531 – 333,351 – – 618,633– Leasing – – 1,728,773 – – – 1,728,773Inter-segments – – – 710 140,580 (141,290) –
Gross revenue(i) 2,731,445 365,574 1,728,773 698,624 1,764,755 (141,290) 7,147,881Cost of revenue excluding
service charge (1,832,658) (215,761) (215,499) (572,357) (1,532,702) 156,231 (4,212,746)Service charge expenses – – (165,491) – – – (165,491)
Gross profit 898,787 149,813 1,347,783 126,267 232,053 14,941 2,769,644Depreciation and
amortisation – – (10,605) (155,496) (87,191) – (253,292)Provisions, impairments
and write-downs, net (30,409) – (69,950) 46,827 4,835 – (48,697)Fair value loss on investment
properties, net (128,112) – (246,639) – – – (374,751)Gain on disposal of property,
plant and equipment – – 23,014 (50) – – 22,964Gain on disposal of
investment property – – 23,856 – – – 23,856Gain on exchange
of properties, net of write-downs 388,384 – – – – – 388,384
Other income 149,327 – – – 9,751 (15,329) 143,749
Segment profit 1,277,977 149,813 1,067,459 17,548 159,448 (388) 2,671,857
Share of profit from associates and joint ventures (3,096)
Selling and marketing expenses (109,522)
Provisions, impairments and write-downs, net (103,978)
General and administrative expenses (363,830)
Depreciation and amortisation (15,258)
Finance income 84,087Finance costs (349,719)Other income 114,638
Profit for the year 1,925,179
(i) Gross revenue of investment properties include AED 165,491 thousand of revenue from service charges.
For the year ended 31 December 2019
Notes to the Consolidated Financial Statements (continued)
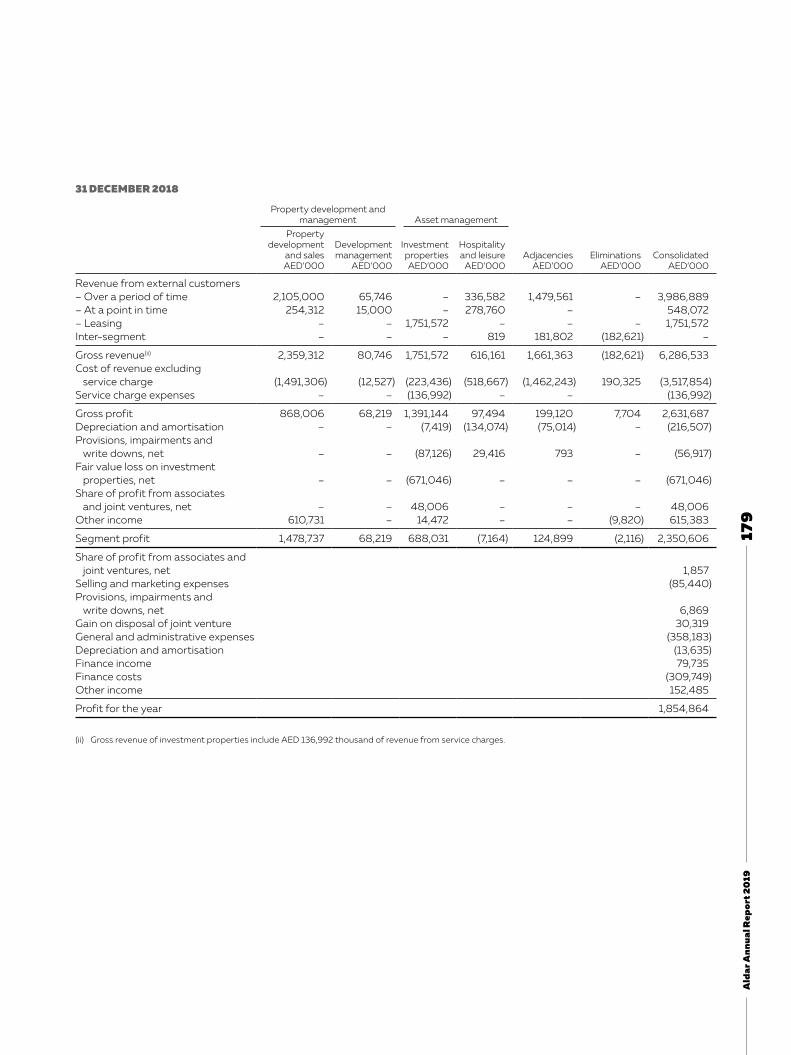
179
Ald
ar A
nnua
l Rep
ort 2
019
31 DECEMBER 2018
Property development and management Asset management
Property development
and salesAED’000
Development management
AED’000
Investment propertiesAED’000
Hospitality and leisureAED’000
AdjacenciesAED’000
EliminationsAED’000
ConsolidatedAED’000
Revenue from external customers– Over a period of time 2,105,000 65,746 – 336,582 1,479,561 – 3,986,889– At a point in time– Leasing
254,312–
15,000–
–1,751,572
278,760–
–– –
548,0721,751,572
Inter-segment – – – 819 181,802 (182,621) –
Gross revenue(ii) 2,359,312 80,746 1,751,572 616,161 1,661,363 (182,621) 6,286,533Cost of revenue excluding
service charge (1,491,306) (12,527) (223,436) (518,667) (1,462,243) 190,325 (3,517,854)Service charge expenses – – (136,992) – – (136,992)
Gross profit 868,006 68,219 1,391,144 97,494 199,120 7,704 2,631,687Depreciation and amortisation – – (7,419) (134,074) (75,014) – (216,507)Provisions, impairments and
write downs, net – – (87,126) 29,416 793 – (56,917)Fair value loss on investment
properties, net – – (671,046) – – – (671,046)Share of profit from associates
and joint ventures, net – – 48,006 – – – 48,006Other income 610,731 – 14,472 – – (9,820) 615,383
Segment profit 1,478,737 68,219 688,031 (7,164) 124,899 (2,116) 2,350,606
Share of profit from associates and joint ventures, net 1,857
Selling and marketing expenses (85,440)Provisions, impairments and
write downs, net 6,869Gain on disposal of joint venture 30,319General and administrative expenses (358,183)Depreciation and amortisation (13,635)Finance income 79,735Finance costs (309,749)Other income 152,485
Profit for the year 1,854,864
(ii) Gross revenue of investment properties include AED 136,992 thousand of revenue from service charges.

180
Fina
ncia
l Sta
tem
ents
39 SEGMENT INFORMATION (CONTINUED)39.1 BUSINESS SEGMENTS (CONTINUED)The segment assets and liabilities and capital and project expenditures are as follows:
Property development and management Asset management
Property development
and salesAED’000
Development management
AED’000
Investment properties
AED’000
Hospitality and leisure
AED’000Adjacencies
AED’000Unallocated
AED’000Elimination
AED’000Group
AED’000
As at 31 December 2019
Assets 13,213,835 2,875,988 18,189,259 2,678,107 2,436,838 1,873,084 (388) 41,266,723
Liabilities (2,885,323) (2,911,411) (7,422,137) (1,132,190) (1,251,952) (712,460) – (16,315,473)
Capital expenditures 2,703,018 – – 94,152 31,178 2,187 – 2,830,535
Project expenditures 2,563,314 3,905 1,224,756 – 4,757 – – 3,796,732
As at 31 December 2018
Assets 10,969,607 2,312,197 17,712,381 2,679,330 2,274,276 2,598,030 (2,116) 38,543,705
Liabilities (1,876,126) (2,472,839) (7,116,630) (1,086,522) (1,218,468) (537,290) (14,307,875)
Capital expenditures 1,500,323 – 49,822 341,610 683,953 8,739 – 2,584,447
Project expenditures 2,516,898 – 898,331 – 3,710 – – 3,418,939
The Group’s operating segments are established on the basis of those components that are evaluated regularly by the Chief Executive Officer, considered to be the Chief Operating Decision Maker. The Chief Operating Decision Maker monitors the operating results of the Group’s operating segments separately for the purpose of making decisions about resource allocation and performance assessment. Segment performance is evaluated based on revenues, gross profit and a broad range of key performance indicators in addition to segment profitability.
For management purposes, at 31 December 2019 and 2018, the Group is organised into three major segments, namely property development and management (develop, sell and manage development projects), asset management (lease and manage retail, commercial and residential properties, hotels and leisure activities) and adjacencies (mainly education, construction, property/facilities management and cooling operations). Comparative information for 2018 has been reorganised to match with current year’s presentation.
The accounting policies of the reportable segments are the same as the Group’s accounting policies described in note 3. Segment profit represents the profit or loss earned by each segment without allocation of central administration, selling and marketing costs and directors’ salaries, share of profits of associates and joint ventures, other gains and losses, finance income and finance costs. This is the measure reported to the Chief Operating Decision Maker for the purposes of resource allocation and assessment of segment performance.
For the purposes of monitoring segment performance and allocating resources between segments: • all assets are allocated to reportable segments other than corporates assets, investment in associates and joint ventures,
investment in financial assets at fair value through other comprehensive income and derivative financial instruments. Assets used jointly by reportable segments are allocated on the basis of the revenues earned by individual reportable segments; and
• all liabilities are allocated to reportable segments other than corporate payables and derivative financial instruments. Liabilities for which reportable segments are jointly liable are allocated in proportion to segment assets.
39.2 GEOGRAPHICAL SEGMENTSThe Group operated mainly in one geographical segment, i.e., United Arab Emirates.
For the year ended 31 December 2019
Notes to the Consolidated Financial Statements (continued)

181
Ald
ar A
nnua
l Rep
ort 2
019
40 OTHER GENERAL AND ADMINISTRATIVE EXPENSESOther general and administrative expenses include social contributions amounting to AED 36,000 thousand (2018: AED 35,000 thousand).
41 NON-CASH TRANSACTIONSThe following were significant non-cash transactions relating to investing and financing activities of condensed consolidated statement cash flows:
2019AED’000
2018AED’000
Disposal of a joint venture (note 9) 771,976 –
Addition to investment properties (note 8) 1,111,480 –
Addition to bank borrowings (note 9) 507,601 –
Transfer between investment properties and property, plant and equipment (notes 8, 6) 13,665 25,700
Transfer between investment properties and development work in progress (notes 8, 13) 205,635 4,672
42 RECONCILIATION OF LIABILITIES ARISING FROM FINANCING ACTIVITIESThe table below details changes in the Group’s liabilities arising from financing activities, including both cash and non-cash changes. Liabilities arising from financing activities are those for which cash flows were, or future cash flows will be, classified in the Group’s consolidated statement of cash flows as cash flows from financing activities.
Balance at 1 January 2019
AED’000
Financing cash flows(i)
AED’000
Fair value adjustments
AED’000Others(iii)
AED’000
Balance at 31 December
2019AED’000
Bank borrowings and sukuk(ii) 7,055,945 248,288 – 842,901 8,147,134Lease liabilities 529,898 (42,011) – 24,453 512,340Dividends payable 91,701 (1,042) – – 90,659Derivative financial instruments (8,222) (77,121) 105,021 (8,918) 10,760
7,669,322 128,114 105,021 858,436 8,760,893
(i) The cash flows from bank borrowings and sukuk make up the net amount of proceeds from bank borrowings and sukuk and repayments of borrowings and sukuk in the consolidated statement of cash flows.
(ii) Bank borrowings under others include AED 507,601 thousand acquired as part of acquisition (note 9).(iii) Others include finance costs incurred.
43 NON-CONTROLLING INTERESTSThe table below shows details of the material non-controlling interests of the non-wholly owned subsidiaries of the Group:
Name of subsidiary
Place of incorporation and principal place of business
Proportion of ownership interests and voting rights held by non-controlling interests
Profit/(loss) allocated to non-controlling interests
Accumulated non-controlling interests
2019(%)
2018(%)
2019AED’000
2018AED’000
2019AED’000
2018AED’000
Pivot Engineering & General Contracting Co. (WLL) (“PIVOT”) UAE 65.2 65.2 (59,323) 2,969 71,866 131,189
Saadiyat Cooling LLC (“SC LLC”) UAE 85 85 404 298 41,804 41,400
Total 113,670 172,589
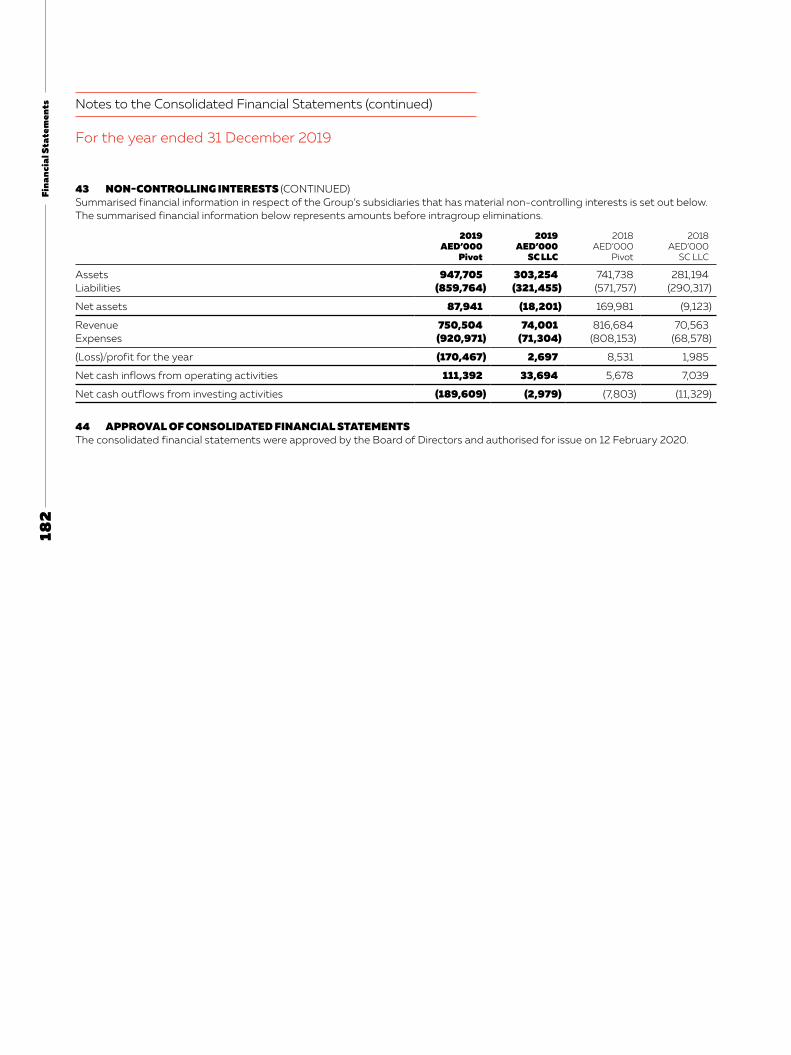
182
Fina
ncia
l Sta
tem
ents
43 NON-CONTROLLING INTERESTS (CONTINUED)Summarised financial information in respect of the Group’s subsidiaries that has material non-controlling interests is set out below. The summarised financial information below represents amounts before intragroup eliminations.
2019AED’000
Pivot
2019AED’000
SC LLC
2018AED’000
Pivot
2018AED’000
SC LLC
Assets 947,705 303,254 741,738 281,194Liabilities (859,764) (321,455) (571,757) (290,317)
Net assets 87,941 (18,201) 169,981 (9,123)
Revenue 750,504 74,001 816,684 70,563Expenses (920,971) (71,304) (808,153) (68,578)
(Loss)/profit for the year (170,467) 2,697 8,531 1,985
Net cash inflows from operating activities 111,392 33,694 5,678 7,039
Net cash outflows from investing activities (189,609) (2,979) (7,803) (11,329)
44 APPROVAL OF CONSOLIDATED FINANCIAL STATEMENTSThe consolidated financial statements were approved by the Board of Directors and authorised for issue on 12 February 2020.
For the year ended 31 December 2019
Notes to the Consolidated Financial Statements (continued)

183
Ald
ar A
nnua
l Rep
ort 2
019

184
Fina
ncia
l Sta
tem
ents


Ald
ar An
nu
al Rep
ort 20
19
ALDAR.COM
ALDAR PROPERTIES PJSCAldar HQAl Raha BeachAbu DhabiTel: +971 2 810 5555