upper incisors position changes after … · the final position of the maxillary incisors after ......
TRANSCRIPT

UPPER INCISORS POSITION CHANGES AFTER ORTHODONTIC TREATMENT IN CLASS I, II AND III MALOCCLUSIONS
by
KONSTANTINOS BAKOS
CHUNG HOW KAU, COMMITTEE CHAIR KYOUNGA CECILIA CHEON
AMJAD JAVED CHRISTOS VLACHOS
A THESIS
Submitted to the graduate faculty of The University of Alabama at Birmingham, in partial fulfillment of the requirements for the degree of
Masters of Science in Dentistry
BIRMINGHAM, ALABAMA
2015
ii
UPPER INCISORS POSITION CHANGES AFTER ORTHODONTIC TREATMENT IN CLASS I, II AND III MALOCCLUSIONS
KONSTANTINOS BAKOS
DEPARTMENT OF ORTHODONTICS
ABSTRACT
Objective: The purpose of this study was to evaluate the maxillary central incisor
position changes after orthodontic treatment in Class I, II and III malocclusions.
Material and Methods: This retrospective cohort study evaluated nighty non extraction
orthodontic Class I, II and III cases which were collected randomly from the Orthodontic
clinic at the University of Alabama at Birmingham and the Institutional Review Board of
the University of Alabama at Birmingham approved the study. All the chosen cases were
treated with fixed appliances and according to the standards of American Board of
Orthodontics. All the lateral cephalo-metric radiographs were taken using the
Orthopantomograph OP100, Instrumentarium Corp.Imaging Division machine(Finland)
and traced digitally using the Dolphin Management and Imaging Software,
Version05.05.5070.221436(US &Canada). In order to evaluate the maxillary incisor
position changes ,the U1-PP(°), U1-SNº, U1-NAº, U1-NA(mm), U1 perpendicular to FH
mm(U1-FH) and U1-Oc° cephalometric measurements were carried out based on the
post-treatment lateral cephalometric measurements. In order to determine if there is a
statistically significant difference in Maxillary central incisor positions among class I, II
and III malocclusions , equivalence tests for post-treatment cephalometric measurements
were performed using a range of ± 2 either degrees or millimeters
Results: The maxillary incisors position does show a significant difference from the
normal value among the Class I, II and III. Class III malocclusion presented a greater

iii
proclination of maxillary incisor teeth compared to Class I and Class II malocclusions.
Class I has a tendency to be more positive of the normal and Class II to be more negative
than the normal. The maxillary incisors changes, seem to not fall within the range of ±2
mm according with the equivalent tests for post-treatment cephalometric measurements
compared to the respective normal value. The final position of the maxillary incisors after
orthodontic treatment depends mainly on the initial position of these teeth and the
discrepancy of jaws.
Conclusion: There is a significant difference in the positioning of the maxillary incisors
among the class I, II and III malocclusions. The post-treatment measurements such as
U1-FHmm, U1-NA mm and U1-SN° and U1-NA° present a significance difference
among Class I, II and III malocclusions. In In the class II, the maxillary teeth showed to
be more upright than Class I and III malocclusions after orthodontic treatment. The U1-
PP° showed no significant difference among the malocclusions. In this study, the U1-PP°
was the same for r the Class I and III.
iv
ACKNOWLEDGEMENTS I would like to thank the entire UAB Department of Orthodontics for its support the last
three years. I would particularly like to thank Prof. Chung H. Kau for his outstanding
dedication and guidance. His help extended well beyond what would be expected from a
thesis advisor and I accredit a large part of where I am today to his support. Dr. Kau and
Dr. Vlachos thank you for selecting me to be one of your residents and giving me the
chance to pursue my dream of being an orthodontist; I am forever grateful. I would also
like to thank Dr. Cheon for their advice and input.
Furthermore, I would like to thank my family. I owe tremendous gratitude to my parents
for their always-present support. I cannot thank my wife, Peni enough for her unyielding
encouragement. Last but not the least I would like to thank my son Ilias for being the best
thing ever happen to my life.
“I am indebted to my parents for living, but to my teachers for living well”.
Alexander the Great
v
TABLE OF CONTENTS Page
ABSTRACT ........................................................................................................................ ii ACKNOWLEDGMENTS ................................................................................................. iv LIST OF TABLES ............................................................................................................ vii LIST OF FIGURES ......................................................................................................... viii CHAPTER
I. LITERATURE REVIEW ...........................................................................................1 Introduction………………………………………………………………………..1 Traditional methods for the evaluation of Maxillary central incisor position….…1 Upper incisor position-history of different analysis…………………………….. The use of radiographs…………………………………………………………….2
Growth of Soft Tissue Facial Profile .......................................................................6 Dental and skeletal changes .....................................................................................7 Class II and III correctors and Upper incisor position changes ...............................9 Upper Incisor and Soft Tissue changes in extraction and non extraction orthodontic treatment .............................................................................................11 Expected and Actual Torque of Upper incisors .....................................................12 Purpose of Study ....................................................................................................17
2. MATERIALS AND METODS...............................................................................18
Sample Size ............................................................................................................19 Data Collection ......................................................................................................19 Statistical Analysis .................................................................................................20
3. RESULTS ...............................................................................................................24

vi
4. DISCUSSION ..........................................................................................................30 LIST OF REFERENCES ...................................................................................................36 APPENDICES A INSTITUTIONAL REVIEW BOARD APPROVAL ....................................41

vii
LIST OF TABLES
Tables Page 1 Cephalometric Landmarks .....................................................................................21 2 Reference Planes ....................................................................................................21 3 Measurements used in Cephalometric Analysis ....................................................22
4 Sample size needed per group ................................................................................23
5 Comparison of mean difference between pre- and post-treatment cephalometric measurements by occlusion class ...........................................................................26
6 Comparison of mean difference between post-treatment cephalometric
measurements with respective normal value by occlusion class ...........................27 7 Equivalence tests for post-treatment cephalometric measurement compared to the
respective normal value .........................................................................................28 8 Inter-observer reliability test……………………………………………………..30

viii
LIST OF FIGURES
Tables Page 1 Mean difference between post-treatment and normal cephalometric measurements
by occlusion class ..................................................................................................29

1
CHAPTER 1
LITERATURE REVIEW
Orthodontists are increasingly using the position of the upper central incisor as a
reference landmark to support the dentition. The position of this tooth not only has a
significance in supporting the upper lip, it also has an importance to the dentition on
smiling, Ramos1. Often, orthodontists use normative values (mainly cephalometric
readings) in trying to position these teeth. However, once the plan is established, the
biomechanical principles of tooth movement may or may not bring an ideal final
treatment position.
Due to the importance of the maxillary incisors in esthetics, several methods have been
used in Orthodontics for the evaluation of their position, such as: a) cephalometric
measurements, b) tooth inclination protractor on the casts or intra-orally and c) three-
dimensional(3D) methods including angular measurements on 3D cast models.
Traditionally, lateral cephalograms were used to measure the inclination of the incisors.
This technique provided the crown-root inclination relative to a horizontal reference
plane (palatal, occlusal, or mandibular, Sella- Nasion). However, the mistakes in
registering the landmarks to assess the inclination of each tooth, or using the occlusal
plane as the reference, and the ionizing beam radiation are among the shortcomings of
this technique. In dental cast-based methods, some of these drawbacks have been
obviated. Andrews tried to determine the tooth crown inclination, considering the facial
axis of the clinical crown and the occlusal plane that passes through the anterior and

2
posterior teeth. However, his technique was both time-consuming and relatively difficult.
The TIP device was first introduced for the measurement of the inclination of incisors on
a dental cast2. Previous studies have demonstrated that the TIP is a simple, inexpensive,
and reliable tool for the assessment of tooth inclination. However, it has some inherent
deficiencies regarding the validity of the measurements, especially in the case of an
inordinate occlusal plane (eg, deep curve of Spee, severe curve of Wilson, canted
occlusal plane) . On the other hand, considering the popularity of CBCT because of its
lower costs and radiation doses, it is now possible to accurately assess the crown and root
3 dimensionally.3
The development of cephalometry (1931) is credited to Broadbent 4 whose article “A new
X-Ray Technique and Its Application to Orthodontia“ broadened the horizons in the
orthodontic research field and further aided the popularity in orthodontic diagnosis and
treatment planning. In 1938,Allan Brodie was the first to evaluate orthodontic results
using cephalometric analysis5. The publication of Down’s analysis in 1952 expanded the
use of cephalometric analysis to clinical practice. Downs used the Frankfort Horizontal
Plane, established in Frankfort, Germany (1882) as a horizontal reference plane6. The
Frankfort horizontal plane was thought to be a representative of the natural head position
in his research and mimicked past orientations of dry skull. Further research performed
by Bagga7 about the inclination of the horizontal plane to the sella-nasion and porion-
orbitale, found that the FHP was more closely related to true horizontal (average mean -
1.15) compared to Sella–Nasion which it’s average mean was 7.33 degrees. However,
some of the disadvantages of FH compared to Sella-Nasion are 1) the difficulty in
locating both landmarks and especially Anatomic Porion 2) both Orbitale and Porion are

3
bilateral structures and 3) the FH is not in sagittal plane and it is influenced significantly
by head’s position changes in cephalostat. The constructed FH is an alternative method
for the orientation of FH and it is a line drawn 6 to 7 degrees below the Sella–Nasion
Proffit 20008.In this study both horizontal planes FH and Sella-Nasion plane were used.
which leads to an in-accurate evaluation of vertical dimension of face. Ellis and
McNamara(1988)9 showed that the variation of SN-FH angle, in untreated Class I
occlusion with well balanced faces was less correlated when the FH plane was used.
When the measurements were made using the SN-MP angle the SNA, SNB showed a
significant correlation with SN-FH angle ranging from 0.63 to 0,67 and for the SN-MP
angle was 0.43. According to this study the FH plane is more accurate than the SN-MP
angle. However, it should be mentioned that the Sella does not affect the ANB angle
which shows the anterio-posterior skeletal relationship of maxilla and mandible. At this
point, it should be emphasized that Riedel10 was the first to introduce the Sella- Nasion
plane in cephalometrics and used it as a reference plane. Riedel also formed the SNA and
SNB angles, drawing lines from SN plane to Point A and B, located on maxilla and
mandible respectively. Jacobson (1975)11 showed that the ANB angle is influenced both
by the length of cranial base and the rotational effect of jaws. Clockwise rotation of the
jaws increases the ANB angle while the counterclockwise rotational effect decreases it.
Jacobson observed that the ANB angle is not a reliable diagnostic measurement in cases
where the SN-MP angle is less than 27 degrees and greater than 37 degrees. He also
introduced the Wits Appraisal which is a linear measurement and not a cephalometric
analysis itself and it can be used as an additional cephalometric measurement to ANB
angle, for the evaluation of jaw relationship. Furthermore, Wits analysis is affected by the

4
functional occlusal plane and the vertical alveolar dimension. Steiner’s analysis as regard
the upper incisor position included both angular and linear measurements. Steiner 12
showed that the inclination of upper incisors ideally should form 24 degrees with the
NA line and the most labial surface of them be 4mm in front of it. However, there is no
reference in the literature how Steiner derived his mean values from .McNamara 9,
introduced the Nasion-Perpendicular to relate the upper incisor to the maxilla. Its
advantage is that it is not affected by the position of maxilla in cases of maxillo-
mandibular anomalies. On the other hand,when the maxilla moves forward both the U1-
NA°and U1-NAmm are decreased and vise versa. The more protrusive the maxilla the
smaller is the U1-NA angular value. These changes happen , even when the upper
incisors remain at the same position within the maxilla. By tilting the maxilla, both
measurements are affected. In this study , Steiner and both McNamara and the Fastlicht
Tetragon cephalometric analyses were used for the upper incisor position to the cranial
base and to the maxilla respectively. With regard to the position of lower incisor to the
MP plane(GO-ME) , the IMPA used in this study is a reliable cephalometric
measurement because it is not affected by the vertical changes in position of the
mandible. The IMPA is one of the Tweed Triangle 13angular cephalometric
measurements and its mean value is 90 degrees. Tweed observed that the concept of
uprighting the mandibular incisor position was related both with facial balance and
occlusion stability. On the other hand, the L1-Apo line can be influenced by both maxilla
and mandible. By moving the maxilla forward this angle decreases whereas when moving
the mandible to the same direction the angle increases. Therefore, the L1-APO can only
be used to describe the lower face profile and not to relate the lower incisors to
5
mandibular symphysis 11 . The interincisal angle U1-L1 has been used from the
orthodontists as an indicator of upper and lower incisors. Kowalski et 14evaluated the
distribution of the U1/L1 in a sample of 1104 subject,474 males and 620 females. The
sample also was divided in 2 different chronological groups, one was 6-8 and the second
18-26 old year. They found that the overall mean value of U1-L1 for the intermediate
group 8-16 year old ,it was129° which differs from Steiner’s ideal of 131°and Down’s of
135.4°. However, the U1-L1 is affected not only by both the position of upper maxillary
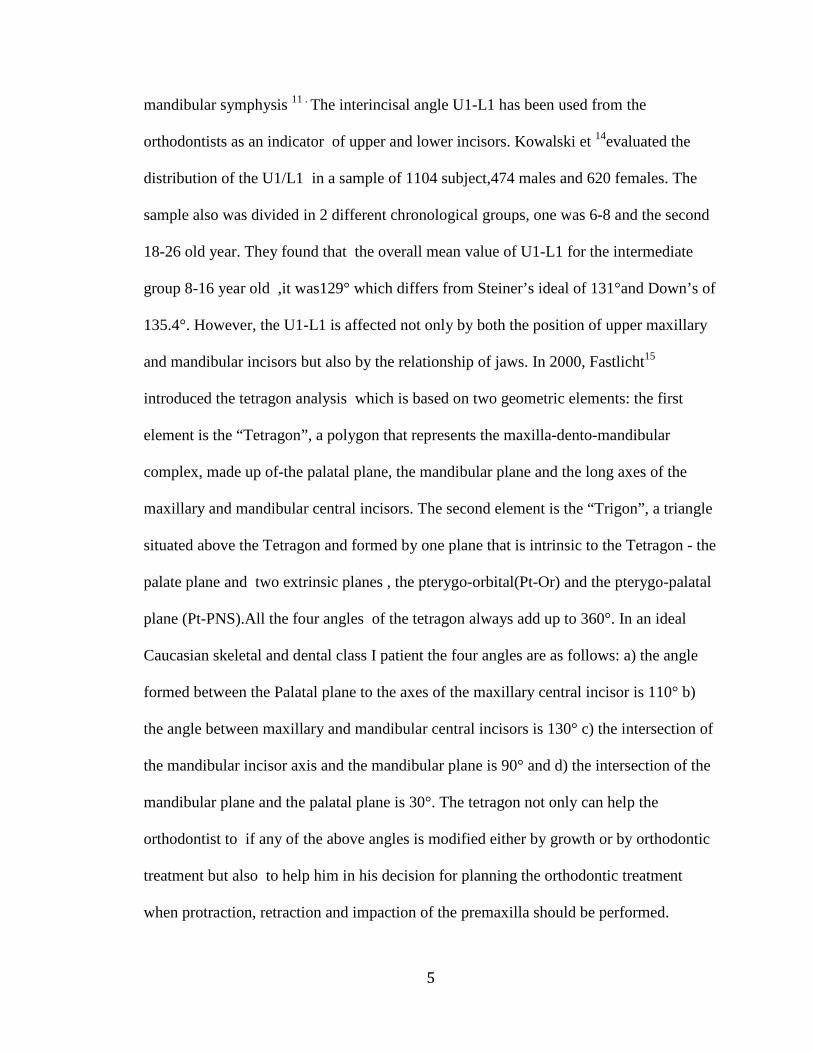
and mandibular incisors but also by the relationship of jaws. In 2000, Fastlicht15
introduced the tetragon analysis which is based on two geometric elements: the first
element is the “Tetragon”, a polygon that represents the maxilla-dento-mandibular
complex, made up of-the palatal plane, the mandibular plane and the long axes of the
maxillary and mandibular central incisors. The second element is the “Trigon”, a triangle
situated above the Tetragon and formed by one plane that is intrinsic to the Tetragon - the
palate plane and two extrinsic planes , the pterygo-orbital(Pt-Or) and the pterygo-palatal
plane (Pt-PNS).All the four angles of the tetragon always add up to 360°. In an ideal
Caucasian skeletal and dental class I patient the four angles are as follows: a) the angle
formed between the Palatal plane to the axes of the maxillary central incisor is 110° b)
the angle between maxillary and mandibular central incisors is 130° c) the intersection of
the mandibular incisor axis and the mandibular plane is 90° and d) the intersection of the
mandibular plane and the palatal plane is 30°. The tetragon not only can help the
orthodontist to if any of the above angles is modified either by growth or by orthodontic
treatment but also to help him in his decision for planning the orthodontic treatment
when protraction, retraction and impaction of the premaxilla should be performed.

6
Bhasin16 after a cephalometric evaluation of pretreatment and postreatment outcome
using the tetragon analysis ,found that the post-treatment reduction of upper incisor –
palatal plane angle to be reduced significantly in skeletal class I patients, followed by
class II and least for class III patients. One reason for this, is that in skeletal class III
cases the upper incisors were proclined in 60% of the cases whereas the incisors were
retracted in others. The post-treatment value of U1-PP angle for skeletal class I and III
were above the norm because the norms of Fastlicht’s tetragon are based on Caucasian
population and the incisors in Indian population are more proclined than the Caucasian
population. According to McLaughlin17 , in a class I malocclusion the upper incisor to
Palatal plane angle depends on the skeletal vertical divergency of the patient with a 117°
and 108° in low and high angle patients respectively. In a class II and Class III patient
that angle should be 100° and 120° respectively.
Growth of Soft Tissue Facial Profile
Several angles have been introduced to evaluate facial soft tissues. One of them, is the
NLA angle, first introduced by McNamara 18 in 1984. The NLA could be affected by
nose, lip thickness and the dento -skeletal tissues under the lip and the position of Jaws.
Patients with maxillary prognathism or true dento-alveolar protrusion of the maxillary
teeth usually present an acute Nasiolabial angle and vise versa. However, the Nasiolabial
angle can also be affected by the vertical dimension. In a patient with both retrusive
Maxilla and Mandible with a steep mandibular plane, the NLA can be within normal
limits. Furthemore, growth of soft tissues is a significant determinant of the Nasiolabial
angle. Nanda et19 , showed that in both sexes there is a slight decrease in the NLA
7
between 7 and 18 years old, with the most acute NLA angle for boys at 9 years old and
for girls at 7 years old respectively. Both girls and boys showed the most obtuse NLA
angle around 16 years old. The difference between boys and girls at the age of 9 years
becomes smaller due to decrease in growth velocity in girls and with no difference at 16
years old. This can be explained ,because girls grow quickly at 9 yeas old while boys are
still growing slowly. The velocity curves for both girls and boys usually intersect around
the age of 12. These data were in agreement with Andersen et al20 who also showed that
the upper lip length is longer in boys than in the girls whereas the opposite is true for the
lower lip. Andersen’s study20concluded that girls show a higher gum-line than boys and
they should be treated with caution in cases when upper incisors need to be intruded
because no spontaneous correction can be expected with age. However, it seems that the
age at which orthodontic treatment is commence would be a more important factor about
the anticipated soft tissues changes happening with the age.
Dental and Skeletal changes
For someone to determine and visualize the position of the upper incisor before and after
treatment, one should first observe how these teeth can be compensated in different
skeletofacial patterns in untreated subjects. Bibby21, having observed that different
incisor relationships exist in similar facial types and vise versa, studied both the incisor
and skeletal compensatory mechanism in 268 cases. He used SN plane as a reference
plane to examine if there is any skeletal or dental accommodation. He found that Point A
showed similar position between Class I and II while it was significant different in Class
III. The point B showed similar relationship with cranial base in Class I and III and

8
different in Class II. From the above, Bibby concluded that there is no compensatory
mechanism for the Antero-Posterior jaws discrepancy. However, this study showed that
there is a compensative mechanism for the incisors. The upper and lower incisors were
investigated relative to the Maxillary and Mandibular Plane respectively. In Class II
cases, the upper incisors were retroclined while in Class III they were proclined. The
lower incisors showed a similar proclination both in Class I and II and an upright or
retroclined position in Class III relative to Class I and Class II. As result in Class III both
upper and lower incisors participate in compensation whereas in Class II the
compensation is mainly due to upper incisors.
Variability in tooth morphology can play a significant role in appliance design and the
final results of orthodontic treatment. Grant22 and Bryant23 evaluated the crown –root
shape of the maxillary central incisors in Class I, Class II division 1, Class II division 2
and Class III. In both studies, the crown-root shape of the permanent maxillary central
incisors were similar in Class I, Class II division 1and Class III. However, in Class II
division 2 the crown-root shape was characterized by a short root, long crown, reduced
labio-palatal thickness and an axial bending of incisors. All these characteristics ,might
lead to a deepening of the bite and a limitation in the expression of palatal root torque in a
Class II division 2. In addition, to the proclination of Maxillary incisors in Class II
division 2, the A point tends to move backward (0.25 mm) and downward(0.6 mm) due
to dento-alveolar remodeling. However, according to Kazim et24 ,Bicakci25
andAbdwani26 this backward and downward movement of Point A does not significantly
affect the SNA which contradicts BeGole’s27 findings of reduced SNA by 1.6 degrees.
In 1960,Andrews28 studied the shape, angulation and inclination of crowns in 120 non

9
orthodontic models and then established the Six keys to normal occlusion. The absence
of any or more of the six keys results in a occlusion less than normal. He also provided
the average mean of each tooth’s angulation and inclination for the design of the
Straight Wire Appliance reducing the need for bending to a certain point. Andrews also
said that the degree of crown angulation both in upper and lower incisors ,affects the
posterior segments’ relationship, the arch dental length and the anterior esthetics.
Andrews, also emphasized the wagon wheel effect where tip was lost as torque was
added and he decided to add additional tip to the anterior brackets. With regard to arch
length changes based both on the unchanged anterio-posterior position of upper incisors
and attribution of torque,O’Higgins et al29 and Sangfcharearn et30 found that if all the
maxillary incisors are torqued by 5 degrees then the space gain would be 1mm. This
finding can be explained by the molar occlusion change happening of 0,46 mm per side
which means 0.92 mm increase in total arch length. O’Higgins also showed that as the
incisor angulation is increased, the molar relationship tends towards a Class III molars
relationship while a decrease of it will result in a Class II tendency. The findings of this
study were attributed to torque and not tipping.
Class II and III correctors and Upper incisor position changes
The position of upper incisors after orthodontic treatment is closely related to the type of
biomechanics used during treatment. There is a variety of orthodontic philosophies and
appliances for a Class II orthodontic treatment. Among these are Class II elastics,
headgear and functional appliances such as Twin Block , Herbst etc. In the literature, the

10
dento-skeletal effect of Twin Block is mostly on the mandible and lower teeth with a
decrease in overjet attributed to skeletal changes by 54% and dental changes by 46% of
which the upper incisor contribution appears to be only 9% or 0.5 mm of total 2.7 mm
overjet correction Bacceti et31. In another study Siara-Olds32 showed that there is no
significant long term changes in the lower incisor proclination among Twin Block,
MARA, Herbst and Cross Bow. It is well know that Class II elastics have mainly a dento-
alveolar effect which is associated with lingual retroclination and extrusion of upper
incisors and an increase of IMPA and intrusion of the mandibular incisors and a
clockwise rotation effect on the mandible steepening the occlusal plane. Janson 33, Nelson
34showed that both Herbst appliance and Begg technique with Class II elastics have
skeletal and dental effects in the treatment of Class II. However, the overjet reduction
with Begg method was mostly dental due to maxillary retroclination while the Herbst
had a skeletal overjet reduction of 51% (headgear effect)compared to Begg of 4% .
Miller et al35 compared the incisor inclination changes between Forcus and X-Bow and
found that both of them produce the same amount of proclination of incisor with the
difference that the lower inclination is affected by the treatment length whereas the upper
incisor inclination by the age at start of treatment.LeComu36 has shown the dento-
alveolar effect of Class II elastics with no skeletal contribution. This finding is not in
agreement with Janson33 who showed although the Class II elastics have mainly a
dentoalveolar effect of (72%)have also a skeletal effect of 19%. This study33 also
showed that class II are effective in correcting Class II maloclussion and their effects are
similar in long term to fixed appliances such as Herbst, Headgear and Forsus. The
extrusion of upper incisor can be beneficial when the upper incisor display is inadequate

11
but can be detrimental in gummy smile cases. Class III elastics have both a
counterclockwise effect on the mandible while retracts the lower incisors and proclines
the upper incisors. Class III elastics can be used as an alternative orthodontic treatment
method when the extraction or surgical options are not acceptable to a patient.
Upper Incisors and Soft Tissue changes in extraction and non-extraction orthodontic
treatment
Incisor angulation plays an important role both in obtaining a normal occlusion and
presenting a facial balance of surrounding soft tissues. Changes in arch length can be
influenced not only by inadequate angulation of incisors but also by extractions of teeth
for orthodontic purposes. There has been a continuous debate between extraction and
non-extraction orthodontic treatment, mainly due to the emphasis placed on esthetics.
The majority of laypersons prefer full facial profiles and orthodontists have been started
treating according to the soft tissue paradigm. Konstantonis37, in a sample of 215
borderline cases based on lower crowding, had four first premolars extracted in 66
patients(30.6%). By comparing these 2 groups, in this study found that the extraction
group showed a significant a greater retraction of the lips and a more obtuse nasiolabial
angle (+5.34 degrees) while the incisor display changes between the 2 groups was
insignificant. In cases with class II camouflage treatment, Seden38showed, that the greater
the overjet to begin with, the greater the upper incisor retraction and greater the reduction
of ANB which is in agreement with Tadic39. Seden’s 38 study did not show any significant
nasolabial angle changes and he mentioned the effect of upper incisor retraction to the

12
retrusion of lower lip. The inadequate inclination of the upper incisors could produce a
poor occlusion with remaining extraction spaces in cases of Class II camouflage
treatment. Bishara 40based on the Iowa Growth study, after the comparison of 2 groups
with and without extractions, concluded that the four first premolars’ extraction group is
characterized by straight profiles and upright upper incisors with no detrimental effects
on the facial profile. This finding is similar with Zierhut et al41 who attributed the soft
tissue flattening to both mandibular and nasal growth changes and not to the teeth
extracted. Ong42, in his study included 3 different groups of extraction pattern based on
the overjet presented: four first premolars with a moderate overjet, upper first and lower
second premolars with the largest mean overjet and the four second premolars group in a
class I molar relationship with the same overjet with the four first premolars. The data
from his study were the following: 1) The amount of Overjet and the class of
malocclusion are considered to be important factors for the extraction pattern needed
2)the greater incisor retraction was observed in 4/4 (4.2 mm), 4/5(3.7mm) and
5/5(2.3mm). Cephalometric pre and post-treatment tracings were superimposed and
showed that the mean incisor retraction for 4/4 was 2.5mm ,4/5 was 1.6 mm. However in
the literature there are a variety of published mean incisal changes for different extraction
patterns. Furthermore, growth and treatment response varies individually and the decision
for a particular extraction pattern should be based on pretreatment characteristics and
biomechanics used.
Expected and Actual Torque of Upper incisors
13
The development of fixed appliances started in the late 1929 by Dr.Angle who
introduced the E-arch appliance followed by the Pin and tube appliance and Ribbon arch.
However, the above fixed appliances had a poor control of root placement. The
Edgwewise was the first fixed appliance, which allowed both tip and torque control of
teeth. In 1972,Andrews studied 120 normal occlusions using as reference plane the
“Andrews plane” and innovated the Straight Wire Appliance(SWA). In SWA each
bracket slot is designed to align with all adjacent slots when the teeth are perfectly
positioned. The “wagon wheel effect”, made Andrews to add additional tip in the anterior
teeth. However, due to heavy forces used at that period and the additional tip
incorporated into the brackets, the ‘roller coaster“ effect was seen in many cases. In 1993,
the MBT system changed the anterior tip of SWA and used the original research values.
The result of this change was that the upper front teeth had 10 degree less distal root tip
and the lower 12 degrees less compared with the original SWA. The changes made to
overcome some disadvantages of SWA such as loss of anchorage and bite deepening.
Today, there have been not only a large variety of pre-adjusted brackets with different
torque values for the same teeth, but also customized brackets for each patient.
The expression of torque is influenced by a variety of factors such as: 1)crown-root
morphology, labial enamel surface(LES) morphology, bracket placement technique,
bracket/wire play, excess composite on the pad of bracket’s base and the ligation mode
used to retain the archwire in the bracket slot. In the literature there is a variety in the
crown root angulation ranging from 156° to 194.8° according to Knosel43 and Bryant et
al 23,, by using lateral caphalograms such as U1-NA angle, studied the interaction
between incisor crown–root morphology and third order angulation in Class II division 2

14
cases. They found that the torque values of the brackets for the incisors should be
different between Class I and Class II division 2; based on the crown root angulation
which differ significantly from the normal values in class II division 2 case. Richmond 44
used, a tooth inclination protractor(TIP)based on occlusal plane and the cephalometric
angles U1-PP and IMPA to determine if any relationship existed between them in class I,
II and III. He found that the TIP method consistently underestimated the lateral
cephalometric measurements of maxillary incisor angulation by 10.46 degrees and
overestimated the lower incisors ones by 2.57 degrees. The TIP according with
Richmond is a reliable method and there is a close relationship between the maxillary and
mandibular incisors inclination on cast and with their cephalometric angulations .
However, the measurements of facio-lingual inclination and mesio-distal angulation
based on the model cast are not considered to be reliable method for obtaining the above
measurements because are based just on the crown and not on the crown –root
angulation. This variation between the long axis of the crown and the long axis of the
root would result in different root positions with constant crown positions. Hongsheng
45using CBCT, studied the facio-lingual inclination and mesio-distal angulation of 76
patients with “near normal” occlusion instead of the normal occlusion that Andrews used
in his sample of 120 non-orthodontic models. Hongsheng45 showed that the facio-lingual
angulation of upper central incisors and lower central and lateral incisors are similar with
those that Andrews found, while Hongsheng’s measurements was higher than Andrews
for the rest of upper teeth. Another important factor affecting the torque’s expression is
the LA point (midpoint of a crown) on which the bracket is placed. Over the years,
different bracket placement protocols have been recommended for the straight-wire

15
system. The FA point used by Andrews for placement of brackets was based on his belief
that the facial surface is more consistent with La point instead of using millimetric
measurements. This finding is not in agreement with Bryant17and Germane47 found a
standard deviation at La Point of maxillary central incisors of +/- 3.02 and +/-2.9 mm
respectively.
Germane46 also found that if the facio-lingual contour and wire size remain the same but
the vertical placement of a bracket differs from 4 to 5 and from 5 to 6 mm then the torque
expression is quite different from 24 to 22 and from 22 to 18.6 in Andrews prescription.
Miethke47 using the La point, studied the torque changes related to change in vertical
bracket positioning and found that 1 mm away from the LA point, alters the torque of
upper central, upper lateral and canine by 2.5, 4 and 3 degrees respectively if no play
existed between wire and bracket. The deviation of LA point led some researchers to
recommend a variety of bracket positioning charts based on incisal or occlusal edge of
teeth. According to McLaughlin, positioning the brackets using the incisal edge would
reduce the placement errors by 50-60% as well as the need to reposition brackets.
Armstrong 48,compared two methods of bracket positioning on cast models, using the FA
point and the distance from the incisal edge(ME). Armstrong 48 found that for the ME
method the correct bracket placement was more incisal than for the CC method and that
ME seems to be more accurate for the upper and lower teeth and less accurate for the
upper first premolars. Overall, Armostrong49 concluded that in both methods there is a
need for wire bending for acceptable orthodontic treatment results. Another factor, which
play important role on the expression of torque, is the bracket slot size used. There are 2
bracket slot systems incorporated in orthodontic treatment; the 0.18 and 0.22 inch-slot.

16
Detterline49 compared the two bracket slot system based on the ABO Objective Grading
System and found that although there is a statistically but not a clinically significant
difference in treatment time (4 months) and ABO–OGS score (2.7) in favor of 0,018 slot.
The amount of torque expressed from the bracket is the difference of the torque built into
the bracket slot and the degree of wire play engaged in the slot.Capeloza50shows that in
the literature there is a variety of wire play values in 0.22 slot with a 0.019x0.025
archwire such as: Dellinge shows a 9.63 , Creekmore 10.5 and Mclaughin 10 degrees.
Gioka et51 shows that there is a similar torque loss of 14 degrees between the
0.016x0.0.22 and 0.19x0.025 archwires in the 0.018 and 0.22 slots respectively. By
increasing the archwire size to 0.017x0.25 in a 0.018 bracket slot the torque play
decreases to a 6 degrees. Gioka et50 also showed that there is a significant difference
between the theoretical and the actual torque loss of 5% to 10% which is about 1 to 1.5
degrees of torque loss due to dimensional inaccuracy and torque inconsistency of
bracket’s slot. Taloumis52 showed that the steel ligatures provide a better control of
torque loss since the elastomeric materials show a rapid force decay of 53%-68% within
24 hours in vivo, because they are affected both from the intraoral temperature and
moisture. In conclusion, even with the use of customized braces and wires, orthodontists
should have always in his mind that a wire bending is the rule and no the exception for a
functional and esthetic orthodontic treatment result.

17
The purpose of this study was to determine if the upper incisor position changed
significantly after orthodontic treatment in Class I,II and III both dental and skeletal
malocclusions.
Purpose of Study

18
CHAPTER 2 MATERIALS AND METHODS Subject Selection Subjects that finished non-extraction orthodontic treatment to a high standard were
automatically included into the study. Each of these subjects had to meet the following
criteria:
1) All non-extraction cases should be finished in a Class I molar and cuspid relationship.
2) Normal cusp to fossa/cusp to embrasure position of teeth at completion of treatment.
3) Normal Overjet(1-2 mm) and Overbite (1-2 mm), where the mandibular canines and
incisors contact the lingual surfaces of the maxillary canines and incisors with a normal
inter-incisal angle.
4) Good quality of cephalometric radiographs before and after orthodontic treatment.
Once these criteria were met, the patients were reorganized into initial treatment
malocclusion and the pre-treatment cephalometric measurements such as the ANB angle
,Wits appraisal ,the mandibular angle and the FMA(MP-FH) angle to identify cases based
on the inclusion criteria:
1) Class I malocclusion should present an ANB from 0-2°, Wits from -1-0,
2) Class II malocclusion should present an ANB >2° and Wits > 1 and
3) Class III malocclusion should present an ANB <0 ° and a Wits <-1.Because the ANB
is influenced by the mandibular plane, the latter should be within a range of 27°-37°,
4) No significant dento-facial deformity (-3≥ ANB≤+5).
19
Approval for this study was given by UAB Institutional Review Board and the committee
assigned the ethics protocol number E140214011.
Sample Size
The sample size calculation was performed by using the non-inferiority test based on the
standard deviation for U1-SN(°) and U1-NA(mm).Table 2 as these showed the highest
variability. From these values, it was deemed that at least 30 individuals were needed in
each group and was based on the ability to have a non-inferiority value of 2 both
millimetric and degrees for U1-NA and 4 degrees for U1-NA and 4 degrees for SN °.
Data Collection
An initial search using the Dolphin management and Imaging Software system data base
provided a report of all patients who presented with a Class I, II and III malocclusion.
Almost 1500 patients were registered to be in the system having malocclusions at that
time. Each of these patients were further searched to meet necessary criteria and included
into the study.
All the lateral cephalograms were taken using the Orthopantomograph OP100,
Instrumentarium Corp. Imaging Division machine (Finland) and traced digitally using the
Dolphin Management and Imaging Software, Version 05.05.5070.221436(US &Canada).
After a careful search, 90 consecutive orthodontic cases were found based on the
inclusion criteria and evaluated at the time of debond.

20
Parameters measured
The parameters analyzed in the study were categorized into skeletal and dental groups.
A) Skeletal
In order to evaluate the skeletal relationships of the jaws with the cranial base the
1) SNA and 2) SNB angles were recorded, while both the 1) ANB angle and 2)
Wits analysis were used to evaluate the relationship of jaws to each other.
(B) Dental
In order to evaluate the maxillary and mandibular incisor positions, the 1) U1-PP(°), 2)
U1-SNº, 3) U1-NAº, 4) U1-NA(mm), 5) U1 perpendicular to FH mm, and 6) U1-L1(°)
cephalometric measurements were carried out based on the post-treatment lateral
cephalometric measurements. A summary of the cephalometric landmarks and planes can
be found in Table 1.
Statistical Analysis
For the purpose of this study, all the pre-treatment and post-treatment lateral
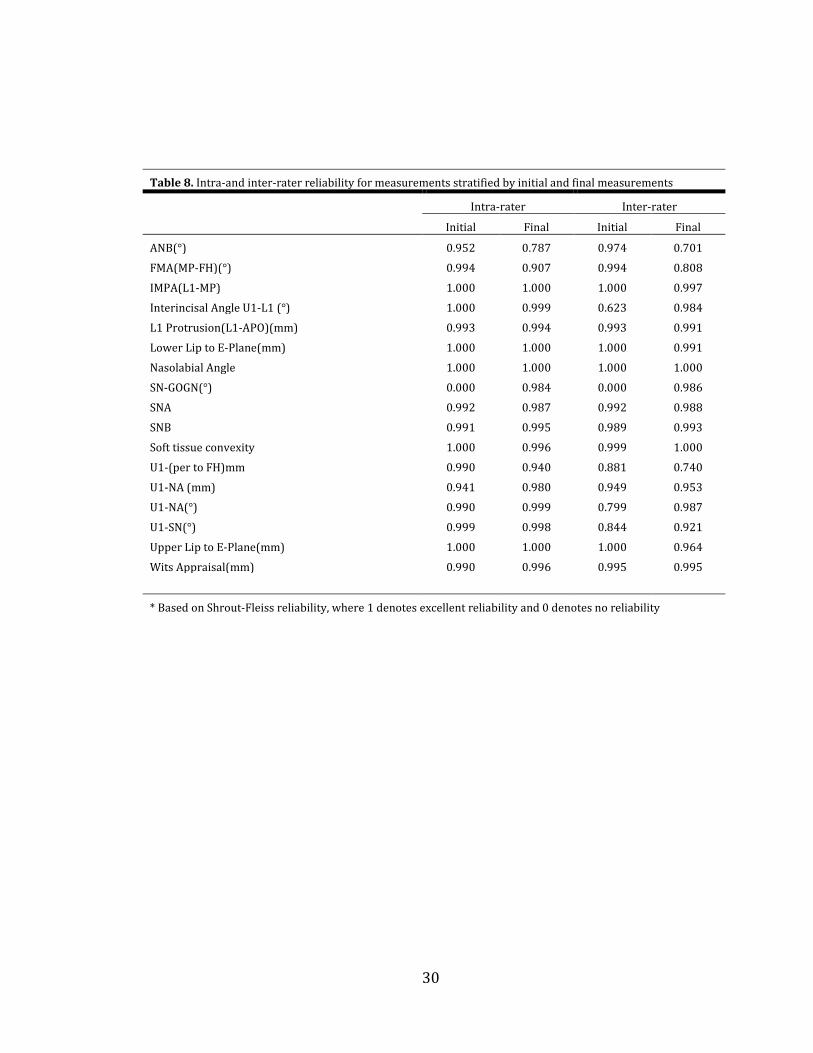
cephalograms, were traced by an orthodontic resident (K.B). The same lateral
cephalograms were traced by one senior orthodontist (CHK). The inter-observer
reliability was performed to determine any random and systematic error in tracing .The
intra-observer reliability was determined using the intra-class correlation coefficient
statistic analysis, table 8.
In order to calculate the maxillary incisor position changes based on our post-treatment
cephalometric measurements ANOVA test was used. In order to determine if there is a
statistically significant difference for the post- treatment position of maxillary incisors

21
among the Class I, II and III the range of +/- 2 degrees or millimetric of difference was
used and an ANOVA test was performed. A difference beyond that range should be
considered as a significant difference for the post-treatment position of maxillary incisors
position among the Class I, II and III malocclusions. The intra-rater and inter-rater
reliability were close to 1 for most of cephalometric measurements, Table 8.
Table 1
Cephalometric Landmarks
Landmarks Abbreviation Definition
A point A Deepest point of the curve of the maxilla between
Anterior spine and the dental alveolus
Point B B Deepest point between the most superior point on the
Alveolar bone overlying the mandibular incisors
and Pogonion.
Anterior Nasal Spine ANS The tip of the anterior nasal spine
Nasion N The most anterior point on the frontonasal suture in the
midsagittal plane
Orbitale Or The lowest point on the inferior rim of orbit
Posterior Nasal Spine PNS The tip of the posterior nasal spine
Sella S Center of the pituitary fossa of the sphenoid bone
Table 2
Reference Planes Abbreviation Definition
Frankfort Horizontal Plane FH The line connecting Po and OR
Nasion Perpendicular Plane NP A vertical reference plane created by drawing a line Perpendicular to FH through Nasion

22
Palate Plane PP The line connecting ANS and PNS
Mandibular plane MP Defined as a line connecting Gonion and Gnathion
Sella –Nasion SN The line forming the anterior cranial base
Nasion-A line NA Defined as a line connecting Nasion and A point.
Occlusal plane OC The line drawn through the region of the overlapping cusps of the first premolars and first molars.
Table 3
Measurements used in Cephalometric Analysis
Measurement Abbreviation Definition
SNA(°) SNA The angle from Sella -Nasion –A point.
SNB(°) SNB The angle from Sella –Nasion-B point.
ANB(°) ANB The antero-posterior discrepancy of the maxillary to the mandibular apical bases.
GoGn-SN (°) MP The angle formed between the GoGn and SN plane.
Go-Me-FH(°) FMA The angle formed between the Go-Me and FH plane.
AO-BO(mm) Wits The antero-posterior spatial relationship of the jaws relative to the occlusal plane.
U1-SN(°) U1-SN Angular relationship of the maxillary central incisor
to the anterior cranial base.
U1-NA(mm) U1-NA 1 Millimetric relationship of the maxillary central incisor to the NA line.
U1-NA(°) U1-NA 2 Angular relationship of the maxillary central incisor to
the NA line.
U1-FH(mm) U1-FH The distance from a vertical line drawn through point A and parallel to N-Pa, to the facial surface of the maxillary incisor.
U1-PP(°) U1-PP Angular relationship of the maxillary central incisor to
the PP.
U1-Ocl.Plane(°) U1-Oc Angular relationship of the maxillary central incisor to the occlusal plane
For the calculation of sample size, multiple tests for both the angular and millimetric
distances were performed for the U1-SN and U1-NA respectively. The total sample size

23
required for this study is 90 cases of which 30 was Class I, Class II and Class III
respectively. Table 4 provides the results of the analysis:
Table 4.
Sample size needed per group
U1-SN U1-NA
Difference values(° or mm)
2 94 23
3 42 11
4 24 6
24
CHAPTER 3
RESULTS
Our sample consisted of 90 patients with 30 patients in each Class I, Class II and Class III
malocclusion. All the orthodontic cases treated with upper and lower pre-adjusted
edgewise appliances (0.022’’ x 0.028 ‘’ slot) with MBT prescription. A 19x25 SS were
used as final archwire for all the treated orthodontic cases. All patients presented a mild
to moderate crowding of the teeth with the greatest amount of crowding presented in
Class I malocclusions. All the patients in Class II and III orthodontic cases were treated
with class II and III inter-maxillary elastics respectively while in some Class II cases a
ForsusTM (3M Unitek Corporation,Monrovia,CA) was used for that purpose due to poor
compliance reasons.
A comparison of mean difference between pre-treatment (T1) and post-treatment (T2)
measurements was performed in order to observe if there is a difference in the movement
during treatment by malocclusion classification. Negative values indicated a backward
movement and positive values indicated forward movement of the maxillary incisors
respectively. The null hypothesis is rejected when the p-value is <0.05.
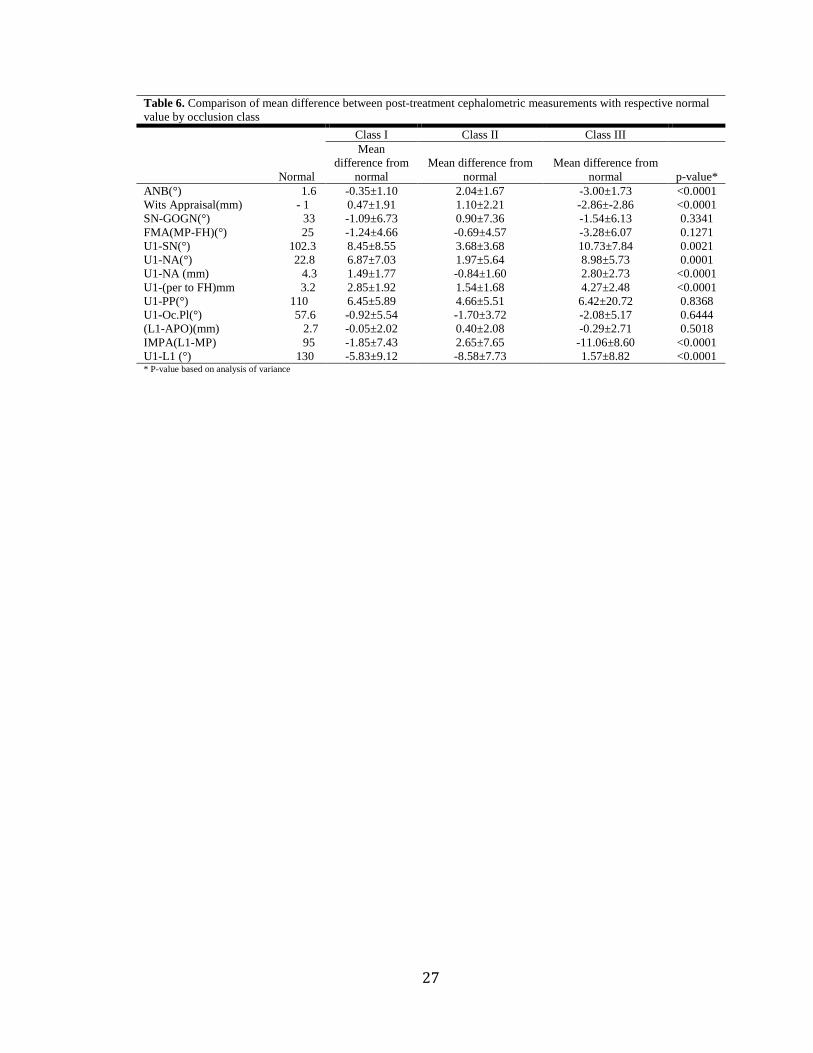
A comparison of mean difference between the post-treatment measurement and normal
value by occlusion class was performed in order to show if there is a difference in how
far the measurements are from the normal value by occlusion class. The results of this
comparison are presented in Table 6 and Figure 1. According to p-value, the post-
treatment values of ANB, Wits appraisal, U1-NA mm, U1-FH mm, IMPA and U1-L1°
show a statistically significance among the Class I, II and III when are compared to the
normal value. However, the U1-SN°, U1-PP° do not show a significant difference from

25
the normal value, with the Class III to present the most positive values for the maxillary
incisors, followed by Class I and Class II malocclusion. From the above could someone
observe that there is a significant amount of dento-alveolar compensation for the
maxillary incisors not only in treated Class II and III but also in Class I malocclusions?
On the other hand, the ANB ° changes happened with orthodontic treatment in Class I, II
and III are statistically significant with the greater changes happened in class III
malocclusion.
In order to determine if there is a significant difference in the post-treatment position of
maxillary incisors among Class I, II and III we used a range for the maxillary incisor
position changes. Table 7 shows, whether the post-treatment measurement falls within
2mm/degrees of the normal value. If the p-value is significant, then the mean value is not
within 2mm/degrees of the normal value.
In Table 7, we see that very few cephalometric measurements were not statistically
different within 2 units of the normal value. In both the class I and II malocclusions the
measurements which fall within the range of 2± are the Wits and L1-APO whereas in the
class II malocclusion the U1-Na mm is the only one. In the class III the only
measurement within the 2± range, is the L1-Apo mm. From looking over the results,
Class III has a tendency to show more positive U1-SN°, U1-NA°, U1-NA mm and U1-
FH mm of the normal, followed by Class I and Class II respectively. Although, the U1-
PP ° is not within the 2± range, it seems to have almost the same mean difference
between Class I and III, but with a high variability in the range of movement of the
maxillary incisors position. The only cephalometric measurement that falls within the
range of ±2 for all three malocclusions is the L1-Apo mm. However, the L1-MP°

26
presents the most negative mean difference within the range of ±2 in the Class III
malocclusion showing the greatest dento-alveolar compensation of the lower central
incisors happened both due to continuous growth of the mandible and the effect of Class
III inter-maxillary elastics. On the other hand , L1-MP ° in the class II malocclusion
shows a positive mean difference within the range of ±2 , showing the proclination of the
lower incisors by using Class II elastics for the correction of the Class II malocclusions.
The results of the analysis suggest that, the direction of movement during treatment is
similar between Class I and III but not in the class II and the post-treatment position of
the maxillary incisors depends on malocclusion.
Table 5. Comparison of mean difference between pre- and post-treatment cephalometric measurements by occlusion class Class I Class II Class III
Normal Mean difference from pre-treatment value
Mean difference from pre-treatment value
Mean difference from pre-treatment value p-value*
ANB(°) 1.6 -0.22±1.05 -1.34±1.30 -0.25±1.96 0.0057 Wits Appraisal(mm) -1 0.55±2.04 -2.03±2.47 0.30±2.19 <0.0001 SN-GOGN(°) 33 -1.05±4.05 -0.41±6.98 0.70±3.52 0.4077 FMA(MP-FH)(°) 25 0.45±5.19 0.29±3.44 0.17±5.52 0.9748 U1-SN(°) 102.3 7.55±6.65 5.61±9.78 6.50±8.62 0.1652 U1-NA(°) 22.8 6.74±6.90 6.50±8.62 4.17±6.86 0.3457 U1-NA (mm) 4.3 1.03±1.52 1.15±2.41 1.24±3.55 0.9527 U1-(per to FH)mm 3.2 0.20±2.19 0.15±2.12 3.55±0.77 0.5424 U1-PP(°) 110 5.94±7.75 6.55±7.72 0.92±21.87 0.2441 U1-Oc.Pl(°) 57.6 -5.56±5.80 -7.52±6.60 -3.48±7.79 0.0750 L1-APO(mm) 2.7 0.89±1.78 2.15±1.33 -0.82±2.53 <0.0001 IMPA(L1-MP) 95 2.49±8.58 2.95±5.21 -3.43±7.27 0.0011 U1-L1 (°) 130 -5.97±14.45 -9.19±10.03 -1.00±11.29 0.0344 * P-value based on analysis of variance
27
Table 6. Comparison of mean difference between post-treatment cephalometric measurements with respective normal value by occlusion class Class I Class II Class III
Normal
Mean difference from
normal Mean difference from
normal Mean difference from
normal p-value* ANB(°) 1.6 -0.35±1.10 2.04±1.67 -3.00±1.73 <0.0001 Wits Appraisal(mm) - 1 0.47±1.91 1.10±2.21 -2.86±-2.86 <0.0001 SN-GOGN(°) 33 -1.09±6.73 0.90±7.36 -1.54±6.13 0.3341 FMA(MP-FH)(°) 25 -1.24±4.66 -0.69±4.57 -3.28±6.07 0.1271 U1-SN(°) 102.3 8.45±8.55 3.68±3.68 10.73±7.84 0.0021 U1-NA(°) 22.8 6.87±7.03 1.97±5.64 8.98±5.73 0.0001 U1-NA (mm) 4.3 1.49±1.77 -0.84±1.60 2.80±2.73 <0.0001 U1-(per to FH)mm 3.2 2.85±1.92 1.54±1.68 4.27±2.48 <0.0001 U1-PP(°) 110 6.45±5.89 4.66±5.51 6.42±20.72 0.8368 U1-Oc.Pl(°) 57.6 -0.92±5.54 -1.70±3.72 -2.08±5.17 0.6444 (L1-APO)(mm) 2.7 -0.05±2.02 0.40±2.08 -0.29±2.71 0.5018 IMPA(L1-MP) 95 -1.85±7.43 2.65±7.65 -11.06±8.60 <0.0001 U1-L1 (°) 130 -5.83±9.12 -8.58±7.73 1.57±8.82 <0.0001 * P-value based on analysis of variance

28
Table 7. Equivalence tests for post-treatment cehpalometric measurement compared to the respective normal value Class I Class II Class III
Mean diff from
normal (90% CI)
Equivalence(
p-value
Equivalent Y/N
Mean diff from
normal (90% CI)
Equivalence
p-value
Equivalent Y/N
Mean diff
from normal (90%
CI)
Equivalence
p-value
Equivalent Y/N
ANB(°)
-0.35 (-0.69-[0.01])
<0.0001 Yes 2.04 (1.52-2.56)
0.5473 No -3.00 (-3.53-[-
2.46])
0.9982 No
Wits Appraisal(mm)
0.47 (-0.24-1.19)
<0.0001 Yes 1.10 (0.42-1.79)
0.0171 Yes -2.86 (-3.50-[-
2.23])
0.9862 No
SN-GOGN(°)
-1.09 (-3.18-0.99)
0.2331 No 0.90 (-1.39-3.18)
0.2100 No -1.54 (-3.45-0.46)
0.3432 No
FMA(MP-FH)(°)
-1.24 (-2.98-0.50)
0.1886 No -0.69 (-2.11-0.72)
0.0641 No -3.28 (-5.17-[-
1.40])
0.8718 No
U1-SN(°)
8.45 (5.80-11.10)
0.9999 No 3.68 (1.69-5.66)
0.9189 No 10.73 (8.30-13.17)
1.0000 No
U1-NA(°)
6.87 (4.69-9.05)
0.9997 No 1.97 (0.22-3.72)
0.4872 No 8.98 (7.20-10.75)
1.0000 No
U1-NA (mm)
1.49 (0.94-2.04)
0.0641 No -0.84 (-1.33-[-
0.34])
0.0002 Yes 2.80 (1.96-3.65)
0.9408 No
U1-(per to FH)mm
2.85 (2.26-3.45)
0.9894 No 1.54 (1.01-2.06)
0.0712 No 4.27 (3.50-5.04)
1.0000 No
U1-PP(°)
6.45 (3.24-9.66)
0.9959 No 4.66 (2.95 -6.37)
0.9934 No 6.42 (-0.003-12.85)
0.8741 No
U1-Oc.Pl(°)
-0.92 (-2.64-0.80)
0.1464 No -1.70 (-2.86-[0.54])
0.3292 No -2.08 (-3.68-[-
0.48])
0.5321 No
L1 Protrusion(L1-APO)(mm)
-0.05 (-0.80-0.70)
<0.0001 Yes 0.40 (-0.25-1.04)
0.0001 Yes -0.29 (-1.13-0.55)
0.0008 Yes
IMPA(L1-MP)
-1.85 (-4.16-0.45)
0.4573 No 2.65 (0.28-5.02)
0.6775 No -11.06 (-13.73-[-8.40])
1.0000 No
Interincisal Angle U1-L1 (°)
-5.83 (-8.66-[-
3.00])
0.9856 No -8.58 (-10.98-[-
6.18])
1.0000 No 1.57 (-1.16-4.31)
0.3964 No
* P-value based on equivalence t-test using (-2,2) as the test range † Comparisons that are equivalent note that the 90% confidence interval of the mean difference from normal falls between -2 and 2 (degrees or mm)

29
-12
-10
-8
-6
-4
-2
0
2
4
6
8
10
12
Mea
n di
ffere
nce
(mm
or
degr
ees)
Mean difference between post-treatment and normal cephalometric
measurements by occlusion class
Class I
Class II
Class III
Figure 1
30
Table 8. Intra-and inter-rater reliability for measurements stratified by initial and final measurements
Intra-rater Inter-rater
Initial Final Initial Final
ANB(°) 0.952 0.787 0.974 0.701 FMA(MP-FH)(°) 0.994 0.907 0.994 0.808 IMPA(L1-MP) 1.000 1.000 1.000 0.997 Interincisal Angle U1-L1 (°) 1.000 0.999 0.623 0.984 L1 Protrusion(L1-APO)(mm) 0.993 0.994 0.993 0.991 Lower Lip to E-Plane(mm) 1.000 1.000 1.000 0.991 Nasolabial Angle 1.000 1.000 1.000 1.000 SN-GOGN(°) 0.000 0.984 0.000 0.986 SNA 0.992 0.987 0.992 0.988 SNB 0.991 0.995 0.989 0.993 Soft tissue convexity 1.000 0.996 0.999 1.000 U1-(per to FH)mm 0.990 0.940 0.881 0.740 U1-NA (mm) 0.941 0.980 0.949 0.953 U1-NA(°) 0.990 0.999 0.799 0.987 U1-SN(°) 0.999 0.998 0.844 0.921 Upper Lip to E-Plane(mm) 1.000 1.000 1.000 0.964 Wits Appraisal(mm) 0.990 0.996 0.995 0.995
* Based on Shrout-Fleiss reliability, where 1 denotes excellent reliability and 0 denotes no reliability
31
CHAPTER 4 DISCUSSION
To date, few studies of significant sample size have been published on the use of
maxillary incisors position as a reference point in diagnosis and orthodontic treatment.
Therefore, the goal of this retrospective cohort study was to evaluate the post-treatment
values of maxillary incisors and determine if there is any significant difference in their
final position among Class I, II and III malocclusions.
According to the inclusion criteria of this study, nighty subjects were collected from the
UAB orthodontic clinic at the University of Alabama at Birmingham. All the above
orthodontic cases were treated with fixed appliances and according to the standards of
American Boards. All the cases were treated using with MBT bracket prescription and
the final archwire size was a 19x25 SS .In this study, they have been used the following
cephalometric analyses: Downs, Steiner, McNamara and Fastlicht Tetragon. All the
lateral cephalometric radiographs were taken using the Orthoceph0c100D x-ray machine
(Finland) and traced digitally using the Dolphin management Version
05.05.5070.221436(US &Canada).
By using a range of Sn-Go between 26° and 38° and with an ANB° between -2° and 6°
,we consider our sample to represent an average orthodontic treatment complexity for an
orthodontist. In this study the average post-treatment values of U1-PP° was 116° in both
Class I and III whereas this angle was 114° for Class II. In comparison to McLaughlin’s
study, regarding the U1-PP normal value after the orthodontic treatment, in this study

32
there is an additional difference of 14° in the Class II(114° instead of 100°) and 4 ° less in
the Class III (116° instead of 120°) .In this study, the average post-treatment value of
U1-PP in the Class I is 116°, (similar with the Class III malocclusion in this study) is in
agreement to McLaughlin’s17 study in which the average post-treatment value of U1-PP°
is between 108°-117° . At this point we need to mention that all of the orthodontic cases
in this study presented a moderate amount crowding with the greatest amount of
crowding presented in Class I malocclusions.. In the literature, the maxillary incisors
position is important because of their effect on space within the dental arches. In extreme
cases, incisor protrusion can produce an ideal alignment of the teeth instead of sever
crowding of teeth, at the expense of lip competence. From the above we can assume that
both the angulation and inclination of the maxillary incisors just after the alignment and
before the correction of it , should be greater in comparison to their pre-treatment values.
Further comparing our findings with literature, Bhasin16 found that the post-treatment
reduction of U1-PP angle to be reduced significantly in skeletal class II patients followed
by class I and least for class III patients. Our data, in Class I and III show that U1-SN °,
U1-NA°, U1-NA mm and U1-OC° angles have a similar both movement direction, but in
class II although the U1-Na° is slightly increase the U1-FH is reduced with a movement
in a negative direction. On the other hand, in Class III, the U1-PP° angle seems to have a
greater positive movement in a forward direction which is in agreement with Bashin 16
study which showed that in skeletal class III cases the upper incisors were proclined in
60% of the cases .
In table 7, we observe that the only equivalent cephalometric measurement among the
three malocclusions within the range of ± 2, is the L1-APO whereas both IMPA° and

33
U1-L1 ° are not. More specifically, it seems that the IMPA ° plays a more important role
in the correction of Class III malocclusions compared to class II malocclusions which is
in not in agreement with Bibby 21. The U1-L1 seems to be decreased more in class II
compared to Class I malocclusion whereas it shows a slightly increase in the Class III
malocclusions..
In this study, both millimetric and angular cephalometric measurements were used to
determine the maxillary incisors position changes relative to the anteroposterior
position of this tooth in facial complex . Further comparing the U1-NA mm and U1-FH
mm , it seems to be a greater inclination of the maxillary incisors for the Class I and
Class III compared to a lesser value of U1-FH mm and a negative inclination changes
of U1-NA mm in Class II malocclusions33,34. By looking at U1-NA mm (Table 6) we
can see that the malocclusion with the greater post-treatment proclination of upper
incisors is the Class III which also presents the most negative change in ANB .The
negative ANB post-treatment changes in Class III malocclusion might not be only
caused of the jaws relationship each other but also because the backward movement of
point A due to proclination of the upper central incisors. The last phenomenon is in
agreement with BeGole 22 who showed that the SNA° was reduced by 1.6 ° due to
proclination of maxillary teeth. On the other hand, the proclination of maxillary incisors
accompanied by backward movement of incisor root apex caused posterior movement of
point A but this does not significantly affect the SNA°.19 20 21 The inclination changes of
U1-NA mm in Class II, seem to be within the range of -2 and 2 mm according with
the equivalent tests for post-treatment cephalometric measurements compared to the
respective normal value whereas is not for maxillary incisors angulation as the U1-NA°

34
shows . Figure1, shows that both U1-FH and U1-NA mm post-treatment values compared
to U1-SN° and U1-NA° seem to be less influenced after orthodontic treatment. From the
above we can assume that the class II and Class III inter-maxillary elastics influence
more the inclination and less the angulation of the upper maxillary teeth during the
orthodontic treatment. In literature is also mentioned that using Class II elastics in a long-
term period has a side effect to upright the maxillary incisors.
By comparing the post-treatment changes in ANB the smallest amount of changes was in
Class III followed by Class I and Class II respectively. On the other hand, by relating the
post-treatment changes happened in the inter-incisal angle we observe that both in Class I
and Class II there is a tendency for decreasing this angle whereas for Class III this angle
tends to be increased . From the above we can conclude that the greater the skeletal
discrepancy initially in both Class I and II , the lesser the inter-incisal angle would be
after treatment ,whereas in Class III there seems that the inter-incisal angle have a
tendency for increasing mainly due to the dento-alveolar compensation of lower incisors
.12 From the above, the ideal inter-incisal angle of 131° according to Steiner or Down’s
of 135.4° seems to be not a realistic goal for every orthodontic case since it depends on
the skeletal discrepancy of jaws.14
Statistical analysis yield high standard deviations for most measurements and variables
investigated. This is due in part to the different orthodontic treatment methods used for
the correction of malocclusion in class I, II and III, but also the small range ±2 used in
the equivalent test. Although in this study the final archwire size for all the selected cases
was 0.019 x 0.025 SS, it is not only unknown the bracket placement method used in our
sample but also the duration of wearing the inter-maxillary elastics for the correction of

35
Class II and III which both of them could influence the final position of maxillary central
incisors .48,49,52.
Future studies could attempt to have a more uniform sample with regard to the amount of
crowding presented among Class I, II and III malocclusions. It seems that the final
position of maxillary incisors was not only influenced by both their pre-treatment
position and the jaw discrepancy but also by their variability of crowding among the
malocclusions. From the above, we could compare more precisely the final position of
maxillary teeth among the three malocclusions. By relating the data presented in this
study, it may be possible to meet this goal.

36
CONCLUSIONS
There is a significant difference in the positioning of the maxillary incisors among the
class I, II and III malocclusions. The post-treatment measurements such as U1-FHmm,
U1-NA mm and U1-SN° and U1-NA° present a significance difference among Class I, II
and III malocclusions. In In the class II, the maxillary teeth showed to be more upright
than Class I and III malocclusions after orthodontic treatment.
The U1-PP° showed no significant difference among the malocclusions. In this study, the
U1-PP° was the same for the Class I and III.
The U1-L1° presented a significant difference among the 3 malocclusions with the
greatest amount of reduction in Class II, followed by Class I malocclusion. On the other
hand, this angle was increased in Class III malocclusions. From the above we can
conclude that the greater the skeletal discrepancy initially in Class II, the lesser the inter-
incisal angle would be after treatment. Whereas, in Class III it seems that the inter-
incisal angle has a tendency to increase due to the dento-alveolar compensation of
Maxillary and mandibular incisors(U1-Namm and L1-MP°) .

37
REFERENCES 1)Ramos, A L (2005). Upper lip changes correlated to maxillary incisor retraction--a metallic implant study. The Angle orthodontist 75 (4), p. 499 2) Ghahferokhi, A E (2002). Critical assessment of a device to measure incisor crown inclination. American journal of orthodontics and dentofacial orthopedics 121 (2), p. 185. 3) Nouri, M (10/2014). "Measurement of the buccolingual inclination of teeth: manual technique vs 3-dimensional software". American journal of orthodontics and dentofacial orthopedics (0889-5406), 146 (4), p. 522. 4) B. Holly Broadbent (1981). A new x-ray technique and its application to orthodontia.The Angle Orthodontist 51 (2), p. 93-114 5) Arthur B. Lewis (1950) .The Impact of Cephalometry on Orthodontic Concepts. The Angle Orthodontist 20 (2), p. 67-73. 6) Wahl, N (2006). Orthodontics in 3 millennia. Chapter 8: The cephalometer takes its place in the orthodontic armamentarium. American journal of orthodontics and dentofacial orthopedics 129 (4), p. 574. 7)Shetty D,Bagga DK (2013). Cephalometric Study of Various Horizontal Reference Planes in Natural Head Position.J Ind Orthod Soc 47(3), p143-147. 8) Proffit, W. R., Fields, H. W., & Sarver, D. M. Contemporary orthodontics. St. Louis, Mo: Mosby Elsevier , 2013, p 190. 9) Cephalometric reference planes—Sella Nasion vs. Frankfort horizontal: E. Ellis and J. McNamara Int. J. Adult Orthodon. Orthognath. Surg 3 (2), p.81–87 10)) Richard A. Riedel (1952) The relation of maxillary structures to cranium in malocclusion and in normal occlusion. The Angle Orthodontist: July 1952, Vol. 22, No. 3, pp. 142-145 11) Jacobson, A (1975). The "Wits" appraisal of jaw disharmony. American journal of orthodontics 67 (2), p. 125. 12) Jacobson A, Jacobson RL. Radiographic Cephalometry. From Basics to 3-D Imaging. 2 nd ed., Ch. 9. Hanover IL: Quintessence Publishing; 2006. p. 99.

38
13) Charles H. Tweed (1954). The Frankfort-Mandibular Incisor Angle (FMIA) In Orthodontic Diagnosis, Treatment Planning and Prognosis. The Angle Orthodontist:. 24 (3),p. 121-169 14) Charles J. Kowalski and Geoffrey F. Walker (1972). The Use of Incisal Angles in the Steiner Cephalometric Analysis. The Angle Orthodontist 42 (2) ,p. 87-95 15) Fastlicht J (2000). Tetragon:A visual cephalometric analysis.J Clin Orthod 34(6), p. 353-60 16) Bhasin, V. S (2013). A cephalometric evaluation of pretreatment and post-treatment outcome using Tetragon analysis: a retrospective study. The journal of contemporary dental practice 14 (2), p. 238. 17) McLaughlin RP, Bennett JC, Trevisi HJ. Systemized Orthodontic Treatment Mechanics. 2 ed Mosby,2001, p 176 18) McNamara, J A (1984). A method of cephalometric evaluation. American journal of orthodontics 86 (6), p. 449 19) Nanda, R S (1990). Growth changes in the soft tissue facial profile. The Angle orthodontist 60 (3), p. 177 20) ) Prahl-Andersen, B (1995). Adolescent growth changes in soft tissue profile. American journal of orthodontics and dentofacial orthopedics 107 (5), p. 476. 21) Bibby, R E (1980). Incisor relationships in different skeleton facial patterns. The Angle orthodontist 50 (1), p. 41. 22) McIntyre, Grant T (2003). Crown root shape of the permanent maxillary central incisor. The Angle orthodontist 73 (6), p. 710 23) Bryant, R M (1984). Variability in three morphologic features of the permanent maxillary central incisor. American journal of orthodontics 86 (1), p. 25. 24) Kazem S. Al-Nimri, Abdalla M. Hazza'a, and Rami M. Al-Omari (2009). Maxillary Incisor Proclination Effect on the Position of Point A in Class II division 2 Malocclusion. The Angle Orthodontist: September 79 (5), p. 880-884. 25) Ali Altug Bicakci (2014). Does proclination of maxillary incisors really affect the sagittal position of point A? The Angle Orthodontist 284 (2), p. 386-386 26) Al-Abdwani, Rasha (2009). Change of incisor inclination effects on points A and B. The Angle orthodontist 79 (3), p. 462.

39
27) John F. Cleall and Ellen A. Begole (1982) .Diagnosis and Treatment of Class II Division 2 Malocclusion. The Angle Orthodontist 52 (1), p. 38-60. 28) Andrews, Lawrence F (1972). The six keys to normal occlusion. American journal of orthodontics 62 (3), p. 296. 29) O'Higgins, E A (1999). The influence of maxillary incisor inclination on arch length". British journal of orthodontics 26 (2), p. 97. 30) Sangcharearn, Yasinee (2007). Maxillary incisor angulation and its effect on molar relationships. The Angle orthodontist 77 (2), p. 221 31) Baccetti, T (2000).Treatment timing for Twin-block therapy. American journal of orthodontics and dentofacial orthopedics 118 (2), p. 159 32) Siara-Olds, Nicole J (2010).Long-term dentoskeletal changes with the Bionator, Herbst, Twin Block, and MARA functional appliances. The Angle orthodontist 80 (1), p. 18 33) Janson, Guilherme (2013).Correction of Class II malocclusion with Class II elastics: a systematic review. American journal of orthodontics and dentofacial orthopedics 143 (3), p. 383 34) Nelson, B (2000).Class II correction in patients treated with class II elastics and with fixed functional appliances: a comparative study. American journal of orthodontics and dentofacial orthopedics 118 (2), p. 142. 35) Miller, Robert A (2013).Incisor inclination changes produced by two compliance-free Class II correction protocols for the treatment of mild to moderate Class II malocclusions. The Angle orthodontist 83 (3), p. 431 36) LeCornu, Megan (2013).Three-dimensional treatment outcomes in Class II patients treated with the Herbst appliance: a pilot study. American journal of orthodontics and dentofacial orthopedics 144 (6), p. 818. 37) Konstantonis, Dimitrios (2012).The impact of extraction vs nonextraction treatment on soft tissue changes in Class I borderline malocclusions. The Angle orthodontist 82 (2), p. 209. 38) Seben, Marisana Piano (2013). Cephalometric changes in Class II division 1 patients treated with two maxillary premolars extraction. Dental press journal of orthodontics 18 (4), p. 61. 39) Tadic, Nevenka (2007). Incisal and soft tissue effects of maxillary premolar extraction in class II treatment. The Angle orthodontist 77 (5), p. 808.

40
40) Bishara, S E (1995). Dentofacial and soft tissue changes in Class II, division 1 cases treated with and without extractions. American journal of orthodontics and dentofacial orthopedics 107 (1), p. 28. 41) Zierhut, E C (2000). Long-term profile changes associated with successfully treated extraction and nonextraction Class II Division 1 malocclusions. The Angle orthodontist 70 (3), p. 208. 42) Ong, H B (2001). An occlusal and cephalometric analysis of maxillary first and second premolar extraction effects. The Angle orthodontist 71 (2), p. 90. 43) Knösel, Michael (2009). On the interaction between incisor crown-root morphology and third-order angulation. The Angle orthodontist 79 (3), p. 454. 44) Richmond, S (1998). Assessing incisor inclination: a non-invasive technique. European journal of orthodontics 20 (6), p. 721. 45) Tong, Hongsheng (2012). Mesiodistal angulation and faciolingual inclination of each whole tooth in 3-dimensional space in patients with near-normal occlusion. American journal of orthodontics and dentofacial orthopedics 141 (5), p. 604. 46) Germane, N (1989). Three biologic variables modifying faciolingual tooth angulation by straight-wire appliances. American journal of orthodontics and dentofacial orthopedics 96 (4), p. 312. 47) Miethke, R R (1999). Effect of variation in tooth morphology and bracket position on first and third order correction with preadjusted appliances . American journal of orthodontics and dentofacial orthopedics 116 (3), p. 329. 48) ) Armstrong, David (2007). A comparison of accuracy in bracket positioning between two techniques--localizing the centre of the clinical crown and measuring the distance from the incisal edge. European journal of orthodontics 29 (5), p. 430. 49) Detterline, David A (2010). Clinical outcomes of 0.018-inch and 0.022-inch bracket slot using the ABO objective grading system. The Angle orthodontist 80 (3), p. 528. 50) Capelloza,Leopoldino (2012). Bracket wire play:What to expect from tipping prescription on pre-adjusted appliances. Dental Press Journal of Orthodontics 17 (4), p.85 51) ) Gioka, Christiana (2004). Materials-induced variation in the torque expression of preadjusted appliances. American journal of orthodontics and dentofacial orthopedics 125 (3), p. 323.

41
52) Taloumis, L J (1997). Force decay and deformation of orthodontic elastomeric ligatures. American journal of orthodontics and dentofacial orthopedics 111 (1), p. 1.

42
APPENDIX A
INSTITUTIONAL REVIEW BOARD APPROVAL

43