upper klamath and lost river subbasins tmdl and water ... · oregon department of environmental...
TRANSCRIPT

Oregon Department of Environmental Quality
Upper Klamath and Lost River Subbasins TMDL and Water Quality Management Plan December 2017
TMDL Program 700 NE Multnomah St.
Suite 600
Portland, OR 97232 Phone: 541-273-7002
Contact: Mike Hiatt
www.oregon.gov/DEQ
DEQ is a leader in restoring, maintaining and
enhancing the quality of
Oregon’s air, land and
water.

State of Oregon Department of Environmental Quality ii
This report prepared by:
Oregon Department of Environmental Quality
700 NE Multnomah St, Suite 600 Portland, OR 97232
541-273-7002 www.oregon.gov/deq
Contact:
Mike Hiatt [email protected]
Documents can be provided upon request in an alternate format for individuals with disabilities or in a language other than English for people with limited English skills. To request a document in another format or language, call DEQ in Portland at 503-229-5696, or toll-free in Oregon at 1-800-452-4011, ext. 5696; or email [email protected].

State of Oregon Department of Environmental Quality iii
Table of Contents Executive Summary................................................................................................................................... 1
Klamath River TMDLs................................................................................................................................ 2
Lost River TMDLs ...................................................................................................................................... 2
TMDL Summaries ...................................................................................................................................... 3
Summary of Load Allocations and Waste Load Allocations: ............................................................... 3
Report Organization .................................................................................................................................. 5
Chapter 1: Introduction ............................................................................................................................. 6
1.1 Introduction .......................................................................................................................................... 7
1.2 Overview of Total Maximum Daily Loads .......................................................................................... 9
1.2.1 What is a TMDL? ............................................................................................................................ 9
1.2.2 Permitting and Enforcement Tools ............................................................................................... 12
1.2.3 Endangered Species Act Consultation ......................................................................................... 12
1.2.4 Tribal Trust Responsibilities ......................................................................................................... 12
1.2.5 FERC Relicensing ........................................................................................................................ 12
1.2.6 TMDL Implementation via the Water Quality Management Plan ................................................. 13
1.2.7 Adaptive Management Process .................................................................................................... 14
1.3 Subbasin Overview .......................................................................................................................... 14
1.3.1 Geology ........................................................................................................................................ 15
1.3.2 Climate .......................................................................................................................................... 17
1.3.3 Land Use and Ownership ............................................................................................................. 19
1.3.4 Hydrology ...................................................................................................................................... 21
1.3.5 Water Management Districts ........................................................................................................ 25
1.3.6 Point Sources ............................................................................................................................... 26
1.3.7 Nonpoint Sources ......................................................................................................................... 29
1.3.8 Fishery Resources ........................................................................................................................ 30
1.4 References ......................................................................................................................................... 35
Chapter 2: Klamath River Dissolved Oxygen, Chlorophyll a, pH, and Ammonia Toxicity ............... 37
2.1 Introduction ........................................................................................................................................ 38
2.2 Target Identification .......................................................................................................................... 40
2.2.1 Sensitive Beneficial Uses ............................................................................................................. 40
2.2.2 Dissolved Oxygen Water Quality Standard (relevant parts) ......................................................... 40
2.2.3 pH Standard:................................................................................................................................. 41
2.2.4 Nuisance Phytoplankton Growth .................................................................................................. 42
2.2.5 Ammonia Toxicity ......................................................................................................................... 42

State of Oregon Department of Environmental Quality iv
2.3 Deviation from Water Quality Standard .......................................................................................... 42
2.3.1 Dissolved Oxygen, pH and Ammonia Toxicity ............................................................................. 43
2.4 Seasonal Variation ............................................................................................................................ 48
2.5 Water Quality Modeling Overview.................................................................................................... 50
2.6 Source Assessment .......................................................................................................................... 52
2.6.1 Pollutant Identification .................................................................................................................. 52
2.6.2 Upstream Condition - Upper Klamath Lake .................................................................................. 55
2.6.3 Point Sources ............................................................................................................................... 57
2.6.4 USBR’s Klamath Project: Lost River Diversion Channel and Klamath Straits Drain ................... 58
2.6.5 PacifiCorp’s Klamath River Hydroelectric Projects ....................................................................... 62
2.6.6 Agriculture ..................................................................................................................................... 63
2.6.7 Irrigation Districts .......................................................................................................................... 63
2.6.8 Forestry ......................................................................................................................................... 63
2.6.9 Urban / residential ........................................................................................................................ 63
2.6.10 Other Possible Upland Sources ................................................................................................. 63
2.6.11 Natural Sources .......................................................................................................................... 63
2.6.12 Internal Sources and Sinks ......................................................................................................... 64
2.6.13 Keno impoundment Source Evaluation ...................................................................................... 66
2.6.14 Current Loading Analysis ........................................................................................................... 66
2.7 Water Quality Standard Attainment Analysis ................................................................................. 70
2.7.1 Natural Conditions Baseline ......................................................................................................... 70
2.7.2 Loading Capacity .......................................................................................................................... 72
2.7.3 Allocations to address DO, pH, excess algae and ammonia toxicity impairments ...................... 73
2.7.4 Instream Targets........................................................................................................................... 83
2.8 Margins of Safety ............................................................................................................................... 84
2.8.1 Uncertainty Analysis ..................................................................................................................... 84
2.8.2 Conservative Assumptions ........................................................................................................... 87
2.10 References ....................................................................................................................................... 88
Chapter 3: Lost River Dissolved Oxygen, Chlorophyll a, pH, and Ammonia Toxicity ..................... 91
3.1 Introduction ........................................................................................................................................ 92
3.2 Pollutant Identification ...................................................................................................................... 93
3.3 Target Identification – CWA §303(d)(1) ........................................................................................... 95
3.3.1 Sensitive Beneficial Uses ............................................................................................................. 95
3.3.2 Water Quality Standard Identification ........................................................................................... 96
3.3.2.4 Ammonia Toxicity ...................................................................................................................... 97
3.4 Deviation from Water Quality Standard .......................................................................................... 97

State of Oregon Department of Environmental Quality v
3.5 Seasonal Variation - CWA §303(d)(1) ............................................................................................ 100
3.6 Source Assessment - CWA §303(d)(1) .......................................................................................... 102
3.6.1 Overview of Sources .................................................................................................................. 102
3.6.3 Analysis - Water Quality Modeling.............................................................................................. 108
3.7 Water Quality Standard Attainment Analysis – CWA §303(d)(1) ................................................ 113
3.7.1 Nutrient and CBOD Reduction Analysis ..................................................................................... 119
3.8 Loading Capacity - 40 CFR 130.2(f) ............................................................................................... 120
3.9 Allocations - 40 CFR 130.2(g) and (h) ............................................................................................ 121
3.10 Margins of Safety - CWA §303(d)(1) ............................................................................................. 126
3.11 Reserve Capacity ........................................................................................................................... 126
3.12 References ..................................................................................................................................... 127
Chapter 4: Water Quality Management Plan ....................................................................................... 128
4.1 Introduction ...................................................................................................................................... 129
4.2 Adaptive Management .................................................................................................................... 131
4.3 Water Quality Management and Implementation Plan Guidance ............................................... 133
4.3.1 Condition Assessment and Problem Description ....................................................................... 134
4.3.2 Goals and Objectives ................................................................................................................. 136
4.3.3 Proposed Management Strategies ............................................................................................. 138
4.3.4 Timeline for Implementing Management Strategies ................................................................... 140
4.3.5 Relationship of Management Strategies to Attainment of Water Quality Standards .................. 141
4.3.6 Identification of Responsible Participants or DMAs.................................................................... 141
4.3.7 Identification of Sector-Specific Implementation Plans .............................................................. 143
4.3.8 Schedule for Preparation of Implementation Plans .................................................................... 146
4.3.9 Reasonable Assurance .............................................................................................................. 147
4.3.10 Monitoring and Evaluation ........................................................................................................ 148
4.3.11 Public Involvement ................................................................................................................... 148
4.3.12 Maintaining Management Strategies over Time ....................................................................... 148
4.3.13 Costs and Funding ................................................................................................................... 148
4.3.14 Citation of Legal Authorities ...................................................................................................... 149
4.4 TMDL - Related Programs, Incentives and Voluntary Efforts ..................................................... 151
4.4.1 Water Quality Credit Trading Opportunities ............................................................................... 151
4.4.2 Local Collaborative Watershed Enhancement Processes ......................................................... 153
4.4.3 The Oregon Plan for Salmon and Watersheds .......................................................................... 153
4.5 References ....................................................................................................................................... 154

State of Oregon Department of Environmental Quality vi
Tables Table 1-1. Beneficial Uses of Klamath River and Lost River tributaries ...................................................... 9 Table 1-2. Waterbodies and impairments identified as “Water Quality Limited, TMDL needed” on DEQ’s 2004/2006 303(d) List for which a TMDL is presented in this document. ................................................. 10 Table 1-3. Waterbodies and impairments identified as “Water Quality Limited” on DEQ’s 2004/2006 303(d) List for which a TMDL is NOT presented in this document. ........................................................... 11 Table 1-4. Upper Klamath and Lost River Subbasin – NPDES General Permits .................................... 26 Table 1-5. Individually permitted sites in the Upper Klamath and Lost River Subbasin. DOM indicates domestic while IND indicates industrial sources. ...................................................................................... 26 Table 1-6. Native Fish Species in the Upper Klamath Basin with Special Federal and/or State Status .. 30 Table 1-7. Fish Found Above Iron Gate Dam in the Klamath River Basin ............................................... 31 Table 1-8. Sucker and Redband Trout Periodicity for the Klamath River in Oregon ............................... 32 Table 2-1. Dissolved Oxygen, pH, Ammonia Toxicity, and Nutrient TMDL Components ........................ 39 Table 2-2. Designated beneficial uses occurring in the Klamath Basin (OAR 340-041-0180(1)) ............ 40 Table 2-3. Summary of Dissolved Oxygen Standard, applicability and assessment of the Klamath River ................................................................................................................................................................... 41 Table 2-4. Klamath River in Oregon, 303(d) list (2004)............................................................................ 43 Table 2-5 Model components applied to each Klamath River modeling segment. ................................... 51 Table 2-6. NPDES Dischargers in the Upper Klamath Subbasin. ............................................................ 57 Table 2-7. Simplified annual pollutant loading capacity and excess load computed from flow and concentration at the state line. ................................................................................................................... 73 Table 2-8. Nonpoint Source Load Allocations and target water quality compliance concentrations using flow-weighted averages. ............................................................................................................................ 75 Table 2-9. Point Source Waste Load Allocations using flow-weighted averages. ................................... 75 Table 2-10. Keno impoundment and JC Boyle Reservoir Load Allocations, averaged by month............ 81 Table 3-1. Dissolved Oxygen, pH, Ammonia Toxicity and Nutrients TMDL Components ....................... 93 Table 3-2. Beneficial uses occurring in the Lost River Subbasin (OAR 350 – 41 – 0180(1)) .................. 95 Table 3-3. Lost River Subbasin 303(d) list for 2004. ................................................................................ 97 Table 3-4. Nitrogen Cycle Processes ..................................................................................................... 107 Table 3-5. Model Configuration .............................................................................................................. 109 Table 3-5. Water Quality Criteria Evaluated for Attainment Analysis ..................................................... 113 Table 3-7. Load Reduction for Water Quality Standards Attainment ..................................................... 120 Table 3-8. Dissolved Oxygen Augmentation for Impoundments. ........................................................... 120 Table 3-9. Annual Lost River Pollutant Loading Capacity. ..................................................................... 121 Table 3-10. Required instantaneous oxygen augmentation in the impoundments. ............................... 121 Table 3-11. Nonpoint Source Allocation Summary by River Mile Segment. .......................................... 122 Table 3-12. Overall Nonpoint Source Load Allocation for Designated Management Agencies Discharging to the Lost River System. .................................................................................................... 123 Table 3-13. Load Allocations for Impoundments. ................................................................................... 123 Table 3-14. Point Source Wasteload Allocation Summary..................................................................... 125 Table 4-1. Current Water quality Conditions .......................................................................................... 134 Table 4-2. Pollutant management strategies for dissolved oxygen, pH, ammonia, and chlorophyll a. .. 139 Table 4-3. Water Quality Management Plan and DMA Specific Implementation Plan Timeline. ........... 140 Table 4-4. List of organizations with TMDL responsibilities. .................................................................. 142
State of Oregon Department of Environmental Quality vii
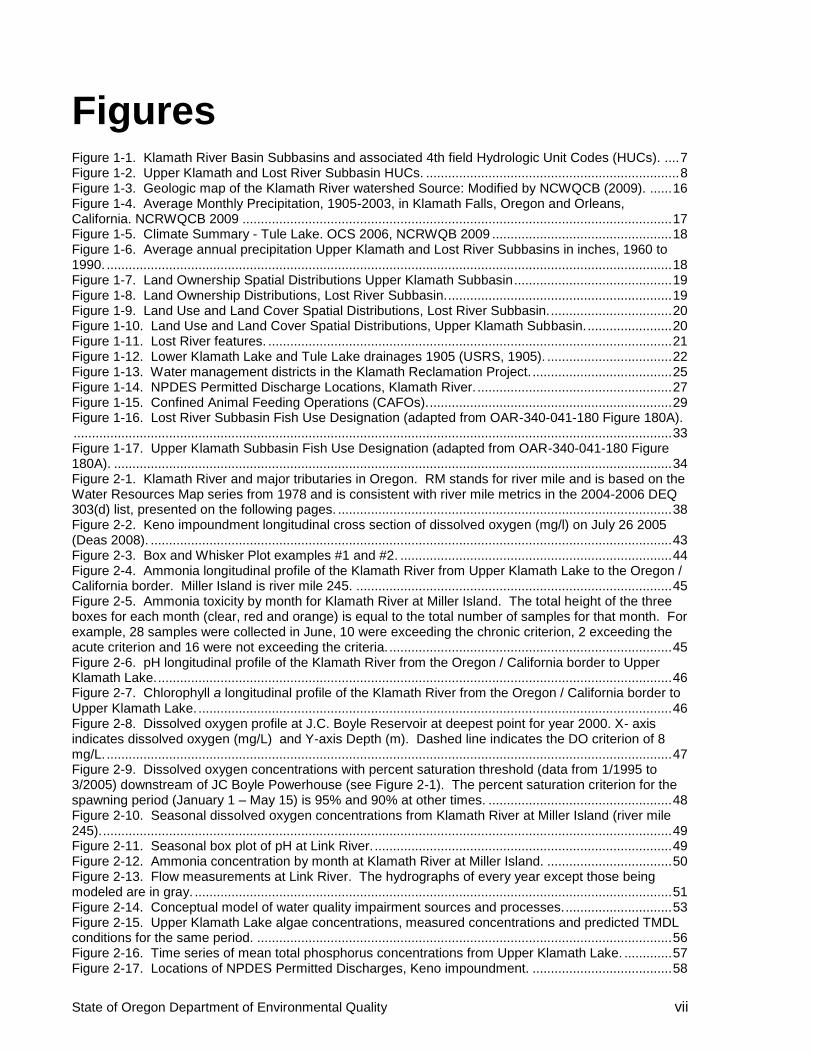
Figures Figure 1-1. Klamath River Basin Subbasins and associated 4th field Hydrologic Unit Codes (HUCs). .... 7 Figure 1-2. Upper Klamath and Lost River Subbasin HUCs. ..................................................................... 8 Figure 1-3. Geologic map of the Klamath River watershed Source: Modified by NCWQCB (2009). ...... 16 Figure 1-4. Average Monthly Precipitation, 1905-2003, in Klamath Falls, Oregon and Orleans, California. NCRWQCB 2009 ..................................................................................................................... 17 Figure 1-5. Climate Summary - Tule Lake. OCS 2006, NCRWQB 2009 ................................................. 18 Figure 1-6. Average annual precipitation Upper Klamath and Lost River Subbasins in inches, 1960 to 1990. .......................................................................................................................................................... 18 Figure 1-7. Land Ownership Spatial Distributions Upper Klamath Subbasin ........................................... 19 Figure 1-8. Land Ownership Distributions, Lost River Subbasin. ............................................................. 19 Figure 1-9. Land Use and Land Cover Spatial Distributions, Lost River Subbasin. ................................. 20 Figure 1-10. Land Use and Land Cover Spatial Distributions, Upper Klamath Subbasin. ....................... 20 Figure 1-11. Lost River features. .............................................................................................................. 21 Figure 1-12. Lower Klamath Lake and Tule Lake drainages 1905 (USRS, 1905). .................................. 22 Figure 1-13. Water management districts in the Klamath Reclamation Project. ...................................... 25 Figure 1-14. NPDES Permitted Discharge Locations, Klamath River. ..................................................... 27 Figure 1-15. Confined Animal Feeding Operations (CAFOs). .................................................................. 29 Figure 1-16. Lost River Subbasin Fish Use Designation (adapted from OAR-340-041-180 Figure 180A). ................................................................................................................................................................... 33 Figure 1-17. Upper Klamath Subbasin Fish Use Designation (adapted from OAR-340-041-180 Figure 180A). ........................................................................................................................................................ 34 Figure 2-1. Klamath River and major tributaries in Oregon. RM stands for river mile and is based on the Water Resources Map series from 1978 and is consistent with river mile metrics in the 2004-2006 DEQ 303(d) list, presented on the following pages. ........................................................................................... 38 Figure 2-2. Keno impoundment longitudinal cross section of dissolved oxygen (mg/l) on July 26 2005 (Deas 2008). .............................................................................................................................................. 43 Figure 2-3. Box and Whisker Plot examples #1 and #2. .......................................................................... 44 Figure 2-4. Ammonia longitudinal profile of the Klamath River from Upper Klamath Lake to the Oregon / California border. Miller Island is river mile 245. ...................................................................................... 45 Figure 2-5. Ammonia toxicity by month for Klamath River at Miller Island. The total height of the three boxes for each month (clear, red and orange) is equal to the total number of samples for that month. For example, 28 samples were collected in June, 10 were exceeding the chronic criterion, 2 exceeding the acute criterion and 16 were not exceeding the criteria. ............................................................................. 45 Figure 2-6. pH longitudinal profile of the Klamath River from the Oregon / California border to Upper Klamath Lake. ............................................................................................................................................ 46 Figure 2-7. Chlorophyll a longitudinal profile of the Klamath River from the Oregon / California border to Upper Klamath Lake. ................................................................................................................................. 46 Figure 2-8. Dissolved oxygen profile at J.C. Boyle Reservoir at deepest point for year 2000. X- axis indicates dissolved oxygen (mg/L) and Y-axis Depth (m). Dashed line indicates the DO criterion of 8 mg/L. .......................................................................................................................................................... 47 Figure 2-9. Dissolved oxygen concentrations with percent saturation threshold (data from 1/1995 to 3/2005) downstream of JC Boyle Powerhouse (see Figure 2-1). The percent saturation criterion for the spawning period (January 1 – May 15) is 95% and 90% at other times. .................................................. 48 Figure 2-10. Seasonal dissolved oxygen concentrations from Klamath River at Miller Island (river mile 245). ........................................................................................................................................................... 49 Figure 2-11. Seasonal box plot of pH at Link River. ................................................................................. 49 Figure 2-12. Ammonia concentration by month at Klamath River at Miller Island. .................................. 50 Figure 2-13. Flow measurements at Link River. The hydrographs of every year except those being modeled are in gray. .................................................................................................................................. 51 Figure 2-14. Conceptual model of water quality impairment sources and processes. ............................. 53 Figure 2-15. Upper Klamath Lake algae concentrations, measured concentrations and predicted TMDL conditions for the same period. ................................................................................................................. 56 Figure 2-16. Time series of mean total phosphorus concentrations from Upper Klamath Lake. ............. 57 Figure 2-17. Locations of NPDES Permitted Discharges, Keno impoundment. ...................................... 58

State of Oregon Department of Environmental Quality viii
Figure 2-18. Flow, concentration and cumulative loading analysis of USBR’s Klamath Project. Total phosphorus (TP) concentrations weighted based on relative flow rates. .................................................. 60 Figure 2-19. Schematic of an example flow balance in cubic feet per second for Keno impoundment (August 2002). Flows are represented by the thickness of each box. ..................................................... 61 Figure 2-20. Klamath River (Keno impoundment) model results from just downstream of Klamath Straits Drain discharge. The “With KSD/LRDC” results are from the 2002 calibration model. The “Without …” results are from a scenario exactly like the 2002 calibration except the constituent concentrations of parameters for Lost River Diversion and Klamath Straits Drain were set to the same constituent concentrations as Link River. .................................................................................................................... 61 Figure 2-21. Nitrogen (N) and phosphorus (P) compounds in Keno impoundment, upstream is to the left, at the mouth of Link River. Data from Sullivan et al. (2009), median 7/15/2008 to 9/15/2008 concentrations. .......................................................................................................................................... 64 Figure 2-22. Time series of chlorophyll a and ammonia concentrations. Data from Sullivan et al. (2009). ................................................................................................................................................................... 65 Figure 2-23. The dissolved oxygen impact of sources on the 30-day moving average of DO concentrations at Miller Island, Keno impoundment reach........................................................................ 66 Figure 2-24. Annual total phosphorus loading Link River to Stateline existing condition (2000). ............. 67 Figure 2-25. Annual total nitrogen loading Link River to Stateline existing condition (2000). ................... 68 Figure 2-26. Annual CBOD loading Link River to Stateline existing condition (2000). ............................. 69 Figure 2-27. Upper Klamath Lake TMDL predicted total phosphorus concentrations for the climate/hydrology years: 1991 – 1998. ...................................................................................................... 71 Figure 2-28. Predicted natural condition baseline nutrient limitation factors for Klamath River, averaged from June through September. .................................................................................................................. 72 Figure 2-29. Predicted natural condition baseline nutrient limitation factors for Klamath River at the state line (river mile 207). ................................................................................................................................... 72 Figure 2-30. Predicted DO (7-day metric) in Klamath River at Klamath Falls WWTP outfall location. The ‘Difference’ at the bottom of the figure shows the ‘Allocations, without dams’ minus the ‘Natural Condition Baseline Scenario’. .................................................................................................................... 75 Figure 2-31. Predicted DO (instantaneous) in Klamath River at Keno Dam. The ‘ % Saturation’ at the bottom of the figure shows the predicted percent DO saturation of the ‘Allocations, without dams’ scenario. .................................................................................................................................................... 76 Figure 2-32. Predicted DO (30-day metric) in Klamath River at stateline. The ‘Difference’ at the bottom of the figure shows the ‘Allocations, without dams’ minus the ‘Natural Condition Baseline Scenario’. .... 76 Figure 2-33. Predicted DO (7-day metric) in Klamath River at stateline. The ‘Difference’ at the bottom of the figure shows the ‘Allocations, without dams’ minus the ‘Natural Condition Baseline Scenario’. ........ 77 Figure 2-34. Predicted pH in Klamath River at South Suburban WWTP outfall location. ........................ 77 Figure 2-35. Predicted daily maximum pH in Klamath River at stateline. The ‘Difference’ at the bottom of the figure shows the ‘Allocations, without dams’ minus the ‘Natural Condition Baseline Scenario’. .... 78 Figure 2-36. Annual loading diagram for total phosphorus ...................................................................... 79 Figure 2-37. Predicted hourly ammonia concentration and toxicity criteria at South Suburban WWTP outfall location. ........................................................................................................................................... 80 Figure 2-38. Detailed view of predicted hourly ammonia concentration and chronic toxicity criteria at South Suburban WWTP outfall location (same results as above). ........................................................... 80 Figure 2-39. Predicted DO (30-day metric) in Klamath River at Highway 66, depth averaged. The ‘Difference’ at the bottom-left of the figure shows the ‘Allocations, with dams’ scenario minus the ‘Allocations, without dams’ scenario. The ‘Quantile’ plot at the bottom-right shows the distribution of the differences. ................................................................................................................................................ 82 Figure 2-40. Predicted DO (30-day metric) in Klamath River at the deepest point in JC Boyle Reservoir, depth averaged. The ‘Difference’ at the bottom-left of the figure shows the ‘Allocations, with dams’ scenario minus the ‘Allocations, without dams’ scenario. The ‘Quantile’ plot at the bottom-right shows the distribution of the differences. .............................................................................................................. 82 Figure 2-41. Example water quality compliant, instream conditions, averaged between June 1 and September 30. TP = total phosphorus, PO4 = orthophosphate, CHLA = chlorophyll a. .......................... 83 Figure 2-42. Example water quality compliant, instream conditions, averaged between June 1 and September 30. TN = total nitrogen, DIN = dissolved inorganic nitrogen (sum of ammonia, nitrate and nitrite). Temperature is the average of the daily maximums. ................................................................... 84 Figure 3-1. Lost River Subbasin Location. ............................................................................................... 92

State of Oregon Department of Environmental Quality ix
Figure 3-2. Productive waterbodies, algal blooms and macrophytes in Wilson Reservoir and Lost River. ................................................................................................................................................................... 95 Figure 3-3. Sampling locations used to develop box plots. ...................................................................... 98 Figure 3-4. Longitudinal variation of the dissolved oxygen concentrations from July through September. The number above x-axis represents number of samples used to construct each box plot. .................... 99 Figure 3-5. Longitudinal variation of the pH from July through September. The number above x-axis represents number of samples used to construct each box plot. .............................................................. 99 Figure 3-6. Longitudinal variation of the ammonia as nitrogen from July through September. Number above x-axis represents number of samples used to construct each box plot. Outliers at kilometer 20 (5.6 mg/L) and kilometer 0 (11.3 mg/L) are greater than the plotted y-axis. ........................................... 100 Figure 3-7. Dissolved Oxygen Seasonal Excursions Frequencies below Water Quality Standards, Klamath Straits Drain at Highway 97 (1995 – 2004). The number above the x-axis represents the number of data points used to construct each box plot. .......................................................................... 101 Figure 3-8. pH Seasonal Excursions Frequencies above Water Quality Standards, Klamath Straits Drain at Highway 97 (1995 – 2004). The number above the x-axis represents the number of data points used to construct each box plot. ....................................................................................................................... 101 Figure 3-9. Ammonia Toxicity Seasonal Excursions Frequencies above Water Quality Standards, Klamath Straits Drain at Highway 97 ....................................................................................................... 102 Figure 3-10. Longitudinal plot of the ratio of dissolved inorganic nitrogen (DIN) to soluble reactive phosphorus (SRP), July through September. A ratio of 7 where points above this line indicate possible phosphorus limitation and points below this line indicate possible nitrogen limitation. ........................... 104 Figure 3-11. Total nitrogen concentrations measured in the Lost River, July through September. The number above the x-axis represents the number of data points used to construct each box plot. ......... 105 Figure 3-12. Total phosphorus concentrations measured in the Lost River system July through September. The number above the x-axis represents the number of data points used to construct each box plot. ................................................................................................................................................... 105 Figure 3-13. BOD concentrations measured in the Lost River system, July through September. The number above the x-axis represents the number of data points used to construct each box plot. ......... 106 Figure 3-14. Nitrogen Cycling in the Lost River. ..................................................................................... 107 Figure 3-15. Model Configuration. .......................................................................................................... 110 Figure 3-16. Model Boundary Conditions and Linkages. ....................................................................... 111 Figure 3-17. Dissolved Oxygen Standards Compliance – Harpold Dam (LRHD). ................................. 114 Figure 3-18. Ammonia toxicity compliance – Harpold Dam (LRHD). ..................................................... 115 Figure 3-19. Chlorophyll-a standard (15μg/l) compliance – Harpold Dam (LRHD). ............................... 115 Figure 3-20. pH standard compliance – Harpold Dam (LRHD). ............................................................. 116 Figure 3-21. DO standard compliance – Stateline Road (LRSR). .......................................................... 117 Figure 3-22. Ammonia toxicity standard compliance – Stateline Road (LRSR). .................................... 118 Figure 3-23. Chlorophyll-a standard compliance – Stateline Road (LRSR). .......................................... 118 Figure 3-24. pH standard compliance – Stateline Road (LRSR). .......................................................... 119 Figure 3-25. Nonpoint Source Dissolved Inorganic Nitrogen (DIN) Load Allocation. ............................. 123 Figure 3-26. Nonpoint Source CBOD Load Allocations. See Figure 14 for identified locations. ........... 125 Figure 4-1. Lost River – Upper Klamath Subbasins TMDL Implementation Schematic. ....................... 130 Figure 4-2. Idealize progress of adaptive management ......................................................................... 132

Upper Klamath and Lost River Subbasins TMDL
State of Oregon Department of Environmental Quality 1
Executive Summary
The Upper Klamath Subbasin and Lost River Subbasin Total Maximum Daily Loads (TMDLs) and Water Quality Implementation Plan (WQMP) establish water quality goals for waterbodies in these two subbasins which are within the Klamath Basin. The WQMP lays out steps toward meeting these goals. Water quality improvement programs that lead to TMDL attainment will advance Oregon's commitment to protecting beneficial uses in compliance with State and Federal Law. To accomplish this, the State has promoted a path that progresses towards water quality standard compliance, with protection of the beneficial uses of waters of the State as the primary goal. It is anticipated that facilities, sectors and management agencies will utilize this TMDL to develop and/or alter water quality management efforts. In addition, this TMDL should be used to track water quality, instream physical parameters and landscape conditions through time. This report presents the Upper Klamath and Lost River Subbasins TMDL. It addresses the elements of a TMDL required by the U.S. Environmental Protection Agency (EPA). These elements include:
A description of the geographic area to which the TMDL applies;
Specification of the applicable water quality standards;
An assessment of the problem, including the extent of deviation of ambient conditions from water quality standards;
The development of a loading capacity including those based on surrogate measures and including flow assumptions used in developing the TMDL;
Identification of point sources and nonpoint sources; development of Waste Load Allocations for point sources and Load Allocations for nonpoint sources;
Development of a margin of safety; and
An evaluation of seasonal variation. Additionally, this TMDL addresses the following required elements specified in Oregon Administrative Rule (OAR) 340-042:
Name and Location
Pollutant identification
Water quality standards and beneficial uses
Loading capacity
Excess load
Sources or source categories
Wasteload allocations
Load allocations
Margin of safety
Seasonal variation
Reserve capacity
Reasonable assurance of implementation The geographic scope of this TMDL addresses 560 miles of 303(d) listed waterbodies in the Upper Klamath and Lost River Subbasins. This TMDL builds on previous TMDLs in the Klamath Basin (ODEQ 2002, http://www.deq.state.or.us/wq/tmdls/docs/klamathbasin/ukldrainage/tmdlwqmp.pdf ). Specifically, this TMDL adopts the Upper Klamath Lake phosphorus TMDL total phosphorus as a boundary condition for developing the Klamath River and lost River TMDLs. ODEQ and California’s North Coast Regional Water Quality Control Board have worked cooperatively to develop TMDLs for the water quality impaired waterbodies in the Klamath Basin, including the Lost River and the Klamath

Upper Klamath and Lost River Subbasins TMDL
State of Oregon Department of Environmental Quality 2
Straits Drain, and the Klamath River from Link River to the Pacific Ocean. In particular, Oregon and California have formed a technical team in conjunction with USEPA and its contractor Tetra Tech, Inc. to develop a uniform water quality model of the basin and conduct joint analyses to ensure compatible TMDLs. However, the states will independently establish the TMDLs for those portions of the basin within their respective jurisdiction. The California North Coast Regional Water Quality Control Board (NCRWQCB) completed temperature and nutrient TMDL analysis (NCRWQCB 2006, http://www.waterboards.ca.gov/northcoast/water_issues/programs/tmdls/klamath_river/100927/03_BasinPlanLanugage_Klamath_Lost.pdf) for listed streams in the upper Lost River Subbasin, upstream of the Oregon-California border at Malone. NCRWQCB has also completed a TMDL document for dissolved oxygen, nutrient, microcystin, and temperature 303(d) listed waterbodies in the Klamath River downstream of stateline. US EPA Region 9 has promulgated TMDLs (US EPA 2008, http://www.epa.gov/region09/water/tmdl/lost-river/TmdlLostRiver12-30-08.pdf) to address 303(d) listed waterbodies in the California Lost River watershed, including Tule Lake Sump and Lower Klamath National Wildlife Refuge. http://www.waterboards.ca.gov/northcoast/water_issues/programs/tmdls/klamath_river/
Klamath River TMDLs The Klamath River TMDL analysis included impoundments and riverine sections of the Klamath River from the outlet of Upper Klamath Lake to the State border with California. Pollutants responsible for water quality impairments included phosphorus, nitrogen, and biochemical oxygen demand. The Oregon TMDLs are based on Oregon’s water quality standards. Because these TMDLs (and their anticipated load and wasteload allocations) are being developed by Oregon as part of a comprehensive multistate analysis of pollutant loadings to the Klamath River, they are also being designed to meet California water quality standards at stateline. The analysis indicates that reductions in phosphorus, nitrogen and biochemical oxygen demand loading from point and nonpoint sources are necessary to attain water quality standards in Oregon waterbodies and California’s water quality standards at stateline. Additionally, dissolved oxygen augmentation is required in two impounded reaches in order to achieve water quality standards.
Lost River TMDLs The analysis included waterbodies in the impounded and riverine sections of the Lost River from the Oregon-California state line downstream of the Malone Dam to state line upstream of Tule Lake and the Klamath Straits Drain from the state line to the confluence with the Klamath River. The analysis indicates that the DO criteria were the most stringent criteria. Consequently, modeling has indicated if the dissolved oxygen criteria are met in the system, then the water quality criteria for pH ammonia toxicity, chlorophyll-a and nutrients will also be attained. Nonpoint source loading was iteratively reduced until water quality criteria were achieved in the non-impounded sections of the Lost River. The analysis found that dissolved inorganic nitrogen (DIN) and carbonaceous biochemical oxygen demand (CBOD) reductions are necessary to attain the dissolved oxygen, pH, and ammonia toxicity standards. The Lost River TMDLs ensure that the water that flows downstream across state line into California meets California’s dissolved oxygen standard.
2

Upper Klamath and Lost River Subbasins TMDL
State of Oregon Department of Environmental Quality 3
TMDL Summaries Following are brief descriptions of the TMDLs included in this document. A summary of the allocations and waste load allocations developed in this TMDL are listed on page iii and listed in table form at the beginning of each TMDL chapter.
Summary of Load Allocations and Waste Load Allocations:
Parameter Geographic Areas Season Responsibility
(Land Uses, Sector) Quantity
Dissolved Oxygen
Lost River drainage, Lost River Diversion
Channel, and Klamath Straits Drain
Year round Agriculture Forestry
% Nitrogen, phosphorus, and BOD5a reduction and DO allocation
Keno Reservoir Year round
Agriculture, Forestry
Hydromodification, Urban Transportation, Sewage treatment
%Phosphorus, nitrogen, BOD5 reduction, temperature and DO allocation
JC Boyle Reservoir Year round Hydropower DOb, temperature allocation
pH
Lost River drainage, Lost River Diversion
Channel and Klamath Straits Drainc
Year round Agriculture
Forestry
% Nitrogen, phosphorus, and BOD5 reduction
DO allocation
Keno and JC Boyle
Reservoirs Year round
Agriculture, Forestry Hydropower, Urban Transportation,
Sewage treatment
% Nitrogen, phosphorus, BOD reduction and DO allocation
Ammonia Toxicity
Lost River Drainage, Lost River Diversion
Channel and Klamath Straits Draina
Year round Agriculture
Forestry % Nitrogen, phosphorus, and BOD5
reduction DO allocation
Keno Reservoir Year round
Agriculture
Hydromodification Urban Transportation
Sewage treatment
%Phosphorus, Nitrogen, BOD5 reduction and DO allocation

Upper Klamath and Lost River Subbasins TMDL
State of Oregon Department of Environmental Quality 4
Parameter Geographic Areas Season Responsibility
(Land Uses, Sector) Quantity
Chlorophyll-a
Lost River drainage, Lost River Diversion Channel and
Klamath Straits Draina
Year round
Agriculture Forestry
Urban
% Nitrogen, phosphorus, and BOD5 reduction and DO allocation
a 5-day test for biochemical oxygen demand b Dissolved Oxygen c Load allocations for Keno Reservoir and Lost River Subbasin apply to both Klamath Strait Drain and Lost River Diversion Channel

Upper Klamath and Lost River Subbasins TMDL
State of Oregon Department of Environmental Quality 5
Report Organization This document is organized as follows:
Chapter 1 – Regulatory framework and watershed overview
Chapter 2 – Klamath River – dissolved oxygen, chlorophyll-a, pH, ammonia toxicity, and temperature TMDL
Chapter 3 – Lost River Subbasin – dissolved oxygen, chlorophyll-a, pH, and ammonia toxicity TMDL
Chapter 4 – Water Quality Management Plan
Appendices – Data and Technical reports

Upper Klamath and Lost River Subbasins TMDL
State of Oregon Department of Environmental Quality 6
Chapter 1: Introduction
J.C. Boyle Dam

Upper Klamath and Lost River Subbasins TMDL
State of Oregon Department of Environmental Quality 7
1.1 Introduction The following summary serves to introduce the Upper Klamath and Lost River Subbasins, discuss the purpose of this document, and presents the goals and plans. The Klamath River Basin (Figure 1-1) is 12,680 square miles originating in southern Oregon extending through northern California to the Pacific Ocean at Requa in Del Norte County, CA. Forty-four percent of the watershed lies within Oregon while the remaining 56 percent lies within California. Figure 1-1. Klamath River Basin Subbasins and associated 4th field Hydrologic Unit Codes (HUCs).

Upper Klamath and Lost River Subbasins TMDL
State of Oregon Department of Environmental Quality 8
The Oregon Department of Environmental Quality (ODEQ), the California North Coast Regional Water Quality Control Board (NCRWQCB), and U.S. EPA have been working cooperatively on the development of TMDLs (Total Maximum Daily Loads) for both the Klamath River and the Lost River as required under the federal Clean Water Act and in accordance with a Memorandum of Agreement (2008) between U.S. EPA, ODEQ and NCRWQCB. The Memorandum of Agreement stipulated that ODEQ and NCRWQB are the lead agencies responsible for adopting TMDLs in their respective jurisdictions are jointly responsible for establishing appropriate water quality targets for each TMDL that ensure attainment of Oregon and California water quality objectives as appropriate. Further, ODEQ and NCRWQCB agreed to meeting downstream water quality standards or water quality objectives, as appropriate. Oregon DEQ completed the Upper Klamath Lake Drainage TMDL in 2002 (ODEQ 2002), California NCRWQCB completed a TMDL analysis of the Upper Lost River from Malone dam at the state border upstream to the headwaters of the Lost River above Clear Lake Reservoir (NCRWQCB 2006), and in 2008 U.S. EPA completed the dissolved inorganic nitrogen and biochemical oxygen demand TMDLs for the Lower Lost River in California which includes Tule Lake watershed and the Lower Klamath Wildlife Refuge.
This TMDL analysis covers the remaining water quality impaired subbasins in the Klamath Basin
(Upper Klamath and Lost River Subbasins) as shown in Figure 1-2.
Figure 1-2. Upper Klamath and Lost River Subbasin HUCs.

Upper Klamath and Lost River Subbasins TMDL
State of Oregon Department of Environmental Quality 9
1.2 Overview of Total Maximum Daily Loads
1.2.1 What is a TMDL?
The Department monitors the water quality of streams, lakes, estuaries, and groundwater in Oregon. This information is used to determine whether water quality standards are being violated, and consequently, whether the beneficial uses of the waters are impaired. Beneficial uses include fisheries, aquatic life, drinking water, recreation, and irrigation (see Table 1-1 for full list). Specific State and Federal plans and regulations are used to determine if violations have occurred. These regulations include the Federal Clean Water Act of 1972 and its amendments Title 40 Code of Federal Regulations 131, Oregon’s Administrative Rules (OAR Chapter 340), and Oregon’s Revised Statutes (ORS Chapter 468). Table 1-1. Beneficial Uses of Klamath River and Lost River tributaries
Beneficial Use All Other Basin
Waters
Public Domestic Water Supply¹ x Private Domestic Water Supply¹ x Industrial Water Supply x Irrigation x Hydro Power x Commercial Navigation x Livestock Watering x Fish and Aquatic Life x Wildlife and Hunting x Fishing x Boating x Water Contact Recreation x Aesthetic Quality x
¹ With adequate pretreatment (filtration and disinfection) and natural quality to meet drinking water standards.
The term “water quality limited” is applied to streams, lakes, and estuaries that do not meet water quality standards for protection of designated beneficial uses. Waterbodies in the Upper Klamath and Lost River Subbasins have been listed as water quality limited for a variety of water quality standards including dissolved oxygen, pH, ammonia toxicity, chlorophyll- a and temperature (Table 1-2). Under the federal CWA Section 303(d), states are required to develop a list of water bodies where technology based effluent limits or other legally required pollution control mechanisms are not sufficient or stringent enough to meet water quality standards applicable to such waters. The “303(d) List” also identifies the pollutant/stressor causing the impairment, and establishes a time schedule for addressing the water quality impairment. With a few exceptions, such as in cases where violations are due to natural causes, the State must establish a Total Maximum Daily Load or TMDL for any waterbody designated as water quality limited. A TMDL is a planning and management tool intended to identify, quantify, and control the sources of pollution within a given watershed such that water quality objectives are achieved and the beneficial uses of water are fully protected.

Upper Klamath and Lost River Subbasins TMDL
State of Oregon Department of Environmental Quality 10
Table 1-2. Waterbodies and impairments identified as “Water Quality Limited, TMDL needed” on DEQ’s 2010 303(d) List for which a TMDL is presented in this document.
Sub-basin Water Body River Miles Parameter Season (Beneficial Use)
Record ID
Kla
math
Riv
er
Klamath River 231.5 to 253 Ammonia Toxicity Year round 15767
Klamath River 231.5 to 253 Chlorophyll a Summer 15776
Klamath River 207 to 231.1 Dissolved Oxygen 1/1 – 5/15 (Spawning) 11587
Klamath River 207 to 231.1 Dissolved Oxygen Year round (Non-spawning) 11982
Klamath River 231.1 to 251 Dissolved Oxygen Year round (Non-spawning) 21093
Klamath River 231.5 to 253 pH Summer 15785
KR Lake Ewauna 232.7 to
253.7 Ammonia Year round 15510
KR Lake Ewauna 232.7 to
253.7 Dissolved Oxygen Year round 21088
KR Lake Ewauna 232.7 to
253.7 pH Year round
15514 / 15515
Lo
st
Riv
er
Klamath Straits 0 to 9.8 Ammonia Toxicity Year round 21952
Klamath Straits 0 to 9.8 Chlorophyll a Summer 2027
Klamath Straits 0 to 9.8 Dissolved Oxygen Year round (Non-spawning) 21949
Lost River 4.8 to 65.4 Ammonia Toxicity Year round 14826
Lost River 4.8 to 65.4 Chlorophyll a Summer 2029
Lost River 4.8 to 65.4 Dissolved Oxygen Year round (Non-spawning) 21087
Lost River DC 0 to 0 Dissolved Oxygen Year round 24489
Lost River Reservoir 25.4 to 27.6 Chlorophyll a Summer 2032
Lost River Reservoir 25.4 to 27.6 Dissolved Oxygen Summer 2015
Lost River Reservoir 25.4 to 27.6 pH Summer 2097
*LLID #1212355422566
A TMDL, or total pollutant load to a waterbody, is the sum of individual waste loads allocated to point sources, load allocations assigned to non-point sources and loads assigned to natural background conditions. The amount of pollutant that a water body can receive without violating the applicable water quality objectives is the loading or assimilative capacity of the water body, and is calculated as the TMDL. Loading from all pollutant sources must not exceed the loading or assimilative capacity (TMDL) of a water body, including an appropriate margin of safety. Load Allocations are portions of the loading capacity that are attributed to either natural background sources, such as soils, or from non-point sources, such as urban, rural agriculture, or forestry activities. Wasteload Allocations are portions of the total load that are allotted to point sources of pollution, such as sewage treatment plants or industries. The Wasteload Allocations are used to establish effluent limits in discharge permits. Allocations can also be reserved for future uses. Allocations are quantified measures that assure water quality standard compliance while distributing the allowable pollutant loads between nonpoint and point sources. This general TMDL concept is represented by the following equation:
TMDL = Waste Load Allocation + Load Allocation + Reserve Capacity + Margin of Safety The Oregon Department of Environmental Quality (ODEQ) is the Oregon state agency responsible for the protection of water quality in the Oregon portion of the Klamath River basin. The USEPA delegates authority to ODEQ to implement federal environmental programs within Oregon including the CWAOAR 340-042). The USEPA has the authority under the Clean Water Act to approve or disapprove TMDLs that states submit. When a TMDL is officially submitted by a state to EPA, EPA has 30 days to take

Upper Klamath and Lost River Subbasins TMDL
State of Oregon Department of Environmental Quality 11
action on the TMDL. In the case where EPA disapproves a TMDL, EPA would need to establish the TMDL within 30 days. DEQ is not developing a TMDL for a number of creek segments impaired by sedimentation or for biological criteria (Table 1-3). At the time of the writing of this TMDL, DEQ is in the process of developing a sedimentation assessment methodology that could be used for implementing the narrative sedimentation standard and possibly the biological criteria impairment, as well. When the methodology and associated guidance is completed, the agency will establish sedimentation TMDLs for those waterways on the 303(d) list. Table 1-3. Waterbodies and impairments identified as “Water Quality Limited” on DEQ’s 2010 303(d) List for which a TMDL is NOT presented in this document.
Sub-basin
Water Body River Miles Parameter Season (Beneficial
Use) Record
ID
Upp
er
Kla
ma
th R
ive
r
Clover Creek 0 to 8.4 Sedimentation Undefined 2098
Miners Creek 0 to 4.3 Sedimentation Undefined 2099
Spencer Creek 0 to 18.9 Biological Criteria Undefined 2003
Spencer Creek 0 to 18.9 Sedimentation Undefined 2100
Klamath River 207 – 285.3 Arsenic Year Round 24490
Klamath Straits 0 – 9.8 Arsenic Year Round 24480
Klamath River 207 to 231.1 Temperature Year round (Non-
spawning) 12840
Rock Creek 0 to 4.3 Temperature Year round (Non-
spawning) 12729
Beaver Creek 0 to 5.5 Temperature Year round (Non-
spawning) 12872
Grizzly Creek 0 to 3 Temperature Summer 2158
Hoxie Creek 0.8 to 4.4 Temperature Summer 2180
Jenny Creek 0 to 17.8 Temperature Summer 1984
Johnson Creek 0 to 9.4 Temperature Summer 2159
Keene Creek 0 to 7.2 Temperature Summer 2163
Keene Creek 7.5 to 9.7 Temperature Summer 2178
Mill Creek 0 to 3.9 Temperature Year Around (Non-
spawning) 2168
S Fork Keene Creek
0 to 3.1 Temperature Year Around (Non-
spawning) 2181
Spencer Creek 0 to 18.9 Temperature Year Around (Non-
spawning) 12815
Lo
st
Riv
er
Un-named creek*
0 to 2.2 Temperature Summer 2166
Antelope Creek 0 to 14.1 Temperature Year round (rearing) 2182
Barnes Valley Creek
0 to 14 Temperature Year round (Non-
spawning) 12738
Ben Hall Creek 0 to 8.7 Temperature Year round (Non-
spawning) 12737
Buck Creek 0 to 12.8 Temperature Year round (Non-
spawning) 12766
Klamath Straits 0 to 9.8 E. Coli Summer 24481
Lost River 4.8 to 65.4 Arsenic Year round 14828
Lapham Creek 0 to 4 Temperature Summer 12726
Long Branch Creek
0 to 4.6 Temperature Summer 12732
Lost River 4.8 to 65.4 Temperature Year round 24463
Miller Creek 0 to 9.6 Temperature Summer 1993

Upper Klamath and Lost River Subbasins TMDL
State of Oregon Department of Environmental Quality 12
N. Fork Willow Creek
0 to 2.3 Temperature Summer 1994
1.2.2 Permitting and Enforcement Tools
TMDL allocations for nonpoint sources in Oregon will be implemented through TMDL Implementation Plans developed by Designated Management Agencies (DMAs) or other responsible person or sources. For facilities in Oregon covered by a permit or license issued by the federal government, the TMDLs will likely be implemented through a Water Quality Standards Certification issued by ODEQ pursuant to Section 401 of the federal Clean Water Act. DEQ administers two different types of wastewater permits to protect surface waters from point source discharges: National Pollutant Discharge Elimination System (NPDES) and Water Pollution Control Facilities (WPCF) permits (Oregon Revised Statute [ORS] 468B.050). The statute requires that no person shall discharge waste into waters of the state or operate a waste disposal system without obtaining a permit from DEQ. DEQ has been given authority from the EPA to issue NPDES permits. Waste discharge pertains to releasing waste to surface waters from any operation that has a water discharge including but not limited to wastewater, sewage, processing water, wash water, cooling water, etc. These discharges to surface water may occur directly through a pipe or ditch or indirectly through a storm sewer system. Certain industries and activities may also be required to obtain permits for storm water runoff from their properties. NPDES permits fall into two categories: individual and general. Disposal pertains to getting rid of the waste by means other than discharge, such as evaporation, seepage, or land application. Disposal activities require a WPCF permit issued by DEQ. WPCF permitted operations do not allow for any discharge to surface waters, therefore they are not addressed in this TMDL. If a source that is covered by the TMDLs complies with its NPDES permit, DEQ-approved TMDL Implementation Plan, applicable forest practice rules, agricultural management plan, or Section 401 certification, it will be considered in compliance with the TMDLs. ODEQ has the regulatory authority to take enforcement action to compel a DMA to develop and implement a TMDL implementation plan. ODEQ, however, will first make every attempt to work collaboratively with the entity to achieve compliance.
1.2.3 Endangered Species Act Consultation
The USEPA and ODEQ initiated an informal consultation process with the United States Fish and Wildlife Service (USFWS) and the National Oceanic and Atmospheric Administration, Fisheries (NOAA Fisheries) on Klamath River basin TMDLs. USEPA, California Regional Water Board, and ODEQ staff used this process to provide information and updates on the TMDLs in the Klamath River basin, namely the Salmon, Scott, Shasta, Lower Lost, and Klamath River TMDLs. In addition, both NOAA Fisheries and the USFWS participated in the Klamath River TMDL meetings.
1.2.4 Tribal Trust Responsibilities
The United States has a trust responsibility to protect and maintain rights reserved by, or granted to, federally recognized tribes and individual Native Americans, by treaties, statutes, and executive orders. The trust responsibility requires that federal agencies take all actions reasonably necessary to protect trust assets, including fishery resources of the Native American tribes in the Klamath River basin. The Department must consider federal tribal trust responsibilities in the Klamath River basin since TMDLs are subject to the approval of the USEPA. TMDLs will be implemented in Oregon in accordance with permitting and Section 401 certification programs and with the Water Quality Management Plan, thus protecting the tribal trust.
1.2.5 FERC Relicensing

Upper Klamath and Lost River Subbasins TMDL
State of Oregon Department of Environmental Quality 13
On February 18, 2010, PacifiCorp entered the Klamath Hydroelectric Settlement Agreement (KHSA). The KHSA establishes a process, in lieu of FERC relicensing, for the potential removal of the hydroelectric project's JC Boyle Dam and three California dams. The Secretary of Interior will determine in 2012 whether dam removal will proceed. If it does not, the FERC relicensing will resume, in which case TMDL implementation will be evaluated in connection with the 401 certification required for a new license. If dam removal does proceed, PacifiCorp will continue to implement interim measures specified in the KHSA until the time of removal, which is targeted for 2020. The interim measures include water quality and fishery measures. Per the KHSA, PacifiCorp will submit to DEQ a proposed TMDL implementation plan incorporating the water quality-related interim measures, within 60 days of DEQ's approval of this TMDL.
1.2.6 TMDL Implementation via the Water Quality Management Plan
Oregon DEQ has completed TMDLs and associated WQMPs for the Upper Klamath Lake Drainage (ODEQ 2002) including the Sprague, Williamson and Upper Klamath Lake Subbasins. This TMDL and WQMP document completes the remaining TMDLs in the Klamath Basin within Oregon. Oregon’s approach to TMDL implementation includes designating responsible management agencies (DMAs), as well as responsible persons or sources. A DMA is a federal, state or local governmental agency that has legal authority over a sector or source contributing pollutants, and is identified as such by ODEQ in a TMDL. The DMAs in the Upper Klamath and Lost River subbasins include: US Forest Service, U.S. Bureau of Reclamation, U.S. Bureau of Land Management, U.S. Fish and Wildlife Service, Oregon Department of Agriculture, Klamath County,Oregon Department of Forestry, the City of Klamath Falls, and the municipalities Keno, Merill, Malin and Bonanza. Desiganted sources responsible for preparation of TMDL implementation plans include Water Management Districts and PacifiCorp. These entities must develop individual WQMPs and TMDL Implementation Plans to address load allocations identified in the TMDLs. Each source specific TMDL Implementation Plan must indicate how the entity will reduce pollution in order to address load allocations. Entities required to submit a TMDL Implementation Plan are not responsible for pollution arising from land management activities that occur outside of their jurisdictional authority. The following are elements of the WQMP required under OAR 340-042-0040(4)(l), and will serve as a framework when developing the WQMP for the Lost River and Upper Klamath Subbasins: Condition assessment and problem description. Goals and objectives. Proposed management strategies designed to meet the wasteload allocations and load allocations
in the TMDL. This will include a categorization of sources and a description of the management strategies proposed for each source category.
Timeline for implementing management strategies including: o Schedule for revising permits, o Schedule for achieving appropriate incremental and measurable water quality targets, o Schedule for implementing control actions, and o Schedule for completing other measurable milestones.
Explanation of how implementing the management strategies will result in attainment of water quality standards.
Timeline for attainment of water quality standards Identification of persons, including DMAs, responsible for implementing the management strategies
and developing and revising sector-specific or source-specific implementation plans. Identification of sector-specific or source-specific implementation plans that are available at the time
the TMDL is issued. Schedule of preparation and submission sector-specific or source-specific implementation plans by
responsible persons, including DMAs, and processes that trigger revisions to these implementation plans.

Upper Klamath and Lost River Subbasins TMDL
State of Oregon Department of Environmental Quality 14
Description of reasonable assurance that management strategies and sector-specific or source-specific implementation plans will be carried out through regulatory or voluntary actions.
Plan to monitor and evaluate progress towards achieving TMDL allocations and water quality standards including:
o Identification of persons responsible for monitoring, and o Plan and schedule for reviewing monitoring information and revising the TMDL.
Plan for public involvement in implementing management strategies. Description of planned efforts to maintain management strategies over time. General discussion of costs and funding for implementing management strategies. Sector-specific
or source-specific implementation plans may provide more detailed analyses of costs and funding for specific management strategies.
Citation of legal authorities relating to implementation of management strategies.
1.2.7 Adaptive Management Process
Subject to available resources, ODEQ intends to periodically review the TMDLs and the WQMP for the Klamath River basin in Oregon. In conducting this review ODEQ will evaluate the progress towards achieving the TMDLs, and water quality standards, and the success of implementing the WQMP. ODEQ expects that each DMA and designated source will also monitor and document its progress in implementing provisions of its TMDL Implementation Plan. This information will be provided to ODEQ for its use while reviewing the TMDLs. As implementation of the WQMP and the associated TMDL Implementation Plan proceeds, ODEQ expects that DMAs and designated source will develop benchmarks for attaining water quality improvement, which will measure progress. Where effectiveness of management techniques laid out in the TMDL Implementation Plans or implementation of these plans is not adequate, ODEQ expects the DMAs and designated source to revise the components of their plans to address these deficiencies. If ODEQ determines that all appropriate measures are being taken by the DMAs and designated source, and water quality criteria are still not being met, ODEQ may reopen and revise the TMDL. ODEQ will also consider reopening the TMDL, subject to available resources, should new information become available indicating that the TMDL or its associated water quality targets need to be modified. The implementation of TMDLs and the associated TMDL Implementation Plans are generally enforceable by ODEQ, other state agencies, and local government. However, sufficient initiative likely exists to achieve water quality goals with minimal enforcement. Should the need for additional effort emerge, DEQ will expect that the responsible agency will work with land managers to overcome impediments to progress through education, technical support, or enforcement. Enforcement may be necessary in instances of insufficient action towards progress. This could occur first through direct intervention from land management agencies (e.g. ODF, ODA, counties, and cities), and secondarily through ODEQ, with a departmental order to implement water quality management goals. ODEQ recognizes a time period from several years to several decades will be necessary after full implementation before management practices identified in a TMDL implementation plan become fully effective in reducing and controlling certain forms of pollution, especially heat loads from lack of riparian vegetation. In addition, ODEQ recognizes that technology for controlling some pollution sources such as nonpoint sources is, in many cases, in the development stages and will likely take one or more iterations to develop effective techniques. It is possible that after application of all reasonable best management practices, some TMDLs or their associated surrogates may not be achievable as originally established and may require adaptation and alteration. ODEQ also recognizes that despite the best and most sincere efforts, natural events beyond the control of humans may interfere with or delay attainment of the TMDLs and/or their associated surrogates. Such events could be, but are not limited to, floods, fire, insect infestations, and drought.
1.3 Subbasin Overview

Upper Klamath and Lost River Subbasins TMDL
State of Oregon Department of Environmental Quality 15
The Klamath River originates in southern Oregon and flows through northern California entering the Pacific Ocean at Requa in Del Norte County, CA. Forty-four percent of the 12,680 square mile watershed lies within the boundaries of Oregon while the remaining lies across the state line within the boundaries of California. The Klamath River basin is of vital economic and cultural importance to the states of Oregon and California, as well as the Klamath Tribes in Oregon; the Hoopa, Karuk, and Yurok tribes in California; the Quartz Valley Indian Reservation in California, and the Resighini Rancheria in California. It provides fertile lands for a rich agricultural economy in the upper basin. Irrigation facilities known as the Klamath Project owned by the U.S. Bureau of Reclamation support this economy as well as hydroelectric power provided via a system of 5 dams operated by PacifiCorp. Historically, the Basin once supported vast spawning and rearing fishery habitat with cultural significance to the local Indian tribes. The watershed supports an active recreational industry, including activities that are specific to the Wild and Scenic portions of the river designated by both the states and federal governments in both Oregon and California. Finally, the watershed continues to support what were once historically significant mining and timber industries.
1.3.1 Geology
The Klamath River watershed crosses four geomorphic provinces. From east (upstream) to west (downstream) these provinces are the Modoc Plateau, Cascade Range, Klamath Mountains, and Coast Ranges (Figure 1-3). The geology of the upper Klamath Basin within Oregon has been dominated by volcanic activity for past 35 million years (my). The Western Cascades subprovince of the Cascade consists of lava flows, andesitic mudflows, tuffaceous sedimentary rocks and vent deposits. The rocks range in age from 20 to 33 million years and have very low permeability which retards the movement of groundwater flow (Gannett et al, 2007). The High Cascade subprovince overlies the Western Cascades subprovince and range in age from 7 my to recent. Deposits consist of volcanic vents and lava flows. The High Cascades rocks are relatively permeable compared to the underlying older rocks. The major water-bearing rocks in the Upper Klamath Basin in Oregon are the late Miocene to Pliocene volcanic rocks of the Basin and Range Province (Gannett et al, 2007). The Basin and Range Province extends over much of the Western US and is characterized by down-dropped basins separated by fault-block ranges. Although the Basin and Range province is primarily a structural feature, faulting has been accompanied by widespread volcanism with rocks consisting of volcanic vent deposits and flow rocks located east of Upper Klamath Lake and Lower Klamath Lake (DOGAMI, 2008). These features probably underlie most of the valley and basin-fill deposits (Gannett et al, 2007). Pliocene (5 mybp) to Recent (age) deposits comprise the youngest rock in the study area, consisting of alluvium, basin-fill, and glacial drift and outwash. Alluvium thickness reaches 1,740 ft in the historic Tule Lake Valley, and Lower Klamath Lake basins.

Upper Klamath and Lost River Subbasins TMDL
State of Oregon Department of Environmental Quality 16
Figure 1-3. Geologic map of the Klamath River watershed Source: Modified by NCWQCB (2009).

Upper Klamath and Lost River Subbasins TMDL
State of Oregon Department of Environmental Quality 17
1.3.2 Climate
The great geographic extent and topographic relief of the Klamath River watershed combine to produce a wide variety of climate. The climate is characterized by dry summers with high daytime temperatures, and wet winters with moderate to low temperatures. About three quarters of the annual precipitation falls between October and March, producing a snowpack in the higher mountain ranges that feeds streamflow in many lower areas through the summer. In the Yreka-Montague area in the lower Shasta Valley, mean annual temperature is about 52o F. The coldest month is January with mean temperature of 35o F. The warmest month is July with mean temperature of 73o F. The mean annual precipitation in the Klamath River watershed from headwaters to the ocean, is about 32 inches, but local averages range more than 80 inches in the high elevations to 10 inches in the Shasta Valley (Figure 1-4) (NCRWQCB 2009). Figure 1-4. Average Monthly Precipitation, 1905-2003, in Klamath Falls, Oregon and Orleans, California. NCRWQCB 2009
The climate of the Lost River Subbasin is generally characterized as dry summers with high temperatures and wet winters with moderately low temperatures. Due to its location approximately 120 miles east of the Cascade Mountain Range, it is in the path of storms originating in the north Pacific Ocean. Winter precipitation is derived from these storms traversing in an easterly direction. The Cascade Range creates a rain shadow that affects the distribution of precipitation throughout the subbasin. About two-thirds of the precipitation falls as snow between October and March. Total average snowfall at Klamath Falls is about 41 inches (Figure 1-5). Average precipitation in the upper Klamath basin ranges from as little as 10 inches to more than 70 inches in the mountains Figure 1-6. The mean yearly precipitation from 1961 to 1990 was 13.5 inches as measured at Klamath Falls, Oregon.

Upper Klamath and Lost River Subbasins TMDL
State of Oregon Department of Environmental Quality 18
Figure 1-5. Climate Summary - Tule Lake. OCS 2006, NCRWQB 2009
Figure 1-6. Average annual precipitation Upper Klamath and Lost River Subbasins in inches, 1960 to 1990.
Legend
OR_Precip_poly_Clip
<all other values>
LEGEND
10-12
12-14
14-16
16-18
18-20
20-24
24-28
28-32
32-36
36-40
40-44
44-48
48-52
52-56
56-60
60-70
Legend
OR_Precip_poly_Clip
<all other values>
LEGEND
10-12
12-14
14-16
16-18
18-20
20-24
24-28
28-32
32-36
36-40
40-44
44-48
48-52
52-56
56-60
60-70
Oregon
California
Klamath Falls

Upper Klamath and Lost River Subbasins TMDL
State of Oregon Department of Environmental Quality 19
1.3.3 Land Use and Ownership
Land ownership in the Lost River Subbasin is comprised of 46% private and 45% federally managed. Land ownership in the Upper Klamath Subbasin is 81% private with the reminder managed by federal agencies. Spatial distributions of land ownership in the Upper Klamath and Lost River Subbasins are displayed in Figure 1-7 and Figure 1-8, respectively. Figure 1-7. Land Ownership Spatial Distributions Upper Klamath Subbasin
Figure 1-8. Land Ownership Distributions, Lost River Subbasin.
Land use related to agriculture in the Lost River Subbasin is approximately 62%. Approximately 80% of Upper Klamath Subbasin is forested. Figure 1-9 and Figure 1-10 show the spatial distribution of major land use types for the Lost River and Upper Klamath Subbasins, respectively.
Klamath Falls
Upper Klamath and Lost River Subbasins TMDL
State of Oregon Department of Environmental Quality 20
Figure 1-9. Land Use and Land Cover Spatial Distributions, Lost River Subbasin.
Figure 1-10. Land Use and Land Cover Spatial Distributions, Upper Klamath Subbasin.
Kla
mat h
Riv
er
Lo
st R
iver
Klamath Falls
Water
Residential
Forest
Grassland/scrub
Crops
Pasture
Wetlands
Legend
Oregon

Upper Klamath and Lost River Subbasins TMDL
State of Oregon Department of Environmental Quality 21
1.3.4 Hydrology
1.3.4.1 Overview Lost River Subbasin The Lost River Subbasin straddles the Oregon-California border. The headwaters of the Lost River lie within California. Prior to development of the Klamath Reclamation Project, the Klamath River and Lost River drainages were connected via the Lost River Slough which occasionally allowed water from the Klamath River into the Lost River (NRC 2004). The Lost River drainages originates in tributaries to Clear Lake and terminus (Tule Lake) both being located in California with the river reach linking the two through the State of Oregon. Along its course, the Lost River gains water from several tributary sources, including Miller Creek and Buck Creek. The mainstem of the Lost River is highly channelized and includes several impoundments (Harpold Dam, Wilson Diversion Dam, and Anderson Rose Dam) to facilitate water storage and support diversion canals and return flow drains. To facilitate irrigation water delivery and flood control, water from the Lost River drainage can be discharged to Keno Reservoir through the Klamath Straits Drain, and the Lost River Diversion Channel (Figure 1-11). Figure 1-11. Lost River features.
Water surface elevations in Lower Klamath Lake and upstream along the channel of the Klamath River to the outlet of Lake Ewauna were historically controlled by a natural basalt reef in the channel at Keno. A similar bedrock reef at the outlet of Lake Ewauna held upstream water surface elevations about 1 foot higher, more or less, at low flow. At higher flows, backwater in Lower Klamath Lake was stored within the lake which raised the water surface elevation, thereby inundating Lake Ewauna, which then became a continuous part of Lower Klamath Lake. Just at the outlet of Lake Ewauna, a natural overflow channel, the Lost River Slough also carried water out of the lake system when the water surface exceeded elevation 4085 feet (USBR 2008).The decision to drain and reclaim Tule Lake and Lower Klamath Lake for agricultural production resulted in substantial alteration to the hydrology of the Lost
Clear Lake
Malone Dam
GerberReservoir
Harpold Dam
Tule Lake Sumps
Anderson Rose Dam
Lost River Diversion Channel
A-CanalLink River Dam
Oregon
California
Keno Dam
Klamath Straits Drain
Lost Rive r
Kl
am
ath
River
Wilson Dam
Lost Riv
er
Lower Klamath NWR
Tule Lake Sumps
Miller C
ree
k
Ady Canal

Upper Klamath and Lost River Subbasins TMDL
State of Oregon Department of Environmental Quality 22
River watershed. Figure 1-12 depicts the hydrology of the Lost River prior to the draining of Lower Klamath Lake, based on survey collected in the 1890’s. Figure 1-12. Lower Klamath Lake and Tule Lake drainages 1905 (USRS, 1905).
1.3.4.2 Klamath Basin Chronology The Klamath Basin is steeped in history. From the time of the early settlement to the present day, balancing natural resources extraction and ecosystem values have been in conflict. Prior to opening of the Klamath Basin to white settlement, the six tribes of the Klamaths were bound together by ties of loyalty and family. They lived along the Klamath Marsh, on the banks of Agency Lake, near the mouth of the Lower Williamson River, on Pelican Bay, beside the Link River, and in the uplands of the Sprague River Valley. The Modoc's lands included the Lower Lost River, around Clear Lake, and the territory that extended south as far as the mountains beyond Goose Lake. The Yahooskin Bands occupied the area east of Yamsay Mountain, south of Lakeview, and north of Fort Rock.
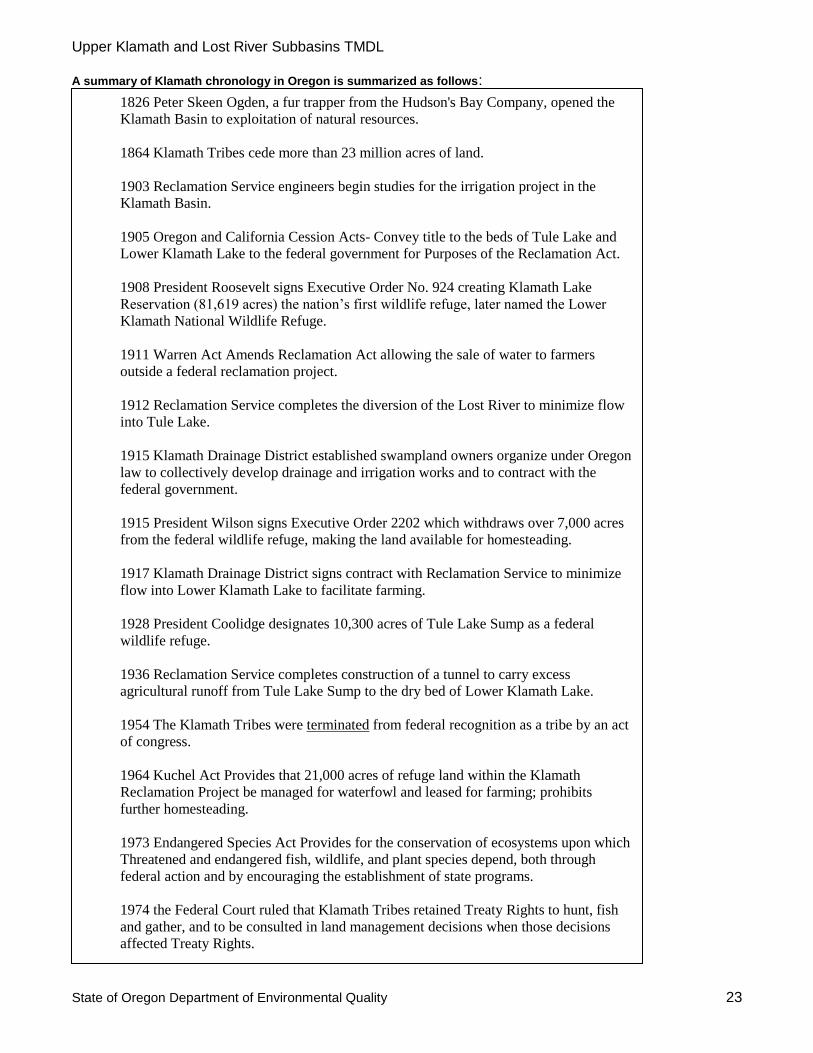
Upper Klamath and Lost River Subbasins TMDL
State of Oregon Department of Environmental Quality 23
A summary of Klamath chronology in Oregon is summarized as follows:
1826 Peter Skeen Ogden, a fur trapper from the Hudson's Bay Company, opened the
Klamath Basin to exploitation of natural resources.
1864 Klamath Tribes cede more than 23 million acres of land.
1903 Reclamation Service engineers begin studies for the irrigation project in the
Klamath Basin.
1905 Oregon and California Cession Acts- Convey title to the beds of Tule Lake and
Lower Klamath Lake to the federal government for Purposes of the Reclamation Act.
1908 President Roosevelt signs Executive Order No. 924 creating Klamath Lake
Reservation (81,619 acres) the nation’s first wildlife refuge, later named the Lower
Klamath National Wildlife Refuge.
1911 Warren Act Amends Reclamation Act allowing the sale of water to farmers
outside a federal reclamation project.
1912 Reclamation Service completes the diversion of the Lost River to minimize flow
into Tule Lake.
1915 Klamath Drainage District established swampland owners organize under Oregon
law to collectively develop drainage and irrigation works and to contract with the
federal government.
1915 President Wilson signs Executive Order 2202 which withdraws over 7,000 acres
from the federal wildlife refuge, making the land available for homesteading.
1917 Klamath Drainage District signs contract with Reclamation Service to minimize
flow into Lower Klamath Lake to facilitate farming.
1928 President Coolidge designates 10,300 acres of Tule Lake Sump as a federal
wildlife refuge.
1936 Reclamation Service completes construction of a tunnel to carry excess
agricultural runoff from Tule Lake Sump to the dry bed of Lower Klamath Lake.
1954 The Klamath Tribes were terminated from federal recognition as a tribe by an act
of congress.
1964 Kuchel Act Provides that 21,000 acres of refuge land within the Klamath
Reclamation Project be managed for waterfowl and leased for farming; prohibits
further homesteading.
1973 Endangered Species Act Provides for the conservation of ecosystems upon which
Threatened and endangered fish, wildlife, and plant species depend, both through
federal action and by encouraging the establishment of state programs.
1974 the Federal Court ruled that Klamath Tribes retained Treaty Rights to hunt, fish
and gather, and to be consulted in land management decisions when those decisions
affected Treaty Rights.
1988 USFWS listed the short-nose sucker (Chasmistes brevirostis) and the Lost River
sucker (Deltistes luxatus) as endangered under the ESA.
1997 NMFS listed the coho salmon (Oncorhynchus kisutch) as threatened under the
ESA

Upper Klamath and Lost River Subbasins TMDL
State of Oregon Department of Environmental Quality 24
1.3.4.3. Features of the Klamath Reclamation Project The Klamath Reclamation Project delivers water to approximately 200,000 acres comprised of 130,000 acres in Oregon and 70,000 in California (Carlson and Todd, 2003). The project supplies water to 63% of the 2,239 farms in Upper Klamath Basin and up to 80% of all irrigated farms in the Upper Klamath Basin. Principal crops grown in the Project area include alfalfa hay, pasture (for beef), barley, potatoes, and wheat. Other crops include oats, onions, peppermint, and horseradish. This section presents features of the Klamath Reclamation Project identified in Figure 1-11.
The A Canal, constructed in 1905, was the first irrigation canal completed on the Klamath Project. The canal supplies water through subsidiary lateral canals and drains to the majority of the Project. Typical water diversions through the A-Canal over extended periods of time are on the order of 1,000 cfs. Clear Lake is located in California and provides storage for irrigation. The Clear Lake dam was originally constructed in 1910 (and rebuilt in 2003) to prevent the re-inundation of former wetlands in the Tule Lake area by providing a shallow reservoir to enhance evaporation. Annual evaporation and seepage loses from this lake account for over half of the average inflow of water to Clear Lake. Gerber Reservoir is located on Miller Creek holds an active capacity of 94,270 acre-ft. Construction of the Gerber Dam was completed in 1925. The reservoir is used to store seasonal runoff to meet irrigation needs (17,000 acres) primarily for the Langell Valley Irrigation District. Average releases from Gerber Reservoir for water years 1991 to 2000 were 41,000 acre feet. Average inflow to the reservoir is approximately 55,000 acre-feet. The Lost River Diversion Canal begins at the Wilson Dam and ends at the confluence with the Klamath River. It was constructed in 1912 and improved in 1948. The canal is capable of moving 3,000 cfs either from the Klamath River during irrigation season, or from the Lost River during periods of high flow in the Lost River drainage. During irrigation season, water is delivered from the Klamath River using the Miller Hill Pumping Plant near the Station 48 Drop into the Lost River. Depending on the operational needs, water that cannot be delivered from Lost River must be delivered from the Klamath River via the Lost River Diversion Canal. Tule Lake Sumps: Tule Lake was historically the terminus of the Lost River. However, under high flow conditions, water from the Klamath River would flow into the Tule Lake via the Lost River Slough. In the 1880’s, settlers built a dike across the Lost River Slough to “reclaim” portions of Tule Lake for agriculture production. Active “reclamation” of Tule began in 1910. In 1932, a dike system was constructed to confine drainage waters entering Tule Lake to central sump. Following repeated failures of the dikes from higher flows in the Lost River drainage, Pumping Station D was installed to maintain water levels in the Tule Lake Sumps and provide water to the Lower Klamath National Wildlife Refuge (NWR). Water discharged from Pumping Station D is delivered through a 1,220 ft long tunnel beneath Sheepy Ridge to the Lower Klamath NWR. During irrigation season, most of the water entering Tule Lake is from the Keno reservoir via the Lost River Diversion Canal at Station 48. In the winter, most of the Lost River flows are diverted into the Lost River Diversion Canal to Keno Reservoir. Klamath Straits Drain (KSD) was constructed in 1941 to drain water from the wetlands of the Lower Klamath National Wildlife Refuge (LKNWR). The KSD was enlarged in 1976 to provide additional capacity to drain the water from the NWR. Maximum flow is about 600 cfs and is operated by USBR. Water is lifted by pumps at two locations to discharge water into the Klamath River. The Ady Canal was constructed in 1912 to control water flow into the Lower Klamath Lake area. The Ady Canal diverts water from the Keno Reservoir to the Lower Klamath Lake area. Approximately 250 cfs is diverted for irrigation. During the fall, winter and spring water is also delivered to the Lower Klamath National Wildlife Refuge.

Upper Klamath and Lost River Subbasins TMDL
State of Oregon Department of Environmental Quality 25
Lower Klamath National Wildlife Refuge extends over 53,000 acres and was established in 1908 by President Theodore Roosevelt and is one of the nation’s first refuges for migratory birds. Lower Klamath NWR was created after the Congress authorized the Klamath Project in 1905. Following court challenges from conservationists, USBR drained Lower Klamath Lake and in 1915 reduced the refuge from 80,000 to 53,600 acres freeing up the remaining land for drainage and sale or lease (NRC 2004), Today the refuge supports important breeding populations of ducks, herons, egrets, terns, avocets, white-faced ibis, and white pelicans. Approximately 6,000 acres of land within the refuge are leased for agricultural production that is consistent with waterfowl production in accordance with the Kuchel Act (1964).
1.3.5 Water Management Districts
Water is delivered to the irrigation projects by several canals at A-Canal, Lost River Diversion Channel, Station 48, North Canal and Ady Canals. Management of water within the federal irrigation project is largely controlled by individual irrigation and drainage districts (Figure 1-13). Most of the irrigation districts in Oregon are members of the Klamath Water Users Association. The Klamath Water Users Association (KWUA) is a non-profit corporation that has represented Klamath Reclamation Project farmers and ranchers since 1953. KWUA members include rural and suburban irrigation districts and other public agencies as well as private individuals who operate on both sides of the California-Oregon border. KWUA represents over 1400 family farms and ranches that encompass over 200,000 acres. The mission of the organization is to preserve, protect and defend the water and power rights of the landowners of the Klamath Basin while promoting wise management of ecosystem resources. Figure 1-13. Water management districts in the Klamath Reclamation Project.
Legend
irrig districts
<all other values>
WDNAME
ADY DIST IMP CO
ENTERPRISE ID
HORSEFLY ID
KLAMATH DRAIN. DIST
KLAMATH I.D.
LANGELL VALLEY ID
MALIN ID
MIDLAND DIST IMP CO
P CANAL WATER CO.
PINE GROVE ID
PIONEER DIST IMP CO
PLEVNA DIST IMP CO
SHASTA VIEW ID
SUNNYSIDE ID
TULELAKE ID
VAN BRIMMER DRAIN ID
WESTSIDE DIST IMP CO
Poe Valley Imp Dist

Upper Klamath and Lost River Subbasins TMDL
State of Oregon Department of Environmental Quality 26
1.3.6 Point Sources
A point source is a stationary location or fixed facility, such as an industry or municipality that discharges pollutants through a defined conveyance, such as pipes, ditches, lagoons or wells. DEQ issues NPDES permits for sources that discharge pollutants to surface water. NPDES permits fall into two categories: general and individual. 1.3.6.1 NPDES – General A general NPDES permit is used to cover a category of similar discharges, rather than a specific site. DEQ may issue a general permit when there are several minor sources or activities involved in similar operations that may be adequately regulated with a standard set of conditions. As of January 2010, there are 53 NPDES general permits for discharge in the Upper Klamath and Lost River Subbasins (Table 1-4). Table 1-4. Upper Klamath and Lost River Subbasin – NPDES General Permits
Permit Type Permit Description Count
GEN12A Stormwater; NPDES sand and gravel mining 3
GEN12C Stormwater; NPDES construction more than 1 acre 36
GEN12Z Stormwater; NPDES specific SIC (industrial) codes 13
GEN15B Industrial Wastewater; NPDES petroleum hydrocarbon cleanup 1
Total 53
1.3.6.2 NPDES - Individual An individual NPDES permit is site-specific; it is developed to address discharges from a specific sewage or industrial wastewater treatment facility. Individual permits are usually issued for a period of five years. Individual permits require frequent monitoring by the permittee to assure that permit limitations are being met. There are 5 individual NPDES permits within the Upper Klamath and Lost River Subbasins (Table 1-5 and Figure 1-14). Individual permitted sources have the potential to impact surface waters and are examined in more detail within this TMDL. NPDES permits may be revised when renewed, to ensure that all permittees are operating in accordance with this TMDL. The four facilities which discharge into the Klamath River are discussed in detail below and in Chapter 2 while the two facilities which discharge into the Lost River system are discussed in Chapter 3. Table 1-5. Individually permitted sites in the Upper Klamath and Lost River Subbasin. DOM indicates domestic while
IND indicates industrial sources.
Permit Number
Legal Name Category Permit Type Receiving Waterbody
River Mile
100701 City of Klamath
Falls DOM
NPDES-DOM-C1b
Klamath River 251
100700 South Suburban Sanitary District
DOM NPDES-DOM-
C1b Klamath River 250.0
101086 Collins Products
LLC IND NPDES-IW-B20 Klamath River 247.2
100016 Columbia Plywood
Corporation IND NPDES-IW-B20 Klamath River 248.5
100670 Henley School DOM NPDES-DOM-Da Lost River 19.4
102541 Klamath Irrigation
District IND NPDES-IW-B15
Unnamed Lost River tributary
LLID = 1214782421532 2.58

Upper Klamath and Lost River Subbasins TMDL
State of Oregon Department of Environmental Quality 27
Figure 1-14. NPDES Permitted Discharge Locations, Klamath River.
City of Klamath Falls Sewage Treatment Plant The City of Klamath Falls operates a wastewater treatment plant (WWTP) under NPDES permit number 100701 issued by the DEQ. The sewage treatment facility utilizes activated sludge as the principal process to meet secondary treatment. The plant unit processes include coarse screening, influent pumping, grit removal, comminution, primary sedimentation, activated sludge aeration, secondary clarification, and disinfection. The plant is currently designed to handle 6 million gallons per day (MGD) of municipal wastewater. Treated effluent from the wastewater treatment system discharges into Keno Reservoir at River Mile 251 via an outfall structure. The City of Klamath Falls WWTP sends reclaimed water to the Klamath Cogeneration power plant owned by Pacific Klamath Energy, for use as cooling water in the plant’s cooling tower and condensers. The power plant is a 300 to 500 MW (net), natural gas-fired, combustion turbine-based, combined-cycle facility. The facility is located on 15 acres of land currently owned by Collins Products southwest of the City of Klamath Falls. Approximately 75% of the reclaimed cooling water is evaporated in the cooling process. The 25% remaining is cooling tower blow down that is piped back to the Spring Street facility, where it is cooled with well water as required by the Reclaimed Water Use Plan and dechlorinated before discharging to the City’s outfall serving the Spring Street facility. The average daily volume of reclaimed water was 2.63 MGD from March 2006 through February 2007. During the cool season, or when power production is reduced, wastewater effluent flow is split to reclaimed water production and discharge to the Klamath River through outfall 001 at River Mile 251. South Suburban Sanitary District South Suburban Sanitary District (SSSD) operates a wastewater treatment facility in Klamath County under NPDES permit number 100700 issued by the DEQ. The South Suburban facility utilizes waste stabilization ponds as the principal process for secondary treatment. Treated water is discharged to Keno Reservoir at R.M. 250. The plant is currently designed to handle 2.3 MGD of municipal wastewater.
South Suburban WWTP
Collins Forest Products
Columbia Forest Products
Klamath Falls WWTP

Upper Klamath and Lost River Subbasins TMDL
State of Oregon Department of Environmental Quality 28
The treatment plant consists of four lagoons; two aerated treatment lagoons and two holding ponds. Prior to discharge to the lagoons wastewater is sent through the washer/compacter to remove primary solids. Wastewater is disinfected using chlorine gas before entering a 700 ft. chlorine contact basin. Treated effluent discharges to a drainage ditch where it co-mingles with both city and county drainage ditches before entering Keno Reservoir. The effluent from the South Suburban facility discharges into Lake Ewauna (Klamath River) at River Mile 250. Before the wastewater enters the Klamath River, however, the discharge actually first enters a ditch next to the discharge box within the treatment facility. The SSSD discharge flow is then mixed with the City and County drainage ditches and diffuses through a small wetland area across the railroad tracks via the Transfer Pump Station. Once in the “canal” the wastewater flows north for approximately ½ mile and enters the river near the railroad trestle. Collins Products, LLC Collins Products, LLC maintains NPDES permit number 101086. Though the facility is permitted to discharge treated effluent to the Klamath River, Collins Products has very limited, occasional discharge to the Klamath River since approximately 2005. Collins Products currently discharges 100% of its treated wastewater to a constructed wetlands for treatment, evaporation and seepage into the ground. Though not currently in use, the facility maintains two outfalls to the Klamath River. Outfall No. 001 is permitted to discharge treated industrial process water with mass limits on TSS and BOD5 (5-day Biochemical Oxygen Demand) and limits on pH. Outfall No. 003 can discharge sanitary wastes with limitations on pH, chlorine residual, total suspended solids (TSS), BOD5 (5 day test for biochemical oxygen demand)), and Fecal Coliform. Both outfalls discharge to a drainage ditch at west end of aerated treatment ponds and mix together before discharging to the Klamath River. The facility currently produces particleboard and hardboard. The plywood plant has been dismantled. The hardboard lift station treats the industrial wastewater for solids and oil and grease prior to pumping to the industrial treatment lagoons; the particleboard lift station pumps only non-contact cooling water. The combined industrial effluent is treated in two settling basins before entering the three aerated, industrial wastewater treatment lagoons. Treated industrial flows to the treatment wetland averaged about four to five hundred thousand gallons per day in 2007. Sanitary wastewater is treated with a grinder and a single aerated lagoon. The effluent from the sanitary lagoon is chlorinated in a contact basin prior to being discharged. The existing NPDES permit authorizes the treated sanitary effluent to be discharged to a ditch where it mixes with the industrial effluent prior to entering the Klamath River. At the time of the last inspection, the sanitary wastewater flows averaged between twenty and twenty-two thousand gallons per day. Columbia Plywood Corporation Columbia Plywood Corporation operates under NPDES permit number 100016. There are currently two wastewater outfalls at the facility. Outfall number 001 is permitted to discharge process wastewater with mass limits on BOD5 and total suspended solids, and limits on pH and oil and grease. Outfall number 002 discharges non-contact cooling water with limits on flow, temperature, pH and oil and grease. The wastewater discharged from 001 is treated in an aeration basin and settled in a settling/storage pond prior to discharge into the Klamath River. In 2008, Columbia Plywood discharged 12 days during the year. During those days, flows averaged 1,491 gallons per day from Outfall 001 and 0 gallons per day from Outfall 002. In addition to these discharges, the company also utilizes a portion of the Klamath River for storing and transporting the logs used in their operations. The facility ties the logs into bundles, and places them into the river using an A-Frame hoist which slowly lowers the bundle into the river. The mill then sorts and stores the floating bundles, and pushes them to the plant’s entrance. The binders on the bundle are removed and logs are individually lifted out of the river with a crane and placed onto a conveyor,

Upper Klamath and Lost River Subbasins TMDL
State of Oregon Department of Environmental Quality 29
which conveys logs into the plant. The storing of logs in the Keno impoundment is not currently regulated under Columbia Plywood’s NPDES permitted discharge. 1.3.6.3 Confined Animal Feeding Operations There are currently 19 permitted Confined Animal Feeding Operations (CAFO) in the Lost River Subbasin (Figure 1-15) and none currently permitted in the Upper Klamath Subbasin. CAFOs are generally defined as the concentrated confined feeding or holding of animals in buildings, pens or lots where the surface is prepared to support animals in wet weather or where there are wastewater treatment facilities for livestock (e.g., manure lagoons). CAFO wastes include but are not limited to manure, silage pit drainage, wash down waters, contaminated runoff, milk wastewater, and bulk tank wastewater. The CAFO permit program began in the early 1980s to prevent CAFO wastes from contaminating groundwater and surface water. All CAFOs operate under a general NPDES permit issued
and managed by the Oregon Department of Agriculture. Figure 1-15. Confined Animal Feeding Operations (CAFOs).
1.3.7 Nonpoint Sources
Nonpoint sources of pollution are diffuse or confined sources of pollution where wastes can be conveyed by the movement of water to public waters. Activities that can lead to nonpoint source pollution include rural and urban development, agricultural practices, forest management and dam operations. Nonpoint sources of pollution are discussed in detail in the Chapters 2, 3 and 4.

Upper Klamath and Lost River Subbasins TMDL
State of Oregon Department of Environmental Quality 30
1.3.8 Fishery Resources
The Klamath River basin Upper Klamath Lake Subbasin to the Pacific Ocean contains 83 species of fish, 45 of which are native to the Klamath drainage and 38 that have been introduced and are non-native. Fourteen of the native fish species in the basin have been granted special federal and/or state status (Table 1-6). Table 1-6. Native Fish Species in the Upper Klamath Basin with Special Federal and/or State Status
SPECIES STATUS
Shortnose sucker, Chasmistes brevirostris Endangered-OR and Federal
Lost River sucker, Deltistes luxatus Endangered-OR and Federal
Bull trout, Salvelinus confluentus Critical-OR; Threatened-Federal
Redband/Rainbow trout, Oncorhynchus mykiss gairdneri
Vulnerable-OR
Pacific Lamprey, Lampetra tridentata Vulnerable-OR; Special Concern-Federal
Sources: National Research Council (NRC) 2004,; Oregon Natural Heritage Information Center (ONHIC) 2004,.
The Klamath River basin above Iron Gate Dam hosts 18 native and 19 non-native fish species (Table 1-7). Native fish persisting in this area of the basin include lamprey, chub, specked dace, sulpins, bull trout, redband trout, and sucker species including the endangered shortnose and Lost River suckers. Sucker and redband trout periodicity is summarized in Table 1-8. Introduced fish include various sunfish, catfish, and perch species. Distribution of Native Fish Bull trout are present in four tributaries to the Sprague River, four tributaries to the Sycan River, and two tributaries to Upper Klamath Lake. The current distribution of bull trout is limited to the headwaters upstream of Upper Klamath Lake. Populations are listed as threatened by the federal government and critical by ODFW. The abundance of Klamath Lake sculpin in the basin above Iron Gate Dam is estimated to be in the millions. Sculpins are widely distributed through the Upper Klamath River and Lost River drainages. The Klamath River and Pit-Klamath brook lamprey are abundant and widespread in small streams of the basin above Iron Gate Dam. Klamath tui chub are typically among the most abundant species found during fish kills in Upper Klamath Lake. Blue chub populations throughout the basin are in decline, however they are probably the most abundant native fish in Upper Klamath Lake.
Distribution of Non-Native Fish Fifteen of the non-native species in the Klamath River basin above Iron Gate Dam were introduced for sport fishing or for bait. Most of these species are not common in the basin, although some are abundant and widespread. The effect of these fish on native fishes is poorly understood. Yellow perch, brown bullhead, and pumpkinseed are abundant in the reservoirs, sloughs and ponds of the basin above Iron Gate Dam. Brook trout, brown trout, and non-native strains of rainbow trout are common in streams above Iron Gate Dam and have replaced native redband/rainbow trout and bull trout in many areas. Bullhead and perch are the most abundant non-native species found in Copco Reservoir, while Iron Gate Reservoir hosts large populations of perch, bass, and crappie. Fathead minnows are often the most abundant species encountered during fish sampling, and are common in Upper Klamath Lake and the Lost River drainages. Sacramento perch is also present in the Klamath River and Lost River drainages.

Upper Klamath and Lost River Subbasins TMDL
State of Oregon Department of Environmental Quality 31
Table 1-7. Fish Found Above Iron Gate Dam in the Klamath River Basin
NATIVE
Klamath River lamprey, Lampetra similis Klamath largescale sucker, Catostomus snyderi
Miller Lake Lamprey, Lampetra milleri Klamath smallscale sucker, Catostomus rimiculus
Pit-Klamath brook lamprey, Lampetra lethophaga
Redband/Rainbow trout, Oncorhynchus mykiss gairdneri
Klamath tui chub, Siphatales bicolor bicolor Bull trout, Salvelinus confluentus
Blue chub, Gila coerulea Klamath Lake sculpin, Cottus princeps
Klamath speckled dace, Rhinichthys osculus klamathensis
Slender sculpin, Cottus tenuis
Shortnose sucker, Chasmistes brevirostris Upper Klamath marbled sculpin, Cottus klamathensis klamathensis Lost River sucker, Deltistes luxatus
NON-NATIVE
Goldfish, Carassius auratus Brown trout, Salmo trutta
Golden shiner, Notemigonus chrysoleucas Sacramento perch, Archoplites interruptus
Fathead minnow, Pimephales promelas White crappie, Pomoxis annularis
Yellow bullhead, Ameiurus natalis Black crappie, Pomoxis nigromaculatus
Brown bullhead, Ameiurus nebulosus Green sunfish, Lepomis cyanellus
Black bullhead, Ameiurus melas Bluegill, Lepomis macrochirus
Channel catfish, Ictalurus punctatus Pumpkinseed, Lepomis gibbosus
Kokanee salmon, Oncorhynchus nerka Largemouth bass, Micropterus salmoides
Brook trout, Salvelinus fontinalis Yellow perch, Perca flavescens
Source: NRC 2004; Pacificorp 2004,.

Upper Klamath and Lost River Subbasins TMDL
State of Oregon Department of Environmental Quality 32
Table 1-8. Sucker and Redband Trout Periodicity for the Klamath River in Oregon
Species/Life Stage
Jan Feb Mar Apr May Jun Jul Aug Sep Oct Nov Dec
Adult Migration
Suckers
Redband Trout
Spawning
Suckers
Redband Trout
Incubation
Suckers
Redband Trout
Rearing
Suckers Redband Trout Juvenile emigration
Suckers
Redband trout
Lesser Use Period
Peak Use Source: FISHPRO 2000 1.3.8.1 Lost River and Shortnose Sucker The Lost River sucker (Deltistes luxatus) and shortnose sucker (Chasmistes brevirostris) were federally listed as endangered on July 18, 1988, because they were at risk of extinction owing to significant population declines with continued downward trends, a lack of recent recruitment, range reduction, habitat loss/degradation and fragmentation, potential hybridization, competition and predation by exotic fishes, and other factors (USFWS 1988). These fish were once very abundant and were important seasonal foods of native Americans and white settlers in the upper Klamath River basin (Cope 1879, Gilbert 1898, Howe 1968). Spawning migrations occurred in the spring at a critical time when winter food stores had been exhausted. The Klamath and Modoc Indians dried suckers for later use. In 1959, suckers were made a game species under Oregon State law; however, the game fishery was terminated in 1987, just prior to federal listing. The factors affecting the persistence and abundance of Lost River and shortnose suckers include the following (USFWS 1988):
• Habitat fragmentation; • Dams, draining of marshes, instream flow diversion and other forms of water
manipulation; • Loss of access to spawning habitat; and, • Decreases in water quality associated with timber harvest, removal of riparian vegetation, livestock grazing, and agriculture practices.
Suckers can tolerate low dissolved oxygen, high water temperature and elevated pH levels, but fish may not thrive in long-term, continual poor conditions and different lifestages may be more sensitive. Long-term exposure to non-lethal, but stressful levels of one water quality parameter may make fish more susceptible to the harmful effects of another. Suckers are designated as a Cool Water Species (Figure 1-16).

Upper Klamath and Lost River Subbasins TMDL
State of Oregon Department of Environmental Quality 33
1.3.8.2 Redband Trout Redband trout are present in the Upper and Klamath and Lost River Subbasins. Redband trout are likely a separate species within the salmon family (Salmonidae) and this necessitated the change in species name of rainbow trout from Salmo gairdneri to Oncorhynchus mykiss, of the Southern Oregon region. Although redband trout have been observed in most of the USBR irrigation project, the primary habitat for redband within the lower Lost River drainage is Miller Creek watershed and tributaries to Gerber Reservoir (Figure 1-17). The species is one of the most taxonomically complicated trout groups in Oregon. The species probably consists of multiple subspecies, of which Klamath redband is one. None of these have been formally recognized. The most recently published data on the species is in Behnke (1992), where three subspecies with ranges extending into Oregon are proposed: O.m. irideus, or coastal rainbow and steelhead trout; O.m. gairdneri, or inland Columbia Basin redband and steelhead trout; and O.m. newberrii, or Oregon Basin redband trout. In general, the group Behnke calls O.m. irideus is undisputed. In addition to the native redband trout, hatchery rainbow trout have been stocked in the upper Klamath Basin since 1922 (Logan and Markle 1993). Figure 1-16. Lost River Subbasin Fish Use Designation (adapted from OAR-340-041-180 Figure 180A).
Redband or Lahontan Cutthroat Trout
Cool Water Species
Trout
Trout
Redband Trout
Klamath Falls
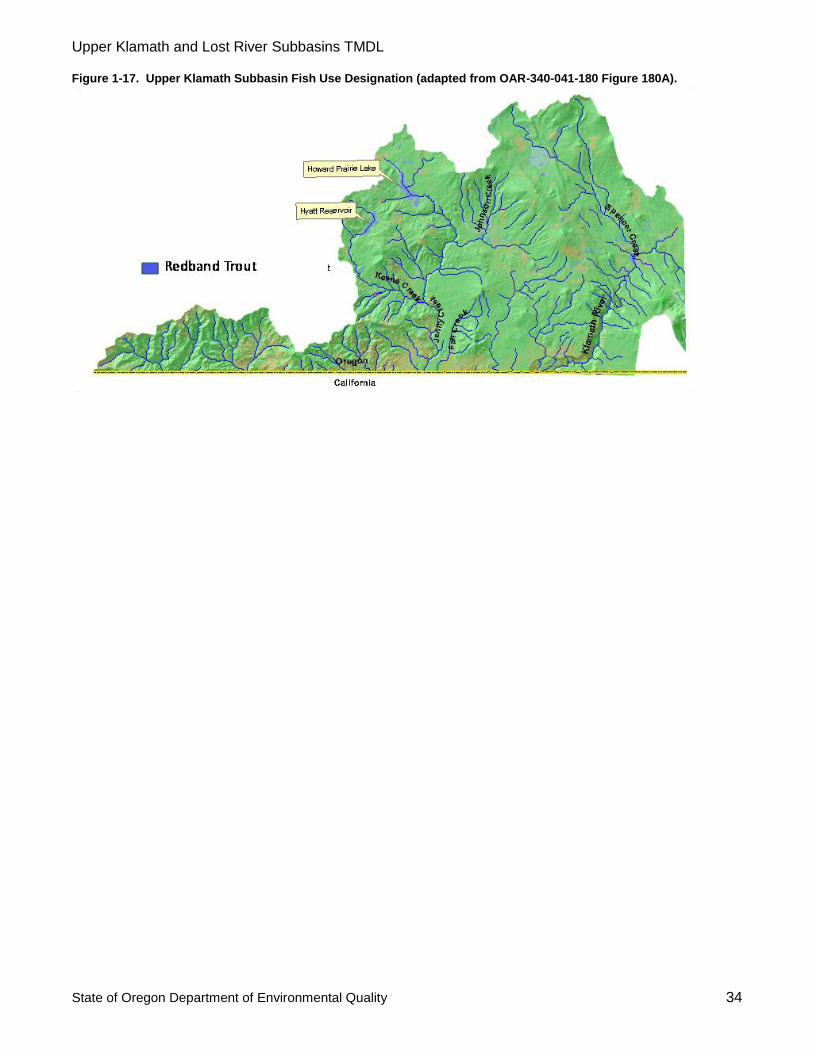
Upper Klamath and Lost River Subbasins TMDL
State of Oregon Department of Environmental Quality 34
Figure 1-17. Upper Klamath Subbasin Fish Use Designation (adapted from OAR-340-041-180 Figure 180A).

Upper Klamath and Lost River Subbasins TMDL
State of Oregon Department of Environmental Quality 35
1.4 References Behnke, R.J. 1992. Native Trout of Western North America. Bethesda, MA. American Fisheries Society Monograph 6.
Boyd, M., S. Kirk, M. Wiltsey, and B. Kasper. 2002. Upper Klamath Drainage Total Maximum Daily Load (TMDL) and Water Quality Management Plan (WQMP). Oregon Department of Environmental Quality. May 2002. 188 pp.
Carlson, H.L., and Todd, Rodney, 2003, Effects of the 2001 water allocation decisions on the agricultural landscape and crop production in the Klamath Reclamation Project, in Braunworth, W.S., Jr., Welch, Teresa, and Hathaway, Ron, eds., Water allocation in the Klamath Reclamation Project: an assessment of natural resource, economic, social, and institutional issues with a focus on the upper Klamath Basin, Oregon State University Extension Service Special Report 1037, p. 163-167,
Cope, E. D. 1879. The fishes of Klamath Lake Oregon. American Naturalist 13:784-785.FISHPRO. 2000. Fish Passage Conditions on the Upper Klamath River. July 2000. Port Orchard, WA. Gannett, M.W., Lite, K.E. Jr., La Marche, J.L., Fisher, B.J., and Polette, D.J., 2007, Ground-water hydrology of the upper Klamath Basin, Oregon and California: U.S. Geological Survey Scientific Investigations Report 2007-5050, 84 p.
Gilbert, C. H. 1898. The fishes of the Klamath Basin. Bulletin of the United States Fish Commission 17. Howe, C. B. 1968. Ancient tribes of Klamath County. Binford and Mort, Portland, Oregon.
Logan, D.J., and D.F. Markle 1993. Fish faunal survey of Agency Lake and northern Upper Klamath Lake, Oregon. In Environmental research in the Klamath Basin, Oregon - 1992 Annual Report. S.G. Campbell (ed.) p. 341.
National Research Council of the National Academies (NRC). 2004. Endangered and Threatened Fishes in the Klamath River Basin. Washington, D.C. National Academies Press. North Coast Regional Water Quality Control Board, Upper Lost River and Clear Lake Reservoir Watershed Total Maximum Daily Load Analysis Water Temperature and Nutrients, 2006. Available at: http://www.swrcb.ca.gov/northcoast/water_issues/programs/tmdls/lost_river_upper/pdf/ul.pdf North Coast Regional Water Quality Control Board, Draft, Staff Report For the Klamath River Total Maximum Daily Loads (TMDLs) and Action Plan Foer Addressing Temperature, Dissolved Oxygen, Nutrient, and Microcystin Impairments in California, June 2009, Available at: http://www.swrcb.ca.gov/northcoast/water_issues/programs/tmdls/klamath_river/ North Coast Regional Water Quality Control Board, Appendix 5, Fish and Fishery Resources of the Klamath River Basin, in Draft, Staff Report For the Klamath River Total Maximum Daily Loads (TMDLs) and Action Plan For Addressing Temperature, Dissolved Oxygen, Nutrient, and Microcystin Impairments in California, June 2009, Available at: http://www.swrcb.ca.gov/northcoast/water_issues/programs/tmdls/klamath_river/ Oregon Climate Service (OCS). 2006. Climate Data Archives: Klamath Falls 2 SSW (354506), Klamath Falls Ag-Stn (354511). Accessed January 8, 2007. Available at: http://www.ocs.oregonstate.edu/page_links/climate_data_zones/monthly_precip/zone7_tpcp.html>. Oregon Department of Environmental Quality, North Coast Regional Water Quality Control Board, U.S. EPA Region 9 and 10. 2008. Memorandum of Agreement, Klamath River/Lost River TMDL Development. Oregon Department of Geology and Mineral Industries (DOGAMI). 2008. Geologic Map of the Klamath Falls Area,

Upper Klamath and Lost River Subbasins TMDL
State of Oregon Department of Environmental Quality 36
Klamath County Oregon.
Oregon Natural Heritage Information Center (ONHIC). 2004. Rare, Threatened, and Endangered Speices in Oregon. Oregon Natural Heritage Information Center, Oregon State University. Portland, OR. May 2004. 105pp. PacifiCorp. 2004. Final Technical Report: Fish Resources. Klamath Hydroelectric Project (FERC Project No. 2082). Portland, OR. 78pp. USFWS (U.S. Fish and Wildlife Service). 1988. Endangered and threatened wildlife and plants; determination of endangered status for the shortnose sucker and Lost River sucker. Federal Register 53:27130-27134. US Bureau of Reclamation. 2008. Undepleted Natural Flow of the Upper Klamath River. http://www.usbr.gov/mp/kbao/special_projects.html US Reclamation Service. 1905. Topographic and Irrigation Map of Upper and Lower Klamath Projects California – Oregon.

Upper Klamath and Lost River Subbasins TMDL
State of Oregon Department of Environmental Quality 37
Chapter 2: Klamath River Dissolved Oxygen, Chlorophyll a, pH, and Ammonia Toxicity

Upper Klamath and Lost River Subbasins TMDL
State of Oregon Department of Environmental Quality 38
2.1 Introduction The initial steps in the development of Klamath River TMDLs included compilation of available water quality data; evaluation of monitoring data to identify the extent, location, and timing of water quality impairments; and development of the technical approach to analyze the relationship between pollutant loading and spatial and temporal impairments to water quality (Figure 2-1). These steps are documented in Appendix A Data Review and Modeling Approach- Klamath and Lost Rivers TMDL Development. Every attempt was made to obtain the most current and comprehensive data to support water quality model development, application, and analysis. The technical analysis used to develop the Klamath River TMDLs made the best use of available data and provides a framework that can be readily updated in the future as more data become available. Using available information, a hydraulic and water quality model was developed to: 1) analyze the available data; 2) simulate water quality dynamics in the system, and 3) predict conditions that attain water quality criteria. Modeling results indicate that water quality criteria for the Klamath River from Upper Klamath Lake to the Oregon–California Stateline can be attained under the following conditions: Achieve the load reductions called for in the Upper Klamath Lake TMDL (DEQ 2002), Reduced loading of nitrogen, phosphorus, and biochemical oxygen demand (BOD), Increased dissolved oxygen levels in Keno impoundment and JC Boyle Reservoir, and Achievement of load allocations for the Lost River Subbasin, where water discharges from the Lost River Subbasin to the Klamath River as described in Chapter 3. These TMDLs are based on Oregon’s water quality standards (OAR 340-041). These TMDLs were developed as part of a comprehensive multistate analysis and also achieve California water quality standards at stateline (North Coast Regional Water Quality Control Board [NCRWQCB], 2009). It is appropriate for the NCRWQCB to account for these anticipated upstream load reductions in Oregon when developing the TMDLs for the segments of the Klamath River that are downstream in California. For this document, “Keno impoundment” refers to the portion of the Klamath River upstream of Keno dam to the mouth of Link River (a segment of the Klamath River), including Lake Ewauna, approximately river miles 231 to 252. The components of the Klamath River TMDLs are summarized in Table 2-1. Figure 2-1. Klamath River and major tributaries in Oregon. RM stands for river mile and is based on the Water Resources
Map series from 1978 and is consistent with river mile metrics in the 2004-2006 DEQ 303(d) list, presented on the following pages.

Upper Klamath and Lost River Subbasins TMDL
State of Oregon Department of Environmental Quality 39
Table 2-1. Dissolved Oxygen, pH, Ammonia Toxicity, and Nutrient TMDL Components
Waterbodies OAR 340-042-0040(4)(a)
This TMDL addresses impairments in the impoundments and riverine sections of the Klamath River from the outlet of Upper Klamath Lake to the State border with California, including Link River and Lake Ewauna.
Pollutant Identification and other factors contributing to impairment OAR 340-042-0040(4)(b)
Total phosphorus, total nitrogen, biochemical oxygen demand, human caused temperature increases and hydraulic modification.
Target Identification OAR 340-042-0040(4)(c) CWA §303(d)(1)
Numeric and narrative criteria in the dissolved oxygen, pH, ammonia toxicity, and nuisance phytoplankton growth water quality standards.
Existing Sources CWA §303(d)(1) OAR 340-042-0040(4)(f)
Upper Klamath Lake, agriculture, Lost River Diversion Channel, Klamath Straits Drain, other irrigation return flow, waste water treatment plants, impoundments, natural sources, septic systems, rural residential land use, urban land use, forestry, transportation.
Seasonal Variation CWA §303(d)(1) OAR 340-042-0040(4)(j)
Critical dissolved oxygen, pH, and ammonia toxicity levels on the Klamath River generally occur in late spring until fall. Nutrient and BOD allocations apply year round.
TMDL Loading Capacity and Allocations 40 CFR 130.2(f) 40 CFR 130.2(g) 40 CFR 130.2(h) OAR 340-042-0040(4)(d), (g), (h), (k)
Loading Capacity: See Table 2-7 The allocations apply to sources within the area that is hydrologically connected to the Klamath River except the area covered by the Upper Klamath and Agency Lakes TMDL (DEQ 2002). It is unknown if the allocations to sources covered by the Lost River System TMDL (this document) will also achieve the allocations in this TMDL. Wasteload Allocations (Point Sources) - See Table 2-7 Load Allocations (Non-Point Sources) – See Table 2-7, Table 2-8 Reserve Capacity –Narrative approach related to DO and pH impairments.
Excess Load OAR 340-042-0040(4)(e)
Excess load is the difference between the current load and the TMDL and equals 285 metric tons / year of total phosphorus, 851 metric tons/year of total nitrogen, and 4,076 metric tons / year of carbonaceous biochemical oxygen demand (CBOD).
Surrogate Measures 40 CFR 130.2(i)
Dissolved oxygen augmentation is required in two impounded reaches in order to achieve water quality standards.
Margins of Safety CWA §303(d)(1) OAR 340-042-0040(4)(i)
The margin of safety is implicit using conservative assumptions about sediment oxygen demand, nutrient loading from Upper Klamath Lake and flow regime.
WQ Standard Attainment Analysis CWA §303(d)(1)
Analytical modeling of TMDL loading capacities demonstrates attainment of water quality standards.
Water Quality Management Plan OAR 340-042-0040(4)(l)
Provided in Chapter 4

Upper Klamath and Lost River Subbasins TMDL
State of Oregon Department of Environmental Quality 40
2.2 Target Identification
2.2.1 Sensitive Beneficial Uses
Oregon Administrative Rules (OAR Chapter 340, Division 41, Section 0180 (1), Table 180A) lists the “Beneficial Uses” occurring within the Klamath basin (Table 2-2). Numeric and narrative water quality standards are designed to protect the most sensitive beneficial uses. The most sensitive beneficial uses relevant to the Klamath River TMDLs are salmonid fish spawning and rearing and resident fish and aquatic life. Water quality problems are of great concern because of their potential impact on native fish in the Klamath basin, including the Shortnose sucker (Chasmistes brevirostris), Lost River sucker (Deltistes luxatus), and interior redband trout (Oncorhynchus mykiss ssp.). Both sucker species were listed as endangered under the federal Endangered Species Act in 1988, and water quality degradation resulting from algal blooms was identified as a probable major factor in their declines (Williams 1988). Table 2-2. Designated beneficial uses occurring in the Klamath Basin (OAR 340-041-0180(1))
Beneficial Use Occurring Beneficial Use Occurring
Public Domestic Water Supply Salmonid Fish Spawning (Trout)
Private Domestic Water Supply Salmonid Fish Rearing (Trout)
Industrial Water Supply Resident Fish and Aquatic Life
Irrigation Wildlife and Hunting
Livestock Watering Fishing
Boating Water Contact Recreation
Hydro Power Aesthetic Quality
Commercial Navigation and Transportation
2.2.2 Dissolved Oxygen Water Quality Standard (relevant parts)
OAR 340-041-0004 (9)(a)(D)(iii) Effective July 1, 1996, in water bodies designated water-quality limited for dissolved oxygen, when establishing WLAs under a TMDL for water bodies meeting the conditions defined in this rule, the Department may at its discretion provide an allowance for WLAs calculated to result in no measurable reduction of dissolved oxygen (DO). For this purpose, "no measurable reduction" is defined as no more than 0.10 mg/L for a single source and no more than 0.20 mg/L for all anthropogenic activities that influence the water quality limited segment. The allowance applies for surface water DO criteria and for Intergravel dissolved oxygen (IGDO) if a determination is made that the conditions are natural. The allowance for WLAs applies only to surface water 30-day and seven-day means; OAR 340-041-0016 (1) For water bodies identified as active spawning areas in the places and times indicated on the following Tables and Figures set out in OAR 340-041-0101 to 340-041-0340: Tables 101B, 121B, and 180B, 201B and 260B, and Figures 130B, 151B, 160B, 170B, 180A, 201A, 220B, 230B, 260A, 271B, 286B, 300B, 310B, 320B, and 340B, (as well as any active spawning area used by resident trout species), the following criteria apply during the applicable spawning through fry emergence periods set forth in the tables and figures and, where resident trout spawning occurs, during the time trout spawning through fry emergence occurs ( Table 2-3):

Upper Klamath and Lost River Subbasins TMDL
State of Oregon Department of Environmental Quality 41
(a) The dissolved oxygen may not be less than 11.0 mg/l (b) Where conditions of barometric pressure, altitude, and temperature preclude attainment of the 11.0 mg/l or 9.0 mg/l criteria, dissolved oxygen levels must not be less than 95 percent of saturation; OAR 340-041-0016 (2) For water bodies identified by the Department as providing cold-water aquatic life, the dissolved oxygen may not be less than 8.0 mg/l as an absolute minimum. Where conditions of barometric pressure, altitude, and temperature preclude attainment of the 8.0 mg/l, dissolved oxygen may not be less than 90 percent of saturation. At the discretion of the Department, when the Department determines that adequate information exists, the dissolved oxygen may not fall below 8.0 mg/l as a 30-day mean minimum, 6.5 mg/l as a seven-day minimum mean, and may not fall below 6.0 mg/l as an absolute minimum ( Table 2-3); OAR 340-041- 0016 (1)(c) For water bodies identified by the Department as providing cool-water aquatic life, the dissolved oxygen may not be less than 6.5 mg/l as an absolute minimum. At the discretion of the Department, when the Department determines that adequate information exists, the dissolved oxygen may not fall below 6.5 mg/l as a 30-day mean minimum, 5.0 mg/l as a seven-day minimum mean, and may not fall below 4.0 mg/l as an absolute minimum ( Table 2-3); Table 2-3. Summary of Dissolved Oxygen Standard, applicability and assessment of the Klamath River
River-miles
Upstream Feature
Dissolved Oxygen Criteria
Salmonid Spawning
Period*
Non-spawning Period (Year Around) Numeric
Criteria (mg/L)
Spawning Period
Numeric Critereia*
2004-06 WQ Assessment
Status
231.5 - 253
Upper Klamath
Lake outlet
Cool water none 6.5 as a 30-day mean minimum
5.0 as a 7-day minimum mean
4.0 as an absolute minimum
na Year round: Impaired
207 - 231.5
Keno Dam Cold water Jan 1 – May 15
8.0 as a 30-day mean minimum
6.5 as a 7-day minimum mean
6.0 as an absolute minimum
11.0 mg/L or not less than
95% saturation
Spawning: Impaired
Non-Spawning: Impaired
*Includes resident trout
2.2.3 pH Standard:
OAR 340-041-0185 (1): pH (hydrogen ion concentration). pH values may not fall outside the following ranges:
(a) Fresh waters except Cascade lakes: pH values may not fall outside the range of 6.5-9.0. When greater than 25 percent of ambient measurements taken between June and September are greater than pH 8.7, and as resources are available according to priorities set by the Department, the Department will determine whether the values higher than 8.7 are anthropogenic or natural in origin;
(b) Cascade lakes above 5,000 feet altitude: pH values may not fall outside the range of 6.0 to 8.5.

Upper Klamath and Lost River Subbasins TMDL
State of Oregon Department of Environmental Quality 42
OAR 340-041-0021 (2): Waters impounded by dams existing on January 1, 1996, which have pHs that exceed the criteria are not in violation of the standard, if the Department determines that the exceedance would not occur without the impoundment and that all practicable measures have been taken to bring the pH in the impounded waters into compliance with the criteria.
2.2.4 Nuisance Phytoplankton Growth
OAR 340-041-0019(1): The following values and implementation program must be applied to lakes, reservoirs, estuaries and streams, except for ponds and reservoirs less than ten acres in surface area, marshes and saline lakes: (a) The following average chlorophyll a values must be used to identify water bodies where phytoplankton may impair the recognized beneficial uses: (B) Natural lakes that do not thermally stratify, reservoirs, rivers and estuaries: 0.015 mg/l; The preceding rule language may guide DEQ’s actions. DEQ uses this criterion as an action level that triggers further investigation. This document continues to present information related to chlorophyll a concentrations. However, the TMDL is not written to demonstrate compliance with the criterion of 0.015 mg/L for chlorophyll a. DO and pH are parameters which more directly affect aquatic life than chlorophyll a and achieving these criteria will be protective of that beneficial use. Nutrient reduction in the watershed will reduce the potential for DO and pH swings, as well as, reduce the presence of chlorophyll a.
2.2.5 Ammonia Toxicity
The Environmental Quality Commission adopted a new toxic substances rule on May 29th, 2004. EPA has approved of the new rule and the TMDL has been updated from its previous version to reflect the approval. The information concerning the analysis and information included in the TMDL can be found in Appendix I. OAR 340-041-033 (2): Levels of toxic substances may not exceed the criteria listed in Table 20 [from the OAR]. Table 20, within the OAR, states that the ammonia criteria are pH and temperature dependent and refers to “Document USEPA January 1985 (Fresh water)” and are published in Quality Criteria for Water (U.S. EPA 1986). The criteria is calculated different depending on whether salmonids or other sensitive coldwater species are present. For the entire Klamath River, the ammonia toxicity criteria are calculated assuming salmonids or other sensitive coldwater species are present which is the more conservative of the two calculation methods.
2.3 Deviation from Water Quality Standard Section 303(d) of the Federal Clean Water Act (1972) requires that water bodies that violate water quality standards, thereby failing to fully protect beneficial uses, be identified and placed on a 303(d) list. Waterbodies in the Klamath River mainstem have been placed on the 2004 Section 303(d) list for pH, dissolved oxygen, ammonia toxicity, and chlorophyll a violations (Table 2-4). The time period “summer” is defined as June 1 – September 30 in OAR 340-041-0002(57). For specific information regarding Oregon’s 303(d) listing procedures, and to obtain more information regarding the 303(d) listed streams, visit the DEQ’s web page at http://www.deq.state.or.us/ .

Upper Klamath and Lost River Subbasins TMDL
State of Oregon Department of Environmental Quality 43
Table 2-4. Klamath River in Oregon, 303(d) list (2004)
Waterbody Name
Record
ID River Mile Parameter Period
Klamath River 11587 207- 231.1 Dissolved Oxygen Spawning: January 1 –
May 15
Klamath River 11982 207 – 231.1
Dissolved Oxygen Year-round (non-
spawning)
Klamath River 21093 231.1 -
251 Dissolved Oxygen
Year-round (non-spawning)
Klamath River 15785 231.5 -
253 pH summer
Klamath River 15767 231.5 -
253 Ammonia Toxicity year round
Klamath River 15776 231.5 -
253 Chlorophyll a summer
2.3.1 Dissolved Oxygen, pH and Ammonia Toxicity
The Keno impoundment from the mouth of Link River (a segment of the Klamath River upstream of Keno impoundment) to Keno Dam is approximately 21 miles long with a mean depth of 13 feet. Water quality in Keno impoundment during summer is extremely impaired with prolonged periods of persistent anoxia, water temperatures exceeding 25º C, high pH and elevated levels of ammonia toxicity (NRC 2004 and Deas and Vaughn 2006). Figure 2-2 shows a longitudinal cross section of DO concentrations in Keno impoundment on July 26, 2005 (Deas 2008). Figure 2-2. Keno impoundment longitudinal cross section of dissolved oxygen (mg/l) on July 26 2005 (Deas 2008).
The DO measurements in the well-aerated Link River between Upper Klamath Lake and Keno impoundment typically achieve the water quality standard. However, the DO values drop in the slow moving water of Keno impoundment with the lowest values observed during July, August and September. The DO standard that applies to this reach is 6.5 mg/L as a 30-day mean minimum, 5.0 mg/L as a seven-day minimum mean, and may not fall below 4.0 mg/L as an absolute minimum. DO values are not typically stratified and are typically measured at less than 1 mg/L at some point each summer. In more extreme conditions, such as those measured in 2000, DO concentration in the entire water column was less than 1 mg/L for approximately a week or more.
236 238 240 242 244 246 248 250 252 254
River Mile
-4
-2
De
pth
(m
)
0 1 2 3 4 5 6 7 8 9 10 11 12 13
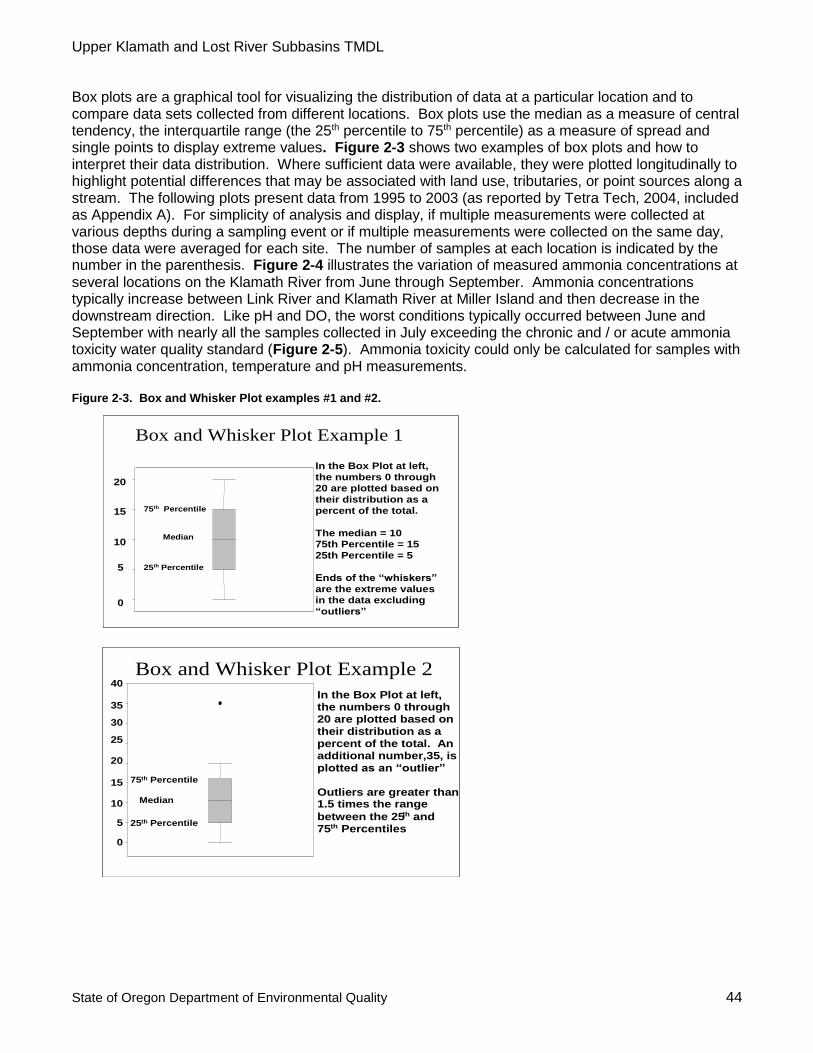
Upper Klamath and Lost River Subbasins TMDL
State of Oregon Department of Environmental Quality 44
Box plots are a graphical tool for visualizing the distribution of data at a particular location and to compare data sets collected from different locations. Box plots use the median as a measure of central tendency, the interquartile range (the 25th percentile to 75th percentile) as a measure of spread and single points to display extreme values. Figure 2-3 shows two examples of box plots and how to interpret their data distribution. Where sufficient data were available, they were plotted longitudinally to highlight potential differences that may be associated with land use, tributaries, or point sources along a stream. The following plots present data from 1995 to 2003 (as reported by Tetra Tech, 2004, included as Appendix A). For simplicity of analysis and display, if multiple measurements were collected at various depths during a sampling event or if multiple measurements were collected on the same day, those data were averaged for each site. The number of samples at each location is indicated by the number in the parenthesis. Figure 2-4 illustrates the variation of measured ammonia concentrations at several locations on the Klamath River from June through September. Ammonia concentrations typically increase between Link River and Klamath River at Miller Island and then decrease in the downstream direction. Like pH and DO, the worst conditions typically occurred between June and September with nearly all the samples collected in July exceeding the chronic and / or acute ammonia toxicity water quality standard (Figure 2-5). Ammonia toxicity could only be calculated for samples with ammonia concentration, temperature and pH measurements. Figure 2-3. Box and Whisker Plot examples #1 and #2.
0
5
10
15
20
Box and Whisker Plot Example 1
In the Box Plot at left,
the numbers 0 through 20 are plotted based on
their distribution as a
percent of the total.
The median = 10
75th Percentile = 15
25th Percentile = 5
Ends of the “whiskers”
are the extreme values in the data excluding
“outliers”
Median
75 th Percentile
25 th Percentile
0
5
10
15
20
25
30
35
40
Box and Whisker Plot Example 2
In the Box Plot at left, the numbers 0 through 20 are plotted based on their distribution as a percent of the total. An additional number,35, is plotted as an “outlier”
Outliers are greater than 1.5 times the range
between the 25 th and 75 th Percentiles
Median
75 th Percentile
25 th Percentile

Upper Klamath and Lost River Subbasins TMDL
State of Oregon Department of Environmental Quality 45
Figure 2-4. Ammonia longitudinal profile of the Klamath River from Upper Klamath Lake to the Oregon / California border. Miller Island is river mile 245.
Figure 2-5. Ammonia toxicity by month for Klamath River at Miller Island. The total height of the three boxes for each
month (clear, red and orange) is equal to the total number of samples for that month. For example, 28 samples were collected in June, 10 were exceeding the chronic criterion, 2 exceeding the acute criterion and 16 were not exceeding the criteria.
The greatest pH values occur between June and September. In this period, pH values peak at Link River and trend downward within Keno impoundment (Figure 2-6). Over half of the summer pH values at Link River exceeded the pH criterion of 9.0. There was only one excursion below the pH standard for the dataset analyzed, which occurred downstream of JC Boyle dam. This sample appears to be anomalous and not indicative of an actual impairment. Chlorophyll a concentrations show a similar trend as pH, peaking in or just downstream of Link River and often exceeding the water quality action level of 15 µg/L (Figure 2-7).
250 240 230 220 210
River Mile
0.0
0.5
1.0
1.5
2.0
2.5A
mm
ionia
as N
(m
g/L
)
Klamath River from California border to Upper Klamath LakeJune - September
JC Boyle R
es
(5)(41)(4)(35)(58)(18)(174)(119)(75)(132)
Link River
Lake Ewauna / Keno Res
Klamath River at Miller Island
Ammonia Toxicity
0
5
10
15
20
25
30
35
40
1 2 3 4 5 6 7 8 9 10 11 12
Month
Nu
mb
er
of
Sa
mp
les
Not exceeding criteria
Exceeding acute criteria
Exceeding chronic criteria

Upper Klamath and Lost River Subbasins TMDL
State of Oregon Department of Environmental Quality 46
Figure 2-6. pH longitudinal profile of the Klamath River from the Oregon / California border to Upper Klamath Lake.
Figure 2-7. Chlorophyll a longitudinal profile of the Klamath River from the Oregon / California border to Upper Klamath Lake.
JC Boyle Reservoir experiences hypoxic (low dissolved oxygen) conditions at times during the summer months at the deepest area of the reservoir (Figure 2-8)
250 240 230 220 210
River Mile
6
7
8
9
10pH
Klamath River from California border to Upper Klamath LakeJune - September
JC Boyle R
es
maximum critierion
(5)(26)(6)(10)(64)(18)(169)(114)(78)(106)
Link River
Lake Ewauna / Keno Res
minimum criterion
250 240 230 220 210
River Mile
1
10
100
Ch
loro
ph
yll
a (
ug
/L)
Klamath River from California border to Upper Klamath LakeJune - September
JC Boyle R
es
maximum critierion = 15
(3)(24)(2)(18)(42)(15)(45)(22)(5)(58)
Link River
Lake Ewauna / Keno Res
action level = 15

Upper Klamath and Lost River Subbasins TMDL
State of Oregon Department of Environmental Quality 47
Figure 2-8. Dissolved oxygen profile at J.C. Boyle Reservoir at deepest point for year 2000. X- axis indicates dissolved
oxygen (mg/L) and Y-axis Depth (m). Dashed line indicates the DO criterion of 8 mg/L.
DO data indicate that although river concentrations of DO are greater than in the impoundments, they are still below the numeric criteria between approximately February 15 and October 15 (Figure 2-9).
Dissolved Oxygen (mg/L)
Depth
(m)
Depth
(m)

Upper Klamath and Lost River Subbasins TMDL
State of Oregon Department of Environmental Quality 48
Figure 2-9. Dissolved oxygen concentrations with percent saturation threshold (data from 1/1995 to 3/2005) downstream of JC Boyle Powerhouse (see Figure 2-1). The percent saturation criterion for the spawning period (January 1 – May 15) is 95% and 90% at other times.
2.4 Seasonal Variation Critical levels of dissolved oxygen, pH and ammonia occur predominantly during the summer, from June through September. However, there are periodic excursions to the DO and pH water quality criteria during the remainder of the year. Miller Island boat ramp was chosen to show seasonal variation because it is a regularly sampled monitoring location with some of the most degraded water quality conditions. July and August appear to be the most impaired months for dissolved oxygen however there are measurements which are less than the criteria from March to November (Figure 2-9 and Figure 2-10). The following plots present data from 1995 to 2003 as reported by Tetra Tech (2004). For simplicity of analysis and display, if multiple measurements were collected at various depths during a sampling event or if multiple measurements were collected on the same day, those data were averaged for each site. Exceedances of the pH standard are more frequent between June and September but also occurred the other months except March, November and December (Figure 2-11). Ammonia concentrations are predominately greatest in the summer and fall (Figure 2-12) however the exceedances of the ammonia toxicity criteria occur between June and September (Figure 2-5). Given the excursions from the pH and/or DO numeric criteria from January through November as discussed above, the allocations to address these impairments apply year round.
0
2
4
6
8
10
12
14
1/1 2/20 4/10 5/30 7/19 9/7 10/27 12/16
Dis
solv
ed
Oxy
gen
(m
g/L)
date
Klamath River downstream of JC Boyle powerhouse (rm 218)
< % saturation criteria ≥ % saturation criteria
numeric criteria

Upper Klamath and Lost River Subbasins TMDL
State of Oregon Department of Environmental Quality 49
Figure 2-10. Seasonal dissolved oxygen concentrations from Klamath River at Miller Island (river mile 245).
Figure 2-11. Seasonal box plot of pH at Link River.
1 2 3 4 5 6 7 8 9 10 11 12
(9) (9) (16) (25) (38) (34) (34) (43) (31) (36) (23) (5)
0
5
10
15
Dis
so
lve
d O
xyg
en (
mg
/L)
Klamath River at Miller Island
average criterion
minimum criterion
Month
30-day mean criterion
1 2 3 4 5 6 7 8 9 10 11 12
6
7
8
9
10
pH
Link River
(31) (33) (61) (33) (58) (31) (45) (43) (44) (33) (33) (6)
maximum criterion
Month
minimum criterion

Upper Klamath and Lost River Subbasins TMDL
State of Oregon Department of Environmental Quality 50
Figure 2-12. Ammonia concentration by month at Klamath River at Miller Island.
2.5 Water Quality Modeling Overview In order to support TMDL development for the Klamath River, the need for an integrated hydrodynamic and water quality modeling system was identified. The following model capabilities were identified:
Capable of simulating the complex hydrodynamics of Keno impoundment.
Capable of predicting nutrient cycles, DO, pH and temperature.
Dynamic (time-variable) and thus capable of representing the highly variable flow and water quality conditions within and between years.
Following a review of potential modeling approaches, DEQ, NCRWQCB and U.S. EPA selected the water quality models developed by Watercourse Engineering for PacifiCorp (Watercourse Engineering, 2004), hereafter referred to as the PacificCorp Model. DEQ, NCRWQCB and U.S. EPA determined that with some enhancements, the PacifiCorp model would provide the optimal basis for developing the Klamath River TMDLs. Complete documentation of modeling configuration, model input, and calibration is presented in Appendix B (Model Configuration and Results Klamath River Model for TMDL Development, Tetra Tech 2009). The modeling domain for the Klamath River was divided into nine model segments as depicted in Table 2-5. Within each model segment the river and reservoirs were further divided into higher resolution elements for greater detail in modeling. The original PacifiCorp model used Resource Management Associates (RMA) RMA-2 and RMA-11 models and the CE-QUAL-W2 model. Specifically, the RMA-2 and RMA-11 models were applied to riverine reaches at Link River, Keno Dam downstream to J.C. Boyle Reservoir, Bypass/Full Flow Reach, and Iron Gate Dam to Turwar. RMA-2 simulates hydrodynamics, while RMA-11 represents water quality processes. The CE-QUAL-W2 model was applied for Lake Ewauna-Keno Dam, J.C. Boyle Reservoir, Copco Reservoir, and Iron Gate Reservoir. The Klamath River estuary (Turwar to Pacific Ocean) was modeled using the Environmental Fluid Dynamics Code (EFDC) which is a full 3-D
1 2 3 4 5 6 7 8 9 10 11 12
(6) (7) (12) (23) (35) (29) (28) (34) (25) (30) (19) (5)
Month
0.0
0.5
1.0
1.5
2.0
Am
monia
as N
(m
g/L
)
Klamath River at Miller Island
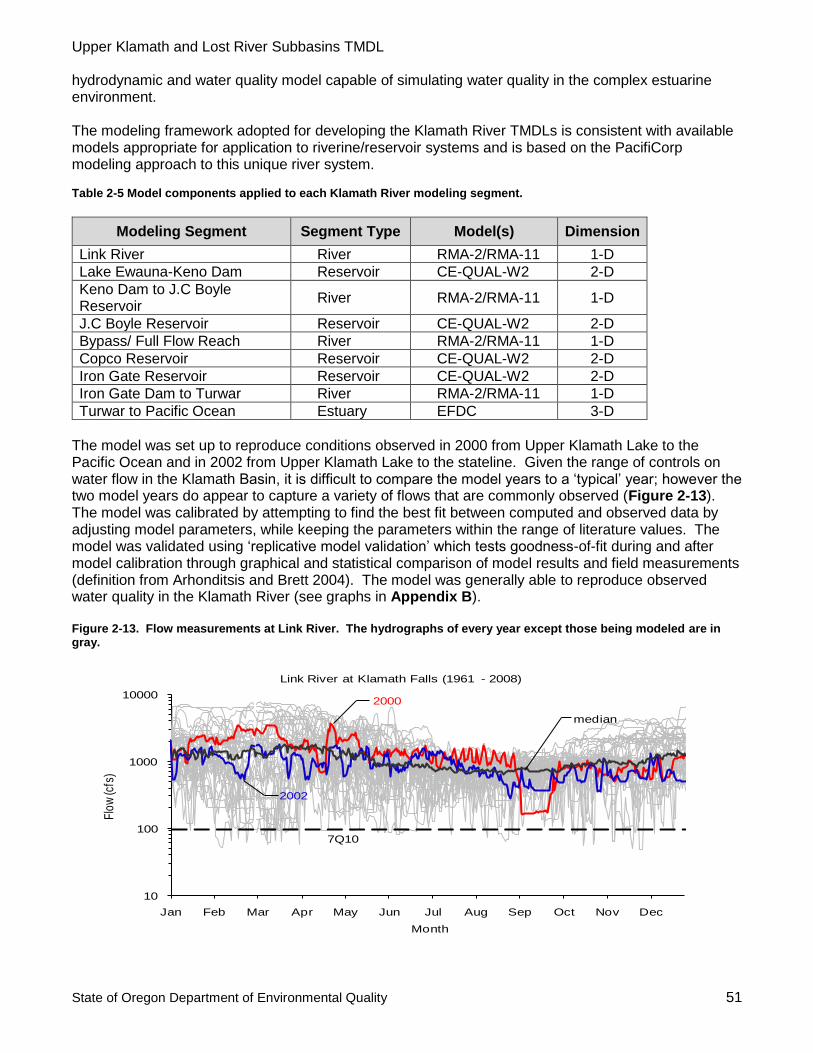
Upper Klamath and Lost River Subbasins TMDL
State of Oregon Department of Environmental Quality 51
hydrodynamic and water quality model capable of simulating water quality in the complex estuarine environment. The modeling framework adopted for developing the Klamath River TMDLs is consistent with available models appropriate for application to riverine/reservoir systems and is based on the PacifiCorp modeling approach to this unique river system. Table 2-5 Model components applied to each Klamath River modeling segment.
Modeling Segment Segment Type Model(s) Dimension
Link River River RMA-2/RMA-11 1-D
Lake Ewauna-Keno Dam Reservoir CE-QUAL-W2 2-D
Keno Dam to J.C Boyle Reservoir
River RMA-2/RMA-11 1-D
J.C Boyle Reservoir Reservoir CE-QUAL-W2 2-D
Bypass/ Full Flow Reach River RMA-2/RMA-11 1-D
Copco Reservoir Reservoir CE-QUAL-W2 2-D
Iron Gate Reservoir Reservoir CE-QUAL-W2 2-D
Iron Gate Dam to Turwar River RMA-2/RMA-11 1-D
Turwar to Pacific Ocean Estuary EFDC 3-D
The model was set up to reproduce conditions observed in 2000 from Upper Klamath Lake to the Pacific Ocean and in 2002 from Upper Klamath Lake to the stateline. Given the range of controls on water flow in the Klamath Basin, it is difficult to compare the model years to a ‘typical’ year; however the two model years do appear to capture a variety of flows that are commonly observed (Figure 2-13). The model was calibrated by attempting to find the best fit between computed and observed data by adjusting model parameters, while keeping the parameters within the range of literature values. The model was validated using ‘replicative model validation’ which tests goodness-of-fit during and after model calibration through graphical and statistical comparison of model results and field measurements (definition from Arhonditsis and Brett 2004). The model was generally able to reproduce observed water quality in the Klamath River (see graphs in Appendix B). Figure 2-13. Flow measurements at Link River. The hydrographs of every year except those being modeled are in gray.
10
100
1000
10000
Jan Feb Mar Apr May Jun Jul Aug Sep Oct Nov Dec
Flo
w (c
fs)
Month
Link River at Klamath Falls (1961 - 2008)
7Q10
2000
median
2002

Upper Klamath and Lost River Subbasins TMDL
State of Oregon Department of Environmental Quality 52
Like any dynamic water quality model, the Klamath River TMDL models were developed based on assumptions, and therefore have inherent limitations and uncertainty. Development and application of the Klamath River TMDL model have focused on key best practices identified in EPA’s March 2009 "Guidance on the Development, Evaluation, and Application of Environmental Models," including peer review of models; QA project planning, including data quality assessment; and model corroboration (qualitative and/or quantitative evaluation of a model’s accuracy and predictive capabilities). Indeed, the entire TMDL modeling process has been a case study for collaboration at both technical and policy levels, with participation of two federal agencies, two state agencies, and private consultants over a five year period. In addition to the key practices noted above, model sensitivity and uncertainty analysis have also been considered. The model sensitivity was performed as needed throughout model calibration and source assessment phases of model scenarios to better understand model predictions and limitations. Since it was not a formal process with defined output and metrics, it is not presented in this document. Discussion of uncertainty as it relates to the TMDL is discussed in the Margin of Safety Section (Section 2.8). This analytical tool went through multiple rounds of peer review. Staff with modeling expertise from DEQ, NCRWQCB and EPA worked as a team with Tetra Tech reviewing and advising on model development and application. In 2005, the calibrated model was also reviewed by Merlynn Bender of U.S. Bureau of Reclamation (USBR), Dr. Scott Wells of Portland State University, and Brown and Caldwell under contract with the City of Klamath Falls. The NCRWQCB also had their TMDL go through an external scientific peer review in 2009 (NCRWQCB 2010). Lastly, USBR contracted the USGS to review the Keno impoundment portion of the model (Rounds and Sullivan 2009 and Rounds and Sullivan 2010). DEQ, along with EPA and NCRWQCB, considered all peer review comments and made changes to the model and documentation when appropriate.
After testing the Klamath River model through hydrodynamic and water quality calibration and corroboration, a series of scenarios were developed to support TMDL determination. The scenarios followed a logical progression that enabled numeric and natural conditions criteria for relevant parameters to be fully evaluated and used as the driver for allocation of the loading capacity. They can be grouped into the following broad categories: existing conditions, natural conditions, and TMDL compliance. The following sections provide a brief description of the scenarios, associated assumptions, and results. Detailed description of modeled scenarios used to develop the allocations is provided in Appendix C.
2.6 Source Assessment
2.6.1 Pollutant Identification
There are a number of pollutants and other physical and biological processes that are causing the DO, chlorophyll a, pH, ammonia toxicity and temperature impairments. The major source categories and their relationships with pollutants and impairments are summarized in Figure 2-14.

Upper Klamath and Lost River Subbasins TMDL
State of Oregon Department of Environmental Quality 53
Figure 2-14. Conceptual model of water quality impairment sources and processes.
Algal Nutrient Dynamics: Nitrogen and Phosphorus Generally, growth and respiration of excessive attached algae (periphyton) in shallow rivers and floating algae (phytoplankton) in impoundments and deeper rivers lead to DO and pH criteria violations. Available nutrients, light, and temperature affect the growth of algae. Additionally, available suitable substrate will limit periphyton growth and total amount of phytoplankton will be limited by self shading. Nutrient loading, specifically phosphorus and nitrogen, encourages algal growth and subsequent decay, settling, and transport downstream. The preferred forms of nutrients for algal growth are dissolved inorganic phosphorus (measured as dissolved orthophosphate or soluble reactive phosphorus) and ammonia. Algae can also utilize nitrite and nitrate but the preferred form of nitrogen is ammonia. Nutrients cycle between the water column and sediment through nutrient spiraling as aquatic plants assimilate dissolved nutrients, particularly orthophosphate (Newbold 1981). If sufficient nutrients are available in either the sediment or the water column, aquatic plants will store nutrients in excess of plants’ needs. When plants die the tissue decays in the water, and the stored nutrients are either restored to the water or the detritus becomes incorporated into the river sediment. Once the nutrients are incorporated into the sediments they become part of the internal nutrient load. This cycle is known as nutrient spiraling. Without external influences, DO and pH would reach an equilibrium concentration as a function of barometric pressure and water temperature. However, the growth and respiration of attached and floating algae cause diel (daily cyclical) swings in DO and pH concentrations. As the algae grow, through photosynthesis, oxygen is released into the river, and as the algae respire at night, oxygen is consumed, causing a reduction in DO. Similarly, inorganic carbon (i.e., carbon dioxide) is consumed
Sediment Oxygen
Demand / CBOD
Point Sources
Municipal WWTPs
Industrial permitted dischargers
Temperature
pH
Ammonia Toxicity
Upper Klamath Lake
Upstream Boundary Condition
Algae
Organic matter
Nutrients
Temperature
Organic Matter
Nonpoint Sources
Klamath Straits Drain
Lost River Diversion Channel
Stormwater
Dams
Dissolved
Oxygen
Nutrients
Phytoplankton and
Cyano Bacterial Growth
NH3
Benthic Matter
Pollu
tant S
ourc
es
Environ
men
tal
Pro
cesses
Upper Klamath and Lost River Subbasins TMDL
State of Oregon Department of Environmental Quality 54
and released through photosynthesis and respiration. Through the carbonate balance, as inorganic carbon is consumed, the concentration of the hydrogen ion decreases which increases the pH. Alkalinity, which dampens the diel swing in pH, is naturally low in the Klamath River. Additionally, when algae die and decay, nitrogen is released into the system resulting in increased ammonia concentrations. Ammonia toxicity then increases as a function of pH and temperature. The pH of the water column influences the concentration of un-ionized ammonia (NH3) and ammonium ion (NH4
+). As pH increases, un-ionized ammonia concentrations increase and ammonium ion concentrations decrease resulting in increased ammonia toxicity. Elevated summer temperatures in the Klamath basin exacerbate toxic levels of ammonia because the concentration of un-ionized ammonia (NH3) in water increases with higher temperature as well as higher pH. Un-ionized ammonia is toxic to fish and other organisms. Algae consume nitrogen and phosphorus at a fixed ratio. Therefore, if one nutrient is in short supply, it will limit the growth of algae regardless of the concentration of the other nutrient. The model was used to investigate what factors are currently limiting algal growth. Biologically available forms of nitrogen and phosphorus are in such great supply that neither nutrient is currently limiting the growth of floating or attached algae in the Oregon stretch of the Klamath River (for example see Appendix B, Figures E-62 and H-41). In the impounded reaches of the Klamath River, light availability is limiting the growth of floating algae. While in the riverine portion, available substrate is limiting the growth of attached algae. However, under restored conditions, the model predicts that phosphorus will mostly limit algae growth with possible nitrogen limitation at some locations during limited periods. Instream Biochemical Oxygen Demand Biochemical oxygen demand (BOD) is a response to compounds that consume water column DO, including the decomposition of organic matter in the water column and sediment and the nitrification of ammonia. Oxidation of organic material is the most important type of biochemical oxygen demand (Tchobanoglous and Schroeder 1985). In the most general sense, carbon in organic material is oxidized to its lowest energy state, CO2, through the metabolic action of microorganisims (principally bacteria). This is termed carbonaceous-BOD (CBOD). When nitrogen in the form of ammonia is introduced to natural waters, the ammonia may “consume” dissolved oxygen as nitrifying bacteria convert the ammonia into nitrite and nitrate. This process is called nitrification. The consumption of oxygen during this process is called nitrogenous biochemical oxygen demand (NBOD). To what extent this process occurs, and how much oxygen is consumed, depends on several factors, including residence time, water temperature, ammonia concentration in the water, and the presence of nitrifying bacteria. It is because of this somewhat complex relationship that computer models are used to determine the amount of ammonia that a waterbody can assimilate and still meet the DO standards. The constituents tracked in the water quality model differ from the common water quality measurements. For example, the water quality model tracks the concentration of organic matter while point sources typically collect BOD concentrations. The two concentrations are related because the BOD is typically caused by organic matter. The following equations were used to calculate the 5-day BOD (BOD5) allocations from organic matter and ammonia concentrations which were tracked in the water quality model. The actual processes are more complex and are accounted for in the water quality model. The 5-day BOD, however, is a common measurement and therefore a more useful target. The ratio of BOD5 to BODu for point source effluent was based on literature values (Chapra 1997, page 357) while the ratio for other sources is based on literature values and model calibration (Appendix B).

Upper Klamath and Lost River Subbasins TMDL
State of Oregon Department of Environmental Quality 55
𝐵𝑂𝐷5 (𝑚𝑔 𝐷𝑂
𝐿) = 𝑂𝑀_𝐵𝑂𝐷5 (
𝑚𝑔 𝐷𝑂
𝐿) + 𝑁𝐵𝑂𝐷5 (
𝑚𝑔 𝐷𝑂
𝐿)
𝑁𝐵𝑂𝐷5 (𝑚𝑔 𝐷𝑂
𝐿) = 𝑁𝐵𝑂𝐷𝑢 (
𝑚𝑔 𝐷𝑂
𝐿) × (1 − 𝑒−0.1 (𝑑𝑎𝑦𝑠−1)×5 (𝑑𝑎𝑦𝑠)) = 𝑁𝐵𝑂𝐷𝑢 (
𝑚𝑔 𝐷𝑂
𝐿) × 0.39
𝑁𝐵𝑂𝐷𝑢 (𝑚𝑔 𝐷𝑂
𝐿) = 𝑁𝐻4 𝑎𝑠 𝑁 (
𝑚𝑔
𝐿) × 4.57
𝑔𝑂
𝑔𝑁
For point source effluent:
𝑂𝑀_𝐵𝑂𝐷5 (𝑚𝑔 𝐷𝑂
𝐿) = 𝑂𝑀_𝐵𝑂𝐷𝑢 (
𝑚𝑔 𝐷𝑂
𝐿) (1 − 𝑒−0.07 (𝑑𝑎𝑦𝑠−1)×5 (𝑑𝑎𝑦𝑠)) = 𝑂𝑀_𝐵𝑂𝐷𝑢 (
𝑚𝑔 𝐷𝑂
𝐿) × 0.30
For nonpoint sources:
𝑂𝑀_𝐵𝑂𝐷5 (𝑚𝑔 𝐷𝑂
𝐿) = 𝑂𝑀_𝐵𝑂𝐷𝑢 (
𝑚𝑔 𝐷𝑂
𝐿) (1 − 𝑒−0.20 (𝑑𝑎𝑦𝑠−1)×5 (𝑑𝑎𝑦𝑠)) = 𝑂𝑀_𝐵𝑂𝐷𝑢 (
𝑚𝑔 𝐷𝑂
𝐿) × 0.63
𝑂𝑀_𝐵𝑂𝐷𝑢 (𝑚𝑔 𝐷𝑂
𝐿) = 𝑂𝑀 (
𝑚𝑔
𝐿) × 1.4
𝑔𝑂
𝑔𝑂𝑀
𝐶𝐵𝑂𝐷𝑢 (𝑚𝑔 𝐷𝑂
𝐿) = 𝑂𝑀 (
𝑚𝑔
𝐿) × 0.45
𝑔𝐶
𝑔𝑂𝑀× 2.67
𝑔𝑂
𝑔𝐶
Where: OM = organic matter including dissolved and particulate forms and algae, C = carbon, O = oxygen, N = nitrogen, DO = dissolved oxygen, u denotes an ultimate time period when no further oxygen reduction occurs, and 5 denotes 5-day time period. The coefficient of 1.4 gO gOM-1 is from Cole and Wells 2003. The equations above ignore the BOD of ammonia derived from the decay of organic nitrogen because of the time lag introduced by the two decay cycles. The equations also combine all forms of organic matter including particulate or dissolved, labile and refractory, and algal. The combination of labile and refractory organic matter is appropriate in this application because their decay rates are the same in the model. Including algae is appropriate because of the observed rapid decrease in algae concentration in Keno impoundment.
2.6.2 Upstream Condition - Upper Klamath Lake
Water from Upper Klamath Lake flows into Keno impoundment via the 1 mile long Link River and is a significant source of organic matter, nutrients and thermal loads (NRC 2004, PacifiCorp 2006). Upper Klamath Lake is currently a hypereutrophic lake with a history of altered hydrology (DEQ 2002) and a subsequent dominance by a single species of cyanobacteria, Aphanizomenon flos-aquae (AFA). AFA blooms in Upper Klamath Lake reach theoretical maximum abundance. Yearly algal blooms result in high algal biomass and violations of water quality standards for pH, dissolved oxygen and ammonia toxicity which led to 303(d) listings and subsequent TMDLs developed in 2002 (DEQ 2002). Water discharging from Upper Klamath Lake through Link River dam into the Link River contains high levels of organic matter from living and dead algae and associated nutrients. Average residence time for water passing from Link River to Keno dam is about 8 days during summer months. A conceptual model of water quality impairment sources and processes is shown in Figure 2-15. The primary source of water quality impairment in Keno impoundment is the upstream water quality from Upper Klamath Lake.

Upper Klamath and Lost River Subbasins TMDL
State of Oregon Department of Environmental Quality 56
Sullivan et al. (2009) reported a mean 5-day BOD of 12.6 mg/L and a 30-day BOD of 28.6 mg/L in Link River. In Keno impoundment, most forms of BOD were significantly and positively correlated with particulate carbon, suggesting an important link between algae and BOD. They conclude that a reduction of the load of particulate algal material from the Upper Klamath Lake could limit the magnitude of low DO periods in the Keno impoundment. The organic load from Upper Klamath Lake causes significant BOD load with subsequent settling of particulate matter to sediments in Keno impoundment contributing to internal nutrient loads and increased sediment oxygen demand (discussed below as internal sources). Warm water leaving Upper Klamath Lake is presumed to be natural due to the natural wide and shallow morphology. The Upper Klamath Lake TMDL indentified phosphorus as the pollutant that controls algal growth and subsequent pH standard exceedances. The Upper Klamath Lake TMDL recognized the large amount of natural phosphorus loading and that prior to 1900s the lake was likely eutrophic (enriched with nutrients). Since that time, though, the lake has become hyper-eutrophic due to increased phosphorus loading from anthropogenic sources and draining of surrounding wetlands. The Upper Klamath Lake TMDL calls for a 40% reduction in phosphorus loading to meet water quality standards. The model used to evaluate the Upper Klamath Lake (Walker 2001), predicts that algae and phosphorus concentrations will be greatly reduced in most years once allocations are met (Figure 2-15). However, 2 out of the 8 years analyzed are predicted to have massive algae blooms under TMDL loading conditions. Figure 2-15. Upper Klamath Lake algae concentrations, measured concentrations and predicted TMDL conditions for the same period.
DEQ examined of phosphorus data collected by the Klamath Tribes in Upper Klamath Lake from 1990 to 2008 (data from personal communication with Jacob Kann of Aquatic Ecosystem, 2009) (Figure 2-16). Statistical analysis did not reveal a significant trend in lake-wide mean phosphorus concentrations. The trend analysis used the nonparametric Seasonal Kendall method to test for montonic trends in the water quality data using the program WQHydro (data segregated into 4 seasons, slope = 0.52, 2 sided P = 0.53) (Aroner 2009). While there has been significant restoration around Upper Klamath Lake, many of these projects have occurred recently and their impact has not likely been expressed on lake phosphorus concentrations.
0
50
100
150
200
250
300
350
400
1991 1992 1993 1994 1995 1996 1997 1998
Ch
loro
ph
yll
a (µ
g/L)
Date
Measured Predicted TMDL

Upper Klamath and Lost River Subbasins TMDL
State of Oregon Department of Environmental Quality 57
Figure 2-16. Time series of mean total phosphorus concentrations from Upper Klamath Lake.
Upper Klamath Lake is not considered a source to thermal impairment because the temperature of water discharged from Upper Klamath Lake likely follow the natural thermal regime. The naturally wide and shallow bathymetry and long residence time of Upper Klamath Lake would have allowed water temperature to reach equilibrium with heat fluxes. The operation of Link River dam at the outlet of Upper Klamath Lake to control lake height is discussed below in Section 2.6.4.
2.6.3 Point Sources
DEQ maintains a database (http://www.deq.state.or.us/wq/sisdata/sisdata.asp) for point source information. There are four individually permitted point sources in the Upper Klamath Subbasin, (Table 2-6). Two of these sources discharge municipal wastewater and two industrial wastewater (see Chapter 1 for discussion). City of Klamath Falls discharged approximately 3 million gallons a day (MGD) and South Suburban discharged 2 MGD of municipal, treated wastewater during the summer of 2000. Other point sources include Collins Forest Products discharging 0.9 MGD of treated wastewater and Columbia Forest Products discharges intermittently with greater frequency during the wet season (average discharge 3700 gallons per day, 13 times per year based on 2000 – 2007 data). Figure 2-17 indicates the location of these four point source discharges. The four point sources contribute less than 1.5% of the organic matter and about 5% of the total phosphorus loading from all sources to Keno impoundment (calculated from model inputs from year 2000, see Appendix B derivation). Instream log handling and storage by Columbia Forest Products can lead to increased organic matter loading to the sediment and potentially greater rates of sediment oxygen demand. Bark, wood chips and sawdust have been observed in the Klamath River sediments in the vicinity of Columbia Forest Products (see Appendix D). Table 2-6. NPDES Dischargers in the Upper Klamath Subbasin.
Permit Number
Legal Name Category Permit Type River Mile
100701 City of Klamath Falls Domestic NPDES-DOM-C1b
251
100700 South Suburban Sanitary District Domestic NPDES-DOM-C1b
250
101086 Collins Products LLC Industrial NPDES-IW-B20 246.5
100016 Columbia Forest Products Industrial NPDES-IW-B20 248
0
100
200
300
400
500
1990 1995 2000 2005
Tota
l Ph
osp
ho
rus
(mg/
L)

Upper Klamath and Lost River Subbasins TMDL
State of Oregon Department of Environmental Quality 58
Figure 2-17. Locations of NPDES Permitted Discharges, Keno impoundment.
Other Point Sources At the time of writing, there are 34 facilities that discharge to the Klamath River or tributaries with general NPDES permits. All of these permits are for stormwater: 23 for construction sites and 11 for industrial facilities. Given the type of impairments (pH, ammonia toxicity, DO and temperature), the relatively small size of the discharges compared to individual NPDES permits and the controls required through the existing permits, these facilities are not likely to cause significant water quality impairment. Additionally, the general permits are for stormwater and the critical water quality condition occurs during the summer, dry period. The water quality model was used to confirm that the current load of TMDL-related pollutants in the Klamath River can be attributed to the individual NPDES permitted sources and nonpoint sources. No major, uncategorized source of pollutants was indicated by this modeling exercise. Therefore, it is unlikely that sources with general permits are causing significant pollutant loading relative to other source categories.
2.6.4 USBR’s Klamath Project: Lost River Diversion Channel and Klamath Straits Drain
The Lost River Diversion Channel (LRDC) and Klamath Straits Drain (KSD) are part of United States Bureau of Reclamation’s (USBR’s) Klamath Project and discharge into the Klamath River in the impounded reach upstream of Keno Dam (Figure 2-1). These facilities, along with water withdrawal canals, hydrologically connect the Klamath River to the Lost River system. For this document the “Lost River system” refers to the hydrologically connected natural and constructed portions for the Lost River, Tule Lake, Lower Klamath Lake, Klamath Straits Drain and other associated canals and drains. DEQ is also developing a TMDL to address water quality impairments within the Lost River system in Oregon (Chapter 3, this document) and EPA has promulgated a TMDL for the Lost River system in California (U.S. EPA, 2008). The Klamath River TMDL investigates the impact of discharge from LRDC and KSD to the Klamath River while the Lost River system TMDL investigates water quality impacts the of Klamath Project on the Lost River system. USBR’s Klamath Project supplies water to approximately 240,000 acres of cropland (38% of it in California and 62% of it in Oregon) (USBR 2009a). Water is supplied from Upper Klamath Lake and

Upper Klamath and Lost River Subbasins TMDL
State of Oregon Department of Environmental Quality 59
Klamath River along with reservoirs and tributaries within the Lost River system. Included in the project are reclaimed lands of Tule Lake and Lower Klamath Lake and facilities related to flood control. In terms of its relationship with the Klamath River, the Klamath Project withdraws water from Upper Klamath Lake via A-canal and from Keno impoundment via Ady Canal and North Canal. The LRDC can transfer water to or from the Klamath River, and pump stations at the western end of KSD transfer water to the Klamath River. Except during high water, there was no surface water connection between the Klamath River and the ancestral Lost River drainage prior to construction of the Klamath Project (USBR 2005). A number of studies have concluded that the USBR’s Klamath Project is a net sink of nutrients in relation to the Klamath River (Rykbost and Charlton 2001, Danosky and Kaffka 2002 and USBR 2009b). DEQ extended the USBR (2009b) analysis to include an entire year, 2002, using DEQ data to supplement the USBR dataset. Daily flow estimates were obtained from USBR’s website. For this analysis, sources of nutrients to the Klamath River are Klamath Strait Drain and Lost River Diversion Channel and extractions from the Klamath River are A-canal, Lost River Diversion Channel, North Canal and Ady Canal. When concentration data were not available for a specific canal, a nearby river concentration from which the canal draws water was used as an estimate as follows (site: surrogate):
LRDC discharge to Klamath River: Lost River at Highway 39 LRDC discharge to Lost River: Link River and Klamath River at USBR site KRS5 A-canal: Link River and Upper Klamath Lake at Link Dam Ady canal: Klamath River at Hwy 66 and Klamath River USBR site KRS11 North Canal: Klamath River at Hwy 66 and Klamath River at Miller Island
Even when examining an entire year for 2002, the Klamath Project appears to be a sink of nutrients in relation to the Klamath River (Figure 2-18). Despite the higher phosphorus concentrations returning to the Klamath River than leaving it, the loading is strongly influenced by the flow and only 30% of the flow that enters the Lost River system from the Klamath is returned to the Klamath River. In 2002, total phosphorus removed from the Klamath River was 2.8 x 10⁵ pounds (130 metric tons) while 1.4 x 10⁵ pounds (64 metric tons) was returned, equivalent to a 50% decrease in load. Total nitrogen removed from the Klamath River was 2.8 x 10⁶ pounds (1300 metric tons) while 9.6 x 10⁵ pounds (440 metric tons) was returned, equivalent to a 66% decrease in load.

Upper Klamath and Lost River Subbasins TMDL
State of Oregon Department of Environmental Quality 60
Figure 2-18. Flow, concentration and cumulative loading analysis of USBR’s Klamath Project. Total phosphorus (TP) concentrations weighted based on relative flow rates.
Even though USBR’s Klamath Project appears to be a net sink of nutrients, it also appears to have detrimental impacts to the water quality of Klamath River. Based on mean August 2002 flows, approximately 1255 cfs was diverted out of the Upper Klamath Lake and the Klamath River, leaving approximately 182 cfs in Keno impoundment just upstream of Klamath Strait Drain (Figure 2-19). The sum of the gages inflows and outflows did not equal the observed downstream flow, so a ‘flow balance’ source was included in the graph. The ‘flow balance’ is 4 percent of the measured flows and might represent uncertainty in flow measurements (typically considered about 10 percent), ungaged withdrawals and/or evaporation. During this time period, Klamath Straits Drain discharge contributes approximately half the flow of the Klamath River at Keno Dam. Therefore, its higher concentration of nutrients relative to the Klamath River, increases the nutrient concentration of the reach (Figure 2-20).
0
50
100
150
200
250
300
J F M A M J J A S O N D
Cum
mul
ativ
e T
P lo
adin
g (t
hous
and
of lb
s)
2002
0.00
0.50
1.00
TP (m
g/L)
0
500
1000
1500
2000
Flo
w (
cfs)
From Klamath River / UKL to Klamath Project
From Klamath Project to Klamath River

Upper Klamath and Lost River Subbasins TMDL
State of Oregon Department of Environmental Quality 61
Figure 2-19. Schematic of an example flow balance in cubic feet per second for Keno impoundment (August 2002).
Flows are represented by the thickness of each box.
Figure 2-20. Klamath River (Keno impoundment) model results from just downstream of Klamath Straits Drain discharge. The “With KSD/LRDC” results are from the 2002 calibration model. The “Without …” results are from a scenario
exactly like the 2002 calibration except the constituent concentrations of parameters for Lost River Diversion and Klamath Straits Drain were set to the same constituent concentrations as Link River.
USBR also owns Link River Dam which regulates flow from Upper Klamath Lake into Link River, at the head of the Klamath River. The impact of the operation of this dam was not quantitatively assessed as part of this TMDL. USBR was named as a “designated management agency” in the Upper Klamath Lake TMDL with responsibilities related to the impact of lake levels on water quality (DEQ 2002). The dam however is operated by PacifiCorp which must provide water both for irrigation and power generation, as well as provide flood control and habitat protection for fish. If the water that is currently diverted into the Lost River system was released into the Klamath River instead, there would be greater assimilative capacity in the Klamath River for discharges with nutrient concentrations greater than Upper Klamath Lake outlet.
Klamath River
511 446 266 182Lin
k R
ive
r
Do
wn
stre
am o
f K
en
o D
am
595 380
0
0.05
0.1
0.15
0.2
0.25
0.3
0.35
J F M A M J J A S O N D
Ort
ho
ph
osp
hat
e (
mg
P /
L)
2002
With KSD/LRDC discharges
Without KSD/LRDC discharges
Upper Klamath and Lost River Subbasins TMDL
State of Oregon Department of Environmental Quality 62
2.6.5 PacifiCorp’s Klamath River Hydroelectric Projects
The reservoirs and conveyances associated with, owned by and operated by PacifiCorp, differ from other sources. The storage of water in reservoirs and the removal of water from the river for power generation can degrade or improve water quality depending on the parameter, the time of year and the location. Regardless of any improvement, it is the responsibility of PacifiCorp to ensure that only minor degradation of water quality occurs at other times and places. For the Oregon Klamath River TMDL, PacifiCorp’s Klamath River Hydroelectric Project developments include East Side and West Side on Link River, Keno and JC Boyle. These developments include dams, reservoirs, water conveyances and powerhouses. Much of the information in this section comes from documents produced by PacifiCorp for the relicensing of the project which provide a much more detailed description of the facilities and their impact on water resources and water quality (PacifiCorp 2004a and 2004b). East Side and West Side Development The East Side and West Side powerhouses receive water from diversions at the Link River Dam which is owned by USBR (see Section 2.6.4) (PacifiCorp 2004a). The lengths of these diversions are 0.6 miles and 1.1 miles, respectively. PacifiCorp is proposing the decommissioning of this development. Therefore, these facilities are not considered further in the source assessment and do not receive an allocation. Keno development The Keno dam is owned by PacifiCorp and operated by PacifiCorp under a contract with USBR. There is no power generation associated with this dam. PacifiCorp operates the dam to maintain reservoir elevations to meet the diversion needs of USBR and others while providing enough water to meet downstream flow requirements. The reservoir behind Keno Dam stretches for 22.5 miles with a maximum depth of 19.5 feet and an average width of 910 feet. At an approximate average flow of 1,500 cfs, retention time in Keno impoundment is 6 days while at 710 cfs, retention time is 13 days. Keno impoundment does not appear to thermally stratify. A natural, bedrock reef upstream of the current Keno Dam used to constrict flow and maintain water surface elevation in the present day Keno impoundment. The reef was notched when Keno Dam was constructed in order to manage high flows and reduce the risk of flooding. J.C. Boyle development The J.C. Boyle development is located 5.6 miles downstream of Keno Dam and consists of a dam, reservoir, water conveyance system and powerhouse. The water conveyance system transfers water from the reservoir at river mile 223 to the powerhouse at river mile 219. The reservoir is 3.6 miles long with a maximum depth of 42 feet. The retention time at approximately average flows (1,500 cfs) is 1.2 days while the retention at 710 cfs is 2.5 days. A minimum flow of 100 cfs is required below the dam. A series of springs discharges into the river between the withdrawal and return (see Section 2.6.11 for discussion). To meet power demands, discharge from the powerhouse varies throughout the day when river flows are less than 3,000 cfs. The typical maximum powerhouse flow is 2500 cfs. Therefore, during the low flow period of the year, daily flows below the powerhouse can range from 500 to 3000 cfs. The quantitative source assessment for Keno and JC Boyle developments is also the analysis used to determine load allocations, so it is described in Sections 2.7.3.2 and 2.7.4.3. Briefly, the operation of Keno Dam appears to decrease dissolved oxygen by 0.2 mg/L in Keno impoundment and increase temperature by 0.2 °C at the outfall. The impact of JC Boyle development is more complex because of the removal and return of water from the river. Between June and September, JC Boyle appears to cause a 1.0 °C increase in temperature at the state line. It is common for temperature impacts from reservoirs to be greatest downstream of the outfall because of the decreased daily temperature range and consequent increase to daily minimum temperatures (see Khangaonkar and Yang 2008 and DEQ

Upper Klamath and Lost River Subbasins TMDL
State of Oregon Department of Environmental Quality 63
2006b for discussion). Within the reservoir, average DO concentrations are depressed by 0.4 mg/L when compared to predicted conditions without a dam, under a restored loading scenario (see Section 2.7.3.2 for further discussion).
2.6.6 Agriculture
Lands used for agriculture can contribute nutrients in a variety of ways. Soil erosion can carry nutrients with it, particularly phosphorus. Animal manure is another potential source of nutrients and particulate organic matter. Particulate organic matter settles to the stream bed causing an increase in sediment oxygen demand (SOD) on the receiving water body. Finally, fertilizers run off and contribute nutrients to the stream. Riparian buffers, where they exist, help to intercept and retain both sediments and nutrients.
2.6.7 Irrigation Districts
Irrigation districts that discharge to the Lost River system, including Klamath Strait Drain, are considered in the Lost River TMDL (see Chapter 3, this document) and their impacts on water quality on the Klamath River are integrated through Klamath Strait Drain and Lost River Diversion Channel (see Section 2.6.4). Plevna and Pioneer irrigation districts are relatively small irrigation districts located to the west of Klamath River and have the potential to discharge into the Klamath River through ditches not routed through Klamath Strait Drain or Lost River Diversion Channel. Given their size and complexity of operations, a quantitative source assessment was not completed for these two irrigation districts. However, given similar operations in the area, there is the potential that these irrigation districts may contribute to water quality impairments due to elevated concentrations of nutrients and temperatures.
2.6.8 Forestry
Forests can contribute nutrients in several ways. First, sediment associated with timber harvesting and related road-building can carry nutrients, especially phosphorus, into streams. Second, Northwest forests are typically fertilized with urea nitrogen, and this may run off into streams under certain conditions. Riparian buffers help to intercept and retain both sediment and nutrients. There are a number of natural processes that add nutrients to the river: leaching from the soil, degradation of plant material, and fish returning to spawn from the ocean.
2.6.9 Urban / residential
Urbanized land areas, with high percentages of impervious surfaces and extensive drainage systems, have surface runoff even during relatively small rainfall events. Runoff from landscape irrigation can also carry high levels of nutrients from fertilizers. In other parts of the state, inorganic phosphorus concentrations in urban dominated creeks, have been measured at approximately 10 times greater than estimated background conditions (DEQ 2006b).
2.6.10 Other Possible Upland Sources
There may be upland sources other than runoff and other permitted discharges that are contributing nutrient loads. Possible sources include faulty septic and sewer systems, and illegal or illicit discharges. While these sources are not readily quantifiable, the nutrient loads are expected to be relatively small due to the control programs that were established previously. It is important that these programs continue to be implemented and are updated based on new data or other information.
2.6.11 Natural Sources
There are a number of natural processes that add nutrients to the river: leaching from the soil, degradation of plant material, and fish returning to spawn from the ocean. In the Klamath Basin, springs can contribute significant amounts of phosphorus because of the volcanic origins of the rock and soil. Specifically, there is a spring complex which contributes approximately 225 cfs (6.36 cms) just upstream of the JC Boyle powerhouse. Based on sampling from other springs in the basin and

Upper Klamath and Lost River Subbasins TMDL
State of Oregon Department of Environmental Quality 64
examining the nutrient mass balance in the river, we estimated an inorganic phosphorus concentration of 0.07 mg / L and nitrate-nitrite concentration of 0.25 mgN/L. The springs’ phosphorus concentration is similar to the average total phosphorus concentration measurements from springs in the Upper Klamath Lake drainage of 0.077 mg/L and within the standard deviation of 0.022 mg/L (DEQ 2002). The springs discharge at approximately 12 °C.
2.6.12 Internal Sources and Sinks
External loading to the system can transform within the system and lead to internal sources which cause or contribute to water quality impairment. Since internal sources are an expression of external sources, they are controlled by reducing the external loading to the system. Algae Mortality and other decomposition of organic matter A significant internal source of oxygen demand in Keno impoundment is from the death of algae, discussed above in Section 2.6.1.1. Decomposing algae also result in an increase in the nitrogen and phosphorus compounds that are available to fuel algal growth. Nitrogen and phosphorus are elements of the total particulate organic matter (e.g. living and dead algae). In Keno impoundment, total nitrogen stays relatively steady, while ammonia concentrations increase in the downstream direction at approximately the rate that particulate nitrogen is decreasing (Figure 2-21). Similarly, orthophosphate concentrations increase in the downstream direction at approximately the rate that particulate phosphorus decreases. For this graph, particulate P was estimated using the ratio between dissolved and particulate organic carbon as an approximation of the ratio between dissolved and particulate organic phosphorus and a steady ratio between particulate carbon and particulate phosphorus. Also, the algae concentrations decrease between Link River and Miller Island as the ammonia concentration at Miller Island increases (Figure 2-22). These trends suggest that the ammonia is being generated through the decomposition of algae rather than an outside source of ammonia (i.e. sediment, point source discharge or tributary). Figure 2-21. Nitrogen (N) and phosphorus (P) compounds in Keno impoundment, upstream is to the left, at the mouth of Link River. Data from Sullivan et al. (2009), median 7/15/2008 to 9/15/2008 concentrations.
0
0.5
1
1.5
2
2.5
3
3.5
234239244249254
Co
nce
ntr
atio
n, i
n m
g/L
as N
River Mile
totalN
particulate N
ammonia
nitrate+nitrite0
0.05
0.1
0.15
0.2
0.25
0.3
0.35
234239244249254
Co
nce
ntr
atio
n, i
n m
g/L
as P
River Mile
total P
estimatedparticulate P
orthophosphate

Upper Klamath and Lost River Subbasins TMDL
State of Oregon Department of Environmental Quality 65
Figure 2-22. Time series of chlorophyll a and ammonia concentrations. Data from Sullivan et al. (2009).
At times, there is a die-off of algae between Link River and Miller Island which could not be linked to nutrient, light or temperature limitations or to the settling particulate organic matter (Tetra Tech 2009, included as Appendix B). The decreasing algae concentrations can also be observed in Figure 2-7 (note the log scale). Tetra Tech (2009) proposed that this die-off is caused by simultaneous hypoxic/anoxic DO concentrations which disrupt the algae’s ability to respire and updated the water quality model code to reflect this hypothesis. The model’s ability to predict algae concentrations was greatly improved after the implementation of this new routine. Sediment Oxygen Demand When solids that contain organic matter, such as dead algae, settle to the bottom of a river they may decompose anaerobically (with no oxygen present), or aerobically (in the presence of oxygen), depending on conditions. The oxygen consumed in aerobic decomposition of these sediments is called sediment oxygen demand (SOD) and represents a loss of dissolved oxygen for a stream. SOD is an important cause of decreased oxygen levels in water, particularly in impoundments where water velocities are low. The SOD can continue to reduce DO for a long period after the pollution discharge ceases (e.g., organic-containing sediment deposited as a result of rain-driven runoff may remain a problem long after the rain event has passed). In contrast, carbonaceous biochemical oxygen demand (CBOD) and nitrification processes are typically short-term. SOD includes several separate processes (Chapra 1997): 1) biological respiration and oxygen consumption of all living organisms residing in the upper benthic zone; 2) chemical oxidation of reduced substances in the sediments; and 3) biochemical oxidation of methane and ammonia that evolve from the lower anaerobic sediments. Modeling of SOD processes is complex and requires calibration with field data including insitu measurements of gas and nutrient fluxes from sediments. SOD rates were measured in Keno impoundment by Eilers and Raymond (2005, included as Appendix D this document) and Doyle and Lynch (2006). Eilers and Raymond measured levels of SOD ranging from 2.7 to 3.6 g/m2/d (grams of oxygen per square meter per day). Doyle and Lynch measured SOD levels ranging from 0.3 to 2.9 g/m2/d. SOD measurements were made at one site in Lake Ewauna and three sites in the Klamath River above Keno Dam. Individual measurements of SOD20 rates (temperature corrected to 20 degrees Celsius) ranged from 0.3 to 2.9 g O2/m2/day, with a median value of 1.8 g O2/m2/day (n=22). These values are consistent with reported levels (Chapra 1997) and similar to SOD rates measured in Upper Klamath Lake.
0
0.5
1
1.5
2
4/10/2008 5/30/2008 7/19/2008 9/7/2008 10/27/2008
Am
mo
nia
as
N (
mg/
L)
0
200
400
600
Ch
loro
ph
yll
a (µ
g/L)
Link River, near Klamath Falls, OR
Klamath River at Miller Island Boat Ramp, OR

Upper Klamath and Lost River Subbasins TMDL
State of Oregon Department of Environmental Quality 66
2.6.13 Keno impoundment Source Evaluation
The model was used to evaluate the impact on dissolved oxygen by 4 groups of sources: point sources, USBR’s Klamath Project sources, sediment oxygen demand, and Upper Klamath Lake (Error! Reference source not found.23). The point sources include City of Klamath Falls WWTP, South Suburban WWTP, Columbia Forest Products and Collins Forest Products. The Klamath Project sources include the Lost River Diversion Channel and Klamath Strait Drain. Current boundary conditions from the calibration year 2000 were used as a base. Due to the sensitive water balance necessary to maintain water levels within the model, the source inflow nutrient concentrations were altered rather than flow. For each of the scenarios presented in Figure 2-23, the concentrations of individual sources were reduced to estimate “background” nutrient concentrations while remaining sources were left at current concentrations. The purpose of this source analysis was not to evaluate a natural condition but rather to evaluate the relative impact of each source group. Therefore, the “background” concentrations should not be interpreted as a natural condition (which is discussed in detail later in this document). The evaluation shows that the complete remediation of any one source will not result in compliance with the numeric DO criteria. The most influential source is Upper Klamath Lake causing a sustained dissolved oxygen deficit of up to 5.1 mg/L during the summer. In 2000, USBR’s operations of Lost River Diversion channel was unique compared to other years, in that flows were diverted into the Klamath River during September (Jon Hicks, USBR, personal communication). The Lost River Diversion channel also appears to have been also discharging during September 2008 (Sullivan et al. 2009, reports samples collected in September and that sampling only occurred when discharging to the Klamath River). This diversion of water contributed significant nutrient loads during a critical time and appears to have caused a dissolved oxygen deficit of up to 3.9 mg/L. Sediment oxygen demand’s influence is less than the oxygen demand from other sources and more constant throughout the year, causing an average 0.7 mg/L dissolved oxygen deficit. The combined impact of point sources under current conditions is minimal when compared to the other source categories. Figure 2-23. The dissolved oxygen impact of sources on the 30-day moving average of DO concentrations at Miller Island, Keno impoundment reach.
2.6.14 Current Loading Analysis
A loading analysis for the point and non point sources was developed, where flow and water quality data were available. Estimates of ungaged agricultural drains and subsurface (hyporheic flows and springs in bypass reach) were estimated by accounting for the other external sources (by difference). Figure 2-24, Figure 2-25, and Figure 2-26 provide estimates of total phosphorus, total nitrogen and CBOD loading from Upper Klamath Lake downstream to the Stateline.
-6
-5
-4
-3
-2
-1
0
J F M A M J J A S O N D
Dis
solv
ed
Oxy
gen
de
fici
t (m
g/L)
Date
Lost River Diversion
Point Sources
Sediment Oxygen Demand
Upper Klamath Lake
All sources

Upper Klamath and Lost River Subbasins TMDL
State of Oregon Department of Environmental Quality 67
Figure 2-24. Annual total phosphorus loading Link River to Stateline existing condition (2000).

Upper Klamath and Lost River Subbasins TMDL
State of Oregon Department of Environmental Quality 68
Figure 2-25. Annual total nitrogen loading Link River to Stateline existing condition (2000).

Upper Klamath and Lost River Subbasins TMDL
State of Oregon Department of Environmental Quality 69
Figure 2-26. Annual CBOD loading Link River to Stateline existing condition (2000).

Upper Klamath and Lost River Subbasins TMDL
State of Oregon Department of Environmental Quality 70
2.7 Water Quality Standard Attainment Analysis The results of model scenarios demonstrate that dissolved oxygen numeric criteria cannot be achieved under the estimated natural condition. Oregon’s water quality standards stipulate that, in this case, anthropogenic activities cannot decrease dissolved oxygen by more than 0.20 mg/L. The natural baseline condition, loading capacity, waste load and load allocations were determined using the water quality model. NCRWQCB (2010) indicates the TMDL developed to achieve Oregon’s water quality standards will achieve the applicable California objectives at the stateline.
2.7.1 Natural Conditions Baseline
In order to fully evaluate applicable water quality standards, it was necessary to simulate a natural conditions baseline throughout the Klamath River. Simulation of natural conditions baseline was necessary because modeling results indicated that even with anthropogenic sources removed, numeric dissolved oxygen water quality standards were not achieved. Therefore, in accordance with OAR- 340-041-0004(9)(a)(D)(iii), there will be no measurable reduction in dissolved oxygen defined as no more than 0.1 mg/L dissolved oxygen reduction for a single source and 0.2 mg/L for all anthropogenic activities. The natural conditions baseline scenario simulated the Klamath River from Upper Klamath Lake to the Pacific Ocean in the absence of all dams, except for Link Dam, but represented the presence of the historic Keno Reef (a natural basalt outcrop that was removed prior to construction of the Keno dam). Keno Reef was represented using data provided by the Bureau of Reclamation with an elevation of 1244.5 meters (4083 feet), whereas normal full pool elevation is 1245 meters (4085 feet) (PacifiCorp 2004a). The Klamath River model for this scenario used a different configuration than that for the current conditions. The Keno impoundment modeling segment was simulated in CE-QUAL-W2 as an impounded segment, and the rest of the river system to just upstream of the estuary was simulated using the riverine RMA model.
The boundary condition representing Upper Klamath Lake under natural conditions was derived with the following criteria: seasonally variable predictions for a calendar year, uses best available tools, consistent with upstream TMDL and uses conservative assumptions. We chose a calendar year as opposed to a water year to be consistent with the calibrated model. The best available tool for deriving water quality parameters under a restored condition is the Upper Klamath Lake TMDL model (DEQ 2002, Walker 2001, also see Section 2.6.2 for the source assessment, Section 2.8.1 for discussion of uncertainty and Chapter 1 for discussion of policy). To our knowledge, there is no other predictive water quality tool for Upper Klamath Lake and using the TMDL would satisfy the upstream consistency objective. The Upper Klamath Lake model provides predictions for restored conditions using the climatic and hydrologic data from April 1991 to September 1998. The Upper Klamath Lake TMDL model predicts a bi-modal distribution of summer phosphorus concentrations with 2 of the 8 years experiencing high phosphorus concentrations (> 200 µg/L) associated with large algae blooms (Figure 2-27). Given the bi-model distribution, we determined that choosing a year representative of better water quality conditions was a conservative assumption (see Section 2.8.2). To satisfy the conservative assumption, years 1993 and 1996 were rejected because of large algal blooms and high phosphorus concentrations. Likewise, years 1994 and 1997 were rejected because of lingering, elevated phosphorus concentrations in the early part of the year due to the previous year’s algae bloom. Year 1991 and 1998 were rejected because they did not have predictions for the entire year. This left 1992 and 1995 as candidates. The year 1992 was rejected because it had the lowest annual average phosphorus concentrations and therefore not representative of the central tendency of predicted concentrations. Therefore, boundary conditions representing Upper Klamath Lake were derived from predictions for restored conditions using 1995 climate / hydrology. The year 1995 had the sixth highest spring phosphorus concentrations and the fourth highest summer concentrations (out of eight years). Since the year 1995 was not influenced by the two extreme years,

Upper Klamath and Lost River Subbasins TMDL
State of Oregon Department of Environmental Quality 71
the total phosphorus concentrations are lower than the multiple year, average targets presented in the Upper Klamath Lake TMDL of 30 µg/L (March – May) and 110 µg/L (annual) (DEQ 2002). For 1995, the average March – May total phosphorus concentration was 27 µg/L and the annual average was 23 µg/L. Later in the document, these boundary conditions used for Upper Klamath Lake are labeled “baseline”. Flow from Upper Klamath Lake and the tributaries were set at existing conditions, in order to maintain consistency with the allocation scenarios. This is necessary because reservoir operations cannot be easily predicted under a different flow regime and to determine the impact of the dams, scenarios flows needed to be the same. Furthermore, because allocations are based on a comparison with the natural condition baseline, flow consistency allows for a more precise loading analysis. Results for two model runs: one that used current condition flows from Upper Klamath Lake and one that used estimated flows from a natural regime (USBR 2005), were compared and water quality conditions downstream of Keno Dam were not found to be significantly different. No significant reduction of temperature is expected from Upper Klamath Lake so the natural condition baseline used the existing temperatures from this source.
Figure 2-27. Upper Klamath Lake TMDL predicted total phosphorus concentrations for the climate/hydrology years: 1991 – 1998.
Permitted point sources were removed from the model (i.e., both flow and water quality contributions were removed). The Lost River Diversion Channel (LRDC) and Klamath Straits Drain (KSD) were represented using current conditions flow but their water quality characteristics and temperature were set to be the same as Upper Klamath Lake. Accretion and depletion flows in Keno impoundment that were necessary for reproducing water surface elevations in the current condition model were removed for the natural conditions model. Including the accretion and depletion flows would unnecessarily complicate allocations. The current condition flow and water quality of the springs are assumed to be equivalent to the natural condition. The model uses instream nitrogen and phosphorus concentrations and properties of algae uptake of nutrients to determine which nutrient is limiting the growth of algae (see Appendix B). The lower of the nitrogen or phosphorus “limiting factors” is applied as a rate multiplier to limit the maximum algal growth. For example, if the phosphorus limiting factor is calculated as 0.3 and the nitrogen limiting factor is calculated as 0.8, then actual algae growth rate would be limited to maximum algae growth rate multiplied by 0.3. Similar to the Upper Klamath Lake TMDL, the availability of phosphorus is predicted to be controlling algal growth in the Klamath River to just downstream of J.C. Boyle dam at approximately river mile 222 (Figure 2-28) Springs with high natural phosphorus concentrations discharge into the Klamath River at this location. Downstream of the springs, at the state line,
0
50
100
150
200
250
300
J F M A M J J A S O N D
Tota
l Ph
osp
ho
rus
(µg/
L)
Date
1995

Upper Klamath and Lost River Subbasins TMDL
State of Oregon Department of Environmental Quality 72
phosphorus and nitrogen are predicted to be limiting algal growth at different times of the year (Figure 2-29). Figure 2-28. Predicted natural condition baseline nutrient limitation factors for Klamath River, averaged from June through September.
Figure 2-29. Predicted natural condition baseline nutrient limitation factors for Klamath River at the state line (river mile 207).
The predicted natural condition baseline water quality condition and comparison to biologically-based criteria are presented below along with the water quality compliance results.
2.7.2 Loading Capacity
2.7.2.1 Dissolved Oxygen, pH, excess algae and ammonia toxicity related pollutants The loading capacity of the Klamath River for total phosphorus, total nitrogen and 5-day biochemical oxygen demand was calculated based on limiting the impact of these pollutants on dissolved oxygen and pH. Per the water quality standard, when dissolved oxygen is not achieving the biologically-based criteria, anthropogenic activities cannot decrease dissolved oxygen by more than 0.20 mg/L. Due to the complexity of the system, the high spatial and temporal resolution of model compared to relatively simple allocations (i.e. average concentrations, percent reductions), the model predicts very minor excursions of this water quality target. The model predicts a 2% excursion rate with a maximum difference of 0.205 mg/L of DO at one of 10 compliance locations using one of the two DO metrics (see Appendix C for specifics). Given the low frequency and low magnitude of excursion, DEQ considers the allocations appropriately protecting beneficial uses.. The nutrient loading capacity for the Klamath River is also determined by reducing pH so that concentrations are less than 9.0. The model predicts minor excursions to this criterion under natural and allocation conditions. The difference between greatest natural and allocated pH is 0.07 standard units with a maximum predicted pH under allocated conditions of 9.11. Under allocated conditions, the frequency of excursions is <2% at 5 of the 12 compliance locations (Appendix C). Given the low
0.6
0.7
0.8
0.9
1
J F M A M J J A S O N D
Lim
itin
g Fa
cto
r
Date
NitrogenPhosphorus

Upper Klamath and Lost River Subbasins TMDL
State of Oregon Department of Environmental Quality 73
frequency and magnitude of excursion, DEQ considers the allocations appropriately protecting beneficial uses. A simplified loading capacity, current load and excess load was calculated from the flow and concentration for the year 2000 conditions at state line (Table 2-7). Since these pollutants are not conservative and the loading capacity varies longitudinally, the sum of the allocated loads may exceed the simplified loading capacity presented in Table 2-7. The actual loading capacity is better described in the paragraphs above. The loading capacity for achieving the ammonia toxicity criteria was not explicitly calculated because water quality compliant conditions for dissolved oxygen and pH, also resulted in achieving the ammonia toxicity criteria. The excess algae guidance level is set to be an indicator of nutrient pollution and likely DO and pH impairments. Therefore, a quantitative loading capacity is not computed for compliance with the guidance level, but rather compliance with DO and pH targets indicate that there is no longer an excessive algae impairment. Table 2-7. Simplified annual pollutant loading capacity and excess load computed from flow and concentration at the state line.
Constituent Current Loading (metric tons/yr)
Loading Capacity (metric tons/yr)
Excess Load (metric tons/yr)
Total Phosphorus
326 41 285
Total Nitrogen 1,371 520 851
Biochemical Oxygen Demand (5-day)
6,576 2500 4076
2.7.3 Allocations to address DO, pH, excess algae and ammonia toxicity impairments
By definition, TMDLs are the sum of the allocations [40 CFR 130.2(i)]. Allocations are defined as the portion of a receiving water loading capacity that is allocated to point or non-point sources and natural background. A Load Allocation (LA) is the amount of pollutant that non-point sources can contribute to the stream without exceeding state water quality standards. The Waste Load Allocation (WLA) is the amount of pollutant that point sources can contribute to the waterbody without violating water quality standards. The allocations were determined through the application of the water quality model (see Appendix C). During implementation, sources could explore achieving allocations through a variety measures including operational changes, improvements or trading. 2.7.3.1 Point source and nonpoint source (except dams) nutrient allocations Table 2- and Table 2- list the distribution of phosphorus, nitrogen, and biochemical oxygen demand (5-day) loading allocated to the various nonpoint and point sources, respectively. Load Allocations are presented in the tables in terms of daily loads. The surrogate measure of percent reduction from current loading is presented for convenience. Waste load allocations are expressed as average concentrations for the year 2000, and the allocations to point and nonpoint sources apply year round. The allocations achieve the DO and pH water quality criteria relative to natural conditions as shown in Figure 2-30 through Figure 2-35. The figures presented are a subset of the 12 compliance locations and present the most impacted locations and critical metrics. Summary tables of the same information are presented in Appendix C, Tables 6 – 9. At certain times and at some sites, the allocations are predicted to cause an increase in DO concentrations above the baseline due to increased algal
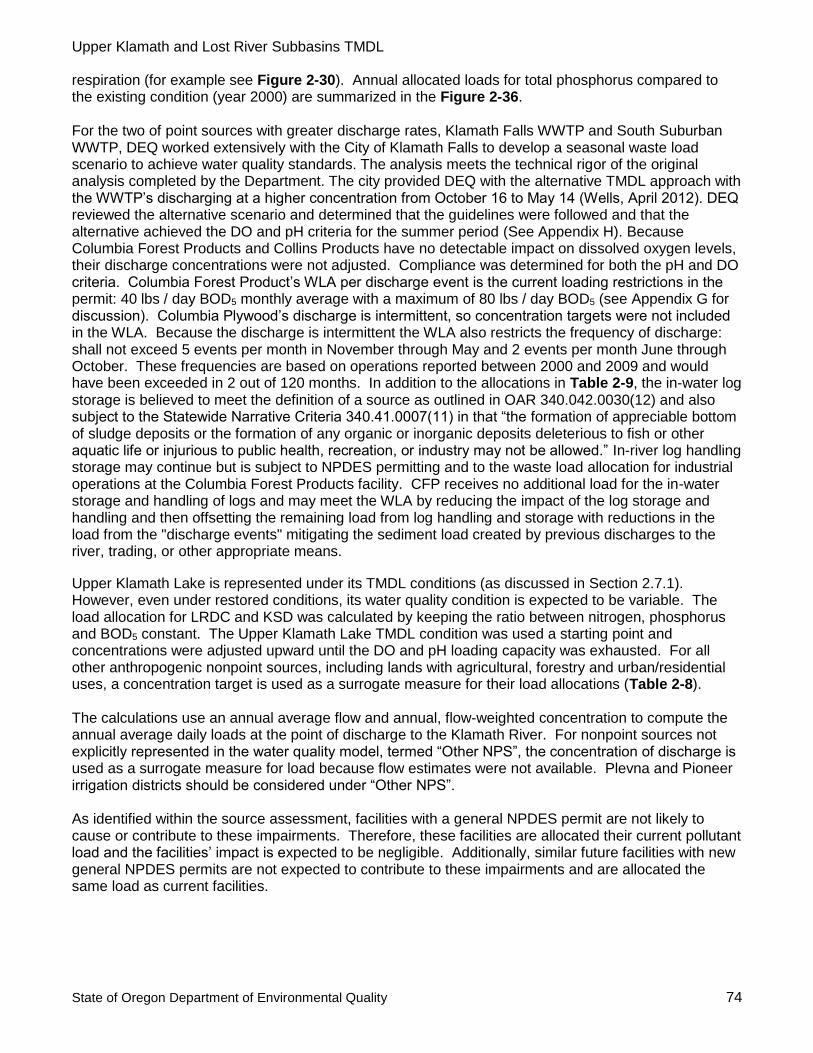
Upper Klamath and Lost River Subbasins TMDL
State of Oregon Department of Environmental Quality 74
respiration (for example see Figure 2-30). Annual allocated loads for total phosphorus compared to the existing condition (year 2000) are summarized in the Figure 2-36. For the two of point sources with greater discharge rates, Klamath Falls WWTP and South Suburban WWTP, DEQ worked extensively with the City of Klamath Falls to develop a seasonal waste load scenario to achieve water quality standards. The analysis meets the technical rigor of the original analysis completed by the Department. The city provided DEQ with the alternative TMDL approach with the WWTP’s discharging at a higher concentration from October 16 to May 14 (Wells, April 2012). DEQ reviewed the alternative scenario and determined that the guidelines were followed and that the alternative achieved the DO and pH criteria for the summer period (See Appendix H). Because Columbia Forest Products and Collins Products have no detectable impact on dissolved oxygen levels, their discharge concentrations were not adjusted. Compliance was determined for both the pH and DO criteria. Columbia Forest Product’s WLA per discharge event is the current loading restrictions in the permit: 40 lbs / day BOD5 monthly average with a maximum of 80 lbs / day BOD5 (see Appendix G for discussion). Columbia Plywood’s discharge is intermittent, so concentration targets were not included in the WLA. Because the discharge is intermittent the WLA also restricts the frequency of discharge: shall not exceed 5 events per month in November through May and 2 events per month June through October. These frequencies are based on operations reported between 2000 and 2009 and would have been exceeded in 2 out of 120 months. In addition to the allocations in Table 2-9, the in-water log storage is believed to meet the definition of a source as outlined in OAR 340.042.0030(12) and also subject to the Statewide Narrative Criteria 340.41.0007(11) in that “the formation of appreciable bottom of sludge deposits or the formation of any organic or inorganic deposits deleterious to fish or other aquatic life or injurious to public health, recreation, or industry may not be allowed.” In-river log handling storage may continue but is subject to NPDES permitting and to the waste load allocation for industrial operations at the Columbia Forest Products facility. CFP receives no additional load for the in-water storage and handling of logs and may meet the WLA by reducing the impact of the log storage and handling and then offsetting the remaining load from log handling and storage with reductions in the load from the "discharge events" mitigating the sediment load created by previous discharges to the river, trading, or other appropriate means. Upper Klamath Lake is represented under its TMDL conditions (as discussed in Section 2.7.1). However, even under restored conditions, its water quality condition is expected to be variable. The load allocation for LRDC and KSD was calculated by keeping the ratio between nitrogen, phosphorus and BOD5 constant. The Upper Klamath Lake TMDL condition was used a starting point and concentrations were adjusted upward until the DO and pH loading capacity was exhausted. For all other anthropogenic nonpoint sources, including lands with agricultural, forestry and urban/residential uses, a concentration target is used as a surrogate measure for their load allocations (Table 2-8). The calculations use an annual average flow and annual, flow-weighted concentration to compute the annual average daily loads at the point of discharge to the Klamath River. For nonpoint sources not explicitly represented in the water quality model, termed “Other NPS”, the concentration of discharge is used as a surrogate measure for load because flow estimates were not available. Plevna and Pioneer irrigation districts should be considered under “Other NPS”. As identified within the source assessment, facilities with a general NPDES permit are not likely to cause or contribute to these impairments. Therefore, these facilities are allocated their current pollutant load and the facilities’ impact is expected to be negligible. Additionally, similar future facilities with new general NPDES permits are not expected to contribute to these impairments and are allocated the same load as current facilities.

Upper Klamath and Lost River Subbasins TMDL
State of Oregon Department of Environmental Quality 75
Table 2-8. Nonpoint Source Load Allocations and target water quality compliance concentrations using flow-weighted averages.
Source
Flow Average
2000 (cfs)
Total Phosphorus
Average (mg/L)
Total P Allocation (lbs/day)
Total Phosphorus
Percent Reduction
Total Nitrogen Average (mg/L)
Total Nitrogen
Allocation (lbs/day)
Total Nitrogen Percent
Reduction
BOD5 (mg/L)
BOD5
Allocation (lbs/day)
BOD5 Percent
Reduction
UKL (baseline) 1511 0.024 -- -- 0.31 -- -- 1.7 -- --
Lost River Diversion*
270 0.029 42 89% 0.37 546 83% 2.1 2998 88%
Klamath Straits Drain
111 0.035 21 92% 0.45 268 87% 2.2 1329 92%
Other NPS -- 0.035 -- -- 0.45 -- -- 2.2 -- --
Springs (natural)
225 0.069 83 0% 0.31 381 0% 0.5 599 0%
Table 2-9. Point Source Waste Load Allocations using flow-weighted averages.
Source Time Perio
d
Flow Rate
Average 2000 (cfs)
Flow Rate
Average 2000
(MGD)
Total Phosphorus Average
(mg/L)
Total Phosphorus Allocation (lbs/day)
Total Nitrogen Average (mg/L)
Total Nitrogen Allocatio
n (lbs/day)
BOD5 Average (mg/L)
BOD5 Allocation (lbs/day)
Klamath Falls WWTP
5/15 - 10/15
4.5 2.9 0.35 8.6 23 556 18 439
10/16 – 5/14
5.4 3.5 1.9 54 23 671 19 549
South Suburban WWTP
5/15 - 10/15
2.6 1.7 0.35 4.9 23 318 18 251
10/16 – 5/14
3.6 2.3 1.9 36 23 448 19 367
Columbia Forest Products
N/A Intermittent discharge -- 2.1* -- 10* -- 40
Collins Forest Products**
N/A 1.4 0.91 0.46 3.5 2.8 21 14 105
*based on assumed ratio with BOD5 **Includes outfall #1 and #2, using a flow weighted average for concentrations Figure 2-30. Predicted DO (7-day metric) in Klamath River at Klamath Falls WWTP outfall location. The ‘Difference’ at
the bottom of the figure shows the ‘Allocations, without dams’ minus the ‘Natural Condition Baseline Scenario’.

Upper Klamath and Lost River Subbasins TMDL
State of Oregon Department of Environmental Quality 76
Figure 2-31. Predicted DO (instantaneous) in Klamath River at Keno Dam. The ‘ % Saturation’ at the bottom of the
figure shows the predicted percent DO saturation of the ‘Allocations, without dams’ scenario.
Figure 2-32. Predicted DO (30-day metric) in Klamath River at stateline. The ‘Difference’ at the bottom of the figure
shows the ‘Allocations, without dams’ minus the ‘Natural Condition Baseline Scenario’.

Upper Klamath and Lost River Subbasins TMDL
State of Oregon Department of Environmental Quality 77
Figure 2-33. Predicted DO (7-day metric) in Klamath River at stateline. The ‘Difference’ at the bottom of the figure shows
the ‘Allocations, without dams’ minus the ‘Natural Condition Baseline Scenario’.
Figure 2-34. Predicted pH in Klamath River at South Suburban WWTP outfall location.

Upper Klamath and Lost River Subbasins TMDL
State of Oregon Department of Environmental Quality 78
Figure 2-35. Predicted daily maximum pH in Klamath River at stateline. The ‘Difference’ at the bottom of the figure
shows the ‘Allocations, without dams’ minus the ‘Natural Condition Baseline Scenario’.

Upper Klamath and Lost River Subbasins TMDL
State of Oregon Department of Environmental Quality 79
Figure 2-36. Annual loading diagram for total phosphorus
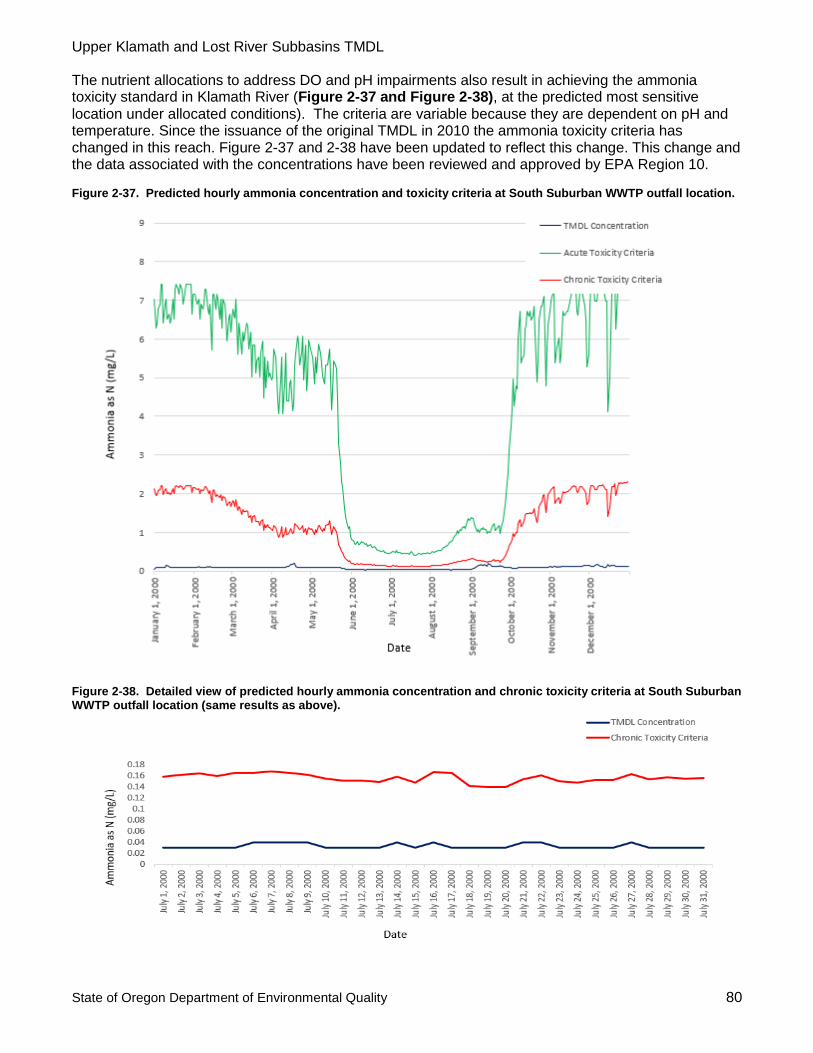
Upper Klamath and Lost River Subbasins TMDL
State of Oregon Department of Environmental Quality 80
The nutrient allocations to address DO and pH impairments also result in achieving the ammonia toxicity standard in Klamath River (Figure 2-37 and Figure 2-38), at the predicted most sensitive location under allocated conditions). The criteria are variable because they are dependent on pH and temperature. Since the issuance of the original TMDL in 2010 the ammonia toxicity criteria has changed in this reach. Figure 2-37 and 2-38 have been updated to reflect this change. This change and the data associated with the concentrations have been reviewed and approved by EPA Region 10. Figure 2-37. Predicted hourly ammonia concentration and toxicity criteria at South Suburban WWTP outfall location.
Figure 2-38. Detailed view of predicted hourly ammonia concentration and chronic toxicity criteria at South Suburban WWTP outfall location (same results as above).

Upper Klamath and Lost River Subbasins TMDL
State of Oregon Department of Environmental Quality 81
2.7.3.2 DO augmentation allocations to dams Dams differ from the others sources described above. Rather than adding nutrients to the system, they alter the hydraulics which leads to a contribution to the impairments. The allocations to the dams reflect this difference and are expressed as a surrogate measure of a required dissolved oxygen augmentation. The dissolved oxygen augmentation is derived from the predicted DO deficit caused by the dams when all other source allocations are in place. Under conditions when a dam is not causing a DO deficit or when the dam’s DO deficit is less than the remaining loading capacity, the dam is not required to augment DO. The amount of DO (mg/L) that a dam is required to augment (DOaugmentation) is calculated by the following:
DOaugmentation = -1 × (DOdam impact + DOLoading capacity + DOOther allocations) The DOdam impact is the difference between the DO concentrations (mg/L) resulting from two scenarios: [‘allocations with dams’ - ‘allocations without dams’], for example the differences shown in Figure 2-39 and Figure 2-40, bottom left graphs. The DOLoading capacity was defined previously as 0.2 mg/L. The DOOther allocations is the DO deficit due to other sources’ allocations (mg/L) [‘allocations without dams’ - ‘Natural condition baseline’] (see Appendix C, Tables 6 and 9). The above equation was computed for the average 7-day and 30-day differences by month and the greater of the two became the dissolved oxygen allocations in Table 2-10. For example, considering the 30-day DO metric for August, the DOdam impact = -0.37 mg/L, the DOLoading capacity = 0.2 mg/L and the DOOther allocations = -0.07, therefore the DOaugmentation = 0.24 mg/L. When DOaugmentation was less than zero it was not reported and no augmentation is required. If a new FERC license is issued to the hydroelectric project, then the conditions in the 401 will implement the TMDL. If no new license is issued, DEQ will require a TMDL implementation plan from the owner of each facility. PacifiCorp is proposing to remove the East Side and West Side developments and therefore their allocation is zero impact to dissolved oxygen and pH. No allocations to dams are necessary to achieve the ammonia toxicity or pH standard. Table 2-10. Keno impoundment and JC Boyle Reservoir Load Allocations, averaged by month.
Month Keno impoundment
Average DO Augmentation (mg/L)
JC Boyle Reservoir Average DO Augmentation
(mg/L)
January -- --
February -- --
March -- --
April -- --
May -- --
June -- --
July 0.01 0.12
August -- 0.24
September -- 0.24
October -- 0.07
November -- --
December -- --

Upper Klamath and Lost River Subbasins TMDL
State of Oregon Department of Environmental Quality 82
Figure 2-39. Predicted DO (30-day metric) in Klamath River at Highway 66, depth averaged. The ‘Difference’ at the
bottom-left of the figure shows the ‘Allocations, with dams’ scenario minus the ‘Allocations, without dams’ scenario. The ‘Quantile’ plot at the bottom-right shows the distribution of the differences.
Figure 2-40. Predicted DO (30-day metric) in Klamath River at the deepest point in JC Boyle Reservoir, depth averaged. The ‘Difference’ at the bottom-left of the figure shows the ‘Allocations, with dams’ scenario minus the ‘Allocations,
without dams’ scenario. The ‘Quantile’ plot at the bottom-right shows the distribution of the differences.

Upper Klamath and Lost River Subbasins TMDL
State of Oregon Department of Environmental Quality 83
2.7.3.3 Reserve Capacity related to DO and pH impairments Reserve capacity is defined as “that portion of a receiving stream’s loading capacity which has not been allocated to point sources or nonpoint sources and natural background as wasteload allocations or load allocations, respectively. New, expanded or previously unidentified sources may discharge pollutants at or below background concentrations of pollutants estimated by the Upper Klamath Lake baseline condition presented in Table 2-. At these concentrations, it is unlikely that a source would contribute to a DO, pH, ammonia toxicity or chlorophyll a impairment. Loading from a new NPDES, general permitted source is already accounted for by the Waste Load Allocation assigned to general permitted sources (see Section 2.7.3.1).
2.7.4 Instream Targets
The following graphs are instream water quality targets which allowed for compliance with water quality standards given the allocations and year 2000 climate and hydrology (Figure 2-41 and Figure 2-42). The targets are averaged results from the water quality model from June 1 through September 30 and include allocations to point sources and nonpoint sources except dams (due to different allocation structure, there is no predictive scenario including implementation of dam allocations). Achieving these instream targets does not determine compliance with allocations but is an example of one set of conditions which achieved water standards. The instream water quality targets are dependent on conditions from Upper Klamath Lake. As described previously, a range of conditions is expected from Upper Klamath Lake after achieving the TMDL targets. These targets likely represent the best conditions that could be expected in the Klamath River. Given the natural variability of the system, there will be some years when these targets will not be achieved but sources could be in compliance with their allocations and water quality standards will be achieved. The significant change in concentration at river mile 220 is due to the springs discharging into the Klamath River at naturally high phosphorus concentrations. Figure 2-41. Example water quality compliant, instream conditions, averaged between June 1 and September 30. TP = total phosphorus, PO4 = orthophosphate, CHLA = chlorophyll a.

Upper Klamath and Lost River Subbasins TMDL
State of Oregon Department of Environmental Quality 84
Figure 2-42. Example water quality compliant, instream conditions, averaged between June 1 and September 30. TN
= total nitrogen, DIN = dissolved inorganic nitrogen (sum of ammonia, nitrate and nitrite). Temperature is the average of the daily maximums.
2.8 Margins of Safety A margin of safety in a TMDL is required by the Clean Water Act to account for uncertainty and to assure that the TMDL will achieve water quality standards. TMDLs can be developed with explicit and/or implicit margins of safety. An explicit margin of safety is established by withholding an explicit fraction of the loading available for allocation. An implicit margin of safety is established by developing the loading capacity or allocations using conservative assumptions, such as assuming very low flows in the receiving water. Because the natural nutrient and temperature conditions exceed the numeric water quality criteria in the Klamath River, the loading available for allocation is restricted to levels that will not cause a measurable impact to water quality. DEQ does not believe an explicit margin of safety, which would reduce the loading available for allocation to an even smaller incremental impact, is warranted in this TMDL. Therefore, the TMDL relies on an implicit margin of safety.
2.8.1 Uncertainty Analysis
Types of model uncertainty can be separated into four broad categories (after EPA 2009):
Framework uncertainty, resulting from incomplete knowledge about factors that control the
behavior of the system being modeled; limitations in spatial or temporal resolution; and
simplifications of the system.
Input uncertainty, resulting from data measurement errors, inconsistencies between measured
values and those used by the model (e.g., in their level of aggregation/averaging),
Parameter uncertainty, resulting from a non-unique calibration and simplified biological and
physical processes.
Niche uncertainty, resulting from the use of a model outside the system for which it was
originally developed and/or developing a larger model from several existing models with
different spatial or temporal scales.

Upper Klamath and Lost River Subbasins TMDL
State of Oregon Department of Environmental Quality 85
Although these four categories of model uncertainty are inter-related, for organizational purposes they are discussed separately below. A more detailed discussion of uncertainty and model limitations in presented in Appendix B. Model framework uncertainty Mathematical models offer a simplified representation of physical, chemical and biological processes. The model framework for the Klamath River is comprised of CE-QUAL-W2, RMA-11 and EFDC, all of which are well known and widely used models with a relatively long history. The models are appropriate choices to evaluate the impacts of BOD and nutrients on the system. The model framework operates at high spatial and temporal resolutions which capture the appropriate processes. The model framework’s longitudinal resolutions vary from 75 to 405 meters and the temporal resolution is less than one hour. CE-QUAL-W2, a two-dimensional, laterally averaged model is used to represent the reservoirs, so stratification and longitudinal differences can be calculated. For the rivers, RMA-11 assumes that the lateral and depth variations are much less important than the longitudinal variations. Lastly, in the estuary, EFDC simulates the system in three dimensions. Notable biochemical process simplifications include the representation of all floating algae as a single group, all attached algae as a single group, organic matter with only four components, sediment oxygen demand using a zero-order formulation and major decay / transformation kinetics as a first-order reaction. These simplifications are widely tested and generally accepted. DEQ believes minimal uncertainty is introduced into the TMDL analysis through the development of the basic model framework. A number of enhancements to the basic model codes were implemented in the model framework (see Appendix B for complete discussion). These enhancements have not had the benefit of testing by many users over many years like the standard routines in these models. However, the enhancements were based on fundamental processes and were documented, tested and reviewed. Of particular note is the enhancement termed the “Two-state Algae Transformation”, which was necessary to represent decreasing algae concentrations in Keno impoundment in the downstream direction. The enhancement is based on algal physiology and is parameterized to capture the unique pattern of algae in Keno impoundment. The base CE-QUAL-W2 model could not capture the observed pattern of algae. DEQ recognizes that these enhancements add uncertainty to the analysis; but the uncertainty has been minimized through documentation, testing and review. These enhancements are necessary to reproduce measurements. Regardless, DEQ believes the uncertainty introduced through the model enhancements is less than the uncertainty of using a poorly-calibrated model. Model Input Uncertainty Boundary conditions are used in the model framework to represent external sources and forces (i.e. tributaries and meteorology, respectively). Typically, boundary conditions are altered to test different water quality scenarios, so uncertainty is introduced not only in the current representation of boundary conditions but also in the scenarios. In the current representation of boundary conditions, the Upper Klamath Lake outlet boundary condition appears to be the least certain. This uncertainty is caused by the infrequent monitoring relative to the temporal variability of conditions and the incomplete monitoring relative to the model constituents. Monitoring sites within Upper Klamath Lake were used to represent the outlet to gain greater frequency, and certain constituents were derived through assumed ratios rather than measured directly. The water quality data were then interpolated into a time series for model input. The water quality of the springs downstream of J.C. Boyle dam has not been measured directly but was derived using a mass balance. Given the dominance of Upper Klamath Lake outlet conditions on the Klamath River in Oregon and the uncertainty associated with this boundary condition, DEQ concludes that this is the largest source of uncertainty in regard to the current model representation. Data from 2007 and 2008, collected by the USGS, was unfortunately not available during model calibration. However, information in the report only supported the conclusions that DEQ had made during the development of the model and would not lead the department to change its conclusions.

Upper Klamath and Lost River Subbasins TMDL
State of Oregon Department of Environmental Quality 86
To test the impact of different loading scenarios, the pollutant concentrations of the boundary conditions are altered. In this analysis we altered boundary conditions using two different methodologies: (1) iteratively changing boundary conditions until instream criteria are achieved or (2) using previous analyses to estimate a restored boundary condition. The first option is dependent on the parameterization of the model which is discussed below. The second option was used to determine the TMDL boundary conditions for the springs downstream of JC Boyle Dam and the Upper Klamath Lake outlet. The springs’ concentration was determined to be uninfluenced by anthropogenic activity, so the springs’ TMDL concentration is the same as current condition. The Upper Klamath Lake TMDL concentration was based on the model that was used to determine the Upper Klamath Lake TMDL (DEQ 2002). This introduces four different types of uncertainty into this analysis:
1. The Upper Klamath Lake model uncertainty is inherited.
2. The Upper Klamath Lake model predicts a bi-modal distribution of phosphorus and algae
concentrations with approximately 25% of the years still experiencing intense algae blooms and
75% of years experiencing more mild algae blooms. The Klamath River TMDL analysis uses a
representation of the more mild, more frequent years as the boundary condition, which is a
conservative assumption (see Conservative Assumptions discussion).
3. The Upper Klamath Lake model predicts concentrations of phosphorus and algae. The
remainder of the constituents necessary for the Klamath River model was determined using
current ratios in the water column (i.e. total nitrogen to total phosphorus).
4. The Upper Klamath Lake scenario concentration was used to set a baseline concentration for
Klamath Straits Drain and Lost River Diversion Channel in the scenarios. These sources’
pollutant concentrations were then iteratively increased from the baseline until their portion of
the assimilative capacity was exhausted.
Similar to the current condition representation, the Upper Klamath Lake boundary condition is likely the largest source of uncertainty in the scenarios. However, there is currently no other representation of restored Upper Klamath Lake conditions. Therefore, this uncertainty is currently unavoidable. From a regulatory and policy prospective, this type of uncertainty can be minimized through adaptive management. Model Parameter Uncertainty Model parameters are semi-empirical in that they are determined not through site specific field or laboratory measurements but through literature review and goodness-of-fit between model output and field measurements. For example, the organic matter decay rate was determined through attempting to reproduce field measurements of dissolved oxygen and nutrient constituents while being constrained to the range of typical literature values. The inherent assumption in most modeling similar to this effort is that parameter uncertainty has been minimized when an acceptable calibration has been achieved. Parameter uncertainty can be quantified; however, DEQ does not know of any cases where the impact of parameter uncertainty on allocations has been quantified for a model of this complexity. The iterative process of adjusting parameters to calibrate the model inherently considers the sensitivity of the model to the parameters. Through this process and the more than 40 subsequent allocation runs, it was clear that the model results are primarily driven by the boundary conditions. Model Niche Uncertainty The appropriateness of the model the setting of the Klamath River was discussed in “Model Framework Uncertainty”. An important part of niche uncertainty is whether the parameters used to represent the current condition are also representative of a restored condition. For example, currently Upper Klamath Lake contributes primarily blue-green algae and it is suspected that a restored condition would have a

Upper Klamath and Lost River Subbasins TMDL
State of Oregon Department of Environmental Quality 87
higher percentage of green algae. There is uncertainty regarding whether the calibrated parameters would still be appropriate given a shift in the algal community. This uncertainty was minimized by calibrating / validating the model to two entire years of data which included a wide variety of flows and water quality conditions. For example, the model framework was able to capture the temporal DO pattern in the Keno impoundment in April and May when diatoms were the predominant algae causing dissolved oxygen swings, in June when blue-green algae were likely dominant, and in July / August when DO was depressed due to organic matter decay (predominant algae type based on observed pattern in 2007 and 2008 from Sullivan et al. 2008 and 2009). Beside model uncertainty, DEQ also acknowledges the importance of data uncertainty. In the Klamath River there are many different agencies and consulting firms who have collected water quality and flow data. Each of these organizations has their own set of quality assurance and quality control procedures. Furthermore, to date, there is no unified storage and retrieval mechanism for these data. These factors, along with the inherent variability and quantification limitations, increase the uncertainty of data quality. This type of uncertainty has been minimized by creating a database of the relevant data, double checking with agencies when data appear to be outliers and calibrating the model with equally distributed weight among data points. In conclusion, uncertainty has been reduced by building a state-of-the-art, time-dependent numeric model based on multi-year data sets. The largest source of uncertainty in this system is the highly variable loading of pollutants from Upper Klamath Lake, not the numeric water quality model, environmental data, or water quality impact caused by point sources in this study area.
2.8.2 Conservative Assumptions DEQ chose to use conservative assumptions in the TMDL analysis to fulfill the Margin of Safety. The conservative assumptions used in this TMDL include:
The numeric model used to predict the impact of allocations assumes that sediment oxygen demand does not improve in the riverine sections. The magnitude of SOD will likely decrease with the decrease of organic loading allocated by the TMDL and result in a shorter season of deficient DO concentrations.
Predicted conditions in the Klamath River are strongly influenced by the predicted variable conditions of the Upper Klamath Lake TMDL. The magnitudes of the allocations are influenced by loading conditions from Upper Klamath Lake and the choice of the baseline condition. Given the Upper Klamath Lake model predicts that under restored conditions, approximately 25% of the years will have significantly higher phosphorus and algae concentrations, the baseline condition was chosen to represent the years with better water quality conditions. This is conservative because allocations are based on the difference from a baseline condition. The closer the concentration or temperature is to the numeric criteria, less loading is necessary to cause a measurable degradation.
Nutrient and BOD allocations to point sources and nonpoint sources apply year-round. In the winter, there may be additional assimilative capacity available.
To address DO and pH, allocations to nonpoint sources are for nitrogen, phosphorus and biochemical oxygen demand.
Year 2000 flows are less than more recent flow requirements (i.e. USBR Klamath Project Operations and PacifiCorp Klamath Hydro Project Biological Opinion flows).
Upper Klamath and Lost River Subbasins TMDL
State of Oregon Department of Environmental Quality 88
2.10 References Arhonditsis, G.B. and Brett, M.T., 2004, Evaluation of the current state of mechanistic aquatic biogeochemical modeling, Marine Ecology Progress Series, 271: 13-26. Aroner, E.R., 2009, WQHydro, Water Quality / Hydrology / Graphics / Analysis System User’s Manual, WQHydro Consulting, Portland, Oregon. Baric, A.; Grbec, B.; Kuspilic, G; Marasovic, I.; Nincevic, Z.; Grubelic, I. (2003) Mass Mortality Event in a Small Saline Lake (Lake Rogoznica) caused by Unusual Holomictic Conditions. Scientia Marina, 67 (2): 129-141. Chapra, S.M., 1997, Surface Water-Quality Modeling, McGraw-Hill. Cole, T.M., and Wells, S.A., 2003, CE-QUAL-W2: A Two-Dimensional, Laterally Averaged, Hydrodynamic and Water Quality Model, Version 3.2, User Manual. Prepared for U.S Army Corps of Engineers. Danosky and Kaffka, 2002, Farming Practices and Water Quality in the Upper Klamath Basin, Final Report to the California State Water Resources Board. Deas, Mike. 2008. Personal communication with Mike Deas via e-mail to Steve Kirk, February 5, 2008. Deas and Vaughn, 2006, Characterization of Organic Matter Fate and Transport in the Klamath River below Link Dam to Assess Treatment/Reduction Potential, Prepared for U.S. Bureau of Reclamation Klamath Area Office DEQ, 2002, Upper Klamath Lake Drainage Total Maximum Daily Load (TMDL) and Water Quality Management Plan (WQMP), primary authors were Matthew Boyd, Steve Kirk, Mike Wiltsey and Brian Kasper. 258 pp. DEQ, 2006a, Umpqua Basin TMDL., primary authors were Daniel Turner, Brian Kasper, Paul Heberling, Bobbi Lindberg, Mike Wiltsey, Gary Arnold, and Ryan Michie DEQ, 2006b, Willamette Basin TMDL.
Doyle, Micelis C, Lynch D. Dennis. 2005. Text says 2006.Sediment Oxygen Demand in Lake Ewauna and the Klamath River, Oregon, June 2003, USGS Scientific Investigation Report 2005-5228.
Eilers, J. M., Raymond. R. 2005. Sediment Oxygen Demand in Selected Sites of the Lost River and Klamath River.
Khangaonkar, T. and Yang, Z., 2008, Dynamic Response of Stream Temperatures to Boundary and Inflow Perturbation Due to Reservoir Operations, River Research and Applications, 24(4): 420 – 433. National Research Council (NRC) 2004. Endangered and Threatened Fishes in the Klamath Basin, Committee on Endangered and Threatened Fishes in the Klamath River Basin, The National Academies Press, Washington, DC. Newbold, J. D., Elwood, J. W., O’Neill, R. V., and Van Winkle, W. 1981. Measuring nutrient spiraling in streams, Can. J. Fish. Aquat.Sci., 38, 860–863.

Upper Klamath and Lost River Subbasins TMDL
State of Oregon Department of Environmental Quality 89
North Coast Regional Water Quality Control Board, 2010, Final Staff Report for the Klamath River Total Maximum Daily Loads (TMDLs) Addressing Temperature, Dissolved Oxygen, Nutrient, Microcystin Impairments in California. PacifiCorp, 2004a, Final License Application, Volume 1, Exhibits A, B, C, D, and H, Klamath Hydroelectric Project (FERC Project No. 2082), Version: February 2004, Portland, Oregon. PacifiCorp, 2004b, Final Technical Report, Klamath Hydroelectric Project (FERC Project No. 2082), Water Resources, Version: February 2004, Portland, Oregon. See Section 3 for current water quality conditions and Section 5 for analysis of the project’s effects on hydrology. PacifiCorp. 2006. Appendix A: Causes and Effects of Nutrient Conditions in the Upper Klamath River. Klamath Hydroelectric Project (FERC Project No. 2082). PacifiCorp, Portland, OR. Rykbost, K.A and Charlton, B.A, 2001, Nutrient Loading of Surface Waters in the Upper Klamath Basin: Agriculture and Natural Sciences, Special Report 1023, Agricultural Experiment Station, Oregon State University, March 2001. Can be accessed at http://ir.library.oregonstate.edu/jspui/handle/1957/6244 Rounds, S.A., and Sullivan, A.B., 2009, Review of Klamath River total maximum daily load models from Link River to Keno Dam, Oregon: U.S. Geological Survey Administrative Report, 37 p. Rounds, S.A., and Sullivan, A.B., 2010, Review of Revised Klamath River Total Maximum Daily Load models from Link River to Keno Dam, Oregon: U.S. Geological Survey Administrative Report, 32 p. Sullivan, A.B., Deas, M.L., Asbill, J., Kirshtein, J.D., Butler, K., Wellman, R.W., Stewart, M.A., and Vaughn, J., 2008, Klamath River Water quality and acoustic Doppler current profiler data from Link River Dam to Keno Dam, 2007: U.S. Geological Survey Open File Report 2008-1185, 24 p. Sullivan, A.B., Deas, M.L., Asbill, J., Kirshtein, J.D., Butler, K., and Vaughn, J., 2009, Klamath River water quality data from Link River Dam to Keno Dam, Oregon, 2008: U.S. Geological Survey Open File Report 2009-1105, 25 p. Sullivan, A.B., Snyder, D.M., and Rounds, S.A, 2009, Controls on biochemical oxygen demand in the upper Klamath River, Oregon, Chemical Geology, published online. Tchobanoglous G., Schroder E. 1985. Water Quality: Characteristics, Modeling, Modifications, Addison-Wesley. 394 pp. Tetra Tech, 2004. Data Review and Modeling Approaches, Klamath and Lost Rivers TMDL Development. Tetra Tech, Inc., Water Resources and TMDL Center. Prepared for U.S. Environmental Protection Agency Regions 9 and 10, North Coast Regional Water Quality Control Board, Oregon Department of Environmental Quality. Tetra Tech. 2009. Klamath River Model for TMDL Development. Tetra Tech, Inc., Water Resources and TMDL Center. Prepared for U.S. Environmental Protection Agency Regions 9 and 10, North Coast Regional Water Quality Control Board, Oregon Department of Environmental Quality. USBR, 2005, Natural Flow of the Upper Klamath River – Phase I. USBR, 2009a, http://www.usbr.gov/projects/Project.jsp?proj_Name=Klamath%20Project accessed 9/17/2009

Upper Klamath and Lost River Subbasins TMDL
State of Oregon Department of Environmental Quality 90
USBR, 2009b, Comments to North Coast Regional Water Quality Control Board on Public Review Draft of Klamath River TMDL and Action Plan. United State Department of the Interior, Bureau of Reclamation, Klamath Basin Area Office, Klamath Falls, Oregon. Accessed at http://www.swrcb.ca.gov/northcoast/water_issues/programs/tmdls/klamath_river/klamath_river_tmdl_comments.shtml on 10/27/2009. U.S. EPA, 1986, Quality Criteria for Water, EPA 440/5-86-001, Office of Water, Washington, DC. U.S. EPA, 2008, Lost River, California, Total Maximum Daily Loads, Nitrogen and Biochemical Oxygen Demand to address Dissolved Oxygen and pH Impairments. U.S. EPA, 2009, Guidance on the Development, Evaluation, and Application of Regulatory Environmental Models, Council for Regulatory Environmental Modeling, principal authors: Noha Gaber, Gary Foley, Pasky Pacual, Neil Stiber, Elsie Sunderland, Ben Cope, Annett Nold, and Zubair Saleem. Walker, W.W., 2001, Development of a Phosphorus TMDL for Upper Klamath Lake, Oregon, prepared for DEQ, March 7. Watercourse Engineering, 2004, Klamath River Modeling Framework to Support the PacifiCorp Federal Energy Regulatory Commission Hydropower Relicensing Application, prepared for PacifiCorp, Draft March 9. Watershed Sciences, 2002, Aerial Surveys in the Klamath and Lost River Basins, Thermal Infrared and Color Videography, Report to North Coast Regional Water Quality Control Board and Oregon DEQ. Williams, J. E. 1988. Endangered and threatened wildlife and plants: determination of endangered status for the shortnose sucker and the Lost River sucker. Federal Register 53:(137):27,130-27,134. Wu, Jennifer, 2016. Evaluation of Ammonia Toxicity Standard: Determination of compliance of Acute and Chronic Criteria. Prepared for DEQ January 16, 2017.

Upper Klamath and Lost River Subbasins TMDL
State of Oregon Department of Environmental Quality 91
Chapter 3: Lost River Dissolved Oxygen, Chlorophyll a, pH, and Ammonia Toxicity
“That seemed the way of Forlorn River. It has its beginning in Clear Lake, a large body of
surface water lying amid the Sage Mountains of northwestern California. It had begun well enough at its source under the beautiful rounded bare mountains of gray sage, and flowed
bravely on for a few miles, then suddenly it became a lost river. That is what it was called by the Indians.”
Zane Grey, 1926 (Forlorn River)
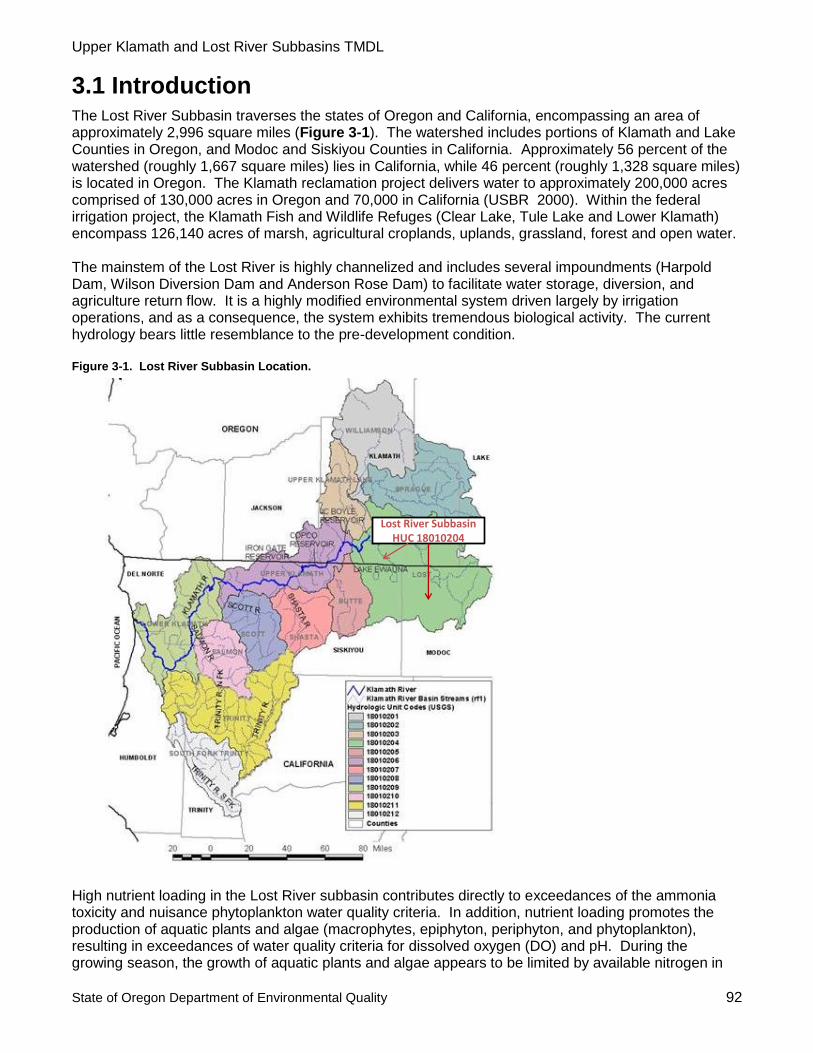
Upper Klamath and Lost River Subbasins TMDL
State of Oregon Department of Environmental Quality 92
3.1 Introduction The Lost River Subbasin traverses the states of Oregon and California, encompassing an area of approximately 2,996 square miles (Figure 3-1). The watershed includes portions of Klamath and Lake Counties in Oregon, and Modoc and Siskiyou Counties in California. Approximately 56 percent of the watershed (roughly 1,667 square miles) lies in California, while 46 percent (roughly 1,328 square miles) is located in Oregon. The Klamath reclamation project delivers water to approximately 200,000 acres comprised of 130,000 acres in Oregon and 70,000 in California (USBR 2000). Within the federal irrigation project, the Klamath Fish and Wildlife Refuges (Clear Lake, Tule Lake and Lower Klamath) encompass 126,140 acres of marsh, agricultural croplands, uplands, grassland, forest and open water. The mainstem of the Lost River is highly channelized and includes several impoundments (Harpold Dam, Wilson Diversion Dam and Anderson Rose Dam) to facilitate water storage, diversion, and agriculture return flow. It is a highly modified environmental system driven largely by irrigation operations, and as a consequence, the system exhibits tremendous biological activity. The current hydrology bears little resemblance to the pre-development condition. Figure 3-1. Lost River Subbasin Location.
High nutrient loading in the Lost River subbasin contributes directly to exceedances of the ammonia toxicity and nuisance phytoplankton water quality criteria. In addition, nutrient loading promotes the production of aquatic plants and algae (macrophytes, epiphyton, periphyton, and phytoplankton), resulting in exceedances of water quality criteria for dissolved oxygen (DO) and pH. During the growing season, the growth of aquatic plants and algae appears to be limited by available nitrogen in
Lost River SubbasinHUC 18010204

Upper Klamath and Lost River Subbasins TMDL
State of Oregon Department of Environmental Quality 93
the Lost River. Biochemical oxygen demand (BOD), in the water column and sediment, also contributes to the dissolved oxygen limitation. Data were accessed from numerous sources and multiple water quality monitoring events. Every attempt was made to obtain the most current and comprehensive data to support water quality model development, application, and analysis. The technical analysis used to develop the TMDLs made the best use of available data and provides a framework which can be readily updated in the future as more data become available. Using available information, a hydraulic and water quality model was developed to: 1) analyze the available data; 2) simulate water quality dynamics in the system, and 3) predict conditions that attain water quality criteria. Modeling results indicate that water quality criteria can be attained by reducing loading of nitrogen and biochemical oxygen demand, in addition to increasing dissolved oxygen levels in several of the impoundments.
3.2 Pollutant Identification The pollutants targeted in the Lost River TMDL are nitrogen and biochemical oxygen demand (Table 3-1). Analysis of water quality data using a calibrated water quality model indicates aquatic plants and algae productivity in the Lost River drainage is controlled primarily by nitrogen (Appendix B, Tetra Tech 2005). High nitrogen loading promotes production (eutrophication) of aquatic plants and algae which results in exceedances of water quality standards for DO and pH. Eutrophication is the over-enrichment of aquatic systems by excessive inputs of nutrients (nitrogen and/or phosphorus). The nutrients act as a fertilizer leading to excessive growth of aquatic plants (Figure 3-2), which eventually die and decompose, leading to bacterial consumption of dissolved oxygen. Ammonia toxicity is also attributed to nitrogen loading. Biochemical oxygen demand and sediment oxygen demand (SOD) also cause lower DO concentrations. When solids that contain organic matter settle to the bottom of a stream, they may decompose anaerobically (with no oxygen present), or aerobically (in the presence of oxygen), depending on conditions. The oxygen consumed in aerobic decomposition of these sediments is called SOD. The organic solids responsible for SOD are either delivered directly to the system or generated by the death of aquatic plants and algae. Analysis indicates that the primary pollutants of nitrogen and biochemical oxygen demand are directly related to SOD and that additional allocations are not necessary to address SOD. Table 3-1. Dissolved Oxygen, pH, Ammonia Toxicity and Nutrients TMDL Components
Waterbodies OAR 340-042-
0040(4)(a)
The impoundents and riverine sections of the Lost River from its mouth to Malone Dam (river mile 64.5), Tule Lake, Lower Klamath Lake, Klamath Straits Drain, and any other primary flow pathways connecting these features within the Lost River Subbasin (HUC CODE 18010204) in Oregon.
Pollutant Identification OAR 340-042-
0040(4)(b)
Pollutants: Dissolved inorganic nitrogen and carbonaceous biochemical oxygen demand.

Upper Klamath and Lost River Subbasins TMDL
State of Oregon Department of Environmental Quality 94
Target Identification OAR 340-042-
0040(4)(c) CWA §303(d)(1)
OAR 340-041-0016(1) (c) (in part) For waterbodies identified by DEQ as providing cool-water aquatic life, the dissolved oxygen shall not be less than 6.5 mg/l as an absolute minimum. At the discretion of DEQ, when it is determined that adequate information exists, the dissolved oxygen shall not fall below 6.5 mg/l as a 30-day mean minimum, 5.0 mg/l as a seven-day minimum mean, and shall not fall below 4.0 mg/l as an absolute minimum; OAR 340-041-0185(1) (a); Fresh waters (except Cascade lakes): pH values shall not fall outside the range of 6.5 to 9.0. OAR 340-041-0021 (2): Water impounded by dams existing on January 1, 1996, which have pHs that exceed the criteria are not in violation of the standard, if the Department determines that the exceedance would not occur without the impoundment and that all practicable measures have been taken to bring the pH in the impounded waters into compliance with the criteria. OAR 340-041-0033 Table 20: Freshwater criteria for ammonia toxicity is pH and temperature dependent as specified in USEPA 1986.. OAR 340-041-0019 (1)(a)(B): Nuisance Phytoplankton Growth; Natural lakes that do not stratify, reservoirs, rivers and estuaries: 0.015 mg/l (chlorophyll a).
Existing Sources CWA §303(d)(1) OAR 340-042-
0040(4)(f)
Forestry, Agriculture, Transportation, Septic Systems, Rural Residential land use, Urban land use, Irrigation return flows, Reservoir and Impoundment operations.
Seasonal Variation CWA §303(d)(1) OAR 340-042-
0040(4)(j)
Critical DO, pH, and ammonia toxicity levels on the Lost River generally occur in summer. The TMDLs apply year-round.
TMDL Loading Capacity and Allocations 40 CFR 130.2(f) 40 CFR 130.2(g) 40 CFR 130.2(h) OAR 340-042-
0040(4)(d), (g), (h), (k)
Loading Capacity: See Table 3-9 Wasteload Allocations (Point Sources)- See Table 3-12 Load Allocations (Non-Point Sources) – See Table 3-11 Reserve Capacity – Load equivalent to no measurable degradation in water quality. No quantified reserve capacity allocated.
Excess Load OAR 340-042-
0040(4)(e)
Excess load is the difference between the current load and the TMDL and equals 555 mtons / year of dissolved inorganic nitrogen (DIN) and 2450 mton / years of carbonaceous biochemical oxygen demand (CBOD).
Surrogate Measures
40 CFR 130.2(i)
Dissolved oxygen augmentation is required in three of the impounded reaches in order to achieve water quality standards.
Margins of Safety CWA §303(d)(1) OAR 340-042-
0040(4)(i)
An implicit margin of safety was used based on conservative assumptions, including year round reductions in DIN and CBOD loading.
WQ Standard Attainment Analysis
CWA §303(d)(1)
Analytical modeling of TMDL loading capacities demonstrates attainment water quality standards.
Water Quality Management Plan
OAR 340-042-0040(4)(l)
To be developed and implemented by Oregon Department of Environmental Quality in Oregon and California North Coast Region Water Quality Control Board in California.

Upper Klamath and Lost River Subbasins TMDL
State of Oregon Department of Environmental Quality 95
A survey was conducted at ten sites in the Lost River of Oregon and California in July 2004 to determine the nature of the aquatic plant communities in the river system (Appendix E, Eilers 2005). The dominant taxon was Ceratophyllum demersum (coontail). Lemna minor (duckweed) was also common at many of the sites. Additional taxa included several species of pondweed (Potamogeton pectinatus, P. crispus, and P. nodosus), Elodea canadensis, and Heteranthera dubia. Cladophora sp., a filamentous alga also common in nutrient-rich waters, was also present at a number of sites, commonly attached to macrophytes. All of these taxa found in the Lost River are tolerant of high turbidity and are common species found in eutrophic lakes and slow-moving waters. The chemical analysis of the plants indicated that they were generally nitrogen deficient based on ratios of nitrogen to phosphorus in the plant tissue (Eilers 2005). Figure 3-2. Productive waterbodies, algal blooms and macrophytes in Wilson Reservoir and Lost River.
3.3 Target Identification – CWA §303(d)(1)
3.3.1 Sensitive Beneficial Uses
Oregon Administrative Rules (OAR Chapter 340, Division 41, Section 0180(1), Table 180A) lists the “Beneficial Uses” occurring within the Klamath basin (Table 3-2). Numeric and narrative water quality standards are designed to protect the most sensitive beneficial uses. In the case of the Lost River, Resident Fish and Aquatic Life is the most sensitive beneficial use. Table 3-2. Beneficial uses occurring in the Lost River Subbasin (OAR 350 – 41 – 0180(1))
Beneficial Use Occurrin
g Beneficial Use Occurring
Public Domestic Water Supply
Salmonid Fish Spawning
(Trout)
Private Domestic Water Supply
Salmonid Fish Rearing
(Trout)

Upper Klamath and Lost River Subbasins TMDL
State of Oregon Department of Environmental Quality 96
Industrial Water Supply Resident Fish and Aquatic
Life
Irrigation Wildlife and Hunting
Livestock Watering Fishing
Boating Water Contact Recreation
Hydro Power Aesthetic Quality
Commercial Navigation and Transportation
Water quality problems are of great concern because of their potential impact on native fish populations in the Klamath basin including the Shortnose sucker (Chasmistes brevirostris), Lost River sucker (Deltistes luxatus), and interior redband trout (Oncorhynchus mykiss ssp.). Both sucker species were listed as endangered under the Endangered Species Act in 1988, and water quality degradation has been identified as a probable major factor in their declines. Populations of listed sucker species in the main stem of the Lost River, and Tule Lake are small and consist primarily of adults. Suckers have been eliminated entirely from the middle portion of the main stem of the Lost River and Lower Klamath Lake (NRC 2004).
3.3.2 Water Quality Standard Identification
3.3.2.1 Dissolved Oxygen Water Quality Standard OAR 340-041-0016(1)(c)
For water bodies identified by the Department as providing cool-water aquatic life, the dissolved oxygen may not be less than 6.5 mg/l as an absolute minimum. At the discretion of the Department, when the Department determines that adequate information exists, the dissolved oxygen may not fall below 6.5 mg/l as a 30-day mean minimum, 5.0 mg/l as a seven-day minimum mean, and may not fall below 4.0 mg/l as an absolute minimum (Table 21);
3.3.2.2 pH Standard OAR 340-041-0185 (1): pH (hydrogen ion concentration). pH values may not fall outside the following ranges:
(a) Fresh waters except Cascade lakes: pH values may not fall outside the range of 6.5-9.0. When greater than 25 percent of ambient measurements taken between June and September are greater than pH 8.7, and as resources are available according to priorities set by the Department, the Department will determine whether the values higher than 8.7 are anthropogenic or natural in origin;
(b) Cascade lakes above 5,000 feet altitude: pH values may not fall outside the range of 6.0 to 8.5.
OAR 340-041-0021 (2): Water impounded by dams existing on January 1, 1996, which have pHs that exceed the criteria are not in violation of the standard, if the Department determines that the exceedance would not occur without the impoundment and that all practicable measures have been taken to bring the pH in the impounded waters into compliance with the criteria. 3.3.2.3 Nuisance Phytoplankton Growth OAR 340-041-0019(1): The following values and implementation program must be applied to lakes, reservoirs, estuaries and streams, except for ponds and reservoirs less than ten acres in surface area, marshes and saline lakes:

Upper Klamath and Lost River Subbasins TMDL
State of Oregon Department of Environmental Quality 97
(a) The following average Chlorophyll a values must be used to identify water bodies where phytoplankton may impair the recognized beneficial uses:
(B) Natural lakes that do not thermally stratify, reservoirs, rivers and estuaries: 0.015 mg/l;
3.3.2.4 Ammonia Toxicity
The Environmental Quality Commission adopted a new toxic substances rule on May 29th, 2004. EPA has approved of the new rule and the TMDL has been updated from its previous version to reflect the approval. The information concerning the analysis and information included in the TMDL can be found in Appendix I. OAR 340-041-033 (2): Levels of toxic substances may not exceed the criteria listed in Table 20. Table 20 states that the ammonia criteria are pH and temperature dependent and refers to “Document USEPA January 1985 (Fresh water)”and are published in Quality Criteria for Water (US EPA 1986).
3.4 Deviation from Water Quality Standard Section 303(d) of the Federal Clean Water Act (1972) requires that water bodies that violate water quality standards, thereby failing to fully protect beneficial uses, be identified and placed on a 303(d) list. Waterbodies in the Lost River Subbasin within Oregon (Figure 3-3) have been put on the 2004 303(d) list (Table 3-3) for pH, dissolved oxygen, ammonia toxicity and chlorophyll-a impairments. For specific information regarding Oregon’s 303(d) listing procedures, and to obtain more information regarding the 303(d) listed streams, visit the Department of Environmental Quality’s web page at http://www.deq.state.or.us/. Table 3-3. Lost River Subbasin 303(d) list for 2010.
Waterbody Name Record
ID(s) River Mile
Parameter Period
Lost River 21087, 2015
4.8-65 Dissolved Oxygen Year round
Lost River 2029, 2032 4.8-65 Chlorophyll-a Summer
Lost River 14826 4.8-65 Ammonia Toxicity Year Round
Lost River Reservoir 2097 25.4-27.6 pH Summer
Klamath Straits Drain 21949 0 Dissolved oxygen Year Round
Klamath Straits Drain 21952 0 Ammonia Toxicity Year Round
Klamath Straits Drain 2027 0 Chlorophyll-a Summer
Longitudinal box plots (see Chapter 1 for explanation of box-plots) from Malone Dam to the outlet at Klamath Straits Drain, show that the Lost River is impaired by low dissolved oxygen and shows a general worsening of conditions in the downstream direction (Figure 3-4). pH impairment appears to be limited to downstream of Anderson Rose Dam with the consistently elevated values occurring in Tule Lake (Figure 3-5). Because the ammonia toxicity criteria depend on temperature and pH, a longitudinal plot of current conditions could not be displayed. Total ammonia concentrations tended to increase in the downstream direction (Figure 3-6). Ammonia toxicity is expected to be most critical in Klamath Straits Drain given the higher pH concentrations and higher ammonia concentrations.
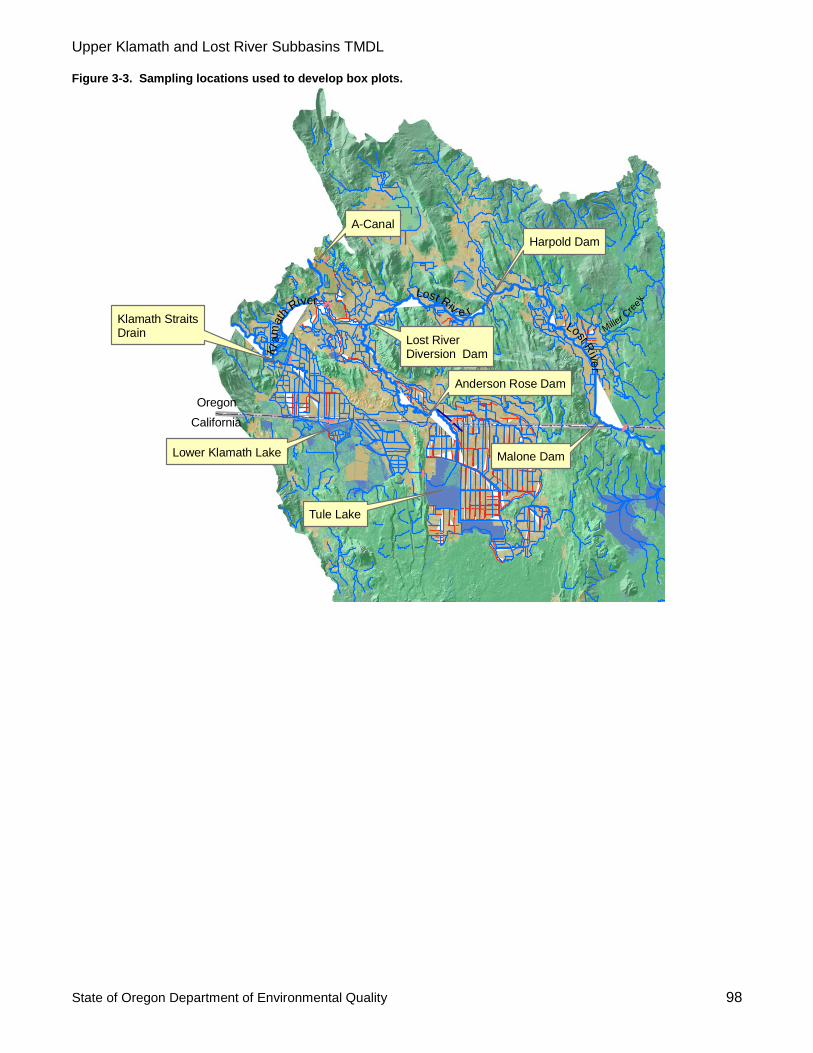
Upper Klamath and Lost River Subbasins TMDL
State of Oregon Department of Environmental Quality 98
Figure 3-3. Sampling locations used to develop box plots.
Malone Dam
Harpold Dam
Tule Lake
Anderson Rose Dam
A-Canal
Oregon
California
Klamath StraitsDrain
Lost Rive r
Kl
am
ath
River
Lost RiverDiversion Dam
Lost Riv
er
Lower Klamath Lake
Miller C
ree
k
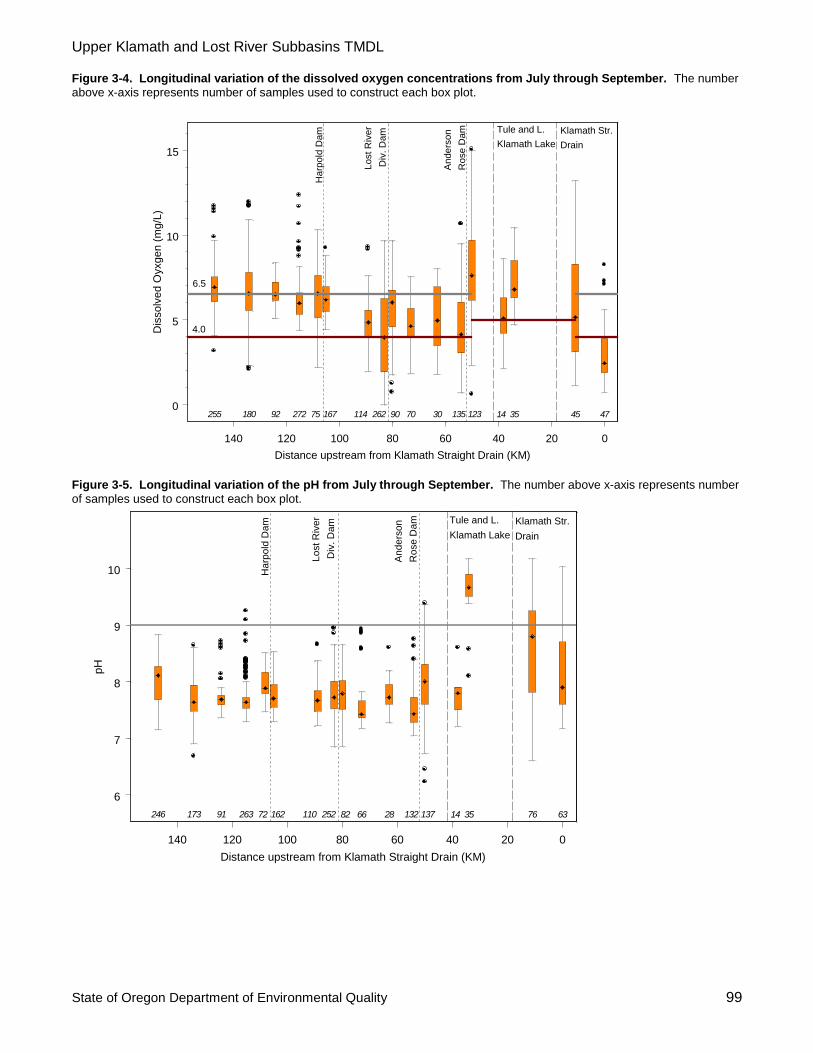
Upper Klamath and Lost River Subbasins TMDL
State of Oregon Department of Environmental Quality 99
Figure 3-4. Longitudinal variation of the dissolved oxygen concentrations from July through September. The number
above x-axis represents number of samples used to construct each box plot.
Figure 3-5. Longitudinal variation of the pH from July through September. The number above x-axis represents number
of samples used to construct each box plot.
Ande
rson
Rose D
am
Lost R
iver
Div
. D
am
140 120 100 80 60 40 20 0
Distance upstream from Klamath Straight Drain (KM)
0
5
10
15D
issolv
ed O
yxgen (
mg/L
)
Mainstem of Lost River Drainage System(July, August, and September)
Harp
old
Dam Tule and L.
Klamath Lake
Klamath Str.
Drain
4.0
474535141231353070902621141677527292180255
6.5
Ande
rson
Rose D
am
Lost R
ive
r
Div
. D
am
140 120 100 80 60 40 20 0
Distance upstream from Klamath Straight Drain (KM)
6
7
8
9
10
pH
Mainstem of Lost River Drainage System(July, August, and September)
Harp
old
Dam Tule and L.
Klamath Lake
Klamath Str.
Drain
637635141371322866822521101627226391173246

Upper Klamath and Lost River Subbasins TMDL
State of Oregon Department of Environmental Quality 100
Figure 3-6. Longitudinal variation of the ammonia as nitrogen from July through September. Number above x-axis
represents number of samples used to construct each box plot. Outliers at kilometer 20 (5.6 mg/L) and kilometer 0 (11.3 mg/L) are greater than the plotted y-axis.
3.5 Seasonal Variation - CWA §303(d)(1) Critical levels of dissolved oxygen, pH and ammonia occur predominately during the summer, from June through September. Because Klamath Straits Drain is the most impaired, regularly-sampled monitoring location, it was chosen to show the seasonal variation. Although July and August appear to be the most impaired months for dissolved oxygen, minimum values have been measured which are less than the criteria between May and November (Figure 3-7). Exceedances of the pH standard are more frequent between June and September (Figure 3-8). Seasonal excursions in ammonia toxicity (Figure 3-9) increase in the spring with greater than 25% exceedance in the summer period.
140 120 100 80 60 40 20 0
0.0
0.5
1.0
1.5
Am
mo
nia
as N
(mg
/L)
20 1 13 13 3 13 8 30 12 18 23 38 2 26 47 79
Mainstem of Lost River Drainage System
Distance upstream from Klamath Straight Drain Outlet (KM)
(July, August and September)
5.6
Lost River
Tule and L.
Klamath Lk.
Klamath Str.
Drain11.3
Ha
rpo
ld D
am
Lo
st R
. D
iv. D
am
An
de
rso
n R
ose
Da
m

Upper Klamath and Lost River Subbasins TMDL
State of Oregon Department of Environmental Quality 101
Figure 3-7. Dissolved Oxygen Seasonal Excursions Frequencies below Water Quality Standards, Klamath Straits Drain at Highway 97 (1995 – 2004). The number above the x-axis represents the number of data points used to construct
each box plot.
Figure 3-8. pH Seasonal Excursions Frequencies above Water Quality Standards, Klamath Straits Drain at Highway 97 (1995 – 2004). The number above the x-axis represents the number of data points used to construct each box plot.
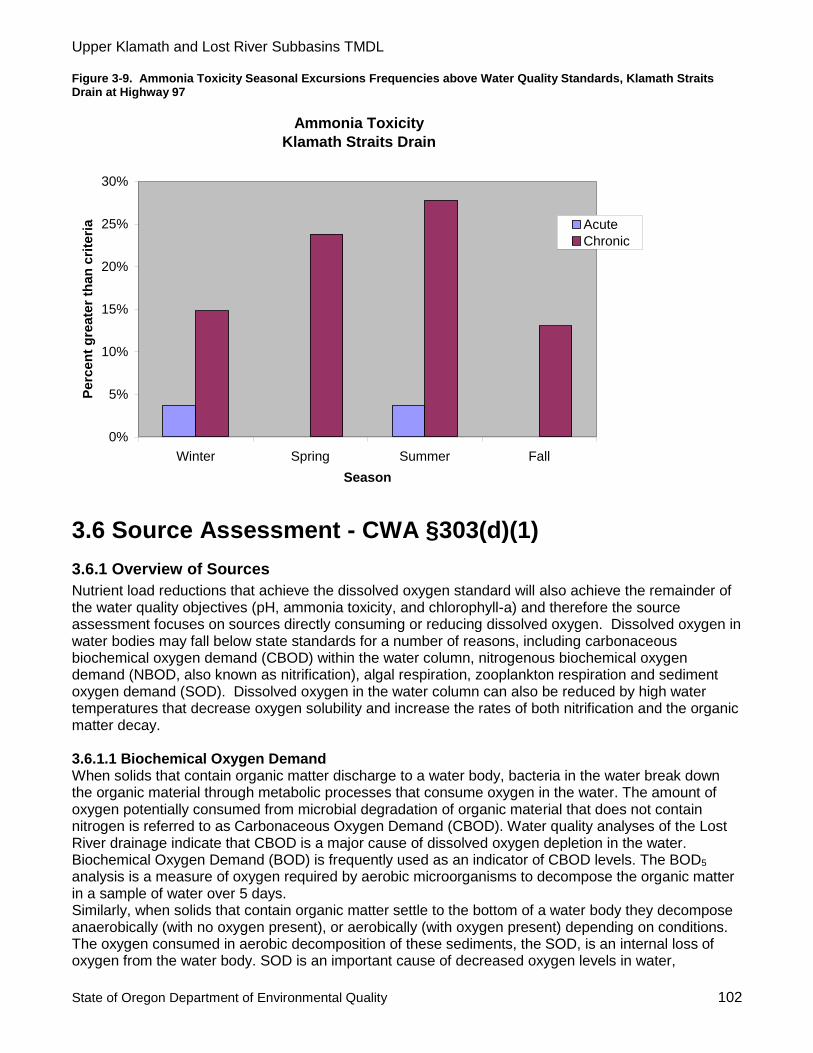
Upper Klamath and Lost River Subbasins TMDL
State of Oregon Department of Environmental Quality 102
Figure 3-9. Ammonia Toxicity Seasonal Excursions Frequencies above Water Quality Standards, Klamath Straits Drain at Highway 97
3.6 Source Assessment - CWA §303(d)(1)
3.6.1 Overview of Sources
Nutrient load reductions that achieve the dissolved oxygen standard will also achieve the remainder of the water quality objectives (pH, ammonia toxicity, and chlorophyll-a) and therefore the source assessment focuses on sources directly consuming or reducing dissolved oxygen. Dissolved oxygen in water bodies may fall below state standards for a number of reasons, including carbonaceous biochemical oxygen demand (CBOD) within the water column, nitrogenous biochemical oxygen demand (NBOD, also known as nitrification), algal respiration, zooplankton respiration and sediment oxygen demand (SOD). Dissolved oxygen in the water column can also be reduced by high water temperatures that decrease oxygen solubility and increase the rates of both nitrification and the organic matter decay. 3.6.1.1 Biochemical Oxygen Demand When solids that contain organic matter discharge to a water body, bacteria in the water break down the organic material through metabolic processes that consume oxygen in the water. The amount of oxygen potentially consumed from microbial degradation of organic material that does not contain nitrogen is referred to as Carbonaceous Oxygen Demand (CBOD). Water quality analyses of the Lost River drainage indicate that CBOD is a major cause of dissolved oxygen depletion in the water. Biochemical Oxygen Demand (BOD) is frequently used as an indicator of CBOD levels. The BOD5 analysis is a measure of oxygen required by aerobic microorganisms to decompose the organic matter in a sample of water over 5 days. Similarly, when solids that contain organic matter settle to the bottom of a water body they decompose anaerobically (with no oxygen present), or aerobically (with oxygen present) depending on conditions. The oxygen consumed in aerobic decomposition of these sediments, the SOD, is an internal loss of oxygen from the water body. SOD is an important cause of decreased oxygen levels in water,
Ammonia Toxicity
Klamath Straits Drain
0%
5%
10%
15%
20%
25%
30%
Winter Spring Summer Fall
Season
Perc
en
t g
rea
ter
tha
n c
rite
ria Acute
Chronic

Upper Klamath and Lost River Subbasins TMDL
State of Oregon Department of Environmental Quality 103
particularly in impoundments where water velocities are low. The SOD can continue to reduce DO for a long period after the pollution discharge ceases (i.e., organic-containing sediment deposited as a result of rain-driven runoff may remain a problem long after the rain event has passed). In contrast, carbonaceous biochemical oxygen demand (CBOD) and nitrification processes are typically short-term, responding to algal and bacterial population dynamics. External sources of organic sediments include runoff from farms, rangeland, forest, and urban lands. Internal sources include dead and dying aquatic plants and algae. It is not feasible to quantify the organic sediment sources for this project given the complexity of the Lost River. Control of the sources which deliver nitrogen and CBOD to the Lost River drainage will also reduce the loading of settable organics. 3.6.1.2 Nutrients Nutrient loading, specifically phosphorus and nitrogen, encourages algae growth. The preferred forms are inorganic phosphorus (measured as dissolved orthophosphate as P or soluble reactive phosphorus) and ammonia, nitrite, and nitrate, respectively. There are number of natural processes that add nutrients to the river: leaching from the soil, degradation of plant material, and fish returning to spawn from the ocean. As the algae grow, they consume phosphorus and nitrogen. As algae respire and die, nutrients are released back into the river. Algae consume nitrogen and phosphorus at a fixed ratio. Therefore, if one nutrient is in short supply, it will limit the growth of algae regardless of the concentration of the other nutrient. Analysis of available data indicates that nitrogen is the nutrient most limiting growth in the Lost River (Figure 3-10). The horizontal line in Figure 10 represents a ratio of 7 where points above this line indicate possible phosphorus limitation and points below this line indicate possible nitrogen limitation (Tanner and Anderson 1996). The growth of attached algae and free-floating algae (phytoplankton) can also be limited by light, temperature and the availability of suitable substrate. High consumption of oxygen by algae and plants can have several effects. At nighttime, algal biomass can consume high levels of oxygen, causing or contributing to nocturnal sags in oxygen levels. Similarly, bacteria can consume high levels of oxygen as excess plant material decays. The reduced levels of oxygen remaining in the water can cause chronic problems.

Upper Klamath and Lost River Subbasins TMDL
State of Oregon Department of Environmental Quality 104
Figure 3-10. Longitudinal plot of the ratio of dissolved inorganic nitrogen (DIN) to soluble reactive phosphorus (SRP), July through September. A ratio of 7 where points above this line indicate possible phosphorus limitation and points below this line indicate possible nitrogen limitation.
In water bodies, nitrogen is found in several compounds including ammonia (NH3), nitrate (NO3
-), nitrite (NO2
-), dissolved organic nitrogen (DON), and particulate organic nitrogen (PON). At appropriate levels, nitrogen-containing compounds are needed as part of a healthy aquatic food web, but excessive fertilization of a water body with nitrogen can cause excess plant and algal growth. The major sources of nitrogen in water are municipal and industrial wastewater, stormwater, failing septic systems, animal waste runoff and fertilized fields and lawns. Delivery of nitrogen to the Lost River can occur through tributaries, canals, drains and shallow and deep groundwater. Nitrogen loading quantified by input is presented in Section 3.9: Allocations. A water quality study in the Tule Lake irrigation district by the University of California Davis concluded : “The differences in water quality between tiles and drainage ditches suggest that the ditches and water management infrastructure itself has a role in regulating nutrient transfers and can contribute nutrients (especially TP – total phosphorus) to the system: from internal hydrologic cycles present in the ditches and canals, from agitation of sediments, from the death and decay of aquatic plants, from N fixation by blue green algae, and from N fixation of sediments due to pumping and transfer of water” (Danosky and Kaffka 2002). These results are consistent with a water quality investigation by USGS in the Yakima basin (McCarthy and Johnson, 2009). The water quality investigation indicated that combining irrigation and artificial-drainage networks may exacerbate the ecological effects of agricultural runoff by increasing direct connectivity between fields and streams and minimizing potentially mitigating effects of longer subsurface pathways such as denitrification and dilution.
Generally, nutrients (phosphorus and nitrogen) and BOD concentrations increase downstream from the mainstem of the Lost River to the Klamath Straits drain (Figure 3-11, Figure 3-12, and Figure 3-13). Figures 3-11 to 3-13 present data collected from 1995 to 2004 during July, August or September. The orange boxes represent stations within the Lost River system while blue boxes represent possible

Upper Klamath and Lost River Subbasins TMDL
State of Oregon Department of Environmental Quality 105
inputs into the Lost River system at the approximate location where water may be supplied. Sites that are close together and thought to be similar in terms of land use and hydrology were combined. A blue diamond with an ‘X’ indicates that there is a value that was not plotted because it was greater than the y-axis scale. The finer dashed vertical lines indicate impoundments in Oregon and the thicker dashed lines indicate the approximate location of the Oregon / California border. As shown in Figure 3-11 to 3-13, levels of nitrogen, phosphorus and BOD tend to be greater in Klamath Straits Drain than in waters received from the Upper Klamath Lake or Klamath River. Figure 3-11. Total nitrogen concentrations measured in the Lost River, July through September. The number above
the x-axis represents the number of data points used to construct each box plot.
Figure 3-12. Total phosphorus concentrations measured in the Lost River system July through September. The
number above the x-axis represents the number of data points used to construct each box plot.

Upper Klamath and Lost River Subbasins TMDL
State of Oregon Department of Environmental Quality 106
Figure 3-13. BOD concentrations measured in the Lost River system, July through September. The number above the
x-axis represents the number of data points used to construct each box plot.
Nitrogen moves among the atmosphere, soil, water, and organisms in the nitrogen cycle. This cycle consists of
five processes: nitrogen fixation, mineralization, nitrification, immobilization, and denitrification (Table 3-44).
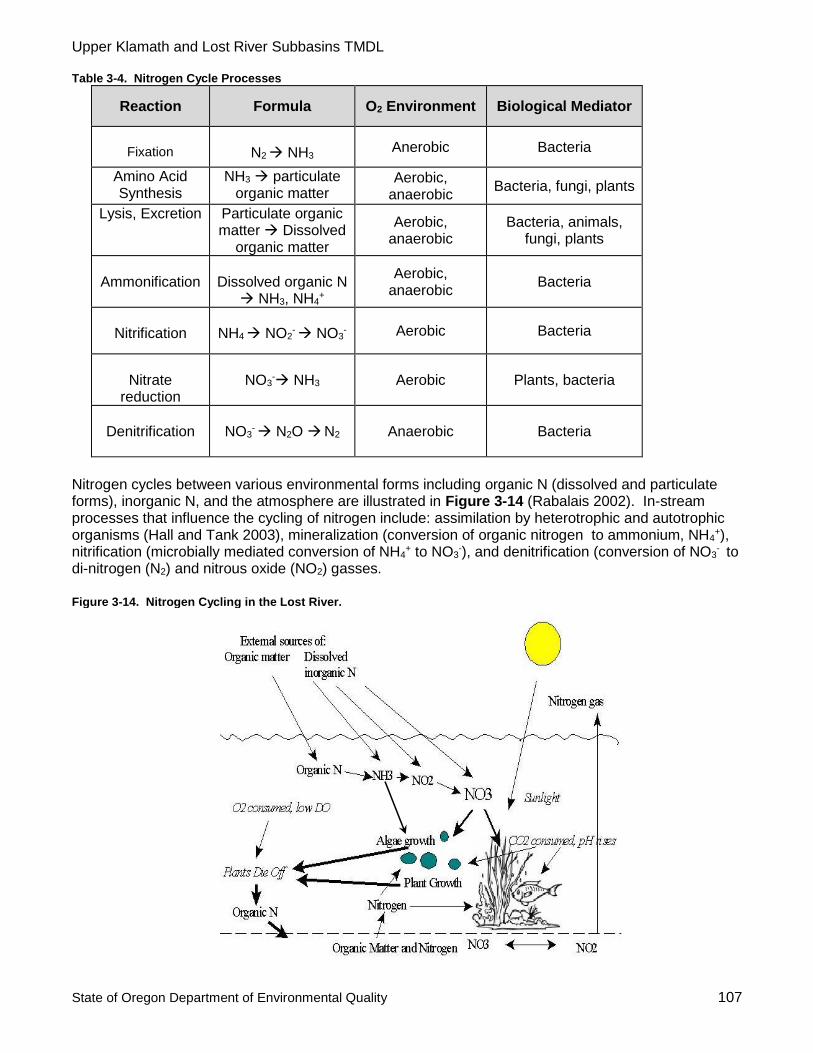
Upper Klamath and Lost River Subbasins TMDL
State of Oregon Department of Environmental Quality 107
Table 3-4. Nitrogen Cycle Processes
Reaction Formula O2 Environment Biological Mediator
Fixation
N2 NH3 Anerobic Bacteria
Amino Acid Synthesis
NH3 particulate organic matter
Aerobic, anaerobic
Bacteria, fungi, plants
Lysis, Excretion Particulate organic matter Dissolved
organic matter
Aerobic, anaerobic
Bacteria, animals, fungi, plants
Ammonification
Dissolved organic N
NH3, NH4+
Aerobic, anaerobic
Bacteria
Nitrification
NH4 NO2
- NO3
- Aerobic Bacteria
Nitrate
reduction
NO3
- NH3 Aerobic Plants, bacteria
Denitrification
NO3
- N2O N2
Anaerobic Bacteria
Nitrogen cycles between various environmental forms including organic N (dissolved and particulate forms), inorganic N, and the atmosphere are illustrated in Figure 3-14 (Rabalais 2002). In-stream processes that influence the cycling of nitrogen include: assimilation by heterotrophic and autotrophic organisms (Hall and Tank 2003), mineralization (conversion of organic nitrogen to ammonium, NH4
+), nitrification (microbially mediated conversion of NH4
+ to NO3-), and denitrification (conversion of NO3
- to di-nitrogen (N2) and nitrous oxide (NO2) gasses.
Figure 3-14. Nitrogen Cycling in the Lost River.
Upper Klamath and Lost River Subbasins TMDL
State of Oregon Department of Environmental Quality 108
Nitrification can be greater within agriculturally influenced streams and is expected to increase as a function of NH4
+ concentration. Denitrification rate can also increase with the concentration of NO3- in
agriculturally influenced systems (Mulholland et al. 2008). Soil nitrate remains soluble in aqueous solutions and available for plant root uptake. Consequently, nitrate is the most important form of nitrogen in terms of agriculture. However, because nitrate is readily water-soluble, it is subject to high rates of leaching out of the soil and into groundwater and streams. Aquatic plants take up nitrogen in the form of dissolved inorganic nitrogen (nitrate, nitrite and ammonia). Available data indicate that a significant amount of nitrogen in the Lost River system is in particulate (organic) form. Mineralization and nitrification processes decompose nitrogen to release dissolved inorganic nitrogen (DIN). DIN, composed of nitrate, nitrite and ammonia, is the form of nitrogen most bioavailable to aquatic plants and algae. These TMDLs focus on controlling dissolved inorganic nitrogen. Although particulate forms of nitrogen and phosphorus might be less important influences on growth of aquatic plants, these TMDLs indirectly account for particulate nutrients by also targeting excess loads of organic materials that could contain particulate nutrients. 3.6.1.2 Point Sources There are two facilities with active individual permits to discharge effluent under the National Pollutant Discharge Elimination System (NPDES) to the Lost River or tributaries: Henley School and Klamath Irrigation District. Henley School discharges treated domestic and spent geothermal effluent to a ditch that discharges to the Lost River at river mile 25. The limits on the effluent restricted BOD loading to a monthly average 5.3 pounds per day between May and October and 8 pounds per day the remainder of the year. The approximate 1 mton of annual BOD loading is very small portion (<0.1 %) of the annual loading capacity of the Lost River. As described i9n the Henley School permit, the facility shall terminate discharge of treated sewage by no later than 5 years after the TMDL. Henley School received a grant in 2010 to pipe their sanitary treated wastewater to South Suburban Sanitary District and re-inject their geothermal water in compliance with a general permit. Klamath Irrigation District has a permit to use herbicide in their irrigation system and is not associated with the pollutants in this TMDL. At the time of writing, there are 19 facilities that discharge to the Klamath River or tributaries with general NPDES permits: 1 industrial discharge, 5 stormwater discharges from industrial facilities and 13 stormwater discharges from construction sites (see http://www.deq.state.or.us/wq/sisdata/sisdata.asp). Given the type of impairments (pH, ammonia toxicity, DO and temperature), the relatively small size of the discharges compared to individual NPDES permits and the controls required through the existing permits, these facilities are not likely to cause significant water quality impairment. Additionally, most of the general permits are for stormwater and the critical water quality condition occurs during the summer, dry period. Therefore, it is unlikely that sources with general permits are causing significant pollutant loading relative to other source categories as storm events leading to a flow scenario are extremely rare in the critical period.
3.6.3 Analysis - Water Quality Modeling
In order to support TMDL development for the Lost River system, the U.S. Army Corps of Engineers’ CE-QUAL-W2 (W2) model was used to represent the Lost River system from Malone Dam through the Lower Klamath Lake, as well as the Klamath Straits Drain. W2 is a two-dimensional, longitudinal/vertical (laterally averaged), hydrodynamic and water quality model (Cole and Wells 2003). Complete documentation of modeling configuration, model input, and calibration is presented in Appendix F, Model Configuration and Results Lost River Model for TMDL Development (Tetra Tech 2005).

Upper Klamath and Lost River Subbasins TMDL
State of Oregon Department of Environmental Quality 109
3.6.3.1 Model Configuration For this modeling study, the Lost River drainage was divided into 12 waterbodies based on the presence of major hydraulic features and the location of monitoring data in the system (Table 3-5 and Figure 3-15). Within the W2 model, each computational segment can have multiple layers associated with it. The number of vertical layers varied for each of the modeling waterbodies from 2 to 5 layers. For this study, layer thicknesses were set to approximately 1 meter (and ranged from 0.84 meters to 1.15 meters) for the 12 waterbodies (Table 3-5). Layers1111111111 Table 3-5. Model Configuration
Waterbody Number
Location Number of Segments
Segment Length
(m)
Number of
Layers
Thickness of
Layers (m)
1 Malone to Harpold 80 483 5 1.0
2 Harpold to RM 27 10 489.7 4 0.96
3 RM 27 to Wilson Reservoir
30 505.3 4 0.84
4 Wilson Reservoir 9 506.4 5 1.0
5 Wilson Dam to Anderson Rose Dam
55 534.5 5 1.0
6 Anderson Rose Dam to Tule Lake
24 502.9 4 1.0
7 Tule Lake 1 8008.0 2 1.0
8 P-Canal 8 502.6 3 1.0
9 Lower Klamath Lake
1 11898 2 1.0
10 Klamath Straits Drain at Pump E
13 507.2 5 1.15
11 Klamath Straits Drain at Pump F
15 538.1 5 0.93
12 Klamath Straits Drain D/S Pump F
6 503.2 5 0.93
Layer Thickness (m)

Upper Klamath and Lost River Subbasins TMDL
State of Oregon Department of Environmental Quality 110
Figure 3-15. Model Configuration.
3.6.3.2 Model Boundary Conditions and Linkages To run the dynamic W2 model, external forcing factors, known as boundary conditions, and internal linkages must be specified for the system. These forcing factors are a critical component in the modeling process and have direct implications on the quality of the model’s predictions. External factors include a wide range of dynamic information:
• Upstream external inflows, temperature, and constituent boundary conditions (US); • Tributary inflows, temperature, and constituent boundary conditions (TRIB); • Distributed tributary inflows, temperature, and constituent boundary conditions (DST); • Withdrawals (WD); and • Atmospheric conditions (including wind, air temperature, solar radiation).
Upstream external inflows represent the inflow at the model’s “starting” point. Tributary inflows represent the major tributaries that feed into the Lost River. Distributed tributary inflows represent the combination of all diffuse contributions to each of the waterbodies (i.e., anything that is not considered a major tributary inflow, such as irrigation return flow). All water removed from the system is combined within the Withdrawals category. The US, TRIB, DST, and WD boundary conditions are specified for the Lost River model based on all available data (Figure 3-16). Modeled internal, boundary condition linkages include:
• Downstream weir-based boundary conditions (DSW); • Upstream internal flow, temperature and constituent boundary conditions (USIFB); • Downstream internal head boundary conditions (DSIH); and • Upstream internal head boundary conditions (USIH).

Upper Klamath and Lost River Subbasins TMDL
State of Oregon Department of Environmental Quality 111
Figure 3-16. Model Boundary Conditions and Linkages.
Yellow circles represent waterbody divisions. Blue arrows represent tributary (TRIB) and upstream (US) inputs. Red arrows represent distributed (DST) inputs. Green arrows represent withdrawals (WDs).
3.6.3.3 Modeling Assumptions All mathematical water quality models are a representation of the real world. The Lost River system is a highly modified environmental system driven largely by irrigation operations, and it exhibits tremendous biological activity. Because of the limited quantitative data to describe aspects of the system, several key assumptions were made during model development. The following key assumptions are associated with the Lost River model development:
Un-gauged inflows and outflows can be estimated using a water balance that is based on measured flows, inflows, and outflows.
Where quantitative data were unavailable for characterizing agricultural pumping, return flow, and other unknown sources and sinks, it was assumed that the water quality associated with these distributed flows is similar to the water quality in the Lost River where the distributed flow discharges.
One phytoplankton species and one macrophyte species are sufficient for representing the overall primary production and nutrient interactions in the system.
The horizontal water quality gradients within Tule Lake and Lower Klamath Lake are insignificant; therefore, each can be considered as a single, mixed segment.
Modeling assumptions and limitations are specified in the document Lost River Model for TMDL Development (Tetra Tech 2005), presented in Appendix E.
Malone Dam
TRIB
(Miller Creek)
TR
IB (
Big
Sp
ring
s)
TR
IB (
Bu
ck
Cre
ek)
WD
(Harpold Dam)
Harp
old
Dam
TRIB (F1 Canal)
WD (Lost River Diversion Channel)
WD (J Canal)
Tule Lake
and Sump
DST
P Canal Lower
Klamath
Lake
TRIB (ADY Canal)
Kla
ma
th R
ive
r
A Canal
(represented
through DSTs)
Upper
Klamath
Lake
Klamath Straits
DrainDST
Wilson Dam
US
DST
TR
IB (
E C
an
al)
DST
DST
DST
Anderson-Rose
Dam
TRIB (Station 48 Turnout)
TRIB (Drain 1)
TRIB (Drain 5)
DST
DST
DST
DST
DST
Lost River
Diversion Channel
(represented
through TRIBs)
DST
TRIB (Merrill STP)
Lost River

Upper Klamath and Lost River Subbasins TMDL
State of Oregon Department of Environmental Quality 112
3.6.3.4 Model Uncertainty The Lost River model can be used to represent the overall water quality trends in response to external loading and internal system dynamics. The model is also capable of evaluating loading and water quality response and is appropriate to use to develop the TMDL. Model uncertainties were minimized to the extent possible in this effort, and thus the model reproduced general trends in the observed data well, both temporally and spatially. Further reduction of uncertainty is possible through collection of more systematic and accurate data within and external to the system and a more in-depth scientific understanding of the physical, chemical, and biological processes occurring in this unique system. A complete description of model assumptions and limitations is provided in Appendix E. Some of the major sources of uncertainty include the following:
Uncertainty Associated with Boundary Conditions. Boundary conditions for the Lost River model include time series flow, temperature, water quality, and atmospheric conditions. They provide the driving force for the hydrodynamic and water quality simulations. Therefore, accurate definition of boundary conditions is critical to reducing uncertainty. In developing the Lost River model, boundary conditions were defined using available monitoring data or were derived using different techniques (e.g. interpolation). Data were not available for all boundary conditions; where data were available, they often did not comprise a complete time series. Interpolation was used to fill in gaps in temporal data.
Uncertainty in Spatial Representation. The governing partial differential equations of hydrodynamic and water quality models were solved using the finite difference method (FDM) in CE-QUAL-W2. For both FDM, the waterbodies needed to be discretized into different computational cells or nodes on the basis of topographical data. The accuracy in representing the true bathymetry of a waterbody had a significant effect on model performance. Thus, uncertainty associated with the data sets used to discretize the waterbodies in the Lost River drainage had a direct effect on the model’s predictive capabilities. Additionally, all the impoundments were represented with a laterally averaged system.
Uncertainty in Process Representation. Water quality predictions for the Lost River drainage involved representing numerous dynamic interactions (including many physical, chemical, and biological processes). Mathematical models offer a representation of these processes. The current modeling effort took full advantage of all information amassed and understood to date. Model assumptions associated that could have introduced uncertainty include representing the entire phytoplankton community as a single algae group, representing the entire periphyton community as a single periphyton group, representing SOD using a zero-order formulation (i.e.constant rate with no decay), and representing OM with four components based on solubility and degradability.
Uncertainty in Kinetic Structures. The dynamic model CE-QUAL-W2 represents major water quality transformations with first-order kinetics. These kinetics are widely tested and accepted with regard to reasonably representing the dynamic interaction between water quality constituents.
3.6.3.5 Model Source Assessment The water quality model provides the framework for a quantified source assessment and pollutant loading vs. water quality response analysis. The water quality model demonstrated that the hypothesis of nitrogen limitation of aquatic plants and algae was consistent with observed water quality conditions. In addition, the model demonstrated that algae growth and respiration and observed BOD were not sufficient to cause the DO deficits observed. This supports the concept that SOD is an important factor in determining DO concentrations in the Lost River. The model was also able to demonstrate that water quality conditions in the Lost River are heavily dependent on the conditions of the nearby inputs to the system.

Upper Klamath and Lost River Subbasins TMDL
State of Oregon Department of Environmental Quality 113
Consistent with the findings of Mayer (2005), the Lost River model demonstrated that Tule Lake and the Lower Klamath Refuge in California are nutrient sinks. In the Lost River TMDL model, approximately 70 percent of inorganic nitrogen was retained by Tule Lake and the Lower Klamath Refuge (Table 4-1, Nitrogen and CBOD TMDLs for the Lost River, USEPA 2008). The Lost River model indicated that nutrient loads and associated flows are greater at the A-Canal head gate when compared to nutrient loads discharging from Klamath Straits Drain. However, this apparent reduction in loads and associated water quantity is an artifact of various processes including evaporation, agronomic consumption, nutrient uptake by plants in the two wildlife refuges and settling of organic material in non-riverine segments of the irrigation project.
3.7 Water Quality Standard Attainment Analysis – CWA §303(d)(1)
The calibrated hydrodynamic and water quality model CE-QUAL-W2 presented in Section 3.6 was used to evaluate attainment of water quality standards for the Lost River, Tule Lake, Lower Klamath Lake and Klamath Straits Drain (Table 3-6). Modeling results (Appendix E) indicate that the DO criteria were the most stringent criteria. Consequently, if the dissolved oxygen criteria are met in the system, then the water quality criteria for pH, ammonia toxicity, and chlorophyll-a will also be attained. Source loading was iteratively reduced until water quality criteria were achieved in the non-impounded sections of the Lost River as shown in Figures 3-17 to 3-24. Table 3-6. Water Quality Criteria Evaluated for Attainment Analysis
Parameter Oregon Criteria
Dissolved Oxygen
4.0 mg/l as an absolute minimum
6.5 mg/l as a 30-day mean minimum
5.0 mg/l as a 7-day minimum mean
Ammonia
See Table 20, OAR 340-41-0033(2)
pH
pH values may not fall outside the range of 6.5-9.0
Chlorophyll-a
<0.015 mg/L
Following reduction of source loading to attain water quality standards in the non-impounded segments of the Lost River, the model predicts a number of the water quality criteria were exceeded under the TMDL scenario due to model and boundary condition uncertainty. Ammonia toxicity model predictions were found to exceed limits in the spring downstream of Wilson Reservoir and upstream of Tule Lake. These high values are an artifact of the model construction which was based on sparse data during the spring and are not believed to be representative of actual water quality conditions. A review of the monitoring data for this period indicates that there were no apparent ammonia toxicity issues. As with ammonia toxicity, the model predicts that pH exceeded criteria at a number of locations. The pH exceedances are largely attributed to background conditions which have high alkalinity concentrations. pH was not generally found to be sensitive to adjustments in nutrients, and thus was assumed not to be driven predominantly by biological processes. An exception being in the reaches upstream of Tule Lake. However, the predicted pH values during this period are not entirely reliable

Upper Klamath and Lost River Subbasins TMDL
State of Oregon Department of Environmental Quality 114
due to insufficient alkalinity data and no total inorganic carbon data to support boundary condition settings. Monitoring data for 1999 at these stations do not show pH exceedances. The model predicts that instantaneous chlorophyll-a concentrations exceed 15 ug/L in a number of locations. However, the 90-day averages, defined in the water quality standard as 3 samples collected over a consecutive 3 month period, do not exceed criteria () as. Figure 3-17. Dissolved Oxygen Standards Compliance – Harpold Dam (LRHD).

Upper Klamath and Lost River Subbasins TMDL
State of Oregon Department of Environmental Quality 115
Figure 3-18. Ammonia toxicity compliance – Harpold Dam (LRHD).
CCC refers to the calculated chronic criteria.
Figure 3-19. Chlorophyll-a standard (15μg/l) compliance – Harpold Dam (LRHD).
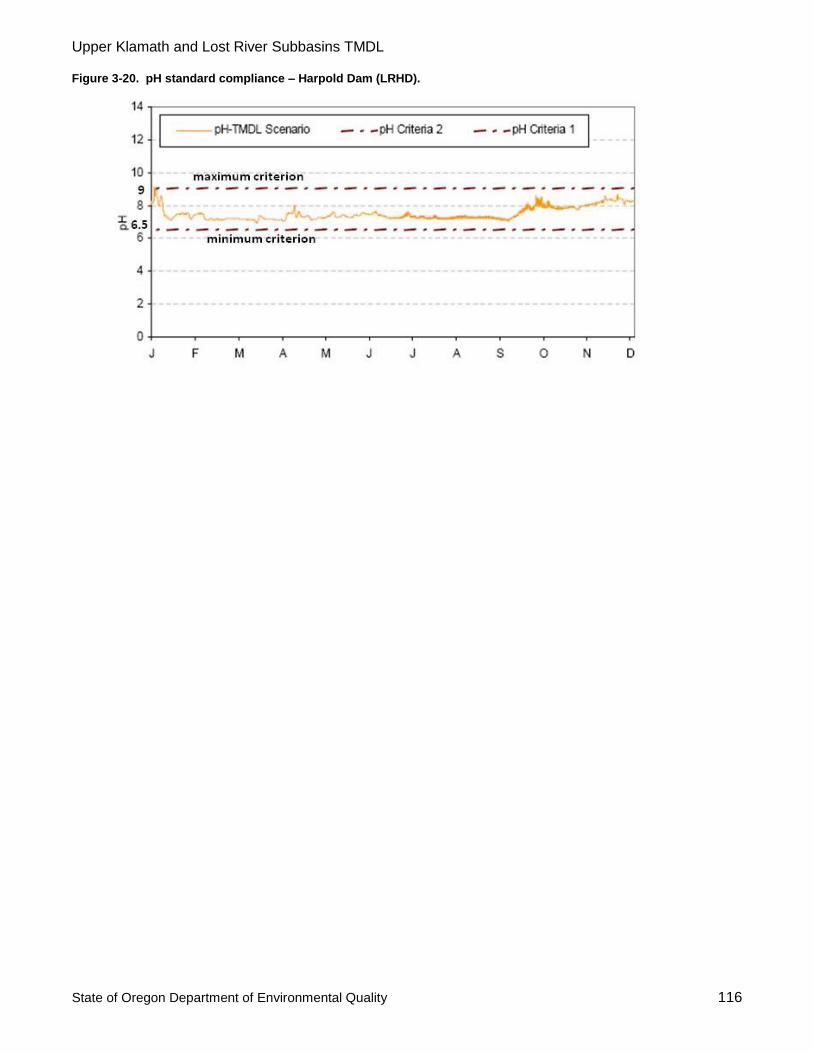
Upper Klamath and Lost River Subbasins TMDL
State of Oregon Department of Environmental Quality 116
Figure 3-20. pH standard compliance – Harpold Dam (LRHD).

Upper Klamath and Lost River Subbasins TMDL
State of Oregon Department of Environmental Quality 117
Figure 3-21. DO standard compliance – Stateline Road (LRSR).

Upper Klamath and Lost River Subbasins TMDL
State of Oregon Department of Environmental Quality 118
Figure 3-22. Ammonia toxicity standard compliance – Stateline Road (LRSR). CCC refers to the calculated chronic criteria or ammonia toxicity.
Figure 3-23. Chlorophyll-a standard compliance – Stateline Road (LRSR).
Ninety-day average chlorophyll-a concentrations did not exceed 15 ug/L criteria (instantaneous results presented.

Upper Klamath and Lost River Subbasins TMDL
State of Oregon Department of Environmental Quality 119
Figure 3-24. pH standard compliance – Stateline Road (LRSR).
Exceedances of the 9.0 criteria in the winter and spring are artifacts of the coarse nature of the model boundary conditions (see Section 3.6.3.4 Model Uncertainty).
3.7.1 Nutrient and CBOD Reduction Analysis
Analysis of water quality conditions using the calibrated model (Appendix E) indicate that Oregon’s water quality standards will be met under the following conditions:
Dissolved inorganic nitrogen (DIN) loading from distributed sources and tributaries (including the Lost River Diversion Canal in model segment #5) is reduced by approximately 50% (Table 3-7).
Carbonaceous biochemical oxygen demand (CBOD) boundary conditions are reduced by the same percentage as nitrogen loading. Sediment Oxygen Demand (SOD) is reduced by the same percentage as boundary condition reductions (e.g., 20% boundary condition reduction would result in a 20% SOD reduction).
In addition to reductions in DIN and CBOD loading, dissolved oxygen levels in Wilson, Anderson Rose and Klamath Straits Drain impoundments are increased to offset reduced assimilative capacity (Table 3-8).
Boundary condition DO maintained at Oregon’s DO criteria (6.5 mg/L, 30-day average).
Temperature of water from boundary conditions does not change.
The maximum algae concentration does not exceed Oregon’s standard, 15 ug/L.
Modeling analysis found that moderate reductions in nitrogen loads were effective in reducing excess algal growth and maintaining acceptable dissolved oxygen levels. In contrast, modeled reductions in phosphorus loads had little if any effect on plant and algal growth rates; therefore, these TMDLs focus on reducing nitrogen sources to address dissolved oxygen deficits.

Upper Klamath and Lost River Subbasins TMDL
State of Oregon Department of Environmental Quality 120
Table 3-7. Load Reduction for Water Quality Standards Attainment
Waterbody Number
Location Nitrogen
Reduction (%)
CBOD Reduction
(%)
1 Malone to Harpold 50 50
2 Harpold to RM 27 50 50
3 RM 27 to Wilson Reservoir 50 50
4 Wilson Reservoir 50 50
5 Wilson Dam to Anderson Rose Dam
50 50
6 Anderson Rose Dam to Tule Lake 50 50
7 Tule Lake 49 49
8 P-Canal 49 49
9 Lower Klamath Lake 49 49
10 -12 Klamath Straits Drain 49 49
The necessary DO increase shown in Table 3-8 is the difference between the DO criteria and the minimum modeled DO concentration, and it represents the greatest divergence from the DO criteria at any given time throughout the year. Table 3-8. Dissolved Oxygen Augmentation for Impoundments.
.Impoundment
Minimum Modeled DO
(mg/L)
DO Criteria (mg/L)
Necessary DO Increase (mg/L)
Min 30-day
7-day
Min 30-day
7-day
Min 30-day
7-day
Wilson Reservoir 0.87
2.62
1.12
4.00
6.50
5.00
3.13
3.88
3.88
Anderson Rose Impoundment
2.15
6.02
3.42
4.00
6.50
5.00
1.85
0.48
1.58
Klamath Straits Drain
5.23
5.96
5.47
4.00
6.50
5.00
N/A 0.54
N/A
3.8 Loading Capacity - 40 CFR 130.2(f) The loading capacity provides a reference for calculating the amount of pollutant reduction needed to bring water into compliance with water quality standards. EPA’s current regulation defines loading capacity as “the greatest amount of loading that a water can receive without violating water quality standards.” (40 CFR § 130.2(f)). The loading capacity (Table 3-9) estimated for purposes of this TMDL is comprised of two elements:
Dissolved inorganic nitrogen and C-BOD loading that is approximately 50% of current loading
Increased dissolved oxygen in the impoundments (Table 3-10). It is recognized that DO changes over time and that the “static” or “instantaneous” mass presented reflects a worst case DO condition and an average volume during the critical season. The DO augmentation could be met through additional load reduction, change in operation, or an engineering solution.

Upper Klamath and Lost River Subbasins TMDL
State of Oregon Department of Environmental Quality 121
The excess load is the difference between current loading and the loading capacity and for DIN equals 556 mtons /year. For C-BOD the excess load equals 2451 mtons /year. Table 3-9. Annual Lost River Pollutant Loading Capacity.
Constituent
Current Loading (mtons /
year)
Loading Capacity (mtons /
year)
Reserve Capacity (mtons / year)
Dissolved Inorganic
Nitrogen 1113 557
No measurable degradation
Carbonaceous Biochemical Oxygen
Demand 4922 2471
No measurable degradation
Table 3-10. Required instantaneous oxygen augmentation in the impoundments.
.Impoundment
Minimum Modeled DO (mg/L)
DO Criteria (mg/L) Necessary DO
Increase (mg/L)
Min 30-day
7-day Min 30-day
7-day Min 30-day
7-day
Wilson Reservoir 0.87
2.62 1.12 4.00
6.50 5.00 3.13
3.88 3.88
Anderson Rose Impoundment
2.15
6.02 3.42 4.00
6.50 5.00 1.85
0.48 1.58
Klamath Straits Drain
5.23
5.96 5.47 4.00
6.50 5.00 N/A 0.54 N/A
3.9 Allocations - 40 CFR 130.2(g) and (h) TMDLs are defined as the sum of the individual wasteload allocations (WLAs) and load allocations (LAs) including natural background, with a margin of safety (MOS), such that the loading capacity of the waterbody is not exceeded [40 CFR 130.2(i)].
TMDL = ∑ (WLAs) + ∑ (LAs) + MOS + RC Allocations are defined as the portion of a receiving water loading capacity that is allocated to point or non-point sources and natural background. A Load Allocation (LA) is the amount of pollutant that non-point sources can contribute to the stream without exceeding state water quality standards. The Waste Load Allocation (WLA) is the amount of pollutant that point sources can contribute to the waterbody without violating water quality standards. Table 3-11 and Table 3-12 lists the distribution of dissolved inorganic nitrogen and carbonaceous biochemical oxygen demand allocated to the various non-point and point sources, respectively. The surrogate load allocation of dissolved oxygen augmentation in the impoundments in presented in Table 3-13. Figure 3-25 and Figure 3-26 depict current conditions and load allocations for dissolved inorganic nitrogen and CBOD, respectively. Allocations are presented in the tables in terms of annual load for convenience. Load allocations are approximately a 50% reduction from current loading. Reductions in loading are most critical during the summer period.

Upper Klamath and Lost River Subbasins TMDL
State of Oregon Department of Environmental Quality 122
Load Allocations are developed for nonpoint source dissolved inorganic nitrogen and CBOD loading. These allocations include background sources such as precipitation, springs, soil contributions, etc., and anthropogenic distributed sources such as wetland reclamation, upland sources, pumps, canals, etc. Further these allocations are flexible. Large load reductions from one source area may allow smaller reductions in other source areas.
Waste Load Allocations are set at zero for point sources because all available loading capacity is allocated to nonpoint source load allocations.
Table 3-11. Nonpoint Source Allocation Summary by River Mile Segment.
Segment Source Type
Load Allocation DIN Load
(mtons/year)
LoadAllocation CBOD Load (mtons/year)
Oxygen Augmentation
Dissolved Oxygen Load (mtons/year)
US of Malone Dam
California Allocation
101 296 NA
Malone to Harpold
Distributed 148 596 NA
Harpold to RM 27
Distributed 17 69 NA
RM 27 to Wilson Res
Distributed 56 230 NA
Wilson Reservoir
Distributed 15 63 16.93
Wilson Dam to Anderson
Rose Distributed 56 187 0.5
Anderson Rose to Tule
Lake Distributed 2 26 NA
Tule Lake Distributed 38 262 NA
P-Canal Distributed 0 0 NA
LKL Distributed 4 40 NA
KSD - LKL to E
Distributed 14 107 0.15
KSD - E to F Distributed 5 45 0.07
KSD - F to Klamath River
Distributed 1 6 0.03
Malone Dam Upstream Boundary
101 296 NA
Miller Creek Tributary 1 12 NA
Big Springs Tributary 19 128 NA
Buck Creek Tributary 12 22 NA
E Canal Tributary 1 6 NA
LR at F-1 Canal
Tributary 1 7 NA
Station 48 Turnout
Tributary 26 220 NA
Drain #1 Tributary 13 53 NA

Upper Klamath and Lost River Subbasins TMDL
State of Oregon Department of Environmental Quality 123
Drain #5 Tributary 20 52 NA
ADY Canal Tributary 5 40 NA
Table 3-12. Overall Nonpoint Source Load Allocation for Designated Management Agencies Discharging to the Lost River System.
Designated Management Agency (DMA)
Dissolved Inorganic Nitrogen Reduction
(%)
CBOD Reduction (%)
USBR 50 50
Oregon Department of Agriculture 50 50
Water Management Districts* 50 50
*Water management districts that manage water discharging into the Lost River system. Table 3-13. Load Allocations for Impoundments.
Impoundment Designated Management
Agency (DMA)
Necessary Instantaneous DO Increase*
(mg/L)
Wilson Reservoir USBR 3.88
Anderson Rose Impoundment
USBR 1.85
Klamath Straits Drain
USBR 0.54
*Based on necessary DO increase (Table 3.9) to comply with the applicable DO standards (instantaneous minimum, 30-day minimum mean and 7-day minimum mean).
Figure 3-25. Nonpoint Source Dissolved Inorganic Nitrogen (DIN) Load Allocation.
Distributed tributary inflows represent the combination of all diffuse contributions to each of the waterbodies (i.e., anything that is not considered a discrete inflow, such as irrigation return flow and tributaries).

Upper Klamath and Lost River Subbasins TMDL
State of Oregon Department of Environmental Quality 124
Lost River Sources and Allocations
0
50
100
150
200
250
300
350
Malon
e to
Har
pold
Har
pold to
Ken
nedy
Ran
ch
Ran
ch to
Wils
on R
es
Wils
on R
eser
voir
Wils
on D
am to
And
erso
n Ros
e
And
erso
n Ros
e to
Tule
Lake
Tule
Lake
P-C
anal
LKL
KSD
- LK
L to
E
KSD
- E to
F
KSD
- F to
Klam
ath
Malon
e Dam
Miller
Cre
ek
Big S
prings
Buc
k Cre
ek
E C
anal
LR a
t F-1
Can
al
Sta
tion
48 T
urno
ut
Dra
in #
1
Dra
in #
5
ADY C
anal
City
of M
errill S
TP
DIN
(m
etr
ic t
on
s /
year) Existing Condition
Allocation
Distributed Discrete
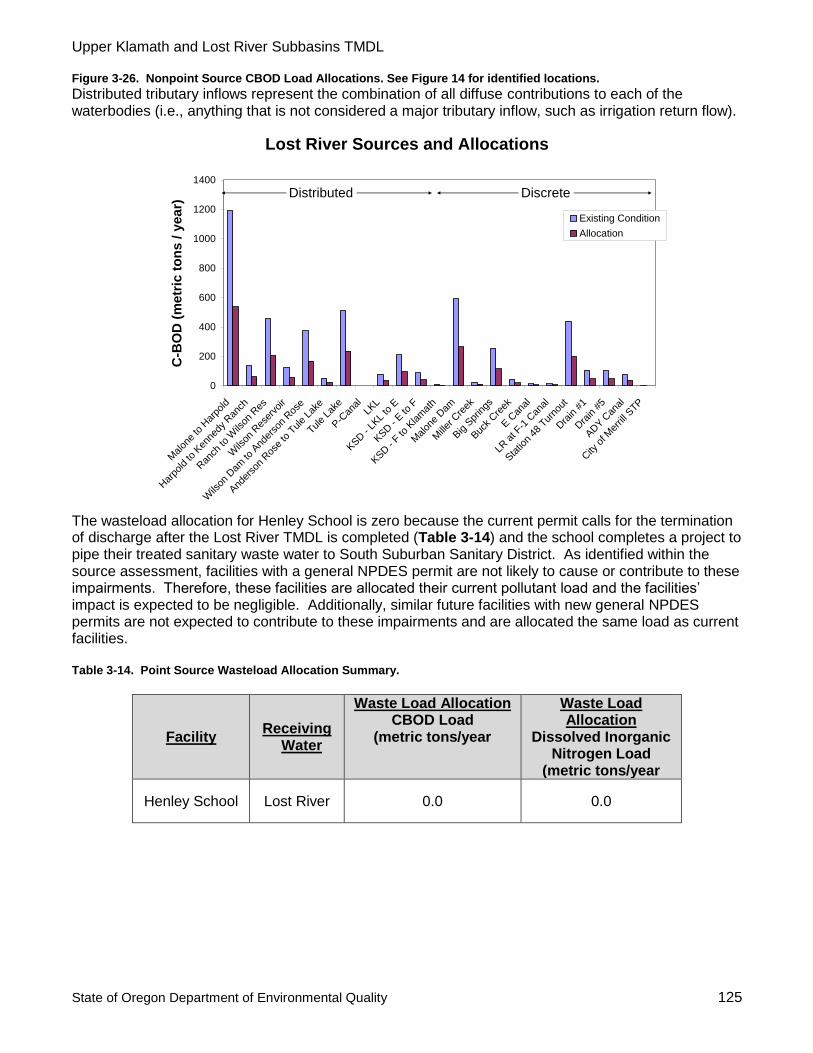
Upper Klamath and Lost River Subbasins TMDL
State of Oregon Department of Environmental Quality 125
Figure 3-26. Nonpoint Source CBOD Load Allocations. See Figure 14 for identified locations.
Distributed tributary inflows represent the combination of all diffuse contributions to each of the waterbodies (i.e., anything that is not considered a major tributary inflow, such as irrigation return flow).
The wasteload allocation for Henley School is zero because the current permit calls for the termination of discharge after the Lost River TMDL is completed (Table 3-14) and the school completes a project to pipe their treated sanitary waste water to South Suburban Sanitary District. As identified within the source assessment, facilities with a general NPDES permit are not likely to cause or contribute to these impairments. Therefore, these facilities are allocated their current pollutant load and the facilities’ impact is expected to be negligible. Additionally, similar future facilities with new general NPDES permits are not expected to contribute to these impairments and are allocated the same load as current facilities. Table 3-14. Point Source Wasteload Allocation Summary.
Facility Receiving
Water
Waste Load Allocation CBOD Load
(metric tons/year
Waste Load Allocation
Dissolved Inorganic Nitrogen Load
(metric tons/year
Henley School Lost River 0.0 0.0
Lost River Sources and Allocations
0
200
400
600
800
1000
1200
1400
Malon
e to
Har
pold
Har
pold to
Ken
nedy
Ran
ch
Ran
ch to
Wils
on R
es
Wils
on R
eser
voir
Wils
on D
am to
And
erso
n Ros
e
And
erso
n Ros
e to
Tule
Lake
Tule
Lake
P-C
anal
LKL
KSD
- LK
L to
E
KSD
- E to
F
KSD
- F to
Klam
ath
Malon
e Dam
Miller
Cre
ek
Big S
prings
Buc
k Cre
ek
E C
anal
LR a
t F-1
Can
al
Sta
tion
48 T
urno
ut
Dra
in #
1
Dra
in #
5
ADY C
anal
City
of M
errill S
TP
C-B
OD
(m
etr
ic t
on
s / y
ear)
Existing Condition
Allocation
Distributed Discrete

Upper Klamath and Lost River Subbasins TMDL
State of Oregon Department of Environmental Quality 126
3.10 Margins of Safety - CWA §303(d)(1) A margin of safety in a TMDL is required in the Clean Water Act to account for uncertainty and to assure that the TMDL will achieve water quality standards. TMDLs can be developed with explicit and/or implicit margins of safety. An explicit margin of safety is established by withholding an explicit fraction of the loading available for allocation. An implicit margin of safety is established by developing the loading capacity or allocations using conservative assumptions. This TMDL incorporates an implicit margin of safety through the use of conservative assumptions. First, the TMDL assumed year-round reductions in DIN and CBOD are necessary, although most violations in water quality standards occur during the summer months. Second, the W2 model calibration incorporates conservative rates for key water quality parameters. Third, the TMDL source analysis does not give “credit” for biological consumption of DIN and CBOD following discharge for purposes of estimating the loading capacity.
3.11 Reserve Capacity Additional sources may receive allocations if it is demonstrated that the additional load does not have a measured adverse impact on dissolved oxygen, pH, chlorophyll-a, ammonia toxicity or sediment oxygen demand. Loadings from new NPDES general permitted sources are already accounted for by the Waste Load Allocation assigned to general permitted sources (see Section 3.9, page 3-37).

Upper Klamath and Lost River Subbasins TMDL
State of Oregon Department of Environmental Quality 127
3.12 References Cole, T.M., and S.A. Wells. 2003. CE-QUAL-W2: A two-dimensional, laterally averaged, Hydrodynamic and Water Quality Model, Version 3.1, Instruction Report EL-03-1, US Army Engineering and Research Development Center, Vicksburg, MS. Danosky, E., and S. Kaffka. 2002. Farming Practices and Water Quality in the Upper Klamath Basin. Final Report to the California State Water Resources Control Board. Eilers, J.M. 2005. Aquatic Vegetation in Selected Sites of the Lost River, OR and CA. Prepared for Tetra Tech, Inc., by Max Depth Aquatics, Bend, OR. Grey, Z. 1926. Forlorn River, Walter J. Black Inc, 338 pp. Hall, R.O. and J.L. Tank. 2003. Ecosystem metabolism controls nitrogen uptake in streams in Grand Teton National Park, Wyoming. Limnology and Oceanography 48: 1120-1128. Kemp, M. J., and W. K. Dodds. 2002. The influence of ammonium, nitrate, and dissolved oxygen concentration on uptake, nitrification, and denitrification rates associated with prairie stream substrata. Limnology and Oceanography 47: 1380- 1393. Mayer, T.D. 2005. Water-quality impacts of wetland management in the Lower Klamath National Wildlife Refuge, Oregon and California, USA. Wetlands 25:697–712.
McCarthy, K and Johnson, H.M. 2009. U.S. Geological Survey Scientific Investigations Report 2009–5030, Effect of Agricultural Practices on Hydrology and Water Chemistry in a Small Irrigated Catchment, Yakima River Basin, Washington
National Research Council (NRC). 2004, Endangered and Threatened Fishes in the Klamath River Basin, The National Academy Press, 397 pp. Rabalais, N.N. 2002. Nitrogen inaquatic ecosystems. Ambio 31.102-111. Tanner, D.Q. and Anderson, C.W. 1996. Assessment of Water Quality, Nutrient, Algal Productivity, and Management Alternatives for Low-Flow Conditions, South Umpqua River Basin, Oregon 1990-92. U.S. Geological Survey. Water Resources Investigations Report 96-4082. Tetra Tech. 2005. Model Configuration and Results: Lost River Model for TMDL Development. Tetra Tech, Inc. Fairfax, VA. USBR (U.S. Bureau of Reclamation). 2000. Klamath Project Historic Operation. Mid-Pacific Region, Klamath Basin Area Office. US Environmental Protection Agency (USEPA). 1986. Quality Criteria for Water, EPA 440/5-86-001, Office of Water, Washington, DC. USEPA. 2008. Lost River, California Total Maximum Daily Loads - Nitrogen and Biochemical Oxygen
Demand to Address Dissolved Oxygen and pH impairments.

Upper Klamath and Lost River Subbasins TMDL
State of Oregon Department of Environmental Quality 128
Chapter 4: Water Quality Management Plan
Upper Klamath
HUC 18010206
Lost River
HUC 18010204

Upper Klamath and Lost River Subbasins TMDL
State of Oregon Department of Environmental Quality 129
4.1 Introduction A Total Maximum Daily Load (TMDL) defines the amount of a pollutant that can be present in a water body while still meeting water quality standards. A Water Quality Management Plan (WQMP) is developed by DEQ as a broad strategy for implementing TMDL allocations. TMDLs, WQMPs and associated planning work together to protect designated beneficial uses, such as aquatic life, drinking water supplies, and water contact recreation. In December of 2002, the State of Oregon’s Environmental Quality Commission (EQC) adopted a new rule, commonly referred to as the “TMDL rule” (OAR 340-042). The TMDL rule defines DEQ’s responsibilities for developing, issuing, and implementing TMDLs as required by the federal Clean Water Act (CWA). The WQMP is one of the twelve TMDL elements called for in the TMDL rule. Oregon Administrative Rule 340-042-0040-(4)(l) states:
(l) Water quality management plan (WQMP). This element provides the framework of management strategies to attain and maintain water quality standards. The framework is designed to work in conjunction with detailed plans and analyses provided in sector-specific or source-specific implementation plans.
This WQMP lays out strategies for implementing the Upper Klamath and Lost River Subbasins TMDL. As indicated above, two scales of planning are addressed. The WQMP itself serves as a framework plan for the entire Upper Klamath and Lost River Subbasins. It describes and references various plans and programs that are specific to a given land use or management sector. The sector-specific plans, or TMDL Implementation Plans, comprise a second tier of planning prepared by the local land use or water quality authorities. Figure 4-1 depicts the relationships in the implementation process.

Upper Klamath and Lost River Subbasins TMDL
State of Oregon Department of Environmental Quality 130
Figure 4-1. Lost River – Upper Klamath Subbasins TMDL Implementation Schematic.
TMDL Implementation Plans are source-specific plans developed and implemented by Designated Management Agencies (DMAs) and designated nonpoint sources. A DMA is “a federal, state, or local governmental agency that has legal authority of a sector or source contributing pollutants, and is identified as such by the Department of Environmental Quality in a TMDL” (Oregon Administrative Rules [OAR] 340-042-0030(2)). PacifiCorp, a non governmental entity, is a designated source responsible for a source-specific implementation plan. The TMDL Implementation Plans, due 18 months after DEQ issues the TMDL, are expected to fully describe the efforts of DMAs to achieve their applicable TMDL allocations. This WQMP establishes timelines for DMAs to develop TMDL Implementation Plans. DEQ and the DMAs will work collaboratively to assure that the WQMP and TMDL Implementation Plans collectively address the elements described below under “TMDL Water Quality Management Plan Guidance”. In short, this document is a starting point and foundation for the development of management strategies being developed by DEQ and the DMAs to attain water quality goals. DEQ recognizes that relationships between management actions and pollutant load reductions cannot always be precisely quantified. An adaptive management approach is encouraged, including interim objectives and feedback through monitoring. Klamath TMDL implementation will be coordinated with the ODEQ and the USEPA. The Regional Water Board, ODEQ, and EPA Regions 9 and 10 have developed a Memorandum of Agreement (MOA, 2009) that establishes a framework for joint implementation of the Klamath River and Lost River TMDLs. The MOA includes commitments such as:
Clean Water Act (CWA)
U.S. Environmental Protection
Agency (EPA)
Oregon Department of Environmental Quality (DEQ)
calculates Total Maximum Daily Loads (TMDLs), set
allocations to reach water quality compliance.
Carry out WQMPsOregon Department of
Agriculture (ODA)
AWQMP
Other
Urban and rural non point
source management
Local Government, Water
Management Districts
Point Source Permits
Oregon DEQ
State Management Agencies
Oregon Department of
Transportation (ODOT),
Department of State Lands (DSL),
Oregon Parks and Recreation(OPR)
Oregon Dept of Geology and
Mineral Industries (DOGAMI)
Federal Management Agencies
Bureau of Land Management (BLM),
US Forest Service (USFS),
US Fish and Wildlife (USFW)
US Bureau of Reclamation (USBR)
Forest Practices Act
Oregon Department of
Forestry (ODF)
PacifiCorp

Upper Klamath and Lost River Subbasins TMDL
State of Oregon Department of Environmental Quality 131
Work to develop and implement a joint adaptive management program, including joint time frames for reviewing progress and considering adjustments to TMDLs;
Work with the Klamath Basin Water Quality Monitoring Coordination Group and other appropriate entities to develop and implement basinwide monitoring programs designed to track progress, fill in data gaps, and provide a feedback loop for management actions on both sides of the common state border;
Work jointly with common implementation parties (e.g., USBR, U.S. Forest Service, USFWS, BLM, PacifiCorp, and the Klamath Water Users Association (KWUA) to develop effective implementation plans and achieve water quality standards;
Explore engineered treatment options such as treatment wetlands, algae harvesting, and package wastewater treatment systems to reduce nutrient loads to the Klamath River and encourage implementation of these options where feasible; and
Work to develop and implement a basinwide water quality tracking and accounting program that would establish a framework to track water quality improvements, facilitate planning and coordinated TMDL implementation, and enable appropriate water quality offsets or trades.
4.2 Adaptive Management The goals of the Clean Water Act, Oregon Revised Statute and Oregon Administrative Rules are that water quality standards shall be met or that all feasible steps will be taken towards achieving the highest water quality attainable. These are long-term goals in many watersheds, particularly where non-point sources are the main concern. To achieve these goals, implementation must begin as soon as possible. TMDLs are numerical pollutant loadings that are set to limit pollutant levels such that in-stream water quality standards are met. ODEQ recognizes that TMDLs are values calculated from mathematical models and other analytical techniques designed to simulate and/or predict complex physical, chemical and biological processes. Models and techniques are simplifications of these complex processes and, as such, are unlikely to exactly reproduce how streams and other waterbodies will respond to the application of various management measures. Therefore, TMDLs have a varying level of uncertainty depending on factors, such as data available and how well the natural processes are understood. For this reason, TMDLs have been established with a margin of safety. For point sources, TMDLs will be implemented through permits issued by ODEQ. For nonpoint sources, TMDLs will be implemented through TMDL Implementation Plans. For facilities covered by a permit or license issued by the federal government, the TMDL will be implemented through a Water Quality Standards Certification issued by ODEQ pursuant to Section 401 of the federal Clean Water Act. ODEQ recognizes that it may take time—from several years to several decades-- after full implementation before management practices identified in a TMDL implementation plan become fully effective in reducing and controlling pollution, such as heat loads from lack of riparian vegetation. In addition, ODEQ recognizes that technology for controlling some pollution sources such as nonpoint sources is, in many cases, in the development stages and will likely take one or more iterations to develop effective techniques. It is possible that after application of all reasonable best management practices, some TMDLs or their associated surrogates cannot be achieved as originally established.

Upper Klamath and Lost River Subbasins TMDL
State of Oregon Department of Environmental Quality 132
ODEQ also recognizes that despite all efforts, natural events beyond the control of humans may interfere with or delay attainment of the TMDL and/or its associated surrogates. Such events could be, but are not limited to, floods, fire, insect infestations, and drought. ODEQ will regularly review progress of TMDL Implementation plans. If and when ODEQ determines that implementation plans have been fully implemented, that all feasible management practices have reached maximum expected effectiveness, and a load allocation cannot be achieved, the Department shall reopen the TMDL and adjust the load allocation and its associated water quality standard(s) as necessary. If a use attainability analysis (UAA) and/or site specific criteria show that the targeted standards or beneficial uses cannot be achieved then revisions to the TMDL may include recalculating the TMDL loading capacity and allocations. ODEQ would also consider reopening the TMDL, subject to available resources, should new scientific information become available that indicates the TMDL or its associated surrogates need modification. The determination that all feasible steps have been taken will be based on, but not limited to, a site-specific balance of the following criteria: protection of beneficial uses; appropriateness to local conditions; use of best treatment technologies or management practices or measures; and cost of compliance. Figure 4-2 is a graphical representation of this adaptive management concept.
Figure 4-2. Idealize progress of adaptive management
In employing an adaptive management approach to this TMDL, ODEQ has the following expectations and intentions:
Subject to available resources, ODEQ will review and, if necessary, modify TMDLs and the TMDL Implementation Plan established on a five-year basis or possibly sooner if ODEQ determines that new scientific information is available that indicates significant changes to the TMDL are needed.

Upper Klamath and Lost River Subbasins TMDL
State of Oregon Department of Environmental Quality 133
When developing water quality-based effluent limits for NPDES permits, ODEQ will ensure that effluent limits developed are consistent with the assumptions and requirements of the waste load allocation (CFR 122.44(d)(1)(vii)(B)).
ODEQ will evaluate the progress towards achieving the TMDL (and water quality standards) and the success of implementing the TMDL Implementation Plan.
ODEQ expects that each DMA and designated source will also monitor and document its progress in implementing the provisions of its individual implementation plan. This information will be provided to ODEQ for its use in reviewing the TMDL.
As implementation of a plan proceeds, ODEQ expects that DMAs and designated sources will develop benchmarks which can be used to measure progress towards meeting allocated loads. Where implementation of the implementation plan or effectiveness of management techniques are found to be inadequate, ODEQ expects management agencies to revise the components of the plan to address these deficiencies.
4.3 Water Quality Management and Implementation Plan Guidance
The TMDL rule of OAR 340-042 lists the required elements of a WQMP. These elements, identified below, serve as the outline for this WQMP.
1) Condition assessment and problem description 2) Goals and objectives 3) Proposed management strategies 4) Timeline for implementing management strategies 5) Relationship of management strategies to attainment of water quality standards 6) Identification of responsible participants or DMAs 7) Identification of sector-specific implementation plans 8) Schedule for preparation and submission of implementation plans 9) Reasonable assurance 10) Monitoring and evaluation 11) Public involvement 12) Planned efforts to maintain management strategies over time 13) Costs and funding 14) Citation to legal authorities
This WQMP also presents a discussion of water quality trading opportunities and TMDL incentives/voluntary efforts. Some of the elements listed above are sufficiently addressed in the WQMP and others are partly or largely deferred to the DMA programs and implementation plans. General discussion of the expected content of TMDL Implementation Plans can be found in TMDL Implementation Plan Guidance DEQ, 2007 and on DEQ’s website http://www.deq.state.or.us/WQ/TMDLs/implementation.htm. Nonpoint source pollution reduction measures are described in Nonpoint Source Pollution Control Guidebook for Local Government, DEQ and Oregon Department of Land Conservation and Development, 1994. More recent guidance for urban settings is available on the DEQ website http://www.deq.state.or.us/wq/, including the Water Quality Model Code and Guide Book, DEQ and Oregon Department of Land Conservation and Development, 2000. Most Federal and State natural resource agencies publish watershed planning guidance as well.

Upper Klamath and Lost River Subbasins TMDL
State of Oregon Department of Environmental Quality 134
4.3.1 Condition Assessment and Problem Description
The water quality standards for dissolved oxygen, pH, ammonia toxicity, and chlorophyll-a are not being met during the spring and summer in much of the Upper Klamath and Lost River Subbasins stream network. A description of the pollutant, water quality criteria and current water quality conditions are presented in Table 4-1. Table 4-1. Current Water quality Conditions
Waterbody Name River Mile Parameter Period
Klamath River 207- 231.1 Dissolved Oxygen Spawning: January 1
– May 15
Klamath River 207 – 231.1 Dissolved Oxygen Year-around (non-
spawning)
Klamath River 231.1 - 251 Dissolved Oxygen Year-round (non-
spawning)
Klamath River 231.5 - 253 pH summer
Klamath River 231.5 - 253 Ammonia Toxicity year around
Klamath River 231.5 - 253 Chlorophyll-a Summer
Klamath River 207 – 231.1 Temperature Summer
Beaver Creek 0 to 5.5 Temperature Year around
Grizzly Creek 0 to 3 Temperature Summer
Hoxie Creek 0.8 to 4.4 Temperature Summer
Jenny Creek 0 to 17.8 Temperature Summer
Johnson Creek 0 to 9.4 Temperature Summer
Keene Creek 0 to 7.2 Temperature Summer
Keene Creek 7.5 to 9.7 Temperature Summer
Mill Creek 0 to 3.9 Temperature Summer
South Fork Keene Creek
0 to 3.1 Temperature Summer
Spencer Creek 0 to 18.9 Temperature Year around
Unnamed Creek, LLID 1212355422566
0 to 2.2 Temperature Year around
Antelope Creek 2 to 3 Temperature Year around
Barnes Valley Creek 0 to 14 Temperature Year around
Ben Hall Creek 0 to 8.7 Temperature Year around
Buck Creek 0 to 12.8 Temperature Year around
Lapham Creek 0 to 4 Temperature Year around
Long Branch Creek 0 to 4.6 Temperature Year around
Miller Creek 0 to 9.6 Temperature Year around
North Fork Willow Creek 0 to 2.3 Temperature Year around
Rock Creek 0 to 4.3 Temperature Year around
Lost River 4.8-65 Dissolved Oxygen Year around
Lost River 4.8-65 Chlorophyll-a Summer
Lost River 4.8-65 Ammonia Toxicity Year around
Lost River Reservoir 25.4-27.6 pH Summer
Klamath Straits Drain 0 Dissolved oxygen Year around

Upper Klamath and Lost River Subbasins TMDL
State of Oregon Department of Environmental Quality 135
Waterbody Name River Mile Parameter Period
Klamath Straits Drain 0 Ammonia Toxicity Year around
Klamath Straits Drain 0 pH Summer
Klamath Straits Drain 0 Chlorophyll-a Summer
Upper Klamath and Lost River Subbasins TMDL
State of Oregon Department of Environmental Quality 136
4.3.2 Goals and Objectives
The overarching goal of this WQMP is to identify the DMAs, designated sources, associated land use, management strategies, and legal authority to achieve compliance with water quality standards through loading reductions of nitrogen, phosphorus, carbonaceous oxygen demand, and solar radiation. The WQMP combines a description of all DMA plans that are in place or will be developed to address the load and wasteload allocations in the TMDL. This WQMP is preliminary and is designed to be adaptive as more information and knowledge is gained regarding the pollutants, allocations, management measures, and other related areas. As defined in OAR 340-042-0080(3), it is expected that all DMAs will develop Implementation Plans, which will serve as the tool for implementing the TMDL and will accomplish the following:
• Develop Best Management Practices (BMPs) to achieve Load Allocations and Waste Load allocations • Give reasonable assurance that management measures will meet load allocations, through both quantitative and qualitative analysis of management measures • Adhere to measurable milestones for progress • Develop a timeline for implementation, with reference to costs and funding • Develop a monitoring plan to determine if:
- BMPs are being implemented - Individual BMPs are effective - Load and wasteload allocations are being met - Water quality standards are being met
The TMDL does not mandate or imply that a DMA or designated source must alter water diversions in order to meet this TMDL and the water quality standard. How a DMA or designated source makes its operations consistent with the allocation is to be established through the sector-specific TMDL Implementation Plans.
Upper Klamath and Lost River Subbasins TMDL
State of Oregon Department of Environmental Quality 137
Oregon Administrative Rules (OAR) Chapter 340 Division 042 – Total Maximum Daily Loads (TMLDs)
OAR 340-042-0080
Implementing a Total Maximum Daily Load
(1) Management strategies identified in a WQMP to achieve wasteload and load
allocations in a TMDL will be implemented through water quality permits for those
sources subject to permit requirements in ORS 468B.050 and through sector-
specific or source-specific implementation plans for other sources. WQMPs will
identify the sector and source-specific implementation plans required and the
persons, including DMAs, responsible for developing and revising those plans.
(2) The Oregon Department of Forestry will develop and enforce implementation
plans addressing state and private forestry sources as authorized by ORS 527.610
through 527.992 and according to OAR chapter 629, divisions 600 through 665.
The Oregon Department of Agriculture will develop implementation plans for
agricultural activities and soil erosion and enforce associated rules as authorized by
ORS 568.900 through 568.933 and according to OAR chapter 603, divisions 90 and
95.
(3) Persons, including DMAs other than the Oregon Department of Forestry or the
Oregon Department of Agriculture, identified in a WQMP as responsible for
developing and revising sector-specific or source-specific implementation plans
must:
(a) Prepare an implementation plan and submit the plan to the Department for
review and approval according to the schedule specified in the WQMP. The
implementation plan must:
(A) Identify the management strategies the DMA or other responsible person will
use to achieve load allocations and reduce pollutant loading;
(B) Provide a timeline for implementing management strategies and a schedule for
completing measurable milestones;
(C) Provide for performance monitoring with a plan for periodic review and
revision of the implementation plan;
(D) To the extent required by ORS 197.180 and OAR chapter 340, division 18,
provide evidence of compliance with applicable statewide land use requirements;
and
(E) Provide any other analyses or information specified in the WQMP.
(b) Implement and revise the plan as needed.
(4) For sources subject to permit requirements in ORS 468B.050, wasteload
allocations and other management strategies will be incorporated into permit
requirements.

Upper Klamath and Lost River Subbasins TMDL
State of Oregon Department of Environmental Quality 138
4.3.3 Proposed Management Strategies
DEQ is reliant on the DMAs for programs and projects providing strategies to minimize loading of dissolved inorganic nitrogen, total nitrogen, total phosphorus, and carbonaceous oxygen demand from nonpoint sources. This section of the plan outlines the proposed management measures that are designed to meet the wasteload allocations and load allocations of each TMDL. The timelines for addressing these measures are given in the following section. The management measures to meet the load and wasteload allocations may differ depending on the source of the pollutant. Below are categorizations of the sources and a description of the management measures being proposed for each source category. Wastewater Treatment Plants The wasteload allocations given to the two municipal wastewater treatment plants (WWTPs) will be implemented through modifications to their National Pollutant Discharge Elimination System (NPDES) permits. These permits will either include numeric effluent limits for nitrogen or provisions to develop and implement management plans, whichever is appropriate. General and Individual NPDES Permitted Sources All individual NPDES permits will be reviewed and, if necessary, modified to ensure compliance with allocations. Either numeric effluent limits will be incorporated into the permits or specific management measures and plans will be developed. The conditions of the general permits can be used to implement waste load allocations. Other Sources For discharges from sources other than the WWTPs and those permitted under general or minor NPDES permits, ODEQ has assembled an initial listing of management categories. This listing, given in Table 4-2 below, is designed to be used by the designated management agencies (DMAs) as guidance for selecting management measures to be included in their Implementation Plans. Each DMA will be responsible for examining the categories in Table 4-2 to determine if the source and/or management measure is applicable within their jurisdiction. This listing is not comprehensive and other sources and management measures will likely be added by the DMAs in their implementation plans. For each source or measure deemed applicable in an implementation plan, a listing of the frequency and areal extent of management measures should also be provided. In addition, each of the DMAs is responsible for source assessment and identification, which may result in additional categories. It is crucial that management measures be directly linked with their effectiveness at reducing pollutant loading contributions.

Upper Klamath and Lost River Subbasins TMDL
State of Oregon Department of Environmental Quality 139
Table 4-2. Pollutant management strategies for dissolved oxygen, pH, ammonia, and chlorophyll a.
Management Measure Dissolved Oxygen, pH, Ammonia
Chlorophyll-a
Public Awareness/Education X X
New Development and Construction
Planning Procedures X X
Permitting/Design X X
Education and Outreach X X
Control erosion from construction Activities
X X
Inspection/Enforcement X X
Storm Drain Construction X X
Existing Development
Storm Drain Operations and Maintenance
X X
Retrofit Existing Systems X X
Inspect Septic Systems X X
Inspection/Enforcement X X
Eliminate Illicit Connections and Illegal Dumping
X X
Streets, Roads, Bridges
Control erosion from Maintenance Activities
X X
New Construction X X
Commercial and Industrial Facilities
Parking Lot Runoff X X
Track and enforce against Illegal Dumping
X X
Eliminate Illicit Discharges and Cross Connections
X X
Control pollutants at Source X X
Reduce Fertilizers in runoff X X
Residential
Eliminate Illegal Dumping X X
Eliminate Illicit Discharges and Cross Connections
X X
Riparian Area Management
Protection/Enhancement X X
Streambank Stabilization X X
Public/Governmental Facilities Including Parks
Public Waterbodies Protection X X
Operations and Maintenance X X
LID at Public Buildings and Facilities X X
Reduce Pet Wastes and Fertilizers in runoff
X X
Forest Practices
Implement Forest Protection Act (State)
X X
Implement Resource Management Plans (Fed)
X X
Riparian Protection/Enhancement X X

Upper Klamath and Lost River Subbasins TMDL
State of Oregon Department of Environmental Quality 140
Replace/Restore Roads/Culverts X X
Management Measure Dissolved Oxygen,
pH, Ammonia Chlorophyll-
a
Agricultural Practices
Implement SB 1010 AgWQMP X X
Table 5.1 continued
Livestock Management Training X X
Nutrient Management Plans X X
Riparian Protection/Enhancement X X
Wetland Protection/Enhancement X X
Reconnect Sloughs and Rivers X X
Replace Defective Culverts X X
Setback Levies and Dikes X X
CAFO Implementation X X
Planning and Assessment
Source Assessment/Identification X X
Source Control Planning X X
Track and Communicate frequently on Forest Conversions.
Monitoring and Evaluation
BMP Monitoring and Evaluation X X
Instream Monitoring X X
BMP Implementation Monitoring X X
4.3.4 Timeline for Implementing Management Strategies
Individual TMDL Implementation Plans will address timelines for completing measurable milestones as appropriate. Time frames for water quality standards attainment and Implementation Plan submittal are addressed in Sections 4.3.5 and 4.3.9. DEQ recognizes that there has been and continues to be much progress towards improving water quality in the Upper Klamath and Lost River Subbasins. Natural resource agencies, local jurisdictions, landowners and nongovernmental organizations have been active both directly and through outreach. This report does not attempt a timeline addressing the many ongoing and voluntary efforts. Table 4-3, below, gives the timeline for activities related to the WQMP and associated DMA Implementation Plans. Table 4-3. Water Quality Management Plan and DMA Specific Implementation Plan Timeline.
Activity 2011 2012 2013 2014 2015 2016
Modification of NPDES Permits
Implementation of NPDES Permits
DEQ Modification of General and Minor permits
5 Year Cycle
Development and Submittal of NPS Implementation Plans
Revision of Agricultural Water Quality Management Plans
2 Year Cycle
Implementation of NPS Plans
DEQ/DMA/Public Review of TMDL and WQMP

Upper Klamath and Lost River Subbasins TMDL
State of Oregon Department of Environmental Quality 141
4.3.5 Relationship of Management Strategies to Attainment of Water Quality Standards
The purpose of this element of the WQMP is to demonstrate a strategy for implementing and maintaining the plan and achieving the water quality standards over the long term. Included in the previous section are timelines for the implementation of DEQ activities. Each DMA-specific Implementation Plan will also include timelines for the implementation of identified milestones. Timelines should be as specific as possible and should include a schedule for BMP installation and/or evaluation, monitoring schedules, reporting dates and milestones for evaluating progress. For the Upper Klamath and Lost River Subbasin TMDL, pollutant surrogates have been defined as alternative targets for meeting the TMDL for some parameters. The purpose of the surrogates is not to excessively limit human access or activity in the subbasin or its riparian areas. However, DEQ expects that the Implementation Plans will address how human activities will be managed to achieve the surrogates. DEQ also recognizes that full attainment of pollutant surrogates (system potential vegetation, for example) at all locations may not be feasible due to physical, legal or other regulatory constraints. To the extent possible, the Implementation Plans should identify potential constraints, and should also provide the ability to mitigate those constraints should the opportunity arise. For instance, at this time, the existing location of a road or highway may preclude attainment of system-potential vegetation due to safety considerations. In the future, however, should the road be expanded or upgraded, consideration should be given to designs that support TMDL load allocations and pollutant surrogates such as system potential vegetation. DEQ intends to regularly review the progress of the Implementation Plans. Individual Implementation Plans, this WQMP, and the TMDLs are part of an adaptive management process. Modifications to the WQMP and the Implementation Plans are expected to occur annually or on a more frequent basis. Pending available resources, review of the TMDLs are expected to occur approximately five years after the final approval of the TMDLs, or whenever deemed necessary by DEQ. Pending the availability of adequate resources, DEQ will review the water quality model used to develop the Upper Klamath Lake TMDL and work cooperatively with USGS, USBR, and other stakeholders for revising the TMDL for Upper Klamath Lake.
4.3.6 Identification of Responsible Participants or DMAs
The purpose of this element is to identify the organizations responsible for the implementation of the Upper Klamath and Lost River Subbasin TMDL (Table 4-4). DMAs and designated sources are recognized by the State of Oregon as being those entities with the legal authority to ensure that the targets set forth in the TMDL are met (OAR 340-042-0030 (2)). What follows is a listing of the DMAs and designated sources in the Upper Klamath and Lost River Subbasins and their responsibilities under the TMDL. DMAs and designated sources are responsible for implementing management strategies and developing and revising sector-specific or source-specific implementation plans. The management strategies necessary to meet the TMDL load and wasteload allocations differ based upon the source of pollution and the responsibilities and resources of the DMAs and designated sources. Many DMAs and designated sources are already implementing or planning to implement management strategies for improving and protecting water quality, but may need to take additional actions to meet the TMDL allocations. Other organizations share in TMDL implementation responsibility and are discussed in this and following sections, but are not required to submit TMDL implementation plans. Also with regard to TMDL responsibilities, DEQ recognizes that organizations are not responsible for land use activities or load allocations outside of their area of jurisdictional authority. DEQ has the regulatory authority to take enforcement action to compel a DMA or designated source to develop and implement a TMDL implementation plan. DEQ, however, will first make every attempt to work collaboratively with the entity to achieve compliance.

Upper Klamath and Lost River Subbasins TMDL
State of Oregon Department of Environmental Quality 142
Table 4-4. List of organizations with TMDL responsibilities.
Management Agency Area of Jurisdiction Expected Form of Planning in
Response to TMDL
Oregon Department of
Agriculture
Agricultural and associated rural residential land use along the mainstem Klamath River, Lost River, irrigation canals/drains and perennial and intermittent tributaries
SB1010 Agricultural Water Quality Management Area Plans or Rules,
updated as needed in 2010 and 2011 to address the TMDL
PacifiCorp Keno Dam and Hydroelectric
Project
TMDL implementation by a source-specific Implementation
Plan
Oregon Department of Forestry
Conifer and Mixed Forest on non-federal forest lands.
Ongoing implementation of the Forest Practices Act
Oregon Department of Geology and Mineral Industries (DOGAMI)
Regulation of aggregate mines,
TMDL Implementation Plan
US Forest Service Fremont-Winema National
Forest USFS Water Quality Restoration
Plan
US Bureau of Land Management (Medford and
Lakeview Districts) BLM managed lands
BLM Water Quality Restoration Plan
US Fish and Wildlife Service
USFWS managed lease lands
TMDL Implementation Plan
Klamath County
County roads along subbasin perennial tributaries, drainage ditches within the County Service District.
Klamath County TMDL Implementation Plan
US Bureau of Reclamation
Operation of Lost River Diversion Channel and Reservoir, Anderson Rose Impoundment, and Klamath Straits Drain facilities
TMDL Implementation Plan
Water Management Districts
Canals and drains within the Klamath Reclamation Project
TMDL Implementation Plan
Municipalities – City of Klamath Falls, Merill, Malin,
Keno and Bonanza
Operation and maintenance of sewer systems, land use planning, maintenance of
city-owned property
TMDL Implementation Plans

Upper Klamath and Lost River Subbasins TMDL
State of Oregon Department of Environmental Quality 143
4.3.7 Identification of Sector-Specific Implementation Plans
Several organizations utilize existing programs as TMDL Implementation Plans. This is typically documented in a memorandum of understanding or agreement with the DEQ. The following planning efforts provide for TMDL implementation in the Upper Klamath and Lost River Subbasins. DEQ expects that they will be updated as needed to layout all feasible steps toward meeting the TMDL. The sections below describe the general form of the anticipated DMA responsibilities. Expected elements of TMDL Implementation Plans are listed in DEQs guidance for developing Implementation Plans, TMDL Implementation Plan Guidance – for State and Local Government Designated Management Agencies, 2007. http://www.deq.state.or.us/wq/tmdls/docs/impl/07wq004tmdlimplplan.pdf
NPDES Permit Program – Point Sources
DEQ administers the National Pollutant Discharge Elimination System (NPDES) permits for surface water discharge; and is delegated to do so by USEPA. The NPDES permit is a Federal permit, required under the Clean Water Act for discharge of waste into waters of the United States. Individual facility NPDES permits are unique to a discharge facility. General NPDES permits address categories of facilities or aggregate pollutant sources, such as sewage treatment or storm water. There is presently one individual facility NPDES permit issued in the Lost River Subbasin. This facility, Henley School will not be permitted to discharge directly to surface water. Henley School is in the process of piping their waste water to South Suburban Sanitary District treatment facility. The four point sources (Klamath Falls WWTP, South Suburban WWTP, Columbia Plywood and Collins Forest Products) discharging to Keno Reservoir will modify their respective permits to address waste load allocations. In the event that any new individual facility permits are issued in the Subbasin, they will be written to insure that all TMDL related issues are addressed in the permit.
There are 53 NPDES general permits that apply in the Upper Klamath and Lost River Subbasins. The conditions of the general permits can be used to implement waste load allocations.
Nonpoint Sources
Agricultural Lands The Oregon Department of Agriculture (ODA) is the DMA responsible for regulating agricultural activities that affect water quality. The mission of the Oregon Department of Agriculture is 1) to ensure food safety and provide consumer protection; 2) to protect the natural resource base for present and future generations of farmers and ranchers, and 3) to promote economic development and expand market opportunities for Oregon agricultural products. ODA employs Agricultural Water Quality Management Area Plans (AgWQMAP) and associated rules to implement TMDLs throughout the state. Periodic review of the progress of AgWQMAP implementation is called for in rule (OAR 603-090-0020). The AgWQMAPs are reviewed biennially by ODA and selected agricultural stakeholders. ODA has primary responsibility for implementing TMDLs on private agricultural lands through a 1998 Memorandum of Agreement (MOA). The MOA (ODA 1998) states that ”Load allocations for agricultural nonpoint sources will be provided by DEQ to ODA which will then begin developing an AgWQMAP, or modifying an existing AgWQMAP, to address the load allocation” and, specific to situations where AgWQMAP development has proceeded a TMDL: “At the time that DEQ develops load allocations for agricultural nonpoint sources or groups of sources, ODA will evaluate the AgWQMAP previously developed plan to assure the attainment of DEQ’s load allocations for agriculture.” Local Management Agencies are funded to conduct outreach and education, develop individual farm plans for operations in the planning area, work with landowners to implement management practices, and help landowners secure funding to cost-share water quality improvement practices. The Local Management Agency is the Klamath County Soil and Water Conservation District, working under contract to ODA.

Upper Klamath and Lost River Subbasins TMDL
State of Oregon Department of Environmental Quality 144
Progress reports, which are submitted to the Board of Agriculture after the biennial review process, are developed based on data collected by Local Management Agencies and ODA on progress of implementation of the plans and rules. Reports to the Board of Agriculture and Director will include statistics on numbers of farm plans developed and types of management practices being employed. These reports are available to DEQ for review in assessing implementation progress. Current Status. Private agricultural lands within the Upper Klamath Subbasin are addressed in the Klamath Headwaters AWQMP which was adopted in 2004 and revised in 2007. The first Lost River Subbasin AgWQMAP and rule were adopted by the Board of Agriculture on April 17, 2002. A first biennial review was recently implemented by the ODA and the Local Advisory Committee. The review report, issued to the Board of Agriculture on December 16, 2004, concludes that “The Lost River Area Plan and Rules have been an effective component of a cooperative effort to protect and enhance water quality and quantity.” The report states that “based on the evaluation, the LAC (Local Area Advisory Committee) decided that there was no need to revise the Area Plan or Rules. The LAC wanted to defer the inclusion of TMDL load allocations until the next biennial review, when the TMDL will be complete.“ The Klamath Headwaters and Lost River Subbasin AWQMAPs (ODA 2006) and Rules are available from ODA’s website at: http://www.oda.state.or.us/nrd/water_quality/areapr.html. DEQ Expectations. DEQ expects ODA and the Local Advisory Committees in the Klamath Basin will revise the AWQMAP’s to address the load allocations for the Upper Klamath and Lost River Subbasin TMDLs. Non Federal Forest Lands The Oregon Department of Forestry (ODF) is the DMA for water quality protection from nonpoint source discharges or pollutants resulting from forest operations on non federal forestlands in Oregon. The Forest Practices Act (FPA) applies broadly to state forest lands and also provides for watershed-specific protection rules. Watershed-specific protection rules are a mechanism for subbasin-specific TMDL implementation in non-Federal forest land where water quality impairment is attributable to current forest practices. Legacy issues are addressed through management planning with ODF as a participant. Coordination between ODF and DEQ is guided by a Memorandum of Understanding (MOU) signed in April of 1998. This MOU was designed to improve the coordination between the ODF and the DEQ in evaluating and proposing possible changes to the forest practice rules as part of the TMDL process. ODF and DEQ are involved in several statewide efforts to analyze the existing FPA measures and to better define the relationship between the TMDL load allocations and the FPA measures designed to protect water quality. Current Status. The Forest Practice Rules apply in non-federal forest areas in the Upper Klamath and Lost River Subbasins. Watershed-specific rules have not been established in the Basin. DEQ Expectations. DEQ expects ongoing implementation of the Forest Practices Act. Federal Lands – US Forest Service and the US Bureau of Land Management The US Forest Service (USFS) and Bureau of Land Management (BLM) are DMAs for federal lands in the Subbasin in Oregon. In July 2003, both agencies signed memorandums of agreement with DEQ defining how water quality rules and regulations regarding TMDLs will be met. The agencies generally respond to TMDLs by developing and implementing Water Quality Restoration Plans (WQRPs) which will be the equivalent of TMDL Implementation Plans. The WQRPs are revised as needed in order to implement TMDLs All management activities on BLM Klamath Falls Resource Area -managed lands follow the Klamath Falls Resource Area 1995 Record of Decision and Resource Management Plan which incorporates the Aquatic Conservation Strategy (ACS) and standards and guidelines from the

Upper Klamath and Lost River Subbasins TMDL
State of Oregon Department of Environmental Quality 145
Northwest Forest Plan. The ACS outlines a comprehensive framework for protecting and restoring aquatic and riparian systems. The ACS contains four components: riparian reserves, key watersheds, watershed analysis, and watershed restoration. The ACS contains nine objectives that guide maintenance and restoration of watershed processes and water quality. Standards and guidelines associated with the ACS are designed to meet or attain ACS objectives and prohibit and regulate activities that retard or prevent ACS objective attainment. The Resource Management Plan also includes specific best management practices (BMPs) to protect water quality. .
Current Status. WQRP’s for BLM managed lands in portions of the Upper Klamath and Lost River Subbasins have been developed. It is expected that the WQRPs will serve as TMDL implementation plans for all lands managed by BLM in the Upper Klamath and Lost River subbasins. WQRPs that address TMDLs have not been prepared for the USFS managed lands in the Upper Klamath and Lost River Subbasins. DEQ Expectations. DEQ will review of the existing WQRPs for the BLM Medford and Lakeview Districts. DEQ antexpects development of a WQRP by USFS. Federal Irrigation Project - US Bureau of Reclamation (USBR) The Bureau of Reclamation is the DMA responsible for developing a source-specific implementation plan to address load allocations associated with water delivery and drainage facilities that are federally owned and/or operated in the Klamath Reclamation Project and facilities used to supply water to the irrigation project. This includes USBR responsibilities for meeting load allocations in both this Upper Klamath and Lost River Subbasins TMDL and the previously issued and US EPA approved TMDL for Upper Klamath Lake Drainage. DEQ encourages USBR to pursue innovative changes to project operations including reduction of discharge to the Klamath River from Lost River Diversion Channel (LRDC) to address their combined pollutant load reductions for Klamath Straits Drain and LRDC.
Current Status. Source-specific implementation not yet developed. DEQ Expectations. DEQ expects development of implementation plan within 18 months from the adoption of the TMDL. Water Management Districts Irrigation and drainage districts are designated sources responsible for developing implementation plans to address load allocations associated with non-federal water delivery and drainage systems in the Klamath Reclamation Project.
Current Status. Source-specific implementation not yet developed. DEQ Expectations. As designated sources, DEQ recommends the water management districts develope a unified implementation plan within 18 months from the adoption of the TMDL. If individual water management districts may choose to develop implementation plans. DEQ will assist the districts in preparing a plan that complies with OAR 340-042-0080(3). Klamath County – Klamath County manages storm water runoff in the drainage ditches within the designated Klamath County Drainage Service District. The County also manages roads that are adjacent to waterbodies in the Upper Klamath and Lost River Subbasins. Current Status – Klamath County has mapped the location and sources of stormwater drainage in the Klamath County Drainage District. DEQ Expectations. DEQ expects the County to develop a TMDL implementation plan to control nonpoint pollution related to stormwater and runoff from roads along perennial tributaries. These roads

Upper Klamath and Lost River Subbasins TMDL
State of Oregon Department of Environmental Quality 146
should be evaluated for impediments to load allocation attainment. DEQ requests that the County clarify these objectives in their TMDL implementation plan. City of Klamath Falls – Klamath Falls manages storm water runoff in the drainage ditches within the city limits. Klamath Falls also manages riparian areas and roads that are adjacent to waterbodies in the Upper Klamath and Lost River Subbasins. Current Status – Klamath Falls has mapped the location and sources of storm water drainage within the city limits. DEQ Expectations. DEQ expects the City to develop a TMDL implementation plan to control nonpoint pollution related to stormwater and runoff from roads along perennial and intermittent tributaries. These roads should be evaluated for impediments to load allocation attainment. DEQ requests that the City to clarify these objectives in their TMDL implementation plan.
Other Sources
Hydroelectric Facilities - PacifiCorp owns and operates JC Boyle and Keno Dams. PacifiCorp is designated as a source responsible for developing a source-specific implementation plan to address the dissolved oxygen allocations associated with JC Boyle and Keno Dams. In the event that ownership of Keno Dam is transferred to USBR, then the new owner will have responsibility for developing and implementing the plan. Current Status: PacifiCorp is negotiating a basin-wide agreement for decommissioning JC Boyle and three dams in California. Conditions of the proposed settlement include interim measures to address TMDL implementation for the two PaciCorp dams in Oregon and decommissioning of the two hydroelectric facilities on Link River (East and West Side). DEQ Expectations: DEQ expects PacifiCorp to develop a source-specific plan within 18 months of the final TMDL or in accordance with the schedule stipulated in the settlement agreement.
4.3.8 Schedule for Preparation of Implementation Plans
This section specifies a timeline for the preparation and submission of implementation plans by DMAs and designated sources. In accordance with OAR 340-042-0060, TMDLs are issued as a DEQ order, effective on the date signed by the Director or his or her designee. DEQ will notify all affected NPDES permittees, DMAs and designated sources identified in this document and persons who provided formal comment on the draft TMDL within 20 business days of TMDL issuance. DEQ expects that the USFS, BLM, USBR, Klamath County, other DMAs and designated sources will fulfill the planning expectations of Section 4.3.8 within 18 months of the date of receipt of their notification letter and provide an annual report summarizing progress toward development and implementation of the respective plans. The Forest Practice Rules of ODF are already in effect and ODA follows a two year timeline from the last AgWQMAP review as specified by rule. DEQ review and approval of TMDL implementation plans is called for in OAR 340-042. Following Implementation Plan submittal, DEQ will work closely with DMAs and designated sources to ensure a successful and timely review/approval process. In accordance with MOUs, once a USFS or BLM WQRP is received by DEQ, DEQ will provide a letter of the approval or disapproval decision within 60 days with any appropriate requirements for revision. The implementation plans, this WQMP and the TMDLs are part of an adaptive management process. Review of the TMDLs, WQMP and Implementation Plans will tentatively target a 5 year cycle; this is subject to available staff time and varying levels of priorities within and outside of DEQ. Evaluations that trigger revision of the Implementation Plans will include, but not be limited to, consideration of:

Upper Klamath and Lost River Subbasins TMDL
State of Oregon Department of Environmental Quality 147
DMA/designated sources recommendations, the periodic evaluation called for in Section 4.3.12, new 303(d) listings, TMDL revision and other BMP effectiveness and water quality trend evaluations.
4.3.9 Reasonable Assurance
This section of the WQMP is intended to provide reasonable assurance that the WQMP (along with the associated DMA and designated source Implementation Plans) will be implemented and that the TMDL and associated allocations will be met. NPDES point sources are addressed through the DEQ and USEPA permit program. This Section will focus on nonpoint sources. Federal Lands The BLM and USFS are DMAs for federal lands in the Lost River Subbasin and both agencies have signed memorandums of agreement with DEQ. These MOAs include agreement to prepare and implement Water Quality Restoration Plans (WQRPs) addressing TMDLs. For further discussion, refer to Sections 4.3.8 and 4.3.15. Federal Irrigation Project The Bureau of Reclamation is the DMA responsible for developing a source specific implementation plan to address load allocations associated with water delivery and drainage facilities that are federally owned and/or operated in the Klamath Reclamation Project. PacifiCorp Facilities PacifiCorp is the designated source responsible for developing source specific implementation plan to address load allocations associated with their facilities. Water Management Districts Various water management districts comprised of drainage and irrigation districts are designated sources responsible for developing source specific implementation plans. Non Federal Forest Lands The Oregon Department of Forestry (ODF) is the DMA, by statute, for water quality protection from nonpoint source discharges or pollutants resulting from forest operations on non federal forestlands in Oregon. Linkage to TMDLs and legal authority are discussed in Sections 4.3.8 and 4.3.15. Agricultural Lands The Oregon Department of Agriculture (ODA) is the DMA responsible for regulating agricultural activities that affect water quality. AgWQMA Plans are the TMDL implementation mechanism for agricultural and related rural residential land use. An AgWQMA Plan has been prepared for the Upper Klamath Subbasin (Klamath Headwater AWQMP, ODA 2007) and Lost River Subbasin and ODA has institutionalized a 2-year update cycle. Voluntary Farm Plans are a key component of the SB1010 planning process. In addition, ODA has the ability to assess civil penalties when local operators do not follow their local Agricultural Water Quality Management Area rules. Legal authority is discussed in Sections 4.3.8 and 4.3.15. Urban and Rural Lands Oregon cities and counties have authority to regulate land use activities through city and county ordinances and local comprehensive land use plans. The Oregon land use planning system, administered through the Oregon Department of Land Conservation and Development, requires local jurisdictions to address water quality protection through Statewide Planning Goals 5 and 6. Both the City of Klamath Falls and Klamath County will be submitting implementation plans to fulfill their TMDL responsibilities. Voluntary Efforts and Public Funding

Upper Klamath and Lost River Subbasins TMDL
State of Oregon Department of Environmental Quality 148
Environmental watershed planning in Oregon is supported through outreach, technical assistance, monetary incentives and cost share funding through a variety of organizations and programs (refer to Sections 4.3.13 and 4.3.16). As watershed programs continue to develop and more projects are implemented, landowner adoption of water quality practices broadens through increasing knowledge, familiarity and success.
4.3.10 Monitoring and Evaluation
Monitoring and evaluation has three basic components: 1) implementation of TMDL implementation plans identified in this document; 2) management practice effectiveness monitoring and, 3) assessment of water quality improvement. DEQ generally expects that DMAs and designated sources will monitor implementation efforts and that DEQ and various natural resource organizations including DMAs and designated sources will participate in effectiveness and water quality monitoring. The information generated by each of these organizations will be pooled and used to determine whether management actions are having the desired effects or if changes in management actions and/or TMDLs are needed. This detailed evaluation (refer to Section 4.3.12) will be planned, as feasible, roughly on a five year cycle. If progress is insufficient, then the appropriate management agency will be contacted with a request for additional action. This monitoring and feedback mechanism is a major component of the “reasonable assurance of implementation” for the Upper Klamath and Lost River Subbasin WQMP. It is anticipated that monitoring efforts will consist of some of the following types of activities:
Reports on the numbers, types and locations of projects, BMPs and educational activities completed
Monitoring of channel type, width and depth
Monitoring riparian vegetation communities and shade to assess progress towards achieving system potential targets established in the TMDL
DEQ recognizes that such coordinated local efforts are important and encourages them accordingly. As available, DEQ will contribute resources to such efforts.
4.3.11 Public Involvement
DEQ believes that public involvement is essential to any successful water quality improvement process. When developing and implementing TMDL Implementation Plans, DMAs and designated sources will determine how best to provide for public involvement based on their local needs and requirements. DEQ will also promote public involvement through direct association and contact with existing groups that have an interest in the Upper Klamath and Lost River TMDL, such as watershed councils, and SB 1010 Local Advisory Committees, federal and state agencies, and others.
4.3.12 Maintaining Management Strategies over Time
In response to the Upper Klamath and Lost River Subbasins TMDL, each DMA will review their TMDL Implementation Plan or program for its effectiveness in addressing load allocations. In addition, each DMA and designated source will submit a report describing the implementation efforts underway and noting changes in water quality every five years. DEQ will review these submittals and recommend changes to individual Implementation Plans if necessary. The 303(d)/TMDL process and the management planning associated with WQRP, forest practices and agricultural planning are ongoing by design.
4.3.13 Costs and Funding
One purpose of this element is to demonstrate there is sufficient funding available to begin implementation of the WQMP. Another purpose is to identify potential future funding sources for project

Upper Klamath and Lost River Subbasins TMDL
State of Oregon Department of Environmental Quality 149
implementation. Following TMDL issuance, DEQ will work with the DMAs and designated sources to develop TMDL implementation plans that contain site specific information and costs and timelines for how the DMA would implement the TMDL. It may be necessary for DMAs and designated sources to prioritize among the strategies if resources are limited. This may mean addressing some sources of pollution before others or focusing implementation efforts in a particular geographic area. To the extent possible, the selection of priorities should be driven by the greatest opportunities for achieving pollutant reductions. DMAs and designated sources may need to conduct a fiscal analysis to determine what additional resources are necessary to develop, implement, and maintain the management strategies, and how these resources will be obtained. The results of this analysis could be briefly described in the implementation plan. The cost of restoration projects varies considerably and can range from zero cost, or even profit due to improvements, to full channel reconstruction and land acquisition which can cost hundreds of thousands of dollars per river mile. Restoration can be passive or active. Passive restoration results from removing stresses to the channel, vegetation and floodplain and allowing the river system to naturally recover. Active restoration involves channel construction, installation of structures to capture sediment or re-direct water, etc., and tends to cost more than passive. Passive restoration can be accomplished through measures such as fencing or allowing natural vegetation to grow between farm fields and streams. Different measures are appropriate for different management styles, land uses, and types of geomorphic or vegetative impairment. Restoration can be accomplished by simply changing management as a matter of business, such as changing the timing of pasture use. Given these complexities and uncertainties, a cost analysis is not attempted here. It is expected that DMAs will conduct a cost and funding analysis as part of the Implementation Planning process. Potential Sources of Project Funding Financial assistance is provided through a mix of cost-share, tax credit, and grant funded incentive programs designed to improve on-the-ground watershed conditions. Some of these programs, due to the sources of their funding, have specific qualifying factors and priorities. The following is a partial list of assistance programs available in the Subbasin. Program Agency/Source Oregon Plan for Salmon and Watersheds OWEB Environmental Quality Incentives Program USDA-NRCS Wetland Reserve Program USDA-NRCS Conservation Reserve Enhancement Program USDA-NRCS Stewardship Incentive Program ODF Access and Habitat Program ODFW Partners for Wildlife Program USDA-FSA Conservation Implementation Grants ODA Conserved Water Program and other water projects WRD Nonpoint Source Water Quality Control (EPA 319) DEQ-EPA Riparian Protection/Enhancement COE State Revolving Fund low interest loans DEQ-EPA Nonpoint Source Pollution Reduction Tax Credit DEQ Grant funds are available for water quality improvement projects, typically on a competitive basis. Field specialists assist landowners in identifying, designing, and submitting eligible projects for these grant funds. Assistance is available through the Klamath County Soil and Water Conservation District.
4.3.14 Citation of Legal Authorities
Clean Water Act Section 303(d) Section 303(d) of the 1972 Federal Clean Water Act as amended requires states to develop a list of rivers, streams and lakes that cannot meet water quality standards without application of additional

Upper Klamath and Lost River Subbasins TMDL
State of Oregon Department of Environmental Quality 150
pollution controls beyond the existing requirements on industrial sources and sewage treatment plants. Such water bodies are referred to as “water quality limited”. Water quality limited water bodies are identified by DEQ. DEQ updates the list of water quality limited waters every two years. The list is commonly referred to as the 303(d) list. Section 303(d) of the Clean Water Act further requires that Total Maximum Daily Loads (TMDLs) be developed for all waters on the 303(d) list. Oregon Revised Statute The Oregon Department of Environmental Quality is authorized by law to prevent and abate water pollution within the State of Oregon pursuant to ORS 468B.015, which declares that it is the public policy of the state to maintain and protect quality of waters of the state. The statute ORS 468B.020 (Prevention of pollution) provides that: (1) Pollution of any of the waters of the state is declared to be not a reasonable or natural use of such waters and to be contrary to the public policy of the State or Oregon, as set forth in ORS 468B.015. (2) In order to carry out the public policy set forth in ORS 468B.015, the department shall take such
action as is necessary for the prevention of new pollution and the abatement of existing pollution by:
(a) Fostering and encouraging the cooperation of the people, industry, cities and counties, in order to prevent, control and reduce pollution of the waters of the State; and
(b) Requiring the use of all available and reasonable methods necessary to achieve the purposes of ORS 468B.015 and to conform to the standards of water quality and purity established under ORS 468B.048.”
Oregon Administrative Rules The following Oregon Administrative Rules provide numeric and narrative criteria (water quality standards):
Antidegradation – OAR 340-041-0004 Statewide Narrative Criteria – OAR 340-041-0007
Forest Practices The Oregon Forest Practices Act (FPA) was enacted in 1971. The Board of Forestry has adopted water protection rules, including but not limited to OAR Chapter 629, Divisions 635-660, which describes BMPs for forest operations. The Environmental Quality Commission (EQC), Board of Forestry, DEQ and ODF have agreed that these pollution control measures will be relied upon to result in achievement of state water quality standards. Forest operators conducting operations in accordance with the Forest Practices Act (FPA) are considered to be in compliance with water quality standards. In areas where a TMDL has been approved, site specific rules under the Forest Practices Act rules will need to be revised if the department determines that the generally applicable Forest Practices Act rules are not adequate to implement the TMDL load allocations. A 1998 Memorandum of Understanding between both agencies guides the implementation of this agreement, as described in Section 4.3.8. ODF and DEQ statutes and rules also include provisions for adaptive management that provide for revisions to FPA practices where necessary to meet water quality standards. These provisions are described in ORS 527.710, ORS 527.765, ORS 183.310, OAR 340-041-0026, OAR 629-635-110, OAR 340-042-0080 and OAR 340-041-0120. Agricultural Lands The Oregon Department of Agriculture (ODA) is the DMA responsible for regulating agricultural activities that affect water quality through the Agricultural Water Quality Management Act of 1993 (SB1010, ORS 569.000 through 568.933) and Senate Bill 502 (adopted 1995, ORS 561.191). SB1010 directs ODA to work with local communities, including farmers, ranchers, and environmental representatives, to develop Agricultural Water Quality Management Area Plans (AgWQMAP) and rules

Upper Klamath and Lost River Subbasins TMDL
State of Oregon Department of Environmental Quality 151
throughout the State. SB502 stipulates that ODA “shall develop and implement any program or rules that directly regulate farming practices that are for the purpose of protecting water quality and that are applicable to areas of the state designated as exclusive farm use zones or other agricultural lands.” The plans are accompanied by regulations in OAR 603-90 and portions of OAR 603-95, which are enforceable by ODA. As discussed in Section 4.3.8, TMDL implementation coordination between ODA and DEQ is guided by an MOA signed in 2012 and according to OAR 340-042-0080. Federal Land Managers DEQ maintains Memorandums of Agreement with BLM and the USFS; both were signed in July, 2003. The MOAs define processes by which the agencies will work with DEQ to meet State and Federal water quality rules and regulations. This agreement recognizes the BLM and USFS as DMAs for the lands they administer in Oregon, and clarifies that WQRPs are the TMDL Implementation Plans for these agencies.
4.4 TMDL - Related Programs, Incentives and Voluntary Efforts
TMDLs in Oregon are designed to coordinate with and support other watershed protection and restoration efforts. Watershed enhancement in the Upper Klamath and Lost River Subbasins is ongoing and is, for the most part, consistent with or directly implements the load allocations of the TMDL. While regional programs are in place, much of the restoration is locally based. Collectively, these organizations and programs produce technical assistance, financial assistance, restoration opportunities, outreach, discussion forums, incentives and planning.
4.4.1 Water Quality Credit Trading Opportunities
The Department encourages Klamath Basin DMAs to develop a basin-specific, water quality credit trading program that meets the TMDL allocations for the Upper Klamath and Lost River Subbasins. Water quality credit trading is an innovative TMDL implementation approach to achieve water quality goals more efficiently. Trading is based on the fact that sources in a watershed can face very different costs to control the same pollutant. Trading programs allow facilities facing higher pollution control costs to meet their regulatory obligations by exchanging environmentally equivalent (or superior) pollution reductions from another source at lower cost, thus achieving the same water quality improvement at lower overall cost. The successful trading process allows a source with high TMDL implementation costs to exchange the same or greater level of load reduction from other sources with lower costs. For more information please refer to DEQ’s web page on water quality credit trading at http://www.deq.state.or.us/wq/trading/faqs.htm. Water Quality Improvement Accounting and Tracking Program DEQ and California Regional Water Board staff in coordination with US EPA, and PacifiCorp, have begun developing a Klamath River basin water quality improvement accounting and tracking program . This program will provide a record of individual actions and, perhaps, the basis for a market that facilitates a higher level of activity and collaboration than could be achieved by a regulatory approach alone. These attributes include:
A large, geographically complex watershed that straddles two states, six tribes and two EPA regions thus requiring a framework for project collaboration that extends beyond the jurisdiction of any individual participant;
Numerous and diverse sources of water quality impairments that vary widely in costs and feasibility of control strategies;

Upper Klamath and Lost River Subbasins TMDL
State of Oregon Department of Environmental Quality 152
Significant influence of nonpoint sources of pollutants, particularly from upstream sources in the basin, on water quality throughout the basin;
The presence of dams that are under consideration for removal in the relatively near future thus reducing the desirability of long-term investments in reducing their near-term water quality impacts; and
A large number of regulatory programs with overlapping goals and drivers that would benefit from coordinated action.
The Tracking and Accounting Program provides a mechanism that would allow for collaboration among basin stakeholders on common projects while earning credit towards their regulatory requirements related to TMDLs and other mandated programs (e.g., Klamath hydro settlement agreement interim measures, state and federal Endangered Species Acts). Program Goals The overall program goals are to achieve water quality improvements required in all Klamath Basin TMDLs, in a manner that is consistent with state and federal policy and regulations, is technically sound, and is tailored to meet the specific needs and conditions in the Klamath Basin. More specifically, the goals are to develop a basinwide accountability program to track water quality improvements, facilitate planning, and coordinate TMDL implementation based upon a market-like system. The Tracking and accounting Program should also:
Provide a decision tool to guide expenditure of implementation resources towards projects with greatest/earliest impact.
Encourage the pooling of resources to support engineered solutions and enable the spending of resources across state boundaries by tracking and accounting for the contribution of each project participant.
Program Objectives Establish and operate a program for tracking water quality improvements that:
Encourages early reductions and progress towards water quality improvements;
Reduces the cost of TMDL implementation through greater efficiency and flexible approaches;
Creates economic incentives for innovation, emerging technology, voluntary pollutant reductions from all sources, and for potential trading and/or offsets amongst these sources;
Achieves ancillary environmental benefits beyond the required reductions in specific pollutant loads, such as the creation and restoration of wetlands, floodplains and fish and/or waterfowl habitat;
Establishes an accountability Program whereby a common metric (or sets of metrics) is/are used for estimating and tracking water quality improvements;
Establishes a credible baseline, linked to the two states’ TMDLs, and incorporates effectiveness monitoring and an adaptive management approach;

Upper Klamath and Lost River Subbasins TMDL
State of Oregon Department of Environmental Quality 153
Uses standardized protocols to quantify pollutant loads, load reductions, and credits / offsets, or other water quality improvements (e.g., stream channel restoration) that contribute to supporting conditions for beneficial uses;
Recognizes cross-pollutant benefits (e.g. acknowledges that upstream nutrient reductions can improve downstream low dissolved oxygen levels and algal bloom conditions); and Allows participants to contribute to program-sponsored projects without having to develop partner-specific agreements or contracts thus minimizing administrative and transaction costs.
4.4.2 Local Collaborative Watershed Enhancement Processes
The following is a list of several broad-scale watershed enhancement processes or programs in the Lost River and Upper Klamath Subbasins. Some overlap the state border. US Fish and Wildlife Service, Ecological Restoration office and US Bureau of Reclamation provide funding for potential projects that enhance and restore habitat conditions, improve water-quality conditions, remove fish-passage barriers, reduce entrainment through the installation of fish screens, and result in water conservation efficiencies. The Klamath Tribes fisheries program includes substantial resources invested in monitoring and watershed restoration efforts to achieve recovery of Lost River and shortnose suckers (c'waam and qapdo, respectively) and assist in reintroduction of coho salmon into the upper basin. Habitat restoration and water quality improvements that help the c'waam and qapdo recover will also help restore healthy populations of the threatened coho salmon in downstream Klamath River waters. The Klamath Basin Rangeland Trust is actively engaged in restoration and conservation of the quality and quantity of water in Oregon's Wood River Valley and the upper Klamath Basin to enhance the natural ecosystem and supply needed water for downstream agriculture, ranching, native fish and wildlife populations. The Klamath Basin Watershed Partnership is working to conserve, enhance and restore the natural resources of the Klamath Basin, while ensuring the long-term sustainability of the regional economy and local communities.
4.4.3 The Oregon Plan for Salmon and Watersheds The Oregon Plan for Salmon and Watersheds represents a major process, unique to Oregon, to improve watersheds and restore endangered fish species. The Plan consists of several essential elements:
(1) Coordinated Agency Programs Many state and federal agencies administer laws, policies, and management programs that have an impact on salmonids and water quality. These agencies are responsible for fishery harvest management, production of hatchery fish, water quality, water quantity, and a wide variety of habitat protection, alteration, and restoration activities. Previously, agencies conducted business independently. Water quality and salmon suffered because they were affected by the actions of all the agencies, but no single agency was responsible for comprehensive, life-cycle management. Under the Oregon Plan, all government agencies that impact salmon are accountable for coordinated programs in a manner that is consistent with conservation and restoration efforts. (2) Community-Based Action

Upper Klamath and Lost River Subbasins TMDL
State of Oregon Department of Environmental Quality 154
Government, alone, cannot conserve and restore salmon across the landscape. The Oregon Plan recognizes that actions to conserve and restore salmon must be worked out by communities and landowners, with local knowledge of problems and ownership in solutions. Watershed councils, soil and water conservation districts, and other grassroots efforts are vehicles for getting the work done. Government programs will provide regulatory and technical support to these efforts, but local people will do the bulk of the work to conserve and restore watersheds. Education is a fundamental part of the community based action. People must understand the needs of fish and wildlife, and how rivers function, in order to make informed decisions about how to make changes to their way of life that will accommodate clean water and the needs of fish.
(3) Monitoring The monitoring program combines an annual appraisal of work accomplished and results achieved. Work plans will be used to determine whether agencies meet their goals as promised. Biological and physical sampling will be conducted to determine whether water quality and salmon habitats and populations respond as expected to conservation and restoration efforts.
(4) Appropriate Corrective Measures The Oregon Plan includes an explicit process for learning from experience, discussing alternative approaches, and making changes to current programs. The Plan emphasizes improving compliance with existing laws rather than arbitrarily establishing new protective laws. Compliance will be achieved through a combination of education and prioritized enforcement of laws that are expected to yield the greatest benefits for salmon.
4.5 References DEQ, 1997. Guidance for Developing Water Quality Management Plans that will Function as TMDLs for Nonpoint Sources. DEQ and Oregon Department of Land Conservation and Development, 1994. Nonpoint Source Pollution Control Guidebook for Local Government. DEQ and Oregon Department of Land Conservation and Development, 2000. Water Quality Model Code and Guide Book, http://www.deq.state.or.us/wq/. Oregon Department of Environmental Quality, North Coast Regional Water Quality Control Board, Region 9 and 10 U.S. Environmental Protection Agency. 2009. Memorandum of Agreement Klamath River/Lost River TMDL Implementation USDA Forest Service, USDI Bureau of Land Management, Environmental Protection Agency, 1999. Forest Service and Bureau of Land Management Protocol for Addressing Clean Water Act Section 303(d) Listed Waters.