ups and downs to what extent is this the worst economic downturn in over 30 years? nick...
TRANSCRIPT

Ups and Ups and DownsDowns
To what extent is this the To what extent is this the worst economic downturn in worst economic downturn in
over 30 years? over 30 years?
Nick Langston-AbleNick Langston-AbleESRC Festival of Social ScienceESRC Festival of Social Science
The Future of EconomicsThe Future of Economics
Bristol University November 2011Bristol University November 2011
www.economicsrevealed.co.ukwww.economicsrevealed.co.uk
www.economicsrevealed.blogspot.comwww.economicsrevealed.blogspot.com

The 1980s – a reminder The 1980s – a reminder ……

Economic GrowthEconomic Growth
CHART 7.1: LONG TERM TRENDS IN GDP
-4
-2
0
2
4
6
8
1956 1962 1968 1974 1980 1986 1992 1998 2004
AN
NU
AL
% C
HA
NG
E LONG TERM AVERAGE
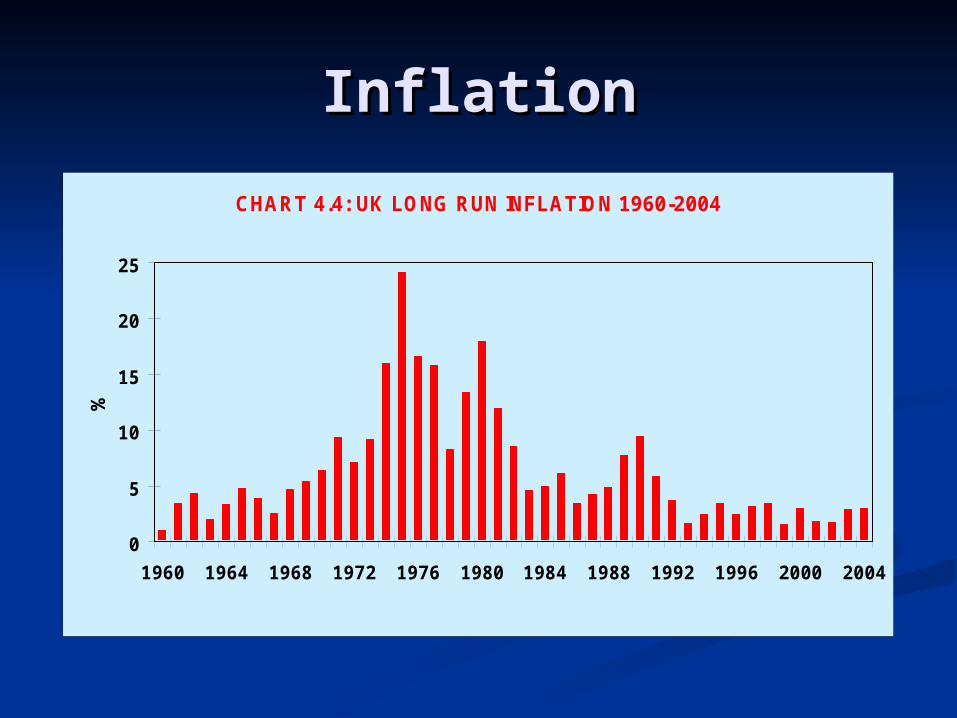
InflationInflation
CHART 4.4: UK LONG RUN INFLATION 1960-2004
0
5
10
15
20
25
1960 1964 1968 1972 1976 1980 1984 1988 1992 1996 2000 2004
%

Interest RatesInterest Rates
CHART 6.2: INTEREST RATES - THE NEW STABILITY
0
2
4
6
8
10
12
14
16
18
1977 1980 1983 1986 1989 1992 1995 1998 2001 2004
AVERAGE FOR PERIOD
%
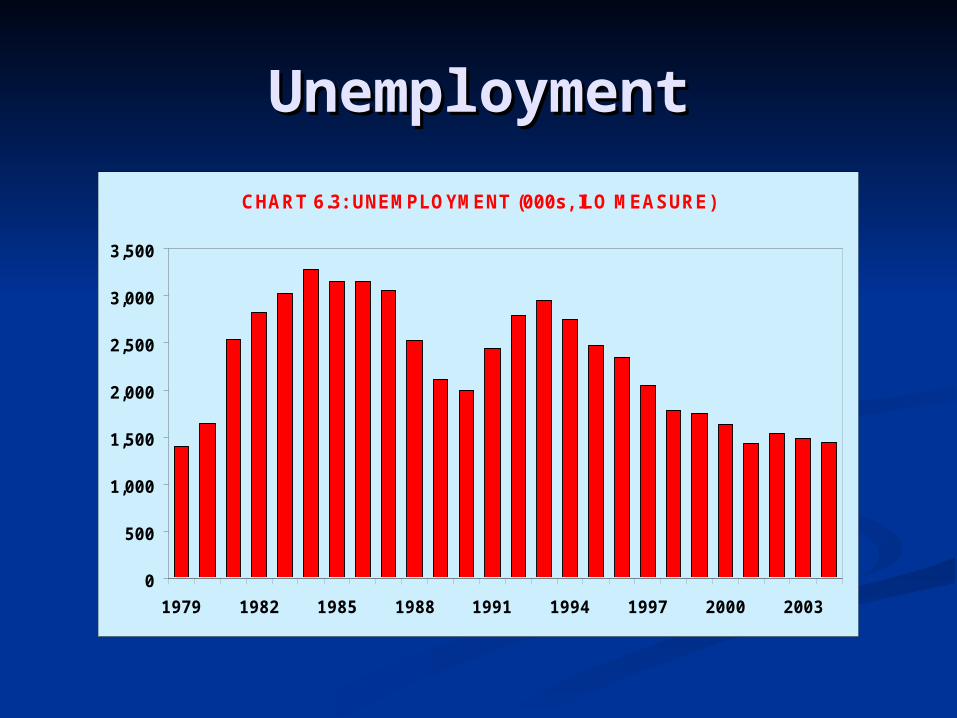
UnemploymentUnemployment
CHART 6.3: UNEMPLOYMENT (000s, ILO MEASURE)
0
500
1,000
1,500
2,000
2,500
3,000
3,500
1979 1982 1985 1988 1991 1994 1997 2000 2003

Government SpendingGovernment Spending
-10
0
10
20
30
40
50
1960 1964 1968 1972 1976 1980 1984 1988 1992 1996 2000 2004
%
CURRENT RECEIPTS
CURRENT EXPENDITURE AND DEPRECIATION
SURPLUS
DEFICIT
CHART 4.5: PUBLIC SECTOR CURRENT RECEIPTS, EXPENDITURE AND BUDGET SURPLUS (% OF GDP)

BoP Current AccountBoP Current Account
CHART 17.10: THE CURRENT ACCOUNT
-30,000
-25,000
-20,000
-15,000
-10,000
-5,000
0
5,000
10,000
1948 1952 1956 1960 1964 1968 1972 1976 1980 1984 1988 1992 1996 2000 2004
£ M
ILL
ION
-12
-10
-8
-6
-4
-2
0
2
4
%
CURRENT ACCOUNT (LHS)% GDP (RHS)
Your very own recessionYour very own recession
Is the current recession the worst in Is the current recession the worst in the last 30 years and is it the worst the last 30 years and is it the worst you will experience?you will experience?

Economic Growth Economic Growth (worse)(worse)

Inflation (better)Inflation (better)

Interest Rates (better!)Interest Rates (better!)

Unemployment (better)Unemployment (better)

BoP Current BoP Current Account Account
(worse than 1980-82 but better than 1990-92)(worse than 1980-82 but better than 1990-92)

Govt Borrowing (worse)Govt Borrowing (worse)

Government Spending Government Spending ComparisonsComparisonsGovernment Expenditure & Tax Burden (% GDP)
0
10
20
30
40
50
60
Country (source: Heritage Foundation / Wall Street Journal 2011)
% G
DP
Tax Burden % GDP
Govt. Expenditure % GDP

ConclusionConclusion
The evidence suggests that the The evidence suggests that the current economic downturn is not as current economic downturn is not as bad as previous downturns. Inflation bad as previous downturns. Inflation is much less of a problem, interest is much less of a problem, interest rates are low and whilst rates are low and whilst unemployment is high, it has still not unemployment is high, it has still not reached levels seen in the 1980s and reached levels seen in the 1980s and early 1990s. Put simply – we’ve had early 1990s. Put simply – we’ve had it worse.it worse.

Conclusion 2Conclusion 2
The evidence suggests that this is indeed The evidence suggests that this is indeed the worst economic downturn in over 30 the worst economic downturn in over 30 years. Whilst there has been less of a years. Whilst there has been less of a problem with inflation and high interest problem with inflation and high interest rates, unemployment is almost as high rates, unemployment is almost as high and may well still rise. The government and may well still rise. The government is also running a large budget deficit in is also running a large budget deficit in addition to the UK experiencing a addition to the UK experiencing a reasonably large current account deficit. reasonably large current account deficit. Put simply – we’re doomed. Put simply – we’re doomed.

Conclusion 3Conclusion 3 The extent to which this is the worst The extent to which this is the worst
economic downturn in over 30 years is up economic downturn in over 30 years is up for debate. There are a number of for debate. There are a number of indicators which suggest this may be the indicators which suggest this may be the case but equally there are other indicators case but equally there are other indicators which suggest that the UK experienced which suggest that the UK experienced worse problems in the 1980s and 1990s. It worse problems in the 1980s and 1990s. It is also difficult to judge the nature of the is also difficult to judge the nature of the current downturn in terms of whether the current downturn in terms of whether the UK is past the worst and how long a UK is past the worst and how long a recovery might take. Put simply – dunno recovery might take. Put simply – dunno really.really.

Thank YouThank You
Nick Langston-AbleNick Langston-Able
www.economicsrevealed.co.ukwww.economicsrevealed.co.uk
www.economicsrevealed.blogspot.comwww.economicsrevealed.blogspot.com