uranium mining in haliburton, a look at the current status ... · 1 uranium mining in haliburton, a...
TRANSCRIPT

1
Uranium Mining in Haliburton, A Look at the Current Status, Indicators and a Public Health Guide
Tandin Wangmo Devon Smith
Scott Baker Mary McBride
Cromwell Adugbo Holly Norris

2
Table of Contents
Current State of Uranium Mining in Haliburton…………………………………………3
History and Current State of Uranium Mining in Haliburton……………. ……..3
Role of Government Officials and the Public in the Uranium Issue……………..4
Mapping Project…………………………………………………………………………..8
Introduction to the Mapping Project………………………………………………8
Outline of the Maps for Future Researchers in the Haliburton area……………....8
Outline of the Maps for Viewing………………………………………………....11
Environmental Impacts of Uranium Mining on the Environment, Plants, and Organisms…………………………………………………………………………….. ....13
Impact on the Environment…………………………………………………… ....13
Impact on Plants and Organisms………………………………………………….14
Monitoring Uranium in the Environment ………………….............……………………..15 I. Biomonitoring: Bioindicators and Biomarkers….............................…..15
II. Quantitative approach………………………………………….……....17
Proposed Monitoring Methods……………………………….…...18
Public Health Guide to Reduce Exposure to Uranium and Radon Gas ……………….…22
What is Radon?.......................................................................................................22
How does Radon get into your home?....................................................................22
Why is Radon a Health Risk?.................................................................................23
How Can you test for Radon in your Home?.........................................................23
What should you do if there are Radon Levels in your Home?.............................26
How can you test for Uranium and Radon in your Well Water?...........................27
What Should you do if your Well Water is Contaminated?...................................28
References………………………………………………………………………………..29

3
Current State of Uranium Mining in Haliburton
What is the history and current state of Uranium mining in Haliburton?
Haliburton has a long history of mining throughout the county, including approximately
60 abandoned mines. Of those old mines, 18 were extracting either uranium or some form of
radioactive mineral, the names of the mines being: Bicroft Mine, Canada Radium Mine, Cardiff
Uranium Mine, Centre Lake Uranium Mines, Croft Mine, Dyno Mine, Halo Mine, Kemp
Uranium Mine, Kenmac Chibougamau Mine, Richardson Mine (Fission Mine), Tripp Mine (Nu-
Age Mine), West Lake Mine, Nu-World Uranium Mine, Canadian All Metals Mine, Rare Earth
Mine No. 2, Millar’s Mine, Saranac Mine, and Desmont Mine (mindat.org). The age of the
uranium mines ranges from as early as 1900, but all closing by the 1970’s. Only recently are
mining companies being held responsible for the restoration and rehabilitation of the mining and
tailing sites after a mine is closed, leaving all of these sites contaminated and potentially
hazardous. Because all of the uranium and radioactive mineral mines in Haliburton have been
closed for close to 40 years, the old companies have no obligation to the cleanup of Haliburton’s
abandoned mines.
Looking through the Ontario Government’s website on Mining Claim Information, some
records of posted, active and cancelled staking claims throughout Ontario were found. For
Haliburton County, for posted claims, there were four in Monmouth, one posted March 3rd and
4th, and two on January 27th, 2010 (Mining Claim Information). There are 19 active claims in
Cardiff Township, and 25 in Monmouth Township, starting in 2009 running until 2011 (Mining
Claim Information). There are 3 cancelled claims in Monmouth Township, but these can easily
be reclaimed by another prospector, if they have not been already (Mining Claim Information).
According to the Ontario Government website, there are no active mines in the region. A map
showing regional contaminants studied in the Haliburton and Bancroft County of Ontario is
provided by the Ontario government. The map shows approximately 86 abandoned mines in
Haliburton County, the majority of which are between the towns of Gooderham and Wilberforce.
4
An old documented record of the Legislative Assembly of Ontario, on December 8th,
1988 mentions the Dyno Mine and a few other abandoned mines in the area. The topic of
abandoned mines was briefly discussed in this meeting as the issue of who is responsible for
abandoned mines was brought up by Mr. Pollock (no other information was provided). Mr.
Pollock told that the Madawaska Mine (uranium mine) was planned on being terminated on
November 30th, 1988, but was postponed, and now the issue of who will take on the mine has
been raised. The fact that neither the provincial or federal government will accept the abandoned
mines, and that they are freely accessible to the public should be a great concern for both
governments (Dyno Mine and Bicroft Mine). The Dyno Mine has been closed since 1960,
producing 363,758 kg of U308 while the Bicroft Mine closed in 1963, producing 2,016,693 kg of
U308, making both old mines, which should have more of the government’s attention when
looking at public access and clean up (mindat.org). The government has been informed that
mine tailings were not covered and are being blown by the wind; the final statement of the record
was “[t]his will have to be addressed.” which leaves the situation of these abandoned mines open.
After spending hours searching through the Ontario Government’s website for any
information regarding Haliburton, uranium, and the Dyno Mine, few links were available. There
were a number of maps of the area containing information about contamination sources,
groundwater quality, aquifer water quality, recharge-discharge areas and flows, and well
references for the Haliburton and Bancroft region. These maps could be used to understand how
water flows through and away from Haliburton County, and solve issues with contamination
within the region. Overall, the Ontario Government’s website did not contain a significant
amount of information about mining in Haliburton or specific mines in the area. It is important
that the government attend to the issues of abandoned mines, especially those in Haliburton
County so that the chance of widespread contamination is eliminated.
What is the role of government officials and the public in the Uranium issue? The Ontario Government has an interesting list of requirements and policies around who
can mine where and when. There is a very informative document on the Ontario Government’s
5
website titled, “Facts about Exploration and Mineral Development in Ontario”, which talks about
the current policies and recommendations provided to mining companies and the general public
from the Ontario Mining Act. The document explains what a company looking for minerals is
and is not allowed to do on private and Crown land. In some cases permits are required while in
other situations, permission from the land owner is required; it is completely dependent on the
situation.
The document outlines how a company or person will stake a claim to an area of land in
order to look for desired minerals, the document also says that very few claims ever become
mines (1 in 10,000). The next step is to complete assessment work on the site, which is required
by law, or the claim will be taken away from the prospector. A claim gives the prospector the
right to explore for minerals, but in order to start mining the prospector must purchase a mining
lease for the surface rights or the mining rights, or for both. From there the prospector will either
cancel the drilling or start the process to begin mining, depending on if it is profitable.
The laws within the Mining Act have a number of areas where land owners are not
protected. For example, a land owner may own their property but may not own the soil, the
mining right of the soil or beneath it, or the trees on the property. In the event that a landowner
does not own all the rights to their land, a prospector wishing to mine on that land has to provide
the landowner with a maximum 24 hours notice before work begins (Facts about Exploration, pg
2). One distinctive word about this document that is consistently used is ‘recommends’. The
Government uses this word to show that they have suggested the ethical thing for the companies
to do in the situation that of mining on private property. The main problem with the extensive
use of this word is that there are no responsibilities, repercussion, or penalties for companies who
do not follow the recommendations. Examples of such recommendations include,
recommending contacting the land owner more than 24 hours in before drilling, recommending
the prospector keeps open dialogue with the land owner, and encouraging written agreements in
the rehabilitation of the site once the extraction is complete. One section within the Mining Act
(Section 23) does protect land owners from prospectors, and that is that staking and claiming is
not allowed on land where there is a dwelling, cemetery, public building, garden, orchard or

6
crops without permission from the surface owner; this Section can also cover recreational areas
(Facts about Exploration, pg 4).
There is a document that is a follow up to the previous, titled, “Frequently Asked
Questions - Mineral Staking in Ontario”. In this document one frequently asked question is “are
you planning any changes to the Mining Act?”, which was followed by a long winded answer
saying that in 2006 the Ontario government created an Ontario’s Mineral Development Strategy
which is trying to ‘address concerns’ about surface, land and mineral owners rights, and staking
methods in southern Ontario (FAQ Mineral Staking in Ontario, pg 3). A subcommittee, named
the Minister’s Mining Act Advisory Committee is reviewing issues within the current Mining
Act including notification and consent requirements and environmental impacts of staking and
prospecting.
In the 2005-2006 Annual Report by the “Chief Drinking Water Inspector” two areas
close to the Dyno Mine were tested for water quality, the Dyno Estates Well Supply and the
Cardiff Well Supply both with >95-100% inspection rating and with 100.00% and 99.01% water
quality respectfully (Chief Drinking Water Inspector Annual Report 2005-2006, pg85). The
water was inspected for mircobial (i.e. E. coli), chemical concentrations and aesthetics (i.e. smell,
colour, taste); it was mentioned that radiological testing was not completed (Chief Drinking
Water Inspector Annual Report 2005-2006, pg.30). The report did say there was testing for
Uranium in some regions of Ontario, but did not list which ones. There was an example of an
unknown location having 0.020mg/L of uranium in the water under the O.Reg standards, which
were not outlined (Chief Drinking Water Inspector Annual Report 2005-2006, pg 40). The
example also states that uranium in low levels is normal in rock, soil and water, and that “short-
term exceedances” do not pose a health risk to humans (Chief Drinking Water Inspector Annual
Report 2005-2006, pg 40). The word exceedance here means the amount of the contaminant
exceeds the standard acceptable level for humans to be in contact with (Dictionary.com). The
number of exceedances in Ontario found at system serving designated facilities (municipal
treatment sites) in 2005-2006 was zero, but in 2004-2005, two were found (Chief Drinking
Water Inspector Annual Report 2005-2006, pg 45). On the other hand, in Non-Municipal Year-
Round Residential Systems (wells), or NMYRR, in 2005-2006, uranium was found at 4 sites,

7
while in 2004-2005, only 1 site was found with uranium (Chief Drinking Water Inspector
Annual Report 2005-2006, pg 50).
Haliburton has a number of community groups fighting to stop the exploration of
uranium in the county, as well as the cleanup of contaminated sites. These groups include,
Environment Haliburton (EH!), Cottagers Against Uranium Mining and Exploration (C.U.M.E.),
Fight Uranium Mining and Exploration (F.U.M.E.), and The Community Coalition Against
Mining Uranium (CCAMU). These groups take part in community forums, public meetings and
government meetings to make their opinions and views known to the different levels of
government. Having this many community groups in such a small area working towards strong
common goals shows the potential the community has in making a impact with not only the local
government, but provincial and federal as well.
To contact the Encana West Limited (potentially a new name) attempt to - get access to the
Environmental Impact Assessment of the mine - what their state of the mine is - any remediate
plans for the site or area - any data or maps of the area - any PR info or aid.
There were two phone numbers on a large sign board posted on the gate of the Dyno
Mine in Wilberforce, Ontario. The first phone number was to the office of Andy with EWL
(Encana West Limited) in Alberta Canada. The phone number (403-645-7861) is similar to
other numbers listed on the Encana West Limited webpage, also from Alberta. The second
phone number was from the Central Ontario (613-332-4003). The message from calling the first
phone number stated that Andy, is conducting field work and will be out of the office for some
time, but does not provide a last name, job title or alternate phone number to be reached at. The
phone number leads to the house of Sam Pataran who lives just north of Bancroft
(yellowpages.ca). I am unsure if the second phone number has been used again for a personal
phone, or what relationship Sam Pataran has with Dyno Mine. Maybe at a later date with more
information about this particular mine, these phone numbers may be more helpful.

8
Uranium Mining in Haliburton Ontario- Mapping Proje ct Introduction The purpose of this mapping project is to combine the knowledge about the geographic
landscape and uranium deposits of Haliburton County. All maps and geospatial information was
obtained from the MNMD (Ministry of Northern Mines and Development) through their MDI
(Mineral Deposit Inventory). There is no present uranium mining in Halliburton County
(MNMD 2 2004) but there are various uranium deposits as well as past mining. The form of
uranium found naturally in the environment is Triuranium octoxide (U3O8) (MNMD1 2004). The
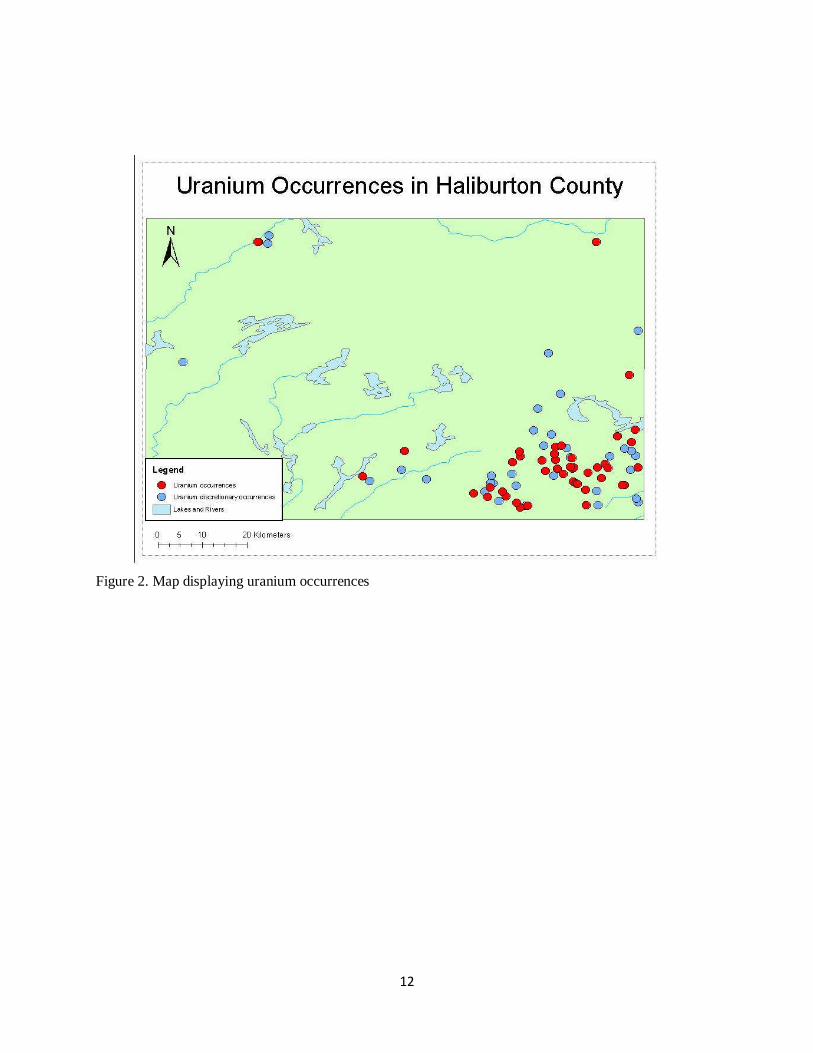
presence of uranium is differentiated in the MNMD inventory (MNMD1 2004) as: Occurrence,
Discretionary Occurrence, Prospect, Past Producing Mine With Reserves, and Past Producing
Mines Without Reserves.
Occurrence: two dimensional section of material that has U3O8 concentration of at least 0.03% or
(300ppm).
Discretionary Occurrence: An occurrence or deposit which does not meet any MNDM criteria
for uranium concentration but is recorded as a subject decision by an MNDM geologist.
Prospect: A three dimensional section of material that has U3O8 concentration of at least 0.03%
for at least 1 m2.
Past Producing Mine With Reserves: Concentration of U3O8 at least 0.05% on average for one
tonne of material. Reserves meet minimum grade/tonnage standards.
Past Producing Mines without Reserves: Concentration of U3O8 at least 0.05% on average for
one tonne of material. Reserves DO NOT meet minimum grade/tonnage standards.
Outline of the Maps for the Future Researcher Files found at the MNDM website Found in file “geospatial data”

9
Folder File Name Description Admin layer Twp_area Geographic Townships and NTS map areas Drainage_ll Major rivers Lakes_ll Major lakes Lat_long_ll Latitude and Longitude in 1 degree increments resbnd2000nad27 Resident Geologist District Boundaries Bedrock Bedrock_ll 1:1 000 000 bedrock geology of Ontario Dikes_ll 1:1 000 000 dikes Faults_ll 1:1 000 000 faults Gran_ll 1:1 000 000 granulites Iron_formations_ll 1:1 000 000 iron formations Kimberlites_ll Known kimberlite locations MDI data Prod_mine Producing Mine Past_prod_w_res Past Producing Mine with Reserves Past_prod_wo_res Past Producing Mine without Reserves Dev_prosp_w_res Developed Prospect with Reserves Dev_prosp_wo_res Developed Prospect without Reserves Prosp Prospect Occur Occurrence Disc_Occur Discretionary Occurrence Mdi_all All MDI points, this theme is not included in the project User produced files Found in file “geospatial data”
GIS copies of the output maps can be found in “Working Maps”
Folder File Name Description Admin layer Haliburton Polygon shape file the encompasses Haliburton County as
defined by the MNDM H_lakes_II Lakes within the spatial extent of Halibutron H_drainage_II River’s and other drainage system in the spatial extent of
Haliburton MDI data Uranium_points All uranium differentiation s in Ontario H_Uranium_point All uranium points within the special extent of Haliburton DO_H_Uranium_p
oints Discretionary occurrence uranium points within the special extent of Haliburton
O_H_Uranium_points
Occurrence uranium points within the special extent of Haliburton
PPR_H_Uranium_points
Past producing mine with reserves uranium point within the special extent of Haliburton
PPWOR_H_Uranium_points
Past producing mine without reserves uranium point within the special extent of Haliburton
P_H_Uranium_points
Prospect uranium points within the special extent of Haliburton
10
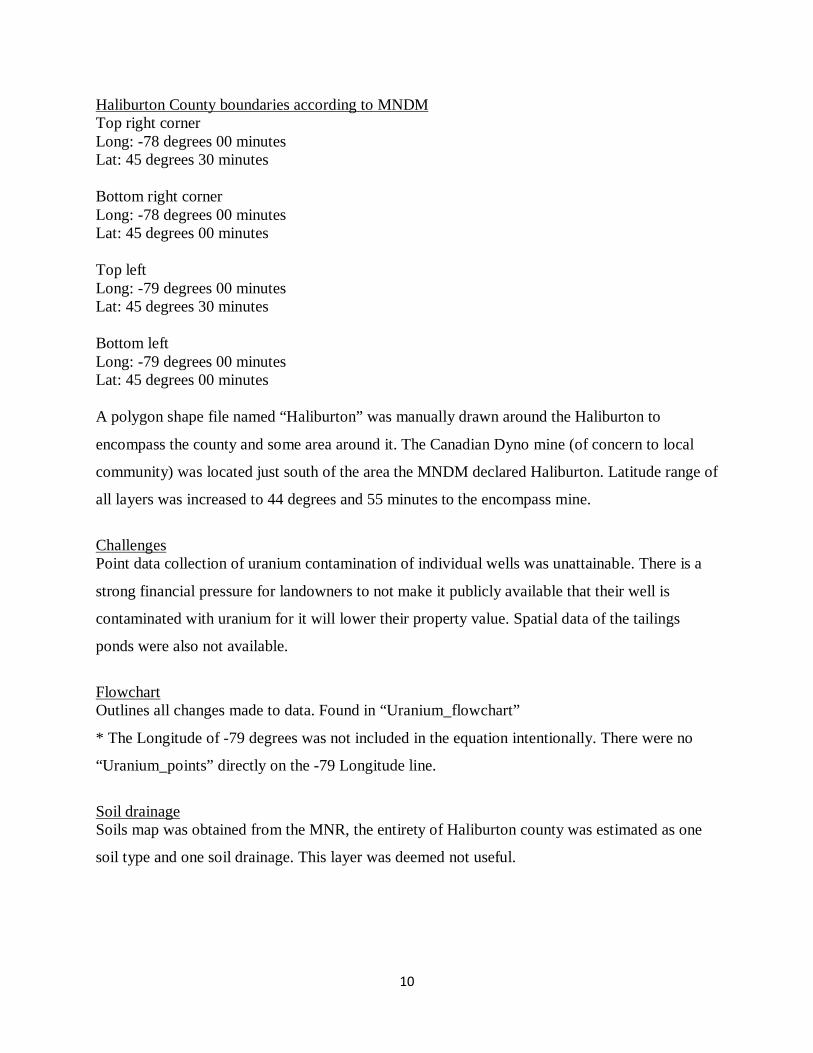
Haliburton County boundaries according to MNDM Top right corner Long: -78 degrees 00 minutes Lat: 45 degrees 30 minutes Bottom right corner Long: -78 degrees 00 minutes Lat: 45 degrees 00 minutes Top left Long: -79 degrees 00 minutes Lat: 45 degrees 30 minutes Bottom left Long: -79 degrees 00 minutes Lat: 45 degrees 00 minutes A polygon shape file named “Haliburton” was manually drawn around the Haliburton to
encompass the county and some area around it. The Canadian Dyno mine (of concern to local
community) was located just south of the area the MNDM declared Haliburton. Latitude range of
all layers was increased to 44 degrees and 55 minutes to the encompass mine.
Challenges Point data collection of uranium contamination of individual wells was unattainable. There is a
strong financial pressure for landowners to not make it publicly available that their well is
contaminated with uranium for it will lower their property value. Spatial data of the tailings
ponds were also not available.
Flowchart Outlines all changes made to data. Found in “Uranium_flowchart”
* The Longitude of -79 degrees was not included in the equation intentionally. There were no
“Uranium_points” directly on the -79 Longitude line.
Soil drainage Soils map was obtained from the MNR, the entirety of Haliburton county was estimated as one
soil type and one soil drainage. This layer was deemed not useful.

11
Possible future research
Collect samples of ground water and determine area’s of concern. Collect geospatial data of
elevation (DEM’s available from the MRN through Trent university) and tailings ponds, to
determine area’s at risk in the case of a floor or rainstorm.
Outline of the Maps for the Viewer All maps are present in the “Maps” folder as pictures and can be viewed without GIS software. Figure 1. Map displaying past uranium mines and current prospects
12
Figure 2. Map displaying uranium occurrences
13
Environmental Impacts of Uranium Mining on the Environment, Plants, and Organisms Impact on the Environment Release of uranium into the environment which is sometimes caused by uranium mining
causes a significant impact not only to the environment but the plants and organisms in the
environment as well. Uranium is an element that occurs naturally in the environment and is also
found in low levels within rocks, soils, and water bodies (Brechignaci, 2001). However during
the extraction of uranium ore and its processing, uranium is released into the environment as a
result of how the uranium ores are processed and kept after processing. The release normally
occurs as a result of tailings ponds located at mines which are filled with uranium and the ore
processing centers which generally release uranium into the environment as a result of the
leaching of uranium into soils (Niese, 1996).
Uranium released into the air as a result of these actions also exists as dust that falls into
surface water, on plants or on soils through settling or rainfall (Niese, 1996). This then sinks into
the sediment in water or to the lower soil layers where it mixes with uranium that is already
present (Brechignaci, 2001). Surface and underground waters in the environment are
contaminated by uranium and it’s by products which causes these water bodies to be very toxic
to organisms when ingested (Ledin et al.1996). Uranium is found in soil where it may stay for
billions of years (Edwards, 1998). Although uranium itself is not particularly dangerous, some
of its decay products do pose a threat, especially radon, which can build up in confined spaces
such as basements (Edwards, 1998). While in soils, uranium causes phytotoxicity to plants that
are exposed or cultivated in that soil and this causes a significant impact on farm lands and
forested ecosystems located close to uranium mines (Pereira et al. 2009). The figure below
shows how uranium undergoes radioactive decay when released into the environment and these
processes causes it to change into new and hazardous substances in the environment when
released into the environment (Edwards, 1998).

14
Figure 3. The Uranium 238 Decay Series (Edwards, 1998). Impacts on Plants and Organisms Exposure to uranium and high concentrations of uranium in the environment have been
found by researchers to be a toxicological hazard in the environment and as a result turns to be a
hazardous substance to aquatic organisms, terrestrial organisms, humans beings and plants as
well(Scholtz et al.2006). This is because plants absorb uranium in the soil through their roots
and store it there but when plant roots are exposed to high concentrations of uranium in the soil,
they are observed to be severely affected (Scholtz et al.2006). A significant effect is observed in
plant heights, ability of seeds to germinate, growth rate and yield when plants are exposed to
soils with high concentrations of uranium (Stojanović et al 2009). These effects do not only
affect the biodiversity of plants in and cause environmental degradation but also greatly affects
the incomes of farmers that are located close to uranium mines due to the decrease in yields that
is caused by uranium in farm soils (Pereira et al. 2009)
Uranium is also highly toxic to a broad range of organisms and can be dispersed in both
terrestrial and aquatic environments. Any organism (human, terrestrial or aquatic) that is
exposed to high concentrations of uranium is prone to develop amongst other symptoms, acute
renal failure, liver dysfunctions and paralytic ileum (Obstruction of the intestine due to paralysis
15
of the intestinal muscles (Scholtz et al.2006). When human beings are exposed to the gas form
of uranium called radon through breathing, severe damages occur in their respiratory tracts and
development of lung cancers are observed as well (Scholtz et al.2006). The ability of uranium to
accumulate in organisms also poses a great threat and this is because it enhances the transfer of
uranium along the food chain which causes more organisms to be exposed to uranium (Kovalsky
et al., 1967). In a number of studies on uranium miners, an increased risk of lung cancer was
observed and it was largely attributed to exposure from radon decay products (Luebeck et
al.1999). Lung tissue damages were also observed and it was found to increase the chance of
development of lung cancer with increasing radiation dose (Luebeck et al.1999). Depleted
uranium (the uranium remaining after removal of the enriched fraction) has been found to be a
weakly radioactive and therefore very large amounts of dust must be inhaled for lung cancer to
be developed and the development of radiation-induced cancers like leukaemia are considered to
be very much lower than for the development of lung cancer(WHO,2010).
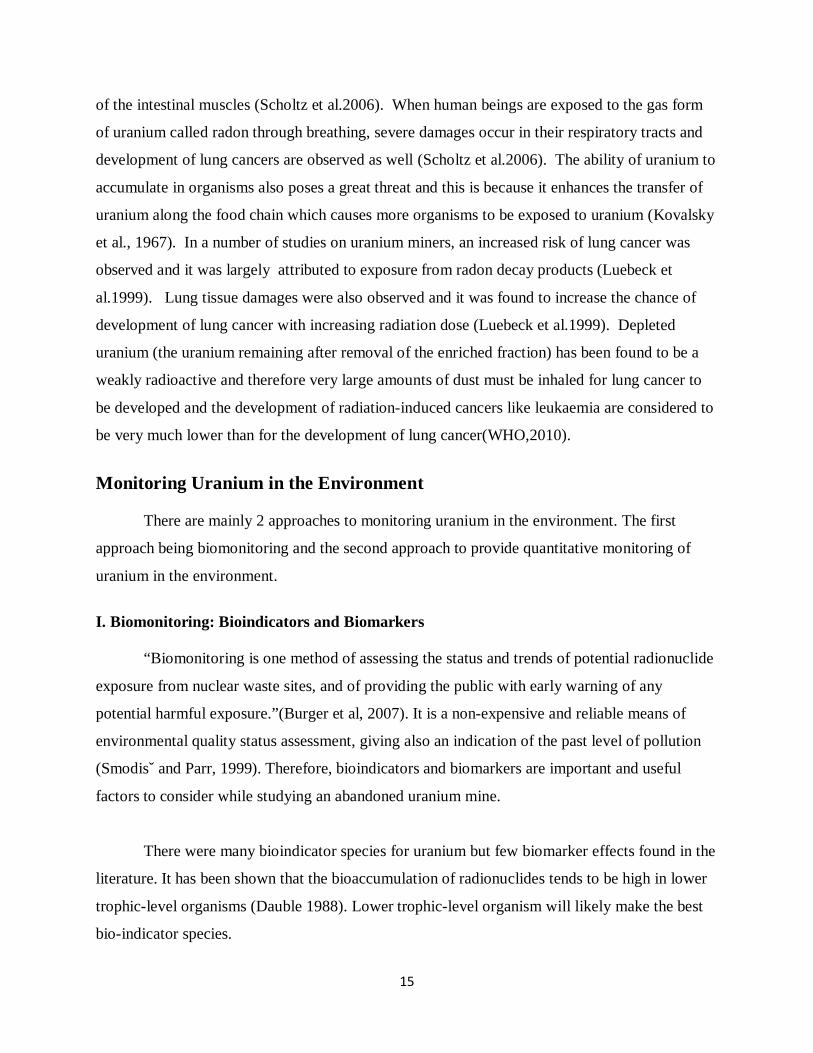
Monitoring Uranium in the Environment There are mainly 2 approaches to monitoring uranium in the environment. The first
approach being biomonitoring and the second approach to provide quantitative monitoring of
uranium in the environment.
I. Biomonitoring: Bioindicators and Biomarkers “Biomonitoring is one method of assessing the status and trends of potential radionuclide
exposure from nuclear waste sites, and of providing the public with early warning of any
potential harmful exposure.”(Burger et al, 2007). It is a non-expensive and reliable means of
environmental quality status assessment, giving also an indication of the past level of pollution
(Smodisˇ and Parr, 1999). Therefore, bioindicators and biomarkers are important and useful
factors to consider while studying an abandoned uranium mine.
There were many bioindicator species for uranium but few biomarker effects found in the
literature. It has been shown that the bioaccumulation of radionuclides tends to be high in lower
trophic-level organisms (Dauble 1988). Lower trophic-level organism will likely make the best
bio-indicator species.
16
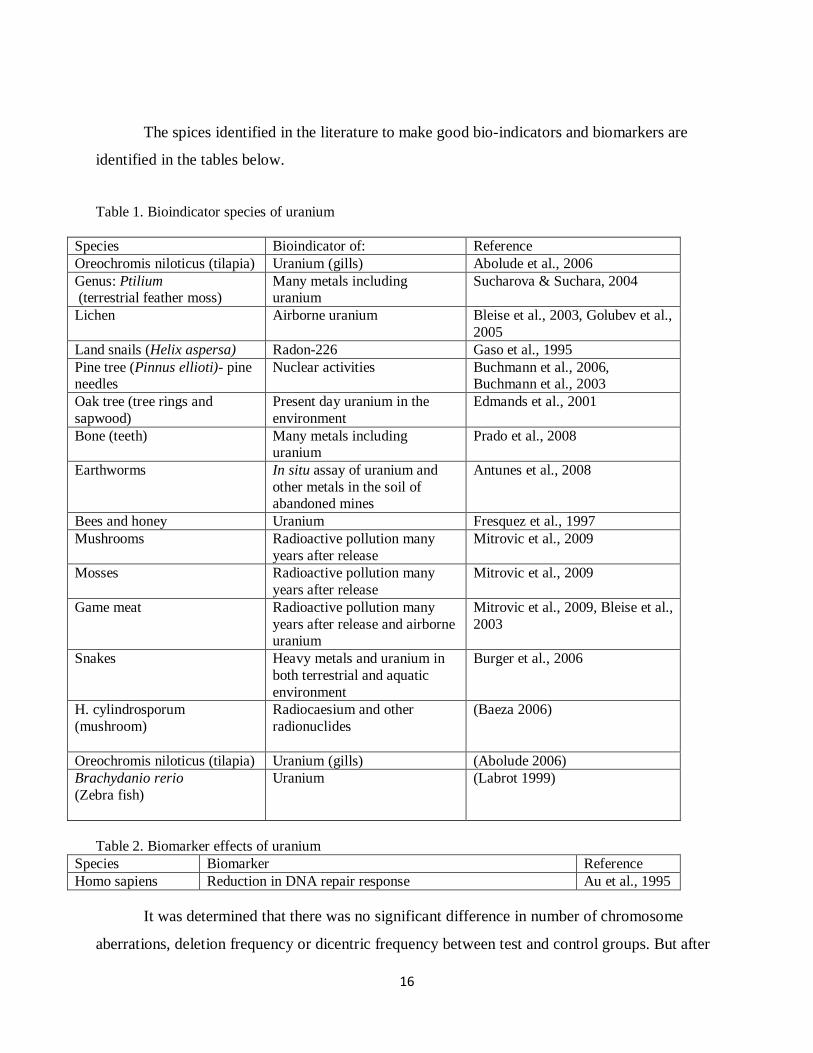
The spices identified in the literature to make good bio-indicators and biomarkers are
identified in the tables below.
Table 1. Bioindicator species of uranium
Species Bioindicator of: Reference Oreochromis niloticus (tilapia) Uranium (gills) Abolude et al., 2006 Genus: Ptilium (terrestrial feather moss)
Many metals including uranium
Sucharova & Suchara, 2004
Lichen Airborne uranium Bleise et al., 2003, Golubev et al., 2005
Land snails (Helix aspersa) Radon-226 Gaso et al., 1995 Pine tree (Pinnus ellioti)- pine needles
Nuclear activities Buchmann et al., 2006, Buchmann et al., 2003
Oak tree (tree rings and sapwood)
Present day uranium in the environment
Edmands et al., 2001
Bone (teeth) Many metals including uranium
Prado et al., 2008
Earthworms In situ assay of uranium and other metals in the soil of abandoned mines
Antunes et al., 2008
Bees and honey Uranium Fresquez et al., 1997 Mushrooms Radioactive pollution many
years after release Mitrovic et al., 2009
Mosses Radioactive pollution many years after release
Mitrovic et al., 2009
Game meat Radioactive pollution many years after release and airborne uranium
Mitrovic et al., 2009, Bleise et al., 2003
Snakes Heavy metals and uranium in both terrestrial and aquatic environment
Burger et al., 2006
H. cylindrosporum (mushroom)
Radiocaesium and other radionuclides
(Baeza 2006)
Oreochromis niloticus (tilapia) Uranium (gills) (Abolude 2006) Brachydanio rerio (Zebra fish)
Uranium (Labrot 1999)
Table 2. Biomarker effects of uranium
Species Biomarker Reference Homo sapiens Reduction in DNA repair response Au et al., 1995
It was determined that there was no significant difference in number of chromosome
aberrations, deletion frequency or dicentric frequency between test and control groups. But after
17
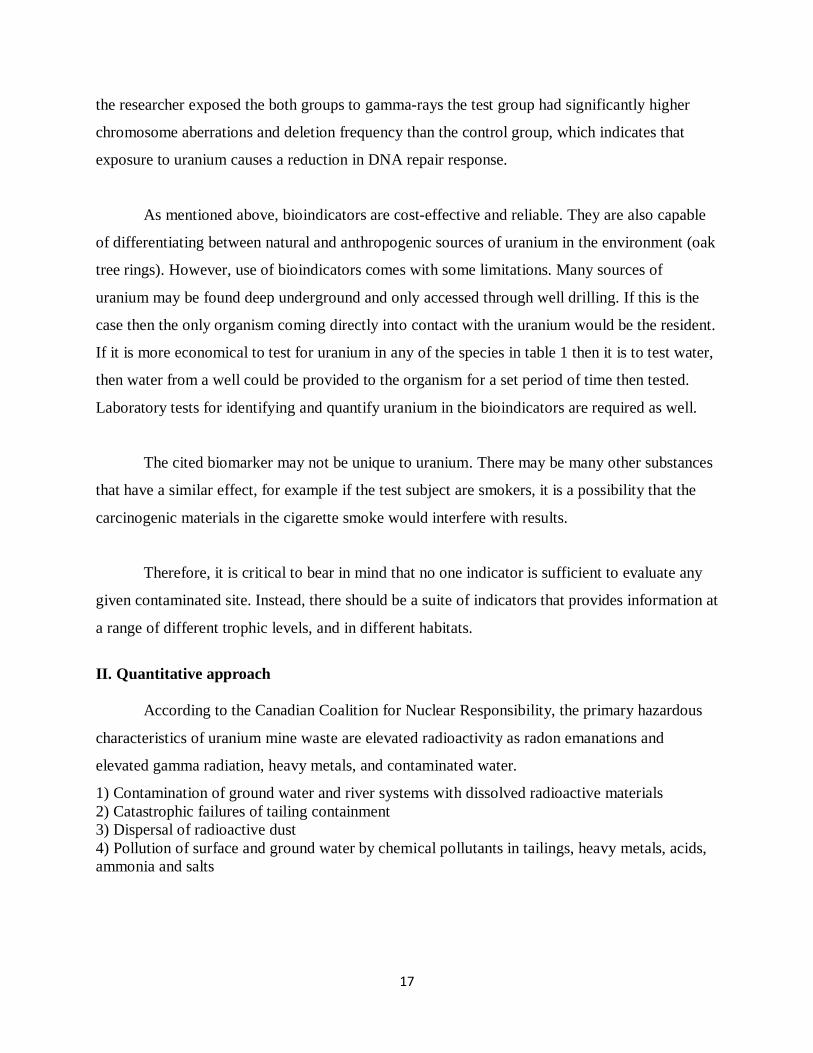
the researcher exposed the both groups to gamma-rays the test group had significantly higher
chromosome aberrations and deletion frequency than the control group, which indicates that
exposure to uranium causes a reduction in DNA repair response.
As mentioned above, bioindicators are cost-effective and reliable. They are also capable
of differentiating between natural and anthropogenic sources of uranium in the environment (oak
tree rings). However, use of bioindicators comes with some limitations. Many sources of
uranium may be found deep underground and only accessed through well drilling. If this is the
case then the only organism coming directly into contact with the uranium would be the resident.
If it is more economical to test for uranium in any of the species in table 1 then it is to test water,
then water from a well could be provided to the organism for a set period of time then tested.
Laboratory tests for identifying and quantify uranium in the bioindicators are required as well.
The cited biomarker may not be unique to uranium. There may be many other substances
that have a similar effect, for example if the test subject are smokers, it is a possibility that the
carcinogenic materials in the cigarette smoke would interfere with results.
Therefore, it is critical to bear in mind that no one indicator is sufficient to evaluate any
given contaminated site. Instead, there should be a suite of indicators that provides information at
a range of different trophic levels, and in different habitats.
II. Quantitative approach According to the Canadian Coalition for Nuclear Responsibility, the primary hazardous
characteristics of uranium mine waste are elevated radioactivity as radon emanations and
elevated gamma radiation, heavy metals, and contaminated water.
1) Contamination of ground water and river systems with dissolved radioactive materials 2) Catastrophic failures of tailing containment 3) Dispersal of radioactive dust 4) Pollution of surface and ground water by chemical pollutants in tailings, heavy metals, acids, ammonia and salts

18
Proposed Monitoring Methods:
The proposed quantitative monitoring approach for Halliburton County is based on the case
study on Church Rock Uranium Mining Project and some other literatures.
Proposed Monitoring Methods
A. Waste characterization and “hotspot” identification
An estimate of area contaminated should be calculated and hotspots indentified (see map) to
make sampling easier, cheaper and more efficient.
B. Soil and water contamination
Soil and water samples collected from “hotspots” need to be measured for:
1. Uranium and Heavy Metals: arsenic, iron, lead, mercury, selenium, thallium and vanadium,
barium, copper, chromium, potassium, manganese, molybdenum, strontium, zinc
Ammonia
Case Study: Church Rock Uranium Monitoring Project, New Mexico, United States (2003) A. History: - Uranium mining occurred early-50s through mid-80s - 16 abandoned mines, 1closed uranium mill (now a federal Superfund site) - ’79 tailings dam failure – U.S’s largest release, by volume, of radioactive waste B. Goals: - Assess contaminants in water, on land, in air in residential areas near abandoned uranium mines - Establish human exposures for future health studies C. Monitoring methods: 1. Water quality assessment – Focused on water sources that are not treated and tested regularly such as wells and springs. - Tested for general chemistry, heavy metals, radionuclides 2. Gamma radiation monitoring – measure using hand-held Ludlum-19 gamma detectors and Sodium –Iodide detector trucks 3. Soil sampling for uranium and heavy metals 4. Indoor radon monitoring – 7-day radon canisters placed in 150 homes 5. Air particulate monitoring – 1 year of air quality data using Continuous, high-volume air samplers

19
2. General chemistry
Some suggested analysis techniques to be carried out in laboratories (Protocol of Accepted
Drinking-Water Testing Methods) are:
Uranium and Heavy metals: Inductively Coupled Plasma-Mass Spectroscopy (ICP-MS) and
Dynamic Reaction Cell (DRC) Inductively Coupled Plasma – Mass Spectrometry (ICP-MS)
Ammonia: Colorimetry
Table 3. Water Standards in Canada
C. Radioactivity
The concentration of radium-226 is a key metric for purposes of classifying waste
materials. Radium is the radionuclide of interest at uranium sites for two reasons: its decay
products give off strong gamma radiation that is easy to measure, and it has the most significance
for human health risks due to radon generation.
a. Radon detection in the environment (Gervino et al., 2004 ) There are 3 types of detection and measurement methods available: Charcoal canisters,
alpha-track detectors and Electret passive Environmental Radon Monitors (E-PERMs)
Table 4. Methods of measuring radon in the environment
Type Duration Mechanism Analysis (suggested)
Radon concentration unit
Charcoal Canister
Short term (24h - 7days)
Contain granular-activated carbon that absorbs the
HPGe gamma spectrometer
Bq/m3 or Bq/L
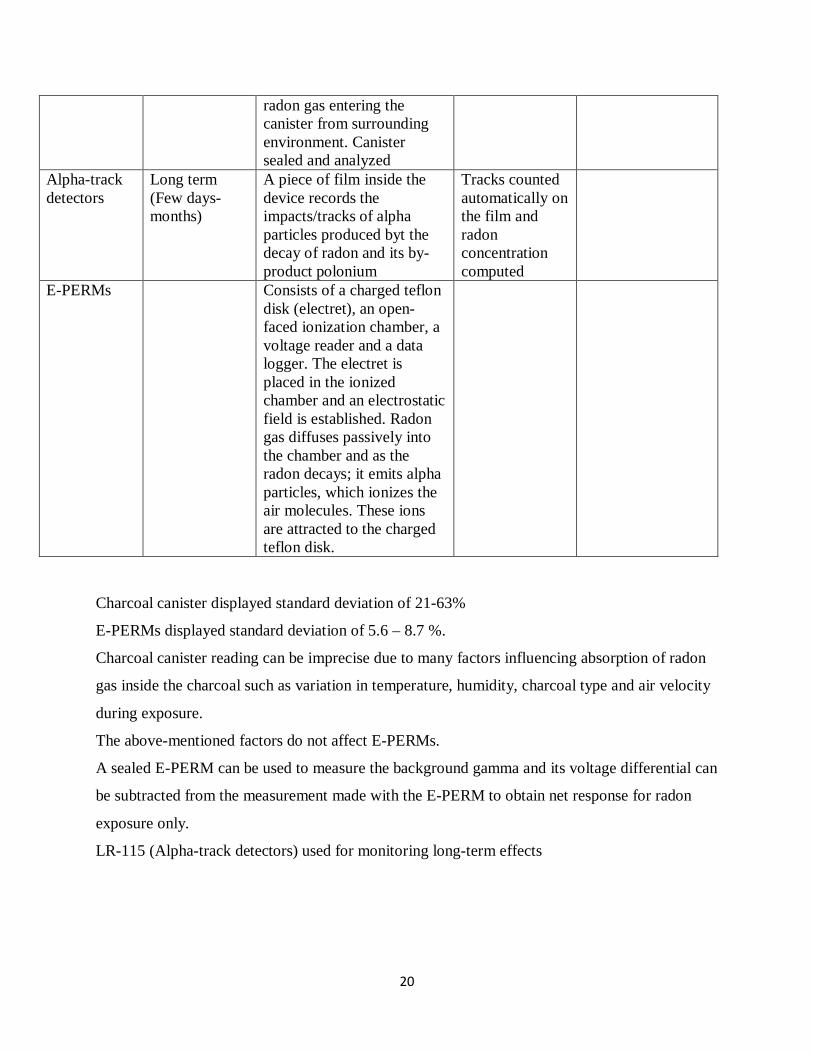
20
radon gas entering the canister from surrounding environment. Canister sealed and analyzed
Alpha-track detectors
Long term (Few days-months)
A piece of film inside the device records the impacts/tracks of alpha particles produced byt the decay of radon and its by-product polonium
Tracks counted automatically on the film and radon concentration computed
E-PERMs Consists of a charged teflon disk (electret), an open-faced ionization chamber, a voltage reader and a data logger. The electret is placed in the ionized chamber and an electrostatic field is established. Radon gas diffuses passively into the chamber and as the radon decays; it emits alpha particles, which ionizes the air molecules. These ions are attracted to the charged teflon disk.
Charcoal canister displayed standard deviation of 21-63%
E-PERMs displayed standard deviation of 5.6 – 8.7 %.
Charcoal canister reading can be imprecise due to many factors influencing absorption of radon
gas inside the charcoal such as variation in temperature, humidity, charcoal type and air velocity
during exposure.
The above-mentioned factors do not affect E-PERMs.
A sealed E-PERM can be used to measure the background gamma and its voltage differential can
be subtracted from the measurement made with the E-PERM to obtain net response for radon
exposure only.
LR-115 (Alpha-track detectors) used for monitoring long-term effects
21
b. Radon in water (Cothern & Smith,1987) 1. Liquid Scintillation counters:
- Rapid and practical method for measuring radon concentration sufficiently high
(>1000pCi/L) – usual case with well water
- Water sample mixed with counting material and counted by conventional liquid scintillation
counters used in air samples
2. Gas extraction:
- More sensitive
- Suitable for lower concentration
- Radon is extracted as a gas and emitted alpha particles are counted in a ZnS scintillation cell
- Helium is bubbled through the water to strips the radon. The gas mixture is then passed through
a cold trap (e.g: activated charcoal at liquid nitrogen temperature) which trap radon while the
helium passes through. The trap is then warmed and radon is transferred into a Lucas counting
cell by stripping with a small amount of Helium.
3. Direct Gamma counting:
- For relatively high concentrations of radon (>500 pCi/L)
- Radon concentration determined by counting gamma rays from radon daughter decay
- Standard gamma-ray spectroscopy techniques with a Ge(li) detector used to cont gamma rays
- Original radon concentration distinguished from the radium-226 concentration by repeating
count after 30 days after which the original radon will have virtually all decayed and the only
remaining radon is that is secular equilibrium with radium 226.
c. Indoor radon Testing (Discussed in next section).
22
Public Health Guide to Reduce Exposure to Uranium and Radon Gas What is Radon?
Radon is a gas that is created from the breakdown of uranium (Health Canada, 2009b). It
is colourless, odourless and tasteless. Radon is naturally released into the air where it becomes
diluted into low concentrations, although some radon can be released into homes where they can
accumulate to high levels. These high levels of radon gas in homes is a major health concern
(Health Canada, 2009b). Uranium mining can be released at a faster rate than naturally through
uranium mine practices. Uranium open pit mines, underground excavations and even uranium
exploration practices create pathways for the radon to be released into the atmosphere, and
sometimes groundwater, faster than it naturally would (Sierra Club, 2008).
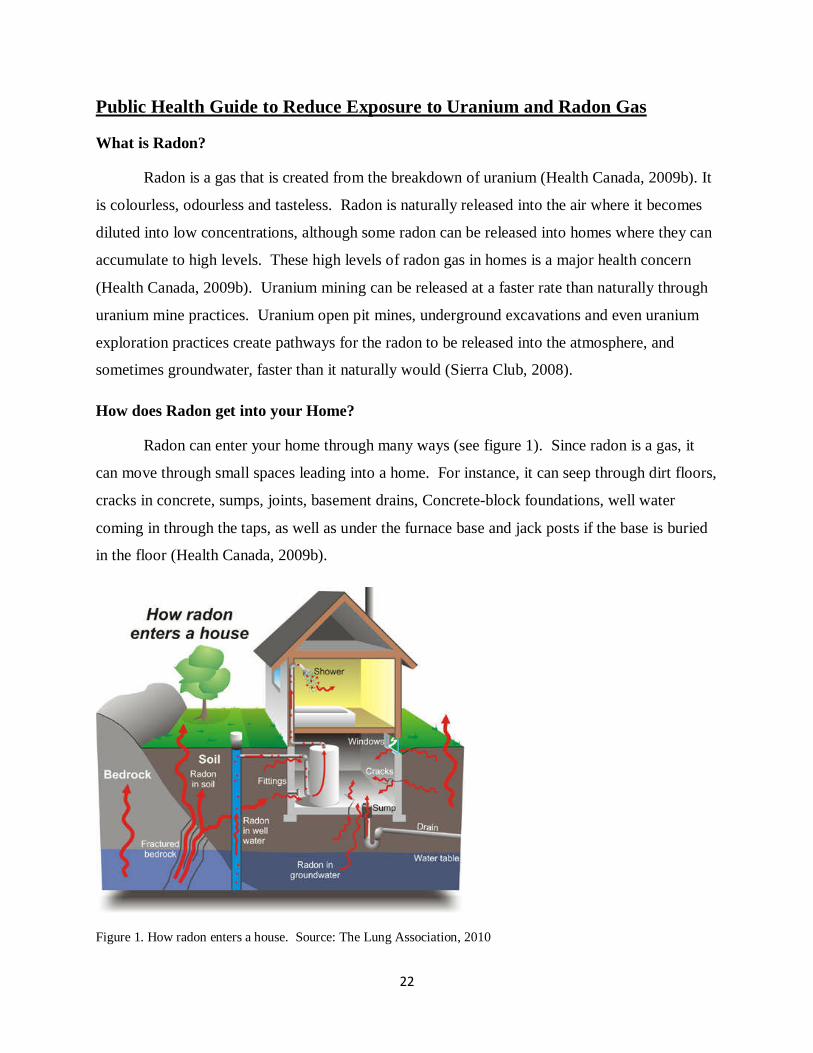
How does Radon get into your Home?
Radon can enter your home through many ways (see figure 1). Since radon is a gas, it
can move through small spaces leading into a home. For instance, it can seep through dirt floors,
cracks in concrete, sumps, joints, basement drains, Concrete-block foundations, well water
coming in through the taps, as well as under the furnace base and jack posts if the base is buried
in the floor (Health Canada, 2009b).
Figure 1. How radon enters a house. Source: The Lung Association, 2010

23
Why is Radon a Health Risk?
Exposure to high levels of radon gas have been found to increase the risk of lung cancer,
depending on the length of exposure time. Radon gas is a form of alpha radiation. It emits alpha
particles that can damage bronchial and lung tissues when inhaled, leading to lung cancer
(Health Canada, 2009b). The combined effect of radon gas exposure and tobacco smoke can
significantly increase the risk of lung cancer. It is estimated that a non-smoker exposed to
elevated levels of radon gas over a lifetime has a 1 in 20 chance of developing lung cancer, while
a smoker has a 1 in 3 chance (Health Canada, 2009a).
Health Canada has created guidelines to indicate an acceptable level of radon that can be
present in homes. The acceptable level of radon gas was first set at 800 becquerels per cubic
metre (Bq/m3) in 1988. After reviewing new evidence of the health affects associated with
exposure to radon gas, this guideline was lowered to 200 Bq/m3 in June of 2007 (Health Canada,
2009b). This guideline is based on what current research has found to have had statistically
significant adverse affects on human health from radon gas exposure. There are still much
uncertainties to the actual level at which radon gas becomes a health hazard. It is therefore
recommended that if a house has been found to have any radon levels within it, remedial action
be taken to protect the home (Health Canada, 2009c).
How Can You Test for Radon in Your Home?
Radon should be tested in your home through long-term measurements. Radon levels
within a home can vary significantly over time. It is not uncommon for radon levels to fluctuate
by a factor of 2 or 3 in a one day period. Seasons can also influence radon levels, in which the
highest levels of radon are usually found in winter months (Health Canada, 2008). It is
therefore, important to establish long-term monitoring of the levels of radon within your home.
The most popular long-term measurement devices are the Alpha Track Detector and the
Electret Ion Chamber (Health Canada, 2009a).
There are two device types of Alpha Track Detectors: passive and active. Passive
devices do not require electrical energy to power the device and generally rely on trapping the
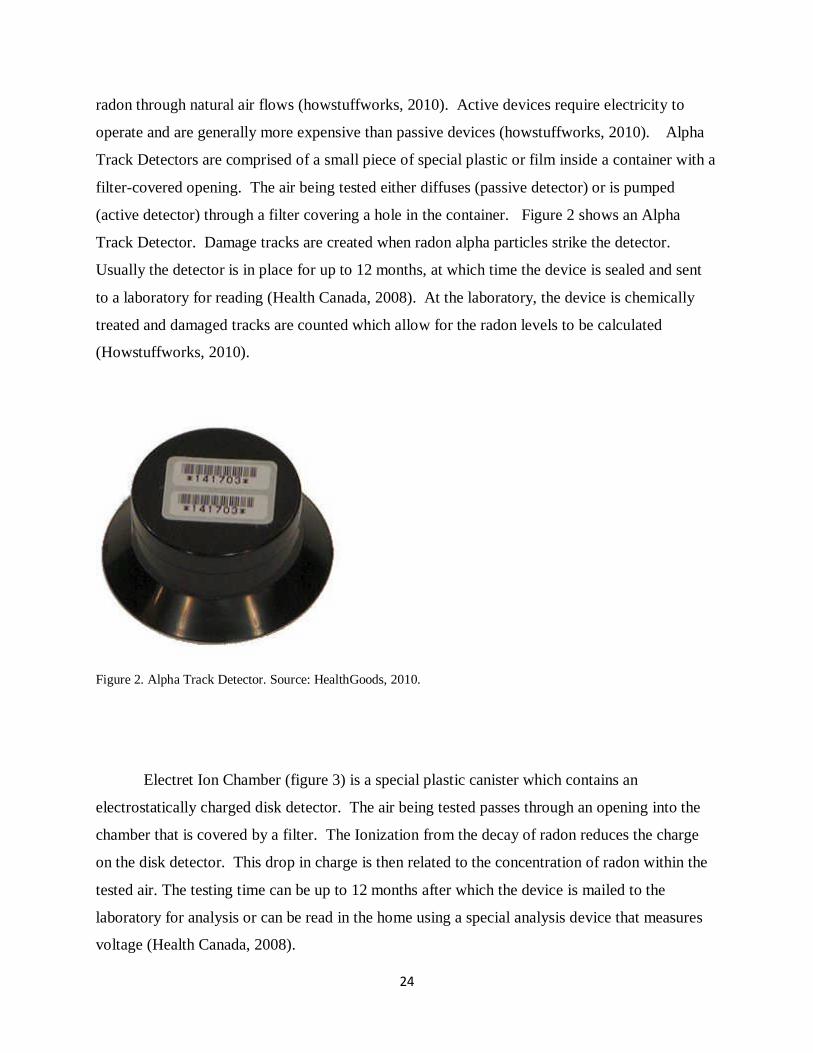
24
radon through natural air flows (howstuffworks, 2010). Active devices require electricity to
operate and are generally more expensive than passive devices (howstuffworks, 2010). Alpha
Track Detectors are comprised of a small piece of special plastic or film inside a container with a
filter-covered opening. The air being tested either diffuses (passive detector) or is pumped
(active detector) through a filter covering a hole in the container. Figure 2 shows an Alpha
Track Detector. Damage tracks are created when radon alpha particles strike the detector.
Usually the detector is in place for up to 12 months, at which time the device is sealed and sent
to a laboratory for reading (Health Canada, 2008). At the laboratory, the device is chemically
treated and damaged tracks are counted which allow for the radon levels to be calculated
(Howstuffworks, 2010).
Figure 2. Alpha Track Detector. Source: HealthGoods, 2010.
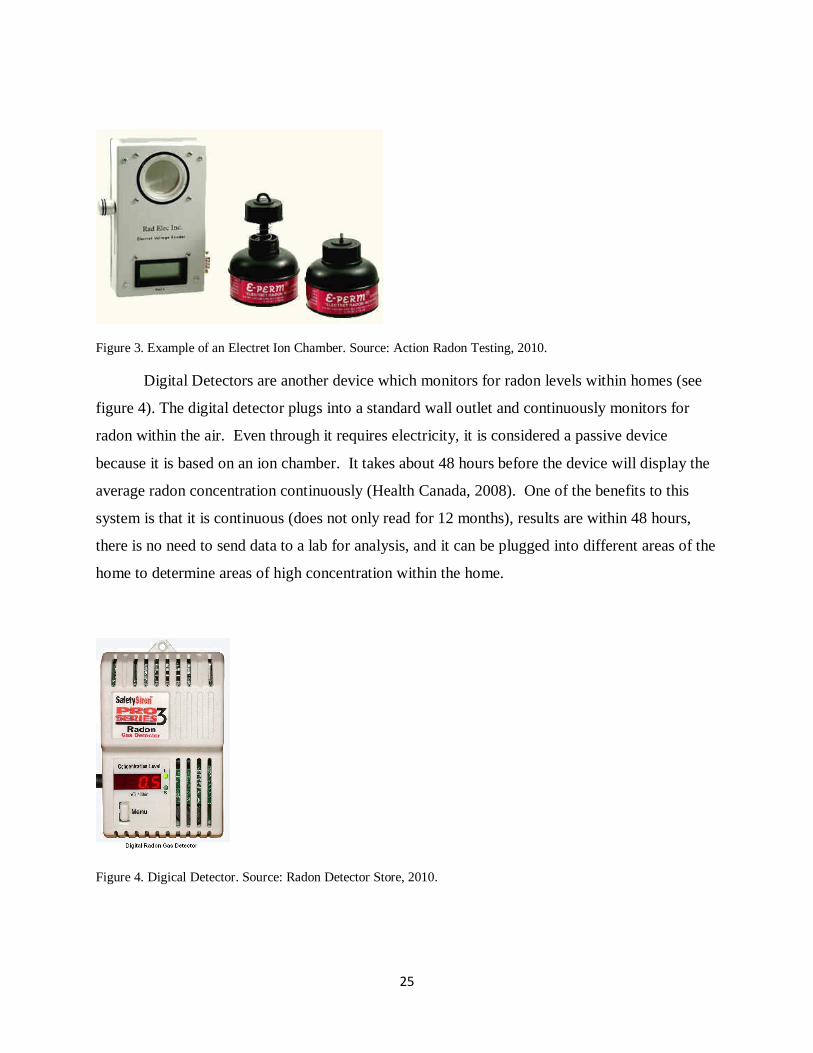
Electret Ion Chamber (figure 3) is a special plastic canister which contains an
electrostatically charged disk detector. The air being tested passes through an opening into the
chamber that is covered by a filter. The Ionization from the decay of radon reduces the charge
on the disk detector. This drop in charge is then related to the concentration of radon within the
tested air. The testing time can be up to 12 months after which the device is mailed to the
laboratory for analysis or can be read in the home using a special analysis device that measures
voltage (Health Canada, 2008).
25
Figure 3. Example of an Electret Ion Chamber. Source: Action Radon Testing, 2010.
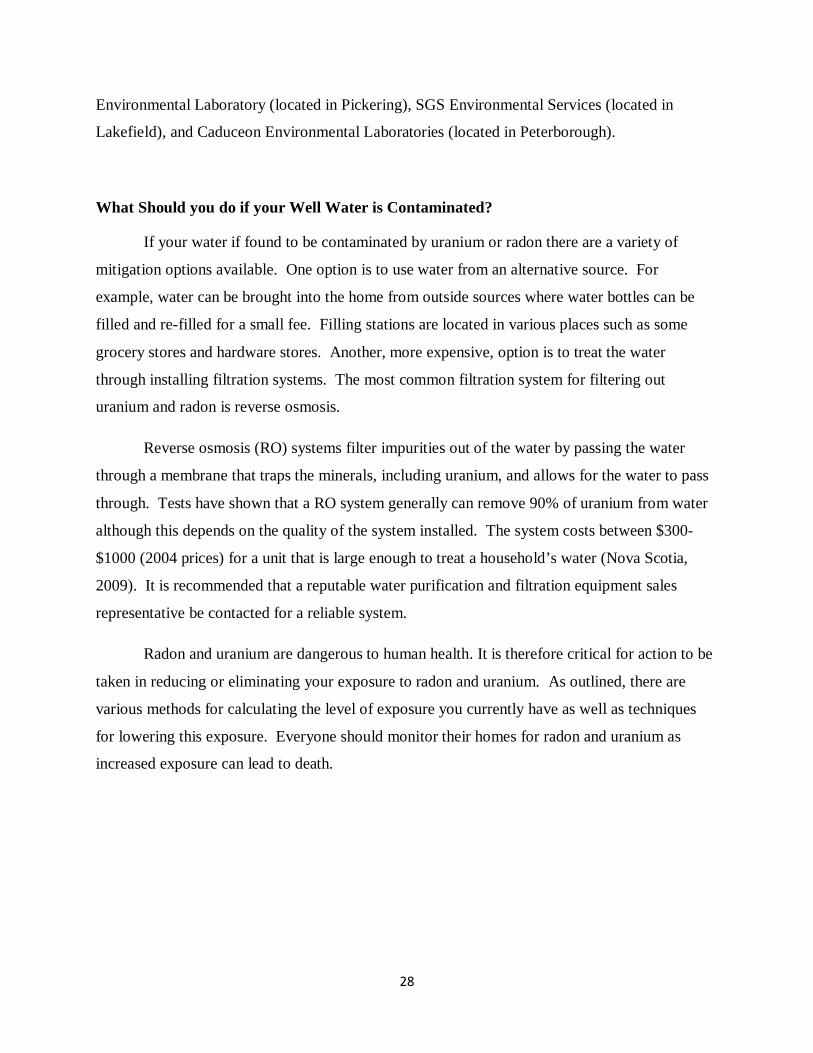
Digital Detectors are another device which monitors for radon levels within homes (see
figure 4). The digital detector plugs into a standard wall outlet and continuously monitors for
radon within the air. Even through it requires electricity, it is considered a passive device
because it is based on an ion chamber. It takes about 48 hours before the device will display the
average radon concentration continuously (Health Canada, 2008). One of the benefits to this
system is that it is continuous (does not only read for 12 months), results are within 48 hours,
there is no need to send data to a lab for analysis, and it can be plugged into different areas of the
home to determine areas of high concentration within the home.
Figure 4. Digical Detector. Source: Radon Detector Store, 2010.

26
There are short-term devices that can be used to determine the concentration of radon
within the home over a week period. However, these systems do not give a good indication of
the average level of radon within the home, since radon levels fluctuate so rapidly. Some of
these short-term devices are: Activated Charcoal Adsorption, Charcoal Liquid Scientillation, and
Electret Ion Chamber (only used for 2-7 days) (Health Canada, 2008).
There are also Specialized Measurement Devices that can be used to determine the radon
levels, although they require operation by a trained technician and are typically not used for
residential monitoring (Health Canada, 2008).
To collect the most reliable data on the radon concentrations within your home there are a
few factors that should be considered. The location of the device should be located by an interior
wall at a height of 3-6.5 feet from the floor but no higher than 20 inches below the ceiling
(Health Canada, 2008). This will allow for the air that you would be breathing in to go into the
device. The device should be placed 8 inches away from other objects to allow for natural air
flow around the detector. The location of the device should also not be in a kitchen or laundry
room since airborne particles and exhaust fan systems may affect the measurement devices. The
room of the device should be a room where a lot of time is spent, such as a living room or
bedroom. This will allow for the results to be representative of the levels of radon that you are
breathing in (Health Canada, 2008).
Radon measuring devices can be ordered online through a variety of websites. An Alpha
Track Detector can be bought through Canadian Radon Testing Products Inc. for $40.00 and an
Electret Ion Chamber can be purchased for $59.99 (Canadian Radon Testing Projects Inc, 2010).
A digital detector can be purchased online through Amazon for $129.95 (Amazon, 2010).
What Should you do if There are Radon Levels in your Home?
Action should be taken if there is radon present in your home, especially if the radon
concentration is higher than 200 Bq/m3. The higher the concentration, the sooner the remedial
measures should be taken (Health Canada, 2008). It is recommended that remediation should
take place in less than one year if the concentration is higher than 600 Bq/m3. If the
concentration is between 200 Bq/m3 and 600 Bq/m3 then remediation should take place in less

27
than two years. No action is required, according to the Health Canada guideline, if the
concentration is less than 200 Bq/m3 (Health Canada, 2008).
You can protect your home from receiving high levels of radon gas by blocking some of
the entrance holes where the gas is seeping in. Renovations of existing basement floors
(especially earth floors), as well as sealing cracks and openings in walls, floors, and around pipes
and drains should be done. Ventilating sub-floor of basement floors can also help to reduce gas
entry (Health Canada, 2009c). Hiring a contractor with experience in radon gas may be the best
option for mitigation.
How Can you Test for Uranium and Radon in your Well Water?
Uranium in drinking water is a great health concern since a portion of the uranium goes
into the blood stream, which can affect the kidneys (Government of Newfoundland and
Labrador, 2010).
Radon in drinking water can lead to stomach cancer although the risk of lung cancer
through the breathing in of radon gas is much higher than ingesting it and getting stomach cancer
(United States Environmental Protection Agency, 2010). Most of the risk involved in having
radon in water is an inhalation risk when radon gas is released into the air when water is used for
showering and other household purposes (United States Environmental Protection Agency,
2010). It is recommended that all wells that are used for drinking water be tested for levels of
uranium. The maximum acceptable concentration of uranium in drinking water is 0.020 mg/L
(Government of Newfoundland and Labrador, 2010 and Health Canada, 2010). This level was
approved in 1999 (Health Canada, 2010).
A sample of your well water can be sent to a variety of water testing laboratories across
Ontario. As of October 2003, the Safe Drinking Water Act, 2002 (SDWA) and the Drinking
Water Testing Services Regulation (O. Reg. 248/03) require every laboratory that performs
drinking water tests to have a license and to test the water in a licensed laboratory (Ministry of
the Environment, 2010). Licensed laboratories that will accept residential water tests and will
test for uranium and radon are listed on the Ministry of Environment website (Ministry of the
Environment, 2010). Some that are located in the Haliburton area are: York-Durham Regional
28
Environmental Laboratory (located in Pickering), SGS Environmental Services (located in
Lakefield), and Caduceon Environmental Laboratories (located in Peterborough).
What Should you do if your Well Water is Contaminated?
If your water if found to be contaminated by uranium or radon there are a variety of
mitigation options available. One option is to use water from an alternative source. For
example, water can be brought into the home from outside sources where water bottles can be
filled and re-filled for a small fee. Filling stations are located in various places such as some
grocery stores and hardware stores. Another, more expensive, option is to treat the water
through installing filtration systems. The most common filtration system for filtering out
uranium and radon is reverse osmosis.
Reverse osmosis (RO) systems filter impurities out of the water by passing the water
through a membrane that traps the minerals, including uranium, and allows for the water to pass
through. Tests have shown that a RO system generally can remove 90% of uranium from water
although this depends on the quality of the system installed. The system costs between $300-
$1000 (2004 prices) for a unit that is large enough to treat a household’s water (Nova Scotia,
2009). It is recommended that a reputable water purification and filtration equipment sales
representative be contacted for a reliable system.
Radon and uranium are dangerous to human health. It is therefore critical for action to be
taken in reducing or eliminating your exposure to radon and uranium. As outlined, there are
various methods for calculating the level of exposure you currently have as well as techniques
for lowering this exposure. Everyone should monitor their homes for radon and uranium as
increased exposure can lead to death.
29
References Abolude, D.S., J.K. Balogun, M.O.A. Oladipo, V.O. Ajibola, S.A. Abdullahi, I.O.B. Ewa, A.Y. Ahmed, P.E. Anyanwu, B.W. Ayonoadu, E.S. Erondu, S.N. Deekae. (2006) Bioaccumulation of some metals in organs of Oreochromis niloticus using instrumental neutron activation analysis (INAA) technique. Proceedings of the 20th annual conference of the Fisheries Society of Nigeria. 411-417 Action Radon Testing. (2010). Call for Action. Retrieved April 3, 2010, from: http://www.actionradon.com/ Amazon. (2010). Safety Siren Pro Series HS71512 3 radon gas detector. Retrieved April 3, 2010, from: http://www.amazon.com/Safety-Siren-Pro-HS71512-Detector/dp/B000CEAY64 Antunes, S.C., B.B. Castro, B. Nunes, R. Pereira, F. Goncalves (2008) In situ bioassay with Eisenia andrei to assess soil toxicity in an abandoned uranium mine. Ecotoxicology & Environmental Safety. 71: 620-631 Au, W.W., R.G. Lane, M.S Legator, E.B. Whorton, G.S. Wilkinson, G.J. Gabehart (1995) Biomarker monitoring of a population residing near uranium mining activities. Environ Health Perspect. 103: 466-470 Baeza, A., J. Guille´n (2006) Influence of the soil bioavailability of radionuclides on the transfer of uranium and thorium to mushrooms. Applied Radiation and Isotopes. 64: 1020-1026 Bleise, A., P.R. Danesi, W. Burkart (2003) Properties, use and health effects of depleted uranium (DU): a general overview. Journal of Environmental radioactivity. 64: 93-112 Brechignaci, F. (2001) Impact of radioactivity on the environment: Problems, state of current knowledge and approaches for identification of radioprotection criteria. Radioprotection. 36: 511 – 535. Buchmann, J.H., J.E.S. Sarkis, C. Rodrigues (2003). Environmental monitoring used to identify nuclear signatures. Journal of Radioanalytical & Nuclear Chemistry. 258: 139-142. Buchmann, J.H., J.E.S. Sarkis, M.H. Kakuzu, C. Rodrigues (2006) Environmental monitoring as an important tool for safeguards of nuclear material and nuclear forensics. Journal of Radioanalytical and Nuclear Chemistry. 270: 291-298. Burger, J., S. Murray, K.F. Gaines, J.M. Novak, T. Punshon, C. Dixon, M. Gochfeld, (2006) Element levels in snakes in South Carolina: Differences between a control site and exposed site on the Savannah river site. Environmental Monitoring & Assessment. 112: 35-52. Burger, J., M. Gochfeld, D.S. Kosson, C.W. Powers (2007) A biomonitoring plan for assessing the potential radionuclide exposure using Amchitka Island in the Aleutian chain of Alaska as a case study. Journal of Environmental Radioactivity. 98: 315-328. Church Rock Uranium Mining Project Report (2006) USEPA Canadian Radon Testing Products Inc. (2010) Radon gas test kits. Retrieved April 3, 2010, from: http://www.canadianradontesting.com/products.html
30
Chief Drinking Water Inspector Annual Report (2005-2006) Ontario Ministry of the Environment. Retrieved March 29, 2010, from: http://www.ontario.ca/drinkingwater/123877.pdf Cothern, C.R., J.E. Smith (1987) Environmental Radon. Pelnum Press, New York. Dauble, D.D., T.M. Poston, R.L. Newell (1988) Assessment of Aquatic Organisms as Bioindicators of Historical Radionuclide Release to the Columbia River. National Technical Information Service. United States of America. Dictionary.com, Retrieved April 12, 2010, from http://dictionary.reference.com/browse/exceedance Edmands, J.D., D.J. Brabander, D.S. Coleman (2001) Uptake and mobility of uranium in black oaks: implications for biomonitoring depleted uranium-contaminated groundwater. Chemosphere. 44: 789-795. Edwards, G. (1998) Uranium: A Discussion Guide. Retrieved April 6, 2010, from http://www.ccnr.org/nfb_uranium_0.html Facts about Exploration and Mineral Development in Ontario. Retrieved March 28, 2010 from http://www.mndm.gov.on.ca/mines/lands/bulbrd/surface_rights/mrvssre.pdf Frequently Asked Questions. Mineral Staking in Ontario. Retrieved March 28, 2010, from http://www.mndm.gov.on.ca/mines/lands/bulbrd/surface_rights/qanda_e.asp Fresquez, P.R., D.R. Armstrong, L.H. Pratt, (1997) Radionuclides in bee and honey within and around Los Alamos National Laboratory. Journal of Enviornmental Science & Health. 32: 1309-1323. Gaso, M.I., M.L. Cervantes, N. Segovia, F. Abascal, S. Salazar, R. Velazquez, R. Mendoza (1995) 137Cs and 26Ra determination in soil and land snails from a radioactive waste site. The Science of the Total Environment. 173/174: 41-45. Gervino, G., R. Bonetti, C. Cigolini, C. Marino, P. Prati, L. Pruiti (2004) Environmental radon monitoring: comparing drawbacks & performances of charcoal canisters, alpha-track & E-PERM detectors. Nuclear Instruments & Methods in Physics Reasearch. 518: 452-455. Golubev, A.V., V.N. Golubeva, N.G. Krylov, V.F. Kuznetsova, S.V. Mavrin, A.Y. Aleinikov, W.G. Hoppes, K.A. Surano (2005). On monitoring anthropogenic airborne uranium concentrations and 235U/238U isotopic ratio by Lichen – bioindicator technique. Journal of Environmental Radioactivity. 84: 333-342. Government of Newfoundland and Labrador, Canada. (2010). Uranium in well water. Retrieved April 3, 2010, from: http://www.env.gov.nl.ca/env/Env/waterres/Groundwater/Uranium/GW&Uranium.asp Health Canada. (2008). Guide for radon measurements in residential dwellings (homes). Minister of Health. Health Canada. (2009a). Environmental and workplace health- radon. http://www.hc-sc.gc.ca/ewh-semt/radiation/radon/protect-proteger-eng.php Health Canada. (2009b). Healthy living- radon. Retrieved April 3, 2010, from: http://www.hc-sc.gc.ca/hl-vs/iyh-vsv/environ/radon-eng.php
31
Health Canada. (2009c). Radon- it’s your health. Retrieved April 3, 2010, from: http://www.hc-sc.gc.ca/hl-vs/iyh-vsv/environ/radon-eng.php Health Canada. (2010). Guidelines for Canadian drinking water quality. Retrieved April 3, 2010, from: http://www.hc-sc.gc.ca/ewh-semt/pubs/water-eau/sum_guide-res_recom/chemical-chimiques-eng.php HealthGoods. (2010). AccurStar Alpha Track long term radon test kit. Retrieved April 3, 2010, from: http://www.healthgoods.com/AccuStar_Alpha_Track_Long_Term_Radon_Test_Kit_p/ac-at100.htm Howstuffworks. (2010) How radon works. Retrieved April 3, 2010, from: http://home.howstuffworks.com/home-improvement/household-safety/tips/radon3.htm Kovalsky, V.V., I.E. Vorotnitskaya, V.S. Lekarev (1967) Biogeochemical food chains of uranium in aquatic and terraneous organisms. In: Aberg, B., Hungate, F.P. (Eds.), Proceedings of an International Symposium, Stockholm, first ed. Radioecological Concentration Processes Pergamon Press, Oxford, pp. 329-332 Labrot F., J. F. Narbonne, P. Ville, M. Saint Denis, D. Ribera. (1999) Acute Toxicity, Toxicokinetics, and Tissue Target of Lead and Uranium in the Clam Corbicula fluminea and the Worm Eisenia fetida: Comparison with the Fish Brachydanio rerio. Archives of Environmental Contamination and Toxicology. 36: 167-178 Ledin, M., K. Pedersen (1996) The environmental impact of mine wastes- Roles of microorganisms and their significance in treatment of mine wastes. Earth-Science Reviews. 41(1-2):67-108. Legislative Assembly of Ontario. Official Documents. Retrieved April 10, 2010, from http://www.ontla.on.ca/web/house-proceedings/house_detail.do?Date=1988-12-08&Parl=34&Sess=1&locale=fr Luebeck E. G., W. F. Heidenreich, W.D. Hazelton, H. G. Paretzke, S.H. Moolgavkar, (1999). Biologically Based Analysis of the Data for the Colorado Uranium Miners Cohort: Age, Dose and Dose-Rate Effects. Radiation Research. 152: 339-35. Mindat.org - Retrieved March 20, 2010, from http://www.mindat.org/lsearch.php?tloc=Haliburton Co., Ontario, Canada Mining Claims Information Main Menu, Ontario Government. Retrieved April 13, 2010, from http://www.mci.mndm.gov.on.ca/Claims/clm_mmen.cfm and http://www.mci.mndm.gov.on.ca/Claims/Cf_Claims/clm_por.CFM Ministry of Northern Development and Mines1 (2004) Mineral Deposit Inventory. Retrieved April 6th 2010 from: http://www.mndm.gov.on.ca/mines/ogs/ims/pub/digcat/mdi_e.asp Ministry of Northern Development and Mines2 (2004).Ontario Mining and Exploration Directory. Retrieved April 5th 2010 from http://www.mndm.gov.on.ca/mines/ogs/ims/investment/publications/expdir/expdire.pdf Ministry of the Environment Ontario (2008) Protocol of Accepted Drinking-Water Testing Methods. Laboratory Services Branch, Canada.

32
Ministry of the Environment, Ontario, Canada. (2010). Licensed Laboratories. Retrieved April 3, 2010, from: http://www.ene.gov.on.ca/en/water/sdwa/licensedlabs.php Mitrovic, B., G. Vitorovic, D. Vitorovic, G. Pantelic, I. Adamovic, (2009) Natural and anthropogenic radioactivity in the environment of mountain region of Serbia. Journal of Environmental Monitoring. 11: 383-388. Niese S. (1996) Application of low-level counting techniques for the investigation of the impact of uranium mining as well as remediation on the environment. Applied Radiation and Isotopes. 47: 1109-1112 Nova Scotia, Canada (2009) Removing uranium from drinking water using reverse osmosis. Retrieved April 3, 2010, from: http://www.gov.ns.ca/nse/water/uraniumremovalro.asp. Ontario Ministry of Natural Resources (2009). Natural Resource Values Information System (NRVIS) Fundamental Class Data. Pereira R., C.R. Marques, M.J.S. Ferreira, M.F.J.V. Neves, A.L. Caetano, S.C. Antunes, S. Mendo, F. Goncalves. (2009) Phytotoxicity and genotoxicity of soils from an abandoned uranium mine area. Applied Soil Ecology. 42: 209-220. Prado, G.R., J.D.T. Arruda-Neto, J.E.S. Sarkis, L.P. Geraldo, R.M.L. Muller, F. Garcia, M.C. Bittencourt-Oliveira, M.V.M. Guevara, G. Rodrigues, J. Mesa, T.E. Rodrigues, (2008) Evaluation of uranium incorporation from contaminated areas using teeth as bioindicators – A case study. Radiaiton Protection Dosimetry. 130: 249 -252. Radon Detector Store. (2010). Pro Series3 Digital Radon Gas Detector. Retrieved April 3, 2010, from: http://www.radondetectorstore.com/page/1271872 Trent Conservation Coalition. Map 12, November (2003) Regional Contaminant Source Inventory, Municipal Groundwater Study. Retrieved April 1, 2010, from http://www.ene.gov.on.ca/envision/water/groundwater/trent_river_watershed/precambrian/Map12-RegionalContaminantSourceInventory.pdf Scholtz N., O.F. Scholtz, P.G. Potgieter (2006) Potential environmental impact resulting from inadequate remediation of uranium mining in the Karoo Uranium Province, South Africa. Earth and Environmental Science.789-799 Sierra Club Canada. (2008). Phase out of uranium mining and nuclear energy urged. Retrieved April 3, 2010, from: http://www.sierraclub.ca/en/node/153 Smodis, B., R.M. Parr (1999) Biomonitoring of air pollution as exemplified by recent IAEA programs. Biological Trace Element Research 71: 257–266. Stojanović .D., S.R. Mirjana, M.V. Dragi, G.S.M. Jelena, A.D. Ileš (2009) Phytotoxic Effect of the Uranium on the Growing Up and Development the Plant of Corn. Water, Air, & Soil Pollution. Sucharova, J., I. Suchara. (2004) Distribution of 36 element deposition rates in a historic mining and smelting area as determined through fine scale Biomonitoring techniques. part I: Relative and absolute current atmospheric deposition levels detected by moss analyses. Water Air and Soil Pollution. 153: 205-228.
33
The Lung Association, British Columbia, Canada. (2010). Retrieved April 3, 2010, from: http://www.bc.lung.ca/airquality/airquality_radon.html United States Environmental Protection Agency (2010) A citizen’s guide to radon. Retrieved April 3, 2010, from: http://www.epa.gov/radon/pubs/citguide.html WHO (2010) Depleted uranium. Retrieved April 6, 2010, from http://www.who.int/mediacentre/factsheets/fs257/en/ Yellowpages.ca - retrieved April 15, 2010, from http://www.canada411.ca/res/6133324003/Sam-Pataran/136813203.html