urban abandonment or urban renaissance - joseph rowntree
TRANSCRIPT

The slow death of great cities?Urban abandonment or urban renaissance
Anne Power and Katharine Mumford

The Joseph Rowntree Foundation has supported this project as part of its programme ofresearch and innovative development projects, which it hopes will be of value to policymakers and practitioners. The facts presented and views expressed in this report are,however, those of the authors and not necessarily those of the Foundation.
Joseph Rowntree Foundation 1999
All rights reserved.
Published for the Joseph Rowntree Foundation by YPS
ISBN 1 902633 11 3
Cover design by Adkins Design
Prepared and printed by:York Publishing Services Ltd64 Hallfield RoadLayerthorpeYork YO31 7ZQ
Photographs are Anthony Lee (LSE Housing) and Katharine Mumford
The flyer on page 34 is reproduced courtesy of City of Newcastle upon Tyne Housing Department;the photographs on page 79 are reproduced courtesy of Urban Splash; Appendix 6 is reproducedcourtesy of Manchester City Council.

Contents
Page
Acknowledgements vi
Definitions vii
Executive summary ix
1 Introduction – urban abandonment or urban renaissance? 1
Part I Trends in two cities and four neighbourhoods 3
2 Method and approach 5
3 Changes in the two cities and four neighbourhoods 8Population 8Density 10Jobs 10
4 Social dynamics 13Deprivation 13Concentrated deprivation 14Ethnic composition 15Crime 15
5 Housing patterns – how problematic are they? 17Tenure 17Changing housing patterns 18Housing types 20
Part II Evidence of incipient abandonment 23
6 Urban abandonment 25Empty property 25Demolition 28Pace of abandonment 28Property values 29Turnover and access to council housing 30Waiting lists 31Housing associations 35Private landlords 35Schools 37

Part III The story of four neighbourhoods 43
7 Bankside 45About the area 45How/when it hit trouble 45Inputs/impacts 46Current options 48
8 City-Edge 49About the area 49How/when it hit trouble 49Inputs/impacts 50Current options 52
9 Riverview 54About the area 54How/when it hit trouble 54Inputs/impacts 56Current options 58
10 Valleyside 59About the area 59How/when it hit trouble 59Inputs/impacts 60Current options 62
Part IV The causes and consequences of decline 65
11 The long roots of the problem – history not news 67Pre-World War I 67Inter-war years 67Post-World War II 67Urban depopulation 68Severed networks 68Surplus estates 69Estate management 69Bias to renovation 70Global shifts 70The break-up of ‘municipal fiefdoms’ 70Rescuing estates 71The numbers game 71

12 Driving factors 73Reputation 74Housing and environmental conditions 75Building for a surplus or gentrification? 77Management pressures 77Disrupted communities 80Cumulative crisis 81
Part V A way forward 83
13 What can be done? 85The counter-pressures 85Social exclusion 86Marketing social housing 88Regeneration 92Holding on to residents 94Density 97Household size and formation 98Policing 99Anti-social behaviour 100Young men 100Neighbourhood management or strategic vision? 101
14 Conclusion 104
References 107
Appendix 1: Interviews with local authorities and housing associations around the country 115
Appendix 2: Additional interviews – contributors to low demand 118
Appendix 3: Areas of the country with evidence of pockets of low demand, difficult to let 119properties and high turnover – affecting local authorities and/or housing
associations (not exhaustive)
Appendix 4: Other current research 120
Appendix 5: Schedule of fieldwork interviews 121
Appendix 6: Manchester City Council: corporate aims and objectives 122
Appendix 7: Newcastle’s corporate strategic plan: key extracts 124
Appendix 8: Articles about low demand and abandonment 126
Appendix 9: Local authority stock size, number of difficult to let units, empties, 131demolitions for Manchester and Newcastle

138
Acknowledgements
The debt of thanks we owe to staff and residentsin the cities of Manchester and Newcastle,particularly in the four case study areas, isimmeasurable. We cannot name most of ourlocal collaborators in order to protect theidentity of the areas. We have tried to do justiceto their trust and confidence. Without them, wewould not have understood how serious theproblem of urban abandonment was, nor howintense the commitment to help. We would alsolike to thank Kevin Lavery (Chief Executive),David Butler (Director of Housing), JohnCornhill (Assistant Director), Paul Tanney(Principal Housing Manager), Michael Kerridge(Housing Needs Manager) in Newcastle CityCouncil; and Howard Bernstein (ChiefExecutive), Steve Mycio (Deputy ChiefExecutive (Performance)), Fionnuala Stringer(Principal Team Leader), Clare Tostevin (LowDemand Team Leader) in Manchester CityCouncil. We are also grateful to staff in all theother councils and housing associations who co-operated with our study. We are greatlyindebted to Anthony Lee who helped with thefieldwork interviews and Rebecca Morris whoprepared the report for publication.
We must also thank Mavis McDonald(DETR), Anthony Mayer and Max Steinberg(Housing Corporation), Moira Wallace and LizWalton (Social Exclusion Unit) for their supportin organising three workshops on low demandand unpopular areas. These involved over 100participants from all over the country, giving usmany additional sources of information andideas of what can be done to change conditions.
Finally, we thank Theresa McDonagh, JohnLowe, Richard Best, Alan Holmans, RebeccaTunstall, Ruth Lupton, Ade Kearns, AlanKilburn, Jackie Haq, Chris Power, MikeGahagan, Ivan Turok and Duncan Maclennanwho gave excellent advice and painstakinglyhelped us to draft, correct and recorrect the textof this report. We also want to thank JohnStevens and Barbara Carlisle for their supporton the advisory committee.
We accept full and sole responsibility for anymistakes or misrepresentations in discussingwhat has proved to be a highly topical andtherefore contentious issue.
vi

139
Abandonment describes a house which is emptyand which no one wants to use or live in; alsowhole areas of empty housing – ‘areaabandonment’. ‘Abandonment’ can be causedby the occupier vacating a property withoutgiving any notice, or by the owner, believing theproperty to have zero or negative value.
Brownfield describes land that has alreadybeen used for development. It is usually intowns and cities but airfields, army camps andother previously developed land in villages andthe country, and along roads, railways andcanals are included. Local authorities have atarget of producing 60 per cent of new housingon brownfield sites. Renovation of existingbuildings and change of use (e.g. offices to flats)come within the brownfield category.
Census information in the report is based onofficial Census definitions.
Changing demand implies different groupsseeking access, e.g. singles or families, young orelderly, ethnic minorities or whites. It may resultin housing being used in a different way, e.g.temporary rather than permanent housing.
City council and government information isbased on the definitions in their documents.These are fully referenced.
Difficult to let describes rented housingwhich has above average refusal rates, turnoverand empty property but below average demandor waiting lists. The term was first used in 1976when the then Labour government mounted theinvestigation of difficult to let housing(Burbidge et al., 1981).
General Improvement Areas (GIAs) wereintroduced by the 1969 Housing Act. Run-downinner city areas were designated forconservation through improvement grants toindividual owners and environmental grants to
local authorities to upgrade the area as a whole.They ranged from 300–800 homes. Some weresold off at great profits to owner occupiers.
Gentrification describes the improvement ofdecayed inner city housing through moreaffluent owners buying run-down, olderproperty and doing it up. The term suggestslower income people losing out in the process.
Greenfield describes land that has not beenbuilt on (generally within living memory) orthat bears no sign of construction. Greenfieldhousing developments are exempt from VAT.
Housing Action Areas (HAAs) were set upthrough the 1974 Housing Act. They were aresponse to ‘gentrification’ and combinedcouncil action with bottom-up methods to tackleinner city decline in small areas of around 500properties. Declared areas attracted generousimprovement grants aimed at encouragingresidents to stay. Tenants’ rights wereguaranteed and, where private landlords failedto improve, councils could compulsorilypurchase and renovate.
Inner Urban Areas define the distinct parts ofthe city around the city centre characterised byabove average concentrations of social andeconomic problems. The exact definition variesbut the same areas with similar characteristics,in the same cities, tend to reappear on all indicesand definitions (see DoE, 1996, p. 211).
Low demand describes housing which fewpeople want to move into, or remain living in.The term applies to owner occupied as well asrented housing. It underlines the possibility ofchoice in where people live. It applies to areaswhere overall demand is low relative to supply,suggesting an emerging surplus of housing. Theareas affected can be small neighbourhoods,estates, cities or whole districts. The term is
Definitions
vii

140
The slow death of great cities?
sometimes applied to regions such as the NorthEast or Merseyside.
Negative equity means that a property has alower market value than the outstanding debtthe owner has incurred in buying the property.
New Deal for Communities (NDC) waslaunched in September 1998 as the most recentregeneration programme. It proposesneighbourhood management of up to 4,500homes, co-ordinating health, education, police,training, security, family support and housing.It offers significant capital resources, but alsofunds resident consultation, capacity buildingand long-term support. NDC encouragesinnovative models of ownership, managementand involvement.
Outer Urban Areas are those areas within cityboundaries, further from the centre, with lessconcentrated problems and more attractiveenvironments (see DoE, 1996, p. 211).
Single Regeneration Budget (SRB) broughttogether 20 programmes run through variousgovernment departments. It creates localpartnerships – private/public/statutory/voluntary – to deliver large- and small-scaleregeneration covering environment, security,training, employment, commerce, leisure and, ina minority of cases, housing.
Social exclusion describes the processes which
reduce or limit people’s life chances, resulting insome individuals and groups being unable toparticipate fully in the society in which theylive.
Social Exclusion Unit was set up by the newLabour government in 1997 to co-ordinatedifferent government efforts in tackling theproblems that place some people outside main-stream society. The first three priorities weretruancy and school exclusion, street living andthe most disadvantaged neighbourhoods. Cross-departmental action teams including non-governmental experts are expected to proposenew ‘joined-up’ solutions.
Turnover means the rate of exodus from anarea based on the numbers of householdsleaving as a percentage of all occupied units.
Urban Development Corporations (UDCs) wereestablished by the 1980 Local Government andLand Act. They took over planning powers fromthe local authority for designated inner cityareas with an obsolete industrial, manufacturinginfrastructure. Their aim was to lever in privateinvestment through strong public support tocreate new and refurbished commercial andresidential centres.
Zero demand is housing which no one wants,for which there is no waiting list or marketvalue.
viii

141
Problems
This report examines the experience of fourneighbourhoods within the inner areas of twoNorthern cities that suffer from low demand,incipient abandonment and generaldepopulation. Their problems reflect muchwider trends. Many city neighbourhoodsexperience acute decline and, in the mostextreme cases, abandonment. Layers ofregeneration programmes have made someimprovements but underlying problemscontinue unchanged.
Manchester and Newcastle have declinedover much of this century. Their populationshave dropped as jobs have disappeared.Deprivation is heavily concentrated within thecities, but particularly within the innerneighbourhoods. Large clusters of poverty andunemployment have formed across wide areasinvolving hundreds of thousands ofhouseholds. Concentrated deprivation isregarded as the single biggest factor in areadecline in both cities.
The quality of most housing in the areas isgood, much of it excellent. But abandonment isaffecting all tenures and all property types.Council housing forms the largest tenure in theneighbourhoods but there is significant owneroccupation and some private renting. Housingassociations have been very active in the 1980sand 1990s. Renting dominates and helpsdetermine who lives in the areas. Youngerpeople in work tend to move out to buy.
The four neighbourhoods traditionallyhoused low-income people. The chronic joblosses and the cumulative impact of urbandepopulation have led to empty unwantedproperty becoming a blight on the areas over
the last five years. The value of private propertyhas plummeted in the 1990s, in some cases tozero. Right to Buy sales are far below theaverage for the cities, which in turn are farbelow national levels. Turnover is exceptionallyhigh, making effective management andcommunity stability elusive goals.
Demolition has removed several thousandproperties in the two cities, particularly in theinner neighbourhoods, but numbers of emptyproperties have not declined. In some areas theyhave continued to grow. Whole streets aresometimes abandoned and the areas are dottedwith empty unused spaces. Demolitiondecisions are often a piecemeal reaction tointense problems rather than part of a renewalplan. The blight and uncertainty of demolitionfuel the exodus of those that can.
Schools have been seriously affected. Pupilturnover and falling roles have had a negativeeffect even where schools are performing well.This in turn undermines neighbourhoodcohesion. Crime and disturbance are majorproblems but intensive, proactive policing andcollaboration with residents and local housingmanagers have cut crime and created morepeaceful conditions in some areas.
The main factors associated with acutedecline are: poor reputation and negativehistory; surplus rented housing coupled withdeclining populations; neighbourhoodmanagement problems; disrupted communitieswith weak social controls; acute harassment andanti-social behaviour; a clustering of pressuresprovoking a cumulative crisis.
Low demand is most extensive in councilestates, and there is evidence of falling andchanging demand for social housing in manyareas of the country – in regions of housing
Executive summary
ix

142
The slow death of great cities?
shortage as well as surplus. Local authoritiesand housing associations in different regionsreport increasing turnover and numbers ofdifficult to let properties, and changing socialand demographic profiles of applicants.
Prospects
The study uncovered hundreds of projects andprogrammes underway within theneighbourhoods, most of them small scale, in anattempt to hold on to conditions. Without theseinitiatives, social problems would be muchworse. In some cases they are having ameasurable effect. For example, strongenforcement has cut crime; private developershave sold new homes to incomers; residents andhousing staff within small areas have organisedlocal compacts that have increased security,involvement, service quality and stability.
There are many positive new ideas currentlyon trial: a strong pro-urban stance; an array ofinnovative, experimental government initiativestargeted at the most deprived areas; a focus oncommunity and environmental conditions; astrong emphasis on bottom-up approaches,creating many local avenues for inventivenessand using many local levers to prevent a slideinto abandonment; a commitment from the localauthorities to rebuild inner neighbourhoodsafter the devastation left by the collapse in
manufacturing; a re-emphasis on core services,such as schools, police, health; a neighbourhoodmanagement focus; and a determined approachto centre city revitalisation that could spread tothe inner neighbourhoods.
The biggest challenges for cities are:attracting back more people in work on higherincomes and with higher skills; developing theskills and confidence of existing residents andlinking them into new work opportunities;stabilising community conditions andpreventing further exodus; creating strongneighbourhood management structures that canco-ordinate and deliver programmes, enforcebasic conditions and maintain core services;addressing the inner city environment – streetcleaning, refuse, repair, lack of greenery, traffic.
New experimental forms of city regenerationare popular and are attracting more and morenew residents into city centres. The seemingcontradiction between urban abandonment andurban renaissance represents two sides of asingle coin. Inner areas are adjacent tosuccessful new developments in core city areas.Inner city neighbourhoods have many assetsincluding space, infrastructure, proximity, andquality housing. Strong universal underpinningsuch as education, targeted programmes toequalise the poorest areas, and a commitment toexisting residents could unleash the potentialfor inner area regrowth.
x

1
1 Introduction – urban abandonment or
urban renaissance?
Why do some cities and their neighbourhoodsgenerate abandonment, chaos, breakdown at thesame time as they display resilience,experiment, innovation, excitement? Cities havethe brightest lights and the darkest corners,feeding the hopes and fuelling the fears ofmillions. In this report, we examine a nationalproblem of urban decay in the light of theexperience of two great cities suffering acutedecline and four neighbourhoods witnessing thegrowing abandonment of sound property.Managers in the cities we study talk about theabandoned terraces and rejected streets of innerneighbourhoods in terms of death and disease –‘they’re finished’, ‘there’s nothing more we cando’, ‘we can’t save it’, ‘it’s a cancer’, ‘it has togo’, ‘it’s damaging nearby areas’, ‘the voidshave bred’.
Britain ran the largest slum clearanceprogramme in the western world after theSecond World War. Yet, we are contemplatingnew urban clearances. We are demolishingthousands of the very homes we built to replacethose slums.
In every major British city every year –London, Birmingham, Liverpool, Manchester,Newcastle, Glasgow, and many smaller citiesbesides – we are wiping out housing we say weneed. Why? Too few people want to live inurban areas in many parts of the country. Theneighbourhoods that are depopulating mostrapidly create a feeling of lifelessness in spite ofthe efforts of residents and landlords as well asmost other agencies in the city. The abandonedbuildings look like graves; the new railings,lighting, planting, play areas like flowers ongravestones, a lingering farewell to something
loved now lost. The signs of care survive butmany of the people have gone.
Lavishing care on slowing the death of themost difficult urban neighbourhoods is astatement about the future, just as flowers are anaffirmation of hope. It is obvious to an observerthat these areas should not just waste away. Ourstudy reinforces the urgency of the urbanagenda because of the risk that abandonmentand subsequent demolition may spread muchfurther. Unlike human deaths, no one isrecording the numbers, the cause, or the impacton cities as a whole, of neighbourhoodabandonment and renewed demolition.Demolition may be like some ritual bleeding –the more we knock down, the more peoplecontinue to seep away.
This report attempts to do three things –uncover and explain those events that arecombining to cause the abandonment of urbanneighbourhoods; describe the struggle of thoseliving through the experience; uncover andassess attempted remedies and their impact onconditions and trends.
Neither slums nor city decay are inevitable.They are man-made problems. But, if we knewhow to keep poor city neighbourhoods working,our search for the reason why and the way outwould be simple. It is far from simple. We met abarrage of opinions, emotions and evidence ofconflicting trends. The ‘inevitability ofabandonment’, the ‘uncontrollability of decline’at ground level were matched by optimisticpredictions of population growth, job expansionand rebirth at the most senior city hall level.
Most abandoned housing is structurallysound and, in more popular neighbourhoods, it

2
The slow death of great cities?
would unquestionably stay up and be worth alot of money. Is demolition inevitable? Ispruning back cities the right approach to allowspace for renewed growth? Or doesgentrification work? The process transforms oldand valueless neighbourhoods into sought-afterareas of rising value through the injection ofinvestment and the attraction of better offpeople. This process rescued the depopulatingslum clearance areas of Islington and turnedthem into some of the most highly prizedLondon neighbourhoods (Ferris, 1972). Can welearn anything from the semi-abandonedGeorgian and Victorian slums we saved fromthe bulldozer 30 years ago?
We found evidence of low demand in theSouth East and South West as well as theMidlands and North. Housing associations arebeginning to encounter letting difficulties, untilrecently found only in local authorities. Owneroccupiers in poor neighbourhoods face long-runnegative equity and devaluation of theirproperty.
Can an urban renaissance work for deprivedneighbourhoods so that the space andopportunity within cities created by long-rundecline generate momentum for rebirth? Thefindings from our research reinforce thepotential for city regrowth.
The report is divided into five parts.
• Part I explains the background andapproach to the study, describing the
main demographic, economic, social andhousing patterns of the cities ofNewcastle, Manchester and fourunpopular neighbourhoods within them.
• Part II presents evidence of acute declineand incipient abandonment in the citiesand neighbourhoods we studied in detail,and in other parts of the country wherewe sought evidence of the problem.
• Part III tells the story of fourcommunities, relying on the directevidence we collected during visits andtalking to around 120 local people livingand working with the problems.
• Part IV looks at the national picture,searching out the origins of our anti-urban trends, the pre- and post-war slumclearance policies we adopted, the widerpressures on cities and our nationaleconomy that fuel polarisation andabandonment, and attempts atregeneration and neighbourhoodrenewal.
• Part V draws together the lessons fromthe detailed study and the widerexperience of urban problems in order touncover and assemble current ideasabout an urban renaissance thatincorporates declining neighbourhoods.

Part I
Trends in two cities and four neighbourhoods


5
2 Method and approach
Our starting points for the report are:
• What drives neighbourhood decline?What are the symptoms? How long has itbeen going on?
• Which neighbourhoods experience acutedecline? How widespread is thephenomenon?
• What measures are taken to prevent andcure the problems? Which ones work?Can neighbourhoods recover? Are someneighbourhoods doomed?
• What is the bigger picture? How do theworst areas fit into the general pattern ofcity and regional change?
Our work draws on two earlier studiesfunded by the Joseph Rowntree Foundation:Swimming against the Tide, a study of the 20 mostdifficult council estates over 15 years, andDangerous Disorder, a study of 13 unpopularareas experiencing disorder and rioting in theearly 1990s (Power and Tunstall, 1995, 1997).Both studies included Newcastle and GreaterManchester, but also covered much wider areasof the country. Many of the most unpopularestates were in London. In addition, we draw onthe history of council housing (Power, 1987),two studies of European social housing (Power,1995, 1997), and earlier work for the Departmentof Environment Priority Estates Projectconcerning unpopular areas in England andWales (1979–89). We collected evidence of lowdemand from many parts of the country in thecourse of the work (see Appendices 1–3).
Our main focus is on Manchester andNewcastle, two cities experiencing long-rundecline. Like other large cities, they are
adversely hit both by the loss of key industriesand by more general anti-urban trends. Wechoose these cities because the problems areclear, the impacts visible and the changesdramatic. The North is suffering most from theproblems we are exploring. But we link ourfindings to the more general urban experienceof low demand and exodus from certainneighbourhoods, coupled with changingdemand for social housing.
We examine two neighbourhoods in eachcity. One shows acute symptoms ofabandonment – streets with a majority of housesempty; demolition sites scattered throughoutthe area; empty property across theneighbourhood; property values falling; andintense demand problems in all property types,all tenures and all parts of the neighbourhood.The second neighbourhood is likewise inserious difficulty. But conditions generally havenot plummeted to such a low point and there ismore ground for hope that the situation can bestabilised or reversed. Each neighbourhoodcontains between 3,600 and 4,900 households,and represents either a single ward or adjacentparts of several wards. This size enabled us tocover all tenures and all services, but was smallenough to understand in depth. Each ward waswithin a much larger, deprived area.
By adopting this approach, we aim tounderstand the problem on three levels – acuteproblems at city level; extreme problems atneighbourhood level; complete abandonment inthe very worst pockets of the most difficultareas. The problems of these cities andneighbourhoods are not unique, but extreme,openly acknowledged. Their long roots aretherefore traceable; also vigorous attempts arebeing made to do something about them. Thus,

6
The slow death of great cities?
we can begin to understand the steepness of thedecline; the political and community responses;and the potential for change.
We do not identify the neighbourhoods toavoid further negative images, though weacknowledge the invaluable help of many front-line staff and residents in the four areas. Whenreporting neighbourhood conditions, wenumber them M1, M2, N3, N4; M1 and M2 arein Manchester, N3 and N4 are in Newcastle.Those familiar with the actual scenes wedescribe will possibly recognise the specificareas, but their existing knowledge of theproblems prevents further damage resultingfrom our work. Those concerned about thegeneral problems of low demand and anxious tounderstand more fully what is going on do notneed the exact location or names in order toappreciate the situation facing theseneighbourhoods. The neighbourhoods sharemany characteristics with unpopular anddifficult to manage urban areas all over thecountry, including in high demand cities likeLondon. There is an intense hierarchy ofpopular and unpopular areas. The least popularsuffer high levels of empty property, highturnover with some abandonment anddemolition because of low demand (HackneyBorough Council, 1992; Southwark Council,1994; Power and Tunstall, 1995).
It is possible to draw a broad distinctionbetween low demand in economicallyprosperous cities and regions such as the SouthEast and low demand in cities and regionssuffering long-term structural decline such asthe North. Throughout the report we make thisdistinction, although earlier work and researchoutside the North for this study suggestcommon patterns and pressures within cities
(DoE, 1981a). Our contention is that theeconomic decline, population loss and incipientabandonment evidenced in the North are amore extreme and therefore more visiblemanifestation of a wider process. Thephenomenon also exists in most NorthernEuropean countries, though with distinctcontinental features and in different degrees(Caisse des Depots, 1998).
We drew on academic research in progresson this subject (Housing Corporation, 1997;Bramley, 1998; CIoH, 1998) and governmentresearch as well as earlier work (see Appendix 4for full list).
We spoke to 104 staff in the followingservices: estate agents, voluntary bodies, shops,senior town hall officials, housing, regeneration,education, police, community work, socialservices, councillors and housing associations.We met with 24 residents’ representatives in thefour areas. Where possible, we met one seniorand one front-line representative for each mainservice in each area (see Appendix 5 forbreakdown by service). In addition, weinterviewed local staff in other similarneighbourhoods. We spoke to a further 33people across the country including chiefexecutives, directors of housing and second tierofficers.
Our aim in working close to the ground wasto ‘get under the skin of the problem’. In orderto understand neighbourhood problems as fullyas possible, we relied on four principal methodsbased on our experience of earlierneighbourhood investigations:
• direct observation of conditions andchanges in conditions over time in theneighbourhoods

7
Method and approach
• direct interviews with the residents andstaff living and working in a situation ofacute decline
• collation of available facts on the areasfrom as wide a range of sources aspossible including the Census, councilreports and monitoring, governmentrecords and other research in the field
• interviews with senior officialsresponsible for neighbourhood strategiesand interventions.
In addition, we collected press reports andlocal newsletters; we took photographs of theareas; we wrote observation notes immediatelyafter every visit; we recorded and wrote upinterviews; we documented empty sites andproperty; we mapped the smallerneighbourhoods within each area showing thetenure, the location of services, level ofabandonment, progression of neighbourhood
emptying and changes to buildings.We had not expected the problem to move so
fast that, over the 16 months of our study, wewould witness directly visible changes.However, there was a rapid progression overthis short period both in the manifestation of theproblem itself and in the approach to theproblem by the cities. The people we spoke toleft us with an urgent sense that their struggle tosurvive in such a vortex had been ‘kept quiet fortoo long’. Therefore, whenever possible, we usetheir own words to convey the full force ofevents and to illustrate the issues we foundwider evidence to support. No individual quoteis directly attributed, but we make it clear whichsource we are using. We use individualquotations to support wider evidence, not asevidence in itself. We tried to avoid bias bychecking all the case studies and quotationswith local sources.

8
3 Changes in the two cities and four
neighbourhoods
Below, we present demographic and economicevidence, comparing Manchester and Newcastlewith the national picture. Where possible, weshow comparable trends in the fourneighbourhoods.
Population
Newcastle and Manchester were both muchlarger cities at the turn of the century than today(Halsey, 1988). Both have continued to losepopulation into the 1990s, but the rate of losshas slowed down and may stabilise or evenreverse over the next few years. People inemployment have moved out faster and furtherthan jobs (DoE, 1996). Table 1 shows thepopulation trend.
Outer areas have been depopulating too,though more slowly than inner areas. Table 2shows this.
Table 3 shows the greater population lossesin the four neighbourhoods.
The two Manchester neighbourhoods lostover one-third of their populations in the 1970sbecause of slum clearance. The Newcastleneighbourhoods experienced continuousserious decline over the whole period. Thechanges result in a fairly static supply of housesalongside declining population.
In spite of acute population losses, thenumber of households grew in both citiesbetween 1981 and 1991 – by 3 per cent inManchester and 6 per cent in Newcastle. Tosome extent, household formation is
Table 1 Population of cities of Manchester and Newcastle, 1971–96
Year Manchester1 % change Newcastle2 % change
1971 553,600 299,6641981 462,600 269,2331971–81 –16 –10
1991 438,500 255,9851981–91 –5 –5
1996 430,800 251,8001991–96 –2 –2
Population loss1971–96 –122,800 –22 –47,864 –16
Source: Manchester Committee Report, 30 May 1996; Manchester’s 1996 Local Census; NewcastleCity Profiles, 1997.
1 The figures for Manchester show the mid-year estimates prepared by the Registrar General inorder to overcome the problem of the 1991 Census having largely excluded students.
2 The figures for Newcastle represent the private household population and exclude the institutionalpopulation. Newcastle City Council found that the mid-year estimate for 1996 over-compensatedfor under-enumeration in the 1991 Census, so Newcastle’s own figures, based on their 1996 inter-censal survey together with the 1971, 1981 and 1991 Censuses, have been used here.

9
Changes in the two cities and four neighbourhoods
encouraged by available space. But, in the twoNewcastle neighbourhoods, the absolutenumber of households shrank, suggestingextreme low demand.
Table 4 shows changes in the number ofhouseholds in two cities and fourneighbourhoods between 1981 and 1991.
Table 2 Population change in inner and outer areas
of Manchester and Newcastle, 1971–91 (%)
Manchester Newcastle
1971–81Inner –19 –21Outer –17 –7
1981–91Inner –10 –8Outer –2 –3
Source: Urban Trends in England (DoE, 1996, p. 24).
Table 3 Population change in four inner areas and two cities, 1971–96 (%)
Manchester Newcastle M1 M2 N3 N4
1971–81 –16 –10 –39 –39 –13 –151981–91 –5 –5 –5 –8 –19 –211991–96 –2 –2 –6 –7 –20 –10
Sources: 1981 and 1991 Census; Newcastle City Profiles, 1997; Manchester’s 1996 Local Census.
Table 4 Changes in the number of households in two cities and four neighbourhoods, 1981–91 (%)
Manchester Newcastle M1 M2 N3 N4
1981–91 +3 +6 +13 +3 –5 –9
Sources: Manchester Committee Report, 30 May 1996, based on the 1991 Census; Newcastle CityProfiles, 1997, based on the 1991 Census.
Table 5 Population densities (residents per hectare)
Location Neighbourhoods
Great Britain 2.4England 3.6Inner London 78.1Greater London 42.3Birmingham 36.2Glasgow 33.1Manchester 34.9 M1 31 M2 37Newcastle 23.2 N3 44 N4 42
Source: 1991 Census.

10
The slow death of great cities?
Table 6 Declining population of conurbations in thousands
2001Region 1961 1971 1981 1991 (projected)
Greater Manchester 2,710 2,750 2,619 2,571 2,560Tyne and Wear 1,241 1,218 1,155 1,130 1,114Merseyside 1,711 1,662 1,522 1,450 1,386Greater London 7,977 7,529 6,806 6,890 7,215
Sources: Annual Abstract of Statistics, 1998; PPI population estimates, 1998; 1996 based sub-nationalprojection (PP3 98/1).
Density
Both cities have low population densities, lessthan half the density of inner London. While theoverall population density of Britain is amongthe highest in Europe, urban densities generallyare low (Economist, 1998). Paris, Madrid, Rome,Berlin are visibly more densely built up thanLondon, for example. Table 5 shows the numberof residents per hectare in the two cities andfour neighbourhoods in comparison with othercities and nationally.
Table 6 highlights the long-running declineof urban areas leading to ever lower densitieswithin the main cities of England. The Office ofNational Statistics (ONS) expects the overalldecline of conurbations to continue, with theexception of Greater London, based on the 1996population figures (ONS, 1998).
Jobs
The population and density changes are mirroredby job changes. The figures comparing 1984 and1991 show that jobs in inner areas continued todisappear while jobs in the outer areas grew. Inouter Manchester, jobs expanded by 41 per cent.Table 7 shows this. The increase in outer city jobscontrasts with outer population decline.
The pattern of jobs has changed radicallywith the losses heavily concentrated amongmale workers and the gains among females.Table 8 shows this.
The starkest losses were in manufacturing,as shown in Table 9.
The surprisingly large increase in publicservice jobs in Newcastle may be due in part tospecific boundaries, to the relocation ofgovernment offices to Newcastle, and to the factthat the definition of ‘public services’ includeshealth care provided by the private sector, forexample. Manchester City lost public servicejobs, whilst the rest of the Greater Manchesterconurbation gained 55,000 (an increase of 44 percent) (Turok and Edge, forthcoming).
The proportion of the populationunemployed (registered for work but without ajob) was more than double the national averagein the two cities, but much higher in the fourinner areas than in the cities as a whole. Table 10shows the unemployment rates between 1991and 1996/97. Unemployment droppedsignificantly over the five years from 1991 in thetwo Manchester areas but rose in the Newcastleareas. Mirroring the general job changes,unemployment dropped far more rapidly forwomen than for men.

11
Changes in the two cities and four neighbourhoods
Table 7 Employment change in Manchester and
Newcastle, 1984–91 (% total jobs)
Manchester Newcastle
Inner –6 –7Outer +41 +9
Source: Urban Trends in England (DoE, 1996,p. 44).
Table 8 Employment change for male and female
workers in inner and outer areas of Manchester and
Newcastle, 1984–91 (as a % of full-time equivalents)
Manchester NewcastleMale Female Male Female
Inner –13 +1 –19 +4Outer* +25 +54 –1 +14
Source: Urban Trends in England (DoE, 1996,p. 44).
* Outer Manchester is a small proportion of thecity as a whole, making the % changes moreextreme
Table 9 Changes in sector of employment in the cities of Manchester and Newcastle, 1981–96
Great Britain (%) Manchester (%) Newcastle (%)
Manufacturing –1,950,000 (–33) –38,600 (–62) –12,700 (–42)Private services +2,899,000 (+35) –2,750 (–2) +1,200 (+1)Public services + 988,000 (+22) –5,250 (–7) +14,500 (+35)
Sources: Annual Employment Survey/Census of Employment; Turok and Edge (forthcoming).
Notes: See notes at end of Chapter 3.
Table 10 Male and female unemployment rate, 1991–96/97 (%)
Nationally Manchester Newcastle1 M1 M2 N3 N4
19911 Male 11 23 19 29 32 35 38Female 7 14 10 19 16 18 19
19972 Male 8 17 21* 19 23 39* 43*Female 3 6 9* 5 5 13* 16*
Sources: Newcastle City Profiles, 1991; Newcastle City Profiles, 1996; Social Trends, 1998; ManchesterWard Profiles, 1991; Manchester Matters, 1997; Census, 1991.
1 1991 figures represent Census unemployment rates. Newcastle’s 1996 (*) figures are also based onCensus unemployment rates.
2 1997 figures are based on the Office of National Statistics claimant counts. This may lower theManchester figures.
The proportion of the working agepopulation not in work or studying is far higherin both cities and nationally than the recordedunemployment rate; in the four inner areasalmost half the population of working age isoutside the labour market and education (seeTable 11). This problem has got worse.

12
The slow death of great cities?
Table 11 Percentage of working age population not in work or studying or training, 1991
National Manchester Newcastle M1 M2 N3 N4
24 37 31 46 48 49 50
Source: 1991 Census.
Notes to Table 9
• These figures treat full-time jobs asequivalent to part-time posts, therebyignoring the shift from the former to thelatter.
• The Annual Employment Survey/Censusof Employment does not record self-employment, which increased over theperiod.
• Manchester and Newcastle are defined asthe City Council areas in both cases, notwider conurbations whose definition ismore ambiguous. The outer conurbationsof most cities performed better than thecores over the period 1981–96(interestingly, Leeds and Newcastle werethe two exceptions).
• Occupational data (e.g. manual/non-manual) are available only from theCensus of Population. Considerablemanipulation is required to identify thechanges between 1981 and 1991 sincedefinitions changed over this period.However, the bulk of manual jobs tend tobe in manufacturing industry, so itsdecline is a good indicator of the loss ofmanual jobs. Some manual jobs are alsofound in two service sectors: (i)distribution, hotels and catering (mainlyunskilled); and (ii) transport andcommunications (mainly skilled). Bothsectors declined in Newcastle between1981–96. Distribution, etc. also declined inManchester, but transport andcommunications expanded slightly.
Source: Ivan Turok.

13
4 Social dynamics
In the following sections, we examine some ofthe social problems common to urban areas.
Deprivation
Based on the Government’s new index of localdeprivation (DETR, 1998a), Manchester ranks asthe third most deprived area in England andNewcastle 19th, out of 354. AlthoughManchester scores higher on most indicatorsthan Newcastle, both score higher than all theirsurrounding authorities. Table 12 shows this.
Table 12 Degree of deprivation on 12 indicators in
local authorities around Greater Manchester and
Tyneside
Degree of deprivationDeprivation Rank among
Authority score local authorities
Manchester 36.33 3Salford 26.64 23Rochdale 25.13 29Oldham 24.82 33Bolton 20.66 47Tameside 19.78 53Trafford 7.42 129Stockport 3.81 177
Newcastle 27.95 19Sunderland 26.90 21Gateshead 24.58 35South Tyneside 23.67 38North Tyneside 18.67 62
Source: DETR, 1998a.
Table 13 The top 20 local authorities on the
government’s new index of deprivation in rank
order
Area Score
1 Liverpool 40.072 Newham 38.553 Manchester 36.334 Hackney 35.215 Birmingham 34.676 Tower Hamlets 34.307 Sandwell 33.788 Southwark 33.749 Knowsley 33.6910 Islington 32.2111 Greenwich 31.5812 Lambeth 31.5713 Haringey 31.5314 Lewisham 29.4415 Barking and Dagenham 28.6916 Nottingham 28.4417 Camden 28.2318 Hammersmith and Fulham 28.1919 Newcastle upon Tyne 27.9520 Brent 26.95
Source: DETR, 1998a.
Table 13 shows the 20 most deprived localauthority areas. Newcastle is less than fivepoints behind Islington at tenth, which is onlyfour points behind Manchester at third. InnerLondon and the Midlands rank among the mostdeprived areas of the country. This underlinesthe national dimension of concentrateddeprivation. On core indices, the most deprivedboroughs and neighbourhoods show similarpatterns, though the intensity of specificproblems varies.
14
The slow death of great cities?
Concentrated deprivation
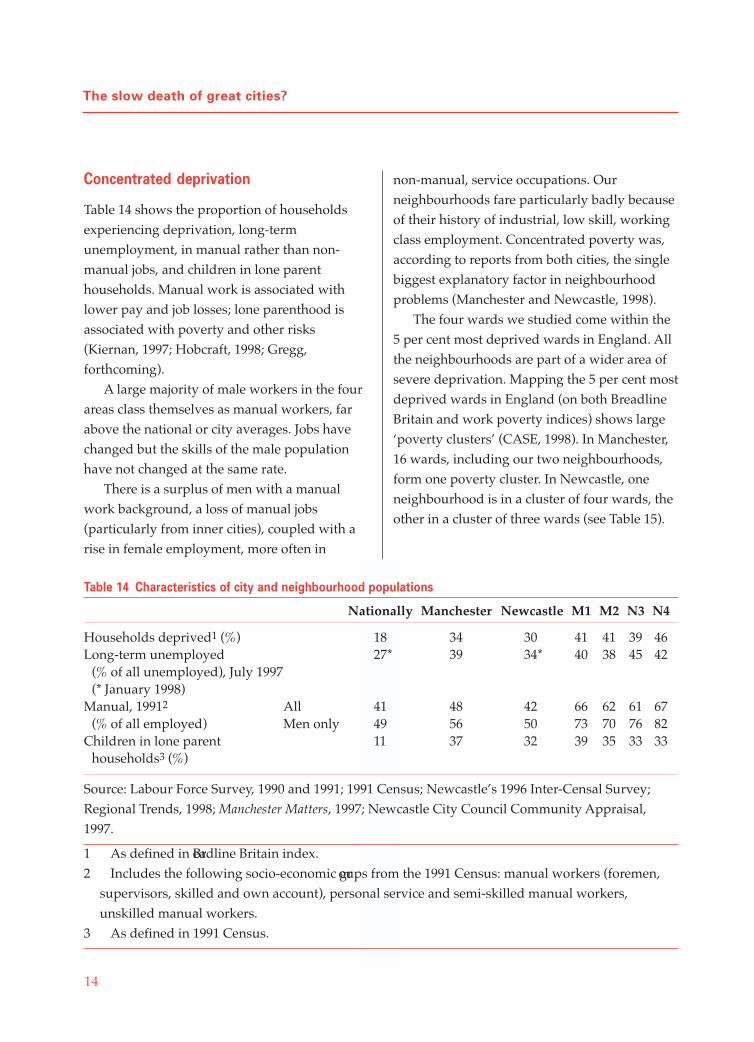
Table 14 shows the proportion of householdsexperiencing deprivation, long-termunemployment, in manual rather than non-manual jobs, and children in lone parenthouseholds. Manual work is associated withlower pay and job losses; lone parenthood isassociated with poverty and other risks(Kiernan, 1997; Hobcraft, 1998; Gregg,forthcoming).
A large majority of male workers in the fourareas class themselves as manual workers, farabove the national or city averages. Jobs havechanged but the skills of the male populationhave not changed at the same rate.
There is a surplus of men with a manualwork background, a loss of manual jobs(particularly from inner cities), coupled with arise in female employment, more often in
non-manual, service occupations. Ourneighbourhoods fare particularly badly becauseof their history of industrial, low skill, workingclass employment. Concentrated poverty was,according to reports from both cities, the singlebiggest explanatory factor in neighbourhoodproblems (Manchester and Newcastle, 1998).
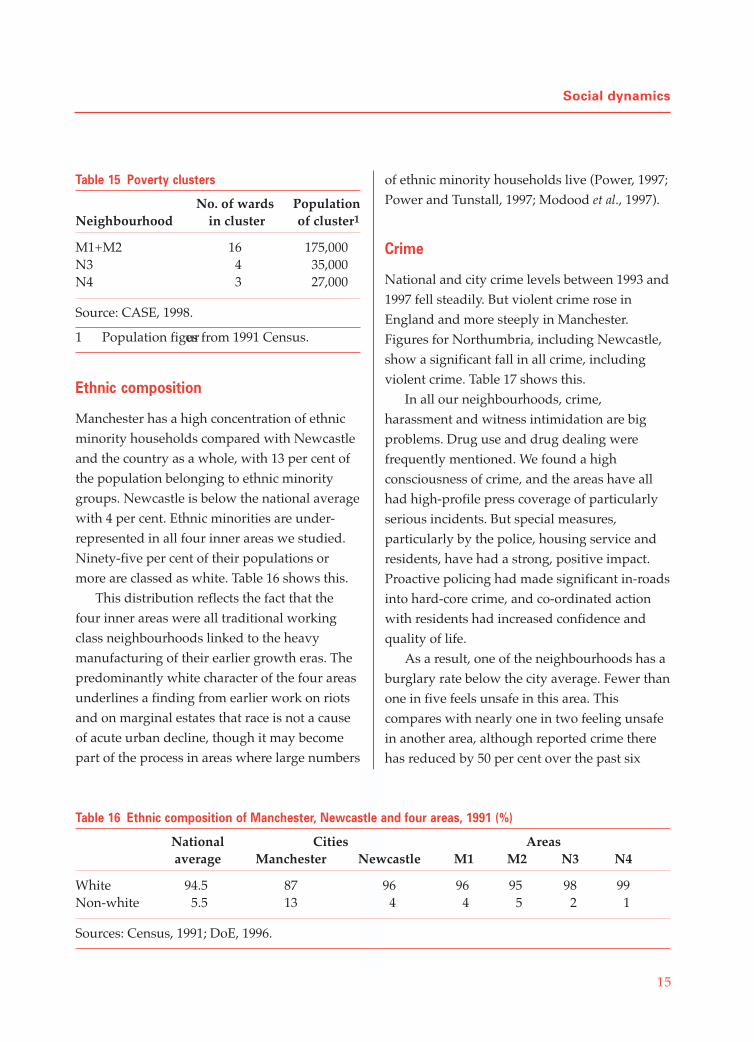
The four wards we studied come within the5 per cent most deprived wards in England. Allthe neighbourhoods are part of a wider area ofsevere deprivation. Mapping the 5 per cent mostdeprived wards in England (on both BreadlineBritain and work poverty indices) shows large‘poverty clusters’ (CASE, 1998). In Manchester,16 wards, including our two neighbourhoods,form one poverty cluster. In Newcastle, oneneighbourhood is in a cluster of four wards, theother in a cluster of three wards (see Table 15).
Table 14 Characteristics of city and neighbourhood populations
Nationally Manchester Newcastle M1 M2 N3 N4
Households deprived1 (%) 18 34 30 41 41 39 46Long-term unemployed 27* 39 34* 40 38 45 42
(% of all unemployed), July 1997(* January 1998)
Manual, 19912 All 41 48 42 66 62 61 67(% of all employed) Men only 49 56 50 73 70 76 82
Children in lone parent 11 37 32 39 35 33 33households3 (%)
Source: Labour Force Survey, 1990 and 1991; 1991 Census; Newcastle’s 1996 Inter-Censal Survey;Regional Trends, 1998; Manchester Matters, 1997; Newcastle City Council Community Appraisal,1997.
1 As defined in Breadline Britain index.2 Includes the following socio-economic groups from the 1991 Census: manual workers (foremen,
supervisors, skilled and own account), personal service and semi-skilled manual workers,unskilled manual workers.
3 As defined in 1991 Census.
15
Social dynamics
Ethnic composition
Manchester has a high concentration of ethnicminority households compared with Newcastleand the country as a whole, with 13 per cent ofthe population belonging to ethnic minoritygroups. Newcastle is below the national averagewith 4 per cent. Ethnic minorities are under-represented in all four inner areas we studied.Ninety-five per cent of their populations ormore are classed as white. Table 16 shows this.
This distribution reflects the fact that thefour inner areas were all traditional workingclass neighbourhoods linked to the heavymanufacturing of their earlier growth eras. Thepredominantly white character of the four areasunderlines a finding from earlier work on riotsand on marginal estates that race is not a causeof acute urban decline, though it may becomepart of the process in areas where large numbers
of ethnic minority households live (Power, 1997;Power and Tunstall, 1997; Modood et al., 1997).
Crime
National and city crime levels between 1993 and1997 fell steadily. But violent crime rose inEngland and more steeply in Manchester.Figures for Northumbria, including Newcastle,show a significant fall in all crime, includingviolent crime. Table 17 shows this.
In all our neighbourhoods, crime,harassment and witness intimidation are bigproblems. Drug use and drug dealing werefrequently mentioned. We found a highconsciousness of crime, and the areas have allhad high-profile press coverage of particularlyserious incidents. But special measures,particularly by the police, housing service andresidents, have had a strong, positive impact.Proactive policing had made significant in-roadsinto hard-core crime, and co-ordinated actionwith residents had increased confidence andquality of life.
As a result, one of the neighbourhoods has aburglary rate below the city average. Fewer thanone in five feels unsafe in this area. Thiscompares with nearly one in two feeling unsafein another area, although reported crime therehas reduced by 50 per cent over the past six
Table 15 Poverty clusters
No. of wards PopulationNeighbourhood in cluster of cluster1
M1+M2 16 175,000N3 4 35,000N4 3 27,000
Source: CASE, 1998.
1 Population figures from 1991 Census.
Table 16 Ethnic composition of Manchester, Newcastle and four areas, 1991 (%)
National Cities Areasaverage Manchester Newcastle M1 M2 N3 N4
White 94.5 87 96 96 95 98 99Non-white 5.5 13 4 4 5 2 1
Sources: Census, 1991; DoE, 1996.

16
The slow death of great cities?
years as Figure 1 illustrates (Newcastle CityCouncil, 1994; Northumbria Police, 1998).Although there is often a problem of under-reporting, the active police presence in these
areas, including witness support, and the goodworking relationship between police, housingstaff and residents, helps explain the fall.
Figure 1 Total recorded crimes in neighbourhood (N3) 1992–98
Table 17 Notifiable offences recorded by the police per 100,000 population by police force area and offence
group
All Violent Theft andPolice force area Year crimes crime Burglary handling
England 1993 10,846 575 2,703 5,4101994 10,296 610 2,480 5,0141995 9,963 607 2,429 4,7961996 9,795 667 2,275 4,6431997 8,885 666 1,973 4,195
Greater Manchester 1993 14,178 654 3,802 6,8311994 13,111 615 3,532 6,0231995 12,723 622 3,330 5,7971996 12,721 727 3,249 5,6201997 11,936 847 2,944 5,168
Northumbria 1993 14,840 576 4,371 6,1191994 14,120 564 3,959 5,6891995 13,466 546 3,667 5,4681996 11,796 497 2,977 4,7761997 9,770 453 2,411 4,209
Source: Criminal Statistics England and Wales. London: HMSO, 1993–97.
20
40
60
80
100
120
140
160
180
200
Mo
nth
ly c
rim
e to
tal
0
Month
Jul. 9
2
Sep. 9
2
Nov. 92
Jan. 9
3
Mar
. 93
May
93
Jul. 9
3
Sep. 9
3
Nov. 93
Jan. 9
4
Mar
. 94
May
94
Jul. 9
4
Sep. 9
4
Nov. 94
Jan. 9
5
Mar
. 95
May
95
Jul. 9
5
Sep. 9
5
Nov. 95
Jan. 9
6
Mar
. 96
May
96
Jul. 9
6
Sep. 9
6
Nov. 96
Jan. 9
7
Mar
. 97
May
97
Jul. 9
7
Sep. 9
7
Nov. 97
Jan.98

17
5 Housing patterns – how problematic
are they?
Next we examine housing patterns to establishtheir effect on the overall decline of the citiesand neighbourhoods.
Tenure
The way housing is owned in the two cities isvery different from the national pattern, thoughit is fairly typical of inner urban areas. Table 18shows the tenure pattern.
Both Manchester and Newcastle have nearlydouble the national proportion of council stockand more housing association activity thanaverage. Conversely, they have far lower levelsof owner occupation and around the average forprivate renting. The tenure distribution is evenmore skewed in the four neighbourhoods with ahigher proportion of social renting than the cityaverage –at least two-and-a-half times thenational level. A majority of all housing in theneighbourhoods is council owned. Owneroccupation is less than half the national average.
The relatively low level of owner occupationin the cities as a whole and the fourneighbourhoods in particular has an impact on
who lives in the city, who leaves and who wantsto stay. In predominantly low incomeneighbourhoods within significantly lowincome cities, tenure plays a very important role– originally in ensuring that the poor werehoused, but today driving depopulation as thenumbers wanting and able to buy have risen,particularly in younger age groups. But, if theneighbourhood conditions are poor, then fewwill want to invest in owner occupation even ifit is available and cheap, thus fuelling a viciouscircle, as illustrated in Figure 2.
People leave for surrounding areas, such asNorth Tyneside outside Newcastle, or Rochdaleand Altrincham, outside Manchester. Thispattern has resulted in low Right to Buy levels,far below the national average. Owner occupiersalready in these neighbourhoods often ‘feelcompletely trapped’ by declining propertyvalues, and the surrounding social andenvironmental problems (Manchester CityCouncil, 1998e).
Housing associations are significantproviders of rented housing in the cities andneighbourhoods. Their role in regeneration has
Table 18 The tenure pattern in the two cities and four neighbourhoods, compared with the national average
(%)
Nationalaverage Manchester Newcastle M1 M2 N3 N4
Local authority renting 20 38 35 50 54 48 77Owner occupied 68 41 50 28 30 35 16Private renting 9 12 9 8 8 10 2Housing associations 3 7 5 13 6 6 4
Source: 1991 Census (from Newcastle City Profiles and Manchester Ward Profiles); ONS et al. (1996).

18
The slow death of great cities?
led to their strong growth in the 1990s.The private rented sector is small. The high
proportion of social renting – two-thirds of allhouseholds – helps to explain this. Nonetheless,private landlords let often to marginalhouseholds. The local authorities saw privatelandlords as offering a fail-safe for people. Theyplay an important role within the cities andlocal authorities want to involve them inneighbourhood renewal (Manchester andNewcastle, 1998). The case studies suggest agrowth in private renting since 1991.
Changing housing patterns
Tenure change in the two cities has followednational trends, with a rise in owner occupation,a fall in council renting and a rise in housingassociation renting. In the neighbourhoods, theincrease in housing association property was
conspicuous, even though, as a proportion oftotal households, the sector remained small. Inneighbourhood N4, for example, although thepoint change was relatively small, the actualnumber of households living in the housingassociation sector more than tripled and those inowner occupation doubled. Other changes weregenerally smaller than average (see Table 19).
Many of the council losses in the cities wereto Right to Buy purchasers. Some of thesepurchasers later became private landlords whenthey could not sell on their properties. But, in allthe neighbourhoods, there was very little Rightto Buy. Table 20 shows the proportion of sales inboth cities and the four neighbourhoods.
Figure 3 shows the proportion of councilstock that has been sold across 26 wards inNewcastle, varying from nearly 50 per cent tounder 5 per cent. Our two neighbourhoods areclose to the bottom.
Source: Manchester and Newcastle, 1998.
Figure 2 Vicious circle of tenure and conditions in low income neighbourhoods
Poor neighbourhoodconditions
Low right tobuy take up
Low value ofneighbourhood
Highpercentage ofsocial renting
Low incomeresidents
Low percentage ofowner occupation
Exodus of those wantingto buy, particularly young
Low value of owneroccupied property

19
Housing patterns – how problematic are they?
Table 19 Tenure change as a % point change of share of total, 1981–91
Nationalaverage Manchester Newcastle M1 M2 N3 N4
Local authority –10 –9 –11 –7 –3 –7 –12Owner occupation +11 +5 +11 +2 0 +3 +9Private rented –2 +11 –2 –21 01 –1 –1Housing association +1 +2 +2 +7 +3 +4 +3
Source: 1991 and 1981 Census data collated by Manchester and Newcastle City Council; ONS et al.(1996).
1 A small number of properties rented with a job or business have been included in the privaterented figures for 1991. These were previously included in the housing association figures.
Table 20 Levels of Right to Buy sales, 1981–98
Nationalaverage Manchester Newcastle M1 M2 N3 N4
Percentage of 1981 stock 25 14 19 81 21 3 9sold to sitting tenants
Source: City Councils, 1998.
1 Percentage of 1998 stock.
Ward
Per
cent
age
of 1
981
stoc
k so
ld
0
5
10
15
20
25
30
35
40
45
50
N4 N3
Figure 3 The pattern of Right to Buy sales in Newcastle showing the percentage of stock sold in each ward
Source: Newcastle City Council, June 1998.

20
The slow death of great cities?
Housing types
The two cities have a high proportion of houses– around 70 per cent of the stock. Flats areconcentrated in post-war council estates, someolder pre-war blocks, sub-divided older housesand Tyneside flats. A majority of the houses areterraced and many date from the nineteenthcentury. A tiny proportion are detached.
The four neighbourhoods are alsopredominantly made up of houses, mainlyterraced. Terraced houses are both Victorian andcouncil-built in this century. Terraced houseshave been traditionally popular across thecountry but, in all four neighbourhoods, theback alleys and yards between properties, built
Table 21 The distribution of types of stock in the two cities and four neighbourhoods (percentage)
NationalStock type average Manchester Newcastle M1 M2 N3 N4
Detached 22 3 5 1 1 2 1Semi-detached 31 28 31 22 10 32 10Terraced 28 41 32 56 59 46 53Flat 19 28 32 21 30 21 37
Sources: Social Trends (ONS, 1997, p. 172); 1991 Census (quoted in Manchester Ward Profiles andNewcastle City Profiles).
for soil carts to remove sewage before moderndrains, led to abandonment (see photographs).
Table 21 shows the break-down of housingtypes.
Generally, the housing stock in all fourneighbourhoods is attractive, solidly built, welllaid out and well maintained. Even semi-abandoned streets are generally made up ofsuch property. There are only one or two estatesand blocks of clumsy, unattractive design. Manyof the least popular, hardest to manage blockshave been demolished. Overall it is hard to seephysical housing design or quality reasons whythese neighbourhoods have hit such extremedifficulty. The photographs show this.

21
Housing patterns – how problematic are they?
Back alleys

22
The slow death of great cities?
High quality modern housing
association property in low
demand
Housing association properties –
empties and occupied homes are
interspersed

Part II
Evidence of incipient abandonment


25
Next, we look at evidence from the fourneighbourhoods of actual abandonment.Abandonment signals the loss of value and useof an area. It attracts vandalism, boarding upand neglect of conditions. It often leads to arson,crime and refuse dumping. It lowers standardsmore generally and creates fear. The starkestmeasure of an area’s decline is visible emptyproperty (Power, 1987, 1997; Downes, 1989).
The four neighbourhoods experienced abuild-up of abandoned homes, either with netcurtains to disguise their emptiness or withsteel, sytex or wooden security shuttering. In allof the areas, whole streets and groups of streetswere semi-abandoned.
Empty property
In the four neighbourhoods, the picture iscomplex and sometimes out of control. TheNewcastle neighbourhoods have between 13and 20 per cent of their council property empty.The Manchester areas have risen steeply from 5per cent two years ago to around 15 per cent.The problem of abandonment in Manchester isbelieved to be catching up with Newcastle(Manchester City Council, 1998e). Both citiesreported a swift, sudden and unexpected loss ofdemand. We counted the numbers of emptyproperties in specific streets in the worstaffected areas on a specific day. Table 22summarises what we found in particular streets.This exercise does not show the overall patternof empty property in the four neighbourhoods.Appendix 9 shows city-wide levels of emptyproperty in the private and public sectors,difficult to let properties and demolition figures.
We observed the following in the worstaffected areas:
• The boarded up properties can belong tothe local authority, a local housingassociation, a private landlord, an owneroccupier – abandonment is affecting alltenures.
• The semi-abandoned streets or blocksinclude Victorian terraces, 1930s councilcottages, post-war houses, modernhousing association developments lessthan ten years old, small blocks ofsheltered flats, 1960s’ and 1970s’ purpose-built estates – all property types areinvolved.
• The streets with boarded up propertiesare not on the whole badly maintained, orunappealing; they tend to containattractive, small-scale, well built houseswith gardens; transferred to an innerLondon context, many of the propertieswould be gentrified.
• There are frequent discussions in the citycouncils about demolition – the de-stabilising effect on the community isintense.
• Some unlet properties belonging tohousing associations are in pristinecondition; they cost around £60,000 a unitto build less than ten years ago – theirabandonment is hard to explain.
• Some Victorian terraces are solid,attractive and renovated, but the backsare a jumble of outhouses, high walls andrubbish-strewn alleys – ugly, insecure andlong outdated. No way has been found ofturning these yards and alleys intosecure, joined-up back gardens.
6 Urban abandonment

26
The slow death of great cities?
• Many individual houses are stillattractive but the neighbourhoodenvironment is an active deterrent.
Many managers and residents believe thatthere simply are not enough people to keep the
houses filled. The people have gone but thehouses are there and, in one or two places, arestill being built!
Table 22 The tenure, number of units and volume of empty property in 30 streets in four neighbourhoods
on a specific day in 1998
Street or block Tenure (main landlord) No. of units No. empty % empty
1 Local authority 6 5 832 Local authority 208 93 453 Local authority 34 14 414 Local authority 60 17 285 Local authority 27 7 266 Local authority 16 4 257 Local authority 90 22 248 Local authority 63 13 219 Local authority 90 19 2110 Local authority 16 3 1911 Local authority 37 7 1912 Local authority 90 15 1713 Local authority 27 4 1514 Local authority 111 14 1315 Local authority 50 6 1216 Local authority 94 11 1217 Local authority 87 7 818 Local authority 171 11 619 Housing association/private 11 7 6420 Housing association/private 74 47 6421 Housing association/private 26 15 5822 Housing association/private 12 6 5023 Housing association/private 82 32 3924 Housing association/private 84 30 3625 Housing association/private 55 18 3326 Housing association/private 26 8 3127 Private 12 6 5028 Private 37 15 4029 Private 24 5 2030 Private 26 5 19
Source: Fieldwork street counts and LA Housing Department information, September 1998.

27
Urban abandonment
This emptying street is likely to be demolished (private and HA)

28
The slow death of great cities?
Demolition
In each city, there is now a regular demolitionprogramme of at least 250 local authorityproperties a year. It is likely to rise based oncurrent predictions. These figures do notinclude the much larger-scale demolition withinregeneration programmes in all fourneighbourhoods. They also do not includeprivate demolitions which are significant, butnot monitored in the same way by the localauthority. The demolitions keep the volume ofempty homes within bounds in the worst hitareas. However, three of the fourneighbourhoods appear to be experiencinggalloping abandonment in restricted areas.
Demolition has not generally stemmed thetide of abandonment although demolition ofspecific unpopular blocks has sometimesincreased the popularity of surrounding houses.In some instances, demolition has fuelled theproblem, creating an atmosphere of uncertaintyover the future of the area, giving a signal ofzero value and zero demand, thereby deterringwould-be applicants. Many demolitiondecisions are being made in response toimmediate neighbourhood conditions without aclear overall plan, or a full option appraisal(Newcastle City Council, 1998b). Other nearbystreets then often start to show the samesymptoms, as the blight from abandonmentinfects the atmosphere of the surroundingstreets and fear drives people in adjacent streetsaway.
Views about demolition were very mixedwith most people seeing it as both positive andnegative. Some current demolition proposals areprovoking objections and there is certainly notunanimous support for it, even where levels ofabandonment are high. Remaining residents
often want to hold on (see Part IV). Whiledemolition helped remove blighted property, itsignalled a more general loss of confidence inthe area when the demolished property wassound and in good condition, as it usually was.
Other cities are demolishing council housingon a larger scale: 2,000 council homes a year arebeing demolished in Glasgow (Webster, 1998); atleast 8,000 council properties were demolishedin Liverpool in the 1980s, only a smallproportion of which were replaced (Ridley,1996). There is also significant councildemolition going on in London, based onregeneration schemes in the 1990s – forexample, in Hackney 5,000, Southwark 2,000,Tower Hamlets 2,000, Brent 3,000 and Islington600. The particular problems of the two cities westudied closely are part of a much biggerprocess. However, central government andregional offices do not have up-to-dateinformation on the scale of demolition (DETR,1997a).
Pace of abandonment
The speed with which streets or blocks areshifting from being relatively well occupied tonearly half-empty is alarming. Over a relativelylong period, the level of turnover had beenunusually high; new demand was heavilyconcentrated among more transient, unstableand younger households; and the level of emptyproperty was above the city average of 3–5 percent – at least 15 per cent in two of theneighbourhoods. This created instability and areduction in informal social controls leaving avacuum which eventually tipped a highlylocalised low demand area into rapidabandonment. Table 23 shows the rapid change.

29
Urban abandonment
Table 24 highlights the change on specificestates or in small areas within theneighbourhoods.
Property values
Low property values reflect the reducingeconomic and social value of these areas. Insome pockets of all four areas, some owneroccupied property cannot be sold at all. We
Table 23 Empty council property in the four neighbourhoods over the period 1995–98
Neighbourhood levels of empty property (number of empties)Year M1 M2 N3 N4
1995–96 (quarter 4) 81 43 260 3081996–97 (quarter 4) 127 148 257 3091997–98 (quarter 1) 176 174 244 3411997–98 (quarter 2) 231 230 214 3441997–98 (quarter 3) 211 238 217 4171997–98 (quarter 4) 260 234 225 4241998–99 (quarter 1) 326 277 252 4421998–99 (quarter 2) 317 306 2151 473
Source: Newcastle and Manchester Housing Departments.
1 Demolitions account for the different pattern of empty property in this neighbourhood.
found private properties that had been boughtfor £30,000 seven years ago now worth only£5,000, and properties bought for £20,000 tenyears ago worth only £2,000. The low privateproperty values help explain the low level ofRight to Buy in the areas. The discounted valueof Right to Buy – around £13,000 – was only alittle below the national average of £15,000, butfar above the private market value (see Table25).
Table 24 The rapid change in % of empty property in six small areas within the four neighbourhoods,
1995–98
1995–96 1996–97 1997–98
Small area 1 2 6 19Small area 2 7 13 16Small area 3 6 18 35Small area 4 4 8 15Small area 5 9% (1993) 13 14 15Small area 6 5% (1994) 12 13 18
Source: Newcastle and Manchester Housing Departments.

30
The slow death of great cities?
An estate agent in one of the areas explainedthe problem in these words:
I have been an estate agent practising in the innercity for the past 23 years. In the last five years,property prices in these areas have slumped, inmy opinion due to the fact that a large amount ofcrime and vandalism has been rife within theseareas. If the properties are empty, then they willbe vandalised within hours of the formeroccupants leaving the property. Anything of valuesuch as combination boilers and pipework, fires,kitchen units and bathroom units are immediatelystripped from the properties and sold.
People will no longer tolerate living in the innercity areas and there has been a massivebreakdown in the communities due to the factthat properties are broken into on a regular basis,owners threatened and I know of casespersonally where owner occupiers have movedout and given their properties up for possessionbecause they have been threatened by localgangs of thugs.
The estate agent gave some current examplesof the changes in private property values in oneof our neighbourhoods (see Table 26).
Turnover and access to council housing
Turnover counts numbers leaving in a year as aproportion of occupied units at the beginning.We have turnover figures only for the localauthority stock. But, when we spoke toresidents and landlords, we understoodturnover to be a serious problem in all tenures.The figures suggest extraordinarily highturnover rates within the council stock. Bothcities far exceed the national average turnoveracross their council stock (see Table 27).
In spite of the loss of one-quarter of thenational council stock under Right to Buy,transfer of ownership to other landlords anddemolitions, social landlords continued toallocate over a quarter of a million properties ineach year from 1979 to new tenants. By 1995, theoverall volume of social lettings rose
Table 25 Right to Buy values (after discount)
Neighbourhood 1 Neighbourhood 2
Manchester £16,250 £10,170Newcastle £11,500 £14,700
Source: City Councils.
Note: National average £15,000.
Table 26 Examples of falling private property values in one neighbourhood
Previous value 1998 value
Property 1 £23,995 (1991) No valueProperty 2 £28,000 (1989/90) £5,000Property 3 £28,000 (1990) £5,000
Source: Estate agent’s information provided to private sector team, Manchester, 1998.

31
Urban abandonment
significantly, as Figure 4 shows, although thelarge increase in housing association new letsdrew some tenants out of council housing.
A significant proportion of vacancies are dueto the more elderly tenant population dying off(Burrows, 1997). Therefore, within councilhousing, increasingly youthful households havebeen rehoused at a surprisingly high rate. The
rate of turnover also reflects increasing choice,which in itself can be seen as positive, and highturnover areas have always played a role incities. But, if turnover moves above a certainlevel, it can become unmanageable. Across theneighbourhoods, the turnover rate was between20 and 50 per cent. Table 28 illustrates theproblem.
Waiting lists
Local authority waiting lists are not a reliablepredictor of demand. About 40 per cent ofapplicants disappear each year through findingother housing solutions, changing plans,circumstances and aspirations (Prescott-Clark et
al., 1994). Nor are waiting lists sensitive to therestricted options which many applicants arewilling to contemplate. Applicants have little
Table 27 Rate of reletting1 in council housing in the
two cities and nationally, 1996/97 (%)
National Manchester Newcastle
12.5 19.5 22.4
Source: HIP1 returns to the DETR, 1997.
1 These figures represent the total lettingsdivided by the total dwellings, as recordedon the HIP1 forms.
Year1979 1985 1990
No.
of l
ettin
gs to
new
tena
nts
(tho
usan
ds)
By local authorities
By housing associations
Total social lettings1
19950
50
100
150
200
250
300
350
Source: Hills in Glennerster and Hills (1998, p. 156).
1 There may be a small amount of double-counting as a result of housing associations sometimes allocating
to council tenants.
Figure 4 Volume of lettings to new tenants by social landlords, 1979–95

32
The slow death of great cities?
Table 28 Level of turnover in 16 specific estates or areas of council housing, 1996–97
Turnover % perEstate or block Neighbourhood Number of units annum (1996/97)
1 M1 366 242 M1 300 203 M1 405 404 M1 96 545 M1 293 256 M1 199 307 M2 182 288 M2 300 209 M2 225 2310 N3 470 2911 N3 540 3412 N3 398 3613 N4 196 5114 N4 115 4715 N4 87 4616 N4 127 54
Source: Manchester and Newcastle housing departments, 1997.
Table 29 Numbers on the waiting list for Manchester and Newcastle, 1992–1997
1992 1993 1994 1995 1996 1997
Manchester 17,3953 12,743 9,507 8,564 6,149 5,3182
% of stock1 24 18 14 13 9 8
Newcastle 5,531 5,694 5,393 5,203 4,812 4,5082
% of stock1 13 14 13.5 13 12 12
Sources: Newcastle City Council Housing Annual Reports 1992–97; Manchester Committee Report,30 May 1996; and Manchester Housing Department, 1998.
1 Stock figures from DETR.2 Estimated numbers leaving council stock each year: Manchester, 11,500; Newcastle, 3,800.3 According to Manchester, this figure may include transfers. All others do not.

33
Urban abandonment
Table 31 Demand for properties in the Manchester neighbourhoods – % of properties by waiting time
(based on expected turnover and actual numbers on the waiting list)
Houses Low rise flatsWaiting time in months Waiting time in months
Less than 1 2–9 Over 9 Less than 1 2–9 Over 9
M11996 53 46 2 88 5 71997 54 44 2 86 8 6M21996 31 38 30 52 15 341997 39 29 32 61 17 22
Source: Manchester City Council Housing Department.
idea what they will be offered or when, thoughthey can often state a broad area preference. Thesystem is usually highly impersonal with littledirect or proactive choice. Rehousing isgenerally based on some criterion of need.Therefore, only needy people generally apply.Refusal of offers is the main mechanism of‘choice’. Also many waiting lists, particularlyfor large urban authorities, are not up-to-datebecause of the scale of the council stock and thevolume of turnover. Nonetheless, they do givesome idea of general demand.
Newcastle’s waiting list fell by 1,023 from1992, while Manchester’s fell by 12,000. Table 29shows the exact figures.
The steep decline in Manchester’s list since1992 is mainly because of the council
undertaking a major ‘clean-up’ of the list toensure that those people registered do actuallywant housing. Manchester’s exclusion policy forineligible applicants accounts for only a smallpart of the overall reduction (Manchester CityCouncil, 1998f).
In Newcastle, the steep decline occurredearlier: there was a significant drop between1986 and 1987 explained by increased efficiencyin monitoring the waiting list at this time. Sincethen, numbers have generally continued to fall,though more gradually. Table 30 shows this.
The waiting time to be rehoused haddropped in both cities. Table 31 based onManchester’s figures shows that a majority inthe least popular neighbourhood are rehousedwithin a month of applying. In the less decayedneighbourhood, the wait is on average sixmonths for a house, less for a flat. There are alsopopular areas in the cities with longer waitingtimes.
In both Newcastle neighbourhoods, we weretold there was virtually no waiting list orwaiting time for rehousing. Both cities havenow opened their allocations and areadvertising nationally.
Table 30 Numbers on the waiting list for
Newcastle, 1986–91
1986 1987 1988 1989 1991
Newcastle 12,500 7,542 5,721 5,209 5,372
Source: Newcastle City Council HousingAnnual Reports, 1986–91

34
The slow death of great cities?

35
Urban abandonment
Housing associations
While council housing is dominant in the citiesand neighbourhoods, housing associations havebecome increasingly important. They enteredthe scene in the 1970s, renovating older terracedproperty. In the 1980s, they became the favouredregeneration partners and implementers ofgovernment policy. Local authorities,government offices for the regions andpoliticians, afraid of losing ‘their share of thecake’, argued for the need to diversify tenure;create newer, higher quality housing; andcapitalise on government support.
Because it was cheaper to develop in theNorth and jobs were short, many argued thatthe North should continue to receive its share ofcapital allocations for housing. The result is thatsome very attractive, small-scale, high qualitydevelopments tucked into the four areas areexperiencing extreme low demand, either‘poaching’ tenants from older but oftenrenovated council housing or simply findingproperties unlettable.
Housing associations have also activelybought up street properties from retreatingowner occupiers as prices fell. But the commonproblem facing both kinds of social landlords isplummeting demand.
Some argue that attractive, new, small-scaledevelopments enhance the prospects ofregeneration and help to keep people in the areawho otherwise might have moved away. Thealternative view is that, unless job opportunitiesexpand, such strategies are bound to fail.
Some residents actively campaigned againsthousing association development, whilst, inother parts, residents supported or eveninitiated development. But housing associationsare now demolishing unlettable, unsellableproperty. Unless regeneration takes off, much ofthe costly building of the last ten years will bewasted.
Private landlords
Private renting began to make a comeback inthe wake of deregulation and the collapse in the
Housing association sheltered
scheme completed c. 1990 –
likely to be demolished

36
The slow death of great cities?
owner occupier market in the late 1980s(Malpass and Means, 1993).
Low income owners, unable to sell at a levelthat would redeem their mortgage, sometimesbecame landlords of last resort, using thehousing benefit system. The same housingbenefit incentive, until recently paying 100 percent of the full rent for low income tenants, hasattracted speculative private landlords too.There were rumours of various ‘scams’. Butprivate landlords are seriously affected byabandonment.
Table 32 shows the level of empty propertyexperienced by housing associations and privatelandlords in small areas within theneighbourhoods.
Rented housing in all sectors wasexperiencing a serious collapse in demand:
• structurally sound, attractive, improvedproperties proved unlettable
• weak social controls and high levels ofvandalism led to empty properties oftenbeing destroyed
• social landlords were operating in directcompetition with each other
• landlords and tenants used the ‘100%benefit system’ to facilitate the movementof a diminishing number of tenantsaround surplus stock
• private landlords speculated arounddemolition decisions, buying up propertyfor little in the hope of high rent fromtemporary lettings, before CompulsoryPurchase Orders
• private landlords were often willing torehouse evicted tenants as long as therent was guaranteed
• local authorities and police werestruggling to enforce basic standards andreduce crime
• long-standing residents, often in smallenclaves, were fighting to hold conditionsas properties in the streets aroundemptied.
Table 32 Level of empty property at 1997 in small areas within the neighbourhoods
Units in area Number of units empty % empty
Housing associationsHA1 183 99 54HA2 16 9 56HA3 282 144 51
Private landlordsArea 1 329 138 42Area 2 137 26 19Area 3 447 134 30Area 4 1,905 362 19Area 5 24 12 50Area 6 93 37 40Area 7 120 24 20
Source: Interviews with housing associations and local authority statistics.

37
Urban abandonment
Schools
A shrinking population, high populationturnover and high levels of deprivation allimpact on schools. In turn, school performanceaffects neighbourhood prospects. Tables 33 and34 show changes in school rolls, spare placesand pupil turnover in the local primary andsecondary schools serving one of ourneighbourhoods. They also show performancecompared with the national average.
The state primary and secondary schoolshave all suffered from falling rolls and surplusplaces. This reduction matches the falling wardpopulation and falling numbers of childrenunder 16. The proportion of free school meals, aclear measure of poverty, is extraordinarilyhigh; in two schools it is four times the nationalaverage. More than double the nationalproportion of children in the state primaries hadspecial educational needs. Educationalattainment was generally far below the nationalaverage, though one primary school scoredabove the national average in science. The gapby GCSE had widened even further. Theoutcome measures are crude and make noallowance for the educational difficultiesteachers face. Nonetheless, children’s lifechances are constricted by such low educationalattainment.
The performance of the Catholic primaryand secondary schools is in sharp contrast.While there are falling numbers of Catholicprimary pupils, the school recruits from furtherafield and makes up numbers with non-Catholicapplicants. Figure 5 shows the contrasting trendin school rolls. The Catholic schools have farfewer free school meals and less children withspecial educational needs. Even allowing for
this, they perform better than expected at GCSEand in English at primary level – above thenational average. The ‘value added’ issignificant. This is a pattern repeated in Catholicschools in poor areas throughout the countryand is worthy of closer study (CatholicEducation Service, 1997). It relates to the ethos,pastoral role, approach to discipline, parentalsupport and teaching methods. As yet,educational research has not fully explained thedifference.
Demolition of housing immediatelysurrounding two of the primaries as part of aregeneration programme destabilised thepopulation, including the schools. Theregeneration programme within theneighbourhood was removing housing,reducing the number of pupils and spending asubstantial amount on school buildings andeducation projects in the area. Thiscontradiction upset teachers as they battledagainst near impossible odds to save theirschools.
Pupil turnover and falling rolls reinforceeach other, creating funding problems and lossof morale among staff. Schools can becomesocially unviable unless extraordinary measuresare introduced. Figure 6 shows this.
The poor academic performance of schoolsin poor neighbourhoods does have a strongdeterrent effect on potential residents. It alsoleads to families with high aspirations movingaway (Rudlin, 1998; Urban Task Force, 1999b).
The local authority is developing a newapproach to schools with falling rolls in thisarea. The goal is to retain families with strongloyalty to the school, get parents involved,provide a base for adult education and usesurplus space for other council services.

38
The slow death of great cities?Ta
ble
33
Su
mm
ary
of
pri
ma
ry s
cho
ol
cha
ract
eri
stic
s
% s
urp
lus
%
pu
pil
s w
ith
SE
N3
%
of
elig
ible
pu
pil
s ac
hie
vin
g%
ch
ange
p
lace
s%
pu
pil
(
1997
)
Lev
el 4
or
abov
e in
Key
Sta
ge 2
Sch
ool
in
rol
l (J
anu
ary
turn
over
%FS
M2
W
ith
te
sts
(199
7)n
ame1
Sch
ool t
ype
(198
2–97
)
199
8)(1
994/
95)
(19
97)
Tota
l SE
Nst
atem
ents
4E
ngl
ish
Mat
hs
Sci
ence
Fiel
dw
ayC
ount
y–3
734
4490
761
4548
69B
eech
Tre
eC
ount
y–2
638
1945
464
5634
51G
rove
Cou
nty
–29
3529
8254
122
1922
All
Sain
tsV
olun
tary
+30
00
3118
170
5353
aid
ed(C
atho
lic)
LE
A–
––
––
––
5150
.960
.2av
erag
eN
atio
nal
––
––
22.9
18.5
1.4
62.5
61.3
68.1
aver
age
Sour
ce: L
EA
and
Ofs
ted
. (W
here
ther
e w
as a
dis
crep
ancy
bet
wee
n th
e tw
o so
urce
s, th
e fi
gure
clo
sest
to th
e in
form
atio
n fr
om th
ehe
ads’
inte
rvie
ws
was
use
d.)
1A
ll sc
hool
nam
es a
re
inve
nted
.2
FSM
= p
upils
in rec
eipt
of f
ree
scho
ol m
eals
.3
SEN
= p
upils
wit
h sp
ecia
l ed
ucat
ion
need
s (e
xpr
esse
d a
s a
perc
enta
ge o
f the
Sep
tem
ber
roll)
.4
Stat
emen
t = p
upils
wit
h st
atem
ents
of s
peci
al e
duc
atio
n ne
eds
(exp
res
sed
as
a pe
rcen
tage
of t
he S
epte
mbe
r ro
ll).

39
Urban abandonmentTa
ble
34
Su
mm
ary
of
seco
nd
ary
sch
oo
l ch
ara
cte
rist
ics
% s
urp
lus
% p
up
ils
wit
h S
EN
3
% c
han
ge
pla
ces
% p
up
il
(19
97)
GC
SE
per
form
ance
(199
7)S
choo
l
in r
oll
(Jan
uar
ytu
rnov
er%
FSM
2
Wit
h%
ach
ievi
ng
% a
chie
vin
gn
ame1
Sch
ool t
ype
(198
2–97
)
199
8)(1
997/
98)
(19
97)
Tota
l SE
Nst
atem
ents
4
5
A–C
5 A
–G
Tha
mes
way
Cou
nty
–62
185
~10
56.4
211.
68
50O
ctav
iaV
olun
tary
+4
4~
020
.610
0.4
5492
aid
ed(C
atho
lic)
Aug
ustu
sV
olun
tary
+2
5–
19.5
6.6
0.9
5291
aid
ed(C
atho
lic)
LE
A–
––
––
––
3275
aver
age
Nat
iona
l–
––
–18
.216
.62.
343
.388
.5av
erag
e
Sour
ce: L
EA
and
Ofs
ted
. (W
here
ther
e w
as a
dis
crep
ancy
bet
wee
n th
e tw
o so
urce
s, th
e fi
gure
clo
sest
to th
e in
form
atio
n fr
om th
ehe
ads’
inte
rvie
ws
was
use
d.)
1A
ll sc
hool
nam
es a
re
inve
nted
.2
FSM
= p
upils
in rec
eipt
of f
ree
scho
ol m
eals
.3
SEN
= p
upils
wit
h sp
ecia
l ed
ucat
ion
need
s (e
xpr
esse
d a
s a
perc
enta
ge o
f the
Sep
tem
ber
roll)
.4
Stat
emen
t = p
upils
wit
h st
atem
ents
of s
peci
al e
duc
atio
n ne
eds
(exp
res
sed
as
a pe
rcen
tage
of t
he S
epte
mbe
r ro
ll).
5T
he d
iscrep
ancy
bet
wee
n th
e fa
lling
rol
l and
pro
port
ion
of s
urpl
us p
lace
s is
acc
ount
ed fo
r by
a s
erie
s of
sch
ool m
erge
rs.

40
The slow death of great cities?
0
500
1,000
1,500
2,000
2,500
3,000
3,500
4,000
82 83 84 85 86 87 88 89 90 91 92 93 94 95 96 97Year
Num
ber
of p
upils
on
roll
ThameswayOctaviaAugustus
Population loss
Fewer pupils
Places available
Lower entrance requirements
Lower reputation
Higher admissions of special needs
More integration problems forchildren with special difficulties
More teaching difficulty
Further exodus of pupils
Reduced per capita funding
Fixed overheads
Less funding for teaching
Redundancies and natural wastage
Imbalance in expertise
Lower teacher morale
More pressure
Negative impact on performance
Figure 6 Knock-on effects on school performance
Figure 5 Numbers on the roll of each of the secondary schools, 1982–97
Overall, we found both negative andpositive elements in city neighbourhoods.
Table 35 summarises both.
More integration problems forchildren with difficulties

41
Urban abandonmentTa
ble
35
Fa
cto
rs i
nfl
ue
nci
ng
cit
y n
eig
hb
ou
r ho
od
s –
ba
sed
on
th
e M
an
che
ste
r a
nd
Ne
wca
stle
ca
se s
tud
ies
Mul
tipl
e in
ner
city
dec
aySe
nse
of e
mpt
ines
sB
urnt
out
pro
pert
yA
band
oned
faci
litie
s, b
oard
ed u
p pr
oper
ties
Dem
olit
ion
site
s, b
ack
alle
ys, u
gly
high
fenc
es
No
over
arch
ing
plan
– o
r pe
rson
wit
h po
wer
ove
r al
l ser
vice
sPo
or s
choo
l per
form
ance
Unc
erta
in c
omm
itm
ent o
f som
e se
rvic
es to
are
aD
epar
tmen
talis
m, c
entr
alis
m, i
n-fi
ghti
ngL
ack
of c
onfi
den
ce in
futu
reU
phill
bat
tle
Man
y, fr
eque
nt s
etba
cks
Fear
, ins
ecur
ity
Los
s of
con
fid
ence
Bla
me
atta
ched
to y
outh
, new
com
ers,
cri
min
als
Som
e ve
ry d
iffi
cult
per
sona
litie
sSo
me
dan
gero
us b
ehav
iour
and
inti
mid
atio
nSt
rong
cri
tici
sm o
f pol
ice
and
hou
sing
ser
vice
sG
row
ing
aban
don
men
t
Con
tinu
ing
popu
lati
on a
nd jo
b lo
ssG
ener
al a
nti-
city
bia
sC
onst
ant p
ress
ures
aga
inst
the
poor
est i
nner
cit
y ne
ighb
ourh
ood
sR
egen
erat
ion
spen
din
g to
o fo
cuse
d o
n ph
ysic
al r
enew
alTo
o lit
tle
emph
asis
on
chan
ges
in jo
b si
tuat
ion
Poor
soc
ial a
nd e
cono
mic
con
nect
ions
Lar
ge-s
cale
une
mpl
oym
ent a
mon
g m
enH
igh
risk
/pr
ejud
ice
agai
nst i
nner
are
as
Nea
r ci
ty c
entr
eSp
ace
– gr
een
area
sG
ood
hou
sing
, som
e ve
ry g
ood
Spen
din
g on
impr
ovem
ents
Obv
ious
eff
ort t
o sa
ve a
rea
Som
e at
tem
pts
at c
o-or
din
atio
nSc
hool
s –
huge
eff
ort
Ver
y lo
calis
ed h
ousi
ng s
ervi
ceD
edic
ated
loca
l sta
ffPo
lice
– st
rong
liai
son
and
ant
i-cr
ime
mea
sure
sSp
ecia
l ini
tiat
ives
Som
e im
pact
Man
y st
able
res
iden
tsTr
aini
ng a
nd s
kill
build
ing
Surp
risi
ng c
omm
itm
ent t
o sa
ving
poc
kets
Stro
ng a
ttac
hmen
ts a
nd n
etw
orks
Ene
rgy
to k
eep
tryi
ngL
ead
ing
acti
vist
sR
esis
tanc
e to
dem
olit
ion
Stro
ng c
ivic
am
biti
on, c
ity
prid
e, lo
yalt
yPr
esti
ge d
evel
opm
ents
, str
uggl
e fo
r re
sour
ces
Rev
ivin
g ci
ty c
entr
e –
clos
e by
Eff
orts
at t
rain
ing
and
ski
ll bu
ildin
gSo
me
new
opp
ortu
niti
esE
asy
tran
spor
t lin
ksJo
b ex
pans
ion
for
wom
en a
nd s
ervi
ces
Figh
t for
inw
ard
inve
stm
ent
Con
dit
ions
Serv
ices
Com
mun
ity
Wid
er is
sues
Neg
ativ
e el
emen
tsP
osit
ive
elem
ents


Part III
The story of four neighbourhoods

This section attempts to convey the live experience of acute decline and the intense efforts to hold onto and rescue inner city neighbourhoods. The story of each area, using the words of local residentsand workers, emphasises the gravity of the situation and brings out the potential for rebirth.

45
About the area
Bankside is approximately two miles from thecity centre, on the riverside. In the past, it wasthe scene of much industrial activity. However,riverside industries suffered long-term declineand, during the 1970s and 1980s, the remainingindustrial base was relocated, encouraged bysubsidy. A business park opened nearby in1990/91 with government incentives. It includes67 firms, employing 4,800 people. However, thejobs are mostly in the service sector and fewerthan 100 local people are employed there. Theskills gap is a major obstacle.
Bankside has been losing population over along period. Demolition has been ongoing since1992. The landscape is thus constantly changing:
There is no greater portrayal of the transience ofan area than demolition. (Social worker)
Bankside’s housing is attractive –comprising modernised 1930s’ houses withfront and rear gardens, and some pre-1919terraced houses and flats (mostly refurbished byhousing associations and private landlords).
How/when it hit trouble
Bankside’s current problems have their roots inthe industrial restructuring of earlier decades,and the area has long had a reputation for highlevels of poverty and serious crime.
By the 1980s, low demand was visible:
Social services have usually been able to getpeople housed in Bankside – there has alwaysbeen property available. (Social worker)
The steep increase in empty propertieshappened between 1989, when there were 40–50
empties, and 1991 when the total had risen toaround 350. This coincided with an increase inthe amount of crime committed by young menagainst their own community – burglary, joy-riding and stripping empty houses.
People in work can buy cheaply elsewhere.Those on housing benefit have rented housingto choose from because of surplus housing inthe area:
There are bribes to people, almost, to move –furniture packages, redecoration allowances, anewly refurbished property. Although we‘regenerators’ think that we’re doing this toregenerate the property and make it moreattractive, in fact, to some extent, it is just fuellinga revolving door. (Regeneration manager).
Press coverage has added to Bankside’snegative image. Pictures of boarded up homesand young children vandalising properties carryheadlines such as ‘Little Beirut’.
One new-build housing associationdevelopment is empty, some of the houses neverhaving been let since they were built. Part of it isnow due to be demolished. Another housingassociation owns 44 refurbished, pepper-pottedstreet properties. Nineteen were empty at May1998. High quality council houses have nodemand:
The allocations policy is basically: ‘Do you want ahouse?’ (Senior council officer)
Not all parts of Bankside have been hitequally severely. There are pockets of stabilitywhich are a different world from the half-emptystreets just minutes away. Even within theemptying streets, committed long-standingresidents surrounded by boarded up homes,continue to attempt to create their own stability,
7 Bankside

46
The slow death of great cities?
with courage, tenacity, solidarity and pride.Extended family networks on particular
estates can be the main factor in their stability:
I love it – I feel very settled here. In LowerBankside, everyone is part of an extended family,and that’s the only reason we stay there.(Resident)
Equally, these networks can mean that, onceone household decides to go, several move outat once because of their family ties and theirdesire to move together.
Bankside is fragile, and vulnerable to rapidchange. Often, residents and communityworkers identify one factor as the immediatetrigger:
The council allocated a property to a vulnerableman who attracted a lot of other young men tocongregate there. The neighbours on each sideleft, and, over six months, the street steadilyemptied. Now, one side of the road is going to bedemolished. (Tenant support worker)
Since the fieldwork was completed, the otherside of this road is now also being demolished.
Inputs/impacts
Bankside’s problems have long been recognisedby central and local government. Localpoliticians and residents’ groups havesuccessfully fought for resources. The UrbanProgramme of the late 1970s, and more recentregeneration efforts such as Safer Cities, EstateAction and City Challenge, have injected manymillions of pounds into the area. These projectshave slowed the decay. But impacts often lastedonly as long as the programmes:
Five-year projects are no use at all. An area likethis needs help in a sustained way. The peoplehere want to help themselves, but they need helpto do it. (Primary school head)
Residents
Fed up with the stigma, the desolation of livingin a half-empty street, the harassment andvandalism, and tempted by housing on offerelsewhere, many residents have left:
A relatively minor incident can prompt people totake flight. (Local researcher)
A primary school head started to keep arecord of the reasons for people moving butstopped doing this when she discovered thatmost left because of harassment of some kind;serious, targeted harassment resulting fromsomeone informing to the police, or moregeneral threatening behaviour.
A survey of residents in one emptying streetrevealed that 50 per cent of the residents foundit ‘terrible/frightening’ to live in a street with somany empty properties, causing worry anddepression. The main factors causing people toleave were crime and fear of crime, intimidationby gangs of young people, harassment and anti-social behaviour by other tenants (CommunityGroup report, 1996):
Putting on a porch and landscaping the gardendoesn’t really do anything – it’s all very cosmetic.People will drive through the area now and think‘oh, it’s not that bad, these houses look reallynice’. But it’s to do with people. Somehow we’vegot to get hold of these families that are bullyingthe neighbourhood and shift them …somewhere. (Primary school head)

47
Bankside
Other residents are happy to live in the onlyplace that they have ever known as home,amongst their family and friends:
Where would I go anyway? I’m staying where I’mused to. (Resident)
Some residents have continued to fight in anorganised way to achieve the improvementsthat they want. An estate housing managementcommittee was formed in 1995 and extendedlast year to cover the whole neighbourhood. Thecommittee meets regularly with the localcouncil housing manager, monitors the housingservice and has an input into policy. Thetenants’ groups are also supporting newcomersto Bankside. Security is their number onepriority. Under the combined efforts of residentsand local housing staff, many new approacheshave been tried:
• show houses
• estate walkabouts
• patch reports by estate officers
• local display boards showing propertyavailable for letting
• a drop-in session for new tenants withlocal staff
• dedicated estate labourers
• rapid-response void clear-out
• tenants’ reporting channels.
In spite of these efforts, failures still arise.
Housing management
The council has a full-time local housing officein Bankside. Staff are attempting to develop
closer working with residents and are‘extremely committed to this difficult area’.Constructive work with the police is ongoing:
We are turning streets around by getting rid ofproblematic families, achieving a good standard ofrepairs, tidying up the voids, and concentratingour efforts. (Council officer)
However, it remains very hard to attractpeople into Bankside:
People don’t want to come to Bankside becausethey think it’s rough. (Council officer)
Schools
Three of the four primaries in the area havesuffered from falling rolls since 1988. Theirpupil populations are extremely deprived.
Families often show attachment to theschools, moving away but continuing to sendtheir children to the school until the journeyinvolved becomes too much to manage.
The main secondary school serving the areafailed its Ofsted inspection in 1995/96. Thisexacerbated its falling roll and added to thenegative reputation of the area. Although theschool came out of special measures inDecember 1997 and the roll has now stabilised,the deprivation of the pupil population has anenormous impact:
We have all sorts of social problems to deal with:children who are malnourished, who are abused,who can see no value in education becausethey’re the fourth generation of unemployedpeople, and they live on an estate with high levelsof crime, fluid movement of population, poverty… (Secondary school head)

48
The slow death of great cities?
Police
The relationship between the police and thecommunity has improved in recent years:
In the late 1980s, the police had a very negativeview of Bankside and its residents – they referredto it as ‘the swamp’. The police response hasdefinitely improved since then, and police carscan now be seen in the area every day.(Community development worker)
A range of policing initiatives has beenimplemented, including a witness supportscheme, joint working with housing, schoolsand residents, and an arson task force (runjointly with the fire brigade).
Unreported crime is a cause for concern,though:
Witness intimidation and fear of reprisals is amajor issue. (Senior police officer)
There are a small number of keytroublemakers:
There are 20 main persistent juvenile offenders inthe area command. If we got rid of them, wecould dramatically reduce crime. (Police officer)
Current options
Thirty-seven per cent of the council’s 1991 stockhas been demolished but this has not got rid ofthe empty properties. If demolition continues tobe the main response to streets that areemptying, then Bankside will be incrementallyrazed to the ground.
As long as people view Bankside as animpoverished, crime-ridden area, and as long asthey can gain access to attractive housingelsewhere, its downward spiral will continue.So far, the entrenched negative image, localmedia attention and general low demand haveoverpowered attempts to market the area.
The wider social and economic problemsneed to be given serious attention:
If as much investment as went intoimprovements to the housing stock and housingmanagement service had gone into local training,advice and resources to help people into decentpaid jobs, it is possible that the decline wouldhave been halted by now.(Community development worker)
Bankside has huge potential. Its housing isnot only adequate, it is excellent. Proximity tothe city centre and to major road networks is inits favour. Just a few miles away are thrivingareas. Security and reputation– neighbourhoodquality as well as housing quality – are clearlycrucial:
The city has plans to extend onto the greenbeltbecause people do like to move out. But we havea site here that if it were ten miles further alongthe river would be worth millions. It’s southfacing, it’s sunny, and the views are stunning.There’s no capital being made of the location.(Primary school head)
However, there is talk at city level ofdevelopers being drawn by the regenerationpotential of this neighbourhood.

49
About the area
The rows of late nineteenth-century terracesbuilt in City-Edge for people working in nearbyindustries were largely cleared during the 1960sand 1970s. Council houses, maisonettes anddeck access flats replaced them. Some pockets ofbetter quality terraced housing escapedclearance. Eleven of these streets, in a grid-ironpattern, make up Lower City-Edge, which wasrejuvenated temporarily when it was declared aHousing Action Area in the 1970s. The deckaccess flats were notorious from the day theywere built, and survived for only 15 yearsbefore being demolished and replaced by newcouncil houses in the 1990s. Private companieshave also built homes within the last nine yearsand housing associations were completing newhouses as recently as 1995. Even so, thereremain large patches of open, grassed-overdemolition sites.
Parts of City-Edge are nearly 50 per centempty. Some homes are physically inadequate –with structural problems or unpopular designfeatures. However, there are traditionallydesigned, modern, well built houses, with frontand back gardens, for which there is zerodemand. Much of the owner occupied housinghas either transferred to the private rentedsector or been abandoned completely. Thecouncil has estimated that two-thirds of housesin a private development of 80 homes are nowrented rather than owner occupied. Fifty-eightof the 138 privately owned homes in LowerCity-Edge were empty at October 1998.
City-Edge has always been a poor area, butpeople used to have a reason for living there –they had work nearby. By the late 1980s,however, most of the traditional engineering,textiles and steel jobs had been lost:
8 City-Edge
You can keep on patching up the housing, but,unless you actually have a reason for peoplewanting to be there, then you’ve lost it.(Local councillor)
It’s been a transit zone for a long time – with allthe clearance, refurbishment and new building.Some people have moved from one bit ofhousing to the next.(Community development worker)
How/when it hit trouble
In the second half of the 1980s, peoplerecognised the loss of demand:
We had a very stable community on our estateuntil 1986, when the local Tenants’ Associationsucceeded in getting the properties modernised.All 53 residents were decanted in order for theworks to take place, but only five householdschose to move back in afterwards. There was nogeneral hatred of the properties, it was just thattheir circumstances had changed. We had thesenew, modernised properties but people didn’twant to move into them. (Local councillor)
In other parts of City-Edge, acute lowdemand has appeared within the last six years.The immediate causes were crime, vandalismand serious anti-social behaviour:
Everyone leaves this area for the same reason:they fear for their safety.(Housing association officer)
I want to move now. Although I’ve never beenmithered by the gangs and I’ve never beenrobbed, I’m frightened. (Resident)

50
The slow death of great cities?
In the absence of demand, landlords felt thatthey had no option but to let to whoeverapplied. A concentration of large families withproblems in one estate was responsible for yearsof serious anti-social behaviour, which in theend caused even the most determined of long-standing residents to leave. The councilfollowed eviction procedures but these werelengthy – it took two years to secure the evictionof the most troublesome family and, althoughthey now live in another part of the city, theystill harass those who gave evidence againstthem. An injunction was obtained; the father ofthis family recently served a 28-day prisonsentence for ten breaches of it.
Blocks of one-bed flats in the area hadtraditionally been let to the elderly. As elderlytenants died (and in the absence of elderlyapplicants) the council let the flats to youngsingle people. The combination of young andold in an unsupervised, insecure environmentdid not work. The young tenants appeared outof control and the elderly were terrified.
People say if you put a rotten apple in the middle,it changes and becomes good. But that doesn’twork. It just clears the building. And it happensvery rapidly. When I was new in the job, I moveda young man into a block of six flats that had astable, elderly community who’d lived there foryears. Within five to six weeks, five of the flatswere empty. He was abusive. He tried to robthem. He had all his mates there too.(Council housing officer)
The housing associations continued to build,but often let their new accommodation topeople who were already resident in the area.As one council housing officer commented:
Forty-four housing association properties werecompleted nearby in 1995. I must have hadbetween 20 and 25 tenants, out of my patch ofabout 300, move into those properties.
Impacts/inputs
Residents
Abandonment problems aren’t uniformthroughout City-Edge. On at least three of thesix council estates, there remains a stable core ofresidents who have lived in their houses sincethe day they were built. These estates havestrong and well established tenants’ associationsor Homewatch schemes – formed in the mid-1990s in response to a deteriorating livingenvironment and community disintegration. Ontwo estates, there is not a single empty house.
Some residents have had enough. They’vetried to change things but the violence that theyhave faced, and their frustration at the delay inpublic intervention, has finally prompted themto try to move away:
If I thought, for one minute, I could make adifference, I would stay. (Resident)
People have seen their life’s investmentbecome virtually worthless:
One bloke has lived there for 50 years. He raisedhis kids in the property and it was a struggle forhim to pay off the mortgage. So he comes toretire, with this property behind him. He’s paid offthe mortgage – but it isn’t worth a carrot to him.And such a proud person who felt that when hepassed away he could pass that house to his kids.Well, his kids don’t want it. (Local councillor)

51
City-Edge
Relationships on the ground can be vital tomaintaining the confidence of residents. Newapproaches can help:
The improvement in allocations management bythe council means that existing tenants havemore confidence. They are no longer ‘panic-stricken’ about who will move in next doorbecause they know that it will be someonedecent. Before, people were so terrified aboutwho would move in, that they would be lookingto move away just in case. (Resident)
The system of the TA [Tenants’ Association]recommending people worked well on our estate.Through this practice, we increased the stabilityof the estate and the sense of community. Thereare four generations of one family living on theestate and three generations of another. We wantto encourage this. That’s what builds up thecommunity we want. (Resident)
Housing service
The high level of empty homes obviouslyreduces the housing department’s income. Thehigh turnover and need to secure emptyproperties increases costs. There are intangiblecosts, such as the effect on staff morale. Housingofficers are faced daily with the misery ofpeople being harassed and intimidated.Pressure to fill empties conflicts with the direconsequences of an insensitive letting:
As soon as people moved on to this estate theywere being robbed of everything they’d got. Youfeel responsible – I put them there and thishappened to them. It just completely blows yourmind. (Housing officer)
The housing service is up-front about its
failures, some of which frustrate residentsterribly:
We’ve been terrible in our management of thearea. What’s needed is all the basics – local patchofficers getting out and about, spotting thingsearly, being proactive. But it’s easier said thandone in an area like this. It all becomes too muchfor people and they get overwhelmed by it.(Council officer)
Housing staff should visit the people in thehouses more – and see what’s going on. Theyonly see you if there’s a problem. They shouldjust pop round and sort things out early on.(Resident)
Even the most dedicated and proactivehousing team cannot deliver a quality service onits own. The housing department set up aneighbourhood strategies working party inSeptember 1997, involving social services, thepolice, community groups, schools and others.This group has worked together on childsupervision:
Children from target families feel that theirbehaviour is being closely monitored by variousagencies … children were complaining of beingwatched from all sides at school, at home andwhen they were playing in the local area. (Council report, 1998)
Departments have traditionally worked inisolation and some services, by their verynature, come with different perspectives. The‘area overview’ role of housing and the‘individual advocacy’ role of social services canconflict when, for example, the eviction offamilies with problems is considered. Without

52
The slow death of great cities?
special follow-through, an eviction to solve ahousing problem can create a costly socialcasualty. The new approach is requiring a greatdeal of effort to implement in practice, bothbetween and within departments.
Schools
School numbers have fallen and some schoolsfear closure. High turnover also affects them.For example, in just a few months, one of theprimary schools lost 22 children but gained 18others.
The crime in the area can also affect schoolbuildings and grounds. In May 1998, one of theprimaries had 16 burnt out cars on its premiseswithin just three days (Council report, 1998).
Police
The police service is perceived very differentlyin different parts of City-Edge. Members of oneof the Homewatch schemes spoke highly of thelocal community police officer and of the closeworking relationship that had been established.Police and housing have also worked togethereffectively, although both see gaps. But, incertain parts of the area, police officers are notvisible on the ground:
I’m not anti-police, but the police manpower forthese areas is just a joke. (Estate agent)
Some residents feel let down by the police:
One night there were about 60 people gatheredon the corner of our street with ghetto blasters. Irang the police at 2.00 a.m., and they said to me‘What do you want us to do about it?’ (Resident)
Shopping
The shopping centre has declined steadily overthe past ten years:
You can almost test the temperature of thecommunity by how many shops there are, howmany disappear, what sorts of goods are beingsold. We’ve seen a gradual run-down of theshopping centre. The bank moved out in 1989/90.There is still a post office, but it’s not thriving.There are at least half a dozen derelict shops,whereas, in the early 1970s, they were all open.(Senior manager, social services)
Current options
A neighbourhood renewal assessment advisedclearance of Lower City-Edge. The statutoryprocess is not yet complete and there have beenobjections, but many owner occupiers arepleased, especially given the degree ofdilapidation that now exists:
Clearance is the only way forward. I just want toget out quick. (Resident)
Residents breathed a huge sigh of relief whenthey heard that the result of the neighbourhoodrenewal assessment was to recommendclearance. (Council officer)
The main housing association in Lower City-Edge has decided that there is no alternative butto demolish homes completed only eight yearsago, but surrounded by empty terraced houses.Already selective demolition of one-bed flatshas helped appearances. Demolition of some ofthe houses has proved less successful. Thehouses adjoining one demolition site are nowboarded up. The problem of too few people andtoo many houses remains, with the associateduncertainty, lettings dilemmas and extremepolarisation that are so damaging to City-Edge,

53
City-Edge
already at the bottom of the city’s housingmarket.
A large leisure development is being built onthe edge of the area, and this may bring jobs, anextension of the metro and new life for theneighbourhood. The city is proposing City-Edgefor a major regeneration initiative. Greatexpectations surround the new approach. Thisinitiative signals light at the end of the tunnel.Investment will need to be linked to sustainedbasic inputs – cleaning, repairs, tenantinvolvement, support for new tenants, carefullettings and co-ordination across services.

54
About the area
Riverview lies less than two miles from the citycentre; 30 minutes’ walk along the river. Thisarea has a long history of industrial activity,including coal mining, iron and chemical works,shipbuilding and related engineering industries.During the 1980s, key employers scaled downtheir workforces and eventually closedaltogether. With the support of the localauthority and the Urban DevelopmentCorporation, a technology park was created.However:
The few jobs that are around now are not suitablefor the unskilled workers from Riverview.(Regeneration manager)
Council housing dominates the area. Inter-war estates of two- and three-bed terraced andsemi-detached houses with front and reargardens were modernised from the 1970s,providing attractive, good quality houses. Post-war developments included houses,maisonettes, multi-storey and ‘scissor blocks’.Some were demolished recently because of theirunpopular design and low demand.
Why did they insist on building maisonette flats?– families on families. (Resident)
Housing associations own a small amount ofrefurbished and new-build property.
How/when it hit trouble
Riverview is divided into several distinct parts.Lower Riverview has always been stigmatised,because of its location near the now defunctheavy industry:
9 Riverview
When I was young, Lower Riverview was the‘lowest of the low’. I only went down there forChapel and Sunday School. There was nothingelse to go down for. It was a bad place. (Resident)
However, people used to have a reason forliving in Riverview; they had employmentnearby:
The relationship between houses, the communityand employment in the area was extremelyimportant. People would walk or cycle to workand the community was able to see what theywere building – it created an enormous sense ofpride. (Regeneration manager)
Once these links to local employment nolonger existed, the community began tofragment:
There has been an increasing number of singleparents, short-lived relationships and a shiftingpopulation which has a destabilising effect onestates. There are a large number of menwandering around different relationships leaving alot of unsettled and damaged people behindthem. (Senior council officer)
People became demoralised. Those who didfind employment tended to move out to becomeowner occupiers in nearby areas. The loss oflocal employment occurred at a time when itwas becoming much easier to enter owneroccupation:
It is not very expensive to enter owneroccupation: the cost per month is less than acouncil rent if you’re working. (Former resident)
The least popular housing, and those areasthat were already stigmatised, began toexperience demand problems. By January 1998,

55
Riverview
every fifth house in Lower Riverview wasempty:
People from outside won’t even come to viewthe properties here because of its reputation.(Resident)
Not enough people want to come and live inLower Riverview – it’s out of the way, at thebottom of the bank and it is overlooking an areawhere once there used to be local employmentbut is no longer. It is at the bottom of the peckingorder of local authority housing.(Regeneration manager)
Historical allocations policies that gradedpeople and areas contributed to that place in thepecking order:
A ghetto was manufactured. In the 1970s, theallocation process graded people A, B, C, D, or Z.Certain estates started getting a greaterproportion of Z-graded people. The area managerused to use it as a threat … and tell people that, ifthey didn’t pay their rent, they’d be rehoused inLower Riverview. (Council officer)
The slack in the system was furtherincreased by the development of 70 housingassociation homes in 1996:
This site became available for letting right at atime when demand was plummeting. It has had adisastrous impact on Lower Riverview.(Council officer)
However, this development was initiated bylocal residents and built on land previouslyoccupied by derelict factories which was an eye-sore. It illustrates conflicting political, financial,local and organisational interests:
The development of this estate originated frommeetings of parents at the primary school and theDevelopment Corporation encouraged it. Weknew it would create voids in the local authoritystock, but the council had no choice. Theycouldn’t have sabotaged a people-led enterpriseand couldn’t have said ‘no’ because of thepowers of the Development Corporation. In anycase, the council wanted people to think forthemselves and local members supported it.Obviously, housing officers were worried …(Local councillor)
More recently the demand problems havespread northwards, affecting the parts ofRiverview that had been regarded as morestable and less stigmatised. There are few emptyhouses, but turnover is high. Blocks of flats arecontinually being demolished.
The local authority sector has borne thebrunt of falling demand over the past ten years.However, older terraced private stock on themain road has suffered a rapid decline. ByJanuary 1998, 31 units were vacant out of a totalof 99:
Central Road went downhill very rapidly, just inthe last 18 months. There was a domino effect –people started leaving in their droves.(Community development officer)
The housing on this road had been nearly allowner occupied but, in a very short space oftime, houses and flats were transferred to theprivate rented sector. As elderly owneroccupiers died, private landlords bought uptheir houses:
There is evidence that social unrest has beenengineered by people who want to purchasehousing on Central Road at knockdown rates.

56
The slow death of great cities?
Owners are forced to sell and the new landlordsthen let to housing benefit claimants. (Senior police officer)
This has shocked local people:
Central Road used to be posh. Those were lovelyflats. It breaks your heart. I wouldn’t live in themrent-free now, but they used to be elite.(Resident)
Inputs/impacts
Residents
Riverview retains a number of tightly knitcommunities. Family networks provide a reasonfor people remaining in the area even thoughwork has gone. However, it can be off-putting to‘outsiders’:
The negative side of the sense of community thatexists is that it can be very parochial. Anyone bornmore than half a mile away is an alien. Anyonewho’s different in any way is not made to feelwelcome at all. (Council officer)
There are two tenants’ groups and a smallcore of committed activists. One groupsucceeded in saving a former social services daycentre from being demolished. With supportfrom the council, and from the SingleRegeneration Budget, it has since beenconverted into a community centre with anattached community development worker. Arange of groups and council services now usesit.
Residents were also instrumental inestablishing a community-run security project inLower Riverview, based in one of the towerblocks. It was set up in 1993 and comprisesCCTV, a 24-hour door guard, and a security
patrol. Action is co-ordinated with the housingservice and the police. The project employs localpeople:
Since the security project commenced, reportedcrime has fallen significantly. We have driven thebad people away. When the security project firststarted, there were more than 20 voids out of the85 flats in the tower. This has been reduced toseven. (Security project manager)
The local church has played an importantrole in supporting these community initiatives.
However:
The residents’ association needs to take LowerRiverview forward, but it has dwindled over thepast few years. It feels as though people don’tcare. (Resident)
As well as a stable core, there is a transientpopulation:
People move up the bank as quickly as they can –so there’s a constant change of people. (Youthofficer)
There are a small number of families whohave a disproportionately negative impact onthe area:
One notorious family was responsible for fiveyears of harassment, crime and burglaries. Theyestablished a little kingdom down there – it wascompletely wild. (Council officer)
There is a feeling that there has been a moregeneral shift in attitudes and behaviour:
The housing has got better, but the neighbourshave got worse. Before it used to be: ‘Don’ttouch that, it’s the council’. Now it’s: ‘Do wreck itbecause it’s the council’. (Resident)

57
Riverview
The serious unemployment which exists causes ablack economy, because people just can’tmanage on benefits. If they declared this income,they would lose everything because of thepoverty trap. But the realisation by youngstersthat their fathers have got to get by through‘fiddling’ is not helpful. (Local councillor)
Housing
The council is faced with a difficult dilemma. Itneeds to fill the properties, and neither local norcitywide adverts have had much success:
People with mental health problems have beenfoisted on housing and they’ve housed thembecause they’re under pressure to makeallocations with demand falling.(Regeneration manager)
People are aware that if you give up your councilhome today and your next place doesn’t workout, you can be offered somewhere else againvery quickly. This has the effect of devaluingcouncil housing. It’s a trap that we’re in. We’renot going to turn people away.(Senior council officer)
The housing department should vet new tenants.If they’ve been thrown out from other parts of thecity, why should we have them? (Resident)
However, the housing service has taken thison board with its deferral policy for peopleresponsible for anti-social behaviour. And it hasbeen a force for good – maintaining a presenceon the ground, addressing historical serviceproblems, working closely with the securityproject and the police, and continuallyattempting to halt the spread of voids. The back-up it needs from other council services is oftenlacking:
Housing is left out there as the last front-lineservice, underpinning housing demand andaddressing the lack of social cohesion. (Renewal manager)
It is not easy:
The situation is now beyond our control – despitetrying every trick in the book to reduce voids,including advertising. (Council officer)
Police
The police work closely with the housingservice and the security project. They alsoexchange information with probation, theschools and social services, and are activelyinvolved with the SRB programme. Crime hasbeen reduced through the proactive targeting ofpersistent offenders.
There is serious organised crime andpeople’s perceptions of crime are hard tochange:
Although the crime rate has fallen, there is aproblem of perception. The old and the vulnerablehave retreated. (Community co-ordinator)
In Lower Riverview, the problems and tensionsthat used to exist are no longer. But the name isstill a powerful negative. (Senior police officer)
Part of the police strategy is to talk positivelyabout the area. Youth initiatives include regularvisits to schools by a ‘youth issues officer’,police forums for 14–16 year olds and avolunteer cadet force.
Some residents argue that the police are stillnot visible enough:
We would like to see more police walking thebeat. (Residents)

58
The slow death of great cities?
Schools
All schools serve a very deprived population:
The long-term and growing unemployment hasundermined the social fabric of the area. Manystudents have reading ages over two years belowtheir actual ages.(Ofsted report of secondary school, 1996)
In a situation of high unemployment, it canbe hard to demonstrate the benefits ofeducation:
As a careers teacher, I could take pupils to theshipyards and they could apply for (and mostlyget) apprenticeships followed by jobs for life.Tremendous efforts are being made to encouragechildren to stay on at school – but it’s very hard ifthey can’t see any opportunity at the end of it all.(Secondary school head)
One primary school, in partnership withparents, pupils, governors and outside agencies,developed play facilities, a community wing (inwhich a range of courses are held), crèchefacilities and a community library. It runs aBreakfast Club, sponsored by local businesses.Sixty to 70 children attend this every day:
The school has to be more than a school in anarea like this. (Primary school head)
Departmental boundaries can be frustrating:
With a community that’s dying, where there’s nohope, you need a joint long-term approach, not asituation where everyone is working in littleboxes. I’ve spent ten years fighting these littleboxes to get the school where it is today.(Primary school head)
The school’s roll increased by 47 per centbetween 1982 and 1997. Other primaries in the
area haven’t fared so well, two having sufferedfrom falling rolls for decades.
Current options
Selective demolition of some council blocks hashad a positive impact on the private housingoverlooking them. The council will carry outimprovements to the remaining maisonetteblocks. In Lower Riverview, there may befurther selective demolition to remove the blightof empty homes. However, there is a dangerthat the ‘front line of the voids’ will creepfurther up the bank.
A regeneration programme is under way.The focus is on people, services, jobs andsupport, as well as on buildings. There will beenvironmental improvements rather thanredevelopment. Additional social housing is notwanted here:
There is something fundamentally wrong with theperception of council housing. It needsrebranding. (Renewal manager)
Most of Riverview is not yet locked intoabandonment. But Riverview is hovering on thebrink and, according to the senior manager,there is no waiting list at all for the area. If theexisting community can be persuaded to stay,then Riverview can survive for the time being.But the population is ageing and times havechanged. The old way of life depended on local,manual employment. New employmentopportunities will be vital to the social cohesionof the area and to give people a reason to live inRiverview. Whilst the drain from city estatesinto owner occupation continues, Riverview’sfuture hangs in the balance.

59
About the area
Although Valleyside is an inner city area, itcontains many open spaces and parks. Parts of ithave almost a ‘village feel’. It has goodshopping facilities, including a large Asda.
Valleyside has always been a working classarea. Most major employers left the areaapproximately ten years ago:
Without employment, the area is not sustainable.Unless you get these people back into work,you’re wasting your time. (Private sector officer)
Nearly 60 per cent of Valleyside’s housing isterraced. The pre-1919 houses are small,opening directly on to the pavement, withshared alleys at the rear. There are also eightlocal authority estates, built in the 1960s and1970s. One has been significantly redeveloped.Others suffer from poor design, a highproportion of flats and maisonettes, disrepair,unsupervised open areas and unkemptenvironments. Housing associations have beeninvolved in refurbishment of pre-1919 housingand have also built anew during the 1990s.
How/when it hit trouble
A demand problem only became visible acrossValleyside in the last three years, although someindividual estates have had high turnover sincemuch earlier.
Allocations policies during the 1980s andearly 1990s emphasised housing and social needto the exclusion of other applicants. The resultwas a high concentration of people who wereunable to cope on particular estates. Meanwhile,waiting lists dried up. Slack in the system meantthat people who wanted to leave could do so:
10 Valleyside
It took time for us to recognise the extent of thechange that was happening and to introducepolicies to counteract the detrimental effect ofthis. (Senior council officer)
Everyone who wanted to be let in to this estatewas let in. (Council officer)
All tenures are now affected by low demand.In nearby private terraces, approximately 20 percent of properties are empty; up from 5 per centjust two years ago. This overall figure masks thefact that there are stable, fully occupied streetsas well as streets which are virtually deserted.
A housing association developmentcompleted four years ago created more choiceand had the knock-on effect of further reducingdemand for the unpopular council stock:
Between 30 per cent and 40 per cent of thetenants came out of our council dwellings inadjacent estates … the stock is better designedand better laid-out. (Regeneration manager)
Poor management in the private sector hasadded to problems:
Low demand is to do with the way that landlordshaven’t been managing their properties, and theirlettings policy – or lack of one. (Resident)
As the population of the terraces growsolder, and the younger generation isincreasingly uninterested in buying suchhousing, the proportion of private renting willcontinue to increase. Areas have changedrapidly if elderly residents have died at aroundthe same time:
In our street we’ve got quite a high percentage ofolder residents. They get intimidated. If you gettwo or three problem families, the houses start to

60
The slow death of great cities?
deteriorate, the elderly move on and other peoplecome in of a similar character. It’s like a cycle. Ifone house gets empty and gets vandalised, veryshortly you’ll find another one goes the sameway. Over a short period of time, a quarter oreven a third of a street can die like that, quitequickly. (Resident)
Inputs/impacts
Housing/regeneration
One estate has been completely renewedincluding attractive new housing and renovatedtower blocks. The local authority confirms it hashealthy demand though it needs sustainedinput from staff and residents. According to thelocal housing officer, it is drawing tenants fromother estates. A bid to regenerate aneighbouring estate failed.
Private companies are building homes forsale, with subsidy from English Partnerships.This is being done as an ‘act of faith’ – in thebelief that demand will be generated bysupplying the right quality housing. Of the 169sales completed or reserved in the regenerationarea so far, 60 per cent have been to existing cityresidents (possibly stopping people exiting thecity). Forty per cent of sales are to incomers,who are being attracted to live in the city. So far,the homes are at the cheaper end of the marketand almost 60 per cent of sales have been topurchasers earning no more than £15,000 perannum (Council report, September 1998). Onecompany plans to build 250 homes inValleyside.
Work is ongoing to attract businesses intothe area, build up the local skills base and linklocal residents with employment opportunities.Regenerators are joining with youth workers to
include young people in this.Renewal of pre-1919 terraces is focused on
those parts of the area with the strongestresident interest. Until recently, housingassociations were using social housing grant toacquire and renew properties. Gradual renewaland selective clearance will continue.
The local authority has also focused onimproving conditions through intensivemanagement, setting clear standards ofbehaviour and enforcing those standards. Afurnished tenancy scheme has reduced emptyflats in multi-storey blocks. The council hasactively sought to redress past failures. It hasforged strong links with the police, as havehousing associations. However, the estatesuffering the worst demand problems in thearea has continued to deteriorate:
We’ve been trying to manage our way throughthe problems on this estate, because we weren’table to put in the capital investment that we didelsewhere. We’ve got very intensivemanagement there: allocations procedures withpre-offer checks. We’ve got an inter-agency taskforce, and we’ve shifted the crime and nuisanceoff the estate. But we have not made one jot ofimpact on demand. (Regeneration manager)
It’s not working. (Council officer)
The level of empty properties is a continualdrain on the housing service:
Empty properties drag the estate down andwaste a lot of time, energy and resources. A lotof money has been wasted keeping emptiessecure. (Council officer)
Housing staff were surprised when theycanvassed opinion about demolition on this

61
Valleyside
estate which was 35 per cent empty at March1998. Contrary to expectations, they found thata majority wanted to stay. This was despitebeing surrounded by empty houses; a few sobadly vandalised and decayed that entiresections of wall are missing, revealing theinterior of rooms.
Residents
There are strong communities in Valleyside:
Valleyside has got some very stable communitiesthat function and exercise social control.(Senior council officer)
There is a warmth in Valleyside – there is thiscommunity feeling. (Head teacher)
Residents have been instrumental in thechanged fortunes of the renewed estate. Theresidents’ association there was established in1985:
When you live in a community, you don’t noticewhat’s happening about you. You walk over therubbish, you pass the empty houses, you getused to your environment. For me, the initial pointwas when I was going to work one day and aused nappy came flying out of a flat and landed atmy feet. I stood there thinking; ‘God, this is whatwe’ve come to’. That was the starting point. Ithought; ‘Something’s got to be done’.(Leading resident activist)
There is also an unstable population:
We’ve seen an increase in the transientpopulation. (Resident)
Some residents feel disaffected:
There’s a lack of hope for some people … andthat pervades the area. (Resident)
There is a limit to how much people willtolerate, especially when there is plenty ofalternative housing on offer:
People do want to stay in the area, but they don’thave to live around empty properties – they don’thave to live next door to the local drug dealer –they can just get up and move somewhere else.(Housing association officer)
Schools
Some schools face closure because of surplusplaces, including a secondary which wasrecently refurbished at a cost of £1.2 million. Theroll of one of the primaries fell from 380 to 207between 1993 and 1998:
One of the biggest things we’re battling against ispupil numbers. (School governor)
By the end of Key Stage 2 (aged ten–11), out of aclass of 25, only half have been here from thebeginning. (Primary school head)
One of the primaries has had a drive toimprove attendance and to reach out into thecommunity. The head is keen to get parentsinvolved in education themselves, in the beliefthat they will then attach greater importance totheir children’s attendance and progress:
So many of our parents condone absence fromschool. If parents have been through the systemand they’ve not come out with this feeling of theimportance of reading and learning having a valueof its own, how can they impart that to theirchildren? So we’ve got a breakfast club, we’veresurrected the parent-toddler group and we’veopened up the school for adult education classes.(Primary school head)
Initially, there was a significant

62
The slow death of great cities?
improvement in attendance and punctualitybut, as the year has gone on, this has droppedoff. However, the initiatives have beensuccessful in involving more parents and a PTAhas been set up.
Police
The police service has adopted a joint-workingapproach, with the housing service, the localschools and social services. This has increasedthe co-operation of the community and otherservices:
There was a period of very poor relationsbetween the town hall and the police, whichstarted in the early 1980s. If I got someinformation about someone dealing drugs in alocal authority property and I wanted to knowwho lived there, I’d be told that they don’t co-operate with the police. Now, housing actuallybring information to us. (Senior police officer)
The crime rate has gone down, mine is one of thequieter beats. (Police officer)
There is still a perception of high crime:
Some people think they are living in the depths ofhell. (Council officer)
Some intimidation does not involve anyoneactually committing a ‘crime’:
The younger generation – kids running round thestreets, causing nuisance –has the biggest effecton people … together with drugs.(Senior police officer)
The empty properties can be a target forchildren to vandalise:
In some ways, it’s like a playground for kids. Oncethey get a door off, it’s an adventure.(Police officer)
Current options
There is a great deal of regeneration activity inValleyside. One estate has been completelyremodelled, private housing is being selectivelycleared and improved, and, most significantly,private developers are building housing for sale(albeit at the lower end of the market and withsubsidy). People from outside the city, as well asexisting residents, are being attracted into thisstock. The crucial test will be whether this newowner occupation is sustained.
There are 125 acres of development land inthe regeneration area. It is close to the city centreand the metro will be extended to the area in thenext three years. There are, therefore, significantopportunities for job creation and furtherhousing developments for higher incomehouseholds. There is political support for thisstrategy. Valleyside has a better chance thanother inner city areas of being ‘saved’,repopulated and ‘depolarised’:
If you’re pessimistic about Valleyside, you’repessimistic about every single inner city area inthe country. The problems will be solved. But it isnot going to happen overnight.(Senior council officer)
Alongside the large-scale, dramatic buildingprojects, there needs to be continued intensivesupport to the existing communities in both thesocial and private housing:
We need good publicity for the area and for theschool. We need private landlords to market theirproperty – with a very strict lettings policy. Wewant people who are going to be committed tothe area and committed to maintaining theproperty. (Resident)

63
Valleyside
Ultimately, hope hinges on economicregeneration of the area and the city – givingpeople a reason to live in Valleyside, and toinvest in the area both economically andsocially.


Part IV
The causes and consequences of decline


67
In this part of the report, we try to set thepopulation and job losses in Manchester andNewcastle in the wider context of urban changeand decline. We link the local fortunes of thefour neighbourhoods to inner city clearance andestate building. We then look at governmentand local regeneration attempts within aglobalising economy that treats cities likeManchester and Newcastle particularly harshly.
In abbreviating and simplifying history, werefer the reader to detailed sources.
Pre-World War I
The roots of abandonment are tangled. Thedepopulation of cities in Britain has beenvirtually continuous since before the First WorldWar (Thompson, 1990). Core areas started todepopulate even before the end of thenineteenth century when railways madecommuting possible and Britain lost itsindustrial mastery of the world (Briggs, 1983).By 1900, 80 per cent of the population wasurbanised and the pressures to decongest citieswere intense. The vast majority of workingpeople in England were living in single familyterraced houses, mostly solidly built, openingon to paved streets, with piped water. Thishousing form was a sign of our relativeaffluence compared with our continental andScottish counterparts who were often living inhigh density tenements (Burnett, 1978). But thedensity was huge compared with today – 40dwellings to the acre, six people to a household,at least 240 people to an acre, but rising to 400 inpoor city neighbourhoods.
Often, strong support networks developed
in these areas, some based on kinship, some onmutual aid principles amongst groups ofworkers (Thompson, 1990).
Inter-war years
‘Coronation Street’ neighbourhoods went intorapid decline between the wars when a vaststock of new suburban housing was built, muchof it for working people (Burnett, 1978;Holmans, 1987).
Rents were tightly controlled except whenre-let to new tenants and nineteenth-centuryinner city housing decayed rapidly (Holland,1965). The total supply of homes jumped fromseven million to 11 million in 20 short years,much of the increase going to first time,working class owner occupation, as well as tocouncil housing. Suburbs spread and councilscreated ‘peripheral estates’ for the first time(Daunton, 1987). People began to be pushed outof the old terraces by slum clearancedeclarations that in the 1930s rose to one-and-a-half million although only a quarter of a millionwere actually cleared before the war (Holmans,1987). Households shrank to an average of threepeople as the number of homes and householdsmultiplied. This rapid process ofdeconcentration was abruptly halted by WorldWar Two.
Post-World War II
An ambitious plan to build new estates, newtowns and new neighbourhoods was born ofwar-time solidarity. In order to deliver Utopianestate plans, it was essential to clear two million
11 The long roots of the problem –
history not news

68
The slow death of great cities?
surviving nineteenth-century slums. Thesecolossal and costly projects blighted every majorinner city in Britain from the early 1950s rightup to 1980 (Burns, 1963; Power, 1987). Between1931 and 1978, city populations plummeted, inspite of continuous rebuilding. Aneurin Bevan’sdream of recreating English and Welsh villageswas corrupted into large monolithic, singletenure, single class estates (Foot, 1973; DoE1977; Power, 1987). The blight on inner cityneighbourhoods, often lasting 30 years or more,destroyed not only many establishedcommunities, but also many jobs and services(Young and Wilmott, 1957; Maclennan, 1997;DoE, 1977). There was in fact a deepcontradiction between the gains of the masshousing programme in dwellings andamenities, and the upheavals it caused(Dunleavy, 1981).
Urban depopulation
City depopulation was caused by strongerforces than clearance and mass construction ofcouncil estates, important as these were.Britain’s slow economic decline relative to NewWorld and German expansion from around 1870turned world famous industrial nerve-centresinto over-sized ghosts of history (Briggs, 1983).Rent controls encouraged private landlords tolet inner city property fall into disrepair, leadingto withdrawal. The 70-year slow boom in owneroccupation continuously sucked working andmiddle class families out of cities into suburbanand smaller settlements (Saunders, 1990); butalso led to gentrification of older, inner cityhousing. According to F.H.L. Thompson,dominant owner occupation at the expense ofprivate renting confirmed Britain as a less
mobile society with more class rigidity thanother wealthy societies (Thompson, 1990).
The outward movement of jobs and peoplewas actively encouraged from 1930 to 1975 withthe aim of reducing overcrowding, cleaning upcities and planning orderly settlements. Someindustry in cities like Newcastle was forced out.This reinforced industrial decline and economicrestructuring. Thousands of monofunctionalestates, stripped of noisy, dirty workshops andcheap corner shops, were built as dormitoriesfor the families of mainly male workers(Community Development Project, 1976).
Severed networks
Large-scale compulsory purchase was seen as aprerequisite for city renewal even when houseswere structurally sound and there was stronglocal resistance (Crossman, 1975). Millions ofunmodernised Victorian and Edwardianterraces were targeted by government. Someescaped and were modernised, many did not(Ferris, 1972).
New housing estates were reserved for thevictims of clearance, the ‘slum dwellers’. Theslow emptying, boarding up and disconnectionof services turned previously thriving, if poor,neighbourhoods into a sea of dereliction(Hamilton, 1976; Konttinen, 1983). In otherEuropean cities, demolition was much moreselective and more mixed-use neighbourhoodshave survived (Power, 1993).
The forced rupture of old neighbourhoodswas occasionally fought off (Hamilton, 1976).But, on the whole, the ‘Family and Kinship’story was replayed in maybe 5,000 compactinner city neighbourhoods, as established socialnetworks were destroyed and forced

69
The long roots of the problem – history not news
communities in new areas often failed to takeroot (Wilmott and Young, 1957). Large tracts ofinner Liverpool, Manchester, Birmingham,Newcastle, Glasgow, Tower Hamlets and otherurban centres were virtually wiped out between1955 and 1975. Nearly five million people werecompulsorily moved (Halsey, 1988). Liverpoollost one-third of its population in the process.Birmingham had a continuous clearance area of35,000 properties.
The idea that people could be reordered outof slums into new estates did not work.Government took no responsibility for the socialupheavals and dislocation that inner citydemolition and rebuilding caused (CHAC, 1949,1953a, 1953b 1955a, 1955b, 1956, 1959, 1969;HSAG, 1978). The informal networks of supportthat are well documented in low incomesettlements world-wide were swept away and ittook years to rebuild them (Habitat, 1996; Youngand Lemos, 1997).
Surplus estates
Estates appeared – sometimes almost end onend as in Tower Hamlets, Southwark, northLambeth, south Hackney, inner Liverpool, theEast End of Newcastle. Many of these newcouncil areas had become hard to let by theearly 1970s (DoE, 1974). The Government wasfirst alerted to the problem when councils beganadvertising vacancies. There were boarded upflats on many large, difficult to let Londonestates – the GLC advertised in the Evening
Standard and let over the counter (GLC, 1979;DoE, 1981a). Islington had several estates whereit simply couldn’t find families to move in(Hamilton, 1976). Demolition of structurallysound blocks began and continues today.
The problem was much more severe in theNorth. Newcastle forecast in 1976 that it wouldhave a surplus of council housing by 1983 if itkept building (DoE, 1981a). Gatesheadcouncillors in 1975 recommended a halt tocouncil building but the recommendation wasrejected for fear of being overtaken byneighbouring local authorities. Liverpool,Birkenhead, Knowsley, Wigan, Blackburn,Oldham, Rochdale and many other areasreported serious demand problems by 1980.Lewisham council in London declared it hadenough council housing in 1976 (DoE, 1981a).
By 1980, over half the housing stock of mostinner London boroughs and nearly half thestock in most major cities was council-ownedand rented. Councils came to dominate cities ina way that had not been clearly foreseen andwas unique in Western Europe (Power, 1993).
Estate management
The lack of management structure or expertisein running the now publicly owned areas led tomajor gaps (DoE, 1981a). For example, thepolice did not accept responsibility forpatrolling estates as ‘private areas withunadopted roads’ (Islington Borough Council,1976). Council housing management was notregulated, unlike other public services, and theresulting standards were very poor (CHAC,1969; HSAG, 1978; Glasgow District Council ,1986). The management task was made muchharder as new generations began to grow up inworkless households (DoE, 1981b). The derelictdocks, warehouses, factories, terminals all nowblighted the very estates that they hadgenerated in their heyday.

70
The slow death of great cities?
Bias to renovation
By 1974, under pressure of growing objections, ashortage of suitable sites and cost, few newclearance areas were being announced.Renovation restored some of the popularity ofold inner areas. In the early 1980s, it was easierto let a Coronation Street house than a brand newflat in Liverpool (DoE, 1981a). In Islington, theshift away from demolition saved manycondemned Georgian squares from thebulldozer and drew in younger households whootherwise would not have stayed in innerLondon. The housing was cheap, accessible andfar more spacious than modern ‘rabbit hutches’and it became highly attractive (Ferris, 1972).This movement gradually spread across innerLondon and other cities. Glasgow began torecognise the intrinsic value of its old tenements(Donnison and Middleton, 1987).
Government funding shifted in favour ofinner city renewal. But, in spite of GeneralImprovement Areas (1969), Housing ActionAreas (1974) and Urban DevelopmentCorporations (1981), all aimed at restoring cities,the decline continued. Rather than too little, toolate, the rescue of cities was a long-term projectin the face of radical economic and socialtransformations.
Global shifts
International competition, the freeing up ofmarkets and investment led to the collapse ofailing British industries – textiles, steel, coal,shipbuilding, car manufacture and many others.Cities like Manchester and Newcastle were evenharder hit in the 1980s by the complex processesof globalisation than in the earlier decades of
slow decline (Economist, 1998). If public buildingprogrammes resembled an unstoppablejuggernaut and inner city renewal a stuntedCinderella, economic change was like a tidalwave, swamping whole communities, sweepingaway jobs and sucking out the energy and life-blood of whole areas.
The break-up of ‘municipal fiefdoms’
The main obsessions of the 1980s became theexpansion of owner occupation and thereduction in the scale and power of urban localauthority landlords (Forrest and Murie, 1988).The hope was that a more private, morecompetitive orientation would generate moreenterprise. Government policy did not ignorecities, even though councils were no longer themain house builders, nor the principleregenerators (Robson, 1995).
Michael Heseltine’s attempt to entice privateinvestors back into inner cities after the Brixtonand Toxteth riots met with a luke-warmresponse. Government had to pump-primevirtually all the new inner city housing,renovation of older property and theinfrastructure for inner city renewal (AuditCommission, 1989). Tenants’ disillusionmentwith conditions was used as a weapon to leverchange out of local authorities, although thissometimes backfired as in the case of the firstHousing Action Trusts (Malpass and Means,1993).
Throughout the 1980s and 1990s, a battery ofinitiatives was tried – at one point, there were adozen simultaneously targeted at inner cities.Most had some impact on conditions. Inparticular, the Urban DevelopmentCorporations, one for every major city, created

71
The long roots of the problem – history not news
flagship centre city renewal projects that beganto attract new jobs and new residents. They arean interesting case of mixed use, mixed fundingpartnerships which cities over time came to beproud of. But they were too glamorous and tooexpensive for poorer and more extensive innerneighbourhoods.
Rescuing estates
Estate Action targeted repair and environmentalfunds at about 500 estates. Housing associationswere encouraged to build new and infillschemes in place of local authorities. But nocoherent or concentrated action was taken overthe long-run decline of inner neighbourhoodsuntil City Challenge was launched with thereturn of the hard-hitting Heseltine to attackmultiple and highly resistant problems withmultiple action (DoE, 1996). In spite ofsignificant visible impacts, under 30 areas werein the programme; they were short-lived (fiveyears) and therefore insufficient to turn the tidein the areas we visited.
The last major Conservative initiative was topool all city programmes, distribute the moneyas widely as possible through the SingleRegeneration Budget and thereby lower thepriority given to cities. This lower commitmentwas linked with rumbling disorder in manyestates and inner areas. In the early 1990s, therewere over a hundred disturbances and at least28 riots, mainly outside London and the SouthEast. There was a clear link between loss ofwork, loss of a male breadwinner role,aggressive male behaviour and weak policing(see Power and Tunstall, 1997 for furtherdiscussion). These riots were local affairs,
provoking no inquiry and no new policies.Among the most severe were the riots in GreaterManchester (Salford) and Newcastle.
The numbers game
Meanwhile, house building continued. Housingassociations entered their fastest growth period,mainly new stock in inner city estates where itwas cheap. Government targets encouraged thenumbers game and economies of scaleencouraged estates. Lower costs encouragedallocations of funds to the North and thespectacle of unwanted new developments inmany northern inner cities began.
Throughout the 1980s and 1990s, between150,000 and 200,000 new homes a year werebuilt, mostly for owner occupation, mostlyoutside the cities on greenfield sites, possiblystaying slightly ahead of the rate of householdformation (House of Commons, 1998).
Councils had undergone 20 years of harsh,negative, downward pressures. Their status andtheir estates were often in bottom place. In bigcities, where municipal landlords were mostdominant and in deepest trouble, the knock-oneffects on the city as a whole were significant(Pacione, 1997).
By 1995, there were constant press reports ofvandals destroying newly built, unoccupiedhouses, of half-empty estates, of demolitiondecisions and of plummeting demand (seeAppendix 8). Table 36 shows how these broadsocietal and economic changes affected lowincome neighbourhoods, fuelling the urbanexodus.

72
The slow death of great cities?
Table 36 Impacts of wider changes on local neighbourhoods
Wider urban and societal changes Local inner city and neighbourhood changes
Industrial decline/job change Highly concentrated impacts of large-scale changesCity exodus and North/South drift Acute poverty and job lossesDecline in social housing popularity Council estates become stigmatised
Clustering of problems Empty propertyLower standards of service High turnoverFalling densities Low value propertyDeclining reputation of cities Lower entry requirements
Interlocking problems ‘Left behind’ populationPoor schools, security, environment High unemployment/low skillRising demand in more popular areas Plummeting demand and abandonment in unpopular areasSettlements leapfrog beyond urban fringe Local controls deteriorate
Anti-urban bias Neighbourhoods caught in vicious spiralFeeds neighbourhood decline Feeds anti-urban prejudice
↔

73
There are three main pressures militatingagainst the survival of the poorestneighbourhoods including the four we studied:
• first, the intense social and economicpolarisation of the poorest areas leadingto the prospect of chaotic conditions, ashappened on some council estates in the1970s, 1980s and 1990s (Power, 1997;Power and Tunstall, 1997)
• second, the dominance of councilownership in cities and the mismatchbetween area tenure and the strongaspiration to choose and to own
• third, the strong lure of suburban andrelatively low cost owner occupationleading those who can buy to abandonpoor inner neighbourhoods and fuellingthe exodus.
The social face of cities has been graduallytransformed (CPRE, 1998; Rudlin, 1998). Thepeople left behind in the process, descendants oftraditional working class communities andnewcomers to the urban scene, occupy oldneighbourhoods that have become all butunrecognisable. Table 37 illustrates the push and
pull factors. Figure 7 illustrates the long patternof urban decline.
Both Manchester and Newcastle have beenhard hit by sprawling greenfield building. Yet‘land is a finite resource and we cannot afford tobe profligate with it’ (Raynsford, 1999). It is stillcheaper and easier to use greenfield thanrecycled inner city land. However, if the fullinfrastructure, social and economic costs ofgreenfield development were included,brownfields would be more attractive.
No government department is responsiblefor monitoring the building targets that arebeing set or the planning permissions that arebeing allowed. Unitary Development Plans,produced by every local authority, are notscrutinised for consistency. Nor are theyregularly updated. The statement withinNewcastle’s Plan that the city still suffers fromhousing shortages and too high densitycontradicts available evidence (Newcastle CityCouncil, 1998c, DETR, 1998b).
We now link the pressures and trends wehave explored to the experience of our innerneighbourhoods. The factors affecting them aregrouped under six main headings.
12 Driving factors
Table 37 Push and pull factors in the abandonment of inner neighbourhoods
Push factors Pull factors
Unpopularity – low value Desire to upgradePoor services, particularly education Escape from inner cityAccelerated decay High premium on securityUnpredictability Desire for peaceful environmentDemoralisation, despair Pro-suburban biasLow income/poverty Higher value neighbourhoodsSense of loss of control – insecurity Affordability – cheap owner occupationAggressive, disruptive behaviour Ready supply outside cities

74
The slow death of great cities?
Reputation
The reputation and history of the areas broughtwith them lasting problems. From the outside,the old slum areas were stereotyped as crime-ridden, ignorant and unruly (Wohl, 1977). Muchof this reputation carried over into the councilestates that replaced them (DoE, 1981a). Astimes changed, people sought constantly toleave, upgrade and improve. Thus, tied into thehistory of poverty was a history of instability.
Poor areas often had a much more positiveside – a strong sense of ‘community’ in the old-
fashioned sense, gritty almost defiant pride inwhat had been the very base of England’sindustrial wealth. Difficult conditions generatedan instinct for survival and close familynetworks (see case studies). These positiveelements helped people to cope with thestruggle at the bottom but they did notovercome the harsh industrial legacy. The senseof solidarity within the community was often anattempt to fight back at a social order that reliedon large groups being at or near the bottom.Overall, the lowest income communities were
City decline
Exit of skilled population
Growing poverty, de-skilling
Suburban owner occupation gets cheaper – more space – better amenities
Social housing stock continues to expand (to 1983)
Estates lose popularity
Poorest estates become marginal
Politicians ‘in denial’ – inadequate response
Worst areas damage city image
Greenfield developments to hold population
Inner areas collapse
Figure 7 Cumulative urban decline leading to collapse in neighbourhood conditions
Source: Based on European Urban programmes; Power, 1993.

75
Driving factors
battling with weak rather than strong levers.This was accentuated as traditional institutionssuch as unions, churches and friendly societieslost members and their cutting edge(Thompson, 1990). The transformation of work,requiring different and higher skills, hasreinforced this problem, making muchtraditional education in low income areasunprepared and as yet unable to generate newstandards and skills sufficiently fast (Blunkett,1998).
As neighbourhoods shrank and lost theiremployment base, so the negative image of anarea became stronger, generating a sense ofshame. It is easy to become depressed when therationale for a community is lost – ‘when workdisappears’, and conditions deteriorate (Wilson,1997). Thus, history and reputation becomeattached to the people who are identified withan area and its problems (Gauldie, 1979).
In spite of this, some residents were deeplycommitted to their neighbourhoods workingtirelessly for the good of the community. Theyhad not given up hope, but they recognised thedownward pressures on their neighbourhoods.In particular, they were distressed by thenegative behaviour of many younger residentsand some families. They felt this compoundedthe poor reputation and betrayed all theystruggled for:
One or two kids were holding the estate toransom and it got a bad name. It crept up on us.(Resident, City-Edge)
Housing and environmental conditions
The economy, housing and environment interactstrongly but with a time lag. As jobs go, so
people filter out to new housing built in growthareas. More anchored and traditional residentsoften do not want to go. The environmentdecays as economic shifts continue, creating asense of dereliction.
There is a singular absence of any overallenvironmental plan for the areas. It is theconfusion of open spaces, derelict land, emptybuildings, lack of trees, loss of an ordered senseof urbanity that so stigmatises the mostabandoned areas, making them look uncaredfor, unvalued and unwanted.
Regeneration initiatives definitely improvethe image of the targeted areas by upgradingthe environment, but often they are too short-term, too capital intensive and too disruptive ofthe existing population, leading to furtherpopulation movement (see case studies) and anabrupt loss of momentum at the end of eachspecific programme (Robson, 1995).
Areas need long-term management ofconditions, with people on the groundconstantly checking, supervising, mending,clearing, guarding, controlling, linking,listening. Little of this activity is funded throughprogrammes of intervention, or through localauthority mainstream services. Earlier studieshave highlighted this need (Carley and Kirk,1998; Gregory, 1998).
Overall, there is far too strong an emphasison physical regeneration and building, and toolittle sense of what might make areas ‘tick’again. The truth must lie in some combinationof physical and social spending, capital andrevenue programmes.

76
The slow death of great cities?
Empty demolition sites, empty
council homes and empty shops

77
Driving factors
Building for a surplus or gentrification?
Neighbourhood abandonment leads to a fight tocounter the decline. Hence, new, low costhousing is going up in the very streets that havebeen cleared for lack of demand. No one yetknows whether the new housing will take rootand new residents will stay. But only bystemming the wider flow out of cities willdemand for these areas rise again. This has notyet begun to happen.
There are some hopeful signs. Better qualityhousing close to the city centres is selling betterthan predicted and there appears to be demandfor more (Manchester and Newcastle, 1998;Rudlin, 1998.) Appealing to higher income,younger working households with new-stylecity flats and town houses offers one wayforward for areas that are quite literallyabandoned by traditional employers andresidents. The quayside along the Tyne israpidly being claimed by developers on theback of the Urban Development Corporation’sinvestment in the 1980s/90s (Newcastle CityCouncil, 1998b). The old warehouses of centralManchester offer spacious and attractive ‘loftapartments’ that are selling for 40 times theprice of a terraced house only a mile away.(Manchester City Council, 1998d). These highquality developments are having a knock-oneffect on the image of city housing and on thestandard of services offered.
The benefits have not yet hit the neighbour-hoods we studied, but they are sometimes onlyminutes away and they symbolise a shift inthinking. What was formerly rejected as a hatedindustrial relic is being ‘gentrified’. Developersare building modest but attractive homes foryoung incomers in two of the neighbourhoodscreating the beginning of more mixed, more
balanced areas. Trickle down theories are stronglydisputed but cities are dynamic vehicles and thedirection of change does affect both poor and rich.The new dynamics may be more pro-city andtherefore indirectly pro-poor. The involvement ofprivate as well as public partners signals thenew opportunities (Urban Splash, 1998).
Management pressures
The management problems generated byconditions of incipient abandonment are littleshort of overwhelming. Some councils, afteryears of over-bureaucratic, rule-bound,procedure-driven systems, are ready to pushout all the boats in precarious neighbourhoods.Local staff, local offices, local lettings andresident links are now commonplace in morego-ahead areas in response to the real urgency.However, these moves are often not backed bylocalised budgets, direct control over servicedelivery or sufficient local decision-makingpowers (Power and Tunstall, 1995). Themanagement structures are often not strongenough to stem the tide. As a result, reallyradical experiments only rarely emerge.
However, tough enforcement on crime andanti-social behaviour appears to be having someeffect. The introduction of concierges into blocksof flats is restoring viability to some previouslyhalf-empty blocks. Localised staff appear tocontain spiralling conditions and win somebattles (see case studies). But, unless there ismore demand, management energies may beleeched away. One of the requirements ofsuccessful management is to get many elementsright together (Power, 1997; Gregory, 1998;Social Exclusion Unit, 1998). Management onlyworks over small areas, yet a co-ordinated effort

78
The slow death of great cities?
Quayside development, Newcastle upon Tyne

79
Driving factors
REVITALISING INNER CITIES
Source: Urban splash
Old Haymarket, Liverpool
Britannia Basin, Manchester

80
The slow death of great cities?
over large areas is essential. Getting thiscombination of highly localised inputs andbroader city strategies to work together ishighly elusive. Both Manchester and Newcastleare battling with these dilemmas (seeAppendices 6 and 7).
Disrupted communities
Social problems dominate the consciousness ofall who live and work in inner neighbourhoods.Tenants are constantly trying to move awayfrom the edges of estates where they might beexposed and vulnerable, or the middle wherethey might feel trapped and forgotten. Thus,strips of empty property keep growing. Manypeople – residents and staff – talked about theproblems at night when no one was around.People referred to gangs, criminals and roughbehaviour. This sense of dread is real, but it isdifficult to judge how many people are involved– probably a small minority, even though it issufficiently aggressive to swamp counter trends:
There is a massive problem with an over-supplyof housing. It has wrecked communities. They arenow unsustainable. This part of the city is just achoice of bad areas to live in.(Former HA development worker, Bankside)
One explanation for the growth of neighbournuisance and behaviour breakdown is thegrowing concentration of difficult people in ashrinking stock of public housing. A singlefamily can wreak havoc where there is space inwhich to operate:
One ‘wrong’ person moves into a street, and thewhole street empties. The perpetrator stays, thevictim moves. (Resident, Bankside)
Abandonment and high turnover make thatminority even more conspicuous. In the controlvacuum that often arises as the stablepopulation declines, behaviour that might havebeen contained spills over:
We had eight abandonments in the course ofthree to four weeks. Five of those were on thesame street and were mainly to do with thisproblem family vandalising the area andthreatening people. They were wrecking ourproperties as they became empty. So we had toput up screening which made the street lookworse. Even then, they were pulling the frontporches off and setting fire to the gas meters.One tenant has had bricks thrown through herwindow. Members of this family have punchedpeople in the street.(Housing association officer, City-Edge)
Disruptive behaviour like this affects localschools. Some children react aggressively to theviolence and destruction they see around them.
Other social problems are quieter – lowincome, lack of work, lone parenthood, forexample. But they actually feed into disorder atthe extreme, because residents have fewerresources, lower morale, weaker links and lessback-up with which to make things work. Theyalso become depressed more easily anddepression readily converts into aggression –particularly among young men.
It appears impossible to sustain socialcohesion when large areas have become almostuniversally poor in a wider context of growingaffluence. Both cities advocate an income andsocial mix within the inner city as the onlyeffective counter to the mounting socialproblems (Manchester and Newcastle, 1998).Residents often agree:

81
Driving factors
Some people think you should just start all overagain and attract in much higher income peoplewho could make it work. (Resident, Bankside)
But spreading rather than concentratingproblems is easier said than done. Newsupports and new initiatives to integratemarginal households have to be constantlycreated (Shelter, 1998). Manchester’s originalstrategy to combat anti-social behaviour incouncil housing through evictions, injunctions,witness support and other enforcementmechanisms is both popular and contentious.On the ground, it is strongly defended.Enforcement often leads to improvement. Thesignals sent out by setting clear boundaries cancontain behaviour.
Cumulative crisis
We observed the phenomenon of ‘tipping’ fromviability to unviability as areas go into a steepslide and problems reach breaking point. Someparts of all four areas became unsaveable. Thekey measures of tipping were zero demand,property abandonment and the decision toallow demolition by managers and residents.Power, energy, resources and authority allbecome so depleted that, over a short period,many elements of viability collapse. No one anylonger has a grip on conditions. Figure 8summarises the process of ‘tipping’.
Figure 8 Tipping point in neighbourhood decline
Tipping point
Long-term decline
Accelerating costs
Loss of confidence
Zero demand
Property abandonment
Zero value
Demolitions
Depleted energy, resources
Loss of authority/control
Collapse in viability


Part V
A way forward


85
The following section examines the prospectsfor inner neighbourhoods in the face of long-rundecline. We link the historic problems of citieswith the climate of positive change that we alsoencountered.
The counter-pressures
Most parts of the neighbourhoods we visitedhave not yet reached tipping point. There aremany efforts to save these neighbourhoods.
• Constantly renewed regenerationinitiatives and other special programmesunderpin the survival of inner areas.Even where they are inadequate orunsuccessful, they express a commitmentto cities that over time may win backsome lost ground. Almost all exampleswe describe make some difference, atleast to the potential of neighbourhoods.
• Localised housing services are bit by bitameliorating some conditions andresponding to immediate problems. On-the-spot repair and environmental careare critical to success in such difficultareas.
• Local policing initiatives are drivingdown crime in some areas and creating amodel of policing that is more sensitive,more focused and more visible on thestreets.
• Efforts by local schools help to counternegative reputations, behaviour andperformance. Where they link parents into the educational and community effort,they are doubly effective.
• Local church members and leaders cangenerate community support and positiveaction.
• More open marketing of availablehousing is encouraging applicants whomay contribute to a more stable socialenvironment. Careful vetting andscreening to prevent disruptivehouseholds is an essential part of thisprocess. Residents’ knowledge can helphere.
• Constant involvement with localresidents encourages them to stayinvolved and keep up hope. It providesinvaluable information and is a vital partof any strategy to stabilise and restoreinner areas. It is far easier to attract newinvestment and new mixed incomedevelopment when there are somelonger-standing residents defending thearea (Power, 1997).
• Many other initiatives are required, someof which we found on the ground, somewere missing; particularly youth andfamily projects, employment and trainingprogrammes, ground level care-taking,guarding and custodial maintenance.New Deals for Work and for Communitiesare designed to tackle these gaps.
• Long time-scales are needed to turnaround such deep-set problems – 15 or 20years (Social Exclusion Unit, 1998).
Co-ordination increases effective action suchas joint police, housing and resident strategiesto tackle drug dealing.
13 What can be done?

86
The slow death of great cities?
The measures we found in place oftencountered or slowed the downward trends andin some areas seemed to contain the worstproblems:
Our residents’ association was set up becausewe wanted to tackle what we saw as the areabeing left to deteriorate. I decided that the areawas worth fighting for. (Resident, City-Edge)
No one agency has the answer or the capability todeal with the problem … it’s so massive that weall need to work together.(Secondary school head, Bankside)
Table 38 summarises those micro-actionsthat cumulatively prevented the collapse thatmany feared.
Social exclusion
The term was invented in France in the early1980s to describe people cut off from work andother support. It has become a catch-all phrasefor poverty and related social problems. Itresonates in Britain where polarisationincreased rapidly in the 1980s (Joseph RowntreeFoundation, 1995). Social exclusion has quicklyrisen to the top of the political agenda.
New patterns of work are driving thesechanges in post-industrial economies (Reich,1993; Marris, 1996; Wilson, 1996). Olderindustrial centres are harder hit than morediverse, service-based, ‘modern’ areas(Jargowsky, 1997). But, in Britain, all large citiesand most sizeable towns experience problems ofsocial exclusion. It is a product of manypressures and changes working together topush more disadvantaged people to the edge ofsociety, often preventing them from partici-pating and depriving them of opportunity. The
least popular council estates and poor innercities are particularly strongly affected becauseof their historic role in housing a manualworkforce (Social Exclusion Unit, 1998). There isno one pattern of decline, as some cities andareas have coped and responded better thanothers.
Social exclusion is associated with theghettoisation of people and areas. Tackling innercity problems and rebuilding cities moregenerally is a key to creating social cohesionbecause pro-urban policies work against thedevelopment of social ghettos.
We have a strong legacy of universalunderpinning through the Welfare State ineducation, health and social security. Thisunderpinning is still remarkably intact (Hills,1998). It provides vital bridges between all areasand all citizens. Area programmes depend onthem. The new government is targeting themost deprived areas with intense initiativesbased on universal programmes. New ideasdraw on earlier experience of successfulregeneration (Robson, 1995; DETR 1998c,1998d). This should help inner cityneighbourhoods.
Many of the new government Action Zones,the emphasis on education and health, the crimeand disorder measures, the supportive approachto families, and targeting the worst areasthrough New Deal for Communities aredesigned to combat social exclusion (PrimeMinister, 1998). The bundle of benefit and taxreforms announced by the Chancellor in 1998helps to move low income households closer tosolvency and in the direction of integration(Hills, 1998). While these measures are nationalpolicies, they are applied regionally and locallyto create local responsive programmes.

87
What can be done?Ta
ble
38
Lo
cal
act
ion
in
fo
ur
ne
igh
bo
ur h
oo
ds
to h
old
co
nd
itio
ns1
Hou
sin
g
Loc
al o
ffic
eL
ocal
lett
ings
Scre
enin
g le
ttin
gsFl
exib
le le
ttin
g, e
.g. u
nder
-oc
cupy
Con
cier
ge in
tow
er b
lock
sFu
rnis
hed
tena
ncie
sE
stat
e ag
reem
ents
Ad
vert
isin
gSe
lect
ive
dem
olit
ion
Mod
erni
sati
onL
ight
ing
Fenc
ing
Ext
erna
l upg
rad
ing
Lan
dsc
apin
g of
cle
ared
site
sE
stat
e re
mod
ellin
gTe
nure
div
ersi
fica
tion
Eng
agin
g pr
ivat
ela
ndlo
rds
LA
sec
urin
g pr
ivat
eem
ptie
sA
ctio
n on
enf
orce
men
tL
ink
to e
mpl
oym
ent
Mul
ti-l
and
lord
link
s
Res
iden
ts
Res
iden
ts’ a
nd te
nant
s’as
soci
atio
nsH
omew
atch
pro
ject
sL
inks
wit
h po
lice
Cre
dit
uni
onC
omm
unit
y d
evel
opm
ent
Mon
itor
ing
hous
ing
and
envi
ronm
enta
l ser
vice
sIn
put i
nto
allo
cati
ons
Neg
otia
ting
est
ate
impr
ovem
ent
Ass
ista
nce
in s
ecur
ing
empt
ies
Cam
paig
n fo
rin
trod
ucto
ry te
nanc
ies
Pol
ice/
secu
rity
Loc
al p
olic
ing
Spec
ial l
iais
on w
ith
resi
den
tsL
iais
on w
ith
othe
rse
rvic
esW
itne
ss s
uppo
rtC
omm
unit
y sa
fety
stra
tegy
Yout
h in
itia
tive
s, e
.g.
volu
ntee
r ca
det
forc
e,sc
hool
link
s,d
iver
sion
ary
wor
kTa
rget
-har
den
ing
Clo
sed
cir
cuit
tele
visi
onC
rim
e pa
tter
ns a
naly
sis
Safe
r E
stat
es in
itia
tive
Ars
on ta
sk fo
rce
Secu
rity
pro
ject
incl
udin
gpa
trol
s by
gua
rds
Sch
ools
Bre
akfa
st c
lubs
Lun
ch-t
ime
club
sPa
rent
invo
lvem
ent
Ad
ult e
duc
atio
nA
nti-
trua
ncy
mea
sure
sA
nti-
bully
ing
mea
sure
sIm
prov
emen
ts to
sch
ool
build
ings
Ext
ra in
puts
for
tran
siti
onfr
om p
rim
ary
tose
cond
ary
Pare
nt li
nks
Wel
fare
sup
port
Hea
lth
Res
ourc
e ce
ntre
Loc
al p
harm
acy
Hea
lth
proj
ect i
nclu
din
ggr
oup
for
stro
ke p
atie
nts
and
thei
r ca
rers
Men
tal h
ealt
h aw
aren
ess
trai
ning
for
fron
t-lin
est
aff
Supp
ort g
roup
for
dru
gus
ers
Sp
ecia
l res
ourc
es
Est
ate
Act
ion
Cit
y C
halle
nge
Sing
le R
egen
erat
ion
Bud
get
New
Dea
l for
Com
mun
itie
s
Vol
un
tary
orga
nis
atio
ns2
Sett
lem
ent
Chu
rch
acti
onN
eigh
bour
hood
wat
chC
omm
unit
y se
curi
typr
ojec
tsC
omm
unit
y Tr
ust
Hou
sing
co-
oper
ativ
eC
omm
unit
y ce
ntre
Food
co-
oper
ativ
e
Em
plo
ymen
t3
Trai
ning
, ski
lls,
dev
elop
men
tO
utre
ach
Job
link/
job
sear
ch/
job
prep
arat
ion
Wor
k ex
peri
ence
Em
ploy
er li
nks
Com
pact
sIn
war
d in
vest
men
t/ne
w jo
bs
Cro
ss-s
ervi
ce w
ork
ing
Com
mun
ity
plan
ning
Polic
ing
wit
h ho
usin
g st
aff
and
res
iden
tsC
hild
sup
ervi
sion
Fam
ily s
uppo
rtA
nti-
soci
al b
ehav
iour
1N
ot a
ll ac
tion
is ta
ken
in a
ll fo
ur n
eigh
bourho
ods.
2O
ther
vol
unta
ry o
rga
nisa
tion
s ar
e lis
ted
und
er o
ther
hea
din
gs.
3O
ften
insu
ffi
cien
t loc
al ta
rget
ing.

88
The slow death of great cities?
Table 39 summarises the programmes,powers and proposals for tackling urban andneighbourhood problems currently in train.They are divided between national, regional,district and neighbourhood policies andapproaches. At neighbourhood level a clearframework does not yet exist (see section on‘Neighbourhood management or strategicvision?’ later in this chapter).
Marketing social housing
Social landlords so dominate rental housing incities that a broad strategy of rehousing variedsocial groups is vital in helping cities to recover.Cohesion depends on a sense of belonging, linksbetween neighbours, support networks andinformal controls (Young and Lemos, 1997).Most people attach high importance to living in‘a good area’. These essentials become elusivewhen only the people with the least resourcesand most difficulties are rehoused together in asmall area without intensive support,particularly when there is a sense of coercionand loss of control.
The strict emphasis on rehousing tenantsaccording to need has destroyed the socialviability of much council housing and may dothe same for housing associations. It has alsoover time excluded people who might want torent and who would stay in cities if they could.
The problem of needs-based allocations asthe only access route to estates is recognisedacross the country. Our evidence shows that theresult is lettings problems in high pressure areaslike London as well as the Midlands, West andNorth (see Appendix 1).
As demand for social renting has fallen,
there is a golden opportunity to try newapproaches. Active marketing of good quality,relatively cheap housing attracts a broaderrange of applicants than are currentlyconsidered eligible (GLC, 1979). It will makedifficult to let but good condition areas morepopular as long as many other external andlocal supports are in place. This approach wassuccessful in the 1980s in some of the mostdifficult estates (Power, 1984, 1991b). It isunlikely to attract more than a few affluentapplicants. But about half the population shouldbe eligible on a broader definition of need.
Access can be organised on continental linesto help ensure a greater social mix. In Denmark,anyone who wants to can apply for socialhousing and a strong mixture is encouraged inorder to retain public support and prevent‘ghettos’ of poor people. A quarter of lettings goto emergencies. In Germany, a majority rent;about 60 per cent of the population is eligible for‘social’ housing, a loose term for all subsidisedhousing. In France, some social housing istargeted at acute need, but a majority is formoderate income households looking for ahome, a very general interpretation of need(Power, 1993). In Holland, all social lettings areadvertised to ensure broad access on theassumption that many people want anaffordable home in cities near work. Manchesteris currently advertising widely for its wholestock. Within steeply declining neighbourhoods,advertising among relatives, friends and othersconnected with the area is often a crucial firststep. Some previously unpopular tower blocksin the neighbourhoods have been successfullyfilled through advertising coupled with specialsecurity and screening measures.
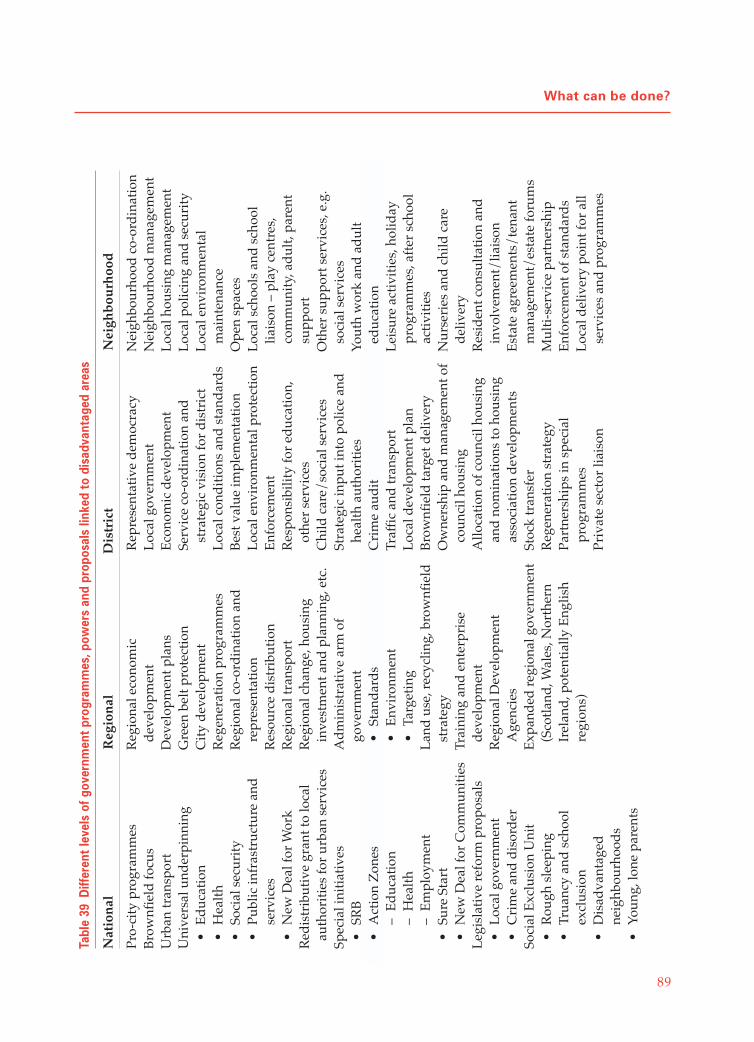
89
What can be done?
Pro-
city
pro
gram
mes
Bro
wnf
ield
focu
sU
rban
tran
spor
tU
nive
rsal
und
erpi
nnin
g•
Ed
ucat
ion
•H
ealt
h•
Soci
al s
ecur
ity
•Pu
blic
infr
astr
uctu
re a
ndse
rvic
es•
New
Dea
l for
Wor
kR
edis
trib
utiv
e gr
ant t
o lo
cal
auth
orit
ies
for
urba
n se
rvic
esSp
ecia
l ini
tiat
ives
•SR
B•
Act
ion
Zon
es–
Ed
ucat
ion
–H
ealt
h–
Em
ploy
men
t•
Sure
Sta
rt•
New
Dea
l for
Com
mun
itie
sL
egis
lati
ve r
efor
m p
ropo
sals
•L
ocal
gov
ernm
ent
•C
rim
e an
d d
isor
der
Soci
al E
xclu
sion
Uni
t•
Rou
gh s
leep
ing
•Tr
uanc
y an
d s
choo
lex
clus
ion
•D
isad
vant
aged
neig
hbou
rhoo
ds
•Yo
ung,
lone
par
ents
Reg
iona
l eco
nom
icd
evel
opm
ent
Dev
elop
men
t pla
nsG
reen
bel
t pro
tect
ion
Cit
y d
evel
opm
ent
Reg
ener
atio
n pr
ogra
mm
esR
egio
nal c
o-or
din
atio
n an
dre
pres
enta
tion
Res
ourc
e d
istr
ibut
ion
Reg
iona
l tra
nspo
rtR
egio
nal c
hang
e, h
ousi
ngin
vest
men
t and
pla
nnin
g, e
tc.
Ad
min
istr
ativ
e ar
m o
fgo
vern
men
t•
Stan
dar
ds
•E
nvir
onm
ent
•Ta
rget
ing
Lan
d u
se, r
ecyc
ling,
bro
wnf
ield
stra
tegy
Trai
ning
and
ent
erpr
ise
dev
elop
men
tR
egio
nal D
evel
opm
ent
Age
ncie
sE
xpan
ded
reg
iona
l gov
ernm
ent
(Sco
tlan
d, W
ales
, Nor
ther
nIr
elan
d, p
oten
tial
ly E
nglis
hre
gion
s)
Rep
rese
ntat
ive
dem
ocra
cyL
ocal
gov
ernm
ent
Eco
nom
ic d
evel
opm
ent
Serv
ice
co-o
rdin
atio
n an
dst
rate
gic
visi
on fo
r d
istr
ict
Loc
al c
ond
itio
ns a
nd s
tand
ard
sB
est v
alue
impl
emen
tati
onL
ocal
env
iron
men
tal p
rote
ctio
nE
nfor
cem
ent
Res
pons
ibili
ty fo
r ed
ucat
ion,
othe
r se
rvic
esC
hild
car
e/so
cial
ser
vice
sSt
rate
gic
inpu
t int
o po
lice
and
heal
th a
utho
riti
esC
rim
e au
dit
Traf
fic
and
tran
spor
tL
ocal
dev
elop
men
t pla
nB
row
nfie
ld ta
rget
del
iver
yO
wne
rshi
p an
d m
anag
emen
t of
coun
cil h
ousi
ngA
lloca
tion
of c
ounc
il ho
usin
gan
d n
omin
atio
ns to
hou
sing
asso
ciat
ion
dev
elop
men
tsSt
ock
tran
sfer
Reg
ener
atio
n st
rate
gyPa
rtne
rshi
ps in
spe
cial
prog
ram
mes
Priv
ate
sect
or li
aiso
n
Nei
ghbo
urho
od c
o-or
din
atio
nN
eigh
bour
hood
man
agem
ent
Loc
al h
ousi
ng m
anag
emen
tL
ocal
pol
icin
g an
d s
ecur
ity
Loc
al e
nvir
onm
enta
lm
aint
enan
ceO
pen
spac
esL
ocal
sch
ools
and
sch
ool
liais
on –
pla
y ce
ntre
s,co
mm
unit
y, a
dul
t, pa
rent
supp
ort
Oth
er s
uppo
rt s
ervi
ces,
e.g
.so
cial
ser
vice
sYo
uth
wor
k an
d a
dul
ted
ucat
ion
Lei
sure
act
ivit
ies,
hol
iday
prog
ram
mes
, aft
er s
choo
lac
tivi
ties
Nur
seri
es a
nd c
hild
car
ed
eliv
ery
Res
iden
t con
sult
atio
n an
din
volv
emen
t/lia
ison
Est
ate
agre
emen
ts/
tena
ntm
anag
emen
t/es
tate
foru
ms
Mul
ti-s
ervi
ce p
artn
ersh
ipE
nfor
cem
ent o
f sta
ndar
ds
Loc
al d
eliv
ery
poin
t for
all
serv
ices
and
pro
gram
mes
Tab
le 3
9D
iffe
ren
t le
ve
ls o
f g
ov
er n
me
nt
pro
gra
mm
es,
po
we
rs a
nd
pr o
po
sals
lin
ke
d t
o d
isa
dv
an
tag
ed
ar e
as
Nat
ion
alR
egio
nal
Dis
tric
tN
eigh
bou
rhoo
d

90
The slow death of great cities?
Polic
y A
ctio
n Te
ams
add
ress
ing
dis
adva
ntag
ed a
reas
Pres
sure
s on
per
form
ance
•B
est v
alue
•A
udit
com
mis
sion
regu
lati
on/
insp
ecti
onE
nvir
onm
enta
l age
nda
Loc
al A
gend
a 21
Fron
t lin
e fo
r lo
cal g
over
nmen
tin
itia
tive
sZ
ones
Cri
me
prev
enti
onPr
o-ci
ty a
nd p
ro-
neig
hbou
rhoo
d p
lans
Ant
i-po
vert
y an
d in
clus
ion
Loc
al c
onsu
ltat
ion
Nei
ghbo
urho
od in
itia
tive
s
Geo
grap
hica
l loc
atio
n fo
rm
ost s
peci
al in
itia
tive
sTa
rget
ing
mec
hani
smN
eigh
bour
hood
and
com
mun
ity
plan
sL
ocal
reg
ener
atio
n in
itia
tive
s
Tab
le 3
9D
iffe
ren
t le
ve
ls o
f g
ov
er n
me
nt
pro
gra
mm
es,
po
we
rs a
nd
pr o
po
sals
lin
ke
d t
o d
isa
dv
an
tag
ed
ar e
as
(co
nti
nu
ed
)
Nat
ion
alR
egio
nal
Dis
tric
tN
eigh
bou
rhoo
d
Not
e: M
any
of th
ese
prop
osal
s ar
e no
t yet
rea
dy
for
impl
emen
tati
on, p
arti
cula
rly
at n
eigh
bour
hood
leve
l.
Polic
e an
d h
ealt
h au
thor
itie
s(o
ften
org
anis
ed a
bove
loca
lau
thor
ity
leve
l)

91
What can be done?
An obvious argument against open lettingsis that they might create more homelessness.Squeezing needy households, however, in theeyes of potential and existing residents, raisesthe value of social housing which is aprerequisite for making estates work.
It is possible to reserve up to half of newlettings for social housing for emergencies inorder to prevent homelessness whilst the restcan be let through a constantly updated, opendate order queue without the discretion,discrimination and sense of coercion thatattaches to ‘merit’ systems, such as points. Thisapproach was recommended 30 years ago in thegovernment review of council housingallocations by Cullingworth, but was neverimplemented, a tragedy of short-sightednessfrom which council housing never recovered(Cullingworth, 1969). Cullingworth’s committeestressed fairness, equal access, an open systemand the avoidance of ghettos.
Mechanisms are necessary to ensure accessto better property for lower income householdsand to prevent higher income groups benefitingfrom windfall gains. Restrictions would benecessary to prevent Right to Buy profiteering,inherited secure tenancies and unfair priorityfor the most sought after properties. Table 40outlines some positive and negative lettingsmechanisms.
A second argument is that the governmentshould not subsidise better-off tenants to live inlow rent council homes. But the counter-argument is that working rent payers will helpto keep up the value and viability of socialhousing. More housing demand will createmore competition, and put different pressureson landlords and tenants. But some householdsin work have been unnecessarily put off renting,
and social renting in particular, creating widerpressures and costs exemplified by urbansprawl. The positive effects may far outweighthe negative and the alternative of allowingareas of exclusively low income housing to beprogressively abandoned, even by needyhouseholds, is the most damaging andexpensive option of all. This is happeningnationwide (Power and Mumford report to theHousing Corporation, 1999).
Allocating housing without choice to thepoorest people fits uneasily with modern urbansociety. It creates a high refusal anddissatisfaction rate. Restrictive, narrowly needs-based allocations, particularly one offer only tohomeless families, causes an increase in refusalsand a higher level of empty property. Thisapproach has been most damaging in largeflatted estates. The level of empty property insome London boroughs has been exceptionallyhigh because of this failure (Power and Tunstall,1997). Less precarious tenants are needed tocreate more mixed, stable estates. There is thespace in less popular areas to do it, but socialhousing generally should be opened up in orderto ensure its long-term survival. Table 41suggests some measures to make this work.
Nothing could be more costly than socialghettos as the US experience has demonstrated.They drive away more affluent populationsleaving the poorest, most discriminated againstpeople marooned in a sea of dereliction (HUD,1997; Vergara, 1997). If opening up allocationscreates more demand for social housing, thennew styles of affordable housing and multipleaccess routes will have to be invented.
Some people argue that the notion of ‘social’housing itself should be abandoned and weshould create a more diverse ‘regulated rented

92
The slow death of great cities?
sector’. This implies the continued transfer ofcouncil housing to ‘registered social landlords’to encourage more diversity, investment,resident commitment and businessmanagement. An obvious first step is to movehousing ownership and management out of thepolitical arena, so that all landlords have anincentive to run their housing as a long-termasset (DETR, 1998e).
Regeneration
Targeting ‘worst first’ is normal regenerationpractice because the worst areas blightsurroundings, destroying urban environmentsand reputations. Some areas may eventuallybecome redundant and demolition becomesinevitable, but this has to happen within abroader strategy of holding conditions in
One offer only policiesHomelessness as dominant access routeOpaque points systemNo clear position in queueNo guarantee of reaching top of any listMember interventions and special pleadingLack of internal transfersUnaccompanied viewingsPoor cleaning and redecorating of property on
offerLack of local ‘settling’ supportNo clear control over impact of lettings on
specific areas
Open waiting list and letting proceduresAll lettings advertisedBroad eligibility, e.g. below average incomeChecks on basic eligibility and suitabilityDate order queueTransparent priority access for emergenciesTarget lettings for clear priorities, e.g. statutory
homelessClear, simple definition of needCareful management of lettings in precarious
areasNo Right to Buy for new tenants in high
demand areasPayment of nominal administration fee (similar
to college applications)Automatic annual update deleting non-
respondentsDiscretionary restrictions to prevent abuseSpecial support mechanisms for rehousing
vulnerable familiesSpecial housing provisions for special needs
householdsOpen transfer system in date order queuingSimple eligibility requirements for transfer of
clean rent record and property conditionsLocal control over matching of applicant and
dwellingPersonalised introduction to tenancyClear, simple tenancy conditionsSettling in via local office, super-caretaking
Table 40 Lettings approaches
Damaging lettings approaches Ingredients of open access to social housing

93
What can be done?
precarious areas. This means planning andspreading capital investment, repair andenvironmental care across inner cities, not justwithin short-term regeneration programmes.Recognition of long-term needs is provokingstock transfer plans in many cities. These nowplay a growing part in regeneration (DETR,1998c).
Regeneration can work only in the context ofwinning back more people in work and withhigher skills – they are essential toneighbourhood vitality, entrepreneurship andinvestment. The need for local services to meettheir aspirations in turn generates mixed uses.Work then begins to find its way into thepattern of neighbourhood recovery. The
transitions of the post-industrial era are alreadycreating many new style jobs which lowerskilled people can do (Sassen, 1998).
The quayside developments in Newcastleand the canalside warehouse conversions inManchester, levered into existence withregeneration funds, demonstrate this new urbanapproach (DoE, 1997). It is unlikely to be truethat lower income households are excludedfrom the benefits of these developments, butproactive local and national governments helpensure inclusion.
Crucial to the success of regeneration isdeveloping basic skills and capacity buildingamong local residents. Most regenerationprogrammes recognise this (DETR, 1998c,
Table 41 Landlord mechanisms for retaining residents and attracting incomers in low demand areas
Management mechanisms Linking with residents
Careful management of allocations– Relaxed approach to transfers within area– Support for rehousing relatives and locally
connected applicants– Resident liaison
Systematic consultation over problems andpriorities– Constantly adapting actions– Constant feedback on progress– Priorities in liaison with residents– Local improvement budgets
Special initiatives with partners– To engage and involve young people– To build skills and generate jobs particularly
among younger residents– To support families in difficulty– To integrate different groups
Gradual improvements and upgrading– Medium- and long-term plan for overall
rescue– Neighbourhood management– Revenue resources
Strong local presenceWell motivated, supervised local staff – at least
one per 100 rented dwellingsImmediate action on basic conditions – cleaning,
repair, wear and tearConsistent legal enforcements against criminal
activityMeticulous attention to detail – highly localised
responsesDay to day liaison and reporting between
residents and staffSpecial management measures to support new
lettings initiatives, e.g. students, flat sharers,elderly
Links between open marketing and locallettings
Close liaison with police, education, socialservices, youth, environmental services
Intensive caretaking of large blocks, e.g. towersand general environmental care

94
The slow death of great cities?
1998d). It is a subtle and often elusive taskrequiring highly localised and sensitive inputs(Richardson, 1997).
To do all this requires a strongly led localauthority, less involved in hands-on detail, moredynamic in promoting neighbourhoods,partnerships, local regeneration companies andnew initiatives. The public landlord role may actas a barrier to fast change. Table 42 shows howsuccessful regeneration projects evolve.
Some regeneration will happen on its own inmore desirable areas but most needs pump-priming, social infrastructure andenvironmental upgrading. There is a strong linkbetween city-wide planning, resource allocationand neighbourhood action. Most importantly,the brownfields focus will work only in an evenplaying field.
Interestingly, developers are ahead of thegame – pioneering core city conversions,proposing inner renewal schemes andcapitalising on untapped demand from higherincome groups to return to the city. They rely onpro-city investment from national, regional andlocal government. In Manchester andNewcastle, developers are actively looking foropportunities within regeneration programmessuch as New Deal for Communities (NewcastleCity Council, 1998f). Lenders need to be drawnin behind this new interest in regeneration(National House-Building Council Conference,1998). Newcastle’s challenged appeal to thegovernment to build executive homes in thegreen belt may falter. The infrastructure costs tothe city are huge and developers may be willingto consider expanding outwards from thesuccessful city centre developments, as analternative to developing beyond the city’souter ring (Newcastle City Council, 1998d,
1998e, 1998f).Housing associations are heavily involved in
regeneration already as our case studies show.They can borrow to upgrade existing localauthority stock under transfer to new company-style structures. Associations have to take muchof the financial risk, alongside privatedevelopers, if they want to build new housing.But they can help to renew and diversify innerareas; particularly estates crying out forinvestment.
In spite of the emergence of ‘gatedcommunities’ in the United States, with somepale imitations in Britain, cities as well asvillages thrive on mixture. It is one of the mostattractive aspects of city life that people of manydifferent backgrounds and experiences share acommon space. Making those common spaceswork is a central role of civic society.
The government has tried many routes toregeneration over three decades. The experiencegives us clues to successful ingredients, many ofwhich are built into the new regenerationprogrammes, as Figure 9 summarises (Robson,1995; DETR, 1998c, 1998d).
Holding on to residents
Residents who have put up with so muchshould benefit from any gains of regeneration.This is central to social cohesion. Constantlydispersing communities undermines thepossibility of restoring a sense ofneighbourhood, and residents who understandhow things happen locally are a strong guide topriorities.
Holding on to long-standing residents helpsto stabilise rapidly declining areas. A cleansweep fits ill with the more successful city

95
What can be done?
Table 42 Stages in developing neighbourhood and district regeneration strategies
Overview of local, city-wide and regional problemsCommunity and political pressuresSelect target areas
Press reportsHistory of areaOfficial and local reports, meetings, Census, records
Bite-sized stepsThink the unthinkable
Target specific areasCost optionsSet out timetableDesignate pump-priming budgetIdentify troubleshooter
ResponsibilitiesWritten agreementsLeadership
Bid for cashMinimum/maximum requirementsInternal/external bidding
Options in light of resourcesBaseline plan for the neighbourhood managementAllow for variations
Functions, goals, powers, responsibilities
To fill in detailTo chase deliveryTo lead implementationTo clarify decision makingTo appoint board
Balanced representationResident involvementStrong independent chair
Identify fast, deliverable targetsConsult widely in areaRecruit local steering group
Core problems – caretaking, etc.Skills/job linksYouth/police/schoolsTraining, employment
Local informationResident input
Adjust planIntroduce new ideas
Long-term management not exitRenegotiate, reallocate, adjust resources
Identify broad problems
Collect evidence
Analyse problems and possibilities
Plan action
Negotiate partners
Identify resources
Revamp plan
Identify delivery team
Appoint ‘supremo’
Appoint board
Move to action
Focus on resident priorities
Monitor activity/spending/results
Evaluate
Extend action

96
The slow death of great cities?
neighbourhoods (Jacobs, 1970). We have arguedthat the best urban regeneration embodiesexisting assets within a new dynamism. Thiswas a main lesson from Estates on the Edge
(Power 1997). Chaotically decliningcommunities were rescued and conditionsreversed, with existing residents forming thecore of restored communities. Many specialsupports were introduced to help families in
difficulty. Manchester has introduced innovativeapproaches to this problem. An organicapproach, responding to the priorities of stableresidents, quelling their fears and meeting theirneeds, can improve conditions radically. A stilloccupied area with some slack is easier todevelop than an abandoned area where signsabound of complete collapse. Table 43 showsthis approach.
Figure 9 Essential lessons of regeneration
Strong leadership
A locally based team, withclear budgetary reponsibilityand decision-makingA long-term commitment
t o m a n a g i n g a n dsupporting the area
Focus on attractinga social mix
Creating mixeduses
Employment generationlinked to local strategies
Public–privateco-operation
Bottom-up planninginvolving residents andall other main actors
Highly visible environmentalimprovements, prioritised anddefended by local residents
Special initiatives to involveyoung people, particularly inenvironmental improvements
Developing new skillsamong residents so thatwork becomes an option
Multi-service partnershipsto draw everyone into aco-ordinated strategy

97
What can be done?
Density
In British urban history, we confused thepoverty and chaos of early urban growth withhigh density. In order to address poorconditions, we drove our cities outwards. In themass housing era, we built high-rise blocks inan attempt to reduce overcrowding, create moreopen space, cope with green belt restrictionsand objections to council housing in moreconservative suburbs (Dunleavy, 1981). Byconcentrating poverty within council estates, wecombined high rise and high need (Power,1987). This, coupled with lack of adequatecaretaking or guarding, led to rapid decay.
In practice, high quality is often associatedwith high density. Old crowdedneighbourhoods in Rome, Paris, Barcelona,Madrid, Edinburgh are sought after andsuccessful. Population density in Barcelona’sinner neighbourhoods is at least ten timeshigher than in British inner cities (Urban TaskForce, 1999a). Georgian terraces in inner
London, Glasgow and Amsterdam are very highdensity.
Higher density is making a comeback(Travers, 1998). When control over entrances iscombined with careful allocations, tower blocksprove popular, secure and relatively easy toregenerate. This is drawing public attention(Guardian, January 1999).
Smaller households and city exodus meanthat less people occupy urban space. It istherefore possible to increase the number ofhouseholds living in cities without crowdingpeople. Smaller households can be morecompactly fitted in, to generate sufficient streetlife and support services for new housing toreally work.
The Joseph Rowntree Foundation’sinnovative proposals for high density, highquality rented accommodation in central Leedsand Birmingham point to new thinking ondensities, single person housing, super-caretaking and city living (Best, 1998). The
Save, reuse and renovate all adaptable buildingsAvoid large-scale clearances wherever possible
Avoid random demolition
Involve residents in planning action
Constantly amend and adapt plans
Focus on viable communitiesWork at edges of area – boundaries with better
conditionsEncourage resident involvementMaximise local back-up services
Modify building forms and usesRespond to resident objections to demolitian
and amend plansRestrict demolition to selective blocks or small
areasAvoid blueprint, open action planning within
clear strategyPut strong leadership into overall
environmental and social planningReinforce positive resident actionBuild links to centre
Strong local managementGive signals of constant care
Table 43 Organic, incremental regeneration
Action Implication

98
The slow death of great cities?
Peabody Trust, historically associated with highdensity and intensive secure management, ispioneering new schemes following this model(Peabody Trust, 1996–98).
A secret of success in creating mixed urbancommunities is higher density. Social housingcan be built into new development invisibly, ifwe copy the Dutch example of quality designand finish. These new styles rely on choicerather than coercion (National House-BuildingCouncil Conference, 1998; Urban Splash, 1998).
High density supports services, street lifeand interchange. Low density encourages theopposite, a sense of emptiness, a lack ofinformal controls, an inadequate resource basefor essential services and a deep sense ofinsecurity. Low income makes all these thingsmuch worse. Having sufficient people tosupport shops, to fund custodial caretaking, touse public transport creates informalsupervision through street activity. But acombination of neighbourhood managementmeasures is necessary to make density work.The continental model of urban maintenance isfar stronger and more effective than Britishmodels partly as a result of higher density. Itapplies in owner occupied as well as rentedareas.
The new core city private developments inManchester and Newcastle are similarly highdensity, well serviced, environmentallyattractive, in strong demand (Manchester CityCouncil, 1998d).
Now is the time to change planningguidelines as a way of enhancing the urbanenvironment, expanding the number of peoplewe can house in cities, reintroducing front-linesupervision.
Household size and formation
Eighty-five per cent of all additional householdsover the next 20 years are projected to be singlepeople. Fifty per cent of them may needaffordable housing (Holmans, 1995).
Households are breaking up and reformingin many new ways. This generates some of theprojected smaller households, although theelderly form a large proportion of them. Butfamily break-up also creates reconstitutedhouseholds, pulling many people who becomesingle into new partnerships and cutting-backthe rate of household growth. This is oneexplanation offered in both cities for lowerhousing demand, less new household formationand higher turnover than expected. It isimportant, therefore, not to rely too heavily onprojections but to look at hard evidence of localdemand and need more directly (Keenan, 1998).
Many more single elderly people will requirehousing within reach of main services in thefuture. Cities and towns will play a big role.Inventing new housing ideas to help singlepeople feel less isolated and closer to support iscritical to social cohesion. Ensuring family-friendly cities is too.
New factors can influence behaviour. Forexample, commuting becomes less popular astraffic congestion grows. Some working mothersare opting in favour of cities to avoid long-distance commuting and loss of child contact.City centres become more attractive to somechildless households as they become morenumerous; resistance to building in thecountryside grows as more green fieldsdisappear; rebuilding inner neighbourhoodsbecomes more attractive to the private sectorunder positive urban management. Household

99
What can be done?
behaviour is already responding to some ofthese signals as John Prescott’s own response toenvironmental pressures illustrates (DETR,1998b).
Shrinking household size makes many of thehouses and flats we saw standing emptypotentially attractive to new households as longas overall environmental security, back-upservices and neighbourhood management areprovided.
Policing
To win popular support for a return to cities inthe face of deep insecurity and long-run decay,more is required than marketing, regenerationand a change in attitude. A prerequisite is a newapproach to policing.
One of the reasons for behaviouralbreakdown is the unequal policing of areas.Weak enforcement highlights this (Power andTunstall, 1997). Over decades, the policeincreasingly withdrew into patrol cars andcentral offices. On the other hand, the police areexpected to broker the ills of society withoutclear rules. In a democracy, we want it bothways – freedom to choose how we live andfreedom from the consequences.
Gradually, it is becoming clear that manylevels of control by many agencies make formore peaceful communities. Strict enforcement,clear visibility on the streets, constant links withparents, co-operation with other authorityfigures, a swift response from localorganisational bases and immediate action oversmall transgressions can stem a rising tide ofmore serious crime. These measures help tocreate a climate of confidence and security thatreinforces people’s willingness to step in.
Crucially, positive or proactive policingencourages positive community behaviour.
Many liberals dislike the notion of intensivepolicing. But, in cities of strangers – which is theessential nature of modern city neighbourhoods– the brokering of law and order by recognisedauthority figures is a prerequisite forcommunity safety and stability.
Policing difficult neighbourhoods carriesmany risks and requires skill, continuity andconsistency. Young people, particularly youngmen, react with hostility and aggression topolice intervention after they have been allowedto develop law-breaking habits. However, theytend to respect clear rules that allow them theright to be out and about within the bounds ofcivic responsibility. This is where crowdedstreets, mixed uses, high density and strongpolicing can work together. They give youthsthe right to roam and gather as they havealways done, without threatening communitysafety.
There are many models of security,guarding, policing and community safety thatwork. Some are illustrated in our report. Often,they apply to small areas for a limited timeperiod. It is a question of applying widely andcontinually across city neighbourhoods what isknown to work. The resources currently spenton crime-chasing and paper-pushing must beconverted into crime prevention through streetpolicing.
Many US cities have cut their violent crimeby adopting a visible street presence and actionagainst ‘incivilities’ (HUD, 1997). Our muchsmaller crime problems are certainly moremanageable. Making urban dwellers feel‘comfortable and not alone’ is an absolute key toregeneration.

100
The slow death of great cities?
Anti-social behaviour
As policing and security are enhanced, mostforms of behavioural breakdown will shrink inproportion. Tougher enforcement in both citiesis beginning to achieve this. But some peopleare so disturbed, so unhappy, so sick and out ofcontrol that they literally cannot help disruptingother people’s lives. Some argue that there hasbeen a fundamental erosion of our social fabric,particularly in inner cities, that many people arebeyond normal help and, left alone, can onlysurvive in a self-destructive, violent way(Davies, 1997). There may be some truth in thisfor a small minority. They must be protectedfrom self-damage and communal havoc. Someinstitutional care is essential.
Formal community care arrangements canalso work in less serious cases. Much care cancome through informal supports and ‘lighthanded’ warden-assisted homes. Theintroduction of foyers and close supervision oftower blocks are examples we found of this new,caring approach in Newcastle. In Manchester,compacts with residents’ groups are succeedingin holding the line on anti-social behaviour invery difficult areas.
The approach that always fails is housingvulnerable and unstable people within the mostprecarious neighbourhoods because there isspace. It is an easy, short-term but self-defeatinganswer that local managers must have power toresist. Preventing the rehousing of unstablepeople was found to be a key to stabilisation inestates across Europe (Power, 1997). Theextreme cases are few but far more resourcesmust be dedicated to containing and helpingthem, not within areas already overloaded withsocial problems, but in a framework of
specialised care as the government’s recentincreased support for mental health underlines(Department of Health, 1998).
The range of anti-social behaviour isfrightening – harassment, arson, drug dealing,youth gangs, burglary, fights and other crime.Once it gets out of control, it is hard to stop as itappears to generate its own momentum. It is onthis front that neighbourhoods are most likely totip over the edge. But a combination of support,supervision and guarding measures gives astrong signal that people cannot abuse theneighbourhood. Essential measures weidentified are:
• proactive policing
• custodial caretaking
• consistent enforcement
• screening of new lettings
• resident involvement in specific problems
• clear tenancy agreements
• co-operation between landlords and amulti-agency approach to problem-solving
• localised social supports
• special care and support for people withspecial needs
• family support.
Young men
Ideas about policing and behaviour breakdownunderline the problems stemming from the lossof role for many men in low income urbancommunities (Power and Tunstall, 1997). Work

101
What can be done?
patterns have changed in such a radical waythat young men with low skills often no longerknow where they fit in. They are heavy losers inthe school system and the new job market(Social Exclusion Unit, 1998). It is a vast newsocial issue that receives too little focus and isbuilding up into a longer-term problem.
Some of the trends are alarming – the loss ofmale jobs, the growth in lone parent female-headed families, the fear of youth gangs and theharassment of witnesses. In a report on the riotsin the 1990s, we explored some of these issues(Power and Tunstall, 1997). A central lessonfrom that study was that communication andlinkage can stop aggression and hostility frommounting to a point of inevitable breakdown.
The government’s emphasis on educationneeds to do more than attack bad teachers andpoorly performing schools; or help ambitiousparents choose better schools; or reduce classsizes in the overcrowded (usually over-subscribed, better performing) schools. Tough,under-performing, inner city schools are oftenwhere special efforts are needed to helpalienated, truanting and excluded boys, thechildren who start to fail on day one because oftheir environmental handicaps and never catchup. Investing more in those with greatestdifficulties is expensive; the returns areuncertain, but the failures create far-reachingsocietal problems. Friendly, well structuredsecondary schools with a strong focus on coresubjects, physical and social outlets, and parentinvolvement will help capture pupils’enthusiasm.
Many young people feel that society doesn’tvalue them, that they are failures and a burden,or worse. This provokes immense hostility inyouth which converts into aggressive attitudes
towards adults and authority. Changing‘attitude’ in youth requires confidence and theeducation of adults to deal with young peoplemore positively. The voiceless/powerless/aggressive syndrome can be reversed (Powerand Tunstall, 1997). This makes residentinvolvement, policing and local managementessential to building bridges with young people.Linking things together so young men can geton the bridge is the most difficult of all, but it isdoable.
Neighbourhood management or strategic
vision?
When an area is pressured by many societalproblems because of its position at the bottom ofthe urban hierarchy, intervention of a differentkind is needed. A new kind of neighbourhood‘supremo’, responsible for ‘booting through’decisions, resources and actions, can be thepivot of integrated regeneration (SocialExclusion Unit, 1998). By definition, theneighbourhood ‘supremo’ needs to have realauthority and a budget to act as a catalyst inchanges (Ballymun Regeneration, 1998; Gregory,1998).
The neighbourhood management idea hasemerged from several experiences.
• It became a model for turning aroundsome of the most difficult estates inBritain in the 1980s.
• The Social Exclusion Unit proposes it as away of ‘joining up’ ground level services.
• European Rescue programmes, targetedat giant peripheral estates of up to 11,000dwellings, successfully adopted this

102
The slow death of great cities?
integrated, localised approach with amanager in charge (Power, 1999).
• In Britain, around £10 million ofgovernment revenue is spent each year oneach estate of 1,000 dwellings (OECD,1991). Making this ‘work on the ground’to produce the caretaking, repairs,policing, training that estates need iselusive but crucial.
• Hands-on intensive management, pullingthe patchwork of services, initiatives andideas together, can have a dramaticimpact.
• Successful experiments involve manyservices, but housing management isoften in the lead because of thedominance of council landlords in thepoorest areas.
• It only works across small areas wherepeople identify a local interest.
• While area regeneration programmes arein train, a project manager can often playthese roles. But neighbourhoodmanagement is about long-term, notshort-term, inputs; about redirectingrevenue already in the system, not
‘special programmes’; about linkingneighbourhoods into the wider systemand developing fully a voice for localorganisations and residents.
If key urban services were organised withina framework of neighbourhood management,leading to co-ordination and supervision, someof the most intractable problems would begin toshrink. The approach needs:
• a new framework• experimentation• independence – a project structure• local authority commitment• relatively small pump-priming• strong political backing.
Figure 10 shows how neighbourhoodmanagement can provide local areas withintensive focused action linking them to thewider city. This requires external andgovernment support – the top-down approach –combined with local services, community actionand involvement – the bottom-up approach. Wecall this a patchwork model because the manysmall levers we found at work inneighbourhoods can together be made morepowerful than the sum of the parts.

103
What can be done?
Figure 10 Patchwork model of neighbourhood change
Top-down Local – linked – long-term Bottom-up
Neighbourhood catalyst/‘supremo‘
ImpactResources to ground level Action on the spotHigh visibility Eyes on the problemDirect communication Community bridgesLocal supervision Multiplication of activityLocal decisions Swift enforcement
GovernmentFundingPolicy frameworkPolitical leadershipCo-ordination/oversight/linkage/integration/standards/enforcementEvaluation
LandlordFinancial managementResident consultationUpgradingRepairs/maintenanceLettings/marketingGuarding/securityLiaison with other services
Other local servicesSchoolsHealthPoliceShops and businessesTransportChurchesVoluntary bodies
Community actionCommunity centresClubs and cafesYouth supportFamily supportMinority initiativesTraining programmesSecurity
Estate focusReinvestmentCity links
Neighbourhood budgetLocal team‘New management’
Local basesLocal co-ordinationExternal support
Consultation/communicationRepresentation/organisationAccess – supportInput – control
RequirementsGovernment interventionLocal political leadershipStrong local leadershipLinks to cityDevolution of power
Delivery mechanismsOrganisationAreaMulti-faceted serviceInter-service co-operation
TechniquesMixed usesVaried lettingsActive marketingStrong supervisionResident involvementProblem-solving drive
Source: Power, 1997.
Area organisationMulti-faceted serviceInter-service co-operationHands-on presence

104
14 Conclusion
This report documents an unexpecteddevelopment in English cities. In spite ofvirtually continuous housing shortages fromWorld War II to the mid-1970s, particularly inlow income, urban communities, there is nowclear evidence of housing abandonment withincities. This threatens and undermines theviability of the cities themselves and thesurvival of the neighbourhoods most affected.We studied the problem in detail in the North,but we gathered evidence of low demand forhousing in neighbourhoods nationwide. Theproblem was most extensive in council estates.This development is occurring despite a largepredicted growth in households and the arguedneed to build on greenfields.
The efforts to restore and regenerate innerneighbourhoods help to hold conditions andsupport remaining residents, but they have notyet reversed the outward flow of populationsand jobs. Many historic factors had contributed:
• Britain’s long industrial decline andeconomic restructuring leading to chronicunemployment and skill mismatch in cities
• Britain’s interventionist slum clearanceand mass council building programmesleading to the dominance of large, poorestates in inner cities
• long-term support for low-density,suburban owner occupation fuellingconstant flight of higher earners.
Once a city exodus has gathered momentum,the most disadvantaged neighbourhoods at thebottom suffer disproportionate losses. This isoften coupled with high demand in morepopular areas.
The critical driving factors leading to actualabandonment are:
• the history and reputation of an area thatdeters ambitious newcomers
• the decayed environment
• easy access to better housing in betterneighbourhoods
• the management problems facing localauthorities
• the failure of mainstream services at thebottom
• the gradual breakdown of social stabilityleading to anti-social behaviour, crimeand fear.
There is real potential for repopulating innerareas based on a shift in approach.
• We can build on the positive measuresalready in train.
• We need to reinforce our universalsupports such as education, police andhealth, while targeting precarious areaswith additional help.
• We need to market social housing to awide band of the population to raise itsvalue and increase demand.
• We need private owners to be involved inmaintaining property and conditions.
• Regeneration projects can attract ‘urbanpioneers’ back into centre cities andgradually spread into the increasinglyempty inner neighbourhoods.
• It is central to encourage existingresidents to stay and rebuild conditionsas they provide an anchor for city rebirth.
• City densities need to be high to supportservices and create the street life thatmakes urban neighbourhoods attractive.

105
Conclusion
• We need to fit in many more smallhouseholds to redensify our cities.
• Proactive policing can help to restoreconfidence, contain violence and reducefear.
• Policing requires many channels ofcommunications, local supports, clearground rules and strong communitylinks.
• In the end, urban neighbourhoods needan over-arching structure for managingconditions and orchestrating the constantchanges.
Table 44 illustrates the tension between steepdecline and renewal.
Many different approaches and initiativeswork for neighbourhoods in trouble and manydifferent buttresses are in place to sustain theweb of interactions that keep communities alive.But national, regional, local authority andneighbourhood initiatives must link together ina continuous chain. Universal underpinningworks only to the extent that the poorest peopleand most disadvantaged areas receive special
help. ‘Being relentless’ and ‘Doing it all’ is thepromise of the new government.
It is not inevitable that inner city areas willcontinue to lose people, control and viability. Itis possible to make cities work. It is essential tothe future of our environment, our communitiesand our crowded country that we invest more insaving what is clearly a huge but wasting asset.We must not leave inner city neighbourhoods injeopardy. The ideas which this work stimulatedare shown in Table 45.
Cities work through multiple enterprises,diverse households and communities. Stoppingthe spread of large urban poverty belts, as hashappened in the US, is central to city growth,change and recovery (HUD, 1997; Jargowsky1997). The neighbourhoods where we witnessedsuch acute decline may become the urbancentres of tomorrow. They offer many assets:proximity; infrastructure; environmentalpotential; stable enclaves of residents holdingon for a better future. It should not be beyondthe wit and energy of our still highly urban, cityfocused society to lever in a new and bettercentury for our cities.
Economic and societal shiftsSkewed city populationsSkewed city tenure structure
Strong polarisationRapid decay of inner city neighbourhoodsGrowth in anti-social behaviourCrime, violenceFear and insecurityLoss of cohesion and purposeIncipient abandonment and demolition
Table 44 Current tensions in neighbourhood change
Threat – abandonment Potential – renaissance
Intrinsic, undervalued assetsCommunity and civic leadershipFight-back, defending and developing city
programmesReinvestment and rescueRegeneration programmesBreak-up of large council estates, open accessTransfer to new social landlordsCity centre renewal and reclamationNew urban pioneersPeople-based approaches

106
The slow death of great cities?
Table 45 Ideas for government action arising from the study
National Regional District Neighbourhood
Increase densityguidelines
Facilitate brownfieldinvestment
Pass true cost ofgreenfielddevelopment todevelopers
Develop urbantransport
Monitor demolitionsand reduceincentives
Proactively encouragetenure diversification
Open up the allocationof social housing
Identify and ring fencerevenue streams forlocal programmes
Target high demandregions for newhousing
Equalise incentives forrenovation with newbuild
Incentivise honesty inprogrammeproposals andmonitoring
Support incrementalorganic development
Promote new ideas,structures
Push mixed uses,mixed incomes
Target inner andcentre city regrowth
Develop pro-citystance
Propose brownfieldplan
Intensifyenvironmentalagenda
Target worst first inparallel with generalsupport
Target economicdevelopment, jobs
Link services andinitiatives
Focus on majorproblem areas
Develop localenvironmental planincluding brownfieldplan
Set environmentalguidelines
Develop specialsupports for familiesin difficulty
Advertise/marketsocial housing
Push tenure diversityCreate arm’s length
non-profit landlordson continental modelto take on councilhousing
Developneighbourhoodmanagement
Identify local revenuebudgets
Decentralise decisionsand control
Help train residentactivists
Support communitydevelopment
Promote proactivepolicing
Push training,investment
Cut procedures andbureaucracy
Create neighbourhood‘supremo’ to deliverneighbourhoodmanagement
Develop proposals forlocal housingcompanies toencourage investment
Develop local policepresence and liaison
Collaborate withresidents in all localinitiatives
Create small seed-corngrant fund to supportnew ideas andcontinue supportingexisting successfulprojects
Target local budgets onlocal areas withdevolved structuresand decision-making
Develop communityplans, communitycompacts, localenvironment actionplans
Screen lettings to allareas of concentrateddisadvantage
Use local budgets togenerate local jobs
Introduce super-caretaking
Involve schools incommunity
Engage health visitors
Note: Tables 38 and 39 show the initiatives, policies and proposals already in train.

107
Atkinson, R. and Kintrea, K. (1998) Reconnecting
Excluded Communities: The Neighbourhood Impacts
of Owner Occupation. Edinburgh: Scottish Homes
Audit Commission (1989) Urban Regeneration
and Economic Development: The Local Government
Dimension. London: HMSO
Ballymun Regeneration (1998) The Master Plan
for Ballymun. Dublin: Ballymun Regeneration
Best, R. (1998) Presentation to the Urban TaskForce, Manchester, June
Blunkett, D. (1998) ‘Launch of Education ActionZones’, DfEE press release, 23 June
Bramley, G. (1998) ‘Housing abandonment inthe English inner city: housing surpluses andhousing need’, paper presented at conference,University of York, July
Briggs, A. (1983) A Social History of England.Harmondsworth: Penguin Books
Burbidge, M. (1992) Internal report onScandinavian estate based services, DoE
Burbidge, M. et al. (1981) An Investigation of
Difficult to Let Housing. London: DoE
Burchardt, T. and Hills, J. (1998) Financial
Services and Social Exclusion. Insurance Trends:Quarterly Statistics and Research Review.London: Association of British Insurers
Burnett, J. (1978) A Social History of Housing
1815–1970. Newton Abbott: David and Charles
Burns, W. (1963) New Towns for Old: The
Technique of Urban Renewal. London: LeonardHill
References
Burrows, R. (1997) Contemporary Patterns of
Residential Mobility in Relation to Social Housing
in England. York: Centre for Housing Policy
Burrows, R. and Rhodes, D. (1998) Unpopular
Places? Area Disadvantage and the Geography of
Misery in England. Bristol: The Policy Press
Caisse des Depots (1998) Seminar at LSE, 23November
Carley, M. and Kirk, K. (1998) Sustainable by
2020? A Strategic Approach to Urban Regeneration
for Britain’s Cities. Bristol: The Policy Press, withJoseph Rowntree Foundation
CASE (1998) Report to ESRC Conference onSocial Exclusion, 2 December
Catholic Education Service (1997) ‘A struggle forexcellence: Catholic secondary schools in urbanpoverty areas’, report prepared by theCommittee for Community Relations of theBishops’ Conference of England and Wales
Central Statistical Office (1998) Regional Trends.London: HMSO
CHAC (Housing Management Sub-Committeeof the Central Housing Advisory Committee ofthe Ministry of Housing and Local Government)(1939) Management of Municipal Housing Estates:
First Report. London: HMSO
CHAC (1945) Management of Municipal Housing
Estates: Second Report. London: HMSO
CHAC (1949) Selection of Tenants and Transfers
and Exchanges: Third Report. London: HMSO
CHAC (1953a) Living in Flats. London: HMSO
CHAC (1953b) Transfers, Exchange and Rents:
Fourth Report. London: HMSO

108
The slow death of great cities?
CHAC (1955a) Residential Qualifications: Fifth
Report. London: HMSO
CHAC (1955b) Unsatisfactory Tenants: Sixth
Report. London: HMSO
CHAC (1956) Moving from the Slums: Seventh
Report. London: HMSO
CHAC (1959) Councils and their Houses: Eighth
Report. London: HMSO
CHAC (1961) Homes for Today and Tomorrow
(Parker Morris Report). London: HMSO
CHAC (1969) Council Housing, Purposes,
Procedures and Priorities: Ninth Report
(Cullingworth Report). London:HMSO
Chartered Institute of Housing (CIoH) (1998)Low Demand for Housing Discussion Paper.Coventry: CIoH
Cole, I. and Shayer, S. (1998) Beyond Housing
Investment: Regeneration, Sustainability and the
Role of Housing Associations. Sheffield: Centre forRegional Economic and Social Research,Sheffield Hallam University
Community Development Project (1976)Whatever Happened to Council Housing? London:Community Development Project Informationand Intelligence Unit
Community Group Report1 (1996) Tenants’survey results, November 1996
Council Report (1998) Report on new housebuilding programme to Regeneration Board, 21September
CPRE (1998) Urban Exodus, a report for CPREprepared by T. Champion et al. London: CPRE
Crook, A.D.H., Darke, R.A. and Disson, J.S.(1996) A New Lease of Life? Housing Association
Investment on Local Authority Housing Estates.Bristol: The Policy Press
Crossman, R. (1975) The Diaries of a Cabinet
Minister, Vol. I. London: Hamish Hamilton andJonathan Cape
Cullingworth, B. (1969) Housing and Labour
Mobility: A Preliminary Report. Paris: OECD
Davies, N. (1997) Dark Heart: The Shocking Truth
about Hidden Britain. London: Chatto andWindus Ltd
Daunton, M.J. (1987) A Property Owning
Democracy? Housing in Britain. London: Faber
DETR (1997a) Monitoring information ondemolitions
DETR (1997b) Housing, Family and Working Lives.Coventry: HMSO
DETR (1998a) 1998 Index of Local Deprivation.London: DETR
DETR (1998b) Planning for the Communities of the
Future. London: HMSO
DETR (1998c) What Works – Learning the Lessons:
Final Evaluation of City Challenge. London: DETR
DETR (1998d) Evaluation of the Single
Regeneration Budget Challenge Fund – A
Partnership for Regeneration: An Interim
Evaluation. London: DETR
DETR (1998e) Consultation Paper A New Financial
Framework for Local Authority Housing: Resource
Accounting in the Housing Revenue Account.London: DETR

109
References
DoE (1974) ‘Difficult to let’, unpublished reportof postal survey
DoE (1977) Inner Area Studies. London: DoE
DoE (1981a) Difficult to Let Investigation. London:DoE
DoE (1981b) Report of visit to Newcastle forPEP
DoE (1996) Urban Trends in England: Latest
Evidence from the 1991 Census. London: HMSO
DoE (1997) Mapping Local Authority Estates Using
the Index of Local Conditions. London: DoE
Department of Health (1998) Press statement onadditional funding for mental health, 10December
Donnison, D. and Middleton, A. (1987)Regenerating the Inner City: Glasgow’s Experience.London: Routledge and Kegan Paul
Downes, D. (ed.) (1989) Crime and the City:
Essays in Memory of John Barron Mays. London:Macmillan
Dunleavy, P. (1981) The Politics of Mass Housing
in Britain 1945–75. Oxford: Clarendon Press
(The) Economist (1998) Economist series on Britishcities, August
Ferris, J. (1972) Participation in Urban Planning –
the Barnsbury Case. Occasional Papers on SocialAdministration (No. 46). London: G. Bell & Sons
Fielder, S. and Smith, R. (1996) Vacant Dwellings
in the Private Sector. London: DoE
Fletcher, A. (1995) Homes Still Wasted. London:Empty Homes Agency
Foot, M. (1973) Aneurin Bevan: A Biography, Vol.
II 1945–1960. London: Davis-Poynter
Forrest, R. and Murie, A. (1988) Selling the
Welfare State: The Privatisation of Public Housing.London: Routledge
Gauldie, E. (1979) Cruel Habitations: A History of
Working-Class Housing, 1780–1918. London:Allen & Unwin
Giddens, A. (1993) The Consequences of Modernity.Cambridge: Policy Press
Gladwell, M. (1996) ‘The tipping point’, New
Yorker, 3 June
Glasgow District Council (Housing) (1986)Inquiry into Housing in Glasgow. Glasgow: CityPress
Glennerster, H. and Hills, J. (1998) The State of
Welfare: The Economics of Social Spending. Oxford:OUP
Greater London Council (GLC) (1979) HousingCommittee minutes, GLC
Gregg, P. (forthcoming) Report of Treasuryseminar on social exclusion
Gregory, S. (1998) Transforming Local Services:
Partnership in Action. York: JRF
(The) Guardian (1999) ‘The joy of tower blocks:electronic eyes turn seedy flats into des res’,6 January
Habitat (1996) An Urbanising World. Oxford:OUP for the United Nations Office on HumanSettlements
Hackney Borough Council (1992) The EstateAction Form B submissions, August

110
The slow death of great cities?
Hall, P. (1989) London 2001. London: UnwinHyman
Hall, P. (1990) Cities of Tomorrow: An Intellectual
History of Urban Planning and Design in the
Twentieth Century. Oxford: Blackwell
Hall, P. and Ward, C. (1998) Sociable Cities: The
Legacy of Ebenezer Howard. New York: J. Wiley
Halsey, A.H. (ed.) (1988) British Social Trends
since 1900 – A Guide to the Changing Social
Structure of Britain. Coventry: HMSO
Hamilton, R. (ed.) (1976) Street by Street.London: North Islington Housing RightsProjects
Hills, J. (1998) Thatcherism, New Labour and the
Welfare State. CASEpaper 13. London: CASE
Hobcraft, J. (1998) Intergenerational and Life-
course Transmission of Social Exclusion: Influences
of Childhood Poverty, Family Disruption and
Contact with the Police. CASEpaper 15. London:CASE
Holland, Sir Milner (Chairman) (1965) Report of
the Committee on Housing in Greater London.Cmnd 2605. London: HMSO
Holmans, A.E. (1987) Housing Policy in Britain.London: Croom Helm
Holmans, A.E. (1995) Housing Demand and Need
in England 1991–2011. York: JRF
Home Office (1993–97) Criminal Statistics
England and Wales. London: HMSO
Hough, M. and Tilley, N. (1998) Getting the
Grease to the Squeak: Research Lessons for Crime
Prevention. London: Home Office, Police PolicyDirectorate
House of Commons (1998) A Brown and Pleasant
Land: Household Growth and Brownfield Sites.Report 117. London: Parliamentary Office ofScience and Technology
Housing Corporation (1997) Registered Social
Landlords in 1996: General Report. London: HC
Housing Services Advisory Group (HSAG)(1978) Organising a Comprehensive Housing
Service. London: DoE
HUD (1997) The State of Cities. Washington:HUD
Hughes, J.W. and Sternlieb, G. (1987) The
dynamics of American Housing. New Brunswicks,NJ: Rutgers
Hunt, R. and Kullberg, J. (1998) ‘Dutch courage:advertising social housing in Britain’, Housing
Agenda, May
Huttman, E. and van Vliet, W. (1988) Handbook
of Housing and the Built Environment. New York:Greenwood Press
Islington Borough Council (1976) Estate Action
Programmes on Unpopular Estates. London:Islington Council
Jacobs, J. (1970) The Death and Life of Great
American Cities. London: Cape
Jargowsky, P. (1997) Poverty and Place: Ghettos,
Barrios, and the American city. New York: RussellSage Foundation
Joseph Rowntree Foundation (1995) JRF InquiryGroup on Income and Wealth
Joseph Rowntree Foundation (1998a)Foundations – Regenerating Neighbourhoods:
Creating Integrated and Sustainable Improvements.York: JRF

111
References
Joseph Rowntree Foundation (1998b) Findings –
Patterns of Neighbourhood Dissatisfaction. York:JRF
Keenan, P. (1998) ‘Housing abandonment anddemand’, paper presented at conference atUniversity of York, July
Kiernan, K. (1997) The Legacy of Parental Divorce:
Social, Economic and Demographic Experiences in
Adulthood. CASEpaper 1. London: CASE
Konttinen, S. (1983) Byker. London: JonathanCape
Maclennan, D. (1991) Paper on A Strategic
Approach to Cities. Edinburgh: OECD
Maclennnan, D. (1997) ‘Britain’s cities: a morepositive future’, Lunar Society lecture,November
Malpass, P. and Means, R. (eds) (1993)Implementing Housing Policy. Buckingham: OpenUniversity Press
Malpass, P. and Murie, A. (1994) Housing Policy
and Practice. Basingstoke: Macmillan
Manchester and Newcastle (1998) Interviewswith chief executives and directors of housing,September–October
Manchester City Council (1993) Manchester1991 Census Ward Profiles
Manchester City Council (1996) ‘Rehousingdemand: report to Housing and EnvironmentalServices Committee’, 30 May
Manchester City Council (1997a) Manchester
Matters: Economic, Unemployment and Welfare
Benefits Bulletin, Summer
Manchester City Council (1997b)Neighbourhood renewal assessment1
Manchester City Council (1998a) Manchester’s1996 Local Census
Manchester City Council (1998b) New housebuilding programme, report to RegenerationBoard1, September
Manchester City Council (1998c) Council reporton neighbourhood options1, October
Manchester City Council (1998d) Report onurban village in Ancoates Manchester
Manchester City Council (1998e) Observationsto Joseph Rowntree advisory committee, 1December
Manchester City Council (1998f) Evidence fromLow Demand Team, December
Marris, R. (1996) How to Save the Underclass.Basingstoke: Macmillan
Modood, T., Berthoud, R., Lakey, J., Nazroo, J.,Smith, P., Virdee, S. and Beishon, S. (1998) Ethnic
Minorities in Britain: Diversity and Disadvantage.London: Policy Studies Institute
National House-Building Council Conference(1998) ‘Sustainable housing – meeting thechallenge’, 11 September
NCHA (1998) Thinking the Unthinkable:
Delivering Sustainability in the North. Chester leStreet: NCHA
Newcastle and Manchester (1998) Statistics onRight to Buy sales supplied by City Councils
Newcastle City Council (1993) Newcastle CityProfiles: results from the 1991 Census

112
The slow death of great cities?
Newcastle City Council (1994) Biennialresidents’ survey
Newcastle City Council (1997) Newcastle CityProfiles: results from the 1996 Inter CensalSurvey
Newcastle City Council (1998a) Internalproposals on combating social exclusion
Newcastle City Council (1998b) Tour withsenior council officer, 12 November
Newcastle City Council (1998c) UnitaryDevelopment Plan
Newcastle City Council (1998d) ‘A practicalexperience of building on the green belt’, paperpresented to the National Housing and TownPlanning Conference, Carlisle, 14–16 July
Newcastle City Council (1998e) Report toHousing and Development Committees onindustrial development opportunities
Newcastle City Council (1998f) Annual Reviewof Housing Development and Land Availability,report to Housing Committee, November
Northumbria Police (1998) Statistics supplied onlocal crime rates
OECD (1991) Seminar on liveable cities,Edinburgh, October
ONS (1990 and 1991) Labour Force Survey/Great
Britain. London: ONS
ONS, DoE/Green, H. (1996) Housing in England
1994/95. A report of the 1994/95 Survey ofEnglish Housing carried out by the SocialSurvey Division of ONS on behalf of the DoE/Hazel Green. London: HMSO
ONS (1997) Social Trends. London: HMSO
ONS (1998) Mid Census population projectionsreported in The Guardian, 8 December
OPCS (1984) 1981 Census (Ward and Civil Parish
Monitors). London: OPCS
OPCS (1992) Census 1991: Definitions: Great
Britain. London: HMSO
OPCS (1994) 1991 Census (Ward and Civil Parish
Monitors). London: OPCS
Pacione, M. (ed.) (1997) Britain’s Cities:
Geographies of Division in Urban Britain. London:Routledge
Pawson, H., Kearns, A., Keoghan, M., Malcolm,J. and Morgan, J. (1997) Managing Voids and
Difficult to Let Property. London: The HousingCorporation
Peabody Trust (1996–98) Annual Reports
PEP (1981) Improving Problem Council Estates: A
Summary of Aims and Progress. London: DoE
Plank, D. (ed.) (1998) Joined up Thinking: A
Directory of Good Practice for Local Authority
Empty Property Strategies. London: EmptyHomes Agency
Poones, J., Schafer, R. and Hartman, C.W. (1980)Housing Urban America. New York: Aldine
Power, A. (1981) Report on the Tulse Hill Estate for
the Greater London Council. London: PEP
Power, A. (1982) Priority Estates Project 1982:
Improving Problem Council Estates: A Summary of
Aims and Progress. London: DoE
Power, A. (1984) Local Housing Management.London: DoE

113
References
Power, A. (1987) Property before People – The
Management of Twentieth-century Council Housing.London: Allen & Unwin
Power, A. with PEP Associates (1991a) Housing
Management: A Guide to Quality and Creativity.London: Longman
Power, A. (1991b) Running to Stand Still: Progress
in Local Management on 20 Unpopular Housing
Estates 1982–1988. London: PEP Ltd
Power, A. (1993) Hovels to High Rise. London:Routledge
Power, A. (1995) Perspectives on Europe. London:Housing Corporation
Power, A. (1997) Estates on the Edge. London:Macmillan Press
Power, A. and Mumford, K. for the HousingCorporation (1999) Report of low demandseminar at the National Tenants’ ResourceCentre, convened by the Housing Corporation,September 1998
Power, A. and Tunstall, R. (1995) Swimming
against the Tide. York: JRF
Power, A. and Tunstall, R. (1997) Dangerous
Disorder: Riots and Violent Disturbances in 13
Areas of Britain, 1991–92. York: JRF
Prescott, J. (1998) Press release on launch ofUrban Task Force. London: DETR
Prescott-Clarke, P., Clemens, S. and Park, A. forthe DoE (1994) Roots into Local Authority
Housing: A Study of Local Authority Waiting Lists
and New Tenancies. London: HMSO
Prime Minister (1998) The Government’s Annual
Report 1997/98. London: The Stationery Office
Raynsford, N. (1999) Written communication toLSE Housing concerning urban sprawl,15 February
Reich, R. (1993) The Work of Nations: Preparing
Ourselves for Twenty-first Century Capitalism.New York: Vintage
Richardson, E. (1997) ‘In the loop’, report to theTrustees of the Gatsby Project. London: LSEHousing
Ridley, P. (1996) LSE housing seminar,November
Robson, B. (1995) Inner Cities Research Project:
Assessing the Impact of Urban Policy. London:HMSO
Rogers, R. (1997) Cities for a Small Planet.London: Faber
Rudlin, D. (1998) Tomorrow: A Peaceful Path for
Urban Reform. The Feasibility of Accommodating
75% of New Homes in Urban Areas. Manchester:UrbED
Sassen, S. (1998) Globalisation and its Discontents.New York: New Press
Saunders, P. (1990) A Nation of Home Owners.London: Unwin Hyman
Schussheim, M.J. (1974) The Modest Commitment
to Cities. Lexington, MA: Lexington Books
Shelter (1998) Proposal to National Lottery on‘Homeless to Home’ initiative
Social Exclusion Unit (1998) Bringing Britain
Together: A National Strategy for Neighbourhood
Renewal. London: The Stationery Office
Southwark Council (1994) Peckham Partnership:
A Bid for Single Regeneration Budget Funding,prepared by the Partnership

114
The slow death of great cities?
Stegman, M.A. (1970) Housing and Economics:
The American Dilemma. Cambridge, MA: MITPress
Stegman, M.A. (1972) Housing Investment in the
Inner City: The Dynamics of Decline. Cambridge,MA: MIT Press
Sternlieb, G. and Burchell, R. W. (1973)Residential Abandonment: The Tenement Landlord
Revisited. New Brunswick, NJ: Rutgers
Thompson, F.H.L. (1990) Cambridge Social
History of Britain 1750–1950, Vols 1, 2, 3.Cambridge: Cambridge University Press
Travers, A. (1998) ‘Housing: high hopes’ The
Guardian, 17 June
Turok, I. and Edge, N. (forthcoming) The Jobs
Gap in British Cities. York: JRF
Urban Splash (1998) Live, Work, Play. Liverpool:Urban Splash
Urban Task Force (1999a) Internal report of visitto Barcelona by the Urban Task Force
Urban Task Force (1999b) Urban Renaissance –
Sharing the Vision: Summary of Responses to the
Urban Task Force Prospectus. London: Urban TaskForce
Vergara, C.J. (1997) The New American Ghetto.New Brunswick, NJ: Rutgers University Press
Wadhams, C. (1998) Reinvestment Plus – Creating
Thriving Neighbourhoods. Birmingham: ChrisWadhams Associates
Webster, D. (1998) ‘Employment change,migration and housing abandonment’, paperpresented to conference at Centre for Urban andRegional Studies, University of Birmingham,November
WHHA (1998) Living in Town Report: Promoting
the Housing Potential of London’s High Streets.
London: West Hampstead Housing AssociationLtd
Whitehead, C., Kleinman, M. and Chattrabhutti,A. (1995) The Private Rental Housing Market: A
Review of Current Trends and Future Prospects.London: Council of Mortgage Lenders
Whitehead, C. (1998) Personal communicationfrom Christine Whitehead, on the issue ofprivate sector vacancies
Wilmott, P. and Young, M. (1957) Family and
Kinship in East London. London: Routledge andKegan Paul
Wilson, W.J. (1996) Are Ghettos Emerging in
Europe? London: LSE Housing
Wilson, W.J. (1997) When Work Disappears. NewYork: Alfred A. Knopf
Wohl, A.S. (1977) The Eternal Slum: Housing and
Social Policy in Victorian London. London:Edward Arnold
Wood, M. and Bryan, J. for the NorthernHousing Research Partnership (1997) Housing in
the North: A Study of Empty Homes. Chester-le-Street: Northern Consortium of HousingAuthorities
Young, M. and Lemos, G. (1997) Communities we
Have Lost and Can Regain. London: Lemos andCrane
Note
1 Names of specific local areas have beenomitted to protect their identity.

115
Appendix 1Interviews with local authorities and housing associations
around the country
6,42
8 ne
wap
plic
ants
(199
7/98
)
Dis
appe
aran
ceof
pre
ssur
e fr
omho
mel
ess
hous
ehol
ds.
Mor
e tr
ansi
ent
hous
ehol
ds
appl
ying
.
Yes
– un
popu
lar
esta
tes.
30%
lets
toho
mel
ess
– on
lysl
ight
ly h
ighe
rth
an L
A. H
As
have
str
eet
prop
erti
es –
not
sam
e is
sues
as
big
esta
tes.
13,5
00
1.1%
(142
)
4,29
0 (o
f whi
ch1,
520
tran
sfer
s)
Shel
tere
d s
tock
impo
ssib
le to
let.
Hom
eles
sap
plic
atio
nsin
crea
sed
(but
fam
ilies
red
uced
, sin
gle
vuln
erab
lein
crea
sed
).
Yes
– 1-
bed
s an
dbe
dsi
ts–
stig
mat
ised
esta
tes
(of w
hich
ther
e ar
e th
ree
mai
n on
es).
Yes
– in
thei
rsh
elte
red
sto
ckan
d in
thei
rbe
dsi
ts. H
ealt
hyd
eman
d fo
rne
w-b
uild
.
34,0
00
2.01
%
~ 1
0%
16,1
00 o
nco
mm
onho
usin
g re
gist
er
Red
ucin
gd
eman
d fo
rsh
elte
red
.Fa
lling
dem
and
in a
min
orit
y of
gene
ral n
eed
sst
ock.
Yes,
in s
helt
ered
stoc
k; c
erta
inar
eas;
cer
tain
prop
erty
type
s(w
alk-
up fl
ats)
.
Yes
– w
ith
shel
tere
d s
tock
(the
LA
can
’tm
ake
nom
inat
ions
),an
d in
cer
tain
area
s.
97,0
00
2.23
%
14%
(199
7/98
)
36–4
0,00
0 (o
fw
hich
26,
000
=tr
ansf
ers)
1997
Incr
easi
ngtu
rnov
er in
LA
stoc
k.Fa
lling
wai
ting
list.
Yes
– in
are
asw
ith
poor
repu
tati
on a
ndin
unp
opul
arst
ock
type
s/po
or c
ond
itio
nst
ock.
Yes
– se
e H
Aco
lum
ns.
11,0
00
20.7
% (1
997/
98)
Dra
mat
icin
crea
se in
turn
over
(fro
m12
% in
199
6/97
to 2
1% in
199
7/98
) and
aban
don
men
ts(5
0% in
199
7/98
).
Yes
– hi
ghtu
rnov
er m
ainl
yin
flat
s. A
lso
stig
mat
ised
area
s.
N/A
4,30
0
18%
(199
7/98
)
Wai
ting
lists
incl
usiv
es, m
any
area
s ha
ve n
ow
aitin
g lis
t at a
ll.
Dra
mat
icin
crea
se in
turn
over
(fro
m12
% in
199
6/97
to 1
8% in
199
7/98
).
Yes
– in
stig
mat
ised
area
s an
d e
stat
es(i
nc. n
ew-b
uild
),an
d s
peci
fic
prop
erty
type
s:1-
bed
s, b
edsi
ts,
shel
tere
d, p
oor
terr
aces
.
N/A
9,00
0
15%
2,00
0
Lar
ge s
cale
volu
ntar
ytr
ansf
er (L
SVT
)H
A (1
990)
. LA
used
rec
eipt
tobu
ild m
ore
hous
es –
red
uced
dem
and
for
the
flat
s.
1,00
0 lo
wd
eman
dpr
oper
ties
due
to: t
ype,
loca
tion
,re
puta
tion
.25
% tu
rnov
er in
this
sto
ck.
N/A
4,22
6
New
hou
ses
inon
e to
wn
in z
ero
dem
and
.Tr
ansi
ent
popu
lati
on o
non
e es
tate
(LSV
T 1
994)
.
Yes
– d
epen
ds
on lo
cati
on.
Als
o, th
ere
is a
surp
lus
of s
ingl
epe
rson
s’ac
com
mod
atio
n.
N/A
Tota
l sto
ck
Voi
ds
Ann
ual
turn
over
Num
ber
onw
aiti
ng li
st
Cha
nges
ind
eman
dex
peri
ence
d
Con
cent
rati
on o
flo
w d
eman
d?
Hou
sing
asso
ciat
ions
affe
cted
?
Inn
er L
ond
onL
A in
Sou
thL
A in
Sou
thL
A in
Wes
tH
A in
Wes
tH
A in
HA
inH
A in
LA
Eas
tW
est
Mid
lan
ds
Mid
lan
ds
Mid
lan
ds
Eas
tern
Wes
tern
regi
onre
gion
regi
on

116
The slow death of great cities?
No
– ve
ry h
igh
pric
es. £
150,
000
– £2
00,0
00 fo
r a
hous
e.
No.
Ad
vert
isin
g.N
othi
ng is
unsa
leab
le/
unle
ttab
le in
Lon
don
.
No
– qu
ite
high
dem
and
eve
nfo
r po
or q
ualit
ypr
ivat
eac
com
mod
atio
n.
No.
Con
vers
ion
ofsh
elte
red
bed
sits
to fa
mily
-siz
eac
com
mod
atio
n–
succ
essf
ul.
Ad
vert
isin
g of
unpo
pula
res
tate
–su
cces
sful
.M
arke
ting
of
shel
tere
d b
edsi
ts–
unsu
cces
sful
.
Slac
k d
urin
g th
ere
cess
ion.
Som
epe
ople
who
exer
cise
d th
eR
TB
hav
ing
dif
ficu
lty
selli
ng.
No
– no
are
asw
ith
void
s ov
er10
%.
Dem
olit
ion
ofm
ulti
s,re
plac
emen
t by
HA
s. R
edes
ign,
secu
rity
impr
ovem
ents
–su
cces
s. L
etti
ngto
ver
y lo
wpr
iori
ty, u
nder
-oc
cupy
ing.
Res
tric
ted
num
ber
of o
ffer
sto
3 –
red
uced
aver
age
num
ber
of o
ffer
s be
fore
acce
ptan
ce.
Yes
– in
cer
tain
pock
ets
wit
hba
d r
eput
atio
n.
No.
Loc
al a
lloca
tion
polic
ies
inse
lect
ed a
reas
–ha
ve r
educ
edvo
id tu
rn-
arou
nd p
erio
d.
No
– ca
n le
tvi
rtua
llyev
eryt
hing
at
pres
ent.
Hom
eim
prov
emen
ts.
Stoc
k sw
aps
tora
tion
alis
e st
ock.
‘Dec
onve
rsio
ns’.
Cus
tom
ersu
rvey
s. P
lan
tod
emol
ish
som
epr
oper
ties
and
rebu
ild. L
ocal
adve
rts
– no
tgo
od r
espo
nse.
The
re a
re a
reas
wit
h ve
ry h
igh
inci
den
ce o
fvo
ids
rela
ting
topr
oper
ty ty
pe/
stig
mat
ised
esta
tes
or s
tree
ts.
Peop
le ju
st w
ant
to g
et o
ut –
‘sho
uld
be
dem
olis
hed
’.
Tow
er b
lock
refu
rbis
hed,
mar
kete
d, le
tting
squ
otas
to a
chie
vepl
anne
dpo
pula
tion
prof
ileof
wor
king
, non
-w
orki
ng, d
iffer
ent
age
grou
ps, e
tc.
Succ
essf
ul.
Dev
elop
ed th
isfu
rthe
r – ra
nge
ofm
arke
ting
pack
ages
for
part
icul
ar v
oid
type
s, re
gula
r ads
,es
tate
age
nt ty
pebo
ards
, lea
flet
drop
s (lo
calit
yan
d fa
mily
and
frie
nds)
.
No
– th
ere
has
been
a p
riva
tese
ctor
boo
m.
No.
Taki
ng s
trat
egic
look
at t
he s
tock
– qu
esti
onin
gw
heth
erd
emol
itio
n m
ore
sens
ible
than
refu
rbis
hmen
t.A
bout
to k
nock
dow
n on
e bl
ock
of fl
ats.
Con
sid
erin
gou
trig
ht s
ales
of
som
e st
ock.
No.
Priv
ate
hous
ing
affe
cted
?
Any
are
as b
eing
‘aba
ndon
ed’?
Init
iati
ves
und
erta
ken
toco
mba
t low
dem
and
? E
ffec
t?
Inn
er L
ond
onL
A in
Sou
thL
A in
Sou
thL
A in
Wes
tH
A in
Wes
tH
A in
HA
inH
A in
LA
Eas
tW
est
Mid
lan
ds
Mid
lan
ds
Mid
lan
ds
Eas
tern
Wes
tern
regi
onre
gion
regi
on

117
Appendix 1
Yes.
The
cou
ncil
owns
too
man
ypr
oper
ties
.
Cou
ld o
pen
upw
aiti
ng li
st to
thos
e no
tpr
evio
usly
cons
ider
ed. I
nL
ond
on, t
here
isve
ry h
igh
dem
and
ove
rall.
Yes
– es
peci
ally
stre
et p
rope
rtie
s.
The
cou
ncil
has
an o
ver-
supp
lyof
one
-bed
s an
dbe
dsi
ts.
Mar
keti
ng o
ffl
ats
to p
eopl
eno
t in
hous
ing
need
.
Yes
– m
any
area
s ve
ryso
ught
aft
er.
Fund
ing
for
furt
her
impr
ovem
ents
.
Loo
king
at
stra
tegy
for
shel
tere
d –
dif
fere
nt u
ses.
Hop
ing
toco
nver
t fla
ts to
fam
ilyac
com
mod
atio
n.A
lso
toco
nsol
idat
est
ock
whe
re L
Aan
d s
ever
alR
SLs
in a
n ar
ea.
Yes
– in
clud
ing
in s
ome
dep
rive
d a
reas
.
Com
bina
tion
of
high
turn
over
,hi
gh n
umbe
r of
unpo
pula
rd
esig
n an
dur
ban
exod
us.
Cha
nge
curr
ent
rest
rict
ive
acce
ss.
Rep
acka
ge to
attr
act g
row
ing
Asi
anpo
pula
tion
who
curr
entl
y ha
vene
gati
vepe
rcep
tion
.
Yes
– bu
t vas
tm
ajor
ity
of s
tock
in d
iffi
cult
inne
rci
ty.
Res
earc
hsu
gges
tspr
oper
tyco
ndit
ion
not
reas
on fo
rle
avin
g –
shou
ldre
dir
ect m
oney
to s
ecur
ity
mea
sure
s.
Still
to tr
yfu
rnis
hed
acco
mm
odat
ion.
Beg
inni
ng to
shar
e in
fo w
ith
othe
r R
SLs.
Yes
– ce
rtai
nar
eas
and
3-b
edho
uses
.
Pace
of c
hang
e.C
onti
nued
red
ucti
on in
dem
and
and
incr
ease
in n
ewvo
ids
each
wee
k.H
uge
deb
tpo
rtfo
lio to
be
fina
nced
.
Mar
keti
ng,
rela
poi
nts
thre
shol
d,
dev
elop
ing
sche
me-
spec
ific
lett
ings
stra
tegi
es,
adap
ting
wor
king
prac
tice
s to
chan
ging
situ
atio
n –
ther
eis
unt
appe
dho
usin
gd
eman
d.
Yes
– ra
tion
ing
mod
el s
till
appl
ies
tom
ajor
ity
ofst
ock.
Lac
k of
adeq
uate
fund
ing
tod
emol
ish
unpo
pula
r hi
gh-
rise
and
bed
sits
.
Still
to tr
y lo
cal
lett
ings
and
allo
win
g un
der
-oc
cupa
tion
.
Yes
– po
cket
s of
high
dem
and
ince
rtai
n lo
cati
ons.
Impa
ct o
f ant
i-so
cial
beh
avio
ur,
resi
den
ts s
care
dto
get
invo
lved
on o
ne e
stat
e.
Mar
keti
ngst
rate
gy n
ot y
etst
arte
d.
Are
as/
stoc
kty
pes
in h
igh
dem
and
?
Futu
re c
once
rns
Futu
re p
oten
tial
Inn
er L
ond
onL
A in
Sou
thL
A in
Sou
thL
A in
Wes
tH
A in
Wes
tH
A in
HA
inH
A in
LA
Eas
tW
est
Mid
lan
ds
Mid
lan
ds
Mid
lan
ds
Eas
tern
Wes
tern
regi
onre
gion
regi
on

118
West West HA – South South NorthernMidlands Midlands Midlands East LA West LA HALA HA region
Area factorsStigma/reputation ✔ ✔ ✔ ✔ ✔ ✔
Crime rate/lack of feeling of ✔ ✔ ✔ ✔ ✔ ✔
securityConcentration of people living in ✔ x ✔ ✔ – ✔
poverty/lack of employmentopportunities
Property factorsType of housing ✔ ✔ ✔ √ ✔ √Poor physical property condition ✔ x x x ✔ √Visible signs of vacancy, – ✔ ✔ ✔ ✔ –i.e. steel security
Service delivery factorsPoor housing management by – x x – x –social landlordsRestrictive allocations policies ✔ – ✔ ✔ – ✔
Reputation of schools x ✔ √ ✔ x –Lack of co-ordination between – – x x x –different service providersLack of shops ✔ x √ ✔ ✔ –
City management factorsContinued new-building by the ✔ – ✔ ✔ (of – ✔
LA/HAs sheltered)Inappropriately targeted – – – ✔ – –regeneration programmesBuilding by the universities – ✔ – x x –reducing student renter population
National trendsUrban exodus ✔ ✔ ✔ – x ✔
Changing tenure aspirations/availability of low cost owner ✔ ✔ ✔ ✔ ✔ ✔
occupationShift in the industrial base, – – ✔ – – ✔
with loss of jobs from the North
✔ = definite contributor√ = contributes to some extentx = does not contribute– = not discussed
Appendix 2Additional interviews – contributors to low demand

119
Wakefield LiverpoolSheffield SandwellBirkenhead CoventryBlackburn BirminghamBradford WolverhamptonStockton NottinghamMiddlesbrough BedfordSunderland BristolGateshead LambethCleveland and Redcar SouthwarkHull HackneySalford Islington*Wigan Hammersmith and Fulham*Knowsley BrentBurnley HaringeyKirklees GreenwichCarlisle LewishamBolton ThurrockLeeds Brighton
* Generally high demand areas, but with specific unpopular estates.
Appendix 3Areas of the country with evidence of pockets of low demand,
difficult to let properties and high turnover – affecting local
authorities and/or housing associations (not exhaustive)

120
Bramley, G., ‘Housing surpluses and housingneed’, paper presented to conference atUniversity of York, July 1998
CIoH, ‘Low demand for housing – discussionpaper’, paper presented to conference atUniversity of York, July 1998
DETR/Bramley, G., ‘Low demand for housingand unpopular neighbourhoods’, researchcommenced October 1998
Keenan, P., ‘Housing abandonment anddemand’, paper presented to conference atUniversity of York, July 1998
Lowe, S., ‘Housing abandonment in the EnglishInner City’, paper presented to conference atUniversity of York, July 1998
Murie, A., Nevin, B. and Leather, P., ‘Changingdemand and unpopular housing’, WorkingPaper No. 4, Housing Corporation, 1998
Pawson, H., ‘Residential instability and tenancyturnover’, paper presented to conference atUniversity of York, July 1998
Research and Change! Consultancy, ‘Frequentmovers’ study (Joseph Rowntree Foundation,forthcoming)
Stringer, F. (Manchester Housing), ‘Area basedhousing management and corporate responsesto low housing demand’, paper presented toconference at University of York, July 1998
Webster, D., ‘Employment change, migrationand housing abandonment’, paper presented toconference at University of Birmingham,November 1998
Appendix 4Other current research

121
No. of people
Two cities and four neighbourhoodsCentral senior staff 6Staff in the following services:
Housing (LA) 22Housing (HA) 21Education 9Police 12Social Services 3Community/leisure 3Regeneration/private sector renewal 11
Councillors 4Voluntary sector 5Private sector (shops and estate agents) 3Academics 5Residents 24Total 128
Outside the two citiesLA staff 15HA staff 13Voluntary sector 5Total 33
Appendix 5Schedule of fieldwork interviews

122
Appendix 6Manchester City Council: corporate aims and objectives

123
Appendix 6

124
Appendix 7Newcastle’s corporate strategic plan: key extracts
The City Council’s vision for Newcastle
• An accessible city with equal opportunityfor all its people to realise their potentialthrough education, work, and otheractivities without discrimination or fear.
• A city which provides a safe, clean,healthy and sustainable environment.
• A city where residents take an active partin the democratic process and participatein decisions about their public services,their local community and their quality oflife.
• A city which values its rich culture,heritage and strong sense of identity.
• A city which is regional capital of theNorth East and which continues to buildlinks with Europe.
Core values and beliefs
The City Council is committed to:
• The value of public service provided bydemocratically accountable localgovernment.
• The best use of its resources for thebenefit of all residents whilst recognisingthe particular needs of the poorest, mostvulnerable and disadvantaged.
• The vital importance of social, economic,and cultural regeneration to improve thequality of life and opportunity for thepeople of Newcastle.
• The value of working in partnership withcommunity, business, and voluntaryorganisations, with governmentdepartments and with other agencies toachieve the best for our community.
• Equality of opportunity for people fromall of Newcastle’s diverse communities,ensuring that we treat all people withsensitivity, fairness and respect.
• Providing services that are easilyaccessible, responsive, relevant and goodvalue for money, and opportunities forpeople to participate in the developmentof better services.
• Creating an accessible and suitableenvironment offering mobility to all.
• Providing clear information about thestandards that Council services shouldmeet.
• Recognising people’s right to complainand have things put right.
The Council’s priorities
Corporate policy priorities
Priority 1: Educational achievement
Raising levels of attainment and improvingeducational standards for all learners in the City.
Priority 2: Tackling youth and long-term
unemployment
Implementing Welfare to Work and reducingunemployment amongst young people andlong-term unemployment overall.

125
Appendix 7
Priority 3: Community regeneration
Social, economic and cultural regeneration oflocal areas which are suffering or likely to sufferdecline.
Priority 4: Improving the local environment
Working to create a clean, healthy and attractiveenvironment which will improve the quality oflife in Newcastle.
Priority 5: The City as regional and cultural
capital of the North East
Retaining and developing Newcastle’s role asregional capital in terms of retailing,entertainment, cultural facilities andemployment opportunities.
Cross-functional guiding principles
1 Best value
The commitment to quality andcontinuous improvement in everythingwe do.
2 Equal opportunities and accessibility
The commitment to provide servicesfairly to all people in the community,improve access to those services, andensure that we act as an equalopportunities employer.
3 Local Agenda 21
The commitment to minimise the use ofnon-renewable resources and promoterecycling of waste whilst workingtowards building sustainablecommunities.
4 Community participation and involvement
The commitment to promote andfacilitate the active participation ofNewcastle residents in decision makingand the development of communityplanning.

126
Dat
eS
ourc
eA
rtic
le
Oct
. 95
Dai
ly T
eleg
raph
Esc
apin
g fr
om c
itie
s06
/07
/96
The
Eco
nom
ist
The
cit
ies
com
e ba
ck to
life
22/
11/
96M
anch
este
r E
veni
ng N
ews
Unp
opul
ar c
ounc
il ho
mes
suf
feri
ng fr
om d
ecay
are
to b
e d
emol
ishe
d a
nd r
epla
ced
04/
12/
96T
he G
uard
ian
Prov
idin
g an
ext
ra 4
.4 m
illio
n ho
useh
old
s by
201
6 is
a p
ipe
dre
am (P
eter
Hal
l)11
/12
/96
The
Ind
epen
den
tT
he b
uck
stop
s he
re19
96B
irm
ingh
am C
ity
Cou
ncil
Mov
emen
t of p
eopl
e ou
t of t
he c
ity
Jan.
/Fe
b. 9
7R
oof
Mor
e th
an 5
00 H
A s
chem
es a
re d
iffic
ult t
o le
t22
/01
/97
Hou
sing
Tod
ayH
ousi
ng d
eman
d le
vel i
s an
ove
rest
imat
e22
/01
/97
Hou
sing
Tod
ayC
oult
er d
ism
isse
s gr
een
belt
sca
rem
onge
rs22
/01
/97
Hou
sing
Tod
aySe
lect
ing
the
righ
t sol
utio
ns o
n ne
ed22
/01
/97
Hou
sing
Tod
ayJu
st b
ecau
se it
’s th
ere
– th
e la
ck o
f fin
anci
al s
trat
egy
in h
ousi
ng22
/01
/97
Hou
sing
Tod
ayA
cha
nce
to g
et a
pie
ce o
f the
act
ion
– SR
B fu
ndin
g23
/01
/97
Insi
de
Hou
sing
Ass
ocia
tion
buy
s in
ext
ra p
atro
l fro
m M
anch
este
r po
lice
23/
01/
97In
sid
e H
ousi
ngE
mpt
ies
lobb
y ha
ils V
AT
har
mon
yM
ar. 9
7H
ousi
ngE
mpt
y ho
uses
(Joh
n Tu
rney
)Ju
n. 9
7T
he H
ousi
ng M
agaz
ine
Put t
he p
eopl
e fi
rst
Jun.
97
The
Hou
sing
Mag
azin
eW
ho w
ants
soc
ial h
ousi
ng?
02/
06/
97To
wns
cape
and
urb
an d
esig
nQ
ualit
y of
life
in c
itie
s13
/06
/97
Insi
de
Hou
sing
Con
quer
ing
the
Vik
ing
– st
oppi
ng a
band
onm
ent o
n an
est
ate
in S
heff
ield
Jul.
97H
ousi
ngK
ey in
gred
ient
is e
nsur
ing
acce
ss to
wor
k on
a s
usta
inab
le b
asis
Jul.
97H
ousi
ngC
losi
ng th
e ga
p be
twee
n ri
ch a
nd p
oor
11/
07/
97In
sid
e H
ousi
ngL
ow d
eman
d w
ill s
ee 4
00 h
omes
dem
olis
hed
(New
cast
le)
25/
07/
97In
sid
e H
ousi
ngL
ack
of in
vest
men
t spa
rks
Car
dif
f ram
page
01/
08/
97In
sid
e H
ousi
ngTe
ens
face
sup
ervi
sion
01/
08/
97In
sid
e H
ousi
ngW
elco
min
g th
e ne
w fo
cus
on c
omm
unit
ies
08/
08/
97In
sid
e H
ousi
ngC
all t
o se
t tar
gets
on
empt
ies
15/
08/
97T
he P
ink
Pape
rSa
lfor
d –
clu
ster
of t
ower
blo
cks
let t
o ga
y an
d le
sbia
n pe
ople
15/
08/
97In
sid
e H
ousi
ngTo
wer
blo
cks
in N
ewca
stle
ver
y po
pula
r w
ith
vuln
erab
le p
eopl
e15
/08
/97
Insi
de
Hou
sing
Who
le e
stat
es c
ould
spi
ral d
ownw
ard
s be
caus
e of
dru
g d
ealin
g pr
esen
ce21
/08
/97
Hou
sing
Tod
ayC
ounc
ils k
een
to h
ang
on to
nom
inat
ion
func
tion
22/
08/
97In
sid
e H
ousi
ngC
PRE
– lo
cal a
utho
riti
es m
ake
over
-pro
visi
on o
n gr
eenf
ield
sit
es22
/08
/97
Insi
de
Hou
sing
Man
y be
nefi
ts o
f sho
rt-t
erm
soc
ial h
ousi
ng h
ave
been
ove
rloo
ked
22/
08/
97In
sid
e H
ousi
ngA
ren
t fre
e m
onth
on
one
of C
oven
try
MD
C’s
mos
t run
dow
n es
tate
sSe
p. 9
7H
ousi
ngL
ond
on h
ousi
ng n
eed
Sep.
97
Roo
fW
ould
Bri
tain
gai
n fr
om F
renc
h st
yle
targ
etin
g of
res
ourc
es?
(Jim
Dic
kson
)Se
p. 9
7H
ousi
ngM
ixed
tenu
re e
stat
es o
nly
have
an
effe
ct w
hen
% o
f sha
red
ow
ners
hip
is h
igh
12/
09/
97In
sid
e H
ousi
ngC
alls
for
the
build
ing
of n
ew to
wns
sim
ilar
in s
cale
to th
at o
f the
pos
t war
per
iod
12/
09/
97In
sid
e H
ousi
ngPr
omot
ing
tena
nt tr
aini
ng r
egim
e, e
xplo
ring
nei
ghbo
ur p
robl
ems
12/
09/
97In
sid
e H
ousi
ngT
he la
st r
esor
t – s
ome
peop
le p
refe
r to
rem
ain
in B
&B
than
live
in h
ard
to le
t12
/09
/97
Insi
de
Hou
sing
Ult
imat
um is
sued
on
empt
y pr
oper
ties
– N
orw
ich
DC
and
Nor
folk
CC
17/
09/
97T
he T
imes
Hal
f of a
ll L
A a
nd H
A r
ente
d p
rope
rtie
s ar
e no
w w
orkl
ess
18/
09/
97H
ull M
ail
Bid
to m
ove
tena
nts
into
no-
go a
reas
(Ang
us Y
oung
)18
/09
/97
Hou
sing
Tod
ayL
ocal
hou
sing
str
ateg
ies
– H
As
and
LA
s no
t wor
king
wel
l tog
ethe
r
Appendix 8Articles about low demand and abandonment

127
Appendix 8D
ate
Sou
rce
Art
icle
18/
09/
97H
ousi
ng T
oday
Ben
tile
e es
tate
, pla
ns to
bre
ak u
p es
tate
into
5 v
illag
es a
nd g
et p
eopl
e ba
ck to
wor
k18
/09
/97
Hou
sing
Tod
aySu
rvey
of 2
5 L
As
and
9 H
As
on s
ocia
l exc
lusi
on18
/09
/97
Hou
sing
Tod
ayD
omes
tic
viol
ence
and
fam
ily d
ispu
tes
are
cont
ribu
ting
to in
crea
se in
old
er h
omel
ess
18/
09/
97H
ousi
ng T
oday
Cho
osin
g th
e ri
ght l
ocat
ion
for
new
hom
es c
an ta
ckle
dep
riva
tion
19/
09/
98In
sid
e H
ousi
ngL
iver
pool
HA
T w
ants
to u
se c
ounc
il w
aiti
ng li
st to
fill
half
em
pty
bloc
ks19
/09
/97
Insi
de
Hou
sing
Old
er p
eopl
e an
d h
omel
essn
ess
– un
able
to s
usta
in m
ortg
age
repa
ymen
ts19
/09
/97
Insi
de
Hou
sing
Hul
l – s
ucce
ss w
ith
prof
essi
onal
wit
ness
es –
evi
ctio
n of
dru
g d
eale
r19
/09
/97
Insi
de
Hou
sing
Kno
ckin
g d
own
esta
tes
coul
d b
e a
bett
er o
ptio
n19
/09
/97
Insi
de
Hou
sing
EH
A-a
ccre
dit
ed le
ttin
g sc
hem
e br
ings
thou
sand
s of
em
pty
hom
es b
ack
into
use
26/
09/
97In
sid
e H
ousi
ngE
mpt
y ho
mes
hot
line
to b
e la
unch
ed in
Nov
embe
r26
/09
/97
Insi
de
Hou
sing
Bir
min
gham
MD
C 9
4 m
illio
n re
gene
rati
on s
chem
eO
ct-9
7H
ousi
ngPl
anni
ng s
yste
m is
a la
nd v
alue
lott
ery
(Cha
rmai
ne Y
oung
)01
/10
/97
The
Gua
rdia
nL
eed
s –
vand
alis
ed h
ome
on th
e m
arke
t for
1,0
00 p
ound
s02
/10
/97
Hou
sing
Tod
ayA
re w
e ab
le to
pro
tect
and
pre
serv
e al
l com
mun
itie
s? (G
ed L
ucas
)02
/10
/97
Hou
sing
Tod
aySe
ttin
g th
e ta
rget
s fo
r ch
ange
-nee
d m
ix o
f are
a ta
rget
ing
and
nat
iona
l pol
icie
s02
/10
/97
Hou
sing
Tod
ayH
ilary
Arm
stro
ng w
ants
to s
ee a
ran
ge o
f pol
icy
opti
ons
befo
re tu
rnin
g to
the
bulld
ozer
03/
10/
97In
sid
e H
ousi
ngD
oubt
cas
t on
impa
ct o
f ren
ewal
sch
emes
– A
ssoc
iati
on o
f Lon
don
Gov
ernm
ent
03/
10/
97In
sid
e H
ousi
ngG
over
nmen
t ple
dge
s to
tack
le s
ocia
l exc
lusi
on th
roug
h ho
usin
g03
/10
/97
Insi
de
Hou
sing
Dep
t. of
Tra
nspo
rt o
wns
hun
dre
ds
of e
mpt
y pr
oper
ties
aw
aiti
ng r
oad
bui
ldin
g d
ecis
ions
03/
10/
97In
sid
e H
ousi
ngC
IoH
pri
orit
y su
rvey
– r
egen
erat
ion
of d
epri
ved
est
ates
, rep
airs
, bri
ngin
g em
ptie
s in
to u
se09
/10
/97
Hou
sing
Tod
ayC
an c
ontr
acts
of m
utua
l sup
port
rec
reat
e co
mm
unit
ies?
(Mic
heal
You
ng a
nd G
erar
d L
emos
)10
/10
/97
Insi
de
Hou
sing
Mer
seys
ide
– ho
w r
esid
ents
, cou
ncil
offi
cers
and
pol
ice
clea
red
dru
g d
eale
rs16
/10
/97
Hou
sing
Tod
ayTa
sk fo
rce
to im
prov
e ci
ty c
entr
e liv
ing
laun
ched
by
Lee
ds
Cit
y C
ounc
il16
/10
/97
Hou
sing
Tod
ayC
red
it u
nion
s co
uld
pla
y a
vita
l rol
e in
tack
ling
soci
al e
xclu
sion
16/
10/
97H
ousi
ng T
oday
Ope
nnes
s by
bot
h L
A a
nd H
A k
ey to
a s
ucce
ssfu
l par
tner
ship
16/
10/
97H
ousi
ng T
oday
Cou
ncils
to g
et H
A in
form
atio
n16
/10
/97
Hou
sing
Tod
ayW
arw
ick
– fi
nd it
fill
it s
chem
e, r
ewar
d to
peo
ple
who
rep
ort e
mpt
ies
whi
ch a
re fi
lled
16/
10/
97H
ousi
ng T
oday
Shel
tere
d h
ousi
ng –
can
’t no
min
ate
or w
on’t
nom
inat
e?17
/10
/97
Insi
de
Hou
sing
Frau
d fa
mili
es to
be
targ
eted
– fa
mili
es w
ho s
wit
ch h
omes
to c
heat
on
bene
fits
17/
10/
97In
sid
e H
ousi
ngB
rad
ford
Cit
y C
halle
nge
a 10
mill
ion
flop
– c
ould
not
att
ract
wor
king
peo
ple
to li
ve in
est
ate
17/
10/
97In
sid
e H
ousi
ngK
nock
dow
n si
nk e
stat
es a
nd s
ell l
and
– N
atio
nwid
e B
uild
ing
Soci
ety
17/
10/
97In
sid
e H
ousi
ngC
ould
bul
ldoz
ers
beco
me
the
prof
essi
onal
s’ b
est f
rien
d?
(Jul
ian
Dob
son)
17/
10/
97In
sid
e H
ousi
ngE
RC
F –
dem
and
impo
rtan
t fac
tor
– lin
ked
to g
eogr
aphy
(Jef
f Zit
ron)
23/
10/
97H
ousi
ng T
oday
Gro
win
g d
eman
d fo
r fu
lly fu
rnis
hed
lett
ings
24/
10/
97In
sid
e H
ousi
ngE
stat
es h
ave
had
thei
r d
ay (J
. McC
arro
n, G
lasg
ow C
ounc
il’s
hous
ing
chai
r)30
/10
/97
Hou
sing
Tod
ayL
etti
ngs
Plus
– ta
cklin
g th
e pr
oble
m o
f em
pty
prop
erti
es a
nd h
elps
non
-pri
orit
y ho
mel
ess
31/
10/
97In
sid
e H
ousi
ngE
din
burg
h –
60%
of o
ffer
s fa
il to
res
ult i
n ne
w te
nanc
ies
Nov
. 97
Hou
sing
Too
man
y em
pty
hom
es in
Sco
tlan
dN
ov. 9
7H
ousi
ngIn
cre
atin
g co
mm
unit
ies,
pla
nner
s ne
ed to
look
bac
kwar
ds
(Dav
id L
unts
)06
/11
/97
Hou
sing
Tod
ayN
orth
ern
prov
ider
s as
k fo
r gr
eate
r fr
eed
om to
spe
nd fu
nds
on c
omm
unit
y re
gene
rati
on06
/11
/97
Hou
sing
Tod
ayTa
x br
eaks
urg
ed fo
r d
erel
ict l
and
– C
PRE
06/
11/
97H
ousi
ng T
oday
Inab
ility
to fu
rnis
h ac
com
mod
atio
n m
ain
reas
on fo
r no
t rem
aini
ng in
LA
hom
es07
/11
/97
Insi
de
Hou
sing
Sund
erla
nd M
DC
pla
ns to
ban
bad
tena
nts
from
its
wai
ting
list

128
The slow death of great cities?D
ate
Sou
rce
Art
icle
07/
11/
97In
sid
e H
ousi
ngFe
wer
hom
eles
s fa
mili
es p
lace
d in
tem
p. B
&B
by
Not
ting
ham
cou
ncil
07/
11/
97In
sid
e H
ousi
ngM
assi
ve p
oten
tial
for
conv
erti
ng e
mpt
y of
fice
spa
ce in
to lo
w c
ost h
ousi
ng13
/11
/97
Hou
sing
Tod
ayH
ousi
ng n
eed
incr
easi
ng in
the
Nor
th (M
arti
n W
ood
)13
/11
/97
Hou
sing
Tod
ayR
idd
ing
soci
al h
ousi
ng o
f sti
gma
and
reg
ener
atin
g in
ner
citi
es’ k
ey c
halle
nges
13/
11/
97H
ousi
ng T
oday
Wor
king
on
empt
ies
is g
etti
ng r
esul
ts (B
ob L
awre
nce)
13/
11/
97H
ousi
ng T
oday
Firs
t evi
ctio
n of
an
intr
oduc
tory
tena
nt h
as h
appe
ned
14/
11/
97In
sid
e H
ousi
ngC
omm
unit
y co
nsul
tati
on is
pos
sibl
e (S
teve
Gay
le)
14/
11/
97In
sid
e H
ousi
ngH
As
mus
t rei
n ba
ck th
eir
dev
elop
men
t asp
irat
ions
(Dav
id C
owan
s, N
orth
Bri
tish
HA
)14
/11
/97
Insi
de
Hou
sing
HA
s m
ust p
lan
ahea
d to
sta
ve o
ff th
e th
reat
of a
lett
ings
cri
sis
(Sim
on D
ow)
14/
11/
97In
sid
e H
ousi
ngH
ousi
ng in
vest
men
t a w
aste
of m
oney
unl
ess
we
put y
outh
firs
t (A
ntho
ny M
ayer
)14
/11
/97
Insi
de
Hou
sing
Tena
nts
that
feel
goo
d a
bout
livi
ng in
an
area
will
mak
e an
est
ate
last
(Jul
ian
Dob
son)
14/
11/
97In
sid
e H
ousi
ngFi
gure
s su
gges
ting
4.4
mill
ion
hom
es q
uest
ione
d b
y L
abou
r M
P D
avid
Dre
w21
/11
/97
Insi
de
Hou
sing
Man
ches
ter
puts
its
fait
h in
you
th fo
r fu
ture
lett
ings
21/
11/
97In
sid
e H
ousi
ngR
egen
erat
ion
polic
y a
failu
re (D
ET
R)
27/
11/
97H
ousi
ng T
oday
Tena
nts
back
pla
n to
tran
sfer
a M
anch
este
r C
ity
Cou
ncil
esta
te to
an
HA
27/
11/
97H
ousi
ng T
oday
Exc
lusi
on s
tud
y sh
ows
wid
enin
g ga
p (D
emos
)27
/11
/97
Hou
sing
Tod
ayG
over
nmen
t sti
ll co
nsid
erin
g w
hat t
he ta
rget
for
new
hou
sing
will
be
27/
11/
97H
ousi
ng T
oday
Reg
ener
atio
n sc
hem
e ha
s tu
rned
Sto
ckw
ell P
ark
esta
te in
to a
love
ly p
lace
27/
11/
97In
sid
e H
ousi
ngSo
me
prop
erti
es n
eed
to b
e d
emol
ishe
d (S
teph
en P
orte
r)D
ec-9
7N
atio
nal H
ousi
ng A
war
ds
Bes
t Fun
din
g So
luti
on –
Em
pty
hom
es s
trat
egy
– L
ond
on B
orou
gh o
f Bre
nt04
/12
/97
Hou
sing
Tod
aySh
elte
r w
arns
of u
nim
agin
able
hom
eles
s cr
isis
in S
cotl
and
05/
12/
97In
sid
e H
ousi
ngR
ever
se c
uts
or fa
ce h
omel
ess
expl
osio
n –
Shel
ter
Scot
land
11/
12/
97H
ousi
ng T
oday
Priv
ate
sect
or is
lead
ing
the
figh
t aga
inst
em
ptie
s –
Em
pty
Hom
es A
genc
y11
/12
/97
Hou
sing
Tod
ayG
row
th in
hom
e ow
ners
hip
is li
kely
to s
low
sig
nifi
cant
ly in
Bri
tain
ove
r ne
xt 2
0 ye
ars
12/
12/
97In
sid
e H
ousi
ngM
idla
nds
lack
s th
e sp
ace
for
5,00
0 ex
tra
hom
es –
Wes
t Mid
land
s re
gion
al fo
rum
12/
12/
97In
sid
e H
ousi
ngSt
reet
sle
eper
s ne
ed m
ore
than
a r
oof –
Hom
eles
s N
etw
ork
12/
12/
97In
sid
e H
ousi
ng8,
900
hom
es in
Eng
land
cre
ated
by
conv
ersi
ons
12/
12/
97In
sid
e H
ousi
ngG
over
nmen
ts w
ill h
ave
to b
alan
ce b
uild
ing
new
hom
es a
nd c
urbi
ng h
ousi
ng b
enef
it12
/12
/97
Insi
de
Hou
sing
MPs
to s
crut
inis
e th
e G
over
nmen
t’s a
sses
smen
t of h
ousi
ng n
eed
12/
12/
97In
sid
e H
ousi
ngH
A d
evel
opm
ent g
rant
s ar
e at
the
righ
t lev
el –
Nat
iona
l Hou
sing
Fed
erat
ion
stud
y19
/12
/97
Insi
de
Hou
sing
Que
stio
n th
e ne
ed to
pro
vid
e 4.
4 m
illio
n ho
mes
19/
12/
97In
sid
e H
ousi
ngL
aws
to d
eal w
ith
empt
y pr
oper
ties
(Sco
tlan
d)
09/
01/
98In
sid
e H
ousi
ngN
eed
figu
re r
ises
to 5
.5 m
illio
n09
/01
/98
Insi
de
Hou
sing
Ask
wha
t we
are
build
ing,
whe
re a
nd fo
r w
hom
?15
/01
/98
Hac
kney
Gaz
ette
Em
pty
prop
erty
team
get
ting
em
pty
priv
ate
hom
es b
ack
into
use
– H
ackn
ey C
ounc
il20
/01
/98
The
Ind
epen
den
tPr
esco
tt p
ropo
ses
Gre
en B
elt T
ax24
/01
/98
The
Ind
epen
den
tG
over
nmen
t urg
ed to
bui
ld n
ew h
omes
on
brow
nfie
ld s
ites
26/
01/
98T
he T
imes
Few
er h
ouse
s m
ay b
e bu
ilt o
n fa
rmla
ndFe
b. 9
8H
ousi
ngN
umbe
r of
pri
orit
y ho
mel
ess
falls
12/
02/
98H
ousi
ng T
oday
New
est
imat
es fu
el c
onfu
sion
12/
02/
98H
ousi
ng T
oday
Why
BM
W d
rive
rs h
old
the
key
12/
02/
98H
ousi
ng T
oday
Em
pty
stoc
k13
/02
/98
Insi
de
Hou
sing
Coa
litio
n in
bat
tle
to e
nd V
AT
on
empt
ies

129
Appendix 8D
ate
Sou
rce
Art
icle
19/
02/
98H
ousi
ng T
oday
Cou
ncils
to o
ffer
hom
es to
pri
vate
sec
tor
tena
nts
19/
02/
98H
ousi
ng T
oday
Pani
ckin
g pl
anne
rs20
/02
/98
Insi
de
Hou
sing
Em
pty
hom
es s
oar
26/
02/
98H
ousi
ng T
oday
Rep
ort s
how
s m
ass
urba
n ex
odus
27/
02/
98In
sid
e H
ousi
ngB
row
nfie
ld ta
rget
fails
to a
dd
ress
soc
ial n
eed
27/
02/
98In
sid
e H
ousi
ngD
emol
itio
n m
ay p
rove
che
apes
t27
/02
/98
Insi
de
Hou
sing
Neg
ativ
e va
lue
sale
hop
es r
ise
27/
02/
98In
sid
e H
ousi
ngT
he n
umbe
rs g
ame
– G
ov. s
tati
stic
s on
hou
sing
nee
d b
ased
on
outd
ated
ideo
logy
04/
03/
98D
ET
RL
ocal
aut
hori
ties
urg
ed to
ren
ovat
e an
d c
ut th
e nu
mbe
r of
em
pty
hom
es14
/03
/98
The
Ind
epen
den
tT
he le
sson
from
the
und
ercl
ass
19/
03/
98H
ousi
ng T
oday
Let
us
brea
k ou
t of t
his
clim
ate
of fe
ar –
cha
ngin
g ne
eds
in h
ousi
ng20
/03
/98
Insi
de
Hou
sing
Mar
ket f
orce
s –
tena
nts
turn
ing
thei
r ba
cks
on s
ocia
l hou
sing
20/
03/
98In
sid
e H
ousi
ngH
ard
sum
s –
will
new
hom
es b
e af
ford
able
?20
/03
/98
Insi
de
Hou
sing
Off
ice
polit
ics
– em
pty
hom
es a
nd o
ffic
es a
re v
ital
in m
eeti
ng fu
ture
hou
sing
dem
and
26/
03/
98H
ousi
ng T
oday
Pres
cott
’s n
ew b
uild
pla
n la
cks
ambi
tion
26/
03/
98H
ousi
ng T
oday
Car
rot f
or w
ell-
beha
ved
tena
nts
27/
03/
98In
sid
e H
ousi
ngPr
essu
re to
per
form
– e
mpt
y ho
mes
are
bec
omin
g a
seri
ous
prob
lem
for
soci
al la
ndlo
rds
02/
04/
98H
ousi
ng T
oday
Lon
e pa
rent
s go
pri
vate
03/
04/
98In
sid
e H
ousi
ngC
allin
g ti
me
on c
rim
e –
coun
cils
giv
en n
ew d
utie
s to
figh
t ant
i-so
cial
beh
avio
ur03
/04
/98
Insi
de
Hou
sing
Flat
s st
ay e
mpt
y as
tena
nts
pick
and
cho
ose
09/
04/
98In
sid
e H
ousi
ngA
cha
nce
that
we
mus
t tak
e –
hous
ing
prof
essi
onal
s in
flue
ncin
g th
e ag
end
a17
/04
/98
Insi
de
Hou
sing
Gov
ernm
ent p
lans
for
mor
e af
ford
able
hom
es23
/04
/98
Hou
sing
Tod
ayH
ousi
ng’s
was
ted
yea
rs –
cas
h sh
ould
not
be
inve
sted
in n
o ho
pe a
reas
23/
04/
98H
ousi
ng T
oday
Plea
s fo
r th
e ex
tens
ion
of c
hild
cur
few
sch
emes
24/
04/
98In
sid
e H
ousi
ngN
o-ho
pe h
omes
to g
o30
/04
/98
Hou
sing
Tod
ayE
mpt
y pr
oper
ty r
ate
to e
ncou
rage
land
lord
s11
/05
/98
DE
TR
pre
ss n
otic
eB
ring
ing
empt
y bu
ildin
gs b
ack
into
use
is a
t the
hea
rt o
f the
Gov
ernm
ent’s
app
roac
h14
/05
/98
Hou
sing
Tod
ayC
rim
e, u
nem
ploy
men
t, la
ck o
f fac
iliti
es a
re to
p of
peo
ple’
s ag
end
a15
/05
/98
Insi
de
Hou
sing
Don
’t re
peat
the
mis
take
s of
the
past
(let
ter)
(Dav
e B
row
n)21
/05
/98
Hou
sing
Tod
ayR
ural
Hou
sing
Tru
st b
uild
ing
bala
nced
com
mun
itie
s (l
ette
r) (P
atri
cia
Phip
ps)
21/
05/
98H
ousi
ng T
oday
Wro
ng to
sto
p in
vest
ing
in n
ew h
omes
in th
e N
orth
Eas
t (le
tter
) (A
ndre
a Ti
tter
ingt
on)
21/
05/
98H
ousi
ng T
oday
Rev
olut
ioni
sing
hou
sing
str
ateg
y22
/05
/98
Insi
de
Hou
sing
Peop
le d
o no
t wan
t to
live
in h
omes
that
are
vis
ually
iden
tifi
able
as
soci
al h
ousi
ng22
/05
/98
Insi
de
Hou
sing
Nor
th n
eed
s ne
w h
omes
(let
ter)
(And
rea
Titt
erin
gton
)29
/05
/98
Insi
de
Hou
sing
Don
’t ca
st th
e N
orth
Eas
t ad
rift
(let
ter)
(Dav
id B
utle
r)Ju
n. 9
8H
ousi
ngH
ow h
igh
self
-est
eem
can
be
retu
rned
to s
ocia
l hou
sing
Jun.
98
Hou
sing
Publ
ic r
elat
ions
and
hou
sing
Jun.
98
Hou
sing
Mor
e pe
ople
bei
ng m
argi
nalis
ed b
y be
ing
excl
uded
from
soc
ial h
ousi
ngJu
n. 9
8T
he G
uard
ian
Pare
nts
plac
e te
araw
ays
in c
are
to a
void
evi
ctio
n04
/06
/98
Hou
sing
Tod
ayTa
cklin
g th
e ne
eds
of y
oung
peo
ple
on h
ousi
ng e
stat
es04
/06
/98
Hou
sing
Tod
ayH
ousi
ng s
taff
join
pol
ice
dru
g te
am05
/06
/98
Insi
de
Hou
sing
Exp
erts
hid
e ab
and
onm
ent o
f hou
ses
11/
06/
98H
ousi
ng T
oday
Wit
ness
es s
till
not s
afe

130
The slow death of great cities?D
ate
Sou
rce
Art
icle
11/
06/
98H
ousi
ng T
oday
Tena
nt b
ans
crea
te s
ocia
l exc
lusi
on12
/06
/98
Insi
de
Hou
sing
Sund
erla
nd M
DC
rej
ects
acc
usat
ions
that
its
get-
toug
h po
licy
has
put y
oung
peo
ple
in c
are
12/
06/
98In
sid
e H
ousi
ngSh
elte
r cl
aim
s co
unci
ls a
buse
exc
lusi
on p
ower
s12
/06
/98
Insi
de
Hou
sing
Man
ches
ter
reth
inks
lim
it o
n re
pair
s fo
r nu
isan
ce te
nant
s26
/06
/98
Insi
de
Hou
sing
Ass
ocia
tion
s fa
ce e
nd o
f pri
vate
cas
h26
/06
/98
Insi
de
Hou
sing
Unw
ante
d h
omes
don
’t ju
stif
y cu
ts26
/06
/98
Insi
de
Hou
sing
Task
forc
e sh
ocke
d b
y d
read
ful p
it h
omes
26/
06/
98In
sid
e H
ousi
ngSu
perc
aret
aker
s to
the
resc
ue02
/07
/98
Hou
sing
Tod
ayD
ownt
urn
in d
eman
d02
/07
/98
Hou
sing
Tod
ayFo
yers
hav
e be
en b
uilt
in th
e w
rong
pla
ces
17/
07/
98In
sid
e H
ousi
ngW
hy a
re lo
cal a
utho
rity
hom
es s
o un
des
irab
le?
17/
07/
98In
sid
e H
ousi
ngM
oD’s
em
pty
hom
es23
/07
/98
Hou
sing
Tod
ayN
o ea
sy a
nsw
ers
for
low
dem
and
nor
ther
n es
tate
s23
/07
/97
Hou
sing
Tod
ayA
s sa
fe a
s ho
uses
– s
ecur
ity
in O
ldha
m24
/07
/98
Insi
de
Hou
sing
New
chi
efs
to fi
ght d
isor
der
24/
07/
98In
sid
e H
ousi
ngC
ounc
ils h
it b
y ab
and
onm
ent
30/
07/
98H
ousi
ng T
oday
Take
a m
ore
bala
nced
look
at i
ssue
s fa
cing
the
Nor
th30
/07
/98
Hou
sing
Tod
ayR
esha
pe h
igh
stre
ets
befo
re it
’s to
o la
te30
/07
/98
Hou
sing
Tod
ayN
eigh
bour
hood
s fo
r ri
cher
and
for
poor
er31
/07
/98
Insi
de
Hou
sing
Cha
lleng
e on
em
ptie
sJu
l./A
ug. 9
8H
ousi
ngSi
n bi
n cr
eate
s m
odel
cit
izen
s –
Dun
dee
fam
ilies
pro
ject
03/
08/
98T
he G
uard
ian
Bill
ions
was
ted
on
unw
ante
d h
omes
14/
08/
98In
sid
e H
ousi
ngSa
nctu
ary
trie
s co
mm
erci
al a
ppro
ach
to ta
ckle
voi
ds
27/
08/
98H
ousi
ng T
oday
Com
men
t on
MoD
hom
es10
/09
/98
Insi
de
Hou
sing
Les
sons
from
the
lett
ing
agen
ts –
ben
efit
s of
pri
vate
land
lord
s11
/09
/98
Insi
de
Hou
sing
Gat
eshe
ad d
eser
ves
appl
ause
for
veto
ing
new
hom
es –
ed
itor
ial
11/
09/
98In
sid
e H
ousi
ngH
ousi
ng s
taff
igno
red
by
soci
al s
ervi
ces
11/
09/
98In
sid
e H
ousi
ngG
ates
head
hal
ts b
uild
ing
18/
09/
98In
sid
e H
ousi
ngC
onve
rtin
g co
mm
erci
al b
uild
ings
to r
esid
enti
al u
se is
slo
win
g d
own
in L
ond
on19
/09
/98
The
Eco
nom
ist
Cou
ncils
that
can
not f
ind
tena
nts
01/
10/
98H
ousi
ng T
oday
Aff
ord
able
hom
es m
ust b
e gi
ven
high
er p
rior
ity
01/
10/
98H
ousi
ng T
oday
Soci
al h
ousi
ng b
ecom
ing
a gr
eate
r ri
sk to
lend
ers
02/
10/
98In
sid
e H
ousi
ngN
ew s
chem
e co
uld
be
a ke
y to
unl
ock
the
pote
ntia
l of e
mpt
y ho
mes
02/
10/
98In
sid
e H
ousi
ngR
esid
ents
trea
ting
cou
ncil
hous
ing
as a
sho
rt te
rm o
ptio
n23
/10
/98
Insi
de
Hou
sing
Gla
sgow
Cit
y C
ounc
il lo
okin
g to
a tr
ust t
o so
lve
its
prob
lem
s02
/12
/98
The
Gua
rdia
nPr
esco
tt in
cla
sh o
ver
new
hom
e ta
x

131
The figures for empty property raise someimportant questions. The fall between 1990 and1997 does not correspond with the evidence atneighbourhood level. It may be partly explainedby large regeneration schemes which removeunpopular properties from normal managementwhile being ‘regenerated’ or awaiting action. Itmay also be that the government’s strictmonitoring of performance indicatorsencourages local authorities to class emptyproperties as ‘awaiting major repair/renewal’rather than as ‘void’. Better monitoring of voidsand more proactive marketing has also helped.Both cities report chronic low demand for muchof their stock.
Appendix 9Local authority stock size, number of difficult to let units,
empties, demolitions for Manchester and Newcastle
Manchester Newcastle1990 1997 1990 1997
Council stock 93,475 78,929 43,678 38,196Difficult to let property 14,804 (1991) 10,750 (1996) 2,810 (1991) 5,624 (1996)Empty property 5,574 2,582 2,473 1,674% of LA stock empty 6.0 3.3 5.7 4.4% empty private property 4.7 6.6 6.2 5.8
Amount of the LA stock demolished 1,791 1,644between 1991 and 1998
% of 1991 stock demolished1 2 4
Volume of empty council stock in 1998 4,744 (6%) 1,774 (4.8%) (November) (October)
Source: Annual HIP returns from DETR, Newcastle and Manchester Housing Departments.
1 This figure does not include all regeneration-driven demolitions.
