urban agriculture: a tool for harmonious city agriculture: a tool for harmonious city 3 but also in...
TRANSCRIPT

Urban Agriculture: A Tool for Harmonious City
A Case of Kathmandu Valley, Nepal
Madhura Karki
Associate Professor
Department of Architecture, Institute of Engineering, Nepal.
1 Urban Sector Review
"My heart is deep in the country. But I live for the City."
1.1 Basic General Data
Geography/Location/Administration
Nepal is a small South-Asian land locked country between big countries like
China and India. Nepal with its rich biological diversity and ecological zones
ranging from 200-8000m horizontally divided into three regions, High Mountains,
Hills and Terai. The country has an area of 147,181 square meters and divided
into 5 development regions, 75 districts and 14 zones. The Kathmandu Valley
consists of three districts, Kathmandu, Lalitpur and Bhaktapur with an area of
about 580 sq km according to the study of Kathmandu Valley GIS Database by
UNEP/ICIMOD. Though the country is heading to Federal structure still central
and local government is ruling in different level of administration.
Economy (Refer Table, A2-Anex I)
Agriculture still is a dominant economic activity (47%) and other informal urban
activities, services and remittance.
Population, Demography and Health
Total pop- 26.97 million out of which 49.88(Female) and 50.12(male)

Madhura Karki
Kathmandu alone holds a population density of 13,586.37 persons per km². 2001, SYB,
2007. Life expectancy at birth is 60.01 year for male and 59.5 years for women giving an
average of 59.8 years. Also refer tables - 1 and 2 from annex-1
1.2 Urban Situation Analysis
Kathmandu Valley having its rich medieval past is undergoing rapid
transformation due to increasing urbanization (7% per annum) and growing
demand for shelter. The growth in housing activity has been reducing the precious
agricultural land around the valley making valleys ecology vulnerable. The
concept of urban agriculture as practiced in many countries today can be a
sustainable solution to retain the valley's fragile ecology which was well
mentioned in the traditional urban planning practice. Urban agriculture as a means
to livelihood to urban poor and a contributor to city's environment has become an
essential component of contemporary urban planning endeavour in Kathamndu
Valley. This could well be the answer to the valley's quest for harmonious living
with nature.
The study context
Housing is a growing problem for urban poor and the migrants. Over ten years,
the city has experienced remarkable growth in its informal settlements. The
migration rate from rural to urban is high. Census 2001 reveals that out of a total
of 2, 929,062 migrants 25% migrated from rural to urban, only 4% from Urban to
rural. In the case of Nepal, migration has been considered as the main contribution
to this rapid growth; urban-bound migration accounted for 28 percent of all
migration (CBS 2003).
The growing population demand additional housing so increase in haphazard
built-up area which is affecting on land encroachment and losing agricultural land
so is the result on threats of Livelihood sustainability of urban farmers and urban
poor. Housing or access to land is one of basic needs. By law anybody interested
to purchase a land can do so. However poor families are not in a position to
benefit this legal and democratic provision. The UA is not only predominant
factor of Livelihood but also related in socio-cultural matters like most of the
festival are related with farming. So the loss of UL is not only threat on livelihood

Urban Agriculture: A Tool for Harmonious City
3
but also in total traditionally harmonious society and urban communities. So this
forms a logical ground for the need of study on the following aspects:
SL for Urban and Migrants
Poverty Reduction
Arable Land conservation
New Urbanism" and Urban Greening Concept for harmonious urban
development.
McLaughlin defines New Urbanism as “The goal of „New Urbanism‟ is to reverse
the trend of „urban sprawl‟ by learning from traditional urban development
patterns and thereby preserving open spaces for natural habitats, active
recreation, and productive agriculture” (McLaughlin, 1997). While urban
greening is often understood as the re-establishment of trees in cities e.g. to
reduce heat island effects and to improve the urban microclimate, but it is more
related to productive greening i.e. sustainable greening that needs to incorporate
urban agriculture.
Urbanization Trend and Agricultural Land in Kathmandu Valley
The population growth rate of Kathmandu, Lalitpur, and
Bhaktapur municipalities is much higher than the national
average growth - 2.08 percent between 1981 - 1991
censuses, which is being clearly marked by migration to
Kathmandu Valley from other districts of Nepal. The urban
growth rate of Katmandu Valley (6%) highest of all other
urban centers indicates the rapid urbanization of the valley”
(Uprety 2000).

Madhura Karki
Table: 3 Urbanization Trend and Projection of Urban Population of Kathmandu Valley
Year
Total
Population of
the Valley
Urban Population of Kathmandu Valley
Kathmand
u Lalitpur Bhaktapur Total
1981 (CY) 740,619 259,185 79,875 74,548 413, 608
1991 (CY) 1,078,909 452,597 115,865 93,375 661, 837
2001 (P) 1, 571,683 767,567 163,923 114,695
2011 (P) 2,020,404 1,057,582 229,852 155,328
2021 (P) 2,597,238 1,439,328 319,655 209,921
2031 (P) 3,338,760 1,937,756 440,882 283,062
Source: Development Plan 2020 of the Kathmandu Valley CY =Census Year, P= Projected
“In Kathmandu and Lalitpur, the share of agricultural land in 1981 was 40% and
52% as compare to the 66% and 71% respectively (PADCO 1986). This rapid
conversion of land from agricultural use to urban use fuelled by growing
urbanization has led to the increase in public and residential built up areas. Recent
urban land study shows that the expansion of built area of Kathmandu-Lalitpur
between 1971 and 1981 was much grater than during the twenty-year period
between 1951 and 1971. The residential areas increased by 134% in Kathmandu
and 94% in Lalitpur respectively between 1971 and 1981(PADCO 1986). Chhetri
in "Urban Land Policy Issues in Kathmandu Valley" (1986) also notes that in
1954, the built up areas of Kathmandu- Lalitpur covered 1076 ha as compare to
almost double built up areas in 1981 covering an area of 3291 ha. The massive
increase in residential land use was observed during this period covering an
additional area of 1075 ha” (Uprety 2000). The agricultural land of the valley has
been decreasing at the rate of 1.41%per year, (Raut 2006), due to rapid
urbanization.

Urban Agriculture: A Tool for Harmonious City
5
Table 4 Land use in greater Kathmandu (ha.)
S.N. Land use 1971 1981 1991
1. Agricultural land 4271 2731 1734
2. Urban land 1497 3170 4355
3. Open space 255 245 143
4. River 241 241 241
Total 6264 6387 6473
Source: Regulating growth: Kathmandu valley, 1995
PADCO (1986) estimates that 56% and almost all of Kathmandu valley's class I
land and would be urbanised by the year 2001 and 2010 respectively. At this rate
no agricultural land will exists in the valley in the year 2020 when almost 60% of
the entire valley will have been urbanised. Also refer (Annex II- the Role of valley
in agriculture).
City Planning and Urban Agriculture: facts and figures
History
Historically speaking the people of Nepal have depended more on agriculture and
livestock products for their livelihood, so is the case of urban communities of
Kathmandu valley. Kathmandu valley well known for its fertile soil and
community wastes used to feed Urban Farmers is open to us. The fertile land of
Nepal Valley was ruled by the Gopalas and Ahiras in the second half of the
second millennium BC. They were the shepherds of Aryan stock who had
migrated to this region from the west and south with their livestock in the
beginning of the Neolithic period around the middle of the third millennium BC.
Two groups of Mongoloids, called Magars and Gurungs, also entered Nepal from
the north with their flocks of goat and sheep and occupied the high mountainous
region of the country (Pandey, 1989, pp. 51-55, CF Prasain, 2006).
The medieval period in Nepal under the Malla dynasty (13th
– 18th
centuries),
the population of Kathmandu has been dominated by the farming community, as
the agriculture was the main economic base of the city dwellers. It can be
observed that the setting of the historical towns of Kathmandu valley was always
on less irrigated higher lands, called tar. And the perimeter goods actually are
located such as to keep the irrigable agricultural outside the settlement limits.

Madhura Karki
Natural &social
economic factors
Institutional
Support
Size and growth of
urban area
Urban Agriculture
Figure 1
People’s household level livelihood in Nepal depended mostly on livestock and
agriculture.
Major elements of UA in the
context of Nepal are Urban
Size and features, natural
and socioeconomic factors,
and institutional support is
explained in the figure-1
Source: Public Policy and LD
Opportunities and constrains
50% of the world's population lives in cities.800 million people are involved in
urban agriculture worldwide and contribute to feeding urban residents. Low-
income urban dwellers spend between 40% and 60% of their income on food each
year. By 2015 about 26 cities in the world are expected to have a population of 10
million or more. To feed a city of this size- at least 6000 tones of food must be
imported each day.
In Valley context, from the statics it is revealed that 28.2% of the economically
active population and 40% economically active female in urban area are still
engaged in agriculture sector. Unemployment rate is in decreasing trend at
national level, while it has been increased from 8.2% in 1995/96 to 13.2% in
2003/04 in the case of urban areas. (CBS 2006).The agricultural land of the valley
has been decreasing at the rate of 1.41% per year. Rapid urbanization has raised
serious environmental problems and creating the imbalanced urban ecosystem.
Many large urban areas are food deficit. On average, food inadequacy is 17% in
urban areas compared to 34% in rural areas. In case of Kathmandu valley, its
urban population is estimated to require nearly 600,000 metric tons of food grains
by 2011 (Pradhan, 2002).
“UA has emerged as an important constituent of UD in recent years in the
developing world”. (Baker et al.2000)
Rapid urban growth coupled with an inadequate government response has led
to the proliferation of unhealthy, poorly serviced, and infrastructure deficient

Urban Agriculture: A Tool for Harmonious City
7
hazard-prone areas. It is mostly the urban poor who are forced to settle in these
areas.
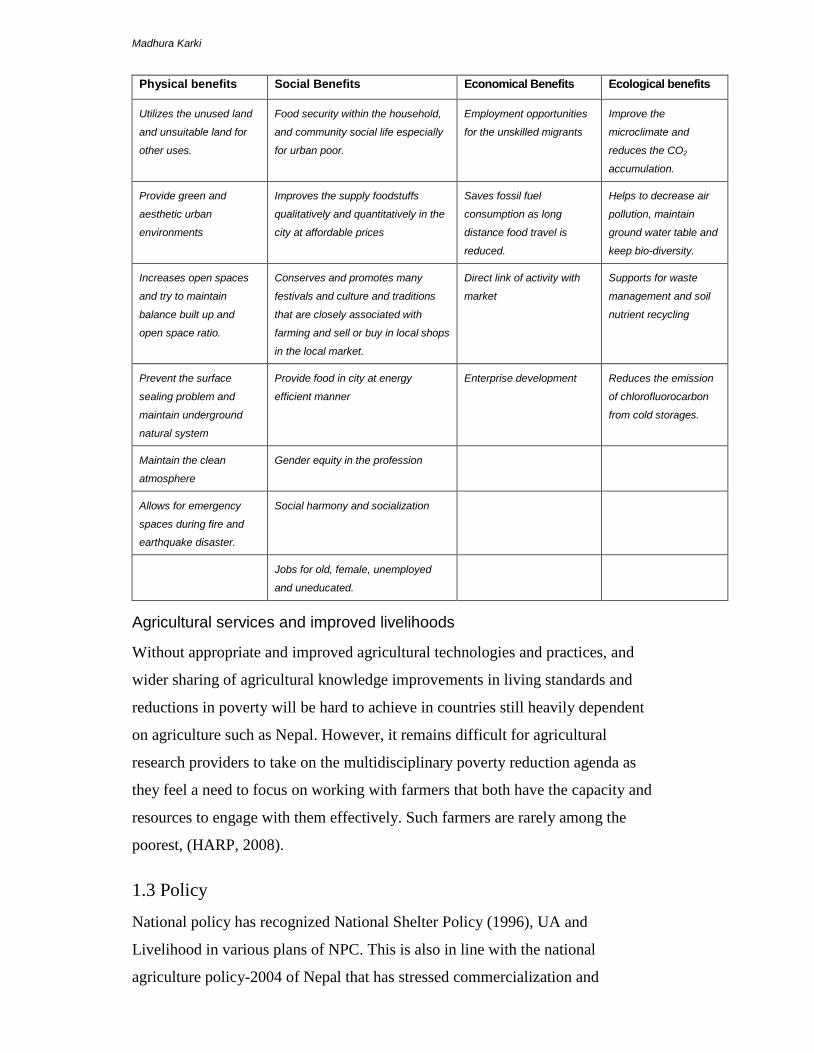
Importance, Role and significance of UA
The importance of UA is accepted globally. Nepal’s history and practices shows
the high contribution of UA on urban lives. The major advantage of urban
agriculture is that the poor can grow their own food on plots in urban areas, thus
increasing their access to much needed food and that they can also sell the little
surplus over and above their consumption in the city market. Above all, enhancing
the greenery of urban land use by turning idle open areas into plant cover is the
main aim of urban agriculture. A common and efficient form of UA is the bio-
intensive method. Because UA promotes energy-saving local food production,
urban and peri-urban agriculture are generally seen as sustainable practices. (UA-
wikipedia-2008). The emerging importance of UA can be discussed in terms of
economic, social, cultural, environmental, energy efficiency, quality of food and
other benefits. From the Literature review and Internet search UA benefits can be
summarized and categorized under sub-headings as:
Madhura Karki
Physical benefits Social Benefits Economical Benefits Ecological benefits
Utilizes the unused land
and unsuitable land for
other uses.
Food security within the household,
and community social life especially
for urban poor.
Employment opportunities
for the unskilled migrants
Improve the
microclimate and
reduces the CO2
accumulation.
Provide green and
aesthetic urban
environments
Improves the supply foodstuffs
qualitatively and quantitatively in the
city at affordable prices
Saves fossil fuel
consumption as long
distance food travel is
reduced.
Helps to decrease air
pollution, maintain
ground water table and
keep bio-diversity.
Increases open spaces
and try to maintain
balance built up and
open space ratio.
Conserves and promotes many
festivals and culture and traditions
that are closely associated with
farming and sell or buy in local shops
in the local market.
Direct link of activity with
market
Supports for waste
management and soil
nutrient recycling
Prevent the surface
sealing problem and
maintain underground
natural system
Provide food in city at energy
efficient manner
Enterprise development Reduces the emission
of chlorofluorocarbon
from cold storages.
Maintain the clean
atmosphere
Gender equity in the profession
Allows for emergency
spaces during fire and
earthquake disaster.
Social harmony and socialization
Jobs for old, female, unemployed
and uneducated.
Agricultural services and improved livelihoods
Without appropriate and improved agricultural technologies and practices, and
wider sharing of agricultural knowledge improvements in living standards and
reductions in poverty will be hard to achieve in countries still heavily dependent
on agriculture such as Nepal. However, it remains difficult for agricultural
research providers to take on the multidisciplinary poverty reduction agenda as
they feel a need to focus on working with farmers that both have the capacity and
resources to engage with them effectively. Such farmers are rarely among the
poorest, (HARP, 2008).
1.3 Policy
National policy has recognized National Shelter Policy (1996), UA and
Livelihood in various plans of NPC. This is also in line with the national
agriculture policy-2004 of Nepal that has stressed commercialization and
Urban Agriculture: A Tool for Harmonious City
9
diversification of agriculture linking directly to food security and poverty
alleviation. In keeping with this scenario, the urban agriculture approach requires
addressing the following four major issues:
(I) environmental conservation and greenery (ii) increase in agricultural
production/ productivity and employment, (iii) supplementary nutrients supply to
food, and (IV) role of municipal government, (Pradhan, Pradhan, Walter, Folmor,
2008).
Provisional Local Shelter Act-1999
This act provides the division of urban areas into different categories on the basis
of population, sources of income and other urban facilities. Each category differs
in population and urban facilities.
1. Municipal corporation
2. Sub-municipal corporation
3. Municipality
1.4 Actors and their Roles
The government’s role is to formulate policy; facilitate implementation through
investment, loan and grant and technological inputs. Local bodies are responsible
for planned development, Millennium development goal which is the global
concept and cannot be fulfilled without acting in local level. Out of eight goals
urban agriculture can help to attain the three goals viz. goal no.1 goal no.2 and
goal no.7, (Raut, 2006).The following parties will have involvement on HUD.
Government organization/Non government organizations/Individual owners/ Private
sector/IOE, as Human Resource Development and Production/HDM Alumni
Members.
2. Organisation
The Institute of Engineering, established in 1972, contributes to the production of
technicians and engineers capable of meeting the national aspirations to accelerate
the pace of development in the country. Besides this, the institute is also offering a
wide range of services for benefit of the country. The institutional objectives of
the Institute of Engineering are to produce different levels of engineering
Madhura Karki
manpower needed for meeting the national aspirations and goals. At present it is
producing engineers and overseers as well as offering Master and Ph.D. studies in
various disciplines. The second objective is to perform various researches and
development works so as to strengthen the national engineering capabilities and
solve engineering problems. The third objective is to offer training, sponsored
courses, problem oriented research and engineering consultancy services. This
objective caters towards greater mobilization of human and physical resources for
the technical advancement of the nation.
I am working in the Institute of Engineering, Nepal as an Associate Professor
under the Department of Architecture. As a woman professional and a woman
activist I am very much involved in staff and student development; contributing to
the various activities undertaken by the different centres under the institute.
Besides teaching and being consultant for various projects undertaken by the
institute, I have been serving since last thirty years by taking various
administrative positions from deputy head of the department to assistant dean.
Refer Annex – I, for IOE organization chart.
3. Urban Problem
Traditional Agriculture is not a recent phenomenon in Nepal; rather it is the
backbone of Nepalese economy as a primary occupation and subsistence
livelihood. But UA, green revolution, food green city and new green urbanism is a
recent concept developed after the fast urbanization rate and loss of arable land.
The farmers of Kathmandu live in compact settlement to save arable land
resources. In the Kathmandu Valley the settlements are on higher land ('tar' land)
separate from irrigated, rice paddy land. Generally, labour intensive work in
irrigation agriculture requires well organized societies. This is the case for the
Newars of the Kathmandu valley (Nepal, 1965).
The urban farmers in Kathmandu Valley are under pressure. This is both
related to the loss of agricultural land due to urban expansion and in terms of their
own living conditions in the traditional towns with fast increasing densities, and
marginalization.
The historic glory of Kathmandu is the result of combined effort of agriculture
and trade, but the rapid conversion of fertile agricultural land into built up areas
Urban Agriculture: A Tool for Harmonious City
11
like residential buildings and commercial complexes has snatched the living of
urban communities. The developing country like Nepal is unable to manage the
unproductive landscapes in the urban area. Therefore the concept of intensive
urban agricultural practices can reduces these problems on livelihood of urban
communities.
Kathmandu is continuously growing both in population and property values
and the availability of land is a significant obstacle to promoting urban agriculture
in Kathmandu. Unlike other cities Kathmandu is almost completely built out. The
market value of land is high and housing demand continues to grow. The low
revenues produced by urban agriculture cannot compete with the market value of
other forms of development. Land speculation in the peri-area is increasing threat
to the occupation and letting no more spaces to the urban agriculture. Minimum
exposure to the modern technology, training and high value crop is prevalent.
Since no awareness about UA so contaminated land, polluted water, air pollution
is problems of UA. At the same time larger food production by industrial
authorities are cheaper and faster and it becomes a threat to UA.
Basic urban agricultural development facilities, such as storage, credit,
extension and training services, transport and communication, and research
activities are inadequately available. In addition, urban farmers are disorganized
and scattered due to lack of organizations among themselves.
The issues to be answered are how the arable land in the urban areas can be
conserved is a major issue with the following leading questions:
• how can the livelihoods of the communities with primary sector (e.g.
agriculture) be sustained in urban area
• How can the aspect of new urbanism and urban greenery be integrated
with urban living of communities at local level?
• How this approach can be beneficial for harmonious urban development?
4 Proposals for Change and Improvement
In order to derive the proposal for change, case studies were carried out. And,
further studies will be carried out in relation to the issues raised in the chapter of
problem identification.

Madhura Karki
Methodologies for mini research
The case study area was selected from two communities each from Kathmandu
and Lalitpur to conduct a mini research on livelihood from urban farming.
Research Steps
Assumed that the pattern and crops growth vary by location, social feature and
urbanization rate, so two different sites were selected, Kirtipur and Lubhu.
Inductive method of reasoning was applied and post positivist paradigm for
history, observing agricultural communities, existence and constructivist
paradigm for observation inquiry and understanding of the past and reconstruction
of a theory in today's context was adopted. Chiefly qualitative methods used but to
support and expand upon qualitative methodology quantitative methods for
sampled households as:
Compiled sample size was calculated as: 2)(1 eN
Nn
Where n is sample size, N is population / household (e) 2
is sample error.
For mini research Deu-Dhaka ward no 2, in Kirtipur and Lubhu ward 3KA was
chosen to study how many urban farmers are still in farming and depending on
UA.
Study Area – One
The urban fabric of Kirtipur combines the elements of a multiple village with
features common to the three cities of the valley. The tentative urban contours are
Theory
construction11
111111111
Step-1
Inductive
reasoning
Step-2 Step-3
Step-4
Step-6
Step-7
Step-8 Step-9
Step-10
Step-5
Urban Agriculture: A Tool for Harmonious City
13
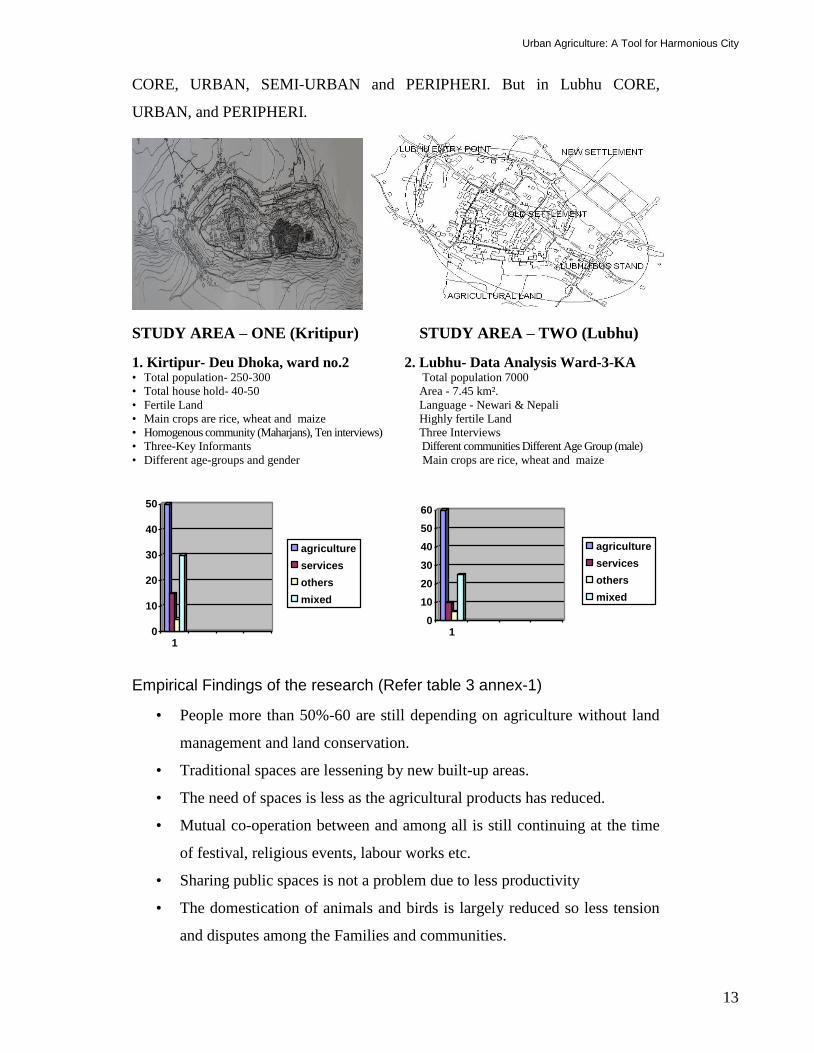
CORE, URBAN, SEMI-URBAN and PERIPHERI. But in Lubhu CORE,
URBAN, and PERIPHERI.
STUDY AREA – ONE (Kritipur) STUDY AREA – TWO (Lubhu)
1. Kirtipur- Deu Dhoka, ward no.2 2. Lubhu- Data Analysis Ward-3-KA • Total population- 250-300 Total population 7000
• Total house hold- 40-50 Area - 7.45 km².
• Fertile Land Language - Newari & Nepali
• Main crops are rice, wheat and maize Highly fertile Land
• Homogenous community (Maharjans), Ten interviews) Three Interviews
• Three-Key Informants Different communities Different Age Group (male)
• Different age-groups and gender Main crops are rice, wheat and maize
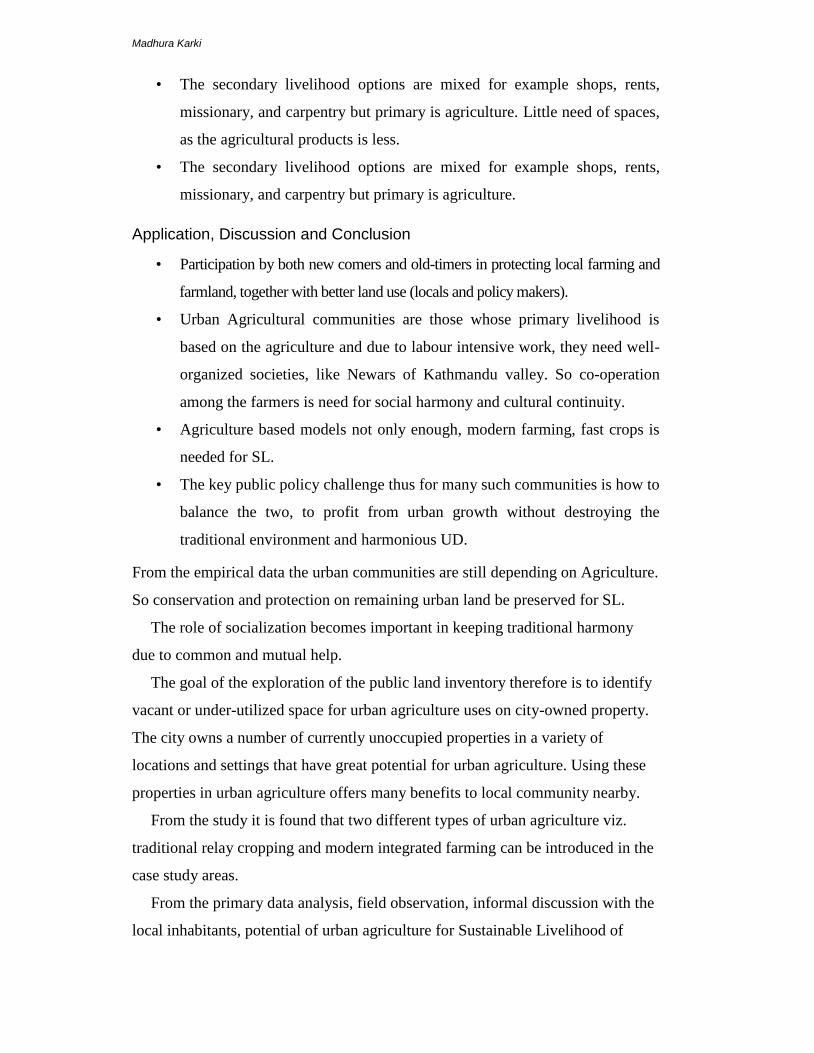
Empirical Findings of the research (Refer table 3 annex-1)
• People more than 50%-60 are still depending on agriculture without land
management and land conservation.
• Traditional spaces are lessening by new built-up areas.
• The need of spaces is less as the agricultural products has reduced.
• Mutual co-operation between and among all is still continuing at the time
of festival, religious events, labour works etc.
• Sharing public spaces is not a problem due to less productivity
• The domestication of animals and birds is largely reduced so less tension
and disputes among the Families and communities.
0
10
20
30
40
50
1
agriculture
services
others
mixed
0
10
20
30
40
50
60
1
agriculture
services
others
mixed
Madhura Karki
• The secondary livelihood options are mixed for example shops, rents,
missionary, and carpentry but primary is agriculture. Little need of spaces,
as the agricultural products is less.
• The secondary livelihood options are mixed for example shops, rents,
missionary, and carpentry but primary is agriculture.
Application, Discussion and Conclusion
• Participation by both new comers and old-timers in protecting local farming and
farmland, together with better land use (locals and policy makers).
• Urban Agricultural communities are those whose primary livelihood is
based on the agriculture and due to labour intensive work, they need well-
organized societies, like Newars of Kathmandu valley. So co-operation
among the farmers is need for social harmony and cultural continuity.
• Agriculture based models not only enough, modern farming, fast crops is
needed for SL.
• The key public policy challenge thus for many such communities is how to
balance the two, to profit from urban growth without destroying the
traditional environment and harmonious UD.
From the empirical data the urban communities are still depending on Agriculture.
So conservation and protection on remaining urban land be preserved for SL.
The role of socialization becomes important in keeping traditional harmony
due to common and mutual help.
The goal of the exploration of the public land inventory therefore is to identify
vacant or under-utilized space for urban agriculture uses on city-owned property.
The city owns a number of currently unoccupied properties in a variety of
locations and settings that have great potential for urban agriculture. Using these
properties in urban agriculture offers many benefits to local community nearby.
From the study it is found that two different types of urban agriculture viz.
traditional relay cropping and modern integrated farming can be introduced in the
case study areas.
From the primary data analysis, field observation, informal discussion with the
local inhabitants, potential of urban agriculture for Sustainable Livelihood of

Urban Agriculture: A Tool for Harmonious City
15
Urban Farms in Kirtipur and Lubhu at Kathmandu is assessed with the SWOT
analysis as described below. .
Strength Weakness Opportunity Threat
Close proximity to
market centres
Agricultural activity is not
formally recognized.
Employment to all House
Hold members.
Decreasing order of
agricultural land
Availability of river
water for irrigation
Difficulty in access to land Learning centre and
research for the
student/Teacher
Demand of land
tenure right from the
farmer
High fertility land Increased land pooling for
housing and land
fragmentation among
communities and family.
Possibility of integration
of vegetable and
livestock.
Theft and vandalism
Greenery through
agriculture
Lack of municipal land use
map
Save the public land from
squatting
Contamination to river
water cause
entrophication
problem
Employment
opportunity for the
migrants and local
Farmers
High yield motor vehicle bore
air pollution, NOx, SOx, HC,
PM, Pb, secondary
pollutants O3.
Saving the transportation
cost of waste.
Haphazard urban
expansion.
Existence of traditional
skills for intensive
farming
Lack of institutional
mechanism.
Health benefits to the
elder people and First
hand access to nutritious
food for the urban poor.
Younger generation
from the urban
inhabitants not
interested in
agriculture.
Availability of small
scale financial
cooperative
organization
Conversion of urban
waste land into
productive one
From the SWOT analysis it is revealed that there is high possibility of urban
agricultural activity by integrating it with urban ecological system, which will
strengthen to Harmonious Urban Development.
Madhura Karki
5. Personal Action Plan
My personal action plan reflects activities at the government level and at the
institute level (University) I am engaged with. The actions are divided as short
term and long term.
Action Plan with the Government Agencies
Government, Physical planning authorities, National planning commission
& others
Short term (2009)
Harmonious Urban Development awareness programmes throughout the nation
with slogans like:
• Local production local use.
• Agricultural services and improved livelihoods
Through
• Government Agents
• Institutions and Private, NGOs, INGOs
• Alumni Members
Community Mobilization: Community centres and garden educate the community
to see agriculture as an integral part of urban life.
Long Term (2013)
Sensitization workshops on the themes such as:
Urban Agriculture as a tool for poverty reduction.
Integration of UA in Planning and develop concept of food green city.
Coordination of government partners and other Institutions, Associations,
CBOs, NGOs, INGOs and private sector to impart proper knowledge
among them for better policies and uses.
Financial support to the lower income groups and urban poor through the
help of government & private banks.
Increase women access to land and maximum involvement of Professional
as well as grass root women in urban agriculture

Urban Agriculture: A Tool for Harmonious City
17
Action Plan with the Institute of Engineering
Short term (2009)
Situational Analysis of existing land and dependency rate on farming in
urban areas through the Staff and student.
Conduct researches on the theme by mobilizing PhD, MSc. and Bachelors
students of Department of architecture.
Long term (2013)
The proposals will be forwarded through the department at four levels as a
research thesis, to the government, University, Institute and Local government under
various activities such as:
Policy recommendation and provide training for arable land conservation
and preservation.
Revision of syllabus and introducing the UA facts and findings where
necessary suggested by the related departments, centres and from other
trainings.
Create a sub-unit under IECS (consultancy Services) advocating UA for SL
and HUD.
Conduct interactions among stakeholders about UA for SL of urban
farmers/poor and concept of food green city and Harmonious Urban
development

Madhura Karki
References
Butler, L. and D.M. Moronek eds.
2002 Urban and Agriculture Communities: Opportunities for Common Ground.
Council for Agricultural Science and Technology. Ames lowa. CAST.
CBS
2004 Nepal Living Standard Survey, 2003/04. NG National Planning
Commission Secretariat, Kathmandu, Nepal.
CBS
2006 Nepal Living Standard Survey (1995/96) and (2003/04). NG National
Planning Commission Secretariat, Kathmandu, Nepal.
FAO
Urban and Perio-urban Agriculture, Household Food Security and
Nutrition.
______
Fractured images of Peril-Urban commercial agriculture. Allison Brown
consultant, Tuscarosa lut. USA.
______
Fractured Images, Internet.
National Planning Commission Nepal (NPC)
2002 The Tenth Plan 2002-2007. Kathmandu.
Pradhan, Walter, Folmor
2008 Public policy and Local Development, Opportunities and Constrains.
Kathmandu, Nepal.
Prasain, J.N.
2006 Poverty Alleviation and Livelihood Options in Rural Nepal. T.U.
Raut, U.B.
2006 Urban Agriculture for sustainable for Urban Development, Kathmandu.
M.Sc., Urban Planning.
Urban Agriculture: A Tool for Harmonious City
19
Shresth, Sunil Babu
2004 A Sustainable City Planning Methodology for 21st Century (Concept of
Food Green City. Osaka Sangyo University.
Thapa, Naresh
2003 Agricultural Land Conversion in Brick Making Process in Kathmandu
Valley (Draft Thesis). Department of Urban Design and Planning,
Norwegian University of Science and Technology (NTNU)
Uprety S.
2002 Options for Private Sector's involvement in urban land development, A
case of greater Kathmandu. Master's thesis, Institute of Engineering.
_____
Urban agriculture . Wikipedia, the free encyclopedia.
_____
Urban Agriculture for sustainable UD. Internet.
Waibel, H.
2000 Urban Agriculture. Vortrag im Agrarökonomischen Seminar der
Universität Göttingen.
* Various Seminars, Dialogues, Networking and Round Table
themes/conclusions from the WUF4 is included and will incorporate more before
presenting to the institute (Department).
* For Operational Definition, Acknowledgement, Abbreviation/Acronyms and
other references, see Annexes.

Madhura Karki
Annex-I: Tables for main text
Table-1 : NLSS Survey of 2003/004
Description Nepal Living Standards Survey
1995/96 2003/04
Percent of Population (0-14 years) 42.4 39.6
Percent of Population (15-59 years) 50.8 52.8
Percent of Population (60 years and over) 6.8 7.6
Sex Ratio (Number of males per 100 females) 95.5 92.3
Dependency Ratio 97.0 89.2
Household size 5.7 5.3
Percent of female headed households 13.6 19.6
Table-2: NLSS Survey of 2003/004
2000 2004 2005
Fertility rate, total (births per woman) 4.0 3.5 ..
Mortality rate, infant (per 1,000 live births) 69.0 58.6 ..
Mortality rate, under-5 (per 1,000) 95.0 76.2 ..
Births attended by skilled health staff (% of total) 11.9 15.0 ..
Malnutrition prevalence, weight for age (% of children under 5) .. .. ..
Immunization, measles (% of children ages 12-23 months) 71.0 73.0 ..
Prevalence of HIV, total (% of population ages 1-49) .. .. 0.5
NLSS 2003/04 reveals that the percent of population in 0-14 year’s age group has
decreased slightly from 42 to 40 that in 15-59 years age group has increased from
51 to 53, and that in 60 years and over age group remained about the same in the
last eight years. Dependency ratio, sex ratio and household size exhibited a
decreasing trend during the same period while the proportion of female-headed
households increased from 14 percent to 20 percent. NLSS 2003/04 results are
generally comparable with those of Population Census 2001.
Urban Agriculture: A Tool for Harmonious City
21
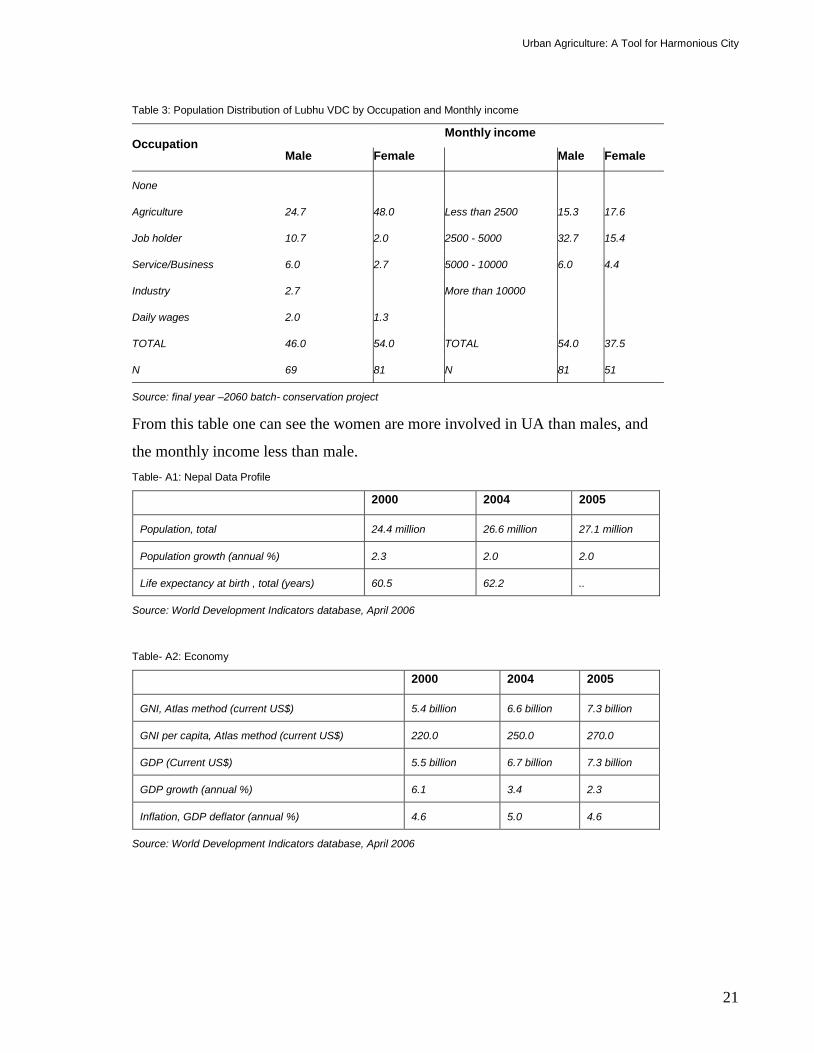
Table 3: Population Distribution of Lubhu VDC by Occupation and Monthly income
Occupation Monthly income
Male Female Male Female
None
Agriculture 24.7 48.0 Less than 2500 15.3 17.6
Job holder 10.7 2.0 2500 - 5000 32.7 15.4
Service/Business 6.0 2.7 5000 - 10000 6.0 4.4
Industry 2.7 More than 10000
Daily wages 2.0 1.3
TOTAL 46.0 54.0 TOTAL 54.0 37.5
N 69 81 N 81 51
Source: final year –2060 batch- conservation project
From this table one can see the women are more involved in UA than males, and
the monthly income less than male.
Table- A1: Nepal Data Profile
2000 2004 2005
Population, total 24.4 million 26.6 million 27.1 million
Population growth (annual %) 2.3 2.0 2.0
Life expectancy at birth , total (years) 60.5 62.2 ..
Source: World Development Indicators database, April 2006
Table- A2: Economy
2000 2004 2005
GNI, Atlas method (current US$) 5.4 billion 6.6 billion 7.3 billion
GNI per capita, Atlas method (current US$) 220.0 250.0 270.0
GDP (Current US$) 5.5 billion 6.7 billion 7.3 billion
GDP growth (annual %) 6.1 3.4 2.3
Inflation, GDP deflator (annual %) 4.6 5.0 4.6
Source: World Development Indicators database, April 2006

Madhura Karki
Table A3: Distribution of households by occupancy
(Percent)
Owner Renter Rent-free Other Total
Urban 72 23.5 3.8 0.7 100
Kath. Valley 62.5 33.1 3 1.4 100
Other 77.2 18.2 4.3 0.4 100
Table A4: Average number of rooms and average size of dwelling
(Percent)
Average
Number of
Rooms
Average size of
Dwelling (Sq.Ft.)
Average Area of Housing
Plot* (Sq.Ft.)
Urban 4.5 584.0 1448
Kath. Valley 4.8 589.0 1162
Other 4.3 581.0 1606
Table A5: Percentage of households with access to various facilities (percent)
Electricity Telephone Sanitary
System
Garbage
Disposal Toilet
Urban 87.4 31.9 54.4 45.0 81.3
Kathmandu Valley 99.1 51.3 98.1 83.0 98.9
Other 80.9 21.2 30.4 24.1 71.6
Table A6: Population Projection of the Kathmandu Valley
Items/Year 2001
Population of Valley 1618159
Households number 318630
Average person per household 5.08
Population Growth* 3.834%

Urban Agriculture: A Tool for Harmonious City
23
Table A7: Population Projections
Estimated population for 2011 2357312
Estimated population for 2021 3434100
Population increase from 2001 to 2021 1815941
Population Growth* 3.834%
Source: Census 2001 (for population)
Population growth: is calculated from census data 1981 (population 740619) and 1991 (Population, 1078909).
Madhura Karki
Annex-II: The Role of Valley in Agriculture
The aggregated yield for three main crops rice, wheat and maize in Kathmandu
valley between 1967/68 to 1982/83 have increase from 2.2 ton to 3 ton per hectare
while the aggregated national product for the same period declined from 1.83 ton
to 1.77 (PADCO, 1986).
Rice production is the major rainy crop in the valley followed by wheat and
maize in winter season. The yield per ton per hectare for rice was 3.49 in 1982/83
significantly higher than national average of about 108 tons per hectare. The
aggregate production of three crops had increasing trend between 1967 to 1977,
fell sharply because of bad weather during 1977-79 and recovering in 1981 to a
increase of 32% production over 1967/68 (PADCO, 1986).
The cultivatable area for main crops despite of reduction by 12%, their
combined production increased considerably. The total production even goes
more when added with minor crops like, barley, millet, potatoes and so on.
The aggregate production of major crops in 1967/68 and 1982/83 accounted for
4.32 percent of national production and about 3.4 percent of total of total
cultivated lands occupied by these crops. The food balance estimate of valleys
shows there is surplus of 3% of the food grain needs in 1971/72. By 1974/75 and
1980/81, the districts produce 98% and 97% of the food grain needs. However,
latter year’s trends shows that Kathmandu valley declined in producing food
grains.
Land System in Kathmandu Valley
LRMP data shows 17% of valleys land is occupied by alluvial plains while river
channels make up about 1.4% of the land area, Principle Rivers being Bagmati,
Bishnumati and Manahara. The alluvial lands are most productive lands, irrigable
and intensely cultivated. Another land system of the valley is tar lands. They are
elevated lands and are flat plateau-like land forms and are separated by flood
plains.
Land Capability
LRMP land classifies Kathmandu valley into three classes, the class I, having
little limitation on agriculture is the land consists of alluvial plains and undersexed
Urban Agriculture: A Tool for Harmonious City
25
tar lands making up 34% of valley area. Class I land is fertile and very productive
and intensively farmed. The urban areas of valley mostly fall in this area. LRMP
map reveals about 14% of class I land was occupied by urban use in 1979.
Class II land consists of dissected tar lands and alluvial fans and makes up 22%
of valley land. Soil is deep and well drained. Class II land lies towards the outer
limit of the valley and some northern parts. The class III and IV land consists of
sloping and mountainous areas and conversion of agriculture land.
The built up area of greater Kathmandu which comprises of Kathmandu and
Lalitpur Municipal area, increased by 88% from 1971 to 1981, a growth rate of
6.52%. The growth resulted in a loss of about 1500 ha of agricultural land. In
1979 the urban areas occupied 2850 ha of land which is 14% of class I land.
Despite urban growth started to have impact on class I land, more than 90%
percent of agricultural land was still left.
However, the situation in the greater Kathmandu, between 1981 and 1991
shows significant changes in agricultural land. The urbanized area increased to
7195 ha showing a loss of 4345 ha of fertile land in the process of unplanned
urbanization in the valley (HMG/IUCN, 1995). During 1971 to 1991, the urban
area has increased to three times. An EMAG study (1992) estimated that about
150 ha of fertile land are lost every year for urban purpose. Between 1984 and
1994, urban area in the valley increased from 3096 ha to 8378 ha and 5282 ha of
agricultural land is lost (HMG, 1999).
Madhura Karki
Annex-III: Acknowledgement
I would like to take this opportunity to express my sincere gratitude to all who
supported and helped me in preparation of my presentation. I would like to
express my sincere gratitude to Prof. Johnny Astrand for his guidance through
mail, creating Lund platform and providing necessary suggestions and support. I
like to thank Lena Andersson for providing administrative assistance. Annette and
Laura for necessary correspondence.
I also acknowledge with gratitude the support received from Mr.Arjune
Koirala, Mr. Sanjay Uprety, Mr Shyam Khadka.
In preparing this draft, numerous organization and individuals have been
contacted, interviewed and they all deserve sincere thanks for unconditional help
by making with relevant documents, data and information. The words of
acknowledgement will not complete without thanking to Sida, HDM and Lund
University.
Last but not the least, thanks to all my friends and familiars who helped me and
supported me in many ways.
Madhura Karki
2008

Urban Agriculture: A Tool for Harmonious City
27
Annex - IV: Abstract
The objective of HUD-4 is to improve living standards for poor people in
developing countries and thus alleviate poverty. Awareness of sustainable UD and
support poverty alleviation. Considering the given objective I like to concentrate
on the UA for SL of U farmers to meet the goal of HUD. In my opinion UA is one
of the main elements of HUD. For better understanding I have tried to collect an
Empirical data on livelihood of urban farmers/poor of two Neighbourhoods, each
from two traditional cities of Kathmandu. I did a small mini research. To asses
how the lives of urban farmers are threatened due to haphazard growth of new
built up structures loosing the arable land, whose primary occupation was
agriculture.
1. This research based paper will be action oriented since the involvement of
M.Sc. student, also this will be developed as a research thesis for T.U. and
recommendation to the govt. is the ultimate goal.
2. The new knowledge on UA, livelihood for SL towards HUD will be
prioritized, categorized and involve student, fellow colleagues, and
university fellow researcher. Planner local and national government is the
main aim.
Madhura Karki
ANNEX - V: Abbreviation/Acronyms
ADB Asian Development Bank
ACDPL Ansal Chaudhary Developers Private Limited.
CBDM Community Based Disaster Management
CBS Central Bureau of Statistics
CDO Chief District Officer
DDC District Development Committee
DDC District Development Committee
DHUD Department of Housing and Urban Development
DHUD Department of Housing and Urban Development
DIPECHO The Disaster Preparedness Programme of the European
DUDBC Department of Urban Development and Building Construction
EWS Economically Weaker Section
GDP Gross Domestic Product
GLD Guided Land Development
GoN Government of Nepal
Ha Hectare
HDFC Housing Development Finance Company
HIG Higher Income Group
HRD Human Resource Development
HUD Harmonious Urban Development
HUDCO Housing and Urban Development Company
IAP Integrated Action Plan
ICIMOD International Center for Mountain Development
NGO Non Governmental Agency
NHS National Housing Survey
SL Sustainable Livelihood
SYB Statical Year Book
UA Urban Agriculture
UC Urban Communities
UD Urban Development
UF Urban Farming

Urban Agriculture: A Tool for Harmonious City
29
UL Urban Land
VDC Village Development Committee
WB World Bank
1 Anna 4 Dam = 31.80 m².
1 Dam 4 Paisa = 7.95 m².
1 Hectare 19.6 Ropani =10 000m².
1 Ropani 16 Anna = 508.74 m².

Madhura Karki
ANNEX - VI: Operational Definitions
Urban Agriculture
"Urban agriculture is an industry located within (intra-urban) or on the fringe
(peri-urban) of a town, a city or a metropolis, which grows and raises, processes
and distributes a diversity of food and non-food products, (re-) using largely
human and material resources, products and services found in and around that
urban area, and in turn supplying, (FAO).
Livelihood
In a broad sense livelihood denotes all the means that are needed for human
beings to live. People's livelihood refers to social, economic, political, physical,
and ecological attributes where people have been living and getting their
livelihood out of complex settings. Putting it succinctly, livelihood comprises the
capabilities, assets and activities required for a means of living (www.livelihood.or-
6/22/2002).
Sustainable Livelihood
A livelihood is sustainable that can cope with and recover from stress and shocks,
maintain and enhance its capabilities and assets, and provide sustainable
livelihood opportunities for the next generation. It must also contribute net
benefits to other livelihoods at the local and global levels in the long as well as
short terms (Chambers and Conway [1992] adopted in DFID, 2000:1.1). The
Brundtland Commission (in 1987) also introduced sustainable livelihood (SL) in
terms of resource ownership and access to basic needs and livelihood security.