urban flood management in surabaya city: … flood management in surabaya city: anticipating changes...
TRANSCRIPT

Urban Flood Management In Surabaya City: Anticipating Changes in the Brantas River
System
Cahyono Susetyo
March, 2008

Urban Flood Management in Surabaya City: Anticipating Changes in the Brantas River System
by
Cahyono Susetyo
Thesis submitted to the International Institute for Geo-information Science and Earth Observation in
partial fulfilment of the requirements for the degree of Master of Science in Geo-information Science
and Earth Observation, Specialisation: Urban Planning and Management
Supervisors
Ir. M.J.G. Brussel (First Supervisor)
Dr. D. Alkema (Second Supervisor)
Thesis Assessment Board
Dr. A. Sharifi (Chair)
Prof.Dr. A. van der Veen (External Examiner)
Ir. M.J.G. Brussel (First Supervisor)
Dr. D. Alkema (Second Supervisor)
INTERNATIONAL INSTITUTE FOR GEO-INFORMATION SCIENCE AND EARTH OBSERVATION
ENSCHEDE, THE NETHERLANDS

Disclaimer This document describes work undertaken as part of a programme of study at the International Institute for Geo-information Science and Earth Observation. All views and opinions expressed therein remain the sole responsibility of the author, and do not necessarily represent those of the institute.


i
Abstract
Concentration of people, activities, and transportations, made hazard management in urban areas
became a very complex system. Hazard threats in urban areas may vary, depending on its internal or
external characteristics. A city may face earthquake hazard, while other city facing flood hazard, and
some city even facing two or more hazard threats at the same time. These presences of hazard threats
can be induced by natural causes, man-made causes, or even combination of both causes. External
changes around the city can also created new hazard problems, which some times totally unpredicted
before.
An example of a city that facing a new flood hazard is Surabaya City, which located in the Delta
Brantas Region. In this region, Brantas River, the longest river in East Java Province, was divided into
two rivers; Surabaya River, the main river in Surabaya City, and Porong River, a man-made diversion
channel that built to protect Surabaya from flooding. In present condition, most of Brantas River
water was safely discharged to the sea through Porong River, and only 2% of Brantas River discharge
entering Surabaya City through Surabaya River. This established river flow configuration is
threatened by the presence of the Mud Flood disaster in Sidoarjo, a nearby municipality from
Surabaya, which can reduce the capacity of Porong River. As the result, larger proportion of Brantas
River discharge can entering Surabaya City, and threatened to cause new flood problems in Surabaya.
This study was carried out to analyze the possible impact of changes in Brantas River System to flood
problems in Surabaya City using 1D2D flood modelling in SOBEK software, which was developed by
Delft Hydraulics. Different flood scenarios were developed by adjusting the flood modelling
parameters, and then, Flood Hazard Analysis and Flood Risk Analysis were performed to determine
the extent of flood problems caused by changes in Delta Brantas region. The result of the flood
modelling show that Surabaya City facing an increasing flood hazard due to changes in Brantas River
System.
Flood mitigation measures scenarios then developed, which consists of two groups; Structural
Measures and Non-Structural Measures. Structural measures were developed using two methods,
which are Regulatory Structures adjustment and Channel Improvement. Each measure then simulated
to assess their impact on flood hazard reduction. The results show that regulatory structures
adjustment is only effective if discharge of Surabaya River is not exceeding 20% of Brantas River
Discharge. The model shows that another structural mitigation measure, the channel and flow
improvement, can give a greater impact on flood hazard reduction.
Non-Structural mitigation measures also developed by catchment area improvement and development
control. Although these two measures were not simulated using 1D2D flood modelling, they also can
provide a significant impact on flood hazard reduction and play an important role on Urban Flood
Management in Surabaya City.
Keywords: 1D2D flood modelling, Flood Hazard, Flood Risk, Structural Measures, Non-Structural
Measures.

ii

iii
Acknowledgements
Alhamdulillah, praise to ALLAH, the most gracious, the most merciful, I can finish my thesis and my
18 month of study in ITC on time. I would like to acknowledge my wife, Ony Devita Shintyasari for
her enormous support she gave to me during the completion of my study in Enschede. I would like to
dedicate this thesis to my son, Arkaan Javier, for being an amazing child. I also would like to thanks
to my family, both in Bandung and Lawang, for their total support.
I want to give a special gratitude for my supervisors, Ir. M.J.G. Brussel and Dr. D. Alkema for their
supports and knowledge they gave to me during the completion of my thesis. Indeed, their
experiences are very valuable, and having discussions with them are a great pleasure for me. I am sure
that the knowledge they share with me are going to be very useful for my future development. Their
patience when facing unexperienced person such my self also an important quality that all lecturers
should have.
I also want to give my appreciation to ITC-UPM staffs who have gave me a lot of new things to learn,
and having the opportunity to study at ITC is one of the greatest achievement I have in my life.
Special thanks to UPM’s Program Director, Mr. Emile Dopheide, who made every administrative
issue during my study is very easy to be solved. Another person who gave me a great contribution is
Mr. Amien Widodo, head of Unit of Disaster Study at 10th Nopember Institute of Technology,
Surabaya, for his support during my fieldwork.
Finally, special gratitude for my UPM friends, who have been a really great friends, and surely they
made my study at ITC was very colourful. Also for my Indonesian friends, who came together with
me to Encshede, and hopefully we can go back home and give a huge contribution to the development
of our nation.
Cahyono Susetyo
Enschede, March 2008

iv
Table of contents
1. Introduction ..................................................................................................................................... 1 1.1. Research Background ............................................................................................................ 1 1.2. Background and Justification................................................................................................. 1 1.3. Research Problem .................................................................................................................. 2 1.4. Research Objective ................................................................................................................ 3 1.5. Research Objective ................................................................................................................ 4 1.6. Research Methodology .......................................................................................................... 4 1.7. Research Layout..................................................................................................................... 7
2. Study Area....................................................................................................................................... 1 2.1. Overview................................................................................................................................ 1
2.1.1. Topography........................................................................................................................ 2 2.1.2. Land use............................................................................................................................. 2
2.2. Climate and Weather.............................................................................................................. 3 2.3. Brantas River Basin ............................................................................................................... 4 2.4. Flood Problems ...................................................................................................................... 6
2.4.1. Past Flood Events .............................................................................................................. 6 2.4.2. River and Drainage Network............................................................................................. 8
2.5. Data Requirement Analysis ................................................................................................... 9 2.5.1. Available Data ................................................................................................................... 9 2.5.2. Required Data.................................................................................................................. 10
2.6. Data Collection .................................................................................................................... 10 A. Policies and Regulation ....................................................................................................... 11 B. Water Discharge................................................................................................................... 11 C. Discharge Capacity .............................................................................................................. 12 D. River Cross Sections............................................................................................................ 12 E. Additional Height Points ..................................................................................................... 13
3. Literature Review.......................................................................................................................... 15 3.1. Urban Flood Management ................................................................................................... 15
3.1.1. Structural Defence........................................................................................................... 15 3.1.2. Non-Structural Measures................................................................................................. 17
3.2. Hydrodynamic Modeling ..................................................................................................... 17 3.2.1. 1D Flood Modelling ........................................................................................................ 17 3.2.2. 2D Flood Modelling ........................................................................................................ 18 3.2.3. 1D2D Flood Modelling ................................................................................................... 20
3.3. Digital Terrain Modeling..................................................................................................... 21 3.3.1. Digital Elevation Model (DEM)...................................................................................... 21 3.3.2. Digital Surface Model ..................................................................................................... 21 3.3.3. DEM Interpolation Methods............................................................................................ 22 3.3.4. DEM Quality Assessment ............................................................................................... 25
4. Digital Terrain Modeling .............................................................................................................. 27 4.1. Introduction.......................................................................................................................... 27

v
4.2. DEM Construction................................................................................................................28 4.2.1. TIN ...................................................................................................................................28 4.2.2. IDW ..................................................................................................................................29 4.2.3. Kriging..............................................................................................................................29
4.3. DEM Accuracy Assessment .................................................................................................33 4.4. DSM Construction ................................................................................................................34
5. Flood Management Policies...........................................................................................................37 5.1. Policies of River and Water Management ............................................................................37
5.1.1. National and Regional Policies ........................................................................................37 5.1.2. Brantas River Basin Management ....................................................................................38 5.1.3. Brantas Delta Region Management..................................................................................43
5.2. Flood Mitigation Measures...................................................................................................44 5.2.1. Management Boundaries ..................................................................................................44 5.2.2. Institutional Hierarchy and Coordination.........................................................................45 5.2.3. Structural Defence............................................................................................................46 5.2.4. Non-Structural Measures..................................................................................................48
6. Flood Modelling.............................................................................................................................53 6.1. Introduction...........................................................................................................................53 6.2. Model Schematisation ..........................................................................................................54 6.3. Boundary Conditions ............................................................................................................57
6.3.1. Inflow Discharge ..............................................................................................................57 6.3.2. Rainfall Intensity ..............................................................................................................58 6.3.3. Sea Tide............................................................................................................................59 6.3.4. Surface Roughness ...........................................................................................................60
6.4. Model Calibration.................................................................................................................61 6.5. Model Sensitivity..................................................................................................................62
7. Flood Risk Analysis .......................................................................................................................67 7.1. Introduction...........................................................................................................................67 7.2. Flood Hazard.........................................................................................................................69
7.2.1. Factors Influencing Flood Hazard ....................................................................................69 7.2.2. Flood Depth......................................................................................................................70 7.2.3. Flood Duration .................................................................................................................71
7.3. Flood Hazard Mapping .........................................................................................................72 7.3.1. Conditional Method..........................................................................................................72 7.3.2. Weighted Sum ..................................................................................................................75
7.4. Vulnerability Analysis ..........................................................................................................78 7.4.1. Flood Risk Analysis .........................................................................................................80
8. Flood Mitigation Scenarios............................................................................................................85 8.1. Introduction...........................................................................................................................85 8.2. Structural Measures Scenario ...............................................................................................85
8.2.1. Regulatory Structures Adjustment ...................................................................................86 8.2.2. Channel and Flow Improvement ......................................................................................88
8.3. Non-Structural Measure Scenario.........................................................................................91 8.3.1. Catchment Area Improvement..........................................................................................91 8.3.2. Development Control .......................................................................................................92

vi
9. Conclusion and Recommendation................................................................................................. 95 9.1. Delta Brantas River System................................................................................................. 95 9.2. Flood Risk Analysis............................................................................................................. 96 9.3. Flood Mitigation Measures.................................................................................................. 97 9.4. Recommendation to Surabaya City’s Government.............................................................. 98 9.5. Recommendation for Future Studies ................................................................................... 99

vii
List of figures
Figure 1.1 Delta Brantas River Network.................................................................................................3
Figure 1.2 Conceptual Framework...........................................................................................................6
Figure 2.1 Surabaya City, East Java, Indonesia .......................................................................................1
Figure 2.2 Land Use of Surabaya City.....................................................................................................3
Figure 2.3 Brantas River Basin ................................................................................................................5
Figure 2.4 Past Flood Events in Surabaya City.......................................................................................7
Figure 2.5 River and Drainage Network in Surabaya City ......................................................................8
Figure 2.6 Flood Forecasting and Warning System Control Room......................................................11
Figure 2.7 An Example of Regulatory Structure (Lengkong Barrage) ..................................................12
Figure 2.8 Additional Height Point Data ..............................................................................................13
Figure 3.1 TIN Interpolation Method....................................................................................................22
Figure 3.2 IDW Power Parameter .........................................................................................................23
Figure 3.3 Example of Semivariogram ..................................................................................................25
Figure 4-1. DTM Overall Methodology.................................................................................................27
Figure 4-2 Elevation Data Overview.....................................................................................................28
Figure 4-3 Cross-Validation of IDW Interpolation................................................................................29
Figure 4-4 Variogram Models................................................................................................................30
Figure 4-5 Gaussian Variogram Model and Cross-Validations.............................................................30
Figure 4-6 Spherical Variogram Model and Cross Validations............................................................31
Figure 4-7 Circular Variogram Model and Cross Validations..............................................................31
Figure 4-8 Comparison of Interpolation Methods..................................................................................32
Figure 4-9 Visual Comparison of IDW and Spherical Kriging ............................................................34
Figure 4-10. DSM Boundary..................................................................................................................35
Figure 4-11. DSM Construction Scheme ...............................................................................................35
Figure 5-1 Institutional Framework in Brantas Basin Management ......................................................40
Figure 5-2 Flood Control Scheme of Brantas River Basin ....................................................................42
Figure 5-3. Brantas River Basin.............................................................................................................44
Figure 5-4 Flood Mitigation Hierarchy..................................................................................................46
Figure 5-5. Structural Defense Adjustment During Flood Event ..........................................................48
Figure 5-6 Flood Proofing Methods......................................................................................................50
Figure 6-1. 1D2D Combination in SOBEK ...........................................................................................53
Figure 6-2 Y-Z Cross Section Profile ....................................................................................................54
Figure 6-3 Channel Interpolation Method..............................................................................................55
Figure 6-4 1D2D Connection.................................................................................................................56
Figure 6-5 FLOOD MODELING SCHEMATISATION.......................................................................56
Figure 6-6. Hydrograph for Brantas River Downstream........................................................................57
Figure 6-7. Sea Tide Adjustment ...........................................................................................................61
Figure 6-8 Model Calibration.................................................................................................................62
Figure 6-9 Monthly Discharge of Delta Brantas Rivers (m3/s)..............................................................63
Figure 6-10. Model Sensitivity Analysis (Flood Depth)........................................................................64
Figure 6-11 Depth and Flood Extent Sensitivity....................................................................................65
Figure 7-1 Flood Risk Parameters..........................................................................................................67

viii
Figure 7-2 Overview of Risk Analysis.................................................................................................. 68
Figure 7-3 Flood Depth Definition........................................................................................................ 70
Figure 7-4. Flood Hazard Zoning Method ............................................................................................ 73
Figure 7-5. Flood Hazard Zoning.......................................................................................................... 74
Figure 7-6 Weighted Sum Method........................................................................................................ 75
Figure 7-7 Flood Depth Classification .................................................................................................. 77
Figure 7-8 Flood Duration Classification.............................................................................................. 77
Figure 7-9 Flood Hazard Classification ................................................................................................ 77
Figure 7-10 Flood Hazard Analysis (2 Years Return Period) ............................................................... 78
Figure 7-11 Element at Risk Vulnerability ........................................................................................... 81
Figure 7-12 Flood Risk Maps (2 Years Return Period)........................................................................ 82
Figure 7-13 Flood Risk Variation ......................................................................................................... 83
Figure 8-1 Adjusted Regulatory Structures........................................................................................... 87
Figure 8-2 Impact of Structure Adjustment .......................................................................................... 87
Figure 8-3 Surabaya City's 1950 Land Use Plan................................................................................... 89
Figure 8-4 Existing and Proposed Channel........................................................................................... 90
Figure 8-5 Development Control Zones................................................................................................ 93
Figure 8-6 Development Control Parameters........................................................................................ 94
Figure 8-7 Development Control Zones................................................................................................ 94

ix
List of tables
Table 2-1 Rainfall Measurement of Surabaya City (1955 – 1998)..........................................................4 Table 4-1 DEM Accuracy for Different Interpolation Methods ............................................................33 Table 5-1 Main Structural Defense........................................................................................................47 Table 6-1. Estimated Maximum Daily Rainfalls (mm/hours)................................................................58 Table 6-2. Design Rainfall Intensities (mm/hour) ................................................................................58 Table 6-3 Rainfall Hydrograph ..............................................................................................................59 Table 6-4. Design Sea Tide Level (m) ...................................................................................................60 Table 6-5. Manning Coefficient for Urban Areas..................................................................................60 Table 7-1 Vulnerability Value for Element at Risk ...............................................................................80 Table 8-1 Regulatory Structure Adjustment ..........................................................................................87


URBAN FLOOD MANAGEMENT IN SURABAYA CITY:ANTICIPATING CHANGES IN THE BRANTAS RIVER SYSTEM
1
1. Introduction
1.1. Research Background
Concentration of people, activities, and transportations, made hazard management in urban areas
became a very complex system. Hazard threats in urban areas may vary, depending on its internal or
external characteristics. A city may face earthquake hazard, while other city facing flood hazard, and
some city even facing two or more hazard threats at the same time. These presences of hazard threats
can be induced by natural causes, man-made causes, or even combination of both causes.
Flood in urban area have a strong relationship with both natural and man-made causes. Flood in urban
area can be considered as a natural hazard when it is caused by natural causes, such as extreme
rainfall, heavy storm, and typhoon. On the other side, flood in urban areas can be considered as man-
made causes when lack of garbage disposal system made people throw away their waste into the river
and reducing or blocking the river flow.
Flood problem in urban areas can be influenced by many factors, such as drainage network within the
city, rainfall, and water discharge of rivers passing through the city. In theory, there are five causes
and types of urban flooding (Parkinson 2005), which are, 1) Lack of drainage infrastructure, 2)
Blockage of the drainage system, 3) Flooding in low-lying areas, 4) Backup due to elevated
downstream water levels, and 5) Inundation caused by high river water levels.
To study all those five factors for flood hazard assessment will require a large amount of time and
efforts, and it is difficult to study all urban flood causes in the same time. Authorities in urban areas
sometimes analyze each of those factors separately, even sometimes only analyzing the one which
considered is the most important factor. Flood hazard assessment may left out one or more factors,
because limitations resources during flood hazard assessment. Some flood hazards might be
unpredicted, and therefore, no flood mitigation will be prepared for these unpredicted flood hazards.
1.2. Background and Justification
Flood is a big problem in Indonesia, where most of its major cities are located in coastal areas.
Indonesia’s capital city, Jakarta, was repeatedly suffers from flood disaster, and there is a big
possibility that other cities in Indonesia also facing the same problem. Other major city in Indonesia
facing the same problem as Jakarta is Surabaya City, capital of East Java Province, which have similar
characteristics with Jakarta. Surabaya is located in low-lying land in coastal area, and surrounded by
extensive land use conversion that can increase the discharge of rivers that entering the city.

URBAN FLOOD MANAGEMENT IN SURABAYA CITY:ANTICIPATING CHANGES IN THE BRANTAS RIVER SYSTEM
2
Every year, several parts of Surabaya, especially in squatters and slums, suffers from a flood and
affected a lot of people who already been in a poor conditions. In general, there are two factors that
caused high flood risk in Surabaya. Firstly, Surabaya has a very high rainfall rate, with yearly average
rainfall around 141.1 mm. Rainfall above 200 mm occurs in February, March, April, November, and
December (Ferita 2006). Secondly, the presence of Surabaya River, that runs through the city. This
river is a branch from the Kali Brantas River, the second largest river in Java Island.
Water flows in the Kali Brantas upstream of Surabaya are regulated by Perum Jasa Tirta through a
series of storage reservoirs and regulator structures. The large flows in the Kali Brantas are mainly
released via a man-made flood diversion channel called Kali Porong which starts at Lengkong Barrage
in Mojokerto and flows directly to the sea. Division of flows into the Kali Surabaya and Kali Porong
is made by operating the gates at Mlirip Weir and Lengkong Barrage. This regulatory system of Kali
Brantas is called Delta Brantas System, with two main functions. First function is to protect Surabaya
from flooding if water discharge of Kali Brantas increases, and second function is as a water level
regulator in the dry season to maintain flows to the Porong Main Canal feeding the large Delta
Brantas irrigation system.
At Gunungsari in Surabaya, the Kali Surabaya is divided into two rivers, Kali Mas and Kali
Wonokromo. Kali Mas flows through the city to the north coast, and Kali Wonokromo flows straight
to the east coast of Surabaya, discharging into the Madura Strait (BAPPEKO 2000).
1.3. Research Problem
There is an immediate threat of flooding in Surabaya because of the possibility of increase in river
flow entering Surabaya. This threat is caused by the presence of Mud Flood disaster in Porong,
Sidoarjo, neighbouring municipality of Surabaya City. This flood hazard in Surabaya due to Mud
Flood disaster is already became a public concern, because from the big flood disaster in the year
2002 in Jakarta, flooding experts agreed that one of the main causes of Jakarta flood disaster was
increasing discharge of the 13 rivers that flow through the capital originate (The Jakarta Post,
February 2002).
Kali Surabaya River is one part Delta Brantas System, a network system consists of Kali Brantas
River, Kali Surabaya River, Kali Porong River, and two river regulator structures. First, Mlirip Weir
as a regulatory structure for river flow entering Kali Surabaya and Second, Lengkong Barrage as a
regulatory structure for river flow entering Kali Porong. The presence of Mud Flood disaster in
Porong is threatening to reduce the discharge capacity of Kali Porong. If this happened, there is a need
to develop new water discharge regulations for Mlirip Weir and Lengkong Barrage to re-distribute
water discharge from Kali Brantas. This new regulations could have a significant impact to flood
hazard disaster in Surabaya City because if too many water were re-distributed to Kali Surabaya, more
water will entering the city and can caused a flood within the city. Overview of this problem can be
seen in figure 1.1.

URBAN FLOOD MANAGEMENT IN SURABAYA CITY:ANTICIPATING CHANGES IN THE BRANTAS RIVER SYSTEM
3
Figure 1.1 Delta Brantas River Network
This flood hazard in Surabaya City due to re-distribution of river discharge within Delta Brantas
system can be unavoidable, if the capacity decrease of Kali Porong were so severe, and left no other
choice to the authorities than to release excessive water to Kali Surabaya. These possibilities to
regulate river discharge within Delta Brantas system and its impact to flood hazard in Surabaya must
be carefully examined to find the best possible solutions. As a conclusion for this research problem
discussion, problem statement in this study is “What is the impact of changes in river Brantas River
System to flood hazard in Surabaya City”.
1.4. Research Objective
The main objective of this study is to identify potential flood hazard within Surabaya City due to river
flow regulations in Delta Brantas River Network System. More specific research objectives of this
study are;
1. To analyze present Delta Brantas river network system.
2. To have better understanding about existing river regulator structures.
3. To analyze flood risk in Surabaya City.
4. To explore possible flood mitigations in Surabaya.

URBAN FLOOD MANAGEMENT IN SURABAYA CITY:ANTICIPATING CHANGES IN THE BRANTAS RIVER SYSTEM
4
1.5. Research Objective
To achieve objectives of this research, there are some questions to be answered. For each objective,
research questions are;
1. To analyze present Delta Brantas river network system.
- What is the current capacity of rivers within Delta Brantas system?
- What are the possibilities to change river flow regulations?
2. To have better understanding in the river regulator structures.
- What kind of authorities do affected municipalities have in changing river regulations?
- Would be adjustments of river flow regulations solve the problems?
- What are the effects of different river flow regulations?
3. To analyze flood risk in Surabaya City caused by changes in Brantas River system.
- Which part of Surabaya will be affected by different water regulations?
- What is the possible worst-case scenario of flooding in Surabaya due to changes in river flow
regulations?
4. To explore possible flood mitigations in Surabaya.
- What are the possible mitigation measures can be taken by municipality to reduce flood
hazard?
- What extent each mitigation measures will be effective?
1.6. Research Methodology
This study consists of five different phases that interconnected each other. One phase should be
completed before continuing to the next phase. This kind of methodology ensures that before jumping
to the next step, all the required data and information already gathered. The main phases of this study
are;
1. Data requirement assessment.
There are generally two types of date sets that are used in this study for the input of the model;
spatial and non spatial data. Spatial data include Digital Elevation Model (DEM), one-
dimensional channel network, man-made structures and land cover map which is transformed into
spatial map showing surface roughness coefficients. Non spatial data are inflow discharge and
water level.
For 1D-2D flood modelling, there are four parameters needed for the input which are (Bin
Usamah 2005);
- Digital Elevation Model to represent topography and river cross sections.
- Roughness data to represent the resistance to water flow on.
- Embankment and other artificial structure to make the model work as close as to the real
world condition.
- Boundary data in which time series of flow or water levels or Q-H relation can be defined.
2. Fieldwork data collection.
When some of required data are still not available, then the possibilities to gather those data
through fieldwork will be investigated. If there is a strong indication that it is not possible to
gather the data through fieldwork, then other methods of analysis that suitable to available data

URBAN FLOOD MANAGEMENT IN SURABAYA CITY:ANTICIPATING CHANGES IN THE BRANTAS RIVER SYSTEM
5
must be selected. List of all required data which are already available and which are going to be
gathered during fieldwork must be completed before conducting fieldwork.
The fieldwork phase will be used to collect data and information required in the study, such as
river discharge, capacity of river network, existing river regulator structure, land use, and previous
flooding events in Surabaya.
3. Flood modelling development.
For this purpose, 1D-2D SOBEK flood modelling will be use to simulate flood hazard in
Surabaya. 1D-2D flood modelling means that it not only simulate water flow inside the river
network, but also simulate overland flow if water volume is exceeding river capacity. In general,
1D-2D flood modelling consists of (Tennakoon 2004);
- Construction of Digital Terrain Model and river network.
- Boundary conditions set-up.
- Surface roughness identification.
- Model calibration
4. Flood Risk Analysis
After flood model for Surabaya is constructed, next phase is to develop different flood scenarios
to gain a better understanding about possible flood events. This type of scenario development is
known as “alternative scenario”. The purpose of alternative scenarios is to broaden people’s
thinking about the future to account for uncertainty by exploring not one, but a range of possible
futures (Wollenberg 2000). Flood scenarios will be developed by changing the values of the
model, and in this study, value changes will be applied to river flow regulations.
Accurate and reliable flood risk maps are ideal tools for decision makers to reduce social and
economic losses from eventual flood events (Tennakoon 2004). In this study, the extent of
possible flood hazard in Surabaya City due to changes in river flow regulations will be identified
5. Exploration of possible mitigation measures for flood management.
Last phase of this study is to identify possible solutions to manage flood in Surabaya city. There
are some possible ways to manage flood, either by building dikes, changing river flow regulations
by adjusting river regulator structures within the city, or by defining retention areas which in
general, remaining non-developed lands in urban floodplains are low-lying and they may be acting
as retention or detention ponds to ease the flood level in the surrounding neighbourhood
(Tennakoon 2004). Overall research methodology is presented in the next page.

URBAN FLOOD MANAGEMENT IN SURABAYA CITY:ANTICIPATING CHANGES IN THE BRANTAS RIVER SYSTEM
6
Figure 1.2 Conceptual Framework

URBAN FLOOD MANAGEMENT IN SURABAYA CITY:ANTICIPATING CHANGES IN THE BRANTAS RIVER SYSTEM
7
1.7. Research Layout
The first chapter of this thesis discusses the overview and the introduction of the research, which
includes detailed explanations on research background, research problems, research objectives and
questions and, conceptual framework for this research.
Chapter two explains the study area, flood problems, and issues related to data requirement and
collection. The explanation about the study area concerns on climate condition, topography, and
spatial characteristics. Last part of this discusses on data requirement and collection during fieldwork.
Chapter three discusses literature reviews related to this study. In general, this chapter is divided into
three main subtopics; Urban Flood Management, Hydrodynamic Modelling, and Digital Terrain
Modelling. The first subtopic contains detailed explanation on the concepts of flood management in
urban areas, and how is it applicable in the study area. The second subtopic discusses hydrodynamic
modelling, with reviews and discussions on 1D2D flood modelling. In general, this sub topic will
discuss the procedures, advantages, and disadvantages of different in flood modelling. The third
subtopic is about Digital Terrain Modelling (DTM) and DTM requirement for 1D2D hydrodynamic
modelling purpose. Another discussion in this subtopic is about interpolation approaches than can be
applied to construct DTM.
Chapter four discusses Digital Terrain Modelling construction with different data sources. First
subtopic is about generating Digital Elevation Model (DEM) but different point interpolation methods
and quality assessment for each method. Second subtopic is about generating Digital Surface Model
(DSM) by adding an elevation values to DEM. Source of this elevation values is man-made features,
which can be higher or lower than elevation observations. Resulted DSM then will be used as an
input in the 1D2D flood modelling
Chapter five discusses policies and regulations related to flood hazard management, either at national,
regional, or local scale. A special emphasize was put on the flood management in Delta Brantas
Region where Surabaya City located. Changes of Brantas River system also occurs in Delta Brantas
due to the presence of mud flood disaster in Sidoarjo, neighbouring municipality of Surabaya City.
Last part of this chapter discusses theoretical aspects of flood mitigation measures.
Chapter six discusses the hydrodynamic modelling of the river and main drainage channels in
Surabaya City using SOBEK’s 1D2D flood modelling. Detailed explanation focuses on parameters
used in flood modelling, for instance boundary condition, surface roughness and etc. Further
discussion is about model calibration and model sensitivity.
Chapter seven discusses flood risk analysis based on results from 1D2D flood modelling and other
required parameters, such as land use, buildings, and other elements at risk from flood hazard.
Chapter eight discusses possible flood mitigation using different methods described in the literature
review part. First part of this chapter is about existing regulations related to flood and river
management in Surabaya City. Second part of this chapter is analyzing the possibilities to implement

URBAN FLOOD MANAGEMENT IN SURABAYA CITY:ANTICIPATING CHANGES IN THE BRANTAS RIVER SYSTEM
8
regulations to reduce flood hazard. Third chapter is description about the best possible solutions and
its impacts to flooding problem in Surabaya City
Chapter nine is about achieved conclusions as an answer to research questions and recommendations
to flood management in Surabaya City and possible further study.

URBAN FLOOD MANAGEMENT IN SURABAYA CITY:ANTICIPATING CHANGES IN THE BRANTAS RIVER SYSTEM
1
2. Study Area
2.1. Overview
Surabaya, the second largest city in Indonesia, is the capital city of the province of East Java. Its main
activities are manufacturing and trading with major air and seaport facilities. Surabaya also plays a
role as a centre of development for eastern part of Indonesia. Surabaya is located between 112o 30’ to
113o E longitude and 7o 0’ to 7 o 30’S latitude. It situated in the south and west of the Madura Strait,
north of Kabupaten Sidoarjo and east of Kabupaten Gresik. It has an area of 327.41 km2 and is
divided administratively into Districts (Kecamatan) and Sub-Districts (Kelurahan). Currently, there
are 31 Districts and 163 Sub-Districts within Surabaya City.
Figure 2.1 Surabaya City, East Java, Indonesia
Legend
1: 150.000
(Approximate scale)
INDONESIA
Madura Strait
Lamong Bay
Gresik Regency
Surabaya City

2
In Regional context, Surabaya City plays a role as a center of development in East Java Province.
Surabaya and its surrounding regencies formed a greater urban area known as “Gerbang Kertosusila”
or GKS, which is an acronym for the regencies (Kabupaten) of Gresik, Bangkalan, Mojokerto,
Surabaya, Sidoarjo and Lamongan.
In the context of GKS, development of Surabaya City is a part of Surabaya Metropolitan Area (KMS),
which plays a role as:
• Center of economic activities in East Java, Bali, and other Eastern Indonesia regions, with the
presence of Tanjung Perak Port as its main support.
• Center of regional development in East Java Province
• Urban Center for social-economic activities in “Gerbang Kertosusila” region.
Recent urban development has spread south from Surabaya to Sidoarjo, where both industrial and
residential growths have been vigorous. To the west, Gresik is emerging as a major industrial centre
as well, with significant residential development to be expected
2.1.1. Topography
Surabaya can be divided into two topographic areas: lowland plain and rolling plain. The lowland
plain has an elevation of up to 5 m above low tide level (datum Low Water Spring = LWS) and
prevailing slope 0 - 2%; it is located in the southern, eastern and northern portion of the city. A large
part of this area is at an elevation below the highest tide level (+ 3.22 LWS).
The remaining area is rolling plain which is located in the western portions of Surabaya City. The
elevation is more than 5 m above low tide level (LWS) and the slope is 2–15 %. Slope characteristics
made most inundated areas are located in the eastern and northern part of Surabaya City, where flat
slope made water discharge to sea is relatively slow. For northern part of Surabaya, damage caused by
flood is relatively higher than in the eastern part, because northern part of Surabaya City is dominated
by built-up areas, whereas in eastern part, open space and conservation areas dominated existing land
use.
2.1.2. Land use
Land use in Surabaya City consists of both urban and rural activities. Urban land use consists of
housing, commercial, industrial, offices and public service buildings, while rural activities consists of
agricultural fields and fish ponds. The urban area is mainly in the central, southern and northern part
of the city, but spreading to newly developing areas to the west and east of the city centre. Build up
areas in Surabaya City in 2001 made up 63% of the whole city, while the rest are non-built-up areas
such as agricultural, fishery, and vacant land. Fishery is a biggest component of non-built-up areas in
Surabaya City.
There is a constant expansion of land in Surabaya City due to sedimentation process in the eastern
coast regions and the presence of an island (Galang Island) in the northern region of Surabaya. This
expansion causes the morphologic form of eastern coast of Surabaya City constantly changed.

URBAN FLOOD MANAGEMENT IN SURABAYA CITY:ANTICIPATING CHANGES IN THE BRANTAS RIVER SYSTEM
3
Figure 2.2 Land Use of Surabaya City
2.2. Climate and Weather
Surabaya has a typical equatorial climate, and can be classified as a Type IV climate, which is a
tropical climate with relative abundant rainfall and sunny day. Another rainfall characteristic in
Surabaya City is that there is a significant difference of rainfall between during dry season and rainy
season. Therefore, rainfall data during rainy season can be considered more important to be included
in flood management than rainfall data in dry season.
• Dry season : May - October
• Wet season : November - April
From November to February, the northern monsoon gives rise to heavy rains during the wet season.
The southeast trade winds carry air from Australia during the dry season. Monthly mean temperatures
vary between a low of 21 o C in August to 34 o C in April. In the wet season average monthly humidity
a reaches 80 %, while in the dry season it falls to a low of 66%. The month with the highest average
rainfall is January with over 300 mm, while the lowest is August with 23 mm.
Another distinctive characteristic of rainfall in Surabaya City is that storms almost always occur in the
afternoon or early evening. Analysis of hourly data for Perak station for the peak months of the
1998/99 wet season (December and January) shows that 45% of the total rainfall occurred between
15:00 and 17:00, and 87% between 15:00 and 21:00.
There are ten daily rainfall stations in the Surabaya City, and each station recorded maximum daily
rainfall since year 1950 to the year 1998. Recorded rainfall for each station can be seen in table 2.1.

4
Table 2-1 Rainfall Measurement of Surabaya City (1955 – 1998) Return Period (years)
No Rain gauge Maximum Recorded Daily
Rainfall (mm) 1.25 2 5 10
1 Larangan 150 75 95 116 128
2 Kebon Agung 187 65 84 108 123
3 Gubeng 250 77 96 124 145
4 Wonorejo 197 63 84 114 135
5 Keputih 175 73 91 115 131
6 Kedung Cowek 178 75 104 133 147
7 Sememi 175 76 96 122 139
8 Banyu Urip 175 78 100 127 143
9 Gunung Sari 200 77 95 125 147
10 Perak 149 76 91 112 126
Average 74 94 119 136
Source : Surabaya Drainage Master plan
From table 2.1., It can be seen that there is a relatively little variation across the study area, with the
highest and lowest values within approximately +/-10% of the average. The results of the daily
analysis also do not indicate any clear geographic pattern, and it is considered appropriate to average
the results for all stations, as shown at the foot of Table 2.1. Perak is close to the average for low
return periods but shows lower rainfall for higher return periods. It was also found that analysis of the
daily rainfall series over the period for which short duration gave slightly lower values than the full
series; this implies that the short duration rainfall values may be on the low side. For design purposes,
the short duration results for Perak were factored by the ratio from the daily analysis for each return
period, and then divided by the duration to give rainfall intensities.
2.3. Brantas River Basin
Surabaya City is situated on the lower reach of Bantams River Basin, which is located on East Java
Province, Java Island. In geographical term, Surabaya City is located between 110o 30’ and 112 o 55’
East Longitude and between 7 o 01’ and 8 o 15’ South Latitude. Bantams River Basin is bounded by
Mt. Broom (2,393 m) and Mt. Seer (3,676 m) in the east, and a series of mountainous area (elevation
300 to 500 m) in the south. In the middle reach, the Basin is bounded by the Arjuno mountain
complex consisting of Mt. Arjuno (3,339 m), Mt. Butak (2,868 m) and Mt. Kelud (1,731 m). Mt.
Wilis (2,169 m) and its ridges bounded the western area of the Basin, and the lower reach of Brantas
River Basin, including Surabaya, is located around Madura Strait. The basin covers nine regencies or
districts: Sidoarjo, Mojokerto, Malang, Blitar, Kediri, Nganjuk, Jombang, Tulungagung, Trenggalek
and five urban centers or municipalities; Surabaya (capital of East Java), Mojokerto, Malang, Kediri,
Blitar.
Watershed area of Brantas River Basin is about 11,800 square kilometers, and stretches up to 320
kilometers from its spring at Mt. Arjuno to the Delta Brantas Region, where Brantas River divided
into two rivers, the Surabaya River and the Porong River, both of which drain into the Madura Strait.

URBAN FLOOD MANAGEMENT IN SURABAYA CITY:ANTICIPATING CHANGES IN THE BRANTAS RIVER SYSTEM
5
The Brantas River flows clockwise with Mt. Arjuno and Mt. Kelud as its center. At the end of its
southward journey, the Brantas River joins the Lesti River on the left bank and Metro River on the
right bank at a point where it starts its westward flow and upstream of the Sutami multipurpose dam.
The total catchment area at the Sutami dam site is about 2,050 km2 including 625 km2 of the Lesti
River basin. The average river bed slope in the upper reaches is around 1 in 200.
The Brantas River, where it turns north-northwestward, joins with the Ngrowo River where the
catchments area is around 3,600 km2. As a result of past drainage works (to reduce flood flows in
Brantas), water from about 1,300 km2 of the Ngrowo basin drains into the ocean to the south. Only
about 177 km2 of the Ngrowo River basin now drains into the Brantas River. At this point the river
slope is of the order of 1 in 1000. The tributaries in this reach originating from the southern slope of
Mt. Kelud carry large amounts of sediment load erupted from Mt. Kelud.
After joining the Ngrowo River, the Brantas River flows in a northwesterly direction up to Kertosono
and then turns eastward up to Mojokerto, where it branches into the Porong and Surabaya Rivers. The
Brantas River catchment area at this location (Lengkong Dam site) is about 8,650 km2. In this reach
the tributaries are Widas, Konto, and others originating from Mt. Arjuno. The average bed slope here
is about 1 in 2000. The Porong and Surabaya Rivers flow through a flat plain at an elevation of 25 m.
Porong River acts as a flood diversion channel while Surabaya River provides the water supply to
Surabaya City and acts as the main drain for the urban area.
Figure 2.3 Brantas River Basin

6
The climate in the basin is dominated by tropical monsoons. The rainy season is normally from
November to April, and the dry season is from May to October. The annual mean temperature in the
basin ranges from 24.2C to 26.6C. The average rainfall over the basin is around 2,000 mm of which
more than 80% occurs in the rainy season. Variation of rainfall is large. In wet years it is around 2,960
mm, and in dry years (one in three years on average) it is around 1,370 mm. The average rainfall in
the higher elevation, especially in the southern and western slopes of Mt. Kelud is between 3,000 mm
and 4,000 mm. The yearly mean relative humidity ranges from 75% to 82%. The average annual
surface water potential in the Brantas basin is estimated to be approximately 12 billion m3 while the
average annual flow that can be regulated is estimated to be about 3 billion m3 or 25% of available
surface water. The average annual flow in the upstream reach is around 823 m3/s, midstream 3,859
m3/s and downstream is 5,300 m3/s (total of Surabaya and Porong river gages).
2.4. Flood Problems
Major factors in the increase in severity of flooding in Surabaya are land development and increased
urbanisation. However, the impact of proposed developments on drainage and flooding is not
considered when building permits are issued. Developers are not required to provide adequate
drainage for their developments or to bear the costs of improvements to the primary and secondary
drainage systems which their development necessitates.
2.4.1. Past Flood Events
According to Surabaya Drainage Master plan Report (SDMP, 2000), due to an unusually heavy flood
caused by La Nina, a detailed survey of flooding was carried out during the end of the 1998/99 wet
season. Flooding caused by intense rainfall has been identified in 148 separate areas throughout
Surabaya. The results of the survey showed that area affected by flooding in Surabaya City is up to
14.5% of the total area. Built-up areas (housing, commerce, industry, public facilities, roads etc.)
Within Surabaya city that were affected by 1999 flood is 15,826 ha or 22.7% of the total built-up
areas in Surabaya City.
Some thirteen flood areas in more 100 ha each were identified. The worst affected flood area is
Tenggilis Mejoyo area, which has an area of 286 ha and floods to a depth in excess of 70 cm with a
duration of more than 6 hours. Information collected during the community survey of 600 households
in the flood areas identified found 43% affected by flooding inside their homes every year, with a
further 27% affected by flooding in some years. The average frequency for flooding inside the home
was 16 times per year, the average duration 11 hours and the average depth 16 cm. In the worst cases
the frequency was 50 to 60 times per year, the duration 2 to 5 days and the depth 50 to 100 cm. Since
nearly all flooding occurs during a period of 4 months (December to March) this means that, on
average, during the wet season these people get flooded inside their homes once a week. Of these 600
households 87% were affected by flooding every year in the street outside their homes. The average
frequency for flooding in the street was 30 times per year, the average duration 12 hours and the
average depth 24 cm. In the worst cases the frequency was 70 to 85 times per year, the duration 3 to 7
days and the depth 70 to 110 cm.

URBAN FLOOD MANAGEMENT IN SURABAYA CITY:ANTICIPATING CHANGES IN THE BRANTAS RIVER SYSTEM
7
Figure 2.4 Past Flood Events in Surabaya City
0 – 1 Hours
1 – 2 Hours
2 – 4Hours
4 – 6 Hours
> 6 Hours
0 – 1 Hours
1 – 2 Hours
2 – 4Hours

8
2.4.2. River and Drainage Network
Surabaya originally developed as a sea port with the original harbour along the banks of the Kali Mas.
During the Dutch colonial period, main regulator structures were built at Gunungsari and Jagir to
maintain river levels upstream for irrigation, and the Kali Wonokromo was excavated as a diversion
channel to dispose of flows from the Kali Brantas to the Madura Straits in the east. Navigation locks
were constructed at Gunungsari to allow small boats to pass upstream into the Kali Surabaya. The
Kalibokor and Gunungsari Canals functioned mainly as supply canals for irrigating rice fields and
supplying fisheries to the west and east of the city, which was located around the Kali Mas. Being
situated very near the coast, the Kali Mas, Kali Wonokromo and the low-lying agricultural areas along
the coast were subject to the effects of tides.
Figure 2.5 River and Drainage Network in Surabaya City
As the city developed into a major maritime trade centre the urban area grew westwards and
eastwards, taking up land previously used for agricultural purposes. New drains were constructed to
dispose of runoff from the new urban areas to the Madura Straits to the east. However, the network of
irrigation canals remained, and became incorporated into the built-up areas.
In the late 1970's a new electrically operated gated regulator structure was built at Gunungsari, now
operated by Jasa Tirta, inc., a semi-government institution. The navigation locks at Gunungsari and
Mlirip upstream in the Kali Surabaya are now disused, and the river is no longer used for freight
transport. Recently, a modern container terminal has been constructed at Perak Port, to take large

URBAN FLOOD MANAGEMENT IN SURABAYA CITY:ANTICIPATING CHANGES IN THE BRANTAS RIVER SYSTEM
9
ocean going vessels, although the old harbour along the Kali Mas still remains for more traditional
craft sailing between Surabaya and the outer islands of the Indonesian archipelago.
The Jagir barrage and Wonokromo weir regulate the intake to the Ngagel water treatment plant, which
commenced operation in 1922. The Gunungsari barrage maintains water levels for the intake from the
Kali Surabaya to the modern Karangpilang water treatment plant, phase I of which opened in 1990.
Major extensions (Karangpilang II) have recently been completed. A small Water Treatment Plant on
Jalan Kayoon also exists, with its intake just upstream of the inflatable rubber weir at Gubeng. The
layout of the main drainage system for Surabaya City consists of the following 4 types of facilities:
a) Main drains to carry flood flows originating outside Surabaya directly to the sea (K.Surabaya
and K. Wonokromo),
b) Collection of internal drainage from urban areas through tertiary, secondary and main drains,
assisted where gravity flow is not possible by drainage pump stations,
c) Sea defence embankment with tide gates to prevent backflow in main drains during high tides
(East coast area),
d) A series of main and secondary irrigation canals from Gunungsari and Gubeng regulator
structures. At present these have a dual function in the wet season, as they receive drainage
inflows.
2.5. Data Requirement Analysis
Data requirement analysis was based on two main aspects; First, requirements for analyzing existing
policies and regulations regarding flood management in Surabaya City, and Seconds requirements to
construct 1D2D flood modelling.
2.5.1. Available Data
1. Elevation dataset.
Height points and contour lines were acquired from official city map issued in the year 2002
by City Planning Agency of Surabaya City. Specifications of this elevation dataset are;
- Method : GPS and Direct Levelling
- Height point unit : cm
- Contour interval : 0,5 m
- Coordinate System: User TM 3, Zone 49.2 Datum WGS '84.
- Horizontal Reference Point : BPN 1201085, 1201095, 1201102
- Vertical Reference Point: TTG.1030, TTG.1038 and BPN 1201108.
2. River Network and Main Drainage System for Surabaya City.
River Network and Drainage System was compiled from Surabaya Drainage Master Plan
(SDMP), issued by Planning Bureau of Surabaya City in the year 2000. This map is
developed under CAD environment, and don’t have any spatial reference.

10
3. Land use Map and Road Network of Surabaya City.
Existing land use map and road network of Surabaya City were acquired from official land
use map issued by Planning Bureau of Surabaya City in the year 2005. Coordinate system of
this map is UTM Zone 49 South, Datum WGS ’84. This map has 1:5000 scale.
4. Past flood events in Surabaya City.
Past flood events are acquired from Bureau of Water and Flood Management of Surabaya
City. Available flood maps are from the year 2002 to the year 2005.
2.5.2. Required Data
This thesis requires following data to be collected during fieldwork phase;
1. Regulations for Delta Brantas River Network.
2. Local and Regional Policy of Urban Management in Surabaya City and Delta Brantas River
Network.
3. Water discharge
- Brantas River
- Kali Surabaya
- Kali Porong
- Rivers inside Surabaya City
4. Discharge Capacity.
- Brantas River
- Mlirip Weir
- Lengkong Barrage.
- Kali Surabaya River.
- Kali Porong River.
- Rivers and primary channels in Surabaya City
5. Cross-sections for rivers and primary channel in Surabaya City
6. Additional Height Points
2.6. Data Collection
The source of data collection during fieldwork is divided into primary and secondary sources. Both
data were derived by the author himself and with helps from colleagues. The fieldwork focused on
collecting primary and secondary data from various sources. The data requirement list was prepared
based on the available data, collected by the previous students and new data required for this study.
The data requirement covered some expectations on data accuracy and precision. However it was
changed and improved due to some limitations and availability of the required information. Since all
the required information is available in different sources or offices, detailed information regarding on
the sources for each data were prepared with helps from the local officers.

URBAN FLOOD MANAGEMENT IN SURABAYA CITY:ANTICIPATING CHANGES IN THE BRANTAS RIVER SYSTEM
11
A. Policies and Regulation
Main sources of policies and regulations are Jasa Tirta, inc, Bureau of Water and Flood Management
of Surabaya City, and Bureau of Water Resource of East Java Province. There are total 13 formal
regulations about river and flood management related to Surabaya City. Responsibility for flood
control in Surabaya is divided between at least seven different authorities. This fragmentation of
responsibility causes difficulties in co-ordination of planning and implementation of improvements to
the drainage systems.
For flood management, Jasa Tirta, inc. has installed a Flood Forecasting and Warning System (FFWS)
to anticipate floods in the Brantas River Basin. By means of FFWS all hydrological data within the
Brantas River Basin, including water level and rainfall could be monitored in order to prepare flood
forecasting.
Figure 2.6 Flood Forecasting and Warning System Control Room
B. Water Discharge
Water discharge data were acquired from two main sources; Measurement station under Jasa Tirta,
inc. and from Surabaya Drainage Master Plan Document (SDMP). Measurement stations for water
discharge observed during fieldwork are;
1. Lengkong Station, as measurement station for Brantas River.
2. Perning Station, as measurement station for Kali Surabaya.
3. Gunungsari Station, as measurement station for Water entering Surabaya City.
4. Porong Station, as measurement station for Kali Porong.
5. Jagir Dam, as measurement station for Kali Wonokromo.
6. Gubeng Dam, as measurement station Kali Mas.

12
C. Discharge Capacity
There are no exact information can be collected during fieldwork regarding discharge capacity for
river and main drainage channels. Information about discharge capacity will be derived from river
regulatory structures, such as water gates and pump stations. For rivers, regulatory structures that can
be use to calculate discharge capacities are;
1. Lengkong Barrage, as regulatory structure for Kali Porong.
2. Mlirip Weir, as regulatory structure for Kali Surabaya.
3. Gunungsari Dam, as regulatory structure for Kali Surabaya.
4. Jagir Dam, as regulatory structure for Kali Wonokromo.
5. Gubeng Dam, as regulatory structure for Kali Mas.
Figure 2.7 An Example of Regulatory Structure (Lengkong Barrage)
D. River Cross Sections
River cross sections are acquired from Jasa Tirta, Inc, and SDMP documents. Cross sections from
Jasa Tirta, Inc. are for Main River, while cross sections from SDMP are for primary drainage channel
inside Surabaya City. Each river/channel has average 4 cross sections. Cross sections data acquired
during fieldwork are still in drawing format, not table format. Therefore, each cross section must be
converted into table format to be usable during flood modelling.
URBAN FLOOD MANAGEMENT IN SURABAYA CITY:ANTICIPATING CHANGES IN THE BRANTAS RIVER SYSTEM
13
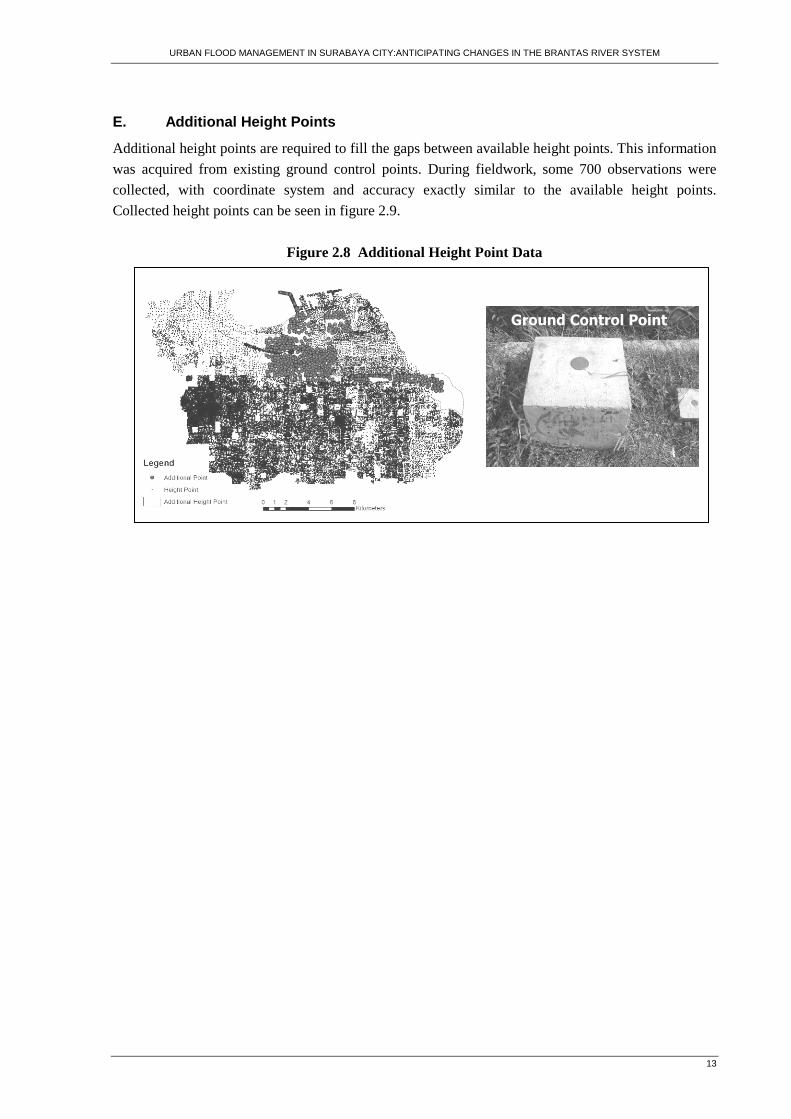
E. Additional Height Points
Additional height points are required to fill the gaps between available height points. This information
was acquired from existing ground control points. During fieldwork, some 700 observations were
collected, with coordinate system and accuracy exactly similar to the available height points.
Collected height points can be seen in figure 2.9.
Figure 2.8 Additional Height Point Data
Ground Control Point

14

URBAN FLOOD MANAGEMENT IN SURABAYA CITY:ANTICIPATING CHANGES IN THE BRANTAS RIVER SYSTEM
15
3. Literature Review
3.1. Urban Flood Management
Flood management in urban areas is a complex decision-making process. Its main purpose is to define
and implement all measures that can reduce the risk from flooding which human, natural and
economic resources are subjected (Oliveri and Santoro 2000). In urban areas, objects that can be
exposed to flood hazard are more various and have more complicated relationship each other
compared to another type of land use, i.e., rural or agricultural.
Urban flood problem seems to be difficult to handle in developing countries. The reason for this is
that firstly, developing countries have small, vulnerable economies and are common to be severely
damaged when flood disaster strikes. Secondly, limited amount of resources to cope with flood
hazard, particularly to investigate and evaluate possible strategies made government in developing
countries often underestimate the existing flood hazard (Hansson, Danielson et al. 2008). Quality of
human resources also limits the possible measures that can be implemented by government to protect
the residents and their belongings in urban areas.
There are two main aspects in urban flood management; structural mitigation and non-structural
measures. Structural mitigation measures are an effort to modify the characteristics of a flood (i.e., the
volume and timing of flood waters, their extent and location, their velocity and depth), so that damage
or susceptibility to people and properties can be reduced.
Non-structural measures are an effort to manage flood hazard by applying actions and regulations that
can either reduce flood hazard, or to minimize the impact of flood in case disaster is unavoidable. (e.g.
real-time forecasting and alert systems, information and training campaigns, tax adjustments, flood
insurance programs).
3.1.1. Structural Defence
The main objective of structural defence in urban flood management is to mass-balanced the systems
of water flow, cycling, and containment in each part of the urban area by water flowing out of that
part. According to (Hansson, Danielson et al. 2008), two main concepts of structural defence
strategies in flood management are using traditional measures or using wider ecosystematic measures.
Traditional measures are common structural measures in flood management. It utilises hydraulic
structures, which can be used to manage, either to divert, slow, or stop the flow water. Flood
management using structural defence is the utilization of an existing flood protection system or
development of new systems to minimize flood hazard. Flood protection system in urban areas needs
to be continuously improved, because the growth of a city and its surrounding areas made flood
hazard also continuously increase. Continuous improvement of the flood protection system requires a

16
reassessment of the growing flood hazards and an up-to-date evaluation about flood hazards
depending on the newest information available about land use, climate, river, and channel
characteristics. (Plate 2002).
The use of structural mitigation measures in flood management is primarily concerning how to avoid
flood or reducing damage resulted by disasters. A structural measure infrastructure for flood
management includes dykes, dam, reservoir, or methods to improve infiltration of rainfall into the
ground. Structural measures can be done by using existing infrastructures or building structures
increase the capacity of flood protection system. The main component of structural defence is the
hydraulic structures that can change the water system balance, which in some cases can increase the
allowable amount of water in the river before flood occurs.
Traditional structural defence also have drawbacks. For example, dykes may provide relatively good
protection against small to medium floods. But, if a dyke breaks in the case of larger flooding events,
dyke more likely to act not as a protection but instead, can increase the effect of the flood. Some
views also consider DAM as potential threat that could devastate river ecosystems and the
construction of a DAM in first place is regretting the right of people affected by it.
Structural defence of flooding in urban area can also use wider ecosystem measures, such as
renaturalisation, that can improves the porosity and absorption of water into the soil, with or without
improvement of water penetration to the ground. One widely known method of renaturalisation is re-
wetting a formerly drained to be functioned as a reservoirs. This can only be efficiently achieved
using detailed knowledge of the occurring organic and mineral soil substrates, the terrain
characteristics, and the available surface and groundwater resources (Hansson, Danielson et al. 2008).
Land use management can also plays an important role in renaturalisation, because different land use
types may have different characteristics. Evapotranspiration rates can be differs because crops have
different vegetation cover, leaf area indices, and root depths. Interception rates during flood or storm
can also different for different land use types (De Roo, Schmuck et al. 2003).
Another approach to structural defence of flooding is mentioned in (De Roo, Schmuck et al. 2003),
which stated that basically there are three approaches possible to implement in reducing flood hazard:
A. Reduce the amount of water flowing to downstream areas, by
1. Changing land use, for example reforestation;
2. Building new reservoirs;
3. Building new polders;
4. Improving management of reservoirs towards flood control.
B. Reduce or prevent damage as much as possible, by
1. Building dykes;
2. Increasing dyke-heights;
3. Increasing floodplain storage, by increasing floodplain width or deepening the floodplain;
4. Relocation of vulnerable build-up areas to areas with less or no flood risk.
C. A combination of both.

URBAN FLOOD MANAGEMENT IN SURABAYA CITY:ANTICIPATING CHANGES IN THE BRANTAS RIVER SYSTEM
17
3.1.2. Non-Structural Measures
Because structural defence approach requires a significant amount of resources to be operational,
which most developing countries can not afford, approaches to avoid loss of life and limit disruption
and damage from flooding have changed significantly in recent years. Worldwide, there has been a
move from a strategy of flood structural defence to non-structural approach and risk management
(Pender and Neelz 2007).
Non-structural measures concerns mainly on non-engineering actions such as restricted development
planning, regulating human activities in order to mitigate flooding (Hansson, Danielson et al. 2008).
With this approach, flood hazard is reduced by changing the spatial characteristics of a city and its
surrounding areas and the behaviour of its residents.
Non-structural approach can also utilize an Early Warning System (EWS) to avoid or reduce damage
during flood event. The presence of EWS in flood management is very important because when
government and resident of a city are informed on flood management and coping strategies, they are
better prepared for adequate countermeasures. For instance, government can quickly changes the
configuration of regulatory structures to avoid flood, and residents can building houses on stilts and
choosing safe escape routes (Hansson, Danielson et al. 2008).
Although an Early Warning System is a very good approach to reduce the flood risk by a non-
structural measures, there is a problem with implementation of an EWS, which is a warning system
can be very complicated due the uncertainty in the flood forecast used within the decision-making
chain for issuing flood warnings (Moore, Bell et al. 2005). Combining an EWS with a management of
structural defence can be a very effective method to either avoid the flood or reducing the damage in
the event of flood disaster.
3.2. Hydrodynamic Modeling
Hydrodynamic modelling urban flood management is a method to develop a digital representation of
water movement inside or outside channels within a city. This model can give authorities a better
understanding about the extent of flood hazard. Flood modelling and forecasting requires not only
rainfall–runoff information, but also requires channel flow routing and forecast updating (Moore, Bell
et al. 2005). There are a set of tiered methodologies in hydrodynamic modelling, and each appropriate
for different tasks and applications over different scales. The most widely used hydrodynamic model
for assessing flood hazard in urban areas are one-dimensional (1D) and two-dimensional (2D) flood
modelling (Pender and Neelz 2007).
3.2.1. 1D Flood Modelling
In the 1D approach, water flow is assumed to occur in one dominant spatial dimension aligned with
the centre line of the main river channel. The geometry of the problem is represented in the model by
channel and floodplain cross-sections perpendicular to the channel centreline. Measured distances
between these cross-sections are also required by the computer model (Pender and Neelz 2007).

18
According to (Horritt and Bates 2002) 1D Flood model is capable of capturing the downstream
propagation of a flood wave and the response of flow to free surface slope, which can be described in
terms of continuity and momentum equations as:
Q is the volumetric flow rate in the channel, A the cross sectional area of the flow, q the flow into the
channel from other sources (i.e. from the floodplain or possibly tributary channels), S0 the down-
slope of the bed, n Manning’s coefficient of friction, P the wetted perimeter of the flow, and h the
flow depth.
One source of the technical requirements in an urban flood model is from (Mark, Weesakul et al.
2004), which stated that data requirement for 1D flood modelling is:
- Dynamic flow description: when urban flooding occurs, surface water can flow in both street and
pipe systems with flow exchange between these two systems through manholes. This means that
simulation of backwater effects is needed in modelling of urban flooding. By using a dynamic wave
model, the model includes backwater effects and surcharge from manhole including rapid change
of water level.
- Parallel flow routing: while surface flooding takes place, water from the pipe system flows through
manholes or catch pits to street system. Flow along the street (e.g. right above the pipes) can be in
either direction along the streets, i.e. it can flow following a slope of the street or against it. It is not
necessary that the flow direction in the street has to be the as the flow direction in the pipe system.
- GIS interface: GIS is important in simulation urban flooding. It is used as a tool to provide data and
display simulation results. Surface storage for simulating surface flooding can be calculated by the
application of GIS together with the DEM the study area, i.e. find area–elevation relation from
DEM. In addition, results of the simulation can be easily understood in form of flood inundation
maps. Model output in term of water along the streets are transferred to GIS and with interpolation
routine, water surface is able developed. Flood inundation maps can be generated by overlaying of
water surface and introducing flood depth map which is an method to visualise flood situations.
The main drawback of 1D flood modelling approach is an inaccuracy in the treatment of street
channels and in the case of water flow on a surface. Both cases still considered as one dimensional.
When the channels are overtopped, the flow of water is not only no longer 1D, because water move
around 2D plane.
3.2.2. 2D Flood Modelling
As an addition to 1D flood modelling, 2D flood modelling can be use to analyze flow behaviour on a
surface, both for water dept and velocity. 2D-modelling of out-channel floods clearly has the
qt
A
x
Q =∂∂+
∂∂
03/10
23/42
0 =∂∂−=x
h
A
QPnS
(1)
(2)

URBAN FLOOD MANAGEMENT IN SURABAYA CITY:ANTICIPATING CHANGES IN THE BRANTAS RIVER SYSTEM
19
potential to revolutionise understanding of high-magnitude spatial and temporal hydraulics and high-
magnitude flow phenomena, geomorphological and sedimentological processes, and hence rapid
fluvial landscape change. This potential for new understanding is because of the now wide availability
of high-resolution DEM data for large and often inaccessible areas, and the availability of remotely-
sensed data (Carrivick 2006).
Models to predict flood inundation based on the 2D shallow water equations are classed here as 2D
approaches and solve for water level and depth-averaged velocities in two spatial dimensions. Unlike
1D models there is no need to prescribe a particular direction for the flow in 2D models. This brings
advantages in terms of providing more detail on the nature of floodplain inundation but also
introduces a number of limitations, e.g., difficulties in including hydraulic structures such as weirs
and bridges in the models, longer computer run times and greater data requirements (Pender and
Neelz 2007).
The system of 2D flood model consists of three equations: one equation for continuity and two
equations for the conservation of momentum in the two orthogonal directions (Mignot, Paquier et al.
2006).
In equation above, h is water depth, u and v are velocities along horizontal x- and y-axes, zb is bottom
level, n is Manning’s roughness coefficient, g is gravity acceleration and Veff is effective cinematic
viscosity. Usually, it is assumed that the viscosity is constant throughout the flow field. Although 2D
flood modelling can accurately describe the behaviour of flow on a surface, this model also has a
drawbacks. First, calculation method is considerably more complicated than 1D flood model, and
second, river and drainage network sometimes has a complicated morphology that can not
incorporated sufficient enough in 2D flood model.
(3)
(4)
(5)
∂∂
∂∂+
∂∂
∂∂++−
∂∂
−=
∂∂+
∂∂+
∂+
∂∂
∂∂
∂∂+
∂∂
∂∂++−
∂∂
−=
∂∂+
∂∂+
∂+
∂∂
=∂
∂+∂
∂+∂∂
y
vh
yv
x
vh
xv
h
vuvgn
y
zgh
y
hgh
y
hv
x
huv
t
hv
y
uh
yv
x
uh
xv
h
vuugn
x
zgh
x
hgh
y
huv
x
hu
t
hu
y
hv
x
hu
t
h
effeffb
effeffb
3/1
222
2
3/1
222
2
)()()(
)()()(
0)()(

20
3.2.3. 1D2D Flood Modelling
Because both 1D and 2D flood modelling has its own advantage and disadvantages, there are an
extensive approaches to integrate 1D and 2D models resulting in hydrodynamic model of floodplains
and integrated 1D (channel flow) and 2D (overland flow), or widely known as 1D2D flood modelling.
The main idea of 1D2D flood modelling is integrating 1D hydrodynamic modelling technologies,
Digital Elevation Models and GIS systems is to take advantage of the best combination of 1D
hydrodynamic data for rivers together with 2D terrain data, and presenting them in the GIS as maps
(Horritt and Bates 2002).
The integrated one-dimensional and two-dimensional (1D-2D) model development focuses on the
extension of model capabilities in order to simulate flooding situations more accurately. This includes
improving flood wave propagation over initially dry land, improving the presentation of hydraulic
control (levees and embankment) in the floodplain and integration of one-dimensional hydraulic
elements (pumps, bridges and regulator gates). The combined 1D-2D modelling opens up the
possibilities for studying flood control measures, flood forecasting, and development of flood
evacuation plans. Main advantages of 1D2D flood modelling model are (Shaviraachin 2005):
• Flow computation on initially dry land, without using any special drying or wetting procedures.
• Accurate and stable flow computation on very steep slopes, such as dike walls and other
manmade structures.
• Especially suitable for short event predictions (hours and days).
• Realistic flood predictions of dike break due to heavy rainfall or other natural hazards.
• Pre- and post-processing within a GIS environment.
There are several software computer package that can perform 1D2D modelling, and one of them is
SOBEK, which has been developed by Delft Hydraulics in partnership with the National Dutch
Institute of Inland Water Management and Wastewater Treatment (RIZA), and the major Dutch
consulting companies. SOBEK a valuable instrument for flood forecasting, navigation, optimising
drainage systems, controlling irrigation systems, reservoir operation, sewer overflow design, ground
water level control, river morphology regulation, and water quality control. SOBEK can combine
river systems, urban systems and rural systems for a total water management solution. The program
has been enhanced with facilities to import GIS data into the model and to export computational
results to GIS systems for presentation and evaluation. It simulates very well the influence of the
existing/planned infrastructure on flooding processes (Shaviraachin 2005).

URBAN FLOOD MANAGEMENT IN SURABAYA CITY:ANTICIPATING CHANGES IN THE BRANTAS RIVER SYSTEM
21
3.3. Digital Terrain Modeling
To be operational, 1D2D computer models require information on the topography of the river channel
and the adjacent floodplain. Topography information is required because In the case of urban
floodplains, the effect will also influence channel’s surrounding, such as streets, buildings and other
urban infrastructure (Pender and Neelz 2007). This is why a digital terrain modelling must be
constructed in flood modelling.
3.3.1. Digital Elevation Model (DEM)
A widely used definition of DEM is a digital representation of ground surface topography or terrain.
Another generic terminology for DEM is “a representation of terrain elevation as a function of
geographic location” (Yue, Du et al. 2007). The digital elevation model (DEM) represents land
elevation data, which are essential for estimation of flood volumes on the surface areas (Mark,
Weesakul et al. 2004). In addition, the result presentation in the form of a flood inundation map is
based on water levels from the model simulation in conjunction with the DEM. Thus, quality of the
model results depends on the quality of DEM. To generate the DEM, spot elevations (X, Y)
coordinates and the ground level Z) covering all of the catchments are needed.
The DEM may be developed based on a different interpolation method, which converts elevation
information originally stored as a point into coverage, which contain the elevation for the whole area.
The size of a 1–5 m resolution is recommended for urban flood analysis since it can cover the width
of the road, the width of sidewalks, and houses or buildings. However, using a finer resolution like 1
m does not necessarily provide results which are significantly more accurate in terms of flood levels,
but does provide a much better visual presentation of the flood extent. A coarser 5 m DEM can thus
be used for quick assessment of the model results, while detailed analyses should be based on the 1m
DEM. It also makes sense to create both a fine DEM and a coarse DEM and to use each for various
purposes.
3.3.2. Digital Surface Model
For flood modelling purposes, sometimes DEM is not enough, because it only stores the natural
terrain elevation, not actual elevation. If water movement on surface need to be simulated accurately,
DEM must be corrected, by raising or lowering elevation to include man-made features. The result of
this DEM correction called Digital Surface Model (DSM).
It is essential to have an accurate description of the man-made features such as building and street in
flood modelling, because man-made features greatly influence the movement of water on a surface. If
the DSM is based on spot elevations on the ground level, e.g. on the sidewalk, the streets must be
added into the DEM with an elevation which corresponds to the height of the curb, either raising or
lowering the value of DEM. Major roads in the study area where floods occur must be included in the
DEM, as the streets act as drains for the surface flooding.

22
3.3.3. DEM Interpolation Methods
A typical procedure is to interpolate and generate the DEM using ground points, and then interpolate
it with different interpolation method to have an elevation representation for the whole study area.
Each interpolation method has its own advantages and disadvantages, and it is important to study
which one is the most appropriate interpolation method to be utilise. Most commonly interpolation
methods that will be used to generate Digital Elevation Model for study area are TIN, IDW, and
Kriging. A DEM Quality assessment then must be performed for each DEM generated by different
methods to decide which one gives the best digital representation for topography of study area.
TIN TIN is a point interpolation method based on calculation of elevations from digitally extracted
Ridgelines (Jordan 2007). Elevations along calculated ridgelines are extracted from the original
elevation model and a new DEM is created by TIN interpolation using these ridgeline elevations.
Unlike other DEM type, TIN basically is a vector model that supports lines, points and polygon
features combined together as a presentation of terrain topology. The original input data will be
preserved in generating the terrain model because when constructing DEM with TIN method, there is
no transformation i.e. to raster is needed. The TIN structure is dynamic Because nodes can be placed
irregularly over a surface, TINs can have a higher resolution in areas where a surface is highly
variable or where more detail is desired and a lower resolution in areas that are less variable. This
allows changes in its resolution according to surface complexity. For instance, a simple flat surface
can be represented with large or coarse TIN resolution, while the high resolution TIN structure is
needed to represent a rugged terrain (Zulkarnain 2006).
Figure 3.1 TIN Interpolation Method
(1) (2)
(3)
Source : ESRI ArcGIS help
(1) Nodes, the fundamental building blocks of a TIN. (2) Every node is joined with its nearest neighbours by edges. (3) DEM constructed from TIN

URBAN FLOOD MANAGEMENT IN SURABAYA CITY:ANTICIPATING CHANGES IN THE BRANTAS RIVER SYSTEM
23
Another way to construct a DEM using TIN method is by using a break line of an area linear feature,
or the boundaries of area features, which represents important natural or man-made discontinuities in
the landscape. There are 3 common break lines used in TIN generation, namely hard break lines, soft
break lines and faults. Soft break lines will ensure that the known elevation values along a linear
feature are maintained in the TIN. Furthermore, it also can be used to maintain linear features and
polygon edges by enforcing the break line as TIN edges. There is no elevation interruption defined by
the soft break lines. Hard break lines on the other hand, define location of abrupt surface change for
instance, streams, ridges, shorelines and building footprints. The fault break lines are used to
represent an interruption in surface continuity, that for instance, caused by man-made features.
IDW DEM can also generated by using distance-weighted interpolation. A common method is the Inverse
Distance Weight (IDW), which implements the spatial correlation assumption, that things that are
close to one another are more alike than those that are farther apart. IDW is an exact interpolator,
where the maximum and minimum in the interpolated surface can only occur at sample points. The
output surface is sensitive to clustering and the presence of outliers. IDW assumes that the surface is
being driven by the local variation, which can be captured through the neighbourhood.
To predict a value for any unmeasured location, IDW will use the measured values surrounding the
prediction location. This means that a Z-coordinate is interpolated from the adjacent X, Y, Z points
for each and every grid cell. Those measured values closest to the prediction location will have more
influence on the predicted value than those farther away. IDW assumes that each measured point has a
local influence that diminishes with distance. It weights the points closer to the prediction location
greater than those farther away; this is why the method called Inverse Distance Weight. Main
parameters in IDW method are power value (p) and root mean square prediction error (RMSPE) as
described in figure below.
Figure 3.2 IDW Power Parameter
From previous figure, weights are proportional to the inverse distance raised to the power value p. As
a result, as the distance increases, the weights decrease rapidly. How fast the weights decrease is
dependent on the value for p. The surface calculated using IDW depends on the selection of a power
value (p) and the neighbourhood search strategy. The optimal power (p) value is determined by
Figure 3.2.
IDW Parameters
Source : ESRI ArcGIS Help

24
minimizing the root mean square prediction error (RMSPE). The RMSPE is the statistic that is
calculated from cross-validation. In cross-validation, each measured point is removed and compared
to the predicted value for that location. The RMSPE is a summary statistic quantifying the error of the
prediction surface.
KRIGING Kriging is a probabilistic interpolation method that calculates the values of the whole study area based
on the value values of observations. The basic interpolation assumption is that, values at a short
distance are more likely to be similar than at a larger distance. The elevation value for each pair is
compared and expressed as variance or covariance. Then, the spatial structure could be analysed
through a semivariance method (Zulkarnain 2006). This method defines the degree of spatial
dependence among pairs at a specific Distance with following equation:
Where
γ (h) = semi-variance at distance h
m = number of point pairs within h distance
Z (x) = elevation value at position i
Z (xi + h) = value at h distance from i
The dataset is analysed through an experimental semi-variogram and it is used to assign the weights
for each elevation sample. An experimental variogram plot is a graph with semivariance values of the
elevation data (Y-axis) against the distance between elevation data (X-axis). After building the
experimental variogram, an appropriate theoretical function (e.g. Gaussian, Exponential, spherical) is
needed to model the spatial variation.
The next step is to determine the values of the required parameters; “Nugget”, “Sill” and “Range”.
Nugget is a semivariance as the separation between elevation data approaches zero. This value
represents variability at a point that can’t be explained by spatial structure. Sill is a maximum
semivariance value that represents variability in the absence of spatial dependence. Finally, range,
represents the separation between point-pairs at which the sill is reached (distance at which there is no
evidence of spatial dependence). In addition lag refers to the average distance of semi-variogram in x-
axis. Formula for calculation variogram and an example of variograms and its parameters can be seen
below.
{ }2
1)()(
2
1)( hxiZxiZ
nh
n
i+−= ∑ =
γ
Where
n is the number of pairs of sample points separated by the distance h.
( )( )[ ]2
1)(2
1)( xZhxiZhm
i−+= ∑ =
γ (6)
(7)

URBAN FLOOD MANAGEMENT IN SURABAYA CITY:ANTICIPATING CHANGES IN THE BRANTAS RIVER SYSTEM
25
Figure 3.3 Example of Semivariogram
The prediction variance that is derived together with the prediction result is based on the
configuration of the existing measurements around each point to be predicted. The kriging weight
must sum to one. The weight values are assigned based on the fitted variogram model (Peter et al.,
2005) with an optimization criterion to minimize the prediction variance. The estimated elevation
value (point to be predicted) is calculated using next equation;
Where
Zo = The estimated value
λi = Weights for measurements participated in the estimation
Zi = Samples value
3.3.4. DEM Quality Assessment
The quality of a DEM must be assessed to find out how accurate it represents the real world. For this
purpose, there are two general method than can be used; by statistical analysis and by visual
assessment. First method, the Statistical Analysis, is basically looking at calculated value on every
observation points. Thus, to calculate the difference between calculated and observed values.
The most common statistical method to assess the quality of DEM is The Root Mean Square Error
(RMSE), which is based on the assumption that the errors are normally distributed with zero mean
This technique is valid when the errors are free from the systematic error and random in nature. The
horizontal accuracy concerns the accuracy of the two-dimensional positional accuracy during the
extraction of the elevation data (Zulkarnain 2006). The formula for calculating RMSE is;
(8) iZii
λ∑ == N
10 Z
Source : ESRI ArcGIS Help

26
Where Zi is the interpolated elevation value, Zj is a true value and n is number of samples.
The second DEM Quality assessment method is by using a Visual Assessment, to compare DEM with
the actual topology of the area. This method is comparing the overview of generated DEM with the
actual visual perception of the whole area. Visual assessment of DEM is simply performing visual
assessment to find out how good DEM represents the real topology based on common or expert
knowledge about geomorphology of the whole area.
(9)
n
ZZRMSE ji
2)( −∑=

URBAN FLOOD MANAGEMENT IN SURABAYA CITY:ANTICIPATING CHANGES IN THE BRANTAS RIVER SYSTEM
27
4. Digital Terrain Modeling
4.1. Introduction
Development of flood mitigation measures in flood-prone area such for both structural and non-
structural measures requires accurate flood predictions. In this study, three definitions are used to
describe digital representation of terrain data. Digital Elevation Model (DEM) is defined as a digital
presentation of terrain which contains elevation data, Digital Surface Model (DSM) is digital
presentation of terrain which contains mixed object on the surface of earth such as buildings and
roads, and last, (Digital Terrain Model) DTM is defined as a broad process of converting natural
terrain to digital maps contains various data.
Digital representation of terrain is a vital requirement to simulate flood in 1D2D environment. When
water volume is not exceeding channel capacity, water is simulated in 1D flood model, and if water
overtopping from channels occurs, water propagation on 2D space is simulated on 2D grid generated
from digital terrain data. Topographic data are crucial for flood inundation modeling and it is best to
use recent and highly accurate topographic data. There are a lot of information related to terrain that
can be used as a parameter in flood modelling, such as terrain elevation, building footprint, and land
use. Overall methodology of Digital Terrain Modelling can be seen in following figure;
Figure 4-1. DTM Overall Methodology

28
4.2. DEM Construction
In this research, DEM is generated using spot height, and then different interpolation methods are
used to convert spot height as a point to an elevation coverage data. Interpolation methods used in this
study are TIN, IDW, and Kriging. Finally, DEM quality assessment with Root Mean Square (RMSE)
method will be utilise to find out which DEM is the most appropriate to represent topographic
elevation for study area. DEM generation in this thesis mainly done in ArcGIS environment and some
required extensions such as 3D analyst and GeoStatistics.
Available data for DEM generation for this research is Spot Height, which produced by the
Government of Surabaya City. Unit of this elevation data is in cm. Detailed descriptions of elevation
dataset can be seen in following figure;
Figure 4-2 Elevation Data Overview
4.2.1. TIN
First interpolation method is a TIN, which height points and triangulated height points. The height
points are connected with a series of edges to form a network of triangles, and with Delaunay triangle
criterion, a new coverage is constructed. TIN interpolation doesn’t require any intermediate
parameters, because it constructed a DEM by using triangulation. RMSE for TIN interpolation cannot
generated automatically in ArcGIS, because TIN uses an exact elevation of each value. Therefore,
elevation data must be split into Calibration dataset and Validation dataset. Calibration dataset was
used to generate the TIN, while Validation dataset was used to calculate differences between
predicted value and observed value. Mean Error value and RMSE value then manually calculated to
assess the quality of generated DEM.
By comparing the values of validation dataset with calibration dataset, two DEM quality indicators
were obtained; Mean Error, which is an average difference between calculated value and observed
value, and Root Mean Square Error (RMSE), which is the error value combined with number of
Number Of Points 56911
Minimum Value (m) 0.00
Median Value (m) 6.52
Mean Value (m) 9.61
Maximum Value (m) 46.02
Standard Deviation 7.60
Spot Height
Histogram
Distance (m)

URBAN FLOOD MANAGEMENT IN SURABAYA CITY:ANTICIPATING CHANGES IN THE BRANTAS RIVER SYSTEM
29
validation dataset. For TIN Interpolation, Mean Error Value is -0.015051 while Root Mean Square
Error is 0.844.
4.2.2. IDW
Second interpolation method is an Inverse Distance Weight (IDW), which calculated the value of an
unobserved location by its distance to an observed location. Main parameter for IDW is power value
(p), which is by using ArcGIS Geostatistics, the value for dataset is 3,4518. After interpolation, we
can assess the quality of the model by calculated error prediction error, which is;
Figure 4-3 Cross-Validation of IDW Interpolation
4.2.3. Kriging
Next method to create DEM from elevation points is by Kriging, which is based on statistical models
that include autocorrelation. This is the statistical relationships among the measured points. Because
of this, not only do geostatistical techniques have the capability of producing a prediction surface,
they also provide some measure of the certainty or accuracy of the predictions. In Kriging, the main
parameter is a semivariogram, which describe the spatial correlation between points. Original
variogram for height point was calculated using R software, but interpolation was performed using
ArcGIS. Parameters of the Kriging, the Nugget, Sill, and Range, were calculated in ArcGIS using
GeoStatistic analysis, while interpolations were performed using Spatial Analyst’s interpolation
method.
When performing a Kriging, a variogram model must be constructed to determine Nugget, Sill, and
Range value. Although the original semivariogram already has these values, fitted values of Nugget,
Sill and Range will be used in the interpolation. In this research, Ordinary Kriging was used with
different variogram models; Gaussian, Spherical, and Circular. Each variogram model will produce
different DEMs, and require further DEM quality assessment.
Prediction errors;
Mean Error : 0.007746
RMSE : 0.7504

30
Figure 4-4 Variogram Models
A. GAUSSIAN The first Kriging interpolation is by using a Gaussian variogram model, which assumes that
semivariogram has a low value in short distance, and after certain point, semivariogram increase
rapidly until it reaches Sill. Calculated semivariogram model and its parameter can be seen in
following figure;
Figure 4-5 Gaussian Variogram Model and Cross-Validations
Figure 4.4. Shows that with Gaussian semivariogram, interpolation methods resulted in relatively high
RMSE, which shows that this method has a lower accuracy than IDW. Standardized RMSE with this
method is 1.12, while IDW has RSME only 0,75. This means that Kriging interpolation with Gaussian
variogram model is a less appropriate method to construct a DEM from height points.
B. SPHERICAL
Second Kriging interpolation is by using a spherical variogram model, which describes that
semivariance increases rapidly in short distance, and as distance increases, the value of semivariance
is slowly decreases until reach the sill value. Variogram model, its parameters and the results can be
seen in following figure;
Source : ESRI ArcGIS Help
Distance, h
γ 10-1
0 250 500 750 1000 1250 1500 1750 2000
0.92
1.84
2.76
3.68
4.6
Nugget : 8.56 Sill : 26.60
Range : 1851.5 Lag : 50
Prediction Errors;
Mean : -0.01063
Root-Mean-Square : 1.12
Observed

URBAN FLOOD MANAGEMENT IN SURABAYA CITY:ANTICIPATING CHANGES IN THE BRANTAS RIVER SYSTEM
31
Figure 4-6 Spherical Variogram Model and Cross Validations
Kriging Interpolation using Spherical Variogram showed a better result than Gaussian Variogram.
RMSE with this method is 0.80 which is much lower than Gaussian’s RMSE. But compared to IDW’s
RMSE, Spherical RMSE still a little bit higher, which indicate that Spherical Interpolation still has a
lower accuracy compared to IDW.
C. CIRCULAR
Final variogram model for Kriging Interpolation is the Circular Variogram Model, which describes
that covariance value between nugget and sill has a circular form. This model assumes that there is a
geometrically form in the elevation. Thus, generated DEM will have a more regular shape than other
semivariogram models.
Figure 4-7 Circular Variogram Model and Cross Validations
Figure 4.6 above showed that by using a Circular Variogram for Kriging Interpolation will have
RMSE value 0,856. This is lower than Gaussian semivariogram, but still higher than Spherical
variogram. Thus, if compared by IDW, this method have a higher RMSE, and therefore, not the most
appropriate method to generate DEM. Comparison between different interpolation method can be
seen in following figure;
Distance, h
γ 10-1
0 250 500 750 1000 1250 1500 1750 2000
0.92
1.84
2.76
3.68
4.6
Nugget : 4.46 Sill : 30.80
Range : 1947.77 Lag : 50
Prediction Errors :
Mean : -0.001964
Root-Mean-Square : 0.8567
Observed
Distance, h
γ 10-1
0 250 500 750 1000 1250 1500 1750 2000
0.92
1.84
2.76
3.68
4.6
Nugget : 3.26 Sill : 30.734
Range : 1995.31 Lag : 50
Prediction Errors;
Mean : -0.000627
Root-Mean-Square : 0.8091
Observed

32
Figure 4-8 Comparison of Interpolation Methods
TIN IDW
Gaussian
Kriging
Spherical
Kriging
Circular
Kriging
ElevationHigh : 10 Meter
Low : 0 Meter

URBAN FLOOD MANAGEMENT IN SURABAYA CITY:ANTICIPATING CHANGES IN THE BRANTAS RIVER SYSTEM
33
4.3. DEM Accuracy Assessment
Hydrodynamic modelling urban flood management is a method to develop a digital representation of
water movement inside or outside channels within a city. This model can give authorities a better
understanding about the extent of flood hazard. Flood modelling and forecasting requires not only
rainfall–runoff information, but also requires channel flow routing and forecast updating (Moore, Bell
et al. 2005). There are a set of tiered methodologies in hydrodynamic modelling, and each appropriate
for different tasks and applications over different scales. The most widely used hydrodynamic model
for assessing flood hazard in urban areas are one-dimensional (1D) and two-dimensional (2D) flood
modelling (Pender and Neelz 2007).
Root Mean Square Error (RSME)
Previous discussions shows that different interpolation method will resulted in different prediction
error. For Kriging Interpolation, different variograms have a significant impact to the error of
interpolation. To determine which method can give the best DEM accuracy, the most common way is
to use RMSE value. The higher the RMSE, the lower the accuracy of generated DEM. Another useful
value to assess the quality of a DEM is Mean Error, which shows the average differences between
calculated an observed value. Because Mean Error is not square-rooted, value of Mean Error can be
positive or negative. Mean Error and RMSE for DEM construction with different interpolation
method can be seen in table 4.1.
Table 4-1DEM Accuracy for Different Interpolation M ethods Table 4.1. Shows that IDW interpolation method and Spherical Kriging Interpolation have a similar
quality. RMSE for IDW is slightly smaller than Spherical, while Spherical’s Mean Error is smaller
than IDW’s Mean Error. This inconsistency made statistical methods cannot give a definite
identification about which method is the most accurate to generate DEM for study area.
Visual Assessment
Because RMSE and Mean Error shows cannot give a decisive definition about which interpolation
method has the best accuracy, visual assessment method can be used to decide which DEM is better in
representing the study area. Visual assessment is based on general knowledge about study area and
common assumptions about topology of urbanized area.
Interpolation Method Mean Error RMSE TIN -0.015051 0.844
IDW 0.007746 0.7504
Gaussian Kriging -0.01063 1.12
Spherical Kriging -0.000627 0.8091
Circular Kriging -0.001964 0.8567

34
Figure 4-9 Visual Comparison of IDW and Spherical Kriging
DEM generated by IDW interpolation shows a more sharp representation of elevation, while DEM
generated by Kriging inter shows a smoother surface. For built-up environment, sharper elevation
representation is better because elevation in urban area often shows a sudden changes because the
presence of man-made features and modifications on the natural terrain. Therefore, IDW interpolation
is considered better to generate DEM in the study area.
4.4. DSM Construction
Flood modelling requires a 2D grid as representation of terrain topology. Digital terrain representation
of urban areas need further improvement of DEM to accurately represents real terrain in digital format
because man-made features, like roads and buildings, have a significant impact to the behaviour of
water on a terrain. Thus, those features can play a role to determine the area of interest of the model.
This study also use man-made features to delineate study area for flood modelling, which is a toll road
that stretches from northern to southern part of Surabaya City. The assumption for this delineation is
toll road can block the flow of the water because it usually higher than the natural terrain. Therefore,
in this study, toll road in Surabaya City was set as a western boundary of the model’s 2D grid.
Northern and eastern boundary of the 2D grid is the sea, and southern boundary is Kali Perbatasan,
which also an administrative boundary for Surabaya City and Sidoarjo Regency.
Another man-made features included in DSM construction is buildings and agricultural land uses. For
buildings, an additional data was added to the DEM, which is the base of buildings. The main
assumption for this method is that water still can penetrate a building, but not building base, which in
Surabaya City is around 20 cm – 50 cm higher than natural terrain. Another consideration is basement
lower than natural terrain is extremely rare in Surabaya City. Agricultural land use have a different
characteristics compared to buildings in term of its relative elevation to the natural terrain. Rice or
vegetable fields and fish ponds are agricultural land use can be found in Surabaya City, especially in
eastern part. These land use usually inundated by water, and the surface of water is around 20 cm
lower than natural terrain.
IDW Interpolation Spherical Kriging Interpolation

URBAN FLOOD MANAGEMENT IN SURABAYA CITY:ANTICIPATING CHANGES IN THE BRANTAS RIVER SYSTEM
35
Roads also an important man made features that should be included in DSM construction. If roads are
also included in DSM, maximum pixel size of the DSM is 10 meters (Tennakoon 2004). If DSM for
study area was generated with 10 meters pixel resolution, number of pixels is exceeding 1 million
pixels, which is exceeding the number of pixels allowed by SOBEK. For 1D2D flood modelling,
SOBEK is currently only support up until around 100.000 pixels. Therefore, roads cannot included in
DSM generation in this study. DSM construction scheme and its result can be seen in following
figure;
Figure 4-10. DSM Boundary
Figure 4-11. DSM Construction Scheme

36

URBAN FLOOD MANAGEMENT IN SURABAYA CITY:ANTICIPATING CHANGES IN THE BRANTAS RIVER SYSTEM
37
5. Flood Management Policies
5.1. Policies of River and Water Management
Regulatory powers of river and water management in Indonesia are vested both in central and local
governments. In current system, regulatory power within local government included operation,
management, and monitoring function of water resources, are held within one institution, namely
Dinas PU Pengairan (water resources agency), which it exercises through its field offices. Therefore,
there is no organizational or institutional demarcation between the regulatory and operation and
management functions. In the regulatory process, before decisions are made, agreement with
concerned agencies, groups, or stakeholders is required. However, this process lacks the
independence, fairness, and transparency that regulatory mechanisms should have. It is a common
problem that local institutions and operating agencies find it difficult to implement the regulations in
river basins (Ramu 2002).
5.1.1. National and Regional Policies
Indonesia has approximately 5,500 rivers, both big and small. Usually, rivers in Indonesia are
originated from mountainous areas with distinct characteristics; Upper reaches have a steep slope,
middle reaches have a moderate bed slopes, and lower reaches have a relatively flat terrain. Almost
major cities in Indonesia is located in the lower reach of a big river, and due to high rainfall intensities
and lack of flood retention infrastructures, big cities which located in the low reaches of rivers are
very common to heavy and annual flood. A large quantity of sediment transport is also a common
phenomenon, which results in river problems in urban areas.
Flooding in urban areas, especially the ones located in low-lying areas, has been a common problem
in many of the river basins. Regardless to the size of the river basin, flooding in Indonesia’s major
cities usually caused by;
a. Increase in flood peaks due to changing land use and severe deforestation,
b. Inadequate capacities of the river channel in the middle and lower reaches
c. High levels of sedimentation impacting the river morphology and causing river mouth problems
d. Lack of flood plain and its encroachment both in rural and urban areas
e. Lack of land-use zoning and enforcement of land-use controls
f. Inadequate urban drainage and disposal of solid waste into river channels
g. Urban land subsidence due to over abstraction of groundwater (Jakarta, Surabaya, Semarang)
h. Poor maintenance of flood infrastructure and lack of funding
i. Institutional weakness in flood management.
The main issue in Indonesia’s national river and water management is balancing water supply and
demand that sometimes can differs greatly, because of the seasonal and annual variation of the river
water discharge. Water supply is always lower than demand during dry season, and during rainy

38
season, lack of reservoirs and storage capacity of the catchment area caused flood on regions along
main rivers. Spatial and temporal variation in supply and the high ratio of demand-to-supply on the
island of Java and some parts of Sumatra and Sulawesi is a major problem that up until now can not
be managed adequately by national and local government. Extreme erosion in the urbanized areas and
densely populated watersheds of major river basins also contribute to river management problems.
River and water resources in Indonesia are governed mainly under de-concentrated governmental
system, where local governments act as regional representatives and implement central government
policies and programs under the supervision of the central government. Local government made
initiations and proposals about what and which programs should carried out to manage river and water
resources, and then, central government will decide the scope and funding resources for those
proposed programs, usually from national budget. At operational level, these programs are carried out
by regional sector agencies, which operate under the regional governments and must follow the
general outline set out by central government (Ramu 2002).
5.1.2. Brantas River Basin Management
Rivers in Indonesia are grouped into 90 river management boundaries called Satuan Wilayah Sungai
(SWS). SWS’s boundaries normally based on regional division for river basin planning, development,
and management. The Brantas SWS has 1,555 rivers and is fully located in the East Java province.
Because of the importance and strategic role of Brantas River both in regional and national scopes,
Brantas River Basin is classified as a national SWS, which means that management of Brantas River
Basin still under co-ordination by central government.
According to (Ramu 2002), there is a generic institutional framework for basin management, which is
also applicable to the Brantas basin. This framework indicates who and which institutions, whether in
central or local level, have significant roles and responsibilities for water and river management in
Indonesia. These institutions are as follows;
1. Macro and Program Planning : National, Provincial and Local Planning Boards
2. Supervision & Guidance : Ministry of Public Works represented by Water Resource
Directorate and Water Basin Planning and Development Board (IPKPWS)
3. Development : National or Provincial Projects
4. Regulatory : Provincial Water Resources Agency and Basin Water Resources Agency (Dinas
PUP, Balai PSDAs)
5. Water Management including Operation and Maintenance: Brantas River Basin Corporation
(Jasa Tirta, Inc.) (a national public sector corporation)
6. Irrigation Management : a) District Water Resource Agency (Kab. Dinas PU) for irrigation systems inside a district.
b) Provincial Basin Water Resource Agency (Balai PSAWS) for irrigation systems those are
inter-district.
7. Coordination : a) Ministerial Coordination Team at the national level.
b) Provincial Water Resources Committee

URBAN FLOOD MANAGEMENT IN SURABAYA CITY:ANTICIPATING CHANGES IN THE BRANTAS RIVER SYSTEM
39
c) District Water Resources Council (KTPA) to be setup with stakeholder representation.
d) Basin Water Resources Committee (PPTPA) at the river basin level, which is expected to
be reorganized with stakeholder representation.
Development of the Brantas River basin was started in 1961, with a series of Master Plan had been
formulated as development guidance. Basic concept of the development Brantas River basin was to
develop a comprehensive and integrated development, which was “one river, one plan, one
coordinated management”, because of water is a dynamic resource, that flowing through different
administrative boundaries. To avoid conflict of interests between stakeholders, Brantas River must
managed under one coordinated management (Ramu 2002).
To improve the management and operational aspects of water resources in Brantas River Basin, in the
year 1990, Indonesia’s central government set up a public sector corporation, namely Jasa Tirta, inc.,
to operate, maintain, and manage all of the major infrastructure and to manage water resources in the
Brantas River. Jasa Tirta has no role in developmental activity and acts strictly as a basin manager
under the supervision of the Ministry of Public Works.
The three main institutions in the basin that have direct responsibility in Brantas River Basin Water
and River Management (WRM) are:
1. The three provincial water agencies
(a) Balai PSDA, Bango Gedangan
(b) Balai PSDA Madiun-Kediri
(c) Balai PSDA, Buntung–Peketigan
2. The Brantas Public Corporation (PJT-I)
3. Basin Coordination Committees
(a) PPTPA, Malang-Besuki
(b) PPTPA Madiun-Kediri
(c) PPTPA Surabaya-Madura.
The primary institutional framework for the Brantas basin is shown diagrammatically in following
figure;

40
Figure 5-1 Institutional Framework in Brantas Basin Management
Source: (Ramu 2002)
The provincial water resources agency acts as the regulator for the Brantas River basin and manages
the provincial funded program in water sector in the basin. The Provincial Water Resources
Coordination Committee (PTPA) set up in 1994 provides the policy direction for the Brantas basin
water resource development and management. (Usman 2003). There are three main aspects of
authority sharing in Delta Brantas River network, which are regarding Licensing for water use and
Operation for Dry and Wet Season.
a. Licensing
If anyone or any institution wants to take water from Brantas River, it must ask for a license from
the local government. Licence issued by the Local Government must be supported by technical
recommendation by Jasa Tirta Public Corporation (PJT).
Technical recommendation is important to keep the balance of water supply and demand, because
water resources in the Brantas River are used for various purposes. The main consumers are:
irrigation (80%), raw water for drinking water, industries, fishpond, city flushing, etc (20%) and
electricity (not consume the water). Water allocation from PJT to the users is based on contract
basis. Users have to contribute cost of O & M to PJT, except farmers. The rate of tariff is decided
by the Government upon pre discussion between PJT and users.
b. Dry Season Operation Rule
Water management in the Brantas river is coordinated by a body called East Java Provincial Water
Board / EJPWB ( Panitia Tata Pengaturan Air ), headed by Vice Governor of East Java Province.
Water allocation pattern consists of two kinds of Operation Rules that are for the dry season (June-
November) and for the rainy season (December-May).

URBAN FLOOD MANAGEMENT IN SURABAYA CITY:ANTICIPATING CHANGES IN THE BRANTAS RIVER SYSTEM
41
Procedure for preparing operation rule for dry season is as follows. In the month of May (for the
dry season) users submitted water demand to PJT. Then by computer simulation and weather
forecasting, PJT prepared draft of dry season operation rule. On the end of May the draft of
operation rule was discussed in the forum of EJPWB and if all parties agreed, then approved by
Vice Governor for implementation. If during the monitoring time, there was deviation of prediction
or conflict of interest between users, limited members of EJPWB sitting together to solve the
problem or to review it , if needed.
c. Rainy season Operation Rules
Preparation of the rainy season operation rules is the same procedure as for dry season, Focus of
rainy season OR is to control flood, because from average annual discharge of 12 billion m3
surface run off, only about 4.5 billion m3 was utilized. The rest is flowing into the ocean, mostly
during rainy season. Management of flood control in the Brantas river basin was done by a State
Own Company, namely Jasa Tirta Public Corporation. Water management was operated using
equipment Flood Forecasting and Warning System, by time interval of 1 hour, on line. A yearly
guide line books were prepared as a guide line of flood forecasting, flood warning and flood
fighting.
The guide line book mentioned the critical locations of levee along the river (about 600 km length
of levees, both sides of river bank), protection methods, numbers of material and equipment
available for flood fighting in the warehouse along the river, information of the staff involved
(names, addresses, telephone numbers, hierarchy of information to be submitted from the chief of
district up to the Governor), etc.
Flood protection scheme at extensive scale has been developed and gradually implemented in the
Brantas River Basin. Main features of this flood protection scheme also have been constructed, which
are Lahor Dam, Karangkates (Sutami) Dam, Wlingi Dam, and the two retarding basins—Ngrowo and
Widas along with the Lengkong flood gates to divert water into the Porong River to reduce flood
flows in Surabaya River and protect the town of Surabaya. Construction these structures, coupled with
the dike system, have successfully prevented flooding in the mainstream of the Brantas River since
1990. A flood warning system also has been developed, and its implementation provides early
warning for operation of the floodgates at the various locations. Flood control scheme of Brantas
River Basin can be seen in following figure;

42
Figure 5-2 Flood Control Scheme of Brantas River Basin
Source: (Ramu 2002)

URBAN FLOOD MANAGEMENT IN SURABAYA CITY:ANTICIPATING CHANGES IN THE BRANTAS RIVER SYSTEM
43
5.1.3. Brantas Delta Region Management
Lower reach Brantas River Basin is called Brantas Delta area, where Kali Brantas River is divided
into two rivers; Kali Surabaya River, a natural river that entering Surabaya City, and Porong River, a
man-made river that built as a diversion channel to protect Surabaya City from flooding. Brantas
Delta was developed by the construction of Lengkong Barrage in 1857.
Brantas Delta plays a very important role to flood hazard in Surabaya City, because regulations of
rivers within Brantas Delta will have a significant impact to the volume of water discharge in Kali
Surabaya River, which is the main river in Surabaya City. Until now, Surabaya City is well protected
from river flooding because most of water discharge of Brantas River is safely discharged to the sea
through Kali Porong. As described in the previous sections, there is a big threat of flooding in
Surabaya City due to the mud flood disaster in Sidoarjo, neighbouring municipality of Surabaya,
which can reduce the capacity of Kali Porong, and caused increasing water discharge of Kali
Surabaya.
Water and river management in Brantas Delta is managed by the three main institutions that have
direct responsibility in Delta Brantas;
1. The Provincial water agencies (PSAWS)
• PSAWS Bango-Gedangan
• PSAWS Buntung–Peketigan
2. The Brantas Public Corporation (Jasa Tirta, Inc.)
3. Basin coordination committees for Delta Brantas (PPTPA Surabaya-Madura).
Those three institutions together have the authority to manage river within Brantas Delta, i.e.,
regulating water discharge, river regulatory structure adjustment, and land use change controls.
Layout of Brantas River Basin and Brantas Delta can be seen in next figure.

44
Figure 5-3. Brantas River Basin
5.2. Flood Mitigation Measures
To narrow and focus the flood mitigation measures, discussions about existing policies is limited to
the Brantas Delta area. Flood mitigation measures in Brantas Delta can be described in four major
groups; management boundaries, institutional hierarchy, structural defence measures, and non-
structural defence measures.
5.2.1. Management Boundaries
In general, flood management in Surabaya City is divided into 4 drainage area boundaries, which are
Eastern, Central, Western, and Southern flood boundaries. Descriptions for each management
boundaries are as follows;
1. Eastern Surabaya Drainage Area.
This area is bounded by Kali Mas River in western part, and sea protection in eastern part. In this
area, in flood event, water was discharged to the sea in eastern part using gravity force. This
discharge is regulated using several water gates to avoid flood from high sea tide.
2. Central Surabaya Drainage Area.
This area is confined in central Surabaya area, which has very high density housing, bordered by
Gunungsari Channel in western part and Kali Mas River in eastern part. Because this area has a
very flat topography, water in flood event must be discharged using water pumps to both Kali Mas
River and Gunungsari Channel.
Brantas Delta

URBAN FLOOD MANAGEMENT IN SURABAYA CITY:ANTICIPATING CHANGES IN THE BRANTAS RIVER SYSTEM
45
3. Western Surabaya Drainage Area.
This area located in the western part of Surabaya City, and delimited by catchment area of
Gunungsari Channel (13.7 km2) and Kedurus River (67.4 km2). Topography in this area mainly
high elevated, so flood is less likely to be occurred in this part of Surabaya City, with exception
along Kedurus River.
4. Southern Surabaya Drainage.
This area is defined as an area south to Kali Surabaya River. Delta Brantas River network system
is also included in this management boundary. Regulatory structures in this area are Mlirip Weir,
Lengkong Barrage, Jagir Dam, and Gunungsari Dam.
5.2.2. Institutional Hierarchy and Coordination
Flood management in Delta Brantas involving three mayor components; Central Government, Local
Government, and Local Communities. At national level, Central government was represented by its
two ministries, which are Ministry of Public Works through and Ministry of Home Affairs. Authority
for Public Works Ministry is held by its Directorate of Water Resource, while authority for Home
Affairs Ministry is held by East Java Province’s Governor.
At local level, Water Basin Planning and Development Board (IPKPWS) and Jasa Tirta held
responsibilities of Delta Brantas river and water management under Directorate of Water Resources.
The first one is responsible for planning and development process, while the second one is responsible
for operational and maintenance of Delta Brantas river network system. In the event of flooding, these
two institutions constantly and separately receiving information from community groups and on-duty
officer in measurement stations about river and rainfall conditions, and established coordination
between each other about proper measures to be taken during flood. Then, together, these two
institutions will make a report and informed the latest flood conditions to the Directorate of Water
Resource. On the other hand, East Java’s Governor established a provincial and local task force as a
coordinator for flood anticipation and mitigation. If flood occurs, local task force will gather
information from community group and measurement stations and then report it to provincial
taskforce, who finally report it to the governor of East Java Province. The task force also must inform
the East Java’s Public Works office to establish coordination between each other.
Final decisions about flood mitigations measurements are held by the Governor of East Java Province,
who then gives an order to Provincial Task Force to undertake required actions during flood events.
Then, Provincial Task Force gives instructions to Jasa Tirta to adjust river regulatory structures to
avoid flood. In case of flood is unavoidable, Local Task Force held the responsibility to undertake
required actions during and after flood event.

46
Ministry of Public Works Ministry of Home Affairs
Directorate of Water Resources
Director of IPKPWS
Brantas
Director of Jasa Tirta,
inc.
IPKPWS BrantasJasa Tirta’s Flood
Division
Brantas River Planning and
Management Offices
On-duty OfficerCommunity Groups
Rainfall, Water Level, and Water Discharge
Delta Brantas Observations
Governor of East Java Provice
Provincial Task Force
Municipal Task Force
Brantas River Task Force
East Java’s Public Works and Water Resource
Office
Provincial Basin Water Resource Agency (Balai
PSAWS) River Structures
Adjustment
Figure 5-4 Flood Mitigation Hierarchy
Source: Jasa Tirta, Inc.
5.2.3. Structural Defence
There are several regulatory structures located in Delta Brantas that play a role as a structural defence
to avoid flood hazard, i.e. Mlirip gates, Gunungsari barrage, Wonokromo gates, Gubeng rubber dam
and Jagir barrage. The Surabaya River is a branch of Brantas River starting from Mlirip gates in
Mojokerto to the estuary in Surabaya. Along the Surabaya River there are several major flood control
structures which are operated in the dry season to guarantee intake flows for water and industry and
urban flushing in the rainy season. The major structures must be operated during both the dry and
rainy seasons because they have to maintain water levels at fixed elevations, in following figures.

URBAN FLOOD MANAGEMENT IN SURABAYA CITY:ANTICIPATING CHANGES IN THE BRANTAS RIVER SYSTEM
47
Table 5-1 Main Structural Defense
No Name of structure And
(Management Organisation)
Elevation to be kept at
Operation Equipment
1 Lengkong Barrage (Jasa Tirta, inc.) - 8 gates sized 6.6 x 5m.
2 Mlirip Weir (Jasa Tirta, inc.) - 1 gate sized 6 x 9 m and 1
flood gate sized 13 x 9 m
3 Gunungsari Dam (Jasa Tirta, inc.) + 4.60 4 gates sized 14 x 4 m
4 Jagir Dam ( Balai PSAWS – BP ) +2.95 3 gates sized 9 x 4 m
5 Wonokromo Gates (Jasa Tirta, inc.) - 2 gates sized 4 x 3,8 m
6 Gubeng Rubber Dam (Jasa Tirta, inc.) +2.20 - +2.27 Rubber dam 2 x 12.0 m
Source: Surabaya Drainage Masterplan (SDMP)
Main functions of each structural defence are as follows;
1. Lengkong Barrage.
Lengkong Barrage’s main function is to regulate Brantas River discharge. In Dry season, this
structure plays a role to maintain water quantity for irrigation purpose, while in rainy season, to
discharge water directly to the sea through Kali Porong. Irrigation area can be served by
Lengkong Barrage is around 40,156 hectares, mainly located south to Sidoarjo. Maximum
capacity of Lengkong Barrage in flood event is approximately 1,500 m3/s.
2. Mlirip Weir
Main function of Mlirip Weir is to regulate water discharge entering Surabaya City through
Surabaya River. If flood occurs in Brantas River, to avoid flooding in Surabaya City, Mlirip Weir
is closed partially. In dry season, Mlirip Weir completely open to maintain water quantity entering
Surabaya City to fill water requirement within Surabaya City.
3. Gunungsari Dam
Gunungsari Dam plays a role to maintain water elevation at Surabaya River and maintain water
quantity for irrigation area (approximately 3,812 hectares) within Surabaya City during dry
season. In rainy season, Gunungsari Dam fully opened to discharge water in Kali Surabaya
directly to the sea.
4. Jagir Dam
Jagir Dam’s main function is to regulate downstream of Surabaya River which is divided into two
rivers; Kali Mas River and Wonokromo River. During dry season, Jagir Dam plays a role to
maintain water elevation of Surabaya River at 2,95 m, maintain intake to Surabaya’s water
company (3 m3/s), and to regulate water entering Kali Mas River through Wonokromo Dam as a
irrigation supply, industrial use, and urban uses. In rainy season, Jagir Dam fully opened to
discharge water directly to the sea through Wonokromo River.
5. Wonokromo Gates
Wonokromo Gates plays a role to divert water from Surabaya River to Kali Mas River and
Surabaya City’s urban area, and during rainy season or flood event, this structure protect
excessive water entering Surabaya City that can caused flood in urban area.
6. Gubeng Rubber Dam
Main functions of Gubeng Dam in dry season are to lift water elevation at Kali Mas River, to
protect sea water intrusions into urban areas, and to provide water for irrigation in north-eastern

48
part of Surabaya City. During rainy season, Gubeng Dam is fully opened to discharge as much as
possible water to the sea through Kali Mas River.
Figure 5-5. Structural Defense Adjustment During Flood Event
5.2.4. Non-Structural Measures
Another type of Flood Mitigation Measures is Non-Structural measures, which in general is an effort
to maintain or to improve flood retention of the river basin and watershed area. Non-Structural
Measures that are applicable to flood management in Delta Brantas is described in Guideline for
Spatial Management in Flood-prone areas, issued by ministry of public works of Republic Indonesia.
In this guideline non-structural measures in flood-prone areas are;
a. Watershed management Main purpose of Watershed management is to reduce rainfall-runoff in a river basin to the main
river. To support watershed management, regulations about land use conservation must be
implemented, to reduce or minimize land use conversions from green and open spaces to built-
up areas. Other examples of methods that can be implemented in watershed management to
reduce runoff to the main river are;
Mlirip Weir
All Gate
Open
Flood Gate
Close
Lengkong Barrage
Adjusted as
Required
All Gate
Open
Gunungsari DAM
Water Level
at 4.6 m
All Gates
Open
Jagir DAM
Water Level
at 2.95 m
All Gates
Open
Wonokromo Gate
All Gate Open 50 %
Capacity
Operation During
Dry Season
Adjustment During
Flood Event
Surabaya Boundary
River or Primary Channels

URBAN FLOOD MANAGEMENT IN SURABAYA CITY:ANTICIPATING CHANGES IN THE BRANTAS RIVER SYSTEM
49
a. Rehabilitation of forest in catchment areas.
b. Construction of sub-channels.
c. Construction of drainage wells.
d. Regulated agricultural areas.
b. Floodplain Management and Land Use Zoning Regulation Floodplain management is performed by implementation of local policies which regulated spatial
plan in floodplain areas, and adjusted with the possibility of flood based on flood risk map and
floodplain zoning based on the severity of the flood. By this method, land use conversion in areas
that are considered prone to flood can be avoided. Thus, future land use in such areas is projected
into open spaces or forestry only. Socio-economics aspects are important factors that must be
considered in floodplain management and land use zoning. These factors are;
a. Size of inundated area.
b. Flood duration.
c. Early warning system efficiency.
d. Flood preparedness.
e. Flooding time.
f. Water velocity.
g. Evacuation plan.
C. Flood Proofings Main purpose if flooding is not to prevent or even to reduce flooding, but rather to reduce the
impact of flood event by adjusting the physical structure of human settlement. Various methods
of flood proofing are;
a. To increase terrain elevation
b. To increase the ground clearance of building structures;
c. To use water-proof materials for building structures.
Flood proofings are implemented by considering following factors;
• Design flood level, both from calculation and from previous flood events.
• Freeboard as a safety factor, which is around 30 – 50 cm above design flood level.
• Flood fringe areas.
Some examples of flood proofing methods can be seen in following figure;

50
Figure 5-6 Flood Proofing Methods
d. Flood Forecast and Early Warning System. Flood forecasting is an effort to give an approximate flooding time and the flood elevation in
flood prone areas. On the other hand, Early Warning System gives a warning about flood event or
certain water discharge to give enough time to save lives or properties. This method is the
cheapest and the most effective way to avoid loss and damage during flood event. This method
also proven to be most useful to save lives because people can move or relocated even before the
flood struck.
Various mathematical models about hydrology and hydraulic have been used to calculate flood
forecast based on hydrological data (rainfall, water discharge, water level) in upstream reach of a
river. The result of this model is an approximation of incoming flood event.

URBAN FLOOD MANAGEMENT IN SURABAYA CITY:ANTICIPATING CHANGES IN THE BRANTAS RIVER SYSTEM
51
To anticipate flood hazard within Delta Brantas River network, Jasa Tirta, inc. equipped with
Flood Forecasting and Warning System (FFWS). Monitoring stations for this system is spread
along Brantas River, with main monitoring station located at Perning, near Kali Surabaya River
upstream.
Through FFWS, hydrological data of the entire Delta Brantas River network can be collected in
real time and time-synchronized between monitoring stations. These data included water elevation
at main rivers and rainfall. Then, based on this data, Jasa Tirta will produce a flood forecasting
report, and then report it to another institutions involved in flood management explained in
section 5.2.2. General operational mechanisms of FFWS are as follows;
1. Rainfall, water elevation, and river discharge observations are performed by the on-duty flood
observer, and if certain rainfall and/or water discharge or level reaches a point that considered
possible to cause flood, he immediately report to Jasa Tirta’s office and then standby for the
coming instructions.
2. In case of flood occurs, on-duty flood observer immediately check field conditions and
established a continuous coordination with Jasa Tirta’s office to exchange information
regarding flood event conditions.
3. On-duty staff in the flood stations will report to Jasa Tirta’s office about;
- Flood discharge;
- Flood impact on river structures
- Flood impact on properties and people.
- Possible steps to be taken for manage flood and its impacts.

52

URBAN FLOOD MANAGEMENT IN SURABAYA CITY:ANTICIPATING CHANGES IN THE BRANTAS RIVER SYSTEM
53
6. Flood Modelling
6.1. Introduction
Prediction about the impact of changes in Delta Brantas River network to flood hazard in Surabaya
City requires a computer-based flood modelling which can produce a realistic results. Thus, different
scenarios can be developed by this flood modelling to find out what are possible measures to be taken
in order to minimize flood impact. For this purpose, SOBEK software developed by Delft Hydraulics
provides the best combination of 1D and 2D flood modelling available. SOBEK a valuable instrument
for flood forecasting, navigation, optimising drainage systems, controlling irrigation systems,
reservoir operation, sewer overflow design, ground water level control, river morphology regulation,
and water quality control. SOBEK can combine river systems, urban systems and rural systems for a
total water management solution.
The program has been enhanced with facilities to import GIS data into the model and to export
computational results to GIS systems for presentation and evaluation. It simulates very well the
influence of the existing/planned infrastructure on flooding processes. Advantages of using SOBEK
for developing 1D2D flood modelling are (Shaviraachin 2005);
a. Water flow is computed initially on dry land, therefore, doesn’t require any special drying and
wetting mechanism.
b. Water flow can be computed in accurate and stable manner, even on very steep slopes and on man
made structures.
c. Flood modelling can be developed in a very accurate time scale, up to within minutes.
d. Realistic flood predictions based on given data inputs and boundary conditions.
e. Supporting user-friendly processing and easy interaction with another GIS softwares.
Figure 6-1. 1D2D Combination in SOBEK

54
6.2. Model Schematisation
Flood schematisation in SOBEK in general consists of Nodes, Reaches, and 2D grid. Descriptions of
each element involved in flood modelling can be found in SOBEK Technical Reference, which
described below.
1. Up Stream Boundary: Node presentation of a point where water discharge entering the model.
2. Down Stream Boundary: Node presentation of a point where water discharge out from the model.
3. Cross Section: Node presentation of river topology.
4. 1D Reach: Line presentation of river network, which only calculated water movement along the
river.
5. 2D Reach: Line presentation of river network, which connected to 2D grid to simulate overland
flow in the event when water discharge is exceeding the river capacity.
6. 2D Grid: Terrain representation of the study area, which store the information about terrain
elevation, both natural and man-made terrain elevation.
For 1D flow, channels were constructed by combination of rivers and primary drainage channels
within Surabaya City. The dimension for each channel was determined from Cross-Section data,
which is defined as an input element of the SOBEK-Flow-module in which the shape and size of the
channel/sewer profile perpendicular to the flow is described. There are different type of cross
section, which are; Asymmetrical trapezoidal, Circular, Egg-shaped, Symmetrical Tabulated, and Y-Z
River cross section. Cross sections can be open or closed. The asymmetrical trapezoidal cross
section, the River cross section and the y-z cross section are always open. The symmetrical tabulated
cross section can be open or closed. It is considered closed when the width of the highest level is
smaller than 10 mm. The circular and egg-shaped cross sections are closed. In this study, all
channels are using Y-Z cross sections to represent its shape. This is a series of Y-Z co-ordinates that
form a general profile.
Figure 6-2 Y-Z Cross Section Profile
Source: SOBEK Manual

URBAN FLOOD MANAGEMENT IN SURABAYA CITY:ANTICIPATING CHANGES IN THE BRANTAS RIVER SYSTEM
55
Cross sections may be defined at arbitrary locations in the model, provided that for each reach at least
one cross section is specified. Depending on the situation, the SOBEK-Flow-module constructs cross
sections at the calculation points by way of constant extrapolation or linear interpolation. If there is
only one cross section defined at a reach, this cross section and its bed level are applied over the
whole reach at all the calculation points. Figures below form an example of the way the cross
sections are interpolated and extrapolated. Here, the bed levels are varied, while the cross sectional
areas are constant.
Figure 6-3 Channel Interpolation Method
The connection between the 2D cells and the 1D network as explained in SOBEK manual reference is
done in the following way:
1. The centre of 1D node is internally moved to match with the centre of 2D grid cell, without
changing the length of the connecting 1D branch.
2. The 2D Grid Cell is counted as part of 1D Node.
3. The flow in 1D channel below the 2D grid level is treated as 1D flow, while the flow above the
2D Grid level is treated as 2D flow with the area of 2D grid cell.
Technical method for 1D2D connection can be seen in following figure;

56
Figure 6-4 1D2D Connection
Source: SOBEK Technical Reference
One of the first things to do when developing 1D2D flood modeling in SOBEK is to create the
schematization of network that represents the water system. Whether it is a river or channel, the
principles are the same: it will be a GIS-based network or grid.
Figure 6-5 FLOOD MODELING SCHEMATISATION

URBAN FLOOD MANAGEMENT IN SURABAYA CITY:ANTICIPATING CHANGES IN THE BRANTAS RIVER SYSTEM
57
6.3. Boundary Conditions
Boundary conditions used in flood modelling for study area are Inflow Discharge as a data source of
Up Stream Boundary of the model, Rainfall intensity as a meteorogical data, and Sea Tide as a data
source for Down Stream Boundary of the model.
6.3.1. Inflow Discharge
Available data for inflow discharge is the Brantas River Down Stream for 2, 5, and 10 years return
period. This data is collected from the measurement station located at intersection of Brantas River,
Surabaya River, and Porong River. The hydrograph for Brantas River down stream is calculated for 5
days period, and the in the flood modelling, this data was entered with 1 hours time steps. Brantas
River Downstream discharge was collected from Jasa Tirta, and Hydrograph for 5 days flood
discharge data can be seen in following figure;
Figure 6-6. Hydrograph for Brantas River Downstream
Source: Jasa Tirta
From figure above, maximum water discharge of Brantas River is around 1,500 m3/second for 10
years return period. In current condition, most of water Brantas River discharge is entering Porong
River, and then can be safely discharge into river. From the 5 years time-synchronized data collected
between year 2000 – 2005, average percentage of Brantas River discharge entering Porong River is
around 98%, while discharge entering Kali Surabaya River is only around 2% of the Brantas River
discharge.

58
6.3.2. Rainfall Intensity
There are ten daily rainfall stations in Surabaya City, but from observations during development of
Surabaya Drainage Master Plan (SDMP), there is relatively little variation across the study area, with
the highest and lowest values within approximately +/-10% of the average. Thus, the results of the
daily analysis do not indicate any clear geographic pattern, and it is considered appropriate to average
the results for all stations. According to Surabaya Drainage Master Plan (SDMP), severe storms in
Surabaya almost always occur in the afternoon or early evening. Analysis of hourly data for the peak
months of the 1998/99 wet season (December and January) shows that 45% of the total rainfall
occurred between 15:00 and 17:00, and 87% between 1500 and 21:00. For design purposes in SDMP,
the short duration observations from Perak Station were factored by the ratio (average of 10
stations/Perak from the 31-year period) from the daily analysis for each return period, and then
divided by the duration to give rainfall intensities. This gives design rainfall intensities which are
going to be used in the flood modelling.
Table 6-1. Estimated Maximum Daily Rainfalls (mm/hours) Return Period (years) Nr. Rainfall Station
2 5 10
1 Larangan 95 116 128
2 Kebon Agung 84 108 123
3 Gubeng 96 124 145
4 Wonorejo 84 114 135
5 Keputih 91 115 131
6 Kedung Cowek 104 133 147
7 Sememi 96 122 139
8 Banyu Urip 100 127 143
9 Gunung Sari 95 125 147
10 Perak 91 112 126
Average 94 119 136
Source : SDMP
Table 6-2. Design Rainfall Intensities (mm/hour)
Return Period (years) Duration
2 5 10
5 minutes 172 224 258
10 minutes 138 179 207
15 minutes 125 160 183
30 minutes 95 118 130
45 minutes 75 95 108
1 hour 66 81 88
2 hours 40 49 54
3 hours 27 35 39
6 hours 13 17 19
Source : SDMP

URBAN FLOOD MANAGEMENT IN SURABAYA CITY:ANTICIPATING CHANGES IN THE BRANTAS RIVER SYSTEM
59
Hydrograph for rainfall data then derived by using rainfall intensity data. Then, the hydrograph was
synchronized with discharge of Brantas River discharge hydrograph. This is requirement in flood
modelling so that simulation runs as close as possible to real conditions. Hydrograph for rainfall data
used in this study is;
Table 6-3 Rainfall Hydrograph
6.3.3. Sea Tide
Because Surabaya is a coastal city, sea tide level plays an important role in flood modelling because
water discharge from rivers within Surabaya is greatly influenced by sea tide level. Therefore, sea tide
level data must be also included in flood modelling. One important consideration is that it is
unjustified to combine sea tide return period with return period of river discharge and rainfall
intensity. Sea tide has a different time frame with river discharge and rainfall intensity, i.e., both has
increasing values during rainy season, while sea tide doesn’t shown similar increases.
To define the design value of sea tide level, at least three key factors are involved:
a) The state of the tide within the daily tidal cycle, i.e. does the high tide coincide with the flood
runoff.
b) The state of the tide within the monthly tidal cycle, i.e. is it a spring or neap tide.
c) Variations from one monthly cycle to another, or from theoretical tide levels, for example storm
surge.

60
SDMP already taking account of all the above points in its calculation, where it is considered that the
design downstream boundary condition should have a peak equal to the average high tide in the peak
wet season months plus allowance for sea level rise (i.e. 2.5 + 0.1 = 2.6m). Design sea tide level used
in SDMP can be seen in following figure;
Table 6-4. Design Sea Tide Level (m)
Time Design Tide (m) Time Design Tide (m) 16:00 1.8 09:00 1
17:00 1.9 10:00 1.3
18:00 2.1 11:00 1.5
19:00 2.3 12:00 1.7
20:00 2.4 13:00 1.8
21:00 2.5 14:00 1.8
22:00 2.6 15:00 1.8
23:00 2.4 16:00 1.8
24:00 2.1
01:00 1.8
02:00 1.4
03:00 1
04:00 0.7
05:00 0.5
06:00 0.4
07:00 0.5
08:00 0.8
Source: SDMP
6.3.4. Surface Roughness
Overland water flow in urban area is influenced greatly by the land use. Surface water is moving
relatively more freely in open space and agricultural areas compare than built-up areas. Description
about how difficult water movement on certain surface characteristics is called Surface Roughness,
with the Manning Coefficient as the most commonly used parameter.
Table 6-5. Manning Coefficient for Urban Areas Land use Manning’s Coefficient
Buildings 1.00
Agricultural 0.04
Open Space 0.03
Source: (Tennakoon 2004)
Surface roughness input for flood modelling is derived from land use map of Surabaya City.
Generated raster map with manning value then used as an input for Bottom Friction Coefficient in
SOBEK flood model.
Design Tides
0.00
0.50
1.00
1.50
2.00
2.50
3.00
16 18 20 22 0 2 4 6 8 10 12 14
Time (hours)
Wat
er L
evel
(m
)

URBAN FLOOD MANAGEMENT IN SURABAYA CITY:ANTICIPATING CHANGES IN THE BRANTAS RIVER SYSTEM
61
6.4. Model Calibration
To improve the quality of the flood model, model calibration is performed by comparing the original
modelling result with observations from previous flood events. The main principle of model
calibration is that some parameters used in flood model may require tuning due to the possibility of
data error or different benchmarking between parameters (i.e., 0 value of terrain elevation and sea
tide). By calibrating the model, difference between model results and observed flood extents can be
reduced.
Most commonly used parameters in model calibration are flood depth and flood extent. Available
observations from previous flood event are flood extent, which can be found in Surabaya Drainage
Master Plan document, which shows the flood extent during 2002 flood. In this study, model
calibration was done by comparing flood extents from results of the model’s initial (1st) run and from
2002 flood events. Parameters used in initial run of the model are;
a. Upper boundary condition: 2% discharge of Brantas River downstream.
b. Rainfall Intensity : Design rainfall from Surabaya Drainage Master plan (SDMP)
c. Sea Tide : Design sea tide from SDMP
d. Surface roughness : Bottom friction map based on Manning’s Coefficient
By using above parameters, the model produced an unrealistic result, because flood extent is far too
big compared to the observed 2002 flood event. A main concern of this result is the difference of
benchmark between two values; Digital Elevation Model (DEM) and Sea Tide data. Minimum value
of DEM is 0 m above sea level, while median value of Sea Tide data is 1.8 m. Therefore, for 2nd run of
the model, sea tide data was adjusted so that median value of sea tide is corresponded with 0 value
DEM.
Figure 6-7. Sea Tide Adjustment
-1,5
-1
-0,5
0
0,5
1
1,5
2
2,5
3
16:00 17:00 18:00 19:00 20:00 21:00 22:00 23:00 0:00 1:00 2:00 3:00 4:00 5:00 6:00 7:00 8:00 9:00 10:00 11:00 12:00 13:00 14:00 15:00 16:00
Hours
Sea
Tid
e Le
vel (
m)
Original (m)
Adjusted (m)

62
The result of 2nd run of the model, by using adjusted Sea Tide level shows a more realistic result
because flood extent from the model is quite similar with the observed 2002 flood event. Although
other parameters can also be adjusted to improve the result of the model, model calibration phase
facing following difficulties;
- Hydrograph of Brantas River downstream is not tested, and there is no other data can be used as
a reference to improve it.
- The model did not incorporate small rivers flowing into Surabaya City from eastward and
southward directions.
- Computation time restricted number of simulations that can be run. Each simulation requires
approximately 8 hours to complete.
Result of model calibration in this study can be seen in following figure;
Figure 6-8 Model Calibration
6.5. Model Sensitivity
Analysis of model sensitivity was done by changing upper boundary condition, which is Brantas River
downstream reach. As previously described, main source of river discharge entering Surabaya city is
came from Brantas River, which on its downstream divided into two rivers, Kali Surabaya and Kali
Porong. Relationship between these three rivers can be described by using a time-synchronized water
discharge from different measurement stations. Observed monthly discharge between January 2002
and November 2006 and the relationship formula are;
Flood Depth Map with Sea Tide Level from SDMP Flood Depth Map with Adjusted Sea Tide Level

URBAN FLOOD MANAGEMENT IN SURABAYA CITY:ANTICIPATING CHANGES IN THE BRANTAS RIVER SYSTEM
63
Figure 6-9 Monthly Discharge of Delta Brantas Rivers (m3/s)
Figure 6.9 shown that almost all water discharge from Brantas River is entering Porong River, and
only small proportion is entering Surabaya River. Because of the presence Mud flood disaster, this
proportion is threatened to be changed. Therefore, model sensitivity is developed by raising the
percentage of water discharge entering Kali Surabaya.
Although discharge data for Brantas River Downstream is available for different return period, due to
time constraints, only discharge for 2 years return period is going to be used in flood sensitivity
analysis. Other consideration is that in urban areas, it is usual to design storm water drains for a return
period of around 2 years. It is almost invariably found that designing for a more severe event cannot
be economically justified because the increased costs outweigh the benefits arising from less frequent
flooding. The effect of upper boundary condition adjustment to the results of the model, in term of
flood depth, can be seen in the next figure;
a = 0.981 b + 0.185 c + 46.584
R2 = 0.98

64
Figure 6-10. Model Sensitivity Analysis (Flood Depth)
2% Brantas Discharge 10% Brantas Discharge
20% Brantas Discharge 30% Brantas Discharge
40% Brantas Discharge 50% Brantas Discharge
0 0.7 1.4 2.1 2.80.35Kilometers

URBAN FLOOD MANAGEMENT IN SURABAYA CITY:ANTICIPATING CHANGES IN THE BRANTAS RIVER SYSTEM
65
Previous figures shown that there is no significant change in flood depth if upper boundary was set
between existing condition (2%) and 30% Kali Brantas discharge. After 40% Brantas Discharge, the
model showed a significant increase of flood depth. Model sensitivity in flood depth and flood
velocity can be seen in following figure;
Figure 6-11 Depth and Flood Extent Sensitivity
Figure 6.7 shows that flood depth and flood extent have similar behaviour; if upper boundary
condition of the flood model was set between 2 % until 20 % of Kali Brantas Discharge, there was no
distinct behaviour of both parameters. If upper boundary of the model increased above 20 % of the
Brantas Discharge, there was a significant increase in average flood depth and inundated area. This
model behaviour means that the present system of rivers within Surabaya City is sufficient enough to
handle an increase of water discharge up until 20 % of Brantas River discharge.
One important point that can be drawn from model sensitivity analysis is that current flood problem in
Surabaya City is not caused by water discharge of rivers and primary channels within Surabaya City,
but rather caused meteorological phenomenon, which are precipitation and sea tide changes. Storm is
rarely seen in Surabaya City, and its presence usually influenced by global weather condition, such as
observed during 2002 El Nino storm.
Upper Boundary Condition ( % of Brantas Discharge)50403020100
Inun
date
d A
rea
(Ha)
7,000
6,000
5,000
4,000
Upper Boundary Condition
50403020100
Ave
rage
Flo
od D
epth
(m
)
0.50
0.45
0.40
0.35
0.30
0.25
Average Flood Depth Inundated Area
Upper Boundary Condition
(% of Brantas River Discharge) Upper Boundary Condition
(% of Brantas River Discharge)

66

URBAN FLOOD MANAGEMENT IN SURABAYA CITY:ANTICIPATING CHANGES IN THE BRANTAS RIVER SYSTEM
67
7. Flood Risk Analysis
7.1. Introduction
Flood Risk is a combination of different factors that together determine how big the loss to property
and human live caused by flood is. Spatial extent of flood risk is the most popular parameter used in
flood risk mapping. By this parameter, scale of flood is easily understood, and gives sufficient
information about possible flood event. The most important information given by spatial extent of
flood is where is the location of flood, and how big the size of inundated area. These to information
are sometime enough for decision makers and people in affected area to prepare flood mitigation
measures. However, combination of spatial extent of flood with other parameters can be very useful to
improve flood mitigation measures. Risk is defined as the expected number or lives lost, persons
injured, damage to property and disruption of economic activity due to flood event. Risk refers to the
consequences of an event. The Risk Research Group uses a simple expression to define risk:
Risk = Hazard * Elements at Risk * Vulnerability’ (Dwyer 2004).
This expression of risk is represented by the three-dimensional pyramid in Figure 7.1. The pyramid
figure shows that risk is depend on three elements, hazard, vulnerability and exposure of elements at
risk. If any of these three elements in risk increases or decreases, then risk increases or decreases
respectively. The risk pyramid also shown that the three elements of risk can be visualized in three
dimensions, with the volume of the pyramid representing risk. Each edge of the pyramid is
proportional to the three factors; hazard, vulnerability and elements exposed. The greater the
contribution of one of the factors, the greater the volume and therefore risk also increases.
Figure 7-1 Flood Risk Parameters Source: www.ga.gov.au Assessment of flood event cannot be calculated by the flood event itself, but must be combined by
other parameters influenced by flood. For example, flood in urban area and flood in forest can have a
totally different impact although both have similar characteristics (depth, duration, and velocity). To

68
analyse the impact of changes in Brantas River system to Surabaya City, various parameters must be
combined together to produce a flood risk assessment that can give an information not only the extent
of flood, but also the scale of its impacts.
Flood risk analysis phase in this study consists of three sections. First, analysis of flood hazard based
on results from flood modelling. Then, flood hazard maps were developed to identify possible impacts
of changes of Brantas River System to flood problems in Surabaya City. Second, vulnerability
analysis of elements at risk to assess the impact of flood hazard to physical features in Surabaya City
such as building and agricultural areas. Last, risk analysis was performed by combining flood hazard
maps and vulnerability map. In this study, flood hazard, vulnerability, and flood risk were calculated
in ArcGIS environment, by using one of its features, which is spatial analyst. There are two spatial
analyst methods that implemented in this study; Conditional Method and Weighted Sum method.
General overview of flood risk analysis in ArcGIS environment using Spatial Analysis can be seen in
following figure;
Figure 7-2 Overview of Risk Analysis

URBAN FLOOD MANAGEMENT IN SURABAYA CITY:ANTICIPATING CHANGES IN THE BRANTAS RIVER SYSTEM
69
7.2. Flood Hazard
Definition of Hazard is any phenomenon, either natural or human-induced, which has a potential to
cause the loss of life or injury, property damage, social and economic disruption or environmental
degradation .However, hazard can be characterized in many ways based on the specific purposes. The
impact of the natural hazard can be recognized in several aspects as listed below (Zulkarnain 2006):
1. Hazard to people – Death, injury, disease, stress
2. Hazard to goods – Property damage, economic loss
3. Hazard to environment – loss of flora and fauna, pollution, loss of amenity
Factors influencing flood hazard can be generalized into two components; human and natural
component. Flood hazard maybe caused only by climate, but human activities, for instance
deforestation and modification of river, has a significant impact on flood hazard. In more specific
term, actors that affect hazard and the disruption caused by a flood could be grouped into four broad
categories as follows;
• Flood behavior (severity of flood, response time, rate of rise, depth, flow velocity, duration,
water quality and etc.)
• Evacuation issues (evacuation routes and time for evacuation).
• Population at risk (number and vulnerability of people, flood awareness).
• Emergency management (flood forecasting, flood warning, flood response, evacuation and
recovery)
Flood hazard definitions traditionally were derived only from the flood extent, or inundated area.
Recent development in flood modelling, like 1D2D in SOBEK, made it possible to analyze another
parameters, such as flood event; flood depth, flood velocity, and flood duration, etc. Thus, output
maps from 2D flood model provide a better way to develop more meaningful and user-friendly flood
hazard maps with some additional flood parameters.
7.2.1. Factors Influencing Flood Hazard
Flood hazard can be described in various terms, either physical, social, or economical. The most
widely used definition of flood hazard is in physical term, which consists of various parameters, like
flood extent, flood depth, flood velocity, etc. Social and economical aspects of flood hazard usually
derived from its physical aspects overlayed with other spatial characteristics. The reason for this
phenomenon is that flood hazard assessment and mapping is much easier if based on spatial
distribution or flood extent. Another physical characteristics can be easily added to improve
assessment and mapping of flood hazard.
Flood depth is the most important factor to be added in the spatial extent of the flood hazard. Water
depth in inundated area immediately has the impact to the damage caused by flooding. Overland flow
module in SOBEK can easily produce flood depth information attached to the spatial extent of the
flood. Based on these considerations, flood depth is used as the first parameter to be used in the
calculation of flood hazard. Duration of flood also important factor to be included in flood hazard
assessment, because damage to property and live can be greatly influenced by the length of inundation

70
period. Flood duration can also give an information about the scale of flood hazard. Unlike flood
hazard, SOBEK cannot automatically produced duration of flood as an output. This parameter must be
derived from other output produced by SOBEK.
Another commonly used parameter in flood hazard assessment is kinetic energy of the flood, which
derived from water velocity during the flood. Surabaya City has a very flat terrain, which means that
water velocity during flood is relatively low, and kinetic energy of the flood is not strong enough to
cause any damaged to property or human live. Therefore, those two parameters, flood depth and flood
duration are considered sufficient to calculate flood hazard in the study area. Hence, the formula to
defining flood hazard in this study is;
Flood Hazard = f(Flood Depth, Flood Duration)
Where;
Flood Depth is the maximum depth of flood for each pixel within the simulation period,
Flood Duration is the inundation time for each pixel during simulation period.
7.2.2. Flood Depth
Flood depth information usually presented as maximum depth for each cell within simulation period.
This way, the presence of flood hazard is clearly explained in both aspects, the size and the severity of
the flood. Flood depth is described as distance between water level and bed level. Water level itself
described as the level of the water surface relative to the model datum (terrain elevation). Bed level is
defined as the lowest value of the cross sections for channel, and the terrain elevation for overland
flow. Definition of flood depth can be seen in following figure;
Figure 7-3 Flood Depth Definition
SOBEK can generates flood depth map file for each simulation time step, and at the end of
simulation, SOBEK generates two files related to depth;
Water Level
Bed Level
Terrain
Channel
Flood Depth
Reference Value
Flood Depth = Water Level – Bed Level

URBAN FLOOD MANAGEMENT IN SURABAYA CITY:ANTICIPATING CHANGES IN THE BRANTAS RIVER SYSTEM
71
- Maximum water depth.
In each cell the maximum water depth of all calculated time steps is written.
- Time of maximum water depth.
In each cell is written after what period this maximum water depth has been reached.
- Rate of change of water depth.
In each cell the difference in water depth is written between two depth map files divided by
specified time step for simulation.
SOBEK generates maximum water depth value for the whole simulation written in ASCII file format,
while the corresponding time step when the maximum water depth occurs also written in the same
format. These files are generated if the option of water depth map generation is selected during
settings of the model. Output files generated by SOBEK can be reclassified into flood depth classes
for further analysis of the results. In this study, flood depth is reclassified using Quantile method,
where the range of possible values is divided into unequal-sized intervals so that the number of values
is the same in each class. Classes at the extremes and middle have the same number of values.
Because the intervals are generally wider at the extremes, this option is useful to highlight changes in
the middle values of the distribution
By using Quantile reclassification method, flood depth below 0.17 meter is considered as a shallow
flood, between 0,17 – 0,5 meter is considered medium flood, and 0,5 – 2 meter is considered a deep
flood. An example of flood depth map, using 20% Brantas River Discharge as an upper boundary and
its classified values can be seen in figure 7.7.
7.2.3. Flood Duration
Time scale of flood event also plays an important role in flood hazard analysis, because the duration
of flood can influence the extent of damage and loss to properties. Although the relation between
flood duration and threat to human live is not as strong as flood depth, prolonged inundation of flood
can caused another threat to human live, such as diseases and lack of drinking water. Flood duration
also has an effect to the evaluation of possible damage to infrastructures and access to emergency
facilities. Until recently, flood duration is rarely included in flood hazard assessment because the
difficulties to produce or to calculate flood duration. Unlike flood depth, which can be gathered from
physical evidence of previous flood event, flood duration calculation requires a good flood modelling.
1D2D modelling in SOBEK cannot generate flood duration automatically. This information must be
derived using integration of 120 flood depth created for each calculated time step (2 hours). First, all
of 120 flood depth maps were reclassified into binary raster map with value 0 for cells without flood
and value 1 for inundated cells. Then, all reclassified flood depth maps were summed up to get the
flood duration map. The final flood duration map has a value between 0 and 120. Flood duration maps
also need to be reclassified to be useful for flood hazard analysis. In this study, flood duration maps
were reclassified with following values; < 1 day was classified as Short Flood, between 1 and 2 days
was classified as Medium Flood, and longer than 2 days was classified as Long Flood. An example of

72
flood duration map, calculated by using 20% Brantas River Discharge as an upper boundary and its
classified values can be seen in figure 7.8.
Flood duration classification map showed that almost all flooded areas have a long duration flood,
which is longer than 2 days. The reason for this result is that upper boundary condition (Brantas River
discharge) and rainfall data used an input in the model are based on 2 years return period data, and
the flood duration map generated is also shown 2 years return period map. This value is considered
acceptable, because in present condition, several parts of Surabaya City, especially along river banks,
are annually inundated by flood. Another important remark is upper boundary condition used in model
was 20% of Brantas River discharge, which is never happened after Brantas River was divided into
Surabaya River and Porong River. As described before, in present condition, only around 2% of
Brantas River discharge is entering Surabaya City through Surabaya River.
Both conditions, return period of input data and upper boundary condition made flood duration maps
generated by the flood model show a larger value than existing condition. This difference is
considered acceptable, since the objective of this study is to analyze the impact of changes in Brantas
River System, not existing flood problems.
7.3. Flood Hazard Mapping
In this study, flood hazard map was derived from flood depth map and flood duration map. Two
methods for flood hazard mapping were explored in this study; By Flood Hazard Zoning and Multi
Criteria Evaluation (MCE). Both were calculated in GIS environment, where Conditional method was
used for Flood Hazard Zoning, while Weighted Sum method was used for MCE. By using Conditional
method, the resulted flood hazard maps have an ordinal scale, which each value represents its hazard
level (for example, 1 = low, 2 = medium, 3 = high). On the other hand, calculation using Weighted
Sum produced flood hazard maps that have a ratio scale, between 0 – 1. These value also represents
the hazard level i.e., 0 means no hazard, and 1 means very hazardous.
7.3.1. Conditional Method
Conditional Method is a function available in ArcGIS Spatial Analyst that allows user to control the
output value for each cell based on whether the cell value fulfil a certain specified conditional
statement. If the cell value is fall within the specified value, it will receive designated value, and if the
value of the cell fall outside the specified value. Based on conditional method, different flood hazard
zones can be generated using the value of flood hazard parameters, which in this study are flood depth
and flood duration.
Flood Hazard Zones is an area of land that is prone to flooding, and defined by its hazard level, which
is for each cell, determined by location if its parameters inside hazard zones. Flood hazard zoning is
the most widely used flood hazard mapping method because it can give a clear information about
spatial distribution of flood problems. Some examples of flood hazard zoning method can be seen in
following figure;

URBAN FLOOD MANAGEMENT IN SURABAYA CITY:ANTICIPATING CHANGES IN THE BRANTAS RIVER SYSTEM
73
Figure 7-4. Flood Hazard Zoning Method
In this study, flood zoning method was used to generate flood hazard maps based on two parameters;
Flood depth and flood duration. As described before, both flood depth map and flood duration map
are reclassified with certain cut-off values. Flood depth below 0.17 meter is considered a shallow
flood, between 0.17 – 0.5 meter as a medium flood, and 0.5 – 2 meter is considered a deep flood. On
the other hand, Flood duration under 1 day is considered a short duration flood, between 1 – 2 days is
considered medium flood, and longer than 2 days is considered a long duration flood. Flood duration
and Flood depth were plotted in 2D Cartesian space, and two regression lines were drawn to connect
each pair of cut-off values; 1 day duration connected to 0.17 flood depth, and 2 days flood duration
connected to 0.5 flood depth. Flood hazard zoning then assigned to the zones bounded by the
Cartesian coordinates and the regression lines.
Source : U.S. Bureau of Reclamation
Source : The Geological Society of Australia

74
Figure 7-5. Flood Hazard Zoning
Delineation of each hazard zone is;
Low Hazard Zone = {T(i,j) < 1 – (5.88 * D(i,j) }
Medium Hazard Zone = {T(i,j) < 2 – (4.00 * D(i,j) }
High Hazard Zone = {T(i,j) < 2 – (4.00 * D(i,j) }
Where;
T(i,j) = Duration of flood for each cell
D(i,j) = Maximum flood depth for each cell
Flood hazard map then generated based by using combination of flood depth map and flood
duration map in ArcGIS Raster Calculator environment with an equation described in (Tennakoon
2004);
H(i,j) = = CON([T(i,j)] > (2 - [D(i,j)),3,[T(i,j)] > (1 - [D(i,j)]),2,[T(i,j)] > 0 & [T(i,j)] < (1 - [D(i,j)]),1,0)
Where;
H(i,j) = Hazard level for each cell (1=Low, 2=Medium, 3=High)
D(i,j) = Maximum flood depth for each cell
T(i,j) = Duration of flood for each cell
Flood hazard map generated by this method can be seen in figure 7.9.
T(i,j) = 1 –
(5.88 * D(i,j)
T(i,j) = 2 –
(4.00 * D(i,j)

URBAN FLOOD MANAGEMENT IN SURABAYA CITY:ANTICIPATING CHANGES IN THE BRANTAS RIVER SYSTEM
75
7.3.2. Weighted Sum
Flood hazard mapping can also be done by using another type of spatial analysis available in ArcGIS
environment, which is Weighted Sum. In spatial analysis, Weighted Sum provides the ability to
weight and combine multiple raster maps to create an integrated analysis. The general method of
Weighted Sum is Overlays several rasters multiplying each by their given weight and summing them
together. One important note regarding Weighted Sum tool is that maps generated using Weighted
Sum method have a value in an interval-ratio scale. General overview of this method can be seen in
following figure
Figure 7-6 Weighted Sum Method
Source: ArcGIS Help
Weighted Sum method can be improved by combining it with Multi Criteria Evaluation (MCE)
method. In MCE, parameters are combined using Weighted Summation (WS) method, which is
calculation of flood hazard based on weight and standardized value of the parameters. First step in
WS is standardization of parameters used in calculation. There are different methods of
standardization in WS, and for this study, maximum standardization was used.
In maximum standardization method, the scores for each cell are standardized with a linear function
by using its own value and the highest value of the dataset. For benefit effect, highest score is
indicated with 1, while for cost effect, lowest score is indicated with 1. Therefore, the result of this
standardization method is a value between 0 and 1. Maximum standardization is recommended when
Input Raster 1
Input Raster 2
Output Raster

76
the parameters used are measured in a ratio scale, and since all output of 1D2D flood modeling is also
written in a ratio scale, this method is considered appropriate to use. The main advantage of maximum
standardization is that the standardized values are proportional to the original values. Flood Depth and
Flood Duration are considered a cost parameter, and the formula for parameter standardization is;
Where;
),( jiDs = Standardized flood depth for each cell
),( jiD = Flood depth for each cell
),( jiTs = Standardized flood duration for each cell
),( jiT = Flood duration for each cell
The next step is an appraisal of the importance for each parameter. A weight value then given to each
parameter indicates its importance. Weight for each parameter can be obtained by various ways, and
the most commonly used is by direct ranking, which is assigning weight to a parameter by using the
range of the criterion scores. Value range of the weights for each parameter is standardized values
between 0 – 1 and the maximum added value of weights is 1. These range, however, depend on the
standardization method and the original value. IF these range changes, for example due to a change in
the standardization method or to an additional parameter, the assigned weights are no longer valid. In
that case, the weighting must be done again.
In this study, flood depth and flood duration are considered equally important, and hence, both are
given weight value of 0.5. Last step of WS is summation of the weighted and standardized values of
all parameters. The formula of Weighted Summation for Flood Hazard mapping is;
Where;
H(i,j) = Hazard level for each cell
Ds(i,j) = Standardized flood duration for each cell
),( jiTs = Standardized flood duration for each cell
From figure 7.6, we can see that flood hazard mapping using MCE is better than using Hazard Zoning,
because the first can shown more variability than the latter. This is an important advantage because
with higher variability, flood mitigation measures can be more effective. Another advantage of flood
hazard mapping using Multi Criteria Evaluation is that the hazard value still written in a ratio scale,
which is very useful for further use of generated flood hazard map. This is a contrast to a flood hazard
map produced by hazard zoning method, which generalized flood hazard value into several classes.
21 ),(
),(ji
ji
DDs −=
1201 ),(
),(ji
ji
TTs −=
),(),(),( *5.0*5.0 jijiji TsDsH +=

URBAN FLOOD MANAGEMENT IN SURABAYA CITY:ANTICIPATING CHANGES IN THE BRANTAS RIVER SYSTEM
77
Figure 7-7 Flood Depth Classification
Figure 7-8 Flood Duration Classification
Figure 7-9 Flood Hazard Classification
Flood Depth Variation Flood Depth Classification
Flood Duration Variation Flood Duration Classification
Based on Multi Criteria Evaluation Based on Flood Hazard Zoning

78
By using changing upper boundary condition, different flood hazard maps can be generated by flood
model to simulate the impact of changes of Brantas River System to flood problems in Surabaya City.
In this study, different flood hazard maps were generated by gradually increasing water discharge
entering Surabaya City, ranged between 2 % - 50 % of Brantas River discharge. The results of these
upper boundary changes to flood hazard for 2 years return period in Surabaya City are;
Figure 7-10 Flood Hazard Analysis (2 Years Return Period)
From figure above, we can see that both average hazard value and flood hazard area are influenced by
increasing water discharge entering Surabaya City. For average hazard value, its increase is constant,
corresponds to increase of upper boundary condition values. On the other hand, the area of flood
hazard shows a significant jump if water discharge entering Surabaya City is exceeding 20% of
Brantas River discharge.
7.4. Vulnerability Analysis
Flood hazard map cannot completely fulfil the information requirement in urban flood management.
Information about the extent of damage and loss in flooded areas is important. The extent of the
damage cannot be predicted from the severity of the hazard alone, but depends also on the condition
of the building stock. Predicting the risk of future damage needs a closer examination of the causes of
damage and this is assisted by consideration of the three elements exposure, hazard, and vulnerability.
Therefore, there is a need to combine flood hazard with another parameters to develop more useful
information for urban flood management. For this purpose, Risk Analysis was developed to analyze
the impact of flood event to properties and human live in urban areas. Definitions of risk used in
research vary with the applications for which they are used. Their basis lies in a common-sense
understanding of the concept of risk, such as the notion that the risk associated with some particular
hazard lies in the consequences of that hazard, and increases with both the probability and severity of
the hazard.

URBAN FLOOD MANAGEMENT IN SURABAYA CITY:ANTICIPATING CHANGES IN THE BRANTAS RIVER SYSTEM
79
The probability and severity of the hazard is not the only factor that affects risk. The risk also depends
on how much building is exposed to the hazard and how vulnerable it is to damage. Further to this,
risk can be seen graphically as a function of these three elements, hazard, exposure and vulnerability.
If any of the three elements hazard, vulnerability or exposure, is absent there is no risk present, as can
be demonstrated (Fedeski and Gwilliam 2007):
• Where buildings are located on a flood plain, both hazard and exposure are present in the event of a
flood. However, if the buildings have been designed to be resilient to flood, vulnerability is absent,
so there is no risk.
• Where a piece of flooded land contains no buildings, the hazard is present but exposure is absent, so
again there is no risk.
Vulnerability refers to the capacity of an element exposed during the impact of a hazard event.
Definitions of vulnerability to natural hazards generally refer to the characteristics of an element
exposed to a hazard - road, building, person, economy – that contributes to the capacity of that
element to resist, cope with and recover from the impact of a natural hazard(Dwyer 2004). The basic
method to evaluate urban losses is dependent upon the development and use of stage-damage curves,
alternatively called loss functions or vulnerability functions. A stage-damage curve normally relates to
a specific class of buildings or another type of element at risk that can give information about the
relationship between flood damage and depth flood depth. In this study, available data is not sufficient
to conduct this kind of vulnerability analysis, because there is no information about stage-damage
curve for building or building classes.
Another method to analysis the vulnerability in study area is by using information about and element
at risk and its function. The function of element at risk can also used as parameter, because it can
indicate how vulnerable the element is. For example, different building use (residential, commercial,
public, etc.) can have different flood vulnerability.
Vulnerability value is the degree of loss to a given element or set of elements at risk resulting from the
occurrence of a natural phenomenon of a given magnitude and expressed on a scale from 0 (no
damage) to 1 (high damage). There are different types of damage that can be caused by flood. The
separation between damage types is based on several factors. The most common separation between
types of damage is to distinguish between tangible and intangible damages based on whether or not
monetary values can be assigned to the consequences of flooding. Examples of intangible losses
include anxiety, inconvenience and ill-health. Tangible damages can be divided into the direct and the
indirect. Direct damages result from the physical contact of flood water with damageable property.
Direct damages are a function of many variables. Some of these are controlled by the physical make-
up of the flood prone area, which are the land use and its susceptibility to flood damage. Others are
related to the characteristics of the flood event, including the area covered, the depth and duration of
flooding, the velocity of flood water and its sediment and effluent content. Indirect damages are losses
caused by disruption of physical and economic linkages of the economy. Examples include
interruption of traffic flows, loss of industrial production, loss of personal income and business profit.
It is further possible to conceive of secondary direct damages, such as damage due to gas explosion

80
through leakage caused by flooding, and secondary indirect damage such as retail business losses due
to reduced local family incomes resulting from loss of work (Badilla Coto 2002).
The basis for this reclassification is general assumption and local experience about different for each
type of element at risk. Reclassification maps can be seen in figure 7.11, and vulnerability values for
element at risk can be seen in following table;
Table 7-1 Vulnerability Value for Element at Risk Nr. Element at Risk Vulnerability Value
1 Industrial, Chemical, Hospital 1
2 Housing, Office, School, Market, Public,
and Other Buildings.
0.8
3 Fishery, Agricultural 0.6
4 Open Space, Vacant 0.1
5 Water 0
7.4.1. Flood Risk Analysis
Flood risk then calculated by using parameters from previous step, which are hazard level and
vulnerability. The result of this calculation if risk value, ranged between 0 – 1 that shows the level of
possible damage inflicted by a flood event. However, due to some limitations, this study is not
calculating the risk value in term of financial or social damage, but rather the scale of the damage
caused by flooding. Previous phase of this study shown that there are different ways to generate
flood-related map. An example of these methods is Flood Hazard Zoning and Weighted Sum.
However, for risk mapping, these two methods are not valid anymore, because risk mapping is a
function using two unrelated parameters, hazard and vulnerability.
This is contrast to hazard analysis which using different parameters, but still related each other (i.e.,
flood depth and flood duration). Another reason why Flood Zoning and Multi Criteria analysis cannot
be use for calculating flood risk map is that flood risk is a function with a rule that both parameters
must exist to have a risk value. Therefore, if any of the two parameter does not exist or have a value 0,
flood risk also not exists. The most straightforward calculation method is by multiplication of Flood
Risk parameters. The risk value for each cell is determined using following formula;
R(i,j) = H(i,j) * V(i,j)
Where;
R(i,j) = Risk value for each cell
H(I,,j) = Hazard level for each cell
V(i,j) = Element at Risk Vulnerability

URBAN FLOOD MANAGEMENT IN SURABAYA CITY:ANTICIPATING CHANGES IN THE BRANTAS RIVER SYSTEM
81
An example of risk map is shown in figure 7.12, which was calculated by combination of hazard level
map for 20 % Brantas River discharge generated using Multi Criteria Analysis method, and
vulnerability of element at risk within Surabaya City.
Figure 7-11 Element at Risk Vulnerability
By using different boundary conditions, different flood risk maps can be generated. In this study,
flood risk maps were generated using different upper boundary condition, simulating the gradual
increase of water discharge entering Surabaya City due to changes in Brantas River System. Spatial
distribution of flood risk in Surabaya City caused by increasing water discharge can be seen in
following figure;
Element of Risk Type Element at Risk Vulnerability

82
Figure 7-12 Flood Risk Maps (2 Years Return Period)
2% Brantas River discharge 10% Brantas River discharge
20% Brantas River discharge
30% Brantas River discharge
40% Brantas River discharge 50% Brantas River discharge

URBAN FLOOD MANAGEMENT IN SURABAYA CITY:ANTICIPATING CHANGES IN THE BRANTAS RIVER SYSTEM
83
Beside spatial variation of flood risk visualized in previous page, flood risk can also draw in Cartesian
coordinates, which shows the relationship between upper boundary condition and flood risk value. By
using comparison of two parameters, Average Risk Value and Area of Risk with upper boundary
conditions, their relationship is better visualized, as shown in following figure;
Figure 7-13 Flood Risk Variation

84

URBAN FLOOD MANAGEMENT IN SURABAYA CITY:ANTICIPATING CHANGES IN THE BRANTAS RIVER SYSTEM
85
8. Flood Mitigation Scenarios
8.1. Introduction
Previous phases was try to model and explore the possible hydrological changes in Surabaya City due
to changes in Brantas River System. Results of the model shown that changes in Brantas River System
clearly can cause flood hazard in Surabaya City. Recent development in flood modelling, especially
with introduction of 1D2D flood modelling in SOBEK, made it easy to change the settings and
parameters of the model. In this study, different flood hazard and risk were developed by changing the
value of parameters used in the model to simulate the different possibilities of changes in Brantas
River System and its impact to flood problems in Surabaya City.
To develop Flood Mitigation Scenarios, different flood Scenarios was simulated by adjusting
Surabaya River upstream boundary. These adjustments are done incrementally, between 2% and 50%
of Brantas River Discharge to analyze the impact of each increase of water discharge entering
Surabaya. 2% value was selected because this is the current percentage of Brantas River discharge
that entering Surabaya River, while 50% of Brantas River discharge entering Surabaya River was
selected because this value is considered the worst scenario. Main consideration about how many
flood scenarios can be developed was time constraint, because each flood scenario requires a
considerable amount of time (about 6 hours each).
Flood hazard and risk were generated by using different values of parameter, and different flood
hazards and flood risk conditions are generated. Therefore, it is important to develop at least one flood
mitigation measure for each condition. This is why this study was not only exploring one possible
flood mitigation measure, but developing various flood mitigation measures scenarios, where each
mitigation measures corresponds to one or more flood hazard and risk conditions.
Flood mitigation scenarios developed in this study are divided into two groups; Structural measures
and Non-structural Measures. Structural measures scenarios described the possibility of adjusting the
existing river regulatory structures and channel improvement to reduce flood hazard caused by
changes in Brantas River System. Non-structural measure scenarios explore the possibility to develop
policies and regulations to reduce flood hazard. Another aspect explored in Non-structural scenarios is
previous changes in Brantas River System, and since the flood retardation capacity of Brantas River is
constantly decrease, this study explores the possible efforts to restoring or increasing it.
8.2. Structural Measures Scenario
First group of flood mitigation scenarios is Structural Measures, which means changing the properties
of the river system within Surabaya City. This scenario can be developed into two ways; by adjusting
existing river system and by river and channel improvement. Regulatory structures adjustment clearly
is the easiest and cheapest way to reduce flood hazard. The main problem of this scenario is that there
86
will be limitations in a sense that for a certain flood extent, regulatory structures adjustment will have
no any significance to flood mitigation measures. Another important issue is that changes in
regulatory structures must be done very carefully, because the wrong adjustment is not only useless to
reduce flood hazard, but also can even increase the flood problems.
Adjustments of river regulatory structures can have a significant impact on flood hazard. By using this
method, flood can be avoided by re-directing water discharge to channels with bigger capacity, or in
case of flood is unavoidable, because different land use can have different flood vulnerability, water
inundation in areas with high hazard proness can be avoided in exchange of more flood in areas with
less hazard proness.
On the other hand, river system improvement by making the channels wider or deeper, or even by
constructing new channels surely at some extents can reduce flood hazard. The main problem for this
scenario is that in urban areas, widening the river or creating new channels are very difficult things to
do. It is also possible that an urban area already reaches its maximum flood retardation and river
system improvement is not efficient anymore because the cost required is much higher compared to its
usefulness in flood hazard mitigation.
Structural measures scenario in this study was developed in following way; First, for lower value of
upper boundary condition, river regulatory changes simulated with flood modelling to see its impact
on flood hazard in Surabaya City. The model shown that until a certain cut-off value, regulatory
structure adjustment is useful to reduce flood hazard and flood risk. Second, river and channel
improvements were simulated using upper boundary condition above the cut-off value to simulate
how efficient channel improvement scenario in reducing flood hazard caused changes in Brantas
River System.
8.2.1. Regulatory Structures Adjustment
There are two structures inside Surabaya City that can be utilized to re-directing flood discharge; Jagir
Dam, and Wonokromo Gate. In current Operation Rule (OR), Jagir Dam and Gunungsari Dam are
fully opened, while Wonokromo Gate is opened at 50% capacity to avoid flood in Surabaya City. Up
until now, this mechanism can well protecting Surabaya City because each time water discharge of
Brantas River increases, excessive water can safely discharge to the sea through Porong River. Flood
simulation using these settings produced extensive flooding in eastern part of Surabaya City.
Therefore, regulatory structures are adjusted to redirecting water to northern part of the city, where
flood extent is relatively low. Adjusted regulatory structures are Jagir Dam, which capacity was
reduced to 20 %, and Wonokromo Gate, which is fully opened, against flood operation rule. Adjusted
regulatory structures and its impact on inundated area and the size of area at risk can be seen in
following figures;

URBAN FLOOD MANAGEMENT IN SURABAYA CITY:ANTICIPATING CHANGES IN THE BRANTAS RIVER SYSTEM
87
Table 8-1 Regulatory Structure Adjustment Regulatory Structure
Name Current Adjustment
(Operation Rule during Flood) Proposed Adjustment
Jagir DAM Fully Open 25 % Capacity Wonokromo Gate 50 % Capacity Full Capacity
Figure 8-1 Adjusted Regulatory Structures
Figure 8-2 Impact of Structure Adjustment
Surabaya River
Wonokromo River
Kali Mas River
Wonokromo Gate (Full capacity)
Jagir Dam (Capacity reduced to 25 %)

88
Results of implementation of regulatory structure adjustment in the flood modelling show that by
using this measure, average flood depth was reduced significantly and the size of area in risk also
reduced. However, the reduction of area in risk is not as obvious as reduction of flood depth. The
model also indicate that this mitigation measures only effective to reduce flood hazard if water
discharge entering Surabaya City is only a small fraction of the whole Brantas River Discharge. In
term of reducing average flood depth, adjustment or regulatory structures is only effective if water
discharge entering Surabaya City is not exceeding 15% of Brantas River discharge, while in term of
reducing the size the cut-off value is 3%.
8.2.2. Channel and Flow Improvement
Another possible structural measure that can be implemented to reduce flood hazard in Surabaya City
is by improvement of rivers and water channels within Surabaya City. To explore the possibility of
structural mitigation measures by channel improvement as anticipation to increasing water discharge
entering Surabaya City caused by changes in Brantas River System, channel improvement method was
simulated in 1D2D flood modelling environment. Although the cost to implement this method is
much higher compared to regulatory structure adjustment, channel and flow improvement can cope
with bigger flood problems. There are several factors that made channel and flow improvement is
considered important to be implemented in Surabaya City, which are;
1. Model sensitivity phase in chapter 6 shown that flooding problems in Surabaya City have a
significant increase if water discharge entering Surabaya City is bigger than 30 % of Brantas
River Discharge. Therefore, it is logical to assume that current river system in Surabaya City only
sufficient if water discharge entering Kali Surabaya is not higher than 30% of Brantas River
discharge.
2. Adjustment of river regulatory structures can only cope with 20 % Brantas River discharge. This
mitigation measure is only effective for only small increase of water discharge entering
Surabaya. Thus, for higher water discharge, this method made the flood problems even worse.
One important aspect to be considered is which channels are going to give the best impact for flood
hazard mitigation if they were improved. Improvement for every single river segment and primary
drainage channel is not only too costly, but also improvement for some channels might not have an
impact on flood hazard mitigation. Therefore, decision about which channels should be improved as
an anticipation of changes in Brantas River System must be done with through consideration and also
try to looking at the historical development of river and drainage system in Surabaya.
In this study, flood channel and flow improvement by creating a new diversion channel is considered
as one of flood mitigation scenarios based on the fact that there is only one man-made diversion
channel in Surabaya City, namely Wonokromo Channel. This channel was constructed in the year
1920, as anticipation for urban development in Surabaya City. Back then, Surabaya was only a small
city, and built-up areas are only located in northern part of Wonokromo Channel. Land use plan that
developed in the year 1950 also indicate that government of Surabaya City didn’t anticipating urban
development at southern part of Surabaya, as can be seen in following figure.

URBAN FLOOD MANAGEMENT IN SURABAYA CITY:ANTICIPATING CHANGES IN THE BRANTAS RIVER SYSTEM
89
Figure 8-3 Surabaya City's 1950 Land Use Plan
Compared to existing to the present conditions (described in chapter 2), Surabaya was only a small
city back in the year 1950. It is possible that Wonokromo Channel was not constructed as a diversion
channel to cope with present Surabaya City development. It also possible that Surabaya City was not
suppose to be developed as far as its present condition, but lack of development control and
urbanization made Surabaya City grew until its current stage of development. Based on this
consideration, it is important to develop a new diversion channel to cope with current flooding
problems and also anticipation to the changes of Brantas River System.
There are two possibility of development of new diversion channel. First, a totally new diversion
channel can be built. Second, a new diversion channel can be developed by improving the dimension
of an existing channel. One river that has a big potential to be developed into diversion channel is
Perbatasan River, located at southern part of Surabaya City. Compared to another channel, this river
has advantages as follows;
1. Land cover around Perbatasan River is not fully built-up areas. Therefore, river improvement such
as river widening is still possible.
2. Perbatasan River is located at the point where Surabaya River is entering Surabaya City, which
means any excess water discharge can immediately discharged to the sea before entering the city.
Despite its strategic location, this river has a very small dimension that made only a small volume
of water can get through it.

90
3. Perbatasan River plays a role as a boundary between Surabaya City and Sidoarjo Municipality.
Improvement of Perbatasan River as a diversion channel made this river can also plays a role as a
buffer zone between those two regions. Existing and proposed diversion channel can be seen in
following figure.
Figure 8-4 Existing and Proposed Channel
To act as a new diversion channel, the dimensions of Perbatasan River must be improved. Due to time
constraints, optimum dimension for channel improvement was not calculated to give a brief overview
about how development of diversion channel can reduce flood hazard, cross section values of
Surabaya River were assigned to Perbatasan River, and then 1D2D flood simulations were run using
the new dimension of Perbatasan River. The result of simulations show that improvement of
Perbatasan River as a new diversion channel can reduce the amount of water entering Surabaya City.
If the dimension of Perbatasan River was improved at least similar to the dimension of Surabaya
River, water discharge from upper reach of Surabaya River will be divided equally. Thus, flood
hazard in Surabaya City can be reduced because any excess water can directly discharge to the sea
through improved Perbatasan River. Surabaya River and Perbatasan River discharge without and with
channel improvement can be seen in Apendix 2.
Perbatasan River
Wonokromo Channel
Surabaya River

URBAN FLOOD MANAGEMENT IN SURABAYA CITY:ANTICIPATING CHANGES IN THE BRANTAS RIVER SYSTEM
91
8.3. Non-Structural Measure Scenario
Previous analysis shows that structural measures have a high possibility to be useful in reducing flood
hazard caused by changes in Brantas River System. However, flood mitigation measures can be
improved by combining structural and non-structural mitigation measures. Although structural
mitigation measures can give a direct impact on reducing flood hazard, in many situations, especially
where the risk of flooding is very high, that structural measures can not cope anymore, non-structural
measures are important measures to reduce the risk and damage caused by flooding. The key aspect of
non-structural mitigation measures is reducing flood hazard without physical intervention of the
existing hydraulics network (Parkinson 2005). In this chapter, two non-structural flood mitigation
measures are discussed; First, by improvement of catchment area along Brantas River basin. This
scenario explores previous changes in Brantas River system, and possible interventions that can be
implemented to increase flood retardation capacity of Brantas River. Second, by development control
on areas with high flood hazard, and possible policies and regulations to prevent extensive urban
development on such areas.
8.3.1. Catchment Area Improvement
The possibility of increasing Water discharge entering Surabaya City is not only caused by the
presence of mud flood disaster in Sidoarjo, but also by the fact that water discharge of Brantas River
has a tendency to increase annually. Therefore, even without the presence of mud flood disaster,
Surabaya still facing flood hazard due to the increasing amount of water discharge entering the city.
Thus, there is still a requirement to develop flood hazard mitigation measures based on the possible
increase of water discharge.
The changes of Brantas River discharge has been studied by Toshikatsu Omachi, and the result
indicate that in the recent three decades, due to check of sediment by reservoirs and excessive
extraction of the riverbed materials, violent degradation of riverbed has occurred and this trend is
ongoing. These changes resulted in the runoff mechanism of floods in the basin. This study also
indicates that the basin storage capacity of the Brantas River basin has almost halved in the past 30
years, which resulted in a faster and higher runoff peak.
Since 1980’s, the riverbed of Brantas River gradually lower due to the sediment deposition along
upper reach and sand extraction in the middle and lower reaches. Extensive deforestation in Brantas
and gradual increase of cultivation areas in mountain hillside plays a major role in sediment
deposition and sand extraction along Brantas River Basin. Natural forests are very limited, and if any
exist, high economic value of trees such as mahogany and teak caused them threatened by illegal
logging. Forest cover on the Brantas River basin made up only 25% of the whole area, and decrease of
flood retardation capacity of catchment area in Brantas River basin can related to the lack of forest
cover.
Another factor that plays a significant role on changes in Brantas River system sedimentation, that
predominantly produced by volcanic activities of mountains such as Mount Semeru, Mount Arjuno,
and Mount Kelud, which are still active volcanoes, and their activities, combine with extensive land
use changes in Brantas River’s cathchment areas, made sedimentation problems worsen every year.

92
Sediment deposition and sand extraction have opposite effect to the Brantas River; sediment
deposition caused decrease of discharge capacity, while sand extraction leads to increase capacity of
Brantas River. Because sand extraction has a higher rate than sediment deposition, there is a constant
increase of discharge capacity in Brantas River while on the other hand, retarding capacity of Brantas
River significantly decrease. These changes in Brantas River caused constant increase of flood hazard
problem in Brantas River basin and its affected areas, including Surabaya City.
Based on previous changes of Brantas River system, improvement of catchment area can also be
promoted as a part of flood mitigation measures to reduce flood hazard in Surabaya City. Although
catchment area of Brantas River covers a big area, where Surabaya City is a just a small part of it, the
strategic role of Surabaya City as the capital of East Java Province made implementation of catchment
improvement of Brantas River is considered important. The most important aspect of catchement area
improvement is to increase or restore its storage capacity by reforestation. With adequate forest on
catchment area, the runoff rate can be reduced, and sudden increase of water discharge in Brantas
River can be minimized.
8.3.2. Development Control
Urban development control is a considerably more cost-effective flood mitigation measure compared
to other methods. To reduce and minimize exposure to elements at risk of flooding, land use controls
can be implemented. Intervention in form of development control are strongly connected to the land
management and urban planning, especially development controls over flood-prone areas. One most
widely used development control for flood hazard mitigation is development restrictions, either partial
or full, on flood-prone areas. This method is facing some challenges, especially ones caused by high
demand of land in cities, which made development restrictions are very difficult to implement. It is up
to local government to implement development control which involves alternative uses for the land in
order to insure that urban development does not occurs on flood-prone areas.
Development control measures explored in this study is Flood Zoning, which is widely used as a basis
for land use control. Development control by zoning involves the designation of the proper mitigation
measures for each mitigation categories, and can be used by urban authorities control the type of
allowed development or redevelopment on such areas. Flood zoning is a planning tool which may be
used to assist flood mitigation strategies by identifying the most appropriate action to reduce flood
hazard and this approach can be used as the basis for development of legal measures for land
development.
Development control of flood-prone areas are based on two parameters; First, Flood Scenario Class,
which is based on different upper boundary conditions to simulate different possible scenario of
flooding in Surabaya City caused by changes in Brantas River System. One important assumption
related to this parameter is that the higher the percentage of Brantas River entering Surabaya City, the
lower the chance it occurs. Therefore, a new value can be assigned to flood scenario map, where
smaller values are assigned to higher percentage of water entering Surabaya City, and vice versa.
Second parameter used in the construction of development control zones is land use, because main
features of development control scenario are how often it is likely to flood and its impact on land use.

URBAN FLOOD MANAGEMENT IN SURABAYA CITY:ANTICIPATING CHANGES IN THE BRANTAS RIVER SYSTEM
93
This scenario requires a set of legal mechanism to prevent urban development, and also needs to be
supported by financial and economic measures to discourage development in such areas (Parkinson
2005). Development control classification can be seen in following figure.
Figure 8-5 Development Control Zones
In figure 8.6, both parameters are reclassified into classes based on its characteristics related to flood
hazard. For Flood Scenario, higher percentage of water entering Surabaya City is less likely to occurs,
and therefore, lower class value was assigned. For land use, type of land uses that are more tolerable
to flood hazard are assigned lower class value, while higher class values were assigned for land uses
which is vulnerable to flood. Maps of both parameters and the result of this construction of
development control zones can be seen in following figure;
Y = 3 –
1.5*X
Y = 10.5 –
1.5*X
Y = 6 –
1.5*X
Land use Class:
1 = Open Space, Vacant, and Pond
2 = Fishery and Agricultural
3 = Military, Port, and Transportation
4 = Housing and Public Buildings
5 = Industry, Commercial, and Waste
Flood Scenario Class:
1 = 50 % Brantas Discharge
2 = 40 % Brantas Discharge
3 = 30 % Brantas Discharge
4 = 20 % Brantas Discharge
5 = 10 % Brantas Discharge
6 = 2 % Brantas Discharge
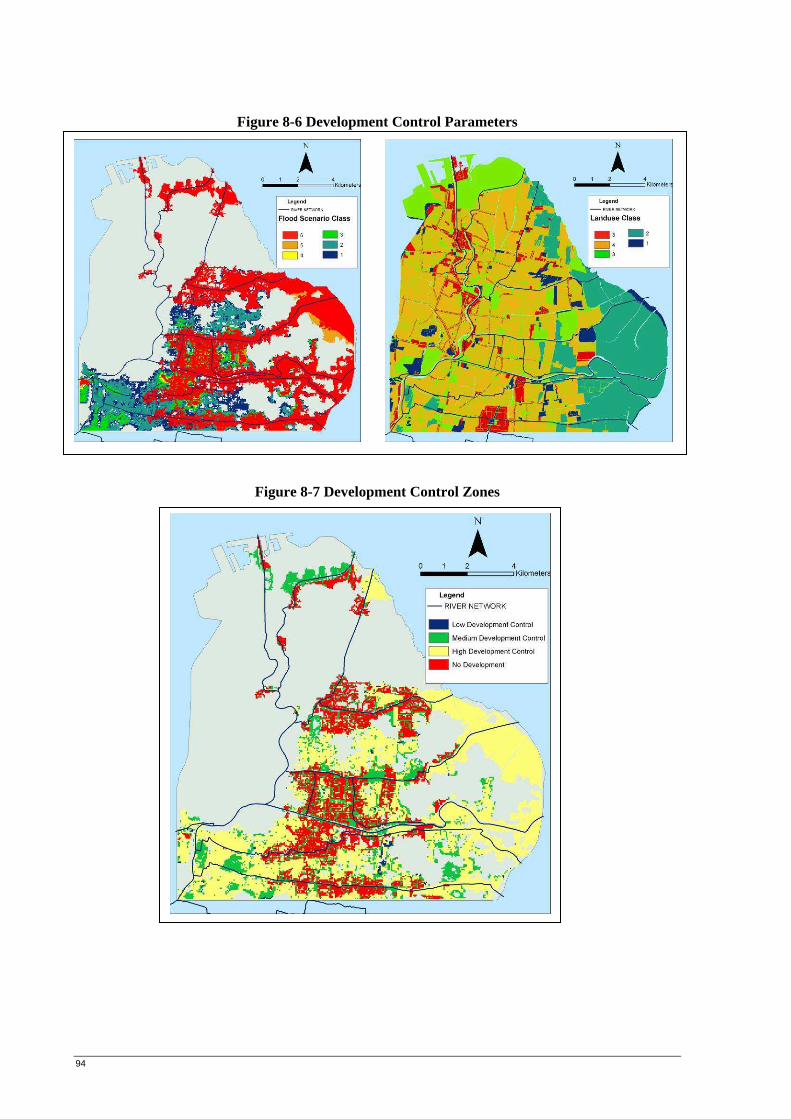
94
Figure 8-6 Development Control Parameters
Figure 8-7 Development Control Zones

URBAN FLOOD MANAGEMENT IN SURABAYA CITY:ANTICIPATING CHANGES IN THE BRANTAS RIVER SYSTEM
95
9. Conclusion and Recommendation
9.1. Delta Brantas River System
Lower reach of Brantas River, or often called Delta Brantas, is a complex river system which consists
of several rivers and regulatory structures. This system is covering a large area, including Surabaya
City and Sidoarjo Municipality. There are three main rivers in Delta Brantas River System, which are
Brantas River as the main river, Surabaya River, and Porong River, a man-made diversion channel
which was constructed to protect Surabaya City from flooding. These three rivers are connected to
each other, and changes in each river will have an impact to another.
Water flow through rivers in Delta Brantas is regulated by two main regulatory structures; Lengkong
Barrage, a regulatory structure that constructed to regulate water flow through Porong River, and
Mlirip Weir, which regulate water intake of Surabaya River. Maximum water discharge of Brantas
System is around 1,500 m3/s, which most of it is was discharged to sea through Porong River. Only
2% of Brantas River discharge was entering Surabaya City through Surabaya River.
Main institution that has the biggest role in Delta Brantas River management is Jasa Tirta, Inc. (PJT),
a public corporation which was set up in the year 1990 to improve the management and operational
aspects of water resources in Brantas River Basin. Adjustment of regulatory structures within Delta
Brantas River System is PJT’s responsibility, and the main purpose of regulatory structure adjustment
is to balance water supply and demand in both dry season and rainy season. During flood events, there
are some Operation Rule (OR) regarding adjustment of regulatory structures that must be followed by
PJT. If adjustment of regulatory structure can not cope with water discharge and flood occurs, PJT
must establish a coordination line with Government of East Java Province, and together, deciding
what are the best mitigation measures to reduce damage caused by flood.
Current Operation Rule of regulatory structures within Surabaya City is proven to be effective against
any increase of Brantas River discharge, and flooding caused by increasing river discharge is very
rare. The established flow regulations in Delta Brantas River System is threatened by the presence of
mud flood in Sidoarjo, nearby municipality from Surabaya. Presently, mud from this disaster is
discharged to the sea through Porong River, and caused some sedimentation problems in lower reach
of Porong River. This sedimentation caused discharge capacity of Porong River is decreased, and
therefore, its function as a diversion channel to protect Surabaya City is also reduced.

96
9.2. Flood Risk Analysis
Analysis about how changes of Brantas River System can caused flood problems in Surabaya City
consists of three parts; Flood Hazard Mapping, Vulnerability Analysis, and Risk Mapping. Flood
hazard mapping is a process to generate maps that can give information about physical characteristics
of the flood. The most common parameters used in flood hazard mapping are flood depth, flood
duration, and kinetic energy. Because Surabaya City has a very flat topography, kinetic energy
analysis will be irrelevant because flow velocity is considerably low. Combination of flood depth and
flood duration proven to be sufficient enough to produce a good flood hazard map.
For flood hazard mapping, this study explores the implementation of two spatial analysis methods
available in ArcGIS environment; Conditional Method and Weighted Sum method. The use of
conditional method in flood hazard mapping is very common, and the result of this method is flood
hazard zoning. On the other hand, Weighted Sum method is rarely used to produce flood-related
maps. Each method has its own advantages and drawbacks, and the choice about which one should be
implemented is strongly related to the purpose of flood hazard mapping.
If the objective of flood hazard mapping is only to analyze flood hazard, not extended to risk analysis,
then flood hazard zoning method is a better way to develop flood hazard maps. This method will have
information about the scale of the flood, i.e. high, medium, and low, which in some cases is very
useful to support local authorities when dealing with flood problems. The main drawback of flood
zoning method is that the information stored in Ordinal scale, which is not suitable to be used in
mathematical function (i.e. addition and multiplication). Therefore, flood hazard maps developed by
using flood zoning method are not suitable to be use for further risk analysis.
In contrast to flood zoning method, Weighted Sum method is proven to be very useful for further
development of flood hazard maps. This study combined Weighted Sum method with Multi Criteria
Evaluation (MCE) and the result shown that implementation of MCE in flood hazard analysis proven
to be useful for further analysis of flood problems. With MCE method, information about flood
hazard is stored in Interval-Ratio Scale, which is very suitable for mathematical calculations required
in flood risk analysis. One drawback of flood hazard mapping using MCE method is that there is no
classification of flood hazard, which is sometimes required in flood mitigation measures.
Flood hazard mapping is not enough to explain the extent of flood problems in urban area, because
urban settlement has various object that can be influenced differently by flood. Therefore,
vulnerability analysis is an important step to improve flood hazard analysis by adding urban entities
into account. Combination of Flood Hazard and vulnerability is called Flood Risk, which is defined as
the presence of two aspects; flood hazard and element at risk. This study was tried to perform
vulnerability analysis of element at risk from flooding, and due to some limitations, especially time
constraints, vulnerability analysis was based on assumptions and local experiences, not by actual
vulnerability of elements at risk. Still, the results of risk analysis are most likely very useful for the
anticipation of changes of Brantas River system.

URBAN FLOOD MANAGEMENT IN SURABAYA CITY:ANTICIPATING CHANGES IN THE BRANTAS RIVER SYSTEM
97
Results from 1D2D hydrological modelling developed in this study show that changes in Brantas
River system caused by the presence of mud flood in Sidoarjo has a significant impact to both flood
hazard and flood risk in Surabaya City. If this mud flood keeps on continuing, capacity of Porong
River will be reduced, and bigger percentage of Kali Brantas discharge will entering Surabaya City.
Increase of flood hazard in Surabaya City is not significant if water volume of Surabaya River does
not exceeding 30% of Brantas River discharge. This is an indication that existing rivers and channels
within Surabaya City can cope with certain increase of water discharge.
9.3. Flood Mitigation Measures
Both mitigation measures, structural and non-structural measures were explored in this study, and the
possibilities of implementation for each measure were also analyzed. Different flood scenarios were
developed, and each impact to flood hazard problems was assessed. For structural measures
mitigation scenarios were developed by using river regulatory structures and channel improvement.
For non-structural measures, catchment area improvement and development regulations to reduce
flood hazard were developed.
Structural measures are easy to assessed, because it can simply be simulated using flood model to
analyze its impact on flood problems. Regulatory structures adjustment and channel improvement can
be simulated by changing cross sections of channels within possible range. On the other hand, non-
structural measures is difficult to assessed because it developed in form of policies and regulations not
related to the physical characteristics of river system.
The flood modelling results shows that regulatory structures adjustment is only effective if changes of
Brantas River system do not caused water discharge entering Kali Surabaya River more than 20% or
Brantas River discharge. If discharge of Kali Surabaya River exceeding 20% Brantas River discharge,
regulatory structures adjustment made the flood problems even bigger. Therefore, implementation of
this mitigation measures must be done with a great cautions, to avoid unnecessary flood problems
caused by the wrong adjustment of regulatory structures.
Beside structural measures, non-structural measures is also important to be implemented. Direct
impact of non-structural measures in reducing flood problems cannot observed immediately, but
rather can be expected at long term. By improving catchment area of Brantas River, its flood
retardation capacity can be increased and subsequently reducing flood threats to Surabaya City. Thus,
catchment area improvement can also prevent future changes on Brantas River Basin that can have a
negative effect on its water storage and flood retardation capacity. Development controls are required
to be implemented to regulate development in flood prone areas according to its flood hazard level.
Development control zones are constructed based on two parameters; the probability of occurrence
and existing land use. Based on these parameters, development controls for flood prone areas can be
categorized as high, medium, and low development control zones. For certain areas, where flood
hazard is very high, development should not be allowed at all.

98
9.4. Recommendation to Surabaya City’s Government
Results of this study clearly indicate that changes of Brantas River System can caused a significant
increase of flood problems within Surabaya City. Efforts to minimize flood hazard can only effective
at certain level. For example, regulatory structures adjustment can only effective if water entering
Surabaya not exceeding 10% of Brantas River discharge. Channel improvement by creating a new
diversion channel also a mitigation measure that should be considered by Government of Surabaya
City, because currently there is only one diversion channel exists in Surabaya City, the Wonokromo
Channel, which was built in the year 1922. Current development of Surabaya City is already far
beyond its condition when Wonokromo Channel was constructed. Therefore, a new diversion channel
is required in Surabaya City to cope with current flood problems, to anticipate changes in Brantas
River System, and also to cope with future development of Surabaya City.
Government of Surabaya City must should decide at what extent flood hazard caused by changes of
Brantas River System is still acceptable, and then develop regulations to prevent flood hazard
exceeding acceptable level. If it was decided that water discharge entering Surabaya River must not
higher than 30% of Brantas River discharge, Mlirip Weir must be adjusted to prevent higher discharge
of Surabaya River, and then implementing regulatory structures adjustment to reduce flood hazard.
This adjustment might protect Surabaya from flood, but can caused flooding in other areas along
Delta Brantas River System.
On the other hand, if Government of Surabaya decided to construct a new diversion channel, river
system within Surabaya City can cope with much higher water discharge. This mitigation measure not
only protect Surabaya from flooding, but also can protect agricultural areas along Delta Brantas River
System. Although construction of new diversion channel by improvement of an existing channel is far
more costly than other mitigation measures, but its impact will be very significant to reduction of
flood problems in Surabaya City, and can cope with future flood problems caused by the constant
development of Surabaya City.
A broader flood mitigation measures which involves governments along Brantas River basin will be
very useful to reduce flood problems in Surabaya City. Improvement of catchment area requires
involvement of all authorities of local governments and institutions related to water and river
management to be effective in reducing flood hazard. A special flood mitigation measures must be
developed between government of Surabaya City and Sidoarjo Regency, because mud flood disaster
in Porong has a direct impact on both regions.

URBAN FLOOD MANAGEMENT IN SURABAYA CITY:ANTICIPATING CHANGES IN THE BRANTAS RIVER SYSTEM
99
9.5. Recommendation for Future Studies
This study was only analyzing the possible impact of changes of Brantas River System to flood
problems in Surabaya City and its possible flood mitigation measures. To improve flood management
in Surabaya City, various flood modelling using recent development in hydrological simulation such
as 1D2D in SOBEK can be developed. Some recommended future studies are;
1. 1D flood model developed in Surabaya Drainage Master Plan can be transformed to an advanced
1D2D flood modelling. 1D flood model can not give information about flood extent if water
discharge is exceeding channel capacity. Data availability in SDMP for development of 1D flow
is considered very complete, and it only required an additional 2D data models such as Digital
Surface Model (DSM) to develop an appropriate 1D2D model.
2. Flood modelling can be developed for broader area, even for the whole Brantas River Basin, and
because there are some cities along Brantas River, a general flood mitigation measures for each
city can be developed.
3. Apart from flood hazard caused by changes of Brantas River System, 1D2D model can be
developed to simulate the comprehensive hydrological system in Surabaya City that can be very
useful in flood hazard management in Surabaya, not only the one caused by changes of Brantas
River System, but also problems caused by natural events, such as storm, constant increase of sea
tide, and even tsunami threat.
4. This study shown which areas has a higher hazard level than others. A detailed 2D flood
modelling can be developed in such areas or other areas that are considered critical, such as
hospital, chemical storage, and industrial area, to develop a local flood mitigation measures that
can protect flood prone and critical areas.
(Fedeski and Gwilliam 2007) (Alkema, Nieuwenhuis et al. 2007) (Ramsbottom and Penning-Rowsell
2003) (Ramlal and Baban; Bates, Anderson et al. 1995; Nicholls, Hoozemans et al. 1999; Stewart,
Bates et al. 1999; Todini 1999; Bates and De Roo 2000; Oliveri and Santoro 2000; Priestnall, Jaafar et
al. 2000; Campana and Tucci 2001; Lenders, Leuven et al. 2001; Werner 2001; Badilla Coto 2002;
Horritt and Bates 2002; Plate 2002; Stephenson 2002; Zerger 2002; Boughton and Droop 2003; De
Roo, Schmuck et al. 2003; Ramsbottom and Penning-Rowsell 2003; Schielen and Gijsbers 2003; van
der Sande, de Jong et al. 2003; da Gloria Muianga 2004; Lhomme, Bouvier et al. 2004; Mark,
Weesakul et al. 2004; Sharifi, Herwijnen et al. 2004; Tennakoon 2004; Bin Usamah 2005; Chetty and
Smithers 2005; Moore, Bell et al. 2005; Shaviraachin 2005; Tralli, Blom et al. 2005; Brath, Montanari
et al. 2006; Carrivick 2006; Culshaw, Nathanail et al. 2006; Mignot, Paquier et al. 2006; Zulkarnain
2006; Chen 2007; Fedeski and Gwilliam 2007; Pender and Neelz 2007; Prachansri 2007; Sanders
2007; Hansson, Danielson et al. 2008)

100
REFERENCES Alkema, D., J. D. p. Nieuwenhuis, et al. (2007). Simulating floods : on the application of a 2D
hydraulic model for flood hazard and risk assessment. ITC Dissertation;147. Enschede, ITC: 198.
Badilla Coto, E. (2002). Flood hazard, vulnerability and risk assessment in the city of Turrialba, Costa
Rica. Enschede, ITC: 81.
BAPPEKO, S. (2000). "Surabaya Drainage Masterplan."
Bates, P. D., M. G. Anderson, et al. (1995). Initial comparison of two - dimensional finite element
codes for river flood simulation.
Bates, P. D. and A. P. J. De Roo (2000). "A simple raster-based model for flood inundation
simulation." Journal of Hydrology 236(1-2): 54-77.
Bin Usamah, M. (2005). Modelling flood events in the lower Bicol floodplain. Enschede, ITC: 112.
Boughton, W. and O. Droop (2003). "Continuous simulation for design flood estimation--a review."
Environmental Modelling & Software 18(4): 309-318.
Brath, A., A. Montanari, et al. (2006). "Assessing the effect on flood frequency of land use change via
hydrological simulation (with uncertainty)." Journal of Hydrology 324(1-4): 141-153.
Campana, N. A. and C. E. M. Tucci (2001). "Predicting floods from urban development scenarios:
case study of the Diluvio Basin, Porto Alegre, Brazil." Urban Water 3(1-2): 113-124.
Carrivick, J. L. (2006). "Application of 2D hydrodynamic modelling to high-magnitude outburst
floods: An example from Kverkfjoll, Iceland." Journal of Hydrology 321(1-4): 187-199.
Chen, P. (2007). Flood impact assessment using hydrodynamic modelling in Bangkok, Thailand.
Enschede, ITC: 61.
Chetty, K. and J. Smithers (2005). "Continuous simulation modelling for design flood estimation in
South Africa: Preliminary investigations in the Thukela catchment." Physics and Chemistry of
the Earth, Parts A/B/C 30(11-16): 634-638.
Culshaw, M. G., C. P. Nathanail, et al. (2006). "The role of web-based environmental information in
urban planning--the environmental information system for planners." Science of The Total
Environment 360(1-3): 233-245.
da Gloria Muianga, M. (2004). Flood hazard assessment and zonation in the lower Limpopo,
Mozambique. Enschede, ITC: 85.
De Roo, A., G. Schmuck, et al. (2003). "The influence of historic land use changes and future planned
land use scenarios on floods in the Oder catchment." Physics and Chemistry of the Earth,
Parts A/B/C 28(33-36): 1291-1300.
Dwyer, A., Zoppou, C., Nielsen, O., Day, S. & Roberts, S. (2004). "Quantifying Social Vulnerability:
A methodology for identifying those at risk to natural hazards." Geoscience Australia;
Australian Government.
Fedeski, M. and J. Gwilliam (2007). "Urban sustainability in the presence of flood and geological
hazards: The development of a GIS-based vulnerability and risk assessment methodology."
Landscape and Urban Planning 83(1): 50-61.
Ferita, H. (2006). "City Report of Surabaya." Asian Urban Information Centre of Kobe: 30.
Hansson, K., M. Danielson, et al. (2008). "A framework for evaluation of flood management
strategies." Journal of Environmental Management 86(3): 465-480.

URBAN FLOOD MANAGEMENT IN SURABAYA CITY:ANTICIPATING CHANGES IN THE BRANTAS RIVER SYSTEM
101
Horritt, M. S. and P. D. Bates (2002). "Evaluation of 1D and 2D numerical models for predicting river
flood inundation." Journal of Hydrology 268(1-4): 87-99.
Jordan, G. (2007). "Adaptive smoothing of valleys in DEMs using TIN interpolation from ridgeline
elevations: An application to morphotectonic aspect analysis." Computers & Geosciences
33(4): 573-585.
Lenders, H. J. R., R. S. E. W. Leuven, et al. (2001). "BIO-SAFE: a method for evaluation of
biodiversity values on the basis of political and legal criteria." Landscape and Urban Planning
55(2): 121-137.
Lhomme, J., C. Bouvier, et al. (2004). "Applying a GIS-based geomorphological routing model in
urban catchments." Journal of Hydrology 299(3-4): 203-216.
Mark, O., S. Weesakul, et al. (2004). "Potential and limitations of 1D modelling of urban flooding."
Journal of Hydrology 299(3-4): 284-299.
Mignot, E., A. Paquier, et al. (2006). "Modeling floods in a dense urban area using 2D shallow water
equations." Journal of Hydrology 327(1-2): 186-199.
Moore, R. J., V. A. Bell, et al. (2005). "Forecasting for flood warning." Comptes Rendus Geosciences
337(1-2): 203-217.
Nicholls, R. J., F. M. J. Hoozemans, et al. (1999). "Increasing flood risk and wetland losses due to
global sea-level rise: regional and global analyses." Global Environmental Change
9(Supplement 1): S69-S87.
Oliveri, E. and M. Santoro (2000). "Estimation of urban structural flood damages: the case study of
Palermo." Urban Water 2(3): 223-234.
Parkinson (2005). "Urban Stormwater Management in Developing Countries, IWA Publishing,
London, UK."
Pender, G. and S. Neelz (2007). "Use of computer models of flood inundation to facilitate
communication in flood risk management." Environmental Hazards 7(2): 106-114.
Plate, E. J. (2002). "Flood risk and flood management." Journal of Hydrology 267(1-2): 2-11.
Prachansri, S. (2007). Analysis of soil and land cover parameters for flood hazard assessment : a case
study of the Nam Chun watershed, Phetchabun, Thailand. Enschede, ITC: 92.
Priestnall, G., J. Jaafar, et al. (2000). "Extracting urban features from LiDAR digital surface models."
Computers, Environment and Urban Systems 24(2): 65-78.
Ramlal, B. and S. M. J. Baban "Developing a GIS based integrated approach to flood management in
Trinidad, West Indies." Journal of Environmental Management In Press, Corrected Proof. Ramsbottom, D. and E. Penning-Rowsell (2003). "Estimating Injury and Loss of Life in Floods: A
Deterministic Framework." Natural hazards : journal of the international society for the
prevention and mitigation of natural hazards.
Ramu, K., P.E., Dr (2002). "Brantas River Basin Case Study Indonesia." Agriculture and Rural
Development Department, World Bank.
Sanders, B. F. (2007). "Evaluation of on-line DEMs for flood inundation modeling." Advances in
Water Resources 30(8): 1831-1843.
Schielen, R. M. J. and P. J. A. Gijsbers (2003). "DSS-large rivers: developing a DSS under changing
societal requirements." Physics and Chemistry of the Earth, Parts A/B/C 28(14-15): 635-645.
Sharifi, A., M. v. Herwijnen, et al. (2004). "Spatial Decision Support Systems." Lecture Notes,
International Institute for Geo-information Science & Earth Observation (ITC), Enschede.

102
Shaviraachin, T. (2005). Flood simulation : a case study in the lower Limpopo valley, Mozambique
using the SOBEK flood model. Enschede, ITC: 43.
Stephenson, D. (2002). "Integrated flood plain management strategy for the Vaal." Urban Water 4(4):
423-428.
Stewart, M. D., P. D. Bates, et al. (1999). "Modelling floods in hydrologically complex lowland river
reaches." Journal of Hydrology 223(1-2): 85-106.
Tennakoon, K. B. M. (2004). Parameterisation of 2D hydrodynamic models and flood hazard mapping
for Naga city, Philippines. Enschede, ITC: 101.
Todini, E. (1999). "An operational decision support system for flood risk mapping, forecasting and
management." Urban Water 1(2): 131-143.
Tralli, D. M., R. G. Blom, et al. (2005). "Satellite remote sensing of earthquake, volcano, flood,
landslide and coastal inundation hazards." ISPRS Journal of Photogrammetry and Remote
Sensing 59(4): 185-198.
Usman, A. A., Ir, M.Eng (2003). "Comperehensive Development Of The Brantas River Basin, The
Republic Of Indonesia." The 3rd World Water Forum.
van der Sande, C. J., S. M. de Jong, et al. (2003). "A segmentation and classification approach of
IKONOS-2 imagery for land cover mapping to assist flood risk and flood damage
assessment." International Journal of Applied Earth Observation and Geoinformation 4(3):
217-229.
Werner, M. G. F. (2001). "Impact of grid size in GIS based flood extent mapping using a 1D flow
model." Physics and Chemistry of the Earth, Part B: Hydrology, Oceans and Atmosphere
26(7-8): 517-522.
Wollenberg, E. (2000). "Anticipating Change: Scenarios as a tool for adaptive forest management."
Center for International Forestry Research.
Yue, T.-X., Z.-P. Du, et al. (2007). "A new method of surface modeling and its application to DEM
construction." Geomorphology 91(1-2): 161-172.
Zerger, A. (2002). "Examining GIS decision utility for natural hazard risk modelling." Environmental
Modelling & Software 17(3): 287-294.
Zulkarnain, M. (2006). "Digital Surface Model (DSM) Construction and Flood Hazard Simulation for
Development Plans in Naga City, Philippines." ITC M.Sc Thesis.

URBAN FLOOD MANAGEMENT IN SURABAYA CITY:ANTICIPATING CHANGES IN THE BRANTAS RIVER SYSTEM
103
APPENDICES Appendix 1. Regulatory Structures of Delta Brantas River System
Mlirip Weir
Lengkong Barrage

104
Appendix 2. Impact of Channel and Flow Improvement
Without Channel Improvement
With Channel Improvement
Kali Surabaya Discharge (m3/s)
Kali Perbatasan Discharge (m3/s)

URBAN FLOOD MANAGEMENT IN SURABAYA CITY:ANTICIPATING CHANGES IN THE BRANTAS RIVER SYSTEM
105
Appendix 3. Model Schematization in SOBEK