urban heat island mitigation strategies - inspq · the 20062012 québec- action plan on climate...
TRANSCRIPT

Urban Heat Island Mitigation Strategies


Literature Review of
Urban Heat Island Mitigation Strategies
Direction de la santé environnementale et de la toxicologie
July 2009

AUTHOR Mélissa Giguère, M.Env. Direction de la santé environnementale et de la toxicologie
LAYOUT
Nicole Dubé Direction de la santé environnementale et de la toxicologie
Julie Colas Direction de la santé environnementale et de la toxicologie
PHOTOGRAPHS
Mélissa Giguère, M.Env Direction de la santé environnementale et de la toxicologie
This study is funded by the Government of Québec’s Green Fund under Measure 21 of the 2006-2012 Québec Action Plan on Climate Change.
This document is available in its entirety in electronic format (PDF) on the Institut national de santé publique du Québec Web site at: http://www.inspq.qc.ca. Reproductions for private study or research purposes are authorized by virtue of Article 29 of the Copyright Act. Any other use must be authorized by the Government of Québec, which holds the exclusive intellectual property rights for this document. Authorization may be obtained by submitting a request to the central clearing house of the Service de la gestion des droits d’auteur of Les Publications du Québec, using the online form at http://www.droitauteur.gouv.qc.ca/en/autorisation.php or by sending an e-mail to [email protected]. Information contained in the document may be cited provided that the source is mentioned. LEGAL DEPOSIT – 3rd QUARTER 2012 BIBLIOTHÈQUE ET ARCHIVES NATIONALES DU QUÉBEC LIBRARY AND ARCHIVES CANADA ISBN: 978-2-550-56805-6 (FRENCH PDF) ISBN: 978-2-550-65608-1 (PDF)
© Gouvernement du Québec (2012)

Urban Heat Island Mitigation Strategies
Institut national de santé publique du Québec I
ACKNOWLEDGMENTS
The author would like to thank the reviewers of this publication, whose willingness to share their expertise was greatly appreciated.
Diane Bélanger, Researcher Centre hospitalier universitaire de Québec research centre
Emmanuelle Boulfroy Centre collégial de transfert de technologie en foresterie affiliated with the Collège d'enseignement général et professionnel de Sainte-Foy
Musandji Fuamba, Assistant Professor Department of Civil, Geological and Mining Engineering École Polytechnique de l’Université de Montréal
Pierre Gosselin, Consulting Physician Institut national de santé publique du Québec
Guy Lalonde, Technical Director Association des maîtres couvreurs du Québec
Xavier Laplace, President Les Toits Vertige
Catherine Rivard, Coordinator Water, Soil and Groundwater Sectors Réseau Environnement
Owen Rose, Architect Provencher Roy et associés President, Montréal Urban Ecology Centre
Madeleine Rousseau, Researcher National Research Council of Canada
We also wish to thank Health Canada’s Climate Change and Health Office for providing financial support for the translation of this report in English.


Urban Heat Island Mitigation Strategies
Institut national de santé publique du Québec III
FOREWORD
The 2006-2012 Québec Action Plan on Climate Change, entitled Quebec and Climate Change – A Challenge for the Future, is a government action plan that draws on several Québec departments and agencies. The Green Fund, financed by a levy on fossil fuels, provides most of the funding for the Action Plan’s 26 measures focused on two major goals: reducing and avoiding greenhouse gas emissions and adapting to climate change.
The Québec Department of Health and Social Services (MSSS) is responsible for the health component of Measure 21, which aims to develop and institute mechanisms that will help prevent and mitigate the impacts of climate change on health. Between 2006 and 2012, the MSSS has committed to addressing six areas for action targeting Québec’s adaptation to climate change, each of which includes several research projects or proposed interventions, namely:
• The development and introduction of an integrated system that includes a real-time extreme heat monitoring and warning system and a system for monitoring associated health problems for all regions of Québec likely to be affected.
• Adaptation of the infectious diseases monitoring system in order to quickly detect pathogens, vectors and diseases whose spread may be promoted by climate change.
• The development and introduction of a system for monitoring the physical and psychosocial health problems related to extreme weather events (winter and summer storms, thunder and lightning storms and torrential rains, tornados, forest fires, floods, landslides and coastal erosion).
• Support to help the health care network adapt to extreme weather events, from a clinical, social and physical perspective, in order to protect the most vulnerable populations.
• Support for preventive management of inhabited areas and spaces in order to mitigate the impact of climate change on the health of vulnerable populations.
• Improved training and knowledge transfer concerning the health problems associated with climate change and possible solutions.
In November 2007, the MSSS tasked the Institut national de santé publique du Québec to manage the health component of Measure 21, including coordination of all the projects listed above, professional support to the MSSS and relations with partners.
This study is part of the process of implementing support programs in the municipal sector and in education and early childhood networks in order to support urban heat island mitigation strategies and preventive adaptation of programs and infrastructure to climate change. It thus constitutes a reference document for the implementation of local demonstration projects on urban heat island mitigation, for which calls for proposals are planned in summer and fall of 2009.


Urban Heat Island Mitigation Strategies
Institut national de santé publique du Québec V
TABLE OF CONTENTS
LIST OF TABLES ............................................................................................................... VIILIST OF FIGURES ............................................................................................................... IXGLOSSARY ......................................................................................................................... XIINTRODUCTION .................................................................................................................... 11 METHODOLOGY ............................................................................................................ 3
1.1 Review methodology ............................................................................................. 31.2 Selection criteria ................................................................................................... 31.3 Revision ................................................................................................................ 3
2 CAUSES, IMPACTS AND THERMAL COMFORT ......................................................... 52.1 Definition of urban heat island ............................................................................... 52.2 Causes .................................................................................................................. 6
2.2.1 Greenhouse gas emissions ...................................................................... 62.2.2 Gradual loss of urban forest cover ............................................................ 62.2.3 Impermeability of materials ....................................................................... 62.2.4 Thermal properties of materials ................................................................ 72.2.5 Urban morphology and city size ............................................................... 72.2.6 Anthropogenic heat .................................................................................. 7
2.3 Impacts ................................................................................................................. 82.3.1 Impacts on the environment ..................................................................... 82.3.2 Impacts on health ..................................................................................... 9
2.4 Thermal comfort .................................................................................................... 92.5 Air conditioning ................................................................................................... 10
3 HEAT ISLANDS IN QUÉBEC ....................................................................................... 113.1 Areas where actions are required ........................................................................ 113.2 Tools for detecting urban heat islands ................................................................. 11
4 URBAN HEAT ISLAND MITIGATION STRATEGIES ................................................... 134.1 Vegetation and cooling ........................................................................................ 13
4.1.1 Urban greening strategy ......................................................................... 144.1.2 Selective planting of trees and vegetation .............................................. 154.1.3 Greening of parking lots ......................................................................... 154.1.4 Vegetation around buildings ................................................................... 154.1.5 Green walls ............................................................................................ 164.1.6 Green roofs ............................................................................................ 174.1.7 Cooling gains and other benefits associated with greening of urban
areas ...................................................................................................... 194.2 Sustainable urban infrastructure .......................................................................... 21
4.2.1 Buildings ................................................................................................. 214.2.2 Road infrastructure ................................................................................. 264.2.3 Characteristics of the built environment .................................................. 27

Urban Heat Island Mitigation Strategies
VI Institut national de santé publique du Québec
4.2.4 Cooling gains and other benefits associated with sustainable urban infrastructure .......................................................................................... 29
4.3 Sustainable stormwater management ................................................................. 304.3.1 Trees and green roofs ............................................................................ 314.3.2 Permeable surfaces ............................................................................... 314.3.3 Rain gardens ......................................................................................... 324.3.4 Retention ponds ..................................................................................... 334.3.5 Infiltration trenches (or soaking trenches) ............................................... 334.3.6 Dry wells ................................................................................................ 334.3.7 Reservoir pavement structures .............................................................. 334.3.8 Watering impermeable pavements with recycled water .......................... 344.3.9 Cooling gains and other benefits related to stormwater management .... 34
4.4 Reducing anthropogenic heat ............................................................................. 354.4.1 Controlling heat production in buildings .................................................. 354.4.2 Reducing the number of vehicles in urban areas .................................... 364.4.3 Passive buildings: controlling air conditioning demand ........................... 384.4.4 Cooling gains associated with passive air conditioning .......................... 41
5 COMPLETED PROJECTS ........................................................................................... 436 SUMMARY AND COMPARISON OF URBAN HEAT ISLAND MITIGATION
STRATEGIES ............................................................................................................... 476.1 Examples of the application of urban heat island mitigation strategies ................ 47
6.1.1 Buildings ................................................................................................ 486.1.2 Urban planning and development ........................................................... 50
6.2 Comparison of the various urban heat island mitigation strategies ...................... 526.2.1 Comparison criteria ................................................................................ 52
7 SUGGESTIONS ........................................................................................................... 57REFERENCES .................................................................................................................... 59APPENDIX 1 ....................................................................................................................... 73

Urban Heat Island Mitigation Strategies
Institut national de santé publique du Québec VII
LIST OF TABLES
Table 1 Anthropogenic emission rate and net annual radiative balance for select American, European and Asian cities .............................................................. 8
Table 2 Climate normals for three Québec cities (1971-2000) .................................... 11
Table 3 Trees with allergenic potential ....................................................................... 14
Table 4 Comparison of extensive and intensive green roofs ....................................... 19
Table 5 Albedos and emissivity factors of various materials ....................................... 22
Table 6 Various types of external shading devices ..................................................... 26
Table 7 Various types of controlled mechanical ventilation (CMV) .............................. 39
Table 8 Cooling in °C by air flow rate (m/s) ................................................................. 42
Table 9 Examples of greening measures .................................................................... 43
Table 10 Examples of measures related to the design of sustainable urban infrastructure .................................................................................................. 44
Table 11 Examples of sustainable stormwater management measures ....................... 44
Table 12 Examples of anthropogenic heat reduction measures .................................... 45
Table 13 Comparison of the various urban heat island mitigation measures ................ 53


Urban Heat Island Mitigation Strategies
Institut national de santé publique du Québec IX
LIST OF FIGURES
Figure 1 Sketch of an Urban Heat Island Profile ............................................................ 5
Figure 2 Example of mapping of urban heat islands in Montréal .................................. 12
Figure 3 Vegetation around a building ......................................................................... 16
Figure 4 Green façades ............................................................................................... 17
Figure 5 Extensive green roofs .................................................................................... 18
Figure 6 Fountain and swimming pool ......................................................................... 29
Figure 7 Impermeable paving stones with permeable joints. Pedestrian areas with paving stones that allow water percolation ..................................................... 32
Figure 8 Vegetated parking area ................................................................................. 32
Figure 9 Cross-section of a ground-coupled heat exchanger ....................................... 41
Figure 10 Schematic diagram of urban heat island mitigation strategies involving buildings ........................................................................................................ 48
Figure 11 Schematic diagram of urban heat island mitigation strategies involving urban planning and development ................................................................... 50


Urban Heat Island Mitigation Strategies
Institut national de santé publique du Québec XI
GLOSSARY
Adaptation The gradual decrease of an organism’s response to repeated exposure to a stimulus, involving all the actions that enhance its ability to survive in such an environment.1
Albedo
The fraction of incident solar energy that is reflected from a surface.1
Heat capacity The quantity of heat required to raise the temperature of a material by 1°C. It is expressed in Wh/m3°C and is obtained by multiplying the mass by the specific heat of the material. The higher this figure, the greater the quantity of heat required to increase the temperature of a material.2
Convection
Displacement of heat within a fluid by the movement of all of its molecules.2
Glare Discomfort or impairment of vision experienced when parts of the visual field are excessively bright compared to the surrounding areas.2
Stack effect Tendency of a fluid to rise when heated, owing to the decrease in density. This natural thermal phenomenon is used to eliminate excess heat inside a building by facilitating the exhaust of warm or hot air through openings in the upper part of the building. This thermal draft can cause negative pressure inside the building which then draws in cooler air from outside through openings in the lower part of the building.2
Sky view factor (SVF) SVF is a measure of the openness of the urban texture to the sky, and is linked to climatological phenomena such as urban heat island, daylighting and heat absorption.
Urban morphology The three-dimensional form of a group of buildings and the spaces they create.1
Solar radiation All of the radiation emitted by the sun. Light is the visible part of radiation and corresponds to wavelengths in the 380 to 780 nanometre range, which extends from blue to red through green and yellow. Solar radiation with the shortest wavelength is ultraviolet radiation, which
1 Nikolopoulou, M. (2004) Designing open spaces in the urban environment: a bioclimatic approach. Center for
Renewable Energy Sources, 64 p. 2 Outils solaires (2009) Glossaire solaire. Accessible at: http://www.outilssolaires.com/Glossaire/default.htm.
Consulted April 3, 2009.

Urban Heat Island Mitigation Strategies
XII Institut national de santé publique du Québec
is partially intercepted by the ozone layer in the upper atmosphere. Beyond the visible spectrum, solar radiation with the longest wavelength is called infrared radiation (heat), which is absorbed in part by water vapour in the atmosphere.3
Transit Oriented Development (TOD)
Concept developed by Peter Calthorpe, one of the founders of New Urbanism, Transit Oriented Development advocates developing dense, multi-purpose neighbourhoods around mass transit hubs. This concept promotes certain principles and objectives, such as quality of life, diversity and accessibility – both residential and commercial, public spaces, forms of soft mobility, diversity of functions creating constant activity, proximity services.4
3 Salomon, T., Aubert, C. (2003) La fraîcheur sans clim. Terre Vivante, Paris, 160 p. 4 Urbatod (2009) Transit oriented development. Accessible at: http://www.urbatod.org/p1.htm.

Urban Heat Island Mitigation Strategies
Institut national de santé publique du Québec 1
INTRODUCTION
According to the Intergovernmental Panel on Climate Change (IPCC), eleven of the hottest twelve years ever observed were recorded since 1995 and are attributable to rising levels of greenhouse gases in the atmosphere. North American cities “that currently experience heat waves are expected to be further challenged by an increased number, intensity and duration of heat waves” (Pachauri and Reisinger, 2007).
In Québec, the hottest ten years of the century have been recorded since the 1980s (Natural Resources Canada, 2004). Forecasts indicate that average temperatures will continue to rise in the coming decades (Bourque and Simonet, 2007).
This observed and forecast constant increase in temperature will accentuate a problem with which we are already familiar: the urban heat island effect. This phenomenon is characterized by higher summer temperatures in urban environments than in surrounding rural areas. According to observations, this temperature difference, which is primarily attributable to the urban built environment, ranges from 2°C to 12°C and may pose particular risks to the urban population (Oke, 1987; Voogt, 2002). Certain cities such as Paris and Chicago learned this first hand following heat waves that proved to be very deadly (Besancenot, 2007).
Many cities have adopted strategies to mitigate urban heat islands. Québec cities must also react to these changing climatic realities, in particular by implementing urban heat island mitigation measures and creating urban cool zones. These types of initiatives protect the population by increasing their ability to adapt to these phenomena.
This literature review was carried out primarily for the benefit of the staff of non-profit organizations and municipalities working in this field and supports the focus of the projects submitted under the Québec Action Plan on Climate Change – Health Component. The objective of this review is to identify and publicize the main urban heat island mitigation strategies and the many successful initiatives in this field, both in Québec and internationally. This document does not claim to replace the recommendations of experts in the fields concerned by urban heat island mitigation strategies, including architecture, urban planning, transportation and engineering.
Section 2 of this literature review discusses the causes and impacts of urban heat islands, while section 3 describes the areas in Québec vulnerable to urban heat islands. Section 4 examines the various urban heat island mitigation strategies adapted to Québec cities, while section 5 provides examples of applications of these measures and strategies in various cities in Québec and around the world. Finally, section 6 provides a summary and comparison of urban heat island mitigation strategies as well as suggestions for their application in Québec, followed by recommendations.


Urban Heat Island Mitigation Strategies
Institut national de santé publique du Québec 3
1 METHODOLOGY
In the context of this literature review, the purpose of the information search was to determine the urban heat island mitigation strategies applicable to Québec and their effectiveness in terms of cooling and temperature reduction. These strategies draw on expertise in various specialized fields, such as urban planning, land use planning, architecture, civil engineering, building engineering, transportation and energy-saving technologies.
1.1 REVIEW METHODOLOGY
The first stage in the methodology adopted for this study was to conduct a review of the scientific publications on urban cooling strategies, an exercise which was carried out from October 2008 to January 2009. The documentary search sites (Medline, Embase, RUDI, Avery Index to Architectural Periodicals, Human Population & Natural Resource Management, Environmental Engineering Abstracts, Google Scholar, Google) were queried using various keywords (Appendix 1). These searches were supplemented by scanning the bibliographies of the publications selected and by searches on Canadian, American and European government Web sites. Then, a documentary search using the Google search engine was used to complete the database of information concerning urban heat island mitigation projects in Québec and around the world.
1.2 SELECTION CRITERIA
References were selected based on the following criteria:
• identification and descriptive nature of the urban heat island mitigation strategies; • evaluation of the cooling potential of the various strategies in urban environments; • year of publication, essentially the 2000-2009 period; • language of publication: English and French.
Certain exclusion criteria helped refine the research. For instance, the following sources were rejected:
• studies conducted in climatic contexts different from those of Québec; • studies dating from 1999 or earlier, without exception; • documents dealing with strategies considered not applicable in Québec according to the
authors surveyed or the experts consulted.
1.3 REVISION
The literature review was examined by nine reviewers, including eight outside reviewers, who are specialists in various fields of expertise relevant to the urban heat island mitigation strategies considered. Corrections were made based on their comments. However, any errors or omissions in the text remain the sole responsibility of the author.


Urban Heat Island Mitigation Strategies
Institut national de santé publique du Québec 5
2 CAUSES, IMPACTS AND THERMAL COMFORT
2.1 DEFINITION OF URBAN HEAT ISLAND
The term “urban heat islands” refers to the observed temperature difference between urban environments and the surrounding rural areas. Observations have shown that the temperatures of urban centres can be up to 12°C higher than neighbouring regions (Figure 1) (Voogt, 2002).
Three types of urban heat islands are distinguished in the literature:
• surface heat islands: by measuring the infrared radiation emitted and reflected by surfaces, it is possible to identify the locations in a city where the surfaces are hottest (section 3.2);
• canopy layer heat islands: the canopy layer is the layer of air between the ground and treetops, or roofs of buildings, where most human activity takes place;
• boundary layer heat islands: the boundary layer is located above the canopy layer. Canopy and boundary layer heat islands refer to air temperature (Oke, 1982; Voogt, 2002).
The intensity of heat islands changes daily and seasonally as a function of the various meteorological and anthropogenic parameters presented in section 2.2. In general, the intensity of canopy heat islands is greater at night than during the day (Oke, 1987; Pigeon et al., 2008).
Figure 1 Sketch of an Urban Heat Island Profile
Source: Lawrence Berkeley National Laboratory, 2000.

Urban Heat Island Mitigation Strategies
6 Institut national de santé publique du Québec
2.2 CAUSES
In addition to the local climate, which is influenced by various meteorological parameters such as temperature, relative humidity and wind, a number of anthropogenic causes promote the emergence and intensification of urban heat islands. These causes are greenhouse gas emissions, gradual loss of urban forest cover, the impermeability and low albedo of materials, the thermal properties of materials, urban morphology and the size of cities as well as anthropogenic heat.
2.2.1 Greenhouse gas emissions
Greenhouse gases (GHGs) trap solar energy in the atmosphere and thus contribute to the warming of the atmosphere. According to the IPCC, “continued GHG emissions at or above current rates would cause further warming and induce many changes in the global climate system during the 21st century that would very likely be larger than those observed during the 20th century” (Pachauri and Reisinger, 2007).
In urban environments, the sources of greenhouse gas emissions are primarily vehicles, industrial processes and the heating of buildings with fossil fuels (MDDEP, 2006).
2.2.2 Gradual loss of urban forest cover
Urban forest cover has been steadily decreasing in Québec since the 1960s and could even disappear within 20 years in the Montréal Metropolitan Community (Cavayas and Baudouin, 2008). Gradual densification of cities and the development of urban infrastructure in recent decades are the primary causes.
This loss of vegetation means a loss of cooling in urban areas. Indeed, vegetation plays an essential role in preventing the build-up of heat through the process of evapotranspiration and shading of the ground and buildings. During the natural process of evapotranspiration of water vapor, the ambient air is cooled, releasing part of its heat to allow evaporation. Vegetation also contributes to effective stormwater management and to better air quality in cities (Bolund and Hunhammar, 1999; Cavayas and Baudouin, 2008; Akbari et al., 2001; English et al., 2007).
2.2.3 Impermeability of materials
The intensification of urbanization in recent decades has also caused changes in the types of ground cover. Natural soils have been replaced by impermeable materials such as asphalt and most building materials which, because they do not provide water filtration and absorption functions, modify the natural path of stormwater (Rushtone, 2001; Coutts et al., 2008; Mailhot and Duchesne, 2005). In fact, the soil infiltration rate in cities is only 15% and the quantity of rainwater runoff is 55%, whereas in the natural environment, approximately 50% of rainwater infiltrates the soil and 10% runs off toward watercourses (USEPA, 2007; Cyr et al., 1998).

Urban Heat Island Mitigation Strategies
Institut national de santé publique du Québec 7
By restricting the availability of water in urban areas, natural cooling processes, such as evaporation of the moisture in soil and evapotranspiration of vegetation, are limited and cannot offset urban warming (Brattebo and Booth, 2003). In addition, impermeable surfaces contribute to contamination of the receiving watercourses by:
• runoff, which carries chemical pollutants, such as hydrocarbons and pesticides; • sewer overflows caused by heavy rains; • bank erosion due to the high velocity of the runoff (Frazer, 2005; Brattebo and Booth,
2003).
Between 2004 and 2006, the cities of Québec and Laval experienced more than 2,000 sewer overflows a year (Union St-Laurent Grands Lacs and Coalition Au secours, 2009). According to climate scenarios, these adverse effects could be amplified in southern Québec, where the cities will experience heavier rain events (Bourque and Simonet, 2007).
2.2.4 Thermal properties of materials
Impermeable surfaces and building materials influence the microclimate and thermal comfort conditions, since they absorb considerable heat during the day, which they release back into the atmosphere at night, thus contributing to the urban heat island effect (Asaeda et al., 1994). These low-albedo materials can reach temperatures of 80°C in summer (Liébard and DeHerde, 2005). Urban planners and architects select materials on the basis of various technical requirements such as security and durability as well as cost, and generally pay little heed to environmental considerations (Luber and McGeehin, 2008; Frazer, 2005; Brattebo and Booth, 2003).
2.2.5 Urban morphology and city size
Urban morphology, which relates to the three-dimensional form, orientation and spacing of buildings in a city, also plays a role in the formation of urban heat islands (USEPA, 2008). Large buildings and narrow streets can hamper good ventilation of urban centres because they create canyons where the heat generated by solar radiation and human activities accumulates and remains trapped (Coutts et al., 2008). In fact, the reduction of the sky view factor limits net radiative losses of buildings and streets (Pigeon et al., 2008). In addition, urban morphology can also influence vehicle traffic and thus promote inputs of heat and air pollution from this mode of transportation (Oke, 1988).
2.2.6 Anthropogenic heat
The production of anthropogenic heat such as heat emitted by vehicles, air conditioners and industrial activity is another factor that contributes to the development of heat islands, particularly in dense urban areas where activities are concentrated (USEPA, 2008). Table 1 presents the anthropogenic emission rate and the net annual radiative balance for select cities.

Urban Heat Island Mitigation Strategies
8 Institut national de santé publique du Québec
Table 1 Anthropogenic emission rate and net annual radiative balance for select American, European and Asian cities
City Anthropogenic emission rate (W/m2) Net total radiative flux (W/m2)
Chicago 53 n/a Cincinnati 26 n/a Los Angeles 21 108 Fairbanks 19 18 St. Louis 16 n/a Manhattan, New York City 117-159 93 Montreal 99 52 Moscow 127 n/a Budapest 43 46 Osaka 26 n/a
Source: Taha et al., 1997.
2.3 IMPACTS
During the summer, urban heat islands can have adverse impacts on the environment and on health.
2.3.1 Impacts on the environment
2.3.1.1 Deterioration of outdoor air quality
Urban heat islands contribute to smog formation. In fact, smog, which is composed of fine particulate matter and tropospheric ozone, is formed during the reaction between the sun’s rays, heat and pollutants (nitrogen oxides (NOx) and volatile organic compounds (VOCs)) (Akbari et al., 2001).
2.3.1.2 Deterioration of indoor air quality
Increased heat has an effect on indoor air quality, since it promotes the growth of mites, mould and bacteria. In addition, certain toxic substances, such as formaldehydes, contained in the glues used in furniture manufacturing and construction materials, are released during periods of intense heat (Salomon and Aubert, 2003).
2.3.1.3 Increase in energy demand
Indoor air cooling and refrigeration requirements can increase energy demand, resulting in greenhouse gas emissions, depending on the energy source used (Voogt, 2002).
2.3.1.4 Increase in demand for potable water
Heat islands likely cause an increase in demand for potable water, for cooling (e.g. swimming pools and fountains) or for watering plants (Balling et al., 2008).

Urban Heat Island Mitigation Strategies
Institut national de santé publique du Québec 9
2.3.2 Impacts on health
Periods of high temperatures, the effects of which are magnified by urban heat islands, can cause heat stress for the population. Some individuals may be more vulnerable to the effects of urban heat islands, such as people with chronic diseases, people who are socially isolated, very young children, outdoor workers, persons of low socioeconomic status, people who engage in strenuous outdoor exercise and the mentally ill (Besancenot, 2002; WHO, 2007; CSST, 2004). Finally, the elderly, whose proportion will double in Québec by 2051 (Institut de la statistique du Québec, 2004), are also more vulnerable to heat-related problems, particularly because of the physiological changes associated with aging (Thibault et al., 2004).
The periods of high temperatures associated with urban heat islands can cause discomfort, weakness, disturbances of consciousness, cramps, fainting, heat stroke, and even exacerbate pre-existing chronic diseases such as diabetes, respiratory failure, and cardiovascular, cerebrovascular, neurological and renal diseases, to the point of causing death (Besancenot, 2002; Luber and McGeehin, 2008). On the recommendation of the World Health Organization, health agencies around the world, including in Québec, have instituted various programs to mitigate the effects of intense heat and prevent urban heat islands.
2.4 THERMAL COMFORT
In order to reduce individual vulnerability and maintain a comfortable thermal environment, ambient temperatures must be neither too low nor too high. Body temperature, which is approximately 37°C, is maintained through intake of calories from food and heat exchanges with the immediate environment according to the following mechanisms:
• convection, which promotes heat transfer between the skin and the ambient air, which increases with elevated air flow;
• conduction, the transfer of heat through direct contact of the skin and a warmer or colder body (example: walking barefoot on a cold floor);
• radiation, which is the direct transfer of heat between the skin and solid objects in the environment (examples: walls, ceiling, ground and heat sources);
• perspiration, the loss of heat through evaporation of sweat, which is more effective when relative humidity is low (Salomon and Aubert, 2003).
The perception of thermal comfort is subjective and varies from person to person and is influenced by various individual and contextual parameters, including activity level, physiological and psychological acclimatization to heat, type of clothing worn, air temperature, temperature of the surrounding surfaces, solar radiation as well as air flow and relative humidity of the air (Brown and Gillespie, 1995; Fanger, 1982).
Thermal comfort is therefore specific to each individual and it is impossible to define a type of thermal environment that meets everyone’s requirements. However, it is possible to specify an acceptable temperature range for a high percentage of people. This range is between 20°C and 27°C with an optimal humidity rate of 35% to 60% (Fanger, 1982; Déoux, 2004; Nikolopoulou, 2004).

Urban Heat Island Mitigation Strategies
10 Institut national de santé publique du Québec
2.5 AIR CONDITIONING
In order to ensure thermal comfort during the summer, air conditioners are often used at home, at work, in public places and even in the car. However, this solution should not be the first choice, since in addition to the high energy demand that it creates, the widespread and growing use of air conditioning can have impacts that worsen urban heat island effects. Generally, large-scale use of air conditioning can result in:
• high energy demand, particularly during peak hours, which is contrary to the principles of energy efficiency (Déoux, 2004). For example: the proportion of Québec households with a home air conditioner more than doubled in 15 years, from 15.2% in 1993 to 36.4% in 2005 (Institut de la statistique du Québec, 2005);
• the production of anthropogenic heat by exhausting hot air from inside the building to the outside of the building. In addition, the air conditioning process (compression and condensation) generates heat (Lachal et al., 2004; Bourque and Simonet, 2007);
• the emission of greenhouse gases (CFCs, HCFCs, HFCs) caused by the use of harmful refrigerants, the annual leak rate of which is reportedly about 10% for individual air conditioning units and 15% for central air conditioning systems (Déoux, 2004);
• degradation of air quality with the associated effects on human health, primarily due to the risk of spread of Legionella bacteria, particularly associated with industrial air conditioners (Déoux, 2004); and
• the increase in noise pollution caused by noise from some air conditioning systems (Salomon and Aubert, 2003).
Currently, air conditioning frequently seems to be considered the solution of first choice. Indeed, for certain individuals who have a very low capacity for adaptation to deal with heat-related health problems (for example, residents of nursing homes and long-term care centres) and their potentially fatal consequences (Jacques and Kosatsky, 2005), air conditioning is a useful and necessary preventive measure. That being said, air conditioning should not be considered a panacea for offsetting the ongoing loss of urban green spaces or for correcting building design flaws or poor building management practices (Dixsaut, 2005). In light of the consequences of widespread use of air conditioning, some of which were mentioned above, it is therefore very important to consider other, more sustainable solutions, both for the environment and for the health of current and future generations, that take into account both the causes of and adaptation to climate change (McEvoy et al., 2006).

Urban Heat Island Mitigation Strategies
Institut national de santé publique du Québec 11
3 HEAT ISLANDS IN QUÉBEC
3.1 AREAS WHERE ACTIONS ARE REQUIRED
The geographic area affected by the problem of urban heat islands is the southern part of Québec that has been experiencing increasingly “tropical” summers (Bourque and Simonet, 2007). This area includes the following administrative health and social services regions (RSS): La Capitale-Nationale (RSS-03), Mauricie et Centre-du-Québec (RSS-04), Estrie (RSS-05), Montréal (RSS-06), Outaouais (RSS-07), Chaudière-Appalaches (RSS-12), Laval (RSS-13), Lanaudière (RSS-14), Laurentides (RSS-15) and Montérégie (RSS-16).
The cities located in southern Québec that are affected by the urban heat island phenomenon have a summer climate called humid continental climate (Table 2). Although they are more effective in hot, dry urban areas, owing to evapotranspiration of the soil and evapotranspiration by plants, certain urban cooling measures can nevertheless be useful in more humid climates, as we will see in section 4.
Table 2 Climate normals for three Québec cities (1971-2000)
City/Month Average temperature (°C)
Average relative humidity at 3:00 pm
(%) Average wind speed
(km/h)
Montréal June 18.2 56.2 13.2 July 20.9 56.3 12.2
August 19.6 58.2 11.3
Québec City June 16.5 55.9 11.8 July 19.2 58.2 10.6
August 17.9 59.3 10.5
Sherbrooke June 15.5 57.6 8.3 July 18.1 58.8 7.5
August 16.9 61.6 7.1 Source: Environment Canada, 2009.
3.2 TOOLS FOR DETECTING URBAN HEAT ISLANDS
The use of certain tools is essential in order to determine the precise locations of surface heat islands; the most frequently used tool is geomatics and more specifically analysis of satellite (e.g. Landsat) and aerial images.
Map-based image analysis makes it possible to determine the surface temperature of a city (Figure 2) and to characterize the type of ground cover (Aniello et al., 1995; Cavayas and Baudouin, 2008; Gill et al., 2008). This inexpensive and practical tool also offers the capability to overlay maps containing various types of data on the urban environment studied (socioeconomic data, forest cover, annual stormwater sewer overflows, etc.) (Quénol et al., 2007).

Urban Heat Island Mitigation Strategies
12 Institut national de santé publique du Québec
Figure 2 Example of mapping of urban heat islands in Montréal
N.B.: The dark orange areas represent the hottest areas. Source: Smargiassi et al., 2009.
Digital infrared radiation thermometers are a second type of tool used in the field to obtain more precise surface temperature measurements than those provided by map-based image analysis. This tool makes it possible to both measure and convert light energy into an electrical signal, even at a considerable distance from the source, unlike other types of thermometers (Voogt, 2009).
In conclusion, we should mention that the Environmental Prediction in Canadian Cities (EPiCC) network is currently conducting research on urban heat islands in Montreal. Their projects involve continuous long-term monitoring of the surface energy balance of an urban residential site, a suburban residential site and a reference site in a rural environment (EPiCC, 2008).

Urban Heat Island Mitigation Strategies
Institut national de santé publique du Québec 13
4 URBAN HEAT ISLAND MITIGATION STRATEGIES
There are many urban heat island mitigation strategies and they draw on the expertise of various professional fields, including urban planning, architecture, natural resources management and transportation. These mitigation strategies have a positive impact on both local and global climate.
In addition to promoting cooling in urban environments, these strategies have other benefits, in particular reducing energy demand and source reduction of water and air pollution, including greenhouse gas emissions.
This section presents the various heat island mitigation strategies as well as their effectiveness in cooling the urban environment, as reported in the literature. In order to associate them directly with the causes of urban heat islands mentioned above, these mitigation measures were grouped into four categories:
• greening measures; • urban infrastructure-related measures (architecture and land use planning); • stormwater management and soil permeability measures; • anthropogenic heat reduction measures.
4.1 VEGETATION AND COOLING
A number of studies have demonstrated the great importance of vegetation and the protection of existing green spaces and wooded areas in countering the urban heat island effect (Heisler et al., 1994; Taha et al., 1996; McPherson et al., 2005; Solecki et al., 2005). In fact, vegetation achieves cooling through various processes, more specifically:
• seasonal shading of infrastructure; • evapotranspiration; • minimizing ground temperature differences.
Vegetation also provides other worthwhile and complementary benefits in urban areas, including:
• improving air quality through oxygen production, CO2 capture, filtration of suspended particulate matter and reducing energy demand for air conditioning;
• improving water quality through retention of rainwater in the ground and soil erosion control;
• health benefits for the population, including protection from ultraviolet (UV) radiation, reducing heat stress and providing spaces for outdoor exercise (Sundseth and Raeymaekers, 2006; Chiesura, 2004; Health Scotland et al., 2008; Rowntree and Nowak, 1991).
In Québec, the vegetation chosen to protect buildings from summer solar radiation must be deciduous but with few branches in order to minimize shade during the other seasons, when solar gain is desirable (Déoux, 2004). The species used for urban planting must be chosen

Urban Heat Island Mitigation Strategies
14 Institut national de santé publique du Québec
judiciously in order to ensure good foliage density which, when the tree is mature, will filter out at least 60% of solar radiation.
Species that emit volatile organic compounds (VOCs) (for example, isoprene, monoterpenes and hydrocarbons) that are components of smog as well as species with high allergenicity (Table 3) must also be avoided. According to Déoux (2004), atmospheric pollution and high ozone levels potentiate the action of allergens. In fact, plants in urban environments are more stressed and pollinate more, which causes certain polluting substances to adhere to the pollen particles and increases the allergenic potential.
Table 3 Trees with allergenic potential
Tree species Allergenic potential
Birch, oak High Alder, ash Moderate Walnut, poplar, willow, elm, maple Low
Source: RNSA, 2009.
Finally, it is essential to adapt the choice of species to the space available. For example, if there is a power line on the planting site, species that grow only to a moderate height should be chosen (Boulfroy, 2009). Finally, preference should be given to choosing native species that are tolerant to Québec’s climactic variations and to urban pollution (Evergreen, 2008).
Urban environments are constantly changing, and there are numerous opportunities to incorporate vegetation in urban restructuring, development and redevelopment plans. A range of options, presented in the following sections, are available to municipalities, contractors and private citizens in order to mitigate the effects of urban heat islands.
4.1.1 Urban greening strategy
The objective of an urban greening strategy is to increase a city’s total vegetation index. To this end, vegetation can be planted or density increased in numerous spaces, such as:
• Along transportation corridors (roadsides and alongside lanes, railway lines, etc.); • On public property (parks, municipal and government lands, school yards, daycare centre
playgrounds, etc.); • On private property (perimeters of residential, commercial and industrial buildings,
laneways, etc.) (Conseil régional de l’environnement de Montréal, 2007).
The cooling provided by vegetation may help ensure that some of these spaces will be used by the public (Health Scotland et al., 2008). It should be noted that artificial turf does not cool the ambient air. On the contrary, areas covered with artificial turf, whose synthetic fibres absorb heat, can be up to 10°C higher than a vegetated natural environment. Furthermore, artificial turf is rarely permeable (Perez Arrau, 2007).

Urban Heat Island Mitigation Strategies
Institut national de santé publique du Québec 15
4.1.2 Selective planting of trees and vegetation
In order for trees to be able to provide cooling, good growth is essential and depends on factors such as soil quality, water availability and sufficient space for optimum root growth. A tree occupying a restricted space in the ground will not attain its maximum size and its lifespan will be shortened (McPherson, 1994).
Optimum growth of trees planted along roads is possible with the use of cell structures, which provide the necessary space for full root development under a partial asphalt covering. Also, drainage of rainwater is facilitated by the presence of quality soil. The cost of a cell structure is approximately five times higher than planting a tree directly in the ground (Urban, 2008). For instance, in Montréal, a tree cell structure would cost approximately $1,000, including the purchase cost, planting cost and maintenance during the first four years (City of Montréal, 2005). The installation of cell structures requires qualified personnel (Urban, 2008).
4.1.3 Greening of parking lots
Parking lots paved with asphalt, a low-albedo material, contribute to the urban heat island effect (Rosenzweig et al., 2005). In order to reduce the heat stored in these asphalt surfaces and in the cars parked there, it is recommended that vegetation be planted around the perimeter of (vegetation strips) and within (vegetation medians) parking lots. The objective is to create shade on paved surfaces. The shade from the trees will also protect the pavement from significant thermal variations and extend its lifespan (McPherson and Muchnick, 2005).
To reduce the surface temperature of parking lots, it is also possible to vegetate entire surfaces by means of various modular systems composed of concrete, PVC or other materials that allow plant growth. These modules are installed on a permeable soil layer, which promotes the natural percolation of rainwater in the ground, and which support loads of up to 376 tonnes per square metre. This resistance allows cars to be parked on vegetated surfaces (section 4.3.2) (Communauté urbaine de Lyon, 2008).
4.1.4 Vegetation around buildings
For optimal cooling, the vegetation planted around a building must protect the building from solar radiation. Indeed, the texture and composition of the ground surrounding the building partially determine the inside and outside temperature of the building. Vegetation keeps the soil cooler and helps prevent direct, reflected and diffuse solar radiation that can affect cooling of the building (Figure 3) (Akbari et al., 2001).
In order to maximize the shade on a building, trees must be located on the east, southeast, southwest and west façades and, ideally, be large enough to shade all or part of the roof. It is also possible to install trellises, pergolas, green walls and green roofs which provide a cooler indoor temperature (Oliva and Courgey, 2006).

Urban Heat Island Mitigation Strategies
16 Institut national de santé publique du Québec
Figure 3 Vegetation around a building
4.1.5 Green walls
Green walls are vertical ecosystems that create a microclimate that substantially lowers the temperature of the building envelope and improves its energy efficiency (Kingsbury and Dunnett, 2008). These walls help reduce large temperature differences by increasing the building’s thermal mass (Jour de la Terre Québec, 2008).
These green installations also have other benefits, such as protecting the building envelope from UV radiation, capturing suspended particulate matter and protecting walls from graffiti. They can be installed on all types of buildings and even on fences, telephone poles and light standards. However, precautions must be taken concerning the condition of the host structure, which must be able to support the weight of the vegetation, and concerning the type of vegetation chosen and its potential colonizers (Kingsbury and Dunnett, 2008). Maintenance of the vegetation is simple: pruning, weeding and inspection of the supporting structure (Oliva and Courgey, 2006).
There are two types of green walls. The first is a green façade, which is a wall covered with climbing plants planted in the ground and that can climb up to 30 m. A minimum space of 15 cm by 15 cm is required on the ground in order to plant the plants. Some plants can grow directly on the face of wall or be positioned on a metal supporting structure (Figure 4). The second type is the living wall, which is composed of plants rooted in a medium attached to the wall. This installation is more complex and requires in particular impermeable membranes to prevent water damage to the wall (Kingsbury and Dunnett, 2008).
Plants adapted to the Québec climate include the Virginia creeper or five-leaved ivy (Parthenocissus quinquefolia) and the climbing hydrangea (Hydrangea petiolaris). Contrary to popular belief, climbing vegetation does not damage the building envelope, unless the wall is already damaged (e.g. deteriorated mortar) (Angers, 2007).

Urban Heat Island Mitigation Strategies
Institut national de santé publique du Québec 17
Figure 4 Green façades
4.1.6 Green roofs
Green roofs reduce the amount of heat transferred from the roof to the inside of building as a result of evapotranspiration and the shade created by the plants. They also cool the outside ambient air (McPherson, 1994) while:
• helping to increase thermal insulation in winter, as well as in summer, owing to other factors that help cool the air inside the building, such as the thermal inertia of the vegetation cover and the water in the soil or growing medium;
• contributing to the esthetic integration of buildings in the landscape;
• providing opportunities for urban agriculture;
• improving air quality; the plants on green roofs trap dust and various atmospheric pollutants;
• improving water quality, since roof vegetation offsets the impermeabilization and loss of plant cover caused by the building’s footprint (section 4.3);
• extending the lifespan of the roof, due to the fact that green roofs provide protection from bad weather, exposure to UV radiation and temperature fluctuations, all factors which cause roof degradation (Déoux, 2004; NRC, 2002; Oberndorfer et al., 2007).
Planting vegetation on roofs is common practice in a number of countries around the world, including Germany, Japan and the United States (Lawlor and Canada Mortgage and Housing Corporation, 2006). It is also a trend that is on the rise in Québec (Boucher, 2006). Green roofs are primarily suited to flat roofs or roofs with a slope of 20% or less (Déoux, 2004), although they can be retrofitted on any type of roof provided that their structures can support the weight. In some cases, installing a green roof may require major renovations (Fischetti, 2008). Also, green roofs are less expensive to install in the case of new construction (Lawlor and Canada Mortgage and Housing Corporation, 2006).

Urban Heat Island Mitigation Strategies
18 Institut national de santé publique du Québec
A standard green roof consists of several components, primarily a supporting structure, a layer of insulation (if the roof is not ventilated), a waterproof layer, a root protection membrane, a drainage and filtration section, a geotextile membrane to retain the soil, a growing medium and a vegetation layer or a growing medium layer. The vegetation layer is used if a sodded or grassland look is desired, while a growing medium layer makes it possible to plant plants, mainly succulent plants, such as sedums (Miller, 2009; Lalonde, 2009). Figure 5 provides examples of extensive green roofs.
Figure 5 Extensive green roofs Source: With the kind permission of Léonard, 2009.
The growing medium (or soil mixture) may be light, poor, absorbent (mixture of expanded clay or slate aggregates) without fertilizer. It is also possible to use water-retaining felt for precultivated and extensive type green roofs (Table 4). These various media substantially reduce the weight of the green roof (Miller, 2009).

Urban Heat Island Mitigation Strategies
Institut national de santé publique du Québec 19
Table 4 Comparison of extensive and intensive green roofs
Characteristic Type of green roof
Extensive Intensive Weight Light
Additional weight of 30 to 100 kg/m2 Heavy Additional weight of 120 to 350 kg/m2.
Cost $100 to $150/m2 Up to $1,000/m2. Depends on substrate depth and plants chosen.
Function Ecological Adapted to large areas (industries).
Recreational use; urban agriculture Adapted to small and medium-sized surfaces.
Type of growing medium
Light, porous, little organic matter. Light to heavy, porous, varying quantities of organic matter.
Thickness 2 to 20 cm. 30 cm or more.
Type of vegetation
Vegetation resistant to harshclimates (for example, sedums).
No restrictions. Type of roof that can accommodate trees.
Maintenance Limited Moderate Similar to a conventional garden; weeding, mowing, seeding, watering of plants, etc.
Accessibility Infrequent For maintenance only.
Accessible for recreation or gardening.
Sources: Lawlor and Canada Mortgage and Housing Corporation, 2006; Boucher, 2006; Laplace, 2009; Oberndorfer et al., 2007.
Finally, several studies have dealt with the types of plants adapted to extensive green roofs (Laplace, 2009). They indicate that sedums, grasses and very hardy perennials appear to do very well on extensive roofs, which require plants that can withstand the temperature and humidity variations of the Québec climate (Miller, 2009; Monterusso et al., 2005).
4.1.7 Cooling gains and other benefits associated with greening of urban areas
4.1.7.1 Greening strategies
According to Dimoudi and Nikolopoulou (2003), adding vegetation to urban areas with little plant cover provides significant cooling gains. In addition, a row of trees reduces the surrounding air temperature by 1°C, while creating a downtown park instead of buildings would reduce the surrounding air temperature from anywhere from 2°C to more than 6°C.
The team of Akbari and Taha (1992) used modelling to examine the potential use of vegetation and high-albedo materials (section 4.2) in four Canadian cities, including Montreal, to mitigate heat islands and minimize air conditioning and heating requirements. The results of their study indicated that increasing plant cover by 30% (corresponding to about three trees per house) and increasing the albedo of building materials by 20% (i.e. a medium albedo) could generate heating and air conditioning energy savings of 10% and 35%, respectively.
Urban Heat Island Mitigation Strategies
20 Institut national de santé publique du Québec
According to Liébard and Deherde (2005), an average temperature difference of 3.5°C can also be observed between a downtown area with little vegetation cover and neighbourhoods adjacent to a strip of vegetation 50 to 100 m wide.
As Lachance et al. (2006) observed in the Montréal Borough of Mercier-Hochelaga-Maisonneuve, in summer, an area adjacent to a vegetated zone had a surface temperature that was 6°C cooler than an area near an industrial zone with no vegetation (29°C and 35°C, respectively).
In their study (2000) carried out in Tel Aviv in summer, Shashua-Bar and Hoffman reported that urban vegetation islands 60 m wide generated a cooling effect over a 100-m radius. They also reported that the cooling range varied exponentially depending on the size of the green spaces. Other factors can help spread the cooling effect generated by vegetation, particularly wind: a large park located upwind of an urban centre, in the direction of the prevailing winds, can have a longer cooling range (Ca et al., 1998; Honjou and Takakura, 1990).
4.1.7.2 Selective planting of trees
Mature trees promote cooling through their evapotranspiration capacity and the area of shade they provide. In fact, a mature tree can lose up to 450 litres of water a day through evapotranspiration, which would be the equivalent of five air conditioners running 20 hours a day (City of Montréal, 2005; Johnston and Newton, 2004; Bolund et al., 1999).
A study carried out in Tokyo by Ca et al. (1998) demonstrated that ground surface temperature is reduced through vegetation shading. In fact, the surface temperatures recorded at noon indicated that the vegetated surface temperature of a park was 19°C lower than paved surfaces and that the air temperature 1.2 m above the ground was 2°C lower than the air temperature measured in a nearby shopping centre parking lot. Also, the presence of the park, with a surface area of 0.6 km2, reduced by nearly 1.5°C the air temperature of a commercial area located 1 km downwind, in the axis of the prevailing winds. At the same site, the temperatures recorded at night revealed that the park’s vegetated surface was cooler than the ambient air, contrary to the paved surfaces, whose temperatures were higher than the ambient air.
4.1.7.3 Greening of parking lots
A study by McPherson et al. (2001) reported that the temperature of a car shaded by vegetation is approximately 7°C lower than a car parked in the sun, while shaded asphalt pavement will be 2°C to 4°C cooler.
4.1.7.4 Vegetation around buildings
The researchers Akbari et al. (1997) studied for several months the maximum surface temperature of walls and roofs shaded by trees on two buildings located in California. The maximum surface temperature measured was 11°C to 25°C.

Urban Heat Island Mitigation Strategies
Institut national de santé publique du Québec 21
4.1.7.5 Green walls
The maximum temperature of green walls is 30°C, whereas conventional walls can reach a temperature of 60°C depending on the type of covering (Kingsbury and Dunnett, 2008). Sandifer and Givoni (2002) examined the cooling effect of Virginia creeper on a wall. They observed temperature reductions of up to 20°C compared to an unshaded wall.
Luxmore et al. (2005) modelled the cooling gains generated by the use of vegetation on buildings forming the urban canyons of a city. They concluded that the hotter and drier the city’s climate, the greater the cooling gains. That being said, cities with hot, humid climates can also benefit from green walls to lower the temperature of urban canyons by a few degrees Celsius.
4.1.7.6 Green roofs
Of all the types of roof coverings (conventional roof, roof with reflective coating, green roof), green roofs provide the greatest benefits in terms of cooling. On a sunny, 26°C day, a dark roof can reach a temperature of up to 80°C, a white roof, 45°C, and a green roof, 29°C (Fischetti, 2008; Liu and Bass, 2005).
Several studies have examined the cooling performance of green roofs. In Chicago, an intensive roof installed on the city hall has an average annual temperature that is 7°C cooler than surrounding conventional roofs, and the difference can be as high as 30°C during the hottest periods of summer (Daley, 2008). In Ottawa, Liu et al. (2002) reached similar conclusions: on a single roof, one half of which was covered with vegetation and the other half with a conventional asphalt coating, a temperature difference of 45°C was recorded on a sunny, 35°C day. Finally, in Toronto, a study that employed modelling determined that creating green roofs on 25% of the total available roof space would reduce summer air temperatures in the city by 1°C or 2°C (Ontario Ministry of Municipal Affairs and Housing, 2004).
In short, during the summer, air conditioning requirements can be reduced by installing a green roof, particularly if the original roof was not well insulated. In fact, energy use can be relatively stable up to a certain temperature. Above this critical threshold, an increase of 2°C due to urban heat islands can increase energy consumption by 5% (Bass and Baskaran, 2003).
4.2 SUSTAINABLE URBAN INFRASTRUCTURE
4.2.1 Buildings
Buildings that incorporate heat protection usually have openings equipped with shading devices, reflective materials and sometimes ingenious natural cooling systems.

Urban Heat Island Mitigation Strategies
22 Institut national de santé publique du Québec
4.2.1.1 Reflective materials
The higher the reflectivity (albedo) and emissivity of a material, the less likely it is to store heat and radiate it back into the atmosphere or into the building through the walls and roof (Paroli and Gallagher, 2008; Synnefa, 2007).
The reflectivity of a surface determines its ability to reflect solar radiation. Albedo is represented on a scale of 0 to 1. A high albedo, for example 0.70, means that the surface reflects a large amount of solar radiation. Emissivity is the property of a material to emit the energy that it accumulates. The energy that is not emitted contributes to the warming of the surfaces. The coefficient of emissivity of a material is a function of the surface condition, and in the case of a metal, the degree of oxidation. This coefficient is also expressed by a value between 0 and 1 (Table 5). A material with a low emissivity is a better thermal insulator (Liébard and DeHerde, 2005).
The roofing materials industry has recently developed high-performance roof coating products, such as elastomeric and polyurea membranes, light-coloured tiles and gravel, which all have higher albedos than conventional materials (Akbari et al., 2006). These products are available in Québec (Lalonde, 2009). The use of these materials is recommended for flat roofs only, in areas subject to the urban heat island effect, since when installed on a sloped roof, they can create glare (Nikolopoulou, 2004).
All reflective materials lose a little of their reflective effectiveness over time due to dirt deposited on the coating (USEPA, 2008b).
Table 5 Albedos and emissivity factors of various materials
Material Emissivity factor Albedo
Polished aluminum 0.1 0.9 Dirty concrete 0.9 0.2 Dark wood 0.95 0.15 Red brick 0.9 0.3 Tarnished copper 0.4 0.4 White marble 0.9 0.6 White paint 0.9 0.8 Plaster 0.9 0.9
Source: Liébard and DeHerde, 2005.
In order to increase the albedo of sloped roofs, the Lawrence Berkeley National Laboratory, in collaboration with the Oak Ridge National Laboratory, conducted research on the properties of various colour pigments. These studies revealed that certain colour pigments can reflect a high rate of close infrared radiation (which accounts for half of solar energy) (Akbarie et al., 2006). Visually, the colors of coatings composed of these pigments are similar to those of conventional roofs, but their reflective capacity is far higher (Levinson et al., 2005). These products are apparently not yet available in Québec.

Urban Heat Island Mitigation Strategies
Institut national de santé publique du Québec 23
4.2.1.2 Bioclimatic architecture
The principles of bioclimatic architecture help protect the building from overheating in summer, since they take climactic constraints into consideration. From the design of the building envelope to the orientation of the building, bioclimatic architecture makes every effort to ensure the thermal comfort of building occupants, thus protecting the most vulnerable people from heat (Liébard and DeHerde, 2005).
Building insulation and air-tightness Although insulation and air-tightness are parameters associated with cold climates, they are also essential for controlling cooling inside a building. They help prevent penetration of cold or heat into the building through the walls, roof, ground and windows, and therefore mitigate the thermal discomfort of building occupants (Déoux, 2004).
Effective building insulation is ensured when the envelope has few or no thermal bridges. Thermal bridges are flaws in the design or construction of the insulation envelope which allow heat to enter the building in summer and cold in winter. They are sources of thermal discomfort and excessive energy consumption (heating and air conditioning). There are various techniques available to locate and repair these flaws, including infrared thermography which is used to visualize the surface temperatures of a building envelope (Liébard and DeHerde, 2005).
Good building air-tightness can also minimize the penetration of hot air, but must be combined with a proper ventilation system that will ensure healthy indoor air quality and cool the ambient air at night, if this is possible (Déoux, 2004).
Thermal inertia The thermal inertia of a material measures its capacity to store heat and defer its release for a certain period of time: this is called the phase lag (Liébard and DeHerde, 2005). Inertia is characterized by the speed with which heat will penetrate a material (or diffusivity) and the capacity of the material to absorb or release the heat (or effusivity). The higher the diffusivity, the longer it will take heat to pass through the thickness of the material. The higher the effusivity, the more energy the material will absorb without substantially warming up.
To reduce the quantity of heat transmitted into a building, ideally, the materials of the building envelope will have a low diffusivity and a high effusivity.
High-inertia materials can accumulate and store excess heat, preventing heat from being transmitted to the ambient air and thus improving thermal comfort. The heat contained in high-inertia materials will be released six to ten hours after the materials begin to store the heat, i.e. toward the end of the day, when it will be possible to bring cooler air into the home (Arizona Solar Center, 2009; Hollmuller et al., 2005). Examples of materials with good thermal inertia are stone, concrete, earth and brick.
To maximize the cooling potential provided by materials with high inertia inside buildings, the high-inertia walls should ideally be placed where there is sunshine and at least 50% of the walls of the rooms should have high inertia (Oliva and Courgey, 2006). A high thermal inertia

Urban Heat Island Mitigation Strategies
24 Institut national de santé publique du Québec
helps prevent overheating by retaining the coolness of the night air throughout the day, while keeping this cool air inside the building through good insulation and good air-tightness.
Windows Windows are the weak points of a building’s thermal insulation, in both summer and winter (Armstrong et al., 2008). However, thermal insulation performance can be improved, for instance, by making the following choices:
• Smart low-e windows, which reduce the solar gain inside a building. These windows adapt to the season and to the angle of inclination of incident radiation: they allow light to pass through in winter when the sun is lower and limit solar radiation in summer when the sun is higher.
• Double- or triple-glazed windows with an air space. Air is an insulator which minimizes heat exchanges by conduction and convection. Double- or triple-glazed windows have a 16 to 20 mm air space which increases their insulation capacity. Injecting argon or krypton gas (non-flammable and non-toxic), to replace the air, offers better insulation in these windows.
• Self-adhesive plastic films that block 98% of UV radiation and 75% of thermal solar heat (Energy Film Insulation, 2008; CMHC, 2009; Manning et al., 2008; Ali, 2008).
Low solar gain windows also exist and could solve the problem of overheating in summer. However, their use would lead to a loss of solar gain in winter and therefore an increase in energy demand. A study on this issue was conducted by researchers at the NRC, in Ottawa, to compare the year-round energy performance of the two types of low-e windows: high solar gain (HSG) windows and low solar gain (LSG) windows. This study demonstrated that the use of HSG windows should be recommended in cities that record more than 3,000 degree-days Celsius (i.e. the majority of Québec cities). Also, the use of HSG windows would reduce combined heating and cooling costs by 13% to 17%, whereas LSG windows would produce savings of 8% to 10% (Manning et al., 2008).
Attention will also have to be paid to skylights. Unless they can be covered from the outside, it is strongly advised that they not be used in buildings in order to avoid the resulting greenhouse effect that may require energy-intensive air conditioning (Oliva and Courget, 2006).
In Québec climatic conditions, the ideal is to take advantage of sunlight in winter and protect against it in summer through various types of shading devices (Potvin, 2008).
Shading devices In addition to vegetation which, as mentioned earlier, is an excellent means of protecting the building envelope from direct sunlight, other solutions are available for limiting heat gains from solar radiation, namely shading devices for windows and buildings.
Shading devices are devices that are installed outside, on or around windows in order to block summer solar radiation from entering, while allowing light to enter (unlike internal shading devices). Various types of shading devices are presented in Table 6.

Urban Heat Island Mitigation Strategies
Institut national de santé publique du Québec 25
The use of fixed shading devices requires precise measurements so that the benefits of sunshine during the winter are not lost (avoid installing an awning that is too long and that will block solar radiation from entering in winter, when the sun is lower).
Although they are much less effective in protecting the inside of the building from overheating in summer, internal shading devices such as light-blocking drapes and blinds must be light-coloured and cover the entire window surface (Oliva and Courgey, 2006).

Urban Heat Island Mitigation Strategies
26 Institut national de santé publique du Québec
Table 6 Various types of external shading devices
Type of shading device Description
Fixed shading devices
Canopies Opaque, horizontal shading device integrated into the structure of the building.
Brise-soleils Composed of slats installed on a frame.
Louvers Series of fixed or movable slats installed on the façade.
Roof overhangs and balconies Also protect windows and part of the building from solar radiation.
Movable shading devices
Sun baffles Protect windows, façades or part of sidewalks from solar radiation.
Shutters Protect windows from solar radiation in summer and can be removed in winter.
Awnings Also protect windows from solar radiation in summer and can be removed in winter.
Source: Liébard and DeHerde, 2005.
4.2.2 Road infrastructure
4.2.2.1 High-albedo pavements
Pavement can account for up to 45% of a city’s surface area (USEPA, 2008b). As mentioned earlier, large urban paved areas, such as school yards, roads and parking lots, are often covered with asphalt and other dark materials which absorb most solar radiation. On hot

Urban Heat Island Mitigation Strategies
Institut national de santé publique du Québec 27
days, these surfaces can reach temperatures of 80°C, thus significantly contributing to the urban heat island effect (Asaeda et al., 1994).
In order to minimize this build-up of heat in pavement, the albedo of pavement can be increased through the following techniques:
• Reversed layer pavement systems: Asphalt roads are currently composed of approximately 85% mineral aggregates covered with 15% bitumen. One way of increasing the albedo of the asphalt is to reverse the paving process, i.e. spread a thin layer of bitumen on which high-albedo (for example 0.60) aggregate is placed. The aggregate thus exposed increases the surface’s rate of reflectivity of solar radiation, which reduces the temperature of the pavement. However, these types of pavements are not recommended for high-speed roads because aggregate chips can break loose and damage windshields.
• Coloured asphalt and coloured concrete: Adding reflective pigments to asphalt and concrete can increase their reflectivity.
• Top concrete layer (whitetopping): This involves applying a layer of concrete 2.5 cm to 10 cm thick on top of a asphalt road that is in good condition (Maillard, 2009). Since concrete has a higher albedo (0.30 to 0.40 when new), this keeps the surface temperature cooler. This method appears to be very effective and can accommodate all types of vehicles (Winkelman, 2005; Synnefa et al., 2007; Maillard, 2009).
The thickness of the pavement determines its ability to store heat; thinner surfaces are preferred for low albedos, which absorb heat (Golden and Kaloush, 2006).
4.2.2.2 Increasing the albedo of vehicle paint
As is the case for buildings and pavements, paints with a high rate of solar reflectivity are available for vehicles, and their use should be encouraged. These paints contain special pigments which increase the paint’s albedo by 17.5% on average (Ihara, 2006).
4.2.3 Characteristics of the built environment
There is a correlation between morphological indicators (roughness, built density, albedo of surfaces, urban geometry) and heat in urban environments. This relationship between urban morphology and microclimates has been established in various studies (Fouad, 2007; Pinho et al., 2003; Nikolopoulou, 2004).
Urban morphology, for instance, can create urban canyons where heat and atmospheric pollutants remain trapped. Urban planners should pay particular attention to the integrative design of cities, which takes into consideration various thermal comfort parameters based on the climate and existing morphology of cities (USEPA, 2008; USEPA, 2001).
Urban planners can promote the thermal comfort of city dwellers by incorporating the following concerns into urban planning:
• Land use planning designed to promote good wind circulation in summer is very useful in very humid cities. Combining vegetation and water installations (waterfalls, fountains and pools) with this ventilation strategy can further increase cooling.

Urban Heat Island Mitigation Strategies
28 Institut national de santé publique du Québec
• Building and protecting judiciously distributed green spaces. Urban green spaces should be properly distributed in order to facilitate access (less than 20 minutes’ walk from any residence). Ideally, they should create green passages through cities, which are easy for pedestrians to use. Large green spaces located upwind of the city in the axis of prevailing winds can also contribute to cooling of the air.
• Mixed uses, i.e. designing and building continuous paths which encourage active transport and provide access to recreational and social areas as well as to various essential services such as grocery stores. This practice also makes people less reliant on using or buying cars.
• Promoting public transit, discouraging car use and promoting a model of urban development inspired by Transit Oriented Development (TOD) (section 4.4.2.1) (USEPA, 2008b; Coutts et al., 2007; Nikolopoulou, 2004; Urbatod.org, 2009).
4.2.3.1 Access to cooling facilities
Cooling centres Access to cooling areas is sometimes essential to provide relief to city dwellers from the adverse effects of heat waves (shopping centres, schools, cultural centres or any air-conditioned public building than can accommodate the public). It is also important to provide assistance for those individuals who are unable to get to these facilities on their own (English et al., 2007; Agence de la santé et des services sociaux de Chaudière-Appalaches, 2009). Rest areas, for example air-conditioned centres or shelters, must also be available for outdoor workers (CSST, 2004).
Water installations Small water installations such as fountains, pools and ponds serve as heat buffers since they temper temperature fluctuations, thus creating microclimates. It should be noted, however, that large pools and ponds increase sound propagation and should be avoided in very noisy urban areas (Déoux, 2004).
Aquatic facilities Access to and proximity of aquatic facilities, in both the natural environment and public areas, are also essential to allow members of the public to escape the heat and cool off (Figure 6). Other facilities, such as pools and misters, also provide cooling and can be installed in parks and recreation centres. Misters are also used indoors (Raymond et al., 2006). Water derives the necessary energy for evaporation from the ambient air: the process of evaporation thus cools the ambient air.

Urban Heat Island Mitigation Strategies
Institut national de santé publique du Québec 29
Figure 6 Fountain and swimming pool
Sun protection in public areas Direct solar radiation raises our subjective perception of the temperature and has a significant impact on our thermal comfort (Watkins et al., 2007). In the same way as for buildings and infrastructures, shade helps people partially protect themselves from direct solar radiation and UV radiation responsible for skin cancer (Health Canada, 2006; Parisi et al., 2000).
4.2.4 Cooling gains and other benefits associated with sustainable urban infrastructure
4.2.4.1 Reflective roofs
A dark roof covering (with a low albedo) can reach a temperature of 50°C higher than the ambient air temperature whereas, according to Akbari et al. (2001), a roof with a high albedo will reach a maximum temperature of 10°C higher than the ambient air temperature. This surface can significantly contribute to reducing air conditioning requirements (ENERGY STAR, 2009). American studies have shown that air conditioning requirements can be reduced by 13% to 40% depending on the city (Konopacki et al., 1998). A California study established that adding high-albedo colour pigments when manufacturing roof coatings could reduce air conditioning needs by 10% and ambient heat by 1°C to 1.5°C, as well as smog by approximately 5% (Akbari and Miller, 2006). The use of reflective and low-emissivity materials makes a positive contribution to urban cooling and, consequently, improves air quality by minimizing smog formation (Taha, 1995).
A study conducted for the Greater Toronto Area estimated that air conditioning costs could be reduced by approximately $11 M (150 GW) if the city installed white roofs and adopted a greening strategy (Akbari and Konopacki, 2004). However, in Québec, the installation of such reflective coatings could result in heat losses during the cold months of the year. The NRC is currently conducting a study to determine the annual energy balance of buildings that use these types of materials. This research is being carried out in the city of Ottawa (Baskaran, 2009).

Urban Heat Island Mitigation Strategies
30 Institut national de santé publique du Québec
4.2.4.2 Reflective walls
An experiment was conducted in London to measure the temperature difference of two walls located in the same urban canyon, both receiving the same rate of solar radiation. One of the walls was constructed with a high-albedo (0.50) material while the other was constructed with a dark, low-albedo (0.03) material. Various measurements were recorded during a sunny afternoon, and the reflective surface temperature was 6°C to 10°C cooler during this period. In conclusion, if all the surfaces were more reflective, the temperature of the canyon would be reduced by 3°C to 4°C at the hottest point of the day (Watkins et al., 2007).
4.2.4.3 High-albedo pavements
A study by the Heat Island Group estimated that switching to high-albedo pavements combined with a greening strategy could reduce the ambient temperature of the city of Los Angeles by 0.6°C (Rosenfeld et al., 1998). According to a comparative study on pavement condition in several American cities, the heat of a city has a direct impact on the rate of deterioration of asphalt compounds. Lighter pavements therefore appear to have a longer life span (Pomerantz, 1999).
4.2.4.4 Water installations
Micronization techniques (spraying of micrometre-sized water droplets suspended in the air) promote cooling of the ambient air. Their effect is maximized in hot, dry climates, but can also have positive cooling effects in environments where the relative humidity is higher, particularly when cooling by air movements is possible (Liébard and DeHerde, 2005). Following the heat wave in Europe in 2003, French researchers conducted a study on the use of a mister at a geriatric centre in Marseille. The use of this device in the day room used by caregivers and residents reduced the indoor temperature by 3°C (Bonin-Guillaume et al., 2005).
4.3 SUSTAINABLE STORMWATER MANAGEMENT
A number of studies have established a correlation between soil moisture levels and the mitigation of urban heat islands. In fact, through the process of evaporation, moist soils have cooling capacities similar to vegetation, and their surface temperatures are cooler than dry soils (Lakshmi et al., 2000; Donglian and Pinker, 2004).
In order to promote soil humidification in urban environments and ensure the availability of water for plants, various sustainable stormwater management and water pollution control practices are available that are in keeping with the low impact development approach. Low impact development promotes small-scale installations that help manage stormwater at the source in order to avoid pollution due to runoff (Endreny, 2008).
In order to ensure that small-scale installations are effective and safe, various studies must first be carried out. Water table proximity, soil particle size distribution and pollution risks are some of the factors to be considered when planning measures designed to promote soil infiltration of rainwater. If the site in question contains polluted sediments (parking lots and industrial sites), then strict monitoring and maintenance must be carried out (Fuamba, 2009).

Urban Heat Island Mitigation Strategies
Institut national de santé publique du Québec 31
Conducting such studies will help prevent contamination of underground aquifers and avoid low-level infiltration which promotes increased runoff much like impermeable surfaces (Craul, 1994; Gregory et al., 2006).
4.3.1 Trees and green roofs
Water infiltration is greatly maximized through the root system of trees. The water retention capacity of trees varies by size, bark texture, season and intensity of rain events (Xiao et al., 1998). It is acknowledged that the greening of urban areas and the installation of green roofs improve air quality, reduce the ambient temperature (evapotranspiration) and reduce air conditioning energy demand (Niachou, 2001; Ryerson University, 2005). Planting of vegetation can also capture a large quantity of rainwater (Gill et al., 2007; DeNardo et al., 2005). Green roofs have characteristics that influence their water retention capacity, including substrate depth, roof slope, type of plants and intensity of precipitation (Oberndorfer et al., 2007).
4.3.2 Permeable surfaces
Permeable surfaces allow water to percolate through pavement or vegetation and reach a substrate layer that facilitates deep infiltration (Albanese and Matlack, 1999). A layer of gravel on top of soil has long been used as a permeable surface. This type of surface facilitates infiltration of water into the soil if the soil is not too compacted, but this approach is not frequently used in urban areas (Gilbert and Clausen, 2006).
There are several other types of permeable surfaces, including:
• Impermeable interlocking paving stones, which allow rainwater to percolate through permeable joints (Figure 7). This type of surface is used in school yards, pedestrian streets, parks, pedestrian walkways, bicycle paths, parking lots, etc. It is not suitable for airports or highways, since it is vulnerable to sudden braking and heavy weights.
• Porous concrete paving stones allow water to flow through small cavities. This type of pavement is obtained using a concrete mix to which no aggregate is added. Maintenance involves cleaning with a power washer or vacuum in order to release any substances that might clog the cavities. It is recommended for use on pedestrian paths, since the lack of strong joints does not confer very good mechanical resistance to the paving stones.
• Grid systems: the grids can be filled with soil that allows grass to planted on the surface, facilitating infiltration of water into the soil. They can support heavy loads and are therefore suitable for parking lots (Figure 8) (Communauté urbaine de Lyon, 2008; USEPA, 2008b).

Urban Heat Island Mitigation Strategies
32 Institut national de santé publique du Québec
Figure 7 Impermeable paving stones with permeable joints. Pedestrian areas with paving stones that allow water percolation
Permeable surfaces require regular maintenance and specific practices in order to prevent contamination of the water table and clogging. For instance, de-icing salt and sand should not be used on this type of surface (Communauté urbaine de Lyon, 2008).
Figure 8 Vegetated parking area
4.3.3 Rain gardens
A low-cost rain garden can be built to prevent rainwater runoff from the roof, the various impermeable surfaces of the building and its perimeter from being directed into the stormwater drainage system. For small and medium-sized residential buildings, rain gardens have many advantages and are relatively easy to build. They reduce runoff and increase the rate of soil humidification as well as facilitating water percolation for water table regeneration (Frazer, 2005; USEPA, 2007).

Urban Heat Island Mitigation Strategies
Institut national de santé publique du Québec 33
According to the CMHC (2005), a rain garden is “a planted or stone-covered bed specifically designed to receive stormwater and allow it to be slowly absorbed into the soil (infiltration).” Rain garden dimensions will depend on the volume of water they are intended to handle. They should be laid out as follows: length greater than width and oriented perpendicular to the slope. The garden should be composed of stones and plants resistant to both wet and dry conditions. Cattails, spirea, ferns and Eupatoriums are plants particularly suited to this type of installation (Smeesters, 2008).
4.3.4 Retention ponds
Retention ponds are similar to rain gardens, but larger. A retention pond consists of a depression excavated in the ground, which receives runoff and allows it to infiltrate into the soil (USEPA, 1997). There are two types of retention ponds: wet retention ponds, which permanently contain stagnant water, and dry retention ponds. This type of installation also provides other benefits, such as creating vegetated landscapes, even play areas and recreational spaces (dry ponds) in urban areas. These ponds can be designed to minimize environmental pollution, for example by incorporating settling tanks and filtering aquatic plants into the design, particularly for parking lots and industrial sites (Yamada et al., 2001).
4.3.5 Infiltration trenches (or soaking trenches)
Runoff can also be collected in infiltration trenches. These linear, shallow (1 m) trenches are covered with a permeable surface of pebbles or sod. They can also serve as access routes for cars or pedestrians. This type of installation integrates well into the urban landscape, since it occupies little space. Regular maintenance is important in order to prevent sedimentation of the infiltration trench and extend its lifespan (PortlandOnline, 2004).
4.3.6 Dry wells
Dry wells receive runoff and allow this water to infiltrate into the soil. Most of the space within these wells is taken up by a settling medium composed of gravel and sand, with outlets around the periphery which allow the water to infiltrate into the soil. Dry wells are used primarily to receive roof runoff. They are simple in design and take up a small surface area (Grand Toulouse communauté urbaine, 2008).
4.3.7 Reservoir pavement structures
Reservoir pavement structures promote water infiltration at the source. They are permeable to water and air, require no additional space and integrate well into the urban environment. Since they have a lower density and a higher albedo than asphalt, porous surfaces of this type store less heat. However, these types of surfaces must be carefully maintained because they can tend to become clogged. To ensure good permeability, the pavement must be regularly cleaned with a power washer or vacuum (Grand Toulouse communauté urbaine, 2008). It should be noted that the Québec climate can adversely affect the performance of pavements of this type during spring snowmelt. In fact, the presence of ice in the pavement cavities can prevent water infiltration during the seasonal thaw (Backtröm and Viklander, 2000).

Urban Heat Island Mitigation Strategies
34 Institut national de santé publique du Québec
4.3.8 Watering impermeable pavements with recycled water
Through the evaporation process, spraying impermeable paved surfaces is an effective means of reducing the temperature of asphalt surfaces, whether permeable or not (Asaeda et al., 1994).
4.3.9 Cooling gains and other benefits related to stormwater management
During this review, we found very few articles dealing with cooling methods using soil humidification in urban environments. Research on stormwater management facilities deals primarily with the quantity of water retained at the source. We found one Swedish study dealing with stormwater management measures suitable for cold climates. It was found that porous surfaces, infiltration trenches, rain gardens and retention ponds are very well adapted to the Swedish climate, which, like the Québec climate, is characterized by periods of freezing temperatures during winter (Backtröm and Viklander, 2000).
4.3.9.1 Trees and green roofs
Based on an extrapolation of the potential for precipitation interception by public trees in the city of Montréal, it was concluded that trees currently capture approximately 2.2% of rainwater (Vergriete and Labrecque, 2007). Another study estimated the rainwater retention capacity of a 10 cm thick green roof to be approximately 60% (Moran et al., 2007). Rainwater retention appears to range from 25% to 50% for thinner substrates. According to the literature, extensive roofs can retain a maximum of 45% of rainwater, while intensive roofs retain up to 75% (Carter and Keeler, 2008). A modelling study concluded that if 10% of the roofs in Brussels were green roofs, total runoff would be reduced by 2.7% (Mentens et al., 2006).
4.3.9.2 Infiltration wells
Infiltration wells help reduce rainwater runoff by up to 90%. Their filtering capacity removes contaminants such as hydrocarbons and metals from the water (James, 2002; Albanese and Matlack, 1999).
4.3.9.3 Permeable surfaces
According to the Milwaukee Metropolitan Sewerage District (2007), permeable and porous pavements allow 70% to 80% infiltration of annual rainfall. In addition, a comparative study of three types of driveway surfaces (asphalt, permeable pavers and crushed stone) concluded that permeable pavers are more effective in filtering pollutants, resulting in less polluted runoff (Gilbert and Clausen, 2006).
4.3.9.4 Watering pavements with recycled water
According to a study conducted in Tokyo, the cooling gain from watering asphalt-paved streets with recycled water is 8°C during the day and 3°C at night. The temperatures of pavements after watering were the same as the temperature of neighbouring vegetated areas (Yamagata et al., 2008).
Urban Heat Island Mitigation Strategies
Institut national de santé publique du Québec 35
4.4 REDUCING ANTHROPOGENIC HEAT
4.4.1 Controlling heat production in buildings
Heat production inside a building contributes to overheating of the building in summer, particularly when added to direct solar radiation or poor thermal insulation of the building. According to an analysis by Taha (1997), anthropogenic heat can be responsible for a 2°C to 3°C increase in urban centres. Household appliances, light bulbs and computers, for example, convert much of the energy they consume into heat. These indoor heat gains are not simultaneous, but rather represent a source of diffuse heat in buildings.
4.4.1.1 Artificial lighting and natural light
Lighting contributes to indoor heat gains. Halogen and incandescent bulbs produce significant heat which, by radiation or convection, is absorbed by the walls and surrounding materials. When the heat storage capacities of the walls and materials are reached, this heat is diffused back into the ambient air. For example, a 500 W halogen bulb uses only 6% of the electricity that it consumes to produce light, the rest is dissipated in the form of heat (Salomon and Aubert, 2004). Using energy-efficient compact fluorescent bulbs helps reduce the quantity of heat dissipated. This type of bulb consumes five times less energy and lasts ten times longer than an incandescent bulb, while providing the same amount of lighting. However, caution must be exercised when disposing of these bulbs because they contain mercury. They must be returned to a retailer that provides a proper recycling service (Gagné et al., 2008).
Another way of controlling heat gains from artificial lighting is to regulate use. Various methods are available to achieve this, including:
• luminous flux control: continuous adjustment of artificial lighting based on the amount of natural light coming from outside;
• programmable timers: hourly control of lighting in locations where light requirements are fixed (businesses, office buildings, schools);
• pre-set timer switches: devices that turn the lighting off after a specified delay in infrequently used locations;
• motion or occupancy sensors: devices that turn on the lighting only when the premises are occupied;
• photosensors: devices, installed in a room or on a building, that measure the natural lighting and adjust artificial lighting needs only when required (Levy, 1978; Liébard and DeHerde, 2005).
Certain buildings, such as hospitals and schools, also benefit from maximizing the use of natural light (except in facilities where constant lighting is required, such as laboratories). Natural lighting and the view of the outside landscape apparently have a positive effect on patient recovery and the academic success of children. However, windows and other openings that allow in natural light must be equipped with shading devices in order to protect building occupants from direct solar radiation (Liébard and DeHerde, 2005).

Urban Heat Island Mitigation Strategies
36 Institut national de santé publique du Québec
Also, when designing new buildings, optimization of natural light should be incorporated in the design in order to reduce dependence on artificial lighting. This requires a study on the site’s lighting capacity by season at the start of the design process (Salomon and Aubert, 2003).
4.4.1.2 Office equipment
All electrical devices give off heat, even when in sleep mode. The use of energy-efficient computer equipment is therefore strongly recommended. In addition, in order to minimize the unnecessary generation of heat, it is important to turn off and unplug devices when they are not being used. A desktop computer with a cathode ray type monitor can increase room temperature by 3°C in a day. Laptop computers and flat screen monitors give off up to ten times more heat than older CRT monitors (Natural Resources Canada, 2009; Salomon and Aubert, 2003).
4.4.1.3 Household appliances
Urban heat islands have an impact on energy demand, particularly because of air conditioning and refrigeration. Increased demand can be so high than it can overload the electrical grid and cause a blackout, as occurred in New York on July 17, 2006. This power failure lasted more than five days, plunging city dwellers into conditions of extreme thermal discomfort. In order to prevent such situations, it is recommended that appliances certified as energy efficient be chosen (Gagné et al., 2008).
Generation of heat inside buildings quickly heats up the ambient air, especially if the buildings are constructed with low-inertia materials (that cannot absorb much heat). On hot days, the use of household appliances such as dishwashers, washing machines and clothes dryers should be minimized as much as as possible: turn on only when full and use energy-saving modes (e.g. washing laundry at 30°C requires only a half or a third as much energy as washing at 60°C) (ADEME, 2009).
4.4.2 Reducing the number of vehicles in urban areas
Cars and other motor vehicles contribute to heat emission in urban areas. The total heat emitted by vehicles can remain trapped in poorly ventilated urban canyons, thereby reducing the thermal comfort of city dwellers. Vehicle emissions also contribute to urban smog formation and global warming (Watkins et al., 2007; Younger et al., 2008; CAPE, 1995). Good transportation planning is essential in order to minimize heat gains in urban environments (Coutts et al., 2008).
4.4.2.1 Densifying urban centres and controlling urban sprawl
Densification of urban centres can reduce vehicle use and incidentally heat production and air pollution, since it reduces travel distance in addition to providing more choices in terms of modes of transportation and reduces the need to own a car (Coutts et al., 2008).

Urban Heat Island Mitigation Strategies
Institut national de santé publique du Québec 37
The concept of Transit Oriented Development (TOD) can serve as a guide for urban development that encourages general use of public transit: TOD advocates developing dense, multi-purpose neighbourhoods around mass transit hubs. This concept promotes certain principles and objectives, such as quality of life, diversity and accessibility – both residential and commercial, public spaces, forms of soft mobility, diversity of functions creating constant activity, proximity services (Urbatod, 2009).
4.4.2.2 Mixed-use development
A number of studies have shown that mixed-use development, i.e. where different uses exist in close proximity, reduces vehicle traffic. In residential areas, neighbourhoods in which businesses are accessible on foot have less road traffic than neighbourhoods without businesses, where travel by car is inevitable (Boarnet and Crane, 2001; Fischler and Lewis, 2005; Vivre en ville, 2004).
4.4.2.3 Restricting motor vehicle access
One potential solution for lowering temperatures in urban areas is to restrict vehicle access and traffic. Various methods are available to achieve this:
• controlling the influx of vehicles by means of traffic restrictions on hot days;
• raising parking rates in the city;
• introducing tolls in specific areas of the city and gradually reducing parking spaces;
• building parking lots near public transit terminals aimed at the suburban population. These parking lots will make it easier for commuters to leave their cars in the suburbs and reduce vehicle traffic in city;
• providing free access to public transit during heat wave alerts (Déoux, 2004; Vivre en ville, 2004; Cappe, 2003).
These measures can be combined with public transit services and active transport, including tramways, buses and bicycles (rental service) (Vivre en ville, 2004).
4.4.2.4 Public transit
A car consumes twice as much energy per passenger per kilometre as a train and four times more than a bus. In urban centres with inadequate public transit infrastructure, the heat and air pollution impacts associated with increased reliance on cars are inevitable. Public transport services that meet consumer needs (subways, buses) and are easy to use, or even free, will help reduce the adverse effects of individual transport. In addition, the use of more energy-efficient and lower-polluting vehicles can improve air quality and contribute to urban heat island mitigation strategies (Vivre en ville, 2004).

Urban Heat Island Mitigation Strategies
38 Institut national de santé publique du Québec
4.4.2.5 Active transport
The development of infrastructure that makes it easier for people to get around by bicycle or on foot should also be encouraged, since active transport not only helps reduce anthropogenic heat related to motorized transport, but is also beneficial to human health by encouraging physical activity (Health Scotland et al., 2008). In fact, by improving the health of users, health care savings would be nearly three times higher than the investment needed to develop this infrastructure (Wang, et al., 2004; CAPE, 1995). In addition, amenities such as bicycle paths and pedestrian streets are sites suitable for planting vegetation and for incorporating sustainable stormwater management measures that contribute to heat island mitigation. In order to encourage active transport, bicycle lanes with safety features should be incorporated when urban roads are upgraded or redeveloped (Déoux, 2004).
According to Wendel et al. (2008), particular attention should be paid to the design of bicycle paths and pedestrian streets. For public safety reasons, these facilities should be adapted, for example, to the needs of children, the elderly, persons with reduced mobility and low-income individuals who do not own a personal vehicle (Wendel et al., 2008). In addition, when planting vegetation, certain safety rules should be followed, such as maintaining good visibility and facilitating police surveillance. In fact, according to Horrobin (2008), densely planted vegetation can create hidden spaces conducive to loitering, vandalism and various crimes.
4.4.3 Passive buildings: controlling air conditioning demand
In 2000, more than 75% of commercial and institutional buildings in Canada were either fully or partially air conditioned. In addition, there appears to be a high correlation between the year of construction of a building and whether or not it is equipped with air conditioning. In fact, 80% of buildings constructed in the 1990s were equipped with air conditioners (Statistics Canada, 2002). Furthermore, air conditioning of homes and vehicles is becoming more common, and indeed is almost the norm in some areas. There are alternative, more energy-efficient and more sustainable solutions for cooling the indoor air of buildings. In fact, various passive air conditioning techniques can be used to cool a building that was not designed to protect itself from very high temperatures.
4.4.3.1 Ventilation
Ventilation can be provided by natural (natural ventilation) or mechanical means (supply ventilation or exhaust ventilation). In order for building occupants to feel comfortable when temperatures are moderate, the air flow rate should be approximately 0.2 m/s. As temperatures and humidity increase, ventilation could be increased in order to provide relief to building occupants. In fact, the air flow rate influences heat exchange by convection and increases evaporative cooling of the skin (Watkins and Kolokotroni, 2007).
Natural ventilation There are two types of natural ventilation: cross ventilation and natural exhaust ventilation or night ventilation. Cross ventilation is achieved by opening windows or doors located on opposite walls, which allows air to circulate in the rooms. The greater the temperature
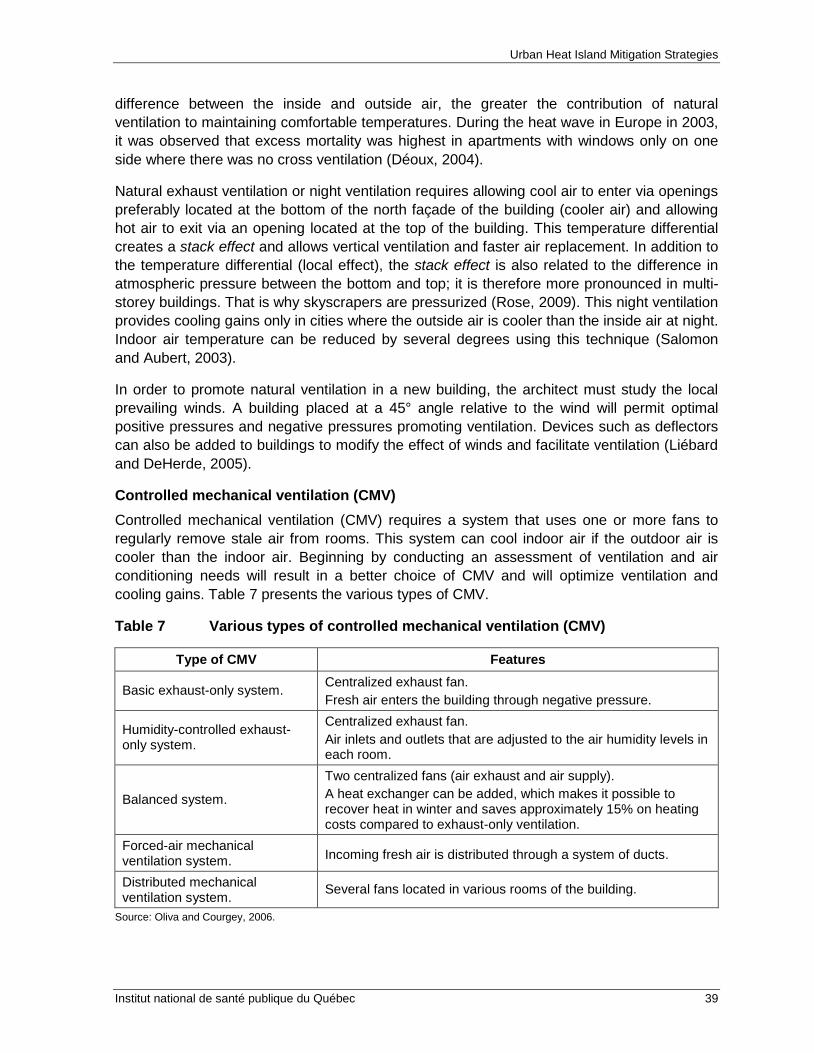
Urban Heat Island Mitigation Strategies
Institut national de santé publique du Québec 39
difference between the inside and outside air, the greater the contribution of natural ventilation to maintaining comfortable temperatures. During the heat wave in Europe in 2003, it was observed that excess mortality was highest in apartments with windows only on one side where there was no cross ventilation (Déoux, 2004).
Natural exhaust ventilation or night ventilation requires allowing cool air to enter via openings preferably located at the bottom of the north façade of the building (cooler air) and allowing hot air to exit via an opening located at the top of the building. This temperature differential creates a stack effect and allows vertical ventilation and faster air replacement. In addition to the temperature differential (local effect), the stack effect is also related to the difference in atmospheric pressure between the bottom and top; it is therefore more pronounced in multi-storey buildings. That is why skyscrapers are pressurized (Rose, 2009). This night ventilation provides cooling gains only in cities where the outside air is cooler than the inside air at night. Indoor air temperature can be reduced by several degrees using this technique (Salomon and Aubert, 2003).
In order to promote natural ventilation in a new building, the architect must study the local prevailing winds. A building placed at a 45° angle relative to the wind will permit optimal positive pressures and negative pressures promoting ventilation. Devices such as deflectors can also be added to buildings to modify the effect of winds and facilitate ventilation (Liébard and DeHerde, 2005).
Controlled mechanical ventilation (CMV) Controlled mechanical ventilation (CMV) requires a system that uses one or more fans to regularly remove stale air from rooms. This system can cool indoor air if the outdoor air is cooler than the indoor air. Beginning by conducting an assessment of ventilation and air conditioning needs will result in a better choice of CMV and will optimize ventilation and cooling gains. Table 7 presents the various types of CMV.
Table 7 Various types of controlled mechanical ventilation (CMV)
Type of CMV Features
Basic exhaust-only system. Centralized exhaust fan. Fresh air enters the building through negative pressure.
Humidity-controlled exhaust-only system.
Centralized exhaust fan. Air inlets and outlets that are adjusted to the air humidity levels in each room.
Balanced system.
Two centralized fans (air exhaust and air supply). A heat exchanger can be added, which makes it possible to recover heat in winter and saves approximately 15% on heating costs compared to exhaust-only ventilation.
Forced-air mechanical ventilation system. Incoming fresh air is distributed through a system of ducts.
Distributed mechanical ventilation system. Several fans located in various rooms of the building.
Source: Oliva and Courgey, 2006.

Urban Heat Island Mitigation Strategies
40 Institut national de santé publique du Québec
Ceiling fans and floor fans Floor fans and ceiling fans can be used to accelerate air flow. In humid climates, ceiling fans are effective in providing cooling through convection (Liébard and DeHerde, 2005).
4.4.3.2 Solar cooling systems
It is possible to use heating-cooling systems that use renewable energy sources. As Déoux (2004) explains, solar energy collected by solar collectors can provide the low-temperature (80-120°C) heat source used by absorption machines, which are promising alternatives to conventional compression machines used in air conditioning. This concept is still new in Québec, but it has been around in Europe for nearly 20 years (Rose, 2009). Absorption machines are in fact the most common type of cooling system in Europe. They work on the following principle: Thermal compression is obtained by using a liquid refrigerant-sorbent solution and a heat source (obtained through solar energy) which replaces the electric power consumption of the mechanical compressor. For chilled water above 0°C, as is used in air conditioning, a liquid water-lithium bromide (H2O-LiBr) solution is used, with water serving as the refrigerant. Most systems use a solution pump, which consumes very little electricity. In a H2O-LiBr system, crystallization of the solution must be avoided through internal control of the cooling circuit temperature (Rhônalpénergie Environnement, 2009).
These absorption systems can also be powered by heat recovery (waste heat, exhaust gases, etc.). In addition, they are very quiet and environmentally friendly, since they do not use refrigerants (Salomon and Aubert, 2003).
4.4.3.3 Geothermal heat exchangers (or ground source heat pumps)
Geothermal heat exchangers passively capture geothermal energy from the ground through controlled mechanical ventilation. The principle is based on installation of a tube in the ground at a depth of 1 m or 2 m. For optimal efficiency, the tube must at least 25 m long and approximately 180 mm in diameter. A sensor allows the air to enter the tube, where it is cooled as a result of the lower temperature of the ground, and then pumped back into the building. This system can also be used for winter heating. The tubing must facilitate effective removal of water condensation in order to avoid problems with moulds that would otherwise affect indoor air quality (Rose, 2009). Condensation problems can be avoided by installing the tube on an incline and installing a siphon which recovers the condensates (Figure 9) (Baldos, 2007). Geothermal heat exchangers installed during building construction can provide passive cooling at relatively low cost.

Urban Heat Island Mitigation Strategies
Institut national de santé publique du Québec 41
Figure 9 Cross-section of a ground-coupled
heat exchanger Source: Adapted from Baldos, 2007.
4.4.3.4 Radiant cooling system
Radiant cooling systems are composed of tubes of cool water (19°C) used to distribute cooling in the walls of a building. The water in these tubes is circulated by means of a pump. The air conditioning effect comes from the radiation of heat from the human body to the surface of the walls, floor or roof which are cooled by the system of water tubes. To maximize cooling capacity, a ventilation system will be used in conjunction with the cooling system to control the humidity level and indoor air quality.
Once installed, the cooling system is relatively simple to operate. It is more energy efficient than conventional air conditioning. However, in order to prevent a high level of humidity from interfering with proper operation of the system, an air dehumidifier is required (Oliva and Courgey, 2006). This system can also be used in floors. However, to avoid the risk of condensation, the temperature of the water cannot be too low (Déoux, 2004).
4.4.4 Cooling gains associated with passive air conditioning
Solar air conditioning can provide cooling in the range of 7°C to 12°C, while geothermal heat exchangers combined with a forced air system cool the ambient air by 5°C to 8°C and can reduce the indoor air temperature of a building by 3°C or more (Déoux, 2004).
The air flow created by ventilation improves the thermal comfort of a building’s occupants. The higher the air flow rate, the greater the cooling effect (Table 8).

Urban Heat Island Mitigation Strategies
42 Institut national de santé publique du Québec
Table 8 Cooling in °C by air flow rate (m/s)
Air flow rate (m/s) Cooling equivalent in °C 0.1 0 0.3 1 0.7 2 1.0 3 1.6 4 2.2 5 3.0 6 4.5 7 6.5 8
Source: Osborne, 1956.
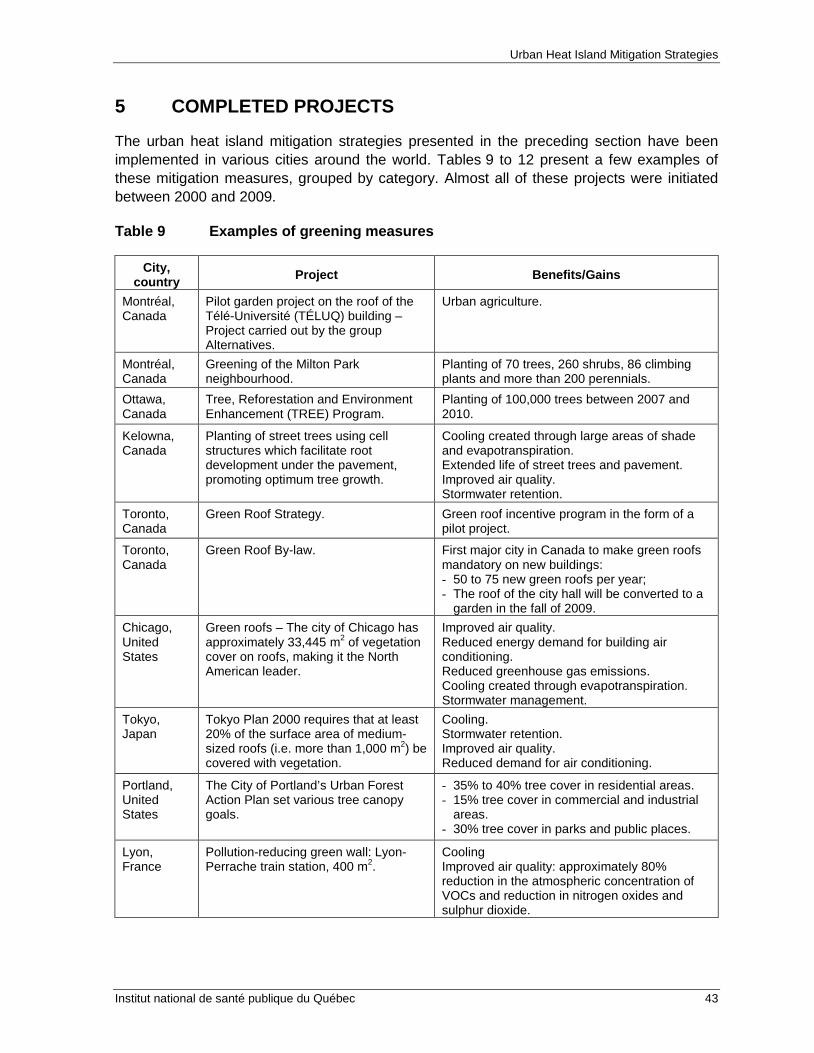
Urban Heat Island Mitigation Strategies
Institut national de santé publique du Québec 43
5 COMPLETED PROJECTS
The urban heat island mitigation strategies presented in the preceding section have been implemented in various cities around the world. Tables 9 to 12 present a few examples of these mitigation measures, grouped by category. Almost all of these projects were initiated between 2000 and 2009.
Table 9 Examples of greening measures
City, country Project Benefits/Gains
Montréal, Canada
Pilot garden project on the roof of the Télé-Université (TÉLUQ) building – Project carried out by the group Alternatives.
Urban agriculture.
Montréal, Canada
Greening of the Milton Park neighbourhood.
Planting of 70 trees, 260 shrubs, 86 climbing plants and more than 200 perennials.
Ottawa, Canada
Tree, Reforestation and Environment Enhancement (TREE) Program.
Planting of 100,000 trees between 2007 and 2010.
Kelowna, Canada
Planting of street trees using cell structures which facilitate root development under the pavement, promoting optimum tree growth.
Cooling created through large areas of shade and evapotranspiration. Extended life of street trees and pavement. Improved air quality. Stormwater retention.
Toronto, Canada
Green Roof Strategy. Green roof incentive program in the form of a pilot project.
Toronto, Canada
Green Roof By-law. First major city in Canada to make green roofs mandatory on new buildings: - 50 to 75 new green roofs per year; - The roof of the city hall will be converted to a
garden in the fall of 2009. Chicago, United States
Green roofs – The city of Chicago has approximately 33,445 m2 of vegetation cover on roofs, making it the North American leader.
Improved air quality. Reduced energy demand for building air conditioning. Reduced greenhouse gas emissions. Cooling created through evapotranspiration. Stormwater management.
Tokyo, Japan
Tokyo Plan 2000 requires that at least 20% of the surface area of medium-sized roofs (i.e. more than 1,000 m2) be covered with vegetation.
Cooling. Stormwater retention. Improved air quality. Reduced demand for air conditioning.
Portland, United States
The City of Portland’s Urban Forest Action Plan set various tree canopy goals.
- 35% to 40% tree cover in residential areas. - 15% tree cover in commercial and industrial
areas. - 30% tree cover in parks and public places.
Lyon, France
Pollution-reducing green wall: Lyon-Perrache train station, 400 m2.
Cooling Improved air quality: approximately 80% reduction in the atmospheric concentration of VOCs and reduction in nitrogen oxides and sulphur dioxide.

Urban Heat Island Mitigation Strategies
44 Institut national de santé publique du Québec
Table 10 Examples of measures related to the design of sustainable urban infrastructure
City, country Project Benefits/Gains
Montréal, Canada
Reflective roof: Collège de Rosemont. - 3,125 m2 of white roof. - Representing 22% of the total surface
area of 14,150 m2.
Reduced indoor and outdoor air temperature.
Montréal, Canada
Benny Farm project: - Renovation of a private seniors’
residential complex. - Use of renewable energy (geothermal
energy; solar energy) and upgraded building insulation.
Reduced greenhouse gas emissions related to air conditioning. Reduced energy demand and reduced anthropogenic heat.
California, United States
Effective July 2009, the California Building. Energy Code requires that roofs have a minimum albedo of 0.15 or 0.20 depending on various characteristics, including roof angle.
Reduced indoor and outdoor air temperature. Reduced energy demand. Reduced greenhouse gas emissions.
Table 11 Examples of sustainable stormwater management measures
City, country Project Benefits/Gains
Lorraine, Canada
60 cm retention ditches along city streets.
Reduced municipal taxes. Reduced costs related to management of the stormwater drainage system.
Boucherville, Canada
Treatment wetland in Vincent-d’Indy Park.
Natural filtration of runoff. Recreation: trails and skating rinks in winter.
Montréal, Canada
Retention pond on the site of La TOHU – Cité des arts du cirque.
Reduced demand for potable water (the water is dissipated by evaporation or percolation and used for site watering needs). Cooling provided by evaporation and evapotranspiration.
Portland, United States
Rain gardens – Oregon Museum of Science and Industry.
Site of approximately 73,000 m2. Network of 10 rain gardens. Paths with signs to raise visitor awareness.
Kansas, United States
10,000 Rain Gardens initiative with the goal of creating 10,000 rain gardens in order to promote sustainable stormwater management.
Increased stormwater retention at the source. Planting of rain gardens and increased cooling through evaporation of moist soil and evapotranspiration of vegetation. Reduced demand for potable water for irrigation of the gardens.
Dearborn, United States
Green roof at the Ford plant, world’s largest green roof: 42,178 m2.
Rainwater retention capacity: 1,700 m3/year. Roof lifespan: 50 years. Reduced building energy demand: 25%/year.

Urban Heat Island Mitigation Strategies
Institut national de santé publique du Québec 45
Table 12 Examples of anthropogenic heat reduction measures
City, country
Project Benefits/Gains
Québec City, Canada
La rue pour tous! campaign by Vélo Québec.
Encourage pedestrians, cyclists and motorists to share the road. Adoption of a courteous and respectful attitude toward other users of the road, particularly the most vulnerable. Increased safety for children near schools.
Ottawa, Canada
O’Train: light rain transit – 8,000 trips per day.
Improved air quality by reducing polluting emissions from vehicles. Reduced anthropogenic heat.
Sherbrooke, Canada
Moi j'embarque au centre-ville! Program.
Will allow 6,650 downtown workers to travel to work by bus free of charge for one year.
Province of Québec, Canada
Novoclimat certification: - Optimized ventilation system. - Upgraded insulation.
Improved building energy performance (minimum 25%).
Canada EQuilibrium: Healthy Housing for a Healthy Environment. - Six pilot projects carried out and
open to visitors year round.
National initiative aimed at promoting sustainable construction projects that are highly energy efficient and have a low impact on the environment. These are zero energy consumption homes: they produce as much energy as they consume.
Portland, United States
Fareless Square. Free public transit in the downtown.
Free transit zone covering the urban area between the Willamette River and the Interstate 405 and between Union Station and Portland State University. In 2001, the fare-free zone was extended to include the Lloyd District to the east of the city.
Copenhagen, Denmark
The city has a network of very safe bicycle paths. 2012 objective: to have 40% of residents using this means of transport to get to work.
Approximately 34% of residents use bicycles to get to work. The number of kilometres travelled by these cyclists represents emissions avoidance of 90,000 tonnes of CO2/year, which would have been generated by equivalent travel by car.
London, England
Congestion charge introduced in 2003 for vehicles entering the city core.
Net revenues invested in improving public transit. Improved environment for pedestrians and cyclists. 20% reduction in traffic during the hours when the charge is in effect. Reduced emissions of 100,000 tonnes of CO2/year.
Freiburg im Breisgau, Germany
30 km/h speed limit. Two tramways serve the city. Reduced prices for public transit. More than 500 km of bicycle paths.
Reduced anthropogenic heat. Improved air quality. Reduced CO2 emissions.
Paris, Nice, Grenoble and Nantes, France
Pedicabs Electric-assist vehicles.
Reduced production of anthropogenic heat due to transport. Reduced atmospheric pollution.
Paris, France
Vélib’ - Bicycle rental service. - More than 20,000 bicycles and
1,451 stations. - More than 350 km of bicycle paths.
Reduced emissions of approximately 30,000 tonnes of CO2/year. Reduced anthropogenic heat. Improved air quality.
France, Canada, Italy, United States
Electric buses in service in various cities around the world.
Six- to eight-fold reduction in GHG emissions. Zero direct emissions. Reduced anthropogenic heat and atmospheric pollution.
Sources: Boucher, 2006; City of Ottawa, 2008; Wilson and Barton, 2008; City of Toronto, 2009; City of Chicago, 2008; Portland Parks and Recreation, 2007; Grand Lyon Communauté urbaine, 2009; Communauté urbaine de Lyon, 2009; Boucher, 2007; USEPA, 2007; USEPA, 2008b; École Polytechnique de Montréal, 2005; Canada Lands Company, 2009; California Energy Commission, 2009.


Urban Heat Island Mitigation Strategies
Institut national de santé publique du Québec 47
6 SUMMARY AND COMPARISON OF URBAN HEAT ISLAND MITIGATION STRATEGIES
6.1 EXAMPLES OF THE APPLICATION OF URBAN HEAT ISLAND MITIGATION STRATEGIES
Simultaneous use of several urban heat island mitigation measures has a greater impact in lowering urban temperatures. For example, using a combination of complementary measures provides better overall protection of the building envelope from solar radiation, which improves thermal comfort in the building.
Examples of applications in terms of buildings and urban planning and development are presented in section 6.1.1 and section 6.1.2, respectively. Figures 10 and 11 show all the possible mitigation measures.
With the goal of minimizing overheating in summer, the application examples consider the following requirements:
• maintain a cool microclimate around the building and in urban areas; • control solar gain; • reduce anthropogenic heat in the building and in urban areas; • maintain a comfortable thermal environment for building occupants.
These examples also consider a few variables, including the climate of the urban areas, whether planting of vegetation is a feasible option and the density of the built environment.

Urban Heat Island Mitigation Strategies
48 Institut national de santé publique du Québec
6.1.1 Buildings
Figure 10 Schematic diagram of urban heat island mitigation strategies involving buildings
Building
Protect from solar radiation
Minimize heat infiltration
Planting of vegetation Shading devices Building envelope
Green roofs
Green walls
Fixed
Movable
Optimum insulation
Airtightness
Vegetation around buildings
Reflective materials
Thermal inertia
Reduce anthropogenic
heat
Energy efficiency
Energy-efficient lighting
Energy-efficient
household appliances
Energy-efficient office
equipment
Maintain comfortable thermal environment
Alternatives to air conditioning
Ground-coupled heat exchanger
Natural and controlled
mechanical ventilation
Radiant cooling system
Solar cooling

Urban Heat Island Mitigation Strategies
Institut national de santé publique du Québec 49
Cooling
Upgraded insulation
Excellent air-
tightness
High-inertia
materials
High-performance
windows Shading devices
for windows
Compact fluorescent light bulbs
CMV
Permeable pavements
Cooling
Green roof
CMV
Permeable pavements
Green walls
Shading devices
Compact fluorescent
bulbs
Cooling
Vegetation around the
building
CMV
Rain garden
Mature trees
Reflective roofs
Energy-efficient
appliances
Radiant cooling
Application example 1: Hot, humid summer climate, night-time heat island and planting vegetation around the building is a feasible option
• Cool microclimate around the building Vegetation around the building + rain garden.
• Solar gain control Mature deciduous trees + reflective roof.
• Reduced anthropogenic heat Energy-efficient household appliances.
• Thermal comfort of occupants Controlled mechanical ventilation.
Application example 2: Hot, humid summer climate, night-time heat island and planting vegetation around the building is not a feasible option
• Cool microclimate around the building Green walls + green roof + permeable pavements.
• Solar gain control Shading devices for windows and roof overhangs.
• Reduced anthropogenic heat Compact fluorescent light bulbs.
• Thermal comfort of occupants Controlled mechanical ventilation.
Application example 3: Hot, humid summer climate, cool nights (night ventilation possible) and planting vegetation around the building is not a feasible option
• Solar gain control: Shading devices for windows/roof overhang.
• Cool microclimate around the building: Permeable pavements.
• Reduced anthropogenic heat: Compact fluorescent light bulbs.
• Thermal comfort of occupants: Controlled mechanical ventilation + upgraded insulation + air-tightness + high inertia of materials+ high-performance windows.
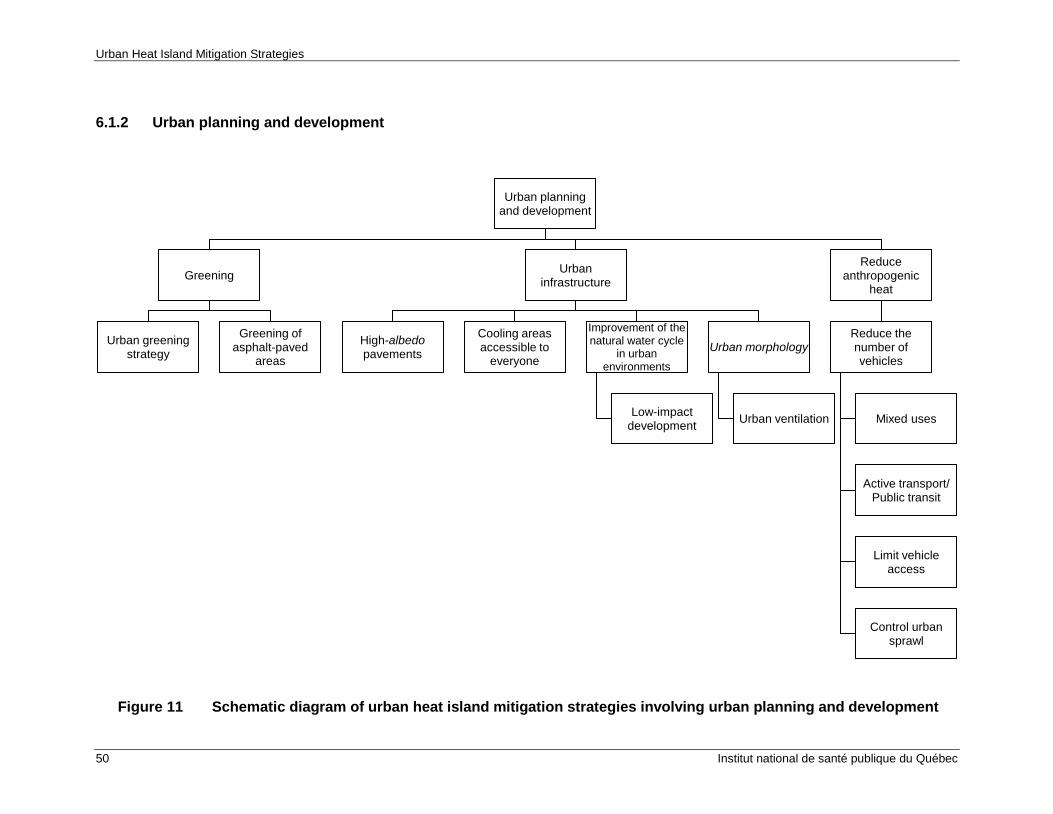
Urban Heat Island Mitigation Strategies
50 Institut national de santé publique du Québec
6.1.2 Urban planning and development
Figure 11 Schematic diagram of urban heat island mitigation strategies involving urban planning and development
Urban planning and development
Greening
Urban greening strategy
Greening of asphalt-paved
areas
Urban infrastructure
High-albedo pavements
Cooling areas accessible to
everyone
Improvement of the natural water cycle
in urban environments
Low-impact development
Urban morphology
Urban ventilation
Reduce anthropogenic
heat
Reduce the number of vehicles
Mixed uses
Active transport/ Public transit
Limit vehicle access
Control urban sprawl

Urban Heat Island Mitigation Strategies
Institut national de santé publique du Québec 51
Cooling
Urban greening strategy
Infiltration trenches
Acccessible green
spaces
Public transit and
active transport Cooling
centres and pools
and fountains
Reflective roofs
Permeable pavements
Mixed uses
Cooling
Greening of asphalt-
paved areas Park
upwind of the urban
centre
Green roofs and
green walls
Public transit and
active transport
Good wind circulation
High-albedo
pavements
Permeable pavements
Pools and
fountains
Cooling centres
Restricted vehicle traffic
Application example 1: Hot, humid summer climate and urban centre with few green spaces
• Solar gain control Green roofs, green walls, greening of asphalt-paved areas.
• Cool microclimate Permeable and reflective pavements + urban morphology that permits wind circulation + water installations + park upwind of the urban centre in the axis of the prevailing winds
• Reduced anthropogenic heat Restriction of vehicle traffic, development of bicycle and pedestrian corridors, public transit
• Thermal comfort of building occupants Pools and fountains + cooling centres
Application example 2: Hot, humid summer climate and urban centre with opportunities for greening
• Solar gain control Urban greening strategy
• Cool microclimate Permeable pavements + infiltration trenches
• Reduced anthropogenic heat Restriction of vehicle traffic, development of bicycle and pedestrian corridors, public transit, mixed uses
• Thermal comfort of building occupants Easily accessible green spaces + pools and fountains + cooling centres

Urban Heat Island Mitigation Strategies
52 Institut national de santé publique du Québec
6.2 COMPARISON OF THE VARIOUS URBAN HEAT ISLAND MITIGATION STRATEGIES
Table 13 provides additional information concerning urban heat island mitigation strategies. The comparison of the various strategies was carried out based on the information obtained from the literature review and consultation of experts and consultants working in the fields concerned.
6.2.1 Comparison criteria
The following comparison criteria were used:
• Focus of heat reduction: Indicates whether the measure cools the indoor air of buildings or the outdoor air of cities, or whether it primarily concerns the thermal comfort of city dwellers.
• Sustainability of the measure: Indicates the duration of the cooling effect of the measure when maintained: 10 years or less, 10 to 25 years, or more than 25 years.
• Additional benefits: Indicates whether the measure provides other direct or indirect benefits for the urban population: Better water quality (Water), better air quality (Air), better use of space for outdoor activities or social activities (Recreation), promotes biodiversity in urban environments (Biodiversity).
• Availability of the technology or service: Indicates whether the technology or service is available in Québec.
It should be noted that cost was not considered as a criterion for the purposes of this study. This issue will be examined in a cost-effectiveness analysis that will be published later.

Urban Heat Island Mitigation Strategies
Institut national de santé publique du Québec 53
Table 13 Comparison of the various urban heat island mitigation measures
Measure Focus of heat reduction Sustainability of the
measure with maintenance
Additional benefits Availability of the
technology or service in Québec
VEGETATION
Urban greening strategy. City More than 25 years. Air and water Recreation Biodiversity
Good
Selective tree planting. Building and city More than 25 years. Air and water Recreation Biodiversity
Good
Greening of parking lots. City More than 25 years. Air and water Good
Planting of vegetation around buildings. Building and city More than 25 years. Air and water
Biodiversity Good
Green walls. Building and city More than 25 years. Air and water Biodiversity Good
Green roofs. Building and city More than 25 years. Air and water Recreation Biodiversity
Good
URBAN INFRASTRUCTURE
Reflective materials for buildings. Building and city 10 to 25 years. Air Good
White roofs. Building and city 10 to more than 25 years
(variable depending on the type of covering chosen).
Air Good
Colour coatings for high solar reflectivity. Building and city More than 25 years. Air Limited
Building insulation. Building More than 25 years. n/a Good
Thermal inertia. Building More than 25 years. n/a Good
n/a: not applicable.

Urban Heat Island Mitigation Strategies
54 Institut national de santé publique du Québec
Table 13 Comparison of the various urban heat island mitigation measures (cont’d)
Measure Focus of heat reduction Sustainability of the
measure with maintenance
Additional benefits Availability of the technology or service in Québec
URBAN INFRASTRUCTURE (CONT’D)
High-performance windows. Building More than 25 years. n/a Good
Shading devices for windows. Building
Less than 10 years to more than 25 years.
(variable depending on the devices chosen)
n/a Good
High-albedo pavements. City 10 years to more than 25 years. Air Good
High-albedo paints for vehicles. City Less than 10 years. Air Limited
Well-ventilated urban morphology. City More than 25 years. Air
Recreation Good
Development of a park upwind of the city. City More than 25 years.
Air and water Biodiversity Recreation
Good
Cooling centres. Population More than 25 years. Recreation Good
Water installations. Building and city More than 25 years. Recreation Good Aquatic facilities. Population More than 25 years. Recreation Good
SUSTAINABLE STORMWATER MANAGEMENT
Permeable surfaces. Building and city n/a Water Good
Rain gardens. Building and city More than 25 years. Water and biodiversity Good
Retention ponds. City More than 25 years. Water and recreation Good
Dry wells. City More than 25 years. Water Good
Infiltration trenches. City More than 25 years. Water Good Reservoir pavement structures. City n/a Water n/a
Watering of pavements with recycled water. City More than 25 years. n/a Good
n/a: not applicable.

Urban Heat Island Mitigation Strategies
Institut national de santé publique du Québec 55
Table 13 Comparison of the various urban heat island mitigation measures (cont’d)
Measure Focus of heat reduction
Sustainability of the measure
with maintenance Additional benefits
Availability of the technology or service in
Québec
REDUCED ANTHROPOGENIC HEAT
Use of compact fluorescent light bulbs. Building Less than 10 years. n/a Good
Energy-efficient office equipment. Building Less than 10 years. n/a Good
Energy-efficient household appliances. Building 10 to 25 years. n/a Good
Reduction in the number of vehicles in urban centres.
City More than 25 years. Air and water Recreation. Good
Natural ventilation. Building More than 25 years*. Indoor air. Good
Controlled mechanical ventilation. Building More than 25 years. Indoor air. Good
Ground-coupled heat exchanger. Building More than 25 years. n/a Good
Solar air conditioning. Building More than 25 years. n/a Limited
Radiant cooling system. Building More than 25 years. n/a Good
* If conditions permit. n/a: not applicable.


Urban Heat Island Mitigation Strategies
Institut national de santé publique du Québec 57
7 SUGGESTIONS
Our survey of urban heat island mitigation strategies indicates that a range of options is available for heat reduction and cooling in urban areas. In addition, our review clearly shows the benefit of applying several mitigation measures at the same time. In fact, when these measures are used concurrently, an additive effect is observed in terms of cooling both buildings and cities, which helps protect the population from the negative health impacts of urban heat islands.
Although this review does not claim to replace the recommendations of experts in the fields concerned by urban heat island mitigation strategies, various suggestions for the southern sub-region of Québec can be made:
• Give priority to the application of urban heat island mitigation strategies in the areas where populations vulnerable to heat live.
• Choose measures adapted to the Québec climate, i.e. that consider the area’s seasonal climatic variations.
• Reduce the production of anthropogenic heat by encouraging the use of sustainable modes of transportation, renewable energy and energy-efficient appliances and equipment.
• Promote the natural water cycle in urban areas through installations that allow water infiltration at the source. Improving the availability of water in the soil will provide cooling of urban areas through the process of evaporation. Humidification of the soil will also meet the moisture needs of plants as well as promoting evapotranspiration, another source of cooling.
• Adopt the principles of bioclimatic architecture, which provides guidance for adapting buildings to the summer climatic conditions in Québec, including the use of shading devices.
• Encourage small- and large-scale greening initiatives as well as the protection of wooded areas. Identify opportunities for urban greening, conduct an inventory of the urban forest heritage, and ensure that proper practices are followed when planting vegetation in order to optimize plant growth and extend plant life.
• Promote ventilation in buildings and cities in the summer months, which will help maintain a comfortable thermal environment for building occupants and city dwellers.
• Reduce dependence on air conditioning. Use passive methods to cool buildings by minimizing internal cooling losses, reducing the amount of heat that enters a building, controlling heat generation in buildings and ensuring effective ventilation.
• Exceed established standards, since they are minimums. It is certainly possible to do better, in particular for insulation of the building envelope and ventilation.
Urban Heat Island Mitigation Strategies
58 Institut national de santé publique du Québec
There is a strong case to be made for giving these measures a prominent role in support programs in the municipal sector and in education and early childhood networks in order to support urban heat island mitigation strategies and preventive adaptation of programs and infrastructure to climate change.
An urban heat island mitigation strategy must be based on an integrated and multidisciplinary approach to urban development and requires the participation of various actors, particularly from the community concerned (members of the public), as well as various sectors, for example public health, urban planning, architecture, transportation and natural resources. Finally, sharing information and knowledge among cities concerning their achievements and the evaluation of their experiences is also essential to ensure optimal adaptation to urban heat islands.

Urban Heat Island Mitigation Strategies
Institut national de santé publique du Québec 59
REFERENCES
Agence de l'efficacité énergétique du Québec (2007) Novo-Climat : Confort, Santé, Économies. Accessible au : http://www.novoclimat.ca/. Consulté le 26 juin 2009.
Agence de l’Environnement et de la Maîtrise de l’Énergie (ADEME) (2009) Dans la cuisine, lavage et froid performants. Accessible au : http://www.ademe.fr/particuliers/Fiches/ equipements_electriques/rub1.htm. Consulté le 1er septembre 2008.
Agence de la santé et des services sociaux de Chaudière-Appalaches (2009) Quand la chaleur devient dangereuse. Accessible au : http://www.santeetenvironnement.ca/. Consulté le 26 juin 2009.
Akbari, H., Berdahl, P., Levinson, R., Miller, S.W.W., Desjarlais, A. (2006) Cool color roofing materials. California Energy Commission, Berkeley, CA., 73 p.
Akbari, H., Konopacki, S. (2004) Energy effects of heat-island reduction strategies in Toronto, Canada, Energy, Vol. 29, No. 2, pp. 191-210.
Akbari, H., Kurn, D., Bretz, S., Hanford, J. (1997) Peak power and cooling energy savings of shade trees, Energy and Buildings, Vol. 25, pp. 139-148.
Akbari, H., Miller, W. (2006) Cool-color roofing material: pier final project report. California Energy Commission, Berkeley, CA., 61 p.
Akbari, H., Pomerantz, M., Taha, H. (2001) Cool surfaces and shade trees to reduce energy use and improve air quality in urban areas, Solar energy, Vol. 70, pp. 95-310.
Akbari, H., Taha, H. (1992) The impact of trees and white surfaces on residential heating and cooling energy use in four canadian cities, Energy, Vol. 17, No. 2, pp. 141-149.
Albanese, B., Matlack, G. (1999) Utilization of parking lots in Hattiesburg, Mississippi, Usa, and impact on local streams, Environmental management, Vol. 24, No. 2, pp. 265-271.
Ali, M.M. (2008) Energy efficient architecture and building systems to address global warming, Leadership and management in engineering, Vol. 8, pp. 113-23.
Angers, G. (2007). À la défense des plantes grimpantes. Journal Le Soleil, 24 avril 2009.
Aniello, C., Morgan, K., Busbey, A., Newland, L. (1995) Mapping micro - urban heat islands using Landsat - TM and GIS, Computers and Geosciences, Vol. 21, No. 8, pp. 965-969.
Arizona Solar Center (2009) Passive solar heating and cooling. Accessible au : http://www.azsolarcenter.com/technology/pas-2.html. Consulté le 26 juin 2009.
Armstrong, M.M., Elmahdy, A.H., Swinton M.C., Parekh A. (2008) Sélection de vitrages de fenêtres de type résidentiel pour un rendement énergétique optimal, Solution constructive, No. 71, Décembre.
Asaeda, A., Ca, V.T., Akio Wake, A. (1994) Heat storage of pavement and its effect on the lower atmosphere, Atmospheric environment, Vol. 30, No. 33, pp. 413-427.

Urban Heat Island Mitigation Strategies
60 Institut national de santé publique du Québec
Backtröm, M., Viklander, M. (2000) Integrated stormwater management in cold climates, Journal of Environmental Science and Health, Part A, Vol. 35, No. 8, pp. 1237-1249.
Baldos, R. (2007) Le puits canadien : une climatisation écologique, Les Quatre saisons du jardin bio.
Balling, R. C., Gober, Jr. P., Jones, N. (2008) Sensitivity of residential water consumption to variations in climate: an intraurban analysis of Phoenix, Arizona, Water Resour. Res., Vol. 44, No. 10.
Banting, D., Doshi, H., Li, J., Missios, P. (2005) Report on the environmental benefits and costs of greenroofs for the City of Toronto. City of Toronto, 88 p.
Baskaran, B. (2009) Chercheur senior. Conseil national de recherches du Canada. Entretien téléphonique le 20 février 2009.
Bass, B., Baskaran, B. (2003) Evaluating rooftop and vertical gardens as an adaption strategy for urban areas. National Research Council Canada, Ottawa, 106 p.
Besancenot, J. (2002) Vagues de chaleur et mortalité dans les grandes agglomérations urbaines, Environnement, risques et santé, Vol. 4, No. 1, pp. 229-240.
Besancenot, J.-P. (2007) Santé et changement climatique, la montée de l'inquiétude. Delachaux Et Niestle, 240 p.
Boarnet, M.G., Crane, R. (2001) Travel by design: the influence of urban form on travel. Oxford University Press. 238 p.
Bolund, P., Hunhammar, S. (1999) Ecosystem services in urban areas, Ecological Economics, Vol. 29, pp. 293-301.
Bonin-Guillaume, S., Gaudreau, D., Mari, L., Razafiarison, M., Donnarel, G. (2005) Évaluation d’un appareil de brumisation en poste fixe dans un lieu de vie d’un établissement pour personnes âgées dépendantes, La revue de gériatrie, Vol. 30, No. 9, pp. 641-650.
Boucher, I. (2006) Les toits verts, Urbanité, septembre, pp. 16-18.
Boucher, I. (2007) Une pratique d’urbanisme durable : la gestion écologique des eaux de pluie. Gouvernement du Québec. Accessible au : http://www.mamrot.gouv.qc.ca/ publications/obse_muni/obse_eaux_pluie.pdf. Consulté le 5 février 2009.
Boulfroy, E. (2009) Aménagement des ressources forestières. Centre d'enseignement et de recherche en foresterie de Sainte-Foy (CERFO). Entretien téléphonique le 11 mai 2009.
Bourque, A., Simonet, G. (2007) Québec, Chap. 5. Dans : Vivre avec les changements climatiques au Canada, Lemmen, D.S., Warren, F.J., Lacroix, J., Bush, E., Gouvernement du Canada, Ottawa, pp. 171-226.
Brattebo, B., Booth, B.D. (2003) Long-term stormwater quantity and quality performance of permeable pavement systems, Water research, Vol. 37, No. 18, pp. 4369-4376.

Urban Heat Island Mitigation Strategies
Institut national de santé publique du Québec 61
Brown, R.D., Gillespie, T.J. (1995) Microclimate landscape design: creating thermal comfort and energy efficiency. John Wiley and Sons, Chichester, 192 p.
Ca, V. T., Asaeda, T., Abu, E.M. (1998) Reductions in air conditioning energy cuased by a neaby park, Energy and Buildings, Vol. 29, pp. 83-92.
California Energy Commission (2009) California's Energy Efficiency Standards for Residential and Nonresidential Buildings. Title 24, Part 6, of the California Code of Regulations. Accessible au : http://www.energy.ca.gov/title24/. Consulté le 12 avril 2009.
Canadian Association for Physicians for the Environment (CAPE) (1995) The greenhouse effect and global climate change. Accessible au : http://www.cape.ca. Consulté le 26 juin 2009.
Cappe, M. (2003) Péage urbain : l’exemple de Londres en Angleterre. Infrastructures Canada, Ottawa, 35 p.
Carter, T., Keeler, A. (2008) Life-cycle cost-benefit analysis of extensive vegetated roof systems, Journal of environmental management, Vol. 87, No. 3, pp. 350-363.
Cavayas, F., Baudouin, Y. (2008) Étude des biotopes urbains et périurbains de la CMM. Conseil régional de l’environnement de Laval (CRE Laval). Accessible au : http://www.cmm.qc.ca/biotopes/. Consulté le 14 novembre 2008.
Centre d’écologie urbaine de Montréal (2008) Îlots de fraîcheur. Accessible au : http://www.ecologieurbaine.net/projet/ilots-de-fraicheur. Consulté le 26 juin 2009.
Chan, C.F., Lebedeva, J., Otere, J., Richardson, G. (2007) Urban heat island: a climate change adaptation strategy for Montreal. Climate change action partnership, McGill University School of Urban Planning, Montréal, 78 p.
Chiesura, A. (2004) The role of urban parks for the sustainable city, Landscape and Urban Planning, Vol. 68, No. 1, pp. 129-138.
City of Chicago (2008) Monitoring the rooftop garden’s benefits. Accessible au : http://egov.cityofchicago.org/city/webportal/. Consulté le 30 octobre 2008.
City of Toronto (2009). Making Policy. Accessible au : http://www.toronto.ca/greenroofs/ policy.htm. Consulté le 23 avril 2009.
Commission de santé et de la sécurité au travail du Québec (CSST) (2004) Guide de prévention des coups de chaleur. 19 p.
Communauté urbaine de Lyon (2008) Aménagement et eaux pluviales sur le territoire du grand Lyon : guide à l'usage des professionnels Lyon. Grand Lyon, communauté urbaine, 51 p.

Urban Heat Island Mitigation Strategies
62 Institut national de santé publique du Québec
Conseil national de recherches du Canada (CNRC) (2002) Le gouvernement du Canada annonce que la multiplication des toitures-jardins réduirait grandement les gaz à effet de serre et améliorerait la qualité de l'air, Communiqués de presse, 9 octobre 2002, Ottawa. Accessible au : http://wwwreno.nrc-cnrc.gc.ca/fra/actualites/cnrc/2002/10/09/toitures-jardins.html. Consulté le 11 février 2009.
Conseil régional de l’environnement de Montréal (2007) Lutte aux îlots de chaleur urbains. Le Conseil, Montréal, 54 p.
Coutts A.M., Beringer J., Tapper N.(2008) Changing urban climate and CO2 emissions: implications for the development of policies for sustainable cities, Urban Policy and Research, In Press.
Craul, P.J. (1994) Soil compaction on heavily used sites, Journal of Arboriculture, Vol. 20, No. 2, pp. 69-74.
Cyr, J.-F., Marcoux, C., Deutsch, J.C., Lavallée, P. (1998) L’hydrologie urbaine : nouvelles problématiques, nouvelles approches de solutions, Revue des sciences de l’eau, No. spécial, pp. 51-60.
DeNardo, J.C., Jarrett, A.R., Manbeck, H.B., Beattie, D.J., Berghage, R.D. (2005) Stormwater mitigation and surface temperature reduction by green roofs, Trans. ASAE, Vol. 48, pp. 1491-1496.
Déoux, S., Déoux, P. (2004) Guide de l'Habitat Sain. Medieco Editions, 537 p.
Dimoudi, A., Nikolopoulou, M. (2003) Vegetation in the urban environment: microclimatic analysis and benefits, Energy and Buildings, Vol. 35, No. 1, pp. 69-76.
Dixsaut, G. (2005) Vague de chaleur et climatisation : revue bibliographique, Bise, Vol. 16, No. 3, pp. 1-6.
Donglian, S., Pinker, R.T. (2004) Case study of soil moisture effect on land surface temperature retrieval, Geoscience and Remote Sensing Letters, IEEE, Vol. 1, No. 2, pp. 127-130.
École polytechnique de Montréal (2005) L'École Polytechnique de Montréal inaugure les pavillons Lassonde, les premiers « bâtiments durables » érigés par une institution d'enseignement au Québec - Un investissement de 104,9 M$. Accessible au : http://www.polymtl.ca/carrefour/article.php?no=2077. Consulté le 9 mars 2009.
Endreny, T. (2008) Naturalizing urban watershed hydrology to mitigate urban heat-island effects, Hydrological processes, Vol. 22, No. 3, pp. 461-463.
Energy film Insulation (2008). Accessible au : http://www.energyfilminsulation.com/. Consulté le 26 juin 2009.
Enegy star (2009) Reflective roof products for consumers. Accessible au : http://www.energystar.gov/index.cfm?c=roof_prods.pr_roof_products. Consulté le 26 juin 2009.

Urban Heat Island Mitigation Strategies
Institut national de santé publique du Québec 63
English, P., Fitzsimmons, K., Hoshiko, S., Margolis, H., McKone, T.E., Rotkin-Ellman, M., Solomon, G., Trent, R., Ross, Z. (2007) Public health impacts of climate change in California: community vulnerability assessments and adaptation strategies: report No. 1: heat-related illness and mortality, Information for the Public Health Network in California. California Department of Public Health, Salt Lake City, 49 p.
Environmental Prediction in Canadian Cities (EPiCC) (2008) Measurement: sites. Accessible au : http://www.epicc.uwo.ca/measurement/. Consulté le 26 juin 2009.
Environnement Canada (2009) Archives nationales d'information et de données climatologiques. Accessible au : http://www.climate.weatheroffice.ec.gc.ca/climateData/ canada_f.html?&. Consulté le 2 juin 2009.
Evergreen (2008) Liste de plantes recommandées. Accessible au : http://www.evergreen.ca/ plantesindigenes/lists/index.php. Consulté le 14 octobre 2008.
Fanger, P.O. (1982) Thermal comfort: analysis and applications in environmental engineering. R.E. Krieger Publishing company, Malabar, Florida, 244 p.
Fischetti, M. (2008) Green roofs, living cover, Scientific American, Vol. 298, pp. 104-105.
Fischler, R., Lewis, P. (2005) Aménagement urbain et transport actif : enjeux et perpectives. Université McGill, Université de Montréal, Montréal, 7 p. Accessible au : http://www.inspq.qc.ca/aspx/docs/jasp/presentations/2005/JASP2005-TransportActif-Fischler-Lewis.pdf. Consulté le 11 octobre 2008.
Fouad, A.O. (2007) Morphologie urbaine et confort thermique dans les espaces publics : étude comparative entre trois tissus urbains de la ville de Québec. Mémoire de maîtrise en science de l’architecture, Université Laval, Québec, 151 p.
Frazer, L. (2005) Paving paradise: the peril of impervious surface, Environmental Health Perspectives, Vol. 113, pp. 456-462.
Fuamba, M. (2009) Professeur de l’école Polytechnique de Montréal. Entretien téléphonique le 19 mai 2009.
Gagné, A., Dufour, S., Saulnier, M., St-Louis, M. (2008) Le guide des options écolos, une exclusivité de l’APCHQ : des options claires pour construire vert. Association provinciale des constructeurs d’habitations du Québec (APCHQ), 47 p.
Gauthier, J., Morais, J.A., Mallet, L. (2005) Impact des vagues de chaleur en gériatrie et risques associés aux médicaments, Pharmactuel, Vol. 38, No. 3, pp. 123-133.
Gilbert, J.K., Clausen, J.C. (2006) Stormwater runoff quality and quantity from aspharlt, paver, and crushed stone driveways in Connecticut, Water research, Vol. 40, No. 4, pp. 826-832.
Gill, S.E., Handley, J.F., Ennos, A.R., Pauleit, S. (2007) Adapting cities for climate change: the role of the green infrastructure, Built Environment, Vol. 33, pp. 115-133.

Urban Heat Island Mitigation Strategies
64 Institut national de santé publique du Québec
Gill, S.E., Handley, J.F., Ennos, A.R., Pauleit, S., Theuray, N., Lindley, S.J. (2008) Characterising the urban environment of UK cities and towns: a template for landscape planning, Landscape and urban planning, Vol. 87, pp. 210-222.
Godmaire, H., Demers, A. (2009) Eaux usées et fleuve Saint-Laurent : problèmes et solutions. Union St-Laurent Grands Lacs, Eau secours, Montréal, 21 p.
Golden, J.S., Kaloush, K. (2006) Meso-scale and micro-scale evaluations of surface pavement impacts to the urban heat island effects, International Journal of Pavement Engineering, Vol. 7, No. 1, pp. 37-52.
Gouvernement du Québec (2009) Portail du gouvernement du Québec. Accessible au : www.gouv.qc.ca/. Consulté le 10 janvier 2009.
Grand Lyon Communauté urbaine (2009) Un mur végétal dépolluant. Accessible au : http://www.grandlyon.com/Un-mur-vegetal-depolluant.3190.0.html. Consulté le 13 février 2009.
Grand Toulouse Communauté urbaine (2008) Guide de gestion des eaux de pluie et de ruissellement. Accessible au : http://www.grandtoulouse.org/index.php?pagecode=376. Consulté le 12 novembre 2008.
Greater London Authority (2008) London climate change adaptation strategy: draft report. London, 113 p.
Gregory, J.H., Dukes, M.D., Jones, P.H., Miller, G.L. (2006) Effect of urban soil compaction on infiltration rate, Journal of soil and water conservation, Vol. 61, No. 3, pp. 117-123.
Health Scotland, greenspace scotland, Scottish Natural Heritage and Institute of Occupational Medicine (2008) Health impact assessment of greenspace: a guide. Greenspace Scotland, Stirling, 74 p.
Heisler, G.M., Grimmond, S., Grant, R.H., Souch, C. (1994) Investigation of the influence of Chicago's urban forests on and air temperature within residential neighborhoods, Northeaster Forest Experiment, Vol. 186, pp. 19-40.
Herzog, B. (2007) Le puits canadien. Eyrolles Environnement. 116 p.
Hollmuller, P., Lachal, B., Zgraggen, J.-M. (2005) Rafraîchissement de bâtiments par déphasage thermique contrôlé, CISBAT’05, Lausanne, septembre, pp. 317-322.
Honjo, T., Takakura, T. (1990) Simulation of thermal effects of urban green .areas on their surrounding areas, Energy and Buildings, Vol. 15, pp. 443-446.
Horrobin, B. (2008) Optimizing the safe application of shade using crime prevention through environmental design (C.P.T.E.D.). Conférence présenté dans le cadre du Forum ‘Where’s the Shade’ à London le 29 septembre 2008, Windsor Police Service, London, 21 p.

Urban Heat Island Mitigation Strategies
Institut national de santé publique du Québec 65
Houghton, J.T., Ding, Y., Griggs, D.J., Noguer, M., van der Linden, P.J., Dai, X., Maskell, K., Johnson, C.A. (2001) Climate change 2001: the scientific basis. Cambridge University Press, Cambridge, 881 p.
Ihara, T. (2006) Energy conservation and urban heat island mitigation effects by solar reflective coating to an automobile. International workshop on countermeasures to urban heat islands (Tokyo, Japan) August 3rd, 2006, National Institute of Advanced Industrial Science and Technology (AIST), 35 p. Accessible au : http://www.iea.org/Textbase/ work/2006/heat/5-f_Ihara.pdf. Consulté le 12 février 2009.
Institut de la statistique du Québec (2004) Si la tendance se maintient : Perspectives démographiques, Québec et régions 2001-2015. Accessible au : http://www.stat.gouv.qc.ca/publications/demograp/pdf/tendance2001_2051.pdf. Consulté le 19 décembre 2008.
Institut de la statistique du Québec (2005) Proportion de ménages qui disposent de certaines composantes de l’équipement ménager et d’une maison de campagne, Québec, Ontario et Canada, 1972-2005. Accessible au : http://www.stat.gouv.qc.ca/donstat/societe/famls_ mengs_niv_vie/patrm_equip/4equip_pourcent.htm. Consulté le 16 juin 2009.
Jacques, L., Kosatsky, T. (2005) Commentaires faisant suite à la parution de l’article : Dixsaut, G. (2005) Vague de chaleur et climatisation : revue bibliographique, Bise, Vol. 16, No. 3, pp. 1-6.
James, W. (2002) Green roads: research into permeable pavers, Stormwater, March/April, pp. 48-50.
Johnston, J., Newton, J. (2004) Building green: a guide to using plants on roofs, walls and pavements. Ecology Unit, London, 95 p.
Jour de la Terre Québec (2008) Fiche technique du mur végétal de l’espace fraîcheur. 2 p. Accessible au : http://www.jourdelaterre.org/DATA/ARTICLE/208_132.pdf. Consulté le 13 décembre 2008.
Kingsbury, N., Dunnett, N. (2008) Planting green roofs and living walls. 2nd Ed., Timber Press, 336 p.
Konopacki, S., Gartland, L., Akbari, H., Rainer, I. (1998) Demonstration of energy savings of cool roofs. Lawrence Berkeley National Laboratory, University of California, LBNL-40673.
Lachal, B., Soutter, C., Weber, W. (2004) Il est possible de garantir le confort d’été sans recourir à la climatisation, La revue durable, No. 9, février-mars.
Lachance, G., Baudouin, Y., Guay, F. (2006) Étude des îlots de chaleur montréalais dans une perspective de santé publique, Bulletin d’information en santé environnementale (BISE), Vol. 17, No. 3, pp. 1-5.
Lakshmi, V., Zehrfuhs, D., Jackson, T. (2000) Observations of land surface temperature and its relationship to soil moisture during SGP99, Geoscience and Remote Sensing Symposium, 2000. IEEE 2000 International, Vol. 3, pp. 1256-1258.

Urban Heat Island Mitigation Strategies
66 Institut national de santé publique du Québec
Lalonde, G. (2009) Directeur technique, Association des Maîtres Couvreurs du Québec (AMCQ). Entretien téléphonique le 13 mai 2009.
Laplace, X. (2009) Spécialiste des toitures végétales. Entretien téléphonique le 9 avril 2009.
Lawlor, G., Société canadienne d’hypothèques et de logement (2006) Toits verts : manuel de ressources destiné aux décideurs municipaux. Société canadienne d'hypothèques et de logement (SCHL), Ottawa, 146 p.
Lawrence Berkeley National Laboratory (2000) High temperatures. Accessible au : http://heatisland.lbl.gov/HighTemps/. Consulté le 26 juin 2009.
Lessard, G., Boulfroy, E. (2008) Les rôles de l’arbre en ville. Centre collégial de transfert de technologie en foresterie de Sainte-Foy (CERFO), Québec, 21 p.
Levinson, R., Berdahl, P., Akbari, H. (2005) Solar spectral properties of pigments, or how to design a cool nonwhite coating. Presented at Cool Roofing, Cutting Through the Glare, Atlanta, GA, May 12.
Levy, A.W. (1978) CBD-192-F. Éclairage intérieur et économie de l'énergie. Conseil national de recherche du Canada. Accessible au : http://irc.nrc-cnrc.gc.ca/pubs/cbd/cbd192_f.html. Consulté le 12 novembre 2008.
Liébard, A., DeHerde, A. (2005) Traité d'architecture et d'urbanisme bioclimatiques : concevoir, édifier et aménager avec le développement durable. Le Moniteur, Paris, 776 p.
Liu, K.K.Y. (2002) Energy efficiency and environmental benefits of rooftop gardens. National Research Council Canada, Ottawa, 12 p.
Liu, K., Bass, B. (2005) Performance of green roof systems. National Research Council Canada, Ottawa, 18 p.
Luber, G., McGeehin, M. (2008) Climate change and extreme heat events, American Journal of Preventive Medicine, Vol. 35, pp. 429-435.
Luxmore, D., Jayasinghe, M.T.R., Mahendran, M. (2005) Mitigating temperature increases in high lot density sub-tropical residential developments, Energy and Buildings, Vol. 37, pp. 1212-1224.
Mailhot, A., Duchesne, S. (2005) Impacts et enjeux liés aux changements climatiques en matière de gestion des eaux en milieu urbain, VertigO, Hors-série no. 1, pp. 1-9.
Maillard, P.-L. (2009) Association canadienne du ciment. Entretien téléphonique le 10 mars 2009.
Manning, M.M., Elmanhy, A.H., Swinton, M.C., Pareck, A. (2008) Choix d’un vitrage à faible émissivité pour une performance énergétique optimale, Home Builder, Vol. 21, No. 2, pp. 1-4.
McEvoy, D., Lindley, S., Handley, J. (2006) Adaptation and mitigation in urban areas: synergies and conflicts, Municipal Engineer, Vol. 159, pp. 185-191.
Urban Heat Island Mitigation Strategies
Institut national de santé publique du Québec 67
McPherson, G., Simpson, J.R., Peper, P.J., Mco, S.E., Siao, Q. (2005) Municipal forest benefits and costs in Five US Cities, Journal of Forestry, Vol. 103, No. 8, pp. 411-416.
McPherson, E.G. (1994) Cooling urban heat islands with sustainable landscapes. In: The ecological city: preserving and restoring urban biodiversity, Rowntree, R.A., Platt, R.H., Muick, P.C., The University of Massachusetts Press, Amherst, pp. 151-171.
McPherson, E. G., Muchnick, J. (2005) Effect of street tree shade on asphalt concrete pavement performance, Journal of arboriculture, Vol. 31, No. 6, pp. 303-310.
McPherson, G.E., James, R., Simpson, J.R., Scott, K.I. (2001) Actualizing microclimate and air quality benefits with parking lot shade ordinances, Wetter und Leben, Vol. 4, pp. 98.
Mentens, J., Raes, D., Hermy, M. (2006) Green roofs as a tool for solving the rainwater runoff problem in the urbanized 21st century? Landscape and Urban Planning, Vol. 77, No. 3, pp. 217-226.
Miller, R. (2009) Spécialiste horticole. Conférence sur les toitures végétales lors du Salon toits verts et jardins de ville. Entretien téléphonique le 9 avril 2009.
Milwaukee Metropolitan Sewerage District (MMSD) (2007) Summary of nonpoint source technology analysis, Chap. 4. In: State of the art report, pp. 4.1-4.90.
Ministère des Affaires municipales et du Logement de l’Ontario (2004) Étude de cas 8 : infrastructure de toits verts, ville de Toronto. Dans : Édifier des collectivités fortes : étude d’initiatives ontariennes d’assainissement de l’air. Accessible au : http://www.mah.gov.on.ca/Page3498.aspx#Cas %208. Consulté le 10 octobre 2008.
Ministère du développement durable et des parcs (MDDEP) (2006) Inventaire québécois des émissions de gaz à effet de serre en 2003 et évolution depuis 1990. Accessible au : http://www.mddep.gouv.qc.ca/changements/ges/2003/index.htm. Consulté le 11 octobre 2008.
Monterusso, M.A., Rowe, D.B., Rugh, C.L. (2005) Establishment and persistence of sedum spp. and native taxa for green roof applications, HortScience, Vol. 40, pp. 391-396.
Moran, A., Hunt, B., Smith, J. (2007) Hydrologic and water quality performance from greenroofs in Goldsboro and Raleigh. North Carolina. Green Roof for Healthy Cities, Washington, pp. 1-11.
Niachou, A. (2001) Analysis of the green roof thermal properties and investigation of its energy performance, Energy and Buildings, Vol. 33, pp. 719-729.
Nikolopoulou, M. (2004) Concevoir des espaces extérieurs en environnement urbain : une approche bioclimatique. Center for Renewable Energy Sources, 64 p.
Novitski, B. (2008) Verdant surfaces. Continuing Education Center. Accessible au : http://continuingeducation.construction.com/article.php?L=5&C=440. Consulté le 26 juin 2009.

Urban Heat Island Mitigation Strategies
68 Institut national de santé publique du Québec
Oberndorfer, E., Lundholm, J., Bass, B., Coffman, R.R., Doshi, H., Dunnett, N., Gaffin, S., Köhler, M., Liu, K.K.Y., Rowe, B. (2007) Green roofs as urban ecosystems: ecological structures, functions and services, BioScience, Vol. 57, No. 10, pp. 823-833.
Oke, T.R. (1982) The energetic basis of the urban heat island, Quarterly Journal of the Royal Meteorological Society, Vol. 108, pp. 1-24.
Oke, T.R. (1987) Boundary layer climates. 2nd ed., Routeledge, London, 474 p.
Oke, T.R. (1988) Street design and urban canopy layer climate, Energy and Buildings, Vol. 11, pp. 103-113.
Oliva, J.P., Courgey, S. (2006) La conception bioclimatique : des maisons économes et confortables en neuf et en réhabilitation. Terre vivante, 240 p.
Organisation mondiale de la Santé (OMS) (2007) Climat et santé. Accessible au : http://www.who.int/mediacentre/factsheets/fs266/fr/index.html. Consulté le 3 novembre 2008.
Osborne, W.C., Turner, C.G. (1956) Woods: guide pratique de ventilation. Dunod, 238 p.
Pachauri, R.K., Reisinger, A. (2007) Bilan 2007 des changements climatiques. Contribution des Groupes de travail I, II et III au quatrième rapport d’évaluation du Groupe d’experts intergouvernemental sur l’évolution du climat. GIEC, Genève, 103 p.
Parisi, A.V., Kimlin, M.G., Wong, J.C.F., Wilson, M. (2000) Personal exposure distribution of solar erythemal ultraviolet radiation in tree shade over summer, Phys. Med. Biol., Vol. 45, pp. 349-356.
Paroli, R.M., Gallagher, J. (2008) Les toits verts, les toits blancs et les toits haute performance : distinguer les faits de la fiction, Canadian Property Managemen : B.C./Alberta Edition, Vol. 16, No. 1, pp. 1-4.
Perez Arrau, C. (2007) Cinq exemples de terrains de jeux synthétiques et de températures associées par une image thermique Landsat 5. UQÀM, Montréal, 23 p. Accessible au : http://www.urbanheatislands.com/Synthetic_turf_Montreal.pdf. Consulté le 13 décembre 2008.
Pigeon, G., Lemonsu, A., Masson, V., Hidalgo, J. (2008) De l’observation du microclimat urbain à la modélisation intégrée de la ville, La Météorologie, No. 52, pp. 39-47.
Pinho, A., Pedro, J.B., Coelho, A.B. (2003) The influence of the built environment in microclimatic variations. The 20th Conference on Passive and Low Energy Architecture, Santiago, CHILE, 9-12 November, 6 p.
Plante, C. (2009) Transport en commun gratuit proposé aux travailleurs du centre-ville. La Tribune, 5 mai 2009.
Pomerantz, M. (1999) Benefits of cooler pavements. Heat Island Group. Accessible au : http://eetd.lbl.gov/HeatIsland/Pavements/Overview/. Consulté le 17 novembre 2008.

Urban Heat Island Mitigation Strategies
Institut national de santé publique du Québec 69
Portland Parks & Recreation, Healthy Parks, Healthy Portland (2007) Urban forest action plan. 20 p.
Portail Québec (2009) Les zones climatiques. Accessible au : http://www.gouv.qc.ca/portail/ quebec/pgs/commun/portrait/geographie/climat/zonesclimatiques/?lang=fr. Consulté le 26 juin 2009.
PortlandOnline (2004) 2004 stormwater management manual. Bureau of Environmental Services, City of Portland, Oregon. Accessible au : http://www.portlandonline.com/ BES/index.cfm?c=35122&. Consulté le 17 novembre 2008.
Potvin, A. (2008) Étude portant sur le potentiel d'utilisation du chauffage solaire passif et le contrôle de la surchauffe estivale. Groupe conseil Technosim inc., Rattachement : École d'architecture, Université Laval, Québec.
Quénol, H., Bridier, S., Vergne, O., Dubreuil, V. (2007) Apport de la géomatique pour la caractérisation de l’Ilot de Chaleur Urbain à Rennes (France). Anais XIII Simpósio Brasileiro de Sensoriamento Remoto, Florianópolis, Brasil, 21-26 avril, INPE, pp. 5467-5469.
Raymond, E.L., Bouchard, A., Gagnon, V. (2006) La gestion du risque de chaleur accablante ou extrême dans l’agglomération de Montréal. Centre de sécurité civile, Ville de Montréal, 18 p.
Réseau National de Surveillance. Aérobiologique (R.N.S.A.) (2009) Guide d’information de la végétation en ville. Le réseau, St-Genis l’Argentière, France, 68 p.
Ressources naturelles Canada (2004) Un temps de changement : les changements climatiques au Québec, un climat en constante transformation. Accessible au : http://adaptation.nrcan.gc.ca/posters/qc/qc_02_f.php. Consulté le 13 novembre 2008.
Ressources naturelles Canada (2009) Guide d’achat ENERGY STAR. Accessible au : http://oee.nrcan.gc.ca/publications/equipement/m27-01-2227f.cfm?attr=12. Consulté le 1er avril 2009.
Rhônalpénergie Environnement (2009) Les techniques du froid solaire. Accessible au : http://www.raee.org/climatisationsolaire/fr/techniques.php. Consulté le 1er avril 2009.
Rose, O. (2009) Président du Centre d’Écologie Urbaine de Montréal. Entretien téléphonique le 14 mai 2009.
Rosenfeld, A.H., Romm, J.J., Akbari, H., Pomerantz, M. (1998) Cool communities: strategies for heat islands mitigation and smog reduction, Energy and Buildings, Vol. 28, pp. 51-62.
Rosenzweig, C., Solecki, W.D., Parshall, L., Chopping, M., Pope, G., Goldberg, R. (2005) Characterizing the urban heat island in current and future climates in New Yersey, Environmental Hazards, Vol. 6, pp. 51-62.
Rowntree, R.A., Nowak, D.J. (1991) Quantifying the role of urban forests in removing atmospheric carbon dioxide, J. Arboric., Vol. 17, pp. 269-275.

Urban Heat Island Mitigation Strategies
70 Institut national de santé publique du Québec
Rushton, B. T. (2001) Low-impact parking lot design reduces runoff and pollutant loads, J. Water Resour. Plng. and Mgmt, Vol. 127, No. 3, pp. 172-179.
Ryerson University (2005) Report on the environmental benefits and costs of greenroofs for the City of Toronto. City of Toronto, 88 p.
Salomon, T., Aubert, C. (2004) La fraîcheur sans clim. Terre Vivante, Paris, 160 p.
Sandifer, S., Givoni, B. (2002) Thermal effects of vines on wall temperatures, comparing laboratory and field collected data. Proceedings of the annual conference of the American Solar Energy Society, Reno, NV., June 15-20, 6 p.
Santamouris, M. (2001) Energy and climate in the urban built Environment. Earthscan Publishers, 412 p.
Santé Canada (2006) Prévention du cancer de la peau. Santé Canada, Ottawa, 2 p.
Shashua-Bar, L., Hoffman, M. E. (2000) Vegetation as a climatic component in the design of an urban street: An empirical model for predicting the cooling effect of urban green areas with trees, Energy and Buildings, Vol. 31, No. 3, pp. 221-235.
Smargiassi, A., Kestens, Y., Fournier, M., Mololey, M., Kosatsky, T. (2009) Modelling of time-related variations of surface temperatures for the detection and monitoring of urban heat islands. Projet de recherche financé par le Fonds vert dans le cadre de l’Action 21 du Plan d’action 2006-2012 sur les changements climatiques du gouvernement du Québec.
Smeesters, E. (2008) Un jardin pluvial pour retenir et filtrer l’eau de pluie, La Maison du 21e siècle, automne, pp. 74.
Société canadienne d’hypothèques et de logement (SCHL) (2005) Un jardin pluvial pour mieux gérer les eaux de ruissellement dans votre cour. Accessible au : http://www.cmhc-schl.gc.ca/fr/co/enlo/ampa/ampa_005.cfm. Consulté le 17 novembre 2008.
Société canadienne d'hypothèques et de logement (SCHL) (2009) Rattrapage des fenêtres haute performance. Accessible au : http://www.cmhc-schl.gc.ca/fr/prin/coco/toenha/ coeceaen/coeceaen_038.cfm. Consulté le 26 juin 2009.
Société immobilière du Canada (2009) Bienvenue à Benny Farm. Accessible au : http://www.bennyfarm.org/fr/home.php. Consulté le 17 mars 2009.
Solecki, W.D., Rosenzweig, C., Parshall, L., Pope, G., Clark, M., Cox, J., Wiencke, M. (2005) Mitigation of the heat island effect in urban New Jersey, Global Environmental Change Part B: Environmental Hazards, Vol. 6, No. 1, pp. 39-49.
Statistique Canada (2002) Enquête sur la consommation d'énergie par les bâtiments commerciaux et institutionnels. Accessible au : http://www.statcan.gc.ca/cgi-bin/imdb/p2SV_f.pl?Function=getSurvey&SDDS=2943&lang=fr&db=imdb&adm=8&dis=2. Consulté le 14 décembre 2008.
Urban Heat Island Mitigation Strategies
Institut national de santé publique du Québec 71
Sundseth, K., Raeymaekers, G. (2006) Biodiversity and natura 2000 in urban areas, nature in cities across Europe: a review of key issues and experiences. IBGE/BIM, Bruxelles, 70 p.
Synnefa, A., Santamouris, M., Apostolakis, K. (2007) On the development, optical properties and thermal performance of cool colored coatings for the urban environment, Solar Energy, Vol. 81, No. 4, pp. 488-497.
Taha, H. (1995) Modeling the impacts of large-scale albedo changes on ozone air quality in the south coast air basin, Atmospheric Environment, Vol. 31, No. 11, pp. 1667-1676.
Taha, H. (1997) Urban climates and heat islands: albedo, evapotranspiration, and anthropogenic heat, Energy and Buildings, Vol. 39, No. 11, pp. 1167-1174.
Taha, H., Konopacki, S., Gabersek, S. (1996) Modeling the meteorological and energy effects of urban heat islands and their mitigation: a 10 region study, report LBNL-44222. Lawrence Berkeley National Laboratory, Berkeley, CA., 51 p.
Thibault, N., Létourneau, E., Girard, C., (2004) Si la tendance se maintient : perspectives démographiques, Québec et régions 2001-2015. Institut de la statistique du Québec, 38 p.
United States Environmental Protection Agency (USEPA) (1997) Conservation design for stormwater management: a design approach to reduce stormwater impacts from land development and achieve multiple objectives related to land use. Sediment and Stormwater Program, 228 p.
United States Environmental Protection Agency (USEPA) (2001) Our built and natural environments: a technical review of the interactions between land use, transportation, and environmental quality. EPA, 93 p.
United States Environmental Protection Agency (USEPA) (2006) Excessive heat events guidebook. USEPA, Washington, DC, 52 p.
United States Environmental Protection Agency (USEPA) (2007) Reducing stormwater costs through low impact development (LID) strategies and practices. USEPA, Washington, DC, 37 p.
United States Environmental Protection Agency (USEPA) (2008a) Ground-level ozone: health and environment. USEPA. Accessible au : http://www.epa.gov/air/ozonepollution/ health.html. Consulté le 26 juin 2009.
United States Environmental Protection Agency (USEPA) (2008b) Reducing urban heat islands: compendium of strategies, urban heat island basics. USEPA, Washington, DC, 19 p.
Urban, J. (2008) Growing the urban forest. In : City of Toronto, Tree Symposium: healthy trees for a beautiful city, 20 p.
Urbatod.com (2009) Transit oriented development. Accessible au : http://www.urbatod.org/ p1.htm.

Urban Heat Island Mitigation Strategies
72 Institut national de santé publique du Québec
Vergriete, Y., Labrecque, M. (2007) Rôle des arbres et des plantes grimpantes en milieu urbain: revue de littérature et tentative d'extrapolation au contexte montréalais. Conseil régional de l'environnement de Montréal, Montréal, 35 p.
Ville d’Ottawa (2008) Programme ARBRE. Accessible au : http://www.ottawa.ca/residents/ healthy_lawns/forestry/tree_program/index_fr.html. Consulté le 25 octobre 2008.
Ville de Montréal (2005) Politique de l'arbre de Montréal. La Ville, Montréal, 30 p.
Vivre en ville (2004) Vers des collectivités viables. Éditions Vivre en ville, Québec, 637 p.
Voogt, J.A. (2002) Urban heat island, Encyclopedia of global environmental change, Vol. 3, pp. 660-666.
Voogt, J.A. (2009) How researchers measure urban heat islands. University of Western Ontario, London, ON, 34 p.
Wang, G., Macera, C.A., Scudder-Soucie, B., Schmid, T., Pratt, M., Buchner, D., Heath, G. (2004) Cost analysis of the built environment: the case of bike and pedestrian trails in Lincoln Neb, Am J Public Health, Vol. 94, No. 4, pp. 549-553.
Watkins, R., Palmer, J., Kolokotroni, M. (2007) Increased temperature and intensification of the urban heat island: implications for human comfort and urban design, Built Environment, Vol. 33, pp. 85-96.
Wendel, A.M., Dannenberg, A.L., Frumkin, H. (2008) Designing and building heathy places for children, International Journal of Environment and Health, Vol. 2, No. 3/4, pp. 338-355.
Wilson, I., Barton, T. (2008) First Commercial Installation of Silva Cells in Kelowna, BC. City of Kelowna. Accessible au : http://www.deeproot.com/pdfs/PNW_Trees_article.pdf. Consulté le 12 février 2009.
Winkelman, T.J. (2005) Whitetopping performance in Illinois, Physical Research Report, No. 148.
Xiao, Q.F., McPherson, E.G., Simpson, J.R., Ustin, S.L. (1998) Rainfall interception by Sacramento's urban forest, Journal of Arboriculture, Vol. 24, No. 4, pp. 235-244.
Yamada, K., Funaki, T., Honda, S., Sugihara, M. (2001) Study of diffuse source pollution management for land use and drainage system planning, Water Sci Technol., Vol. 44, No. 7, pp. 203-208.
Yamagata, H., Nasu, M., Yoshizawa, M., Miyamoto, A., Minamiyama, M. (2008) Heat island mitigation usig water retentive pavement sprinkled with reclaimed wastewater, Water science & technology, Vol. 57, No. 5, pp. 763-771.
Younger, M., Morrow-Almeida, H.R., Vindigni, S.M., Dannenberg, A.L. (2008) Built environment, climate change, and health: opportunities for co-benefits, American Journal of Preventive Medicine, Vol. 35, pp. 517-526.

APPENDIX 1


Urban Heat Island Mitigation Strategies
Institut national de santé publique du Québec 75
Keywords use in the searches in the various databases such as Medline, Embase, RUDI, Avery Index to Architectural Periodicals, Human Population & Natural Resource Management, Environmental Engineering Abstracts, and Google Scholar and Google.
French English Air Air Albédo Albedo Allergies Allergies Aménagement urbain Built environment Arbres Trees Architecture Architecture Architecture bioclimatique Bioclimatic architecture Asphalte Asphalt Bâtiments, bâtiment durable Buildings, green building Béton Concrete, Canyons urbains Street Canyon, urban canyon Capacité thermique Heat storage Chaleur Heat Climat chaud Hot climate Climatisation, climatisation solaire Cooling, solar cooling Climat urbain, microclimat(s) urbain(s) Urban climate, microclimate(s) Confort thermique Thermal comfort COV VOC Design urbain, urbanisme, aménagement du territoire
Urban plannin, landscaping, design
Efficacité énergétique Energy efficiency Environnement urbain Urban environment Espaces végétalisés Green spaces, green areas Étalement urbain Urban sprawl Foresterie urbaine Urban forest Îlot(s) de chaleur urbain(s) Urban heat island(s) Impacts Impacts Gestion des eaux pluviales Stormwater management Géométrie urbaine Urban geometry Mesures de lutte aux îlots de chaleur Urban heat islands mitigation strategies Microclimat(s) urbain(s) Urban microclimate(s) Morphologie urbaine Urban morphology Murs végétaux Green walls, living walls Ombrage, Ombre Shading, Shadow Pavé perméable, poreux Permeable, Porous pavement Puits canadien s. o. Québec Québec Santé, santé publique Health, Public health Surfaces Surfaces Température Temperature Toit(s) vert(s) Green roofs, rooftop vegetation Toits réfléchissants, toits blancs Reflective roofs, white roofs, cool roofs Transport(s) en commun Mass transport, public transport Transport(s) actif(s) Active transport Urban Urban Urbanisme durable Sustainable urban planning Vague de chaleur Heat wave Végétation Vegetation Verdissement urbain Urban greening Ville City

Publication N°: 1513

C
M
Y
CM
MY
CY
CMY
K
Back Couvert.pdf 7/6/06 3:48:56 PM