urban land-cover mapping with high-resolution spaceborne ...373002/fulltext01.pdf · urban...
TRANSCRIPT

Urban Land-cover Mapping with High-resolution Spaceborne SAR Data
Hongtao Hu
November 2010
TRITA-SoM 2010-14 ISSN 1653-6126 ISRN KTH/SoM/10-14/SE ISBN 978-91-7415-805-2

© Hongtao Hu, 2010 Licentiate Thesis Division of Geoinformatics Department of Urban Planning and Environment Royal Institute of Technology (KTH) SE-100 44 Stockholm, Sweden Printed by E-print Stockholm, Sweden, 2010

I
Abstract Urban areas around the world are changing constantly and therefore it is necessary to update urban land cover maps regularly. Remote sensing techniques have been used to monitor changes and update land-use/land-cover information in urban areas for decades. Optical imaging systems have received most of the attention in urban studies. The development of SAR applications in urban monitoring has been accelerated with more and more advanced SAR systems operating in space. This research investigated object-based and rule-based classification methodologies for extracting urban land-cover information from high resolution SAR data. The study area is located in the north and northwest part of the Greater Toronto Area (GTA), Ontario, Canada, which has been undergoing rapid urban growth during the past decades. Five-date RADARSAT-1 fine-beam C-HH SAR images with a spatial resolution of 10 meters were acquired during May to August in 2002. Three-date RADARSAT-2 ultra-fine-beam C-HH SAR images with a spatial resolution of 3 meters were acquired during June to September in 2008. SAR images were pre-processed and then segmented using multi-resolution segmentation algorithm. Specific features such as geometric and texture features were selected and calculated for image objects derived from the segmentation of SAR images. Both neural network (NN) and support vector machines (SVM) were investigated for the supervised classification of image objects of RADARSAT-1 SAR images, while SVM was employed to classify image objects of RADARSAT-2 SAR images. Knowledge-based rules were developed and applied to resolve the confusion among some classes in the object-based classification results. The classification of both RADARSAT-1 and RADARSAT-2 SAR images yielded relatively high accuracies (over 80%). SVM classifier generated better result than NN classifier for the object-based supervised classification of RADARSAT-1 SAR images. Well-designed knowledge-based rules could increase the accuracies of some classes after the object-based supervised classification. The comparison of the classification results of RADARSAT-1 and RADARSAT-2 SAR images showed that SAR images with higher resolution could reveal more details, but might produce lower classification accuracies for certain land cover classes due to the increasing complexity of the images. Overall, the classification results indicate that the proposed object-based and rule-based approaches have potential for operational urban land cover mapping from high-resolution space borne SAR images.

II
Keywords: High-resolution, RADARSAT-1 SAR, RADARSAT-2
SAR, Urban Land Cover, Object-based Classification, Neural Network,
Support Vector Machines.

III
Acknowledgements I would first like to thank my supervisor, Professor Yifang Ban of the Division of Geoinformatics at KTH, for the patient guidance, considerable encouragement, support and advice she has provided throughout my time as her student. My assistant supervisor, Thuy Vu, deserves grateful thanks for the help and advice he offered during the course of my study at KTH. I also want to thank all the members of staff of the Division of Geoinformatics at KTH for their support both academically and personally. My parents always support and encourage me all my life. And then there are my sister Yan Hu and brother-in-law Yaohui Feng who always take so much care of me. I must express my appreciation to my girlfriend Yanqing Zhang for her encouragement, understanding, and patience even during hard times. I owe a lot to them. Finally many thanks to all my friends who were there for me at all stages of my life. Hongtao Hu Stockholm, November 2010

IV
Table of Contents
Abstract ................................................................................................... I
Acknowledgements ............................................................................. III
List of Appended Papers ...................................................................... VI
1. Introduction ........................................................................................ 1
1.1 Research Context ......................................................................................... 1
1.2 Research Objectives .................................................................................... 3
1.3 Organization of the Thesis ......................................................................... 3
2. Literature Review on SAR Data for Urban Land-cover Mapping .... 4
2.1 Characteristics of SAR Image in Urban Areas ......................................... 4
2.2 SAR Image Processing Techniques ........................................................... 9
2.2.1 Speckle filtering ..................................................................................... 9
2.2.2 Texture analysis ................................................................................... 10
2.3 SAR Image Classification in Urban Areas .............................................. 10
2.3.1 Pixel-based classification of SAR images ......................................... 10
2.3.2 Object-based classification of SAR images ..................................... 11
3. Study Area and Data Description .................................................... 15
3.1 Description of the Study Area ................................................................. 15
3.2 Data Description ....................................................................................... 16
4. Methodologies .................................................................................. 18
4.1 SAR Image Pre-processing ....................................................................... 18
4.1.1 Image orthorectification .................................................................... 18
4.1.2 Image filtering ..................................................................................... 18
4.1.3 Data transformation ........................................................................... 18
4.2 SAR Image Segmentation ......................................................................... 19
4.3 Feature Extraction/Selection ................................................................... 19
4.4 Object-based and Rule-based Classification .......................................... 20
4.4.1 Object-based NN classification ........................................................ 20
4.4.2 Object-based SVM classification ...................................................... 21

V
4.4.3 Rule-based classification .................................................................... 21
4.5 Accuracy Assessment ................................................................................ 22
5. Results and Discussions ................................................................... 23
5.1 Image Segmentation .................................................................................. 23
5.2 Image Classification ................................................................................... 25
6. Conclusions and Future Research ................................................... 33
6.1 Conclusions ................................................................................................ 33
6.2 Future Research ......................................................................................... 33
References ............................................................................................ 35

VI
List of Appended Papers This thesis is based on the following papers, which are referred to in the text by their Roman numerals. I. Hu, H. & Ban, Y., 2008. Urban Land-Cover Mapping and Change
Detection with Radarsat SAR Data Using Neural Network and Rule-Based Classifiers. In the International Archives of the Photogrammetry, Remote Sensing and Spatial Information Sciences. ISPRS Congress 2008, Beijing, China, vol. XXXVII, pp. 1549-1553.
II. Hu, H. & Ban, Y., 2008. Urban Land Use/Land Cover Mapping with
High-resolution SAR Imagery by Integrating Support Vector Machines into Object-Based Analysis. In Remote Sensing for Environmental Monitoring, GIS Applications, and Geology VIII. Cardiff, Wales, United Kingdom. SPIE vol. 7110, pp. 71100K1-8.
III. Hu, H. & Ban, Y., 2010. Multitemporal RADARSAT-2 Ultra-Fine-Beam
SAR Data for Urban Land Cover Classification. Submitted to the Canadian Journal of Remote Sensing.
1
1. Introduction
1.1 Research Context Urbanization is the physical growth of urban areas as people migrate from rural areas to existing urban areas. The 2005 Revision of the UN World Urbanization Prospects report described the rapid urbanization of the world’s population over the twentieth century (UN Department of Economic and Social Affairs 2005). The global proportion of urban population increased from a mere 13 percent in 1900 to 29 percent in 1950 and reached 49 percent in 2005. Since the world is projected to continue to urbanize, 60 percent of the global population is expected to live in cities by 2030, according to the UN World Urbanization Prospects report. The number of mega-cities with 10 million or more inhabitants increased from 2 in 1950 to 20 in 2005 and it is projected that there will be 22 mega-cities in 2015. Developing countries will have 17 of these 22 mega-cities in 2015. The rapid urbanization leads to massive changes in urban and suburban landscape. Therefore, mapping urban land-use/ land-cover and their changes regularly and accurately is important for effective urban planning, policy making, biodiversity conservation and sustainable management of land resources. Maintaining up-to-date land-use/land-cover information is both costly and time consuming using traditional field and air photo methods. Remote sensing technology provides an alternative way. In the last few decades, a great many researches proved the applicability of optical satellite data for land-use/land-cover mapping and the acquisition of some spatial information in urban areas (Gao & Skillcorn 1998; Shackelford & Davis 2003; Chou et al. 2005; Carleer & Wolff 2006). Most of the researches concerning urban remote sensing applications employ optical satellite imagery with spatial resolution ranging from 1 meter to 30 meters. Unlike passive optical sensors which usually detect reflected solar radiation in the visible and infrared part of the electromagnetic spectrum, Synthetic Aperture Radar (SAR) is active sensor and works with microwave which could penetrate clouds, smog and haze, so SAR can image the Earth’s surface day and night in almost all weathers. These properties make SAR systems an attractive data source for land-use/land-cover mapping, especially when optical data is not available due to various reasons. With the launch of several civil spaceborne SAR systems, such as ERS SAR, ENVISAT ASAR, RADARSAT-1, TerraSAR-X, RADARSAT-2, and ALOS PALSAR, SAR data are now routinely available which provide an

2
excellent opportunity for extracting urban land-use/land-cover information in a timely manner. TerraSAR-X and RADARSAT-2 even offer SAR imagery with a spatial resolution comparable to high-resolution optical systems like IKONOS. Past studies have demonstrated the potential of SAR for urban applications (Henderson & Xia 1997; Dell'Acqua & Gamba 2003; Dell'Acqua & Gamba 2006; He et al. 2006; Del Frate et al. 2007). Most of these researches dealt with very few classes or only attempted to extract specific urban structure or socioeconomic information. Ban & Wu (2005), Ban & Hu (2007) and Ban et al. (2010) managed to extract eleven land cover classes from multi-temporal RADARSAT-1 images in the rural-urban fringe of the Greater Toronto Area. Detailed and accurate land-use/land-cover mapping from SAR imagery in urban areas is hampered by several factors. SAR image processing is commonly considered as a hard task due to the complexity of image content. An obvious characteristic of SAR images is the so-called ‘speckle’ which originates from the coherent data recording of SAR systems. SAR images become even more complicated in urban areas because of the high variability of urban landscape, the complex combinations of natural and man-made elements, the wide variety of materials, object forms, orientation, facet and size (Franceschetti et al. 2002). Thus, there is a strong need to improve our understanding of complex interactions between SAR signals and diverse urban features, and to develop effective methodologies to extract information on urban land-use/land-cover from high-resolution spaceborne SAR data. Traditionally, SAR imagery classification is performed using pixel-based methods. Texture and contextual information is often used to help improve the classification accuracy for SAR images. Object-based classification method has been introduced to remote sensing image analysis for a long time, but it is rarely used for SAR imagery classification. Due to the complex content of SAR imagery, it is very hard to segment SAR imagery into meaningful image objects by existing segmentation algorithms, especially in urban areas where the landscape is highly heterogeneous and the interactions between SAR signals and ground features are very complicated. Object-based image analysis enables the integration of human knowledge into the classifiers and therefore may solve to some extent the confusion between some land-cover classes which have similar spectral reflectivity in optical images or similar radar backscatter in SAR images. A few studies employed object-based methods for urban SAR image classification and yielded good results (Ban et al. 2010; Niu & Ban 2010).
3
1.2 Research Objectives This research investigates the potential of high resolution SAR data in the context of urban applications. The main objective of this research is to develop effective methodologies to extract detailed urban land-use/land-cover information from high-resolution satellite SAR data. Specifically, object-based and rule-based approaches are examined and developed to classify high-resolution SAR imagery. Radarsat-1 and Radarsat-2 images with different spatial resolutions are classified and the classification results are compared.
1.3 Organization of the Thesis This thesis is organized as follows. Chapter 1 outlines research background and research objectives. Chapter 2 presents a literature review of current progress on SAR data processing and applications in urban landuse/land-cover mapping. Chapter 3 describes the study area and data used in the study. Chapter 4 presents the methodologies for classifying SAR images over urban areas. Chapter 5 analyzes the classification results and discusses the performance of the proposed methods. Conclusions are made in Chapter 6. Paper I and Paper II dealt with RADARSAT-1 fine-beam C-HH SAR images while Paper III handled ultra-fine-beam C-HH SAR images. All three Papers adopted object-based approaches to classify SAR images. Paper I combined neural network and rule-based classifiers for SAR image classification. Support vector machine (SVM) was the main classifier in Paper II. Paper III used both SVM and rule-based classifiers to produce urban land cover map.

4
2. Literature Review on SAR Data for Urban Land-cover Mapping This chapter reviews the recent progress in SAR image processing in urban areas, especially the employment of SAR images for urban land use and land cover mapping.
2.1 Characteristics of SAR Image in Urban Areas Remote sensing systems operating in different regions of electromagnetic spectrum could render the Earth’s surface in quite distinct ways. While reflectance measurements in the visible and near-infrared regions are mainly related to molecular resonances of ground surface materials, the backscatter of a radar wave is mostly determined by radar system parameters and the physical properties of surface objects such as surface roughness and dielectric constant. Remote sensing techniques have been utilized as a powerful tool for urban analysis for decades. Optical imaging systems have received most of the attention in urban studies and thus offered the most widely used techniques (Weng & Quattrochi 2006). Although extensive researches have been carried out on applications of radar remote sending in the studies of agriculture, forests, soils, oceans, and geomorphology, urban environment analysis based on radar imagery has not caught great and comparable interest. SAR data has been used to distinguish different land cover types, including urban, water, forests and vegetation (Del Frate et al. 1999; Dell'Acqua et al. 2003; Tison et al. 2004; He et al. 2006; Dell'Acqua & Gamba 2006; Bonci et al. 2006; Gamba et al. 2007). Most of these studies, however, examined the urban environment in a broad sense without detailed information. The less advanced state of SAR applications in urban studies is largely attributed to highly variable structures of urban landscape and the complex interactions between radar signals and urban features, which make the interpretation of urban SAR imagery a huge challenge. Urban areas are amongst the most complicated environments on Earth. Man-made structures of various shapes and sizes, natural elements and other unpredictable elements like cars coexist in complex forms and patterns in urban areas. These urban elements interact with the transmitted radar signals in complicated ways, and therefore various radar backscattering mechanisms including single bounce, double bounce and triple bounce may contribute to the backscatter.

5
Several theoretical models have been developed to describe how ground objects interact with radar signals in urban areas, which may help improve our understanding and interpretation of SAR images. Franceschetti et al.(2002) presented a geometric and electromagnetic model of a typical element of urban structure, a building over a rough terrain, in order to analytically evaluate its electromagnetic return. The analytical results were used to quantitatively analyze the field backscattered from a building as a function of several parameters. Franceschetti et al. (2003) then proposed a SAR raw signal simulator for urban scenes along with models it employs to compute the backscattered field and to account for the imaging radar sensor characteristics. Their results indicate that the simulator is able to quantitatively assess performances of SAR sensors over urban structures. Delliere et al. (2007) argue that finite-difference time domain method (FDTD) is a quite promising approach to simulate radar wave propagation inside urban areas. Dell'Acqua et al. (2003) employed the simulator proposed by Franceschetti et al to generate fine resolution SAR data in urban areas. The simulated SAR images were then analyzed and the results showed the huge potentiality of high resolution SAR data for urban area mapping and monitoring. Franceschetti et al. (2007) compared simulated SAR images with the real one and found that interpretation of real SAR data was improved with the help of simulation tools. Although theoretical models could be used to describe the interactions between radar signals and ground objects, most practical knowledge about characteristics of SAR imagery has come from empirical observations. The intensity and patterns of radar returns from urban features are determined by radar system properties, surface feature properties, and environmental variables (Xia & Henderson 1997).The primary radar system properties are wavelength, polarization, incidence angle, look direction and spatial resolution. Properties of surface features affecting radar signal returns include dielectric properties, surface roughness and feature orientation. Important environmental variables include landform characteristics, type, amount, and pattern of vegetation cover, land cover classes and patterns, settlement history, local climate and seasonal changes. Since many of these properties are interrelated, it is impossible to separate out each of their individual contributions to the intensity and patterns of radar returns from ground features. Changes in one of these properties may have an impact on the response of other properties, which together will affect the received radar backscatter. In the following sections, these properties are grouped for the purposes of detailed discussion.

6
a) Wavelength and surface roughness
Radar systems use specific microwave bands in remote sensing. Bands that are commonly used in imaging radars include X, C, S, L and P, in order of increasing wavelength (Sabins 1997). Radar wavelength has a fundamental influence on the interaction between the electromagnetic wave and the natural medium (Garestier et al. 2006). As wavelength increases, surface roughness criteria will also change. In general, more surface features will appear smoother at longer wavelengths than at shorter wavelengths. At X-band wavelength the surface roughness of grass and open areas may produce a tone and image texture distinct from that of impervious surfaces, but at L-band wavelength the signal returns may be quite similar, producing confusion in identifying these land-cover categories (Xia & Henderson 1997). Bryan (1975) and Haack (1984) found that the X-band imagery was slightly better than the L-band imagery for overall interpretation of urban features. The preference of the X-band imagery over the L-band for general interpretation is a result of the greater sensitivity of the shorter wavelength to surface roughness. However, Xia and Henderson (1997) reported that as the wavelength decreases the image becomes increasingly noisy and the image contrast decreases. The system wavelength also influences signal penetration of the vegetation canopy and terrain surface. In principal, radar signals are capable of penetrating what would normally be considered solid features. Longer wavelengths usually result in higher penetration. The surface roughness of a feature controls how radar energy interacts with that surface or target and thus strongly influences the strength of radar returns and how it appears on the radar image. Surface roughness is determined by the relationship of surface relief, at the scale of centimeters, to radar wavelength and to the depression angle of the antenna. The Rayleigh criterion is usually used to evaluate whether a surface responds to incident radar signal as a smooth or rough surface (Sabins 1997). A surface is considered "smooth" if the height variations are much smaller than the radar wavelength. A given surface will appear rougher as the wavelength becomes shorter and smoother as the wavelength becomes longer. A smooth surface causes specular reflection of the incident energy (generally away from the sensor) and thus appears as darker toned areas on an image, while a rough surface will scatter the energy approximately equally in all directions and will appear brighter in tone on an image. For a given surface and wavelength, the surface will appear smoother as the incidence angle increases (CCRS 2007). Experimental results and studies using simulation models have shown that the radar signal is more sensitive to surface roughness at high incidence angles than at low incidence angles (Fung & Chen 1992; Baghdadi et al. 2002; Holah et al. 2005).

7
b) Polarization Radar transmit microwave radiation in either horizontal (H) or vertical (V) polarization, and similarly, receive the backscattered signal at one of these polarizations. Polarimetric radars are able to transmit and receive both horizontal and vertical polarizations. Therefore, they are able to receive and process all four combinations of these polarizations: HH, HV, VH, and VV. HH and VV are referred to as like-polarized while HV and VH are referred to as cross-polarized. Each of these ‘polarizing channels’ has varying sensitivities to different surface characteristics and properties. For example, the dynamic range of the like-polarized component is larger than that of the cross-polarized component for urban areas; this is in contrast to the measurement for forested areas, where the dynamic range of the cross-polarized component is larger than that of the like-polarized component (Dong et al. 1997). Hussin (1995) studied the effect of polarization and incidence angle on radar return from urban features using L-band aircraft radar data and concluded that: 1) Radar corner reflection from building is highly affected by the type of polarization and the degree of incidence angle; 2) The like-polarization (HH or VV) shows high corner reflection and is significantly different from the results observed for cross-polarization (VH or HV). Signal return of like-polarized imagery is dominated by surface scatter. Volume scatter is the major influence on signal return of cross-polarized imagery. The cross-polarized imagery is less susceptible to the specular return from dihedral and trihedral reflectors that is apparent on the like-polarized imagery, and thus is preferred in urban applications by some researchers (Xia & Henderson 1997). Past studies showed that radar imagery collected using different polarization may provide different and complementary information about the targets on the surface and thus improve the interpretation of different urban features (Dong et al. 1997). The use of polarimetry datasets for urban analysis has been accelerated in recent years with more and more fully-polarimetric SAR systems being in operation. Several studies demonstrated that polarimetric datasets have great potential for urban applications (Schneider et al. 2006; Garestier et al. 2006).
c) Radar viewing and surface geometry The relationship between viewing geometry and the geometry of the surface features plays an important role in how the radar energy interacts with targets and their corresponding brightness on an image (CCRS 2007).

8
Variations in viewing geometry will accentuate and enhance topography and relief in different ways, such that varying degrees of foreshortening, layover, and shadow may occur depending on surface slope, orientation, and shape. Foreshortening is a dominant effect in SAR images of mountainous areas. Especially in the case of steep-looking space-borne sensors, the cross-track slant-range difference between two points located on fore slopes of mountains are smaller than they would be in flat areas (Lee & Pottier 2009). The layover phenomenon occurs at locations with steep elevation gradient facing towards the sensor, like vertical building walls. Because objects located at different positions have the same distance to the sensor, like roofs, walls and the ground in front of buildings, the backscatter is integrated to the same range cell. Layover areas appear bright in the SAR image (Soergel et al. 2002). A slope away from the radar illumination with an angle that is steeper than the sensor depression angle provokes ‘‘radar shadow’’. Shadow regions appear as dark areas in the SAR image, corresponding to a zero signal, but solely due to the system noise level of the radar sensor, the intensity level may not be zero (Lee & Pottier 2009). Weydahl (2002) investigated backscatter variations in SAR imagery using three RADARSAT fine mode images acquired over the same urban area, which gave a set of images with three different incidence angles for the same geographical position. Backscatter changes of more than 6 dB were observed from many urban-type objects. Such large changes may indicate the presence of specular scattering. The largest backscatter changes were observed in residential areas, but industrial areas also gave large differences when comparing the SAR backscatter from the three fine modes. None of the 10 urban classes used in this study showed a systematic backscatter change as a function of RADARSAT incidence angle. Dong et al. (1997) examined the dominant radar backscattering mechanisms such as single bounce from roofs, double bounce from wall-ground structures and possibly triple bounce from wall-wall-ground structures, and their relative contributions to the backscatter. They concluded that radar backscattering from urban areas is mainly dominated by (a) single bounce from roofs; (b) double bounce from wall-ground structures, and (c) other metallic constituents. The single bounce component depends on the style of the buildings and the incidence angle. The backscattering can be dominated by single bounce from facets such as tilted roofs which happen to face the radar. They also found a good correlation between backscattering response and building’s bulk size as well as density if the effect of the buildings’ orientation is compensated.

9
d) Dielectric properties The dielectric constant is an electrical property that influences the interaction between features and electromagnetic energy, especially at radar wavelengths (Sabins 1997). Metallic objects have high complex dielectric constants. High dielectric constants, together with appropriate orientation and incidence angle, contribute to the strong returns from urban features such as metal bridges and railroad tracks on radar images (Xia & Henderson 1997). The moisture content also affects the electrical properties of an object or medium, which in turn influence the absorption, transmission, and reflection of radar energy and how targets will appear on a radar image. Generally, reflectivity (and image brightness) increases with increased moisture content. Surfaces such as soil and vegetation cover will have higher brightness on radar images when they are wet than when they are dry (CCRS 2007). The high radar reflectance from wet soil and vegetation can create confusion when interpreting urban man-made metallic features which also have high radar returns.
2.2 SAR Image Processing Techniques 2.2.1 Speckle filtering All radar images appear with some degree of what we call radar speckle. Speckle appears as a grainy "salt and pepper" texture in an image. This is caused by random constructive and destructive interference from the multiple scattering returns that will occur within each resolution cell. Speckle is essentially a form of noise which degrades the quality of an image and may make interpretation (visual or digital) more difficult. Thus, it is generally desirable to reduce speckle prior to interpretation and analysis. Speckle reduction can be achieved in two ways: multi-look processing or spatial filtering (CCRS 2007). Multi-look processing involves the averaging of several samples of a same scene and is usually done during data acquisition. Speckle reduction by spatial filtering is performed on the output image in a digital image analysis environment. Spatial filtering takes into account the local statistics and texture properties of one image. Commonly used filters for reducing the high-frequency noise (speckle) while preserving the high-frequency features (edge) include Lee filter, Enhanced Lee filter, Frost filter, Enhanced Frost filter, Kuan filter and Gamma filter etc with different window sizes, iterations and other parameters (Shi & Fung 1994). Intensity-Driven
10
Adaptive-Neighborhood Technique proposed by Vasile et al. (2006) is a relatively new spatial filter which is very effective. 2.2.2 Texture analysis Image texture is considered as the change and repeat of image grey in space, or local pattern in image and its arrangement rules. Texture is an important visual cue, used by both man and machine in describing and assessing object surfaces. The spatial and scale properties of texture have made it an important attribute in the analysis of remotely sensed images, where different surfaces such as those of rocks, sea-ice, seawater, vegetation, urban areas, etc. can be characterized by distinct textural features (Kandaswamy et al. 2005). Texture measures are based on statistical dependences between pixels within a certain region. In practice, this region means pixels within a moving window (a kernel) and the textural measure is calculated for the centre pixel of this window. Different methods have been proposed for the analysis of image texture. Popular methods include those based on the gray-level cooccurrence matrix (GLCM) (Haralick 1979), Markov random fields (MRFs) (Manjunath & Chellappa 1991), Gabor wavelets (Manjunath & Ma 1996), wavelet packets (Pun & Lee 2003), sum-difference histograms, etc. For analysis of remotely sensed images, the GLCM-based methods are the most predominant (Baraldi & Parmiggiani 1995; Soh & Tsatsoulis 1999; Kandaswamy et al. 2005). The proper use of texture features could improve classification of SAR images (Paudyal et al. 1995).
2.3 SAR Image Classification in Urban Areas 2.3.1 Pixel-based classification of SAR images SAR images are traditionally classified on a pixel-by-pixel basis. In single-band and single-polarized synthetic aperture radar (SAR) image classification, texture holds useful information. A large number of studies have been carried out to use texture information to improve the classification accuracy of SAR images (Dell'Acqua & Gamba 2006; Dell'Acqua et al. 2006; Akono et al. 2000; Paudyal et al. 1995; Dekker 2003; Dell'Acqua & Gamba 2003; Carr & De Miranda 1998).
SAR image classification can be based on the use of statistical models. When processing SAR images, there is a strong need for statistical models of scattering to take into account multiplicative noise and high dynamics. Tison et al. (2004) used a mathematical model that relies on the Fisher distribution and the log-moment estimation and which is relevant for one-look data for

11
high-resolution SAR images over urban areas and applied it in a Markovian classification algorithm. Clutter in SAR images becomes non-Gaussian when the resolution is high or when the area is man-made. Many models have been proposed to fit with non-Gaussian scattering statistics, but none of them is flexible enough to model all kinds of surfaces in urban areas. To combat the effect of speckle on a given pixel's backscatter, a Markov Random Field (MRF) model is used to incorporate contextual information from the imagery by considering neighbor pixel statistics in the classification process (Crawford & Ricard 1998). To address the class-specific decrease in backscatter as a function of angle, a hierarchical two-level classifier is considered to compensate for the highly variable water class and the less influenced land classes. SAR images have been often used for urban area extraction. Usually only two classes are involved: urban areas and non-urban areas. Both supervised and unsupervised classification methods were examined (He et al. 2006; Dell'Acqua et al. 2003; Chamundeeswari et al. 2008; Gomez-Chova et al. 2006). 2.3.2 Object-based classification of SAR images During the last several years, a new approach, called Object-Oriented Image Analysis, integrated low level image analysis methods, such as segmentation procedures and algorithms (Baatz & Schape 2000) with high level methods, such as Artificial Intelligence (fuzzy knowledge-based systems) and Pattern Recognition methods. Within this approach, the low level image analysis produces primitive image objects, while the high level processing classifies these primitives into meaningful domain objects (Benz et al. 2004). Unlike the pixel-based methods, the object-based methods are based on segmenting the image into homogeneous regions and use the shape, texture and context associated with the objects thus provide an improved basis for image analysis. Object-based image classification starts with segmenting the images in to primitive image objects. The image objects are then classified by means of various classification algorithms.
a) Image segmentation
Image segmentation is the first step in object-based image classification. The aim of the image segmentation is to divide the image into meaningful segments (or image objects). Every image object is characterized by a huge set of features which define the spectral properties, shape, texture, context, etc. These image objects may or may not correspond to the real world objects. However, they are further analyzed to define real-world objects in

12
the image. This process is called image classification. Image segmentation is the most important step, because of the fact that the basis for extracting the real world objects is the proper segmentation of image in to image objects (Marpu 2009). Traditional image segmentation methods have been commonly divided into three approaches: pixel-, edge and region based segmentation methods (Blaschke et al. 2004). Pixel based methods include image thresholding and segmentation in the feature space. In edge based segmentation methods, the aim is to find edges between the regions and determine the segments as regions within these edges. From this point of view, edges are regarded as boundaries between image objects and they are located where changes in values occur. There are various ways to delineate boundaries but in general the first step of any edge-based segmentation methods is edge detection which consists of three steps: filtering, enhancement and detection. Region-based segmentation algorithms can be divided into region growing, merging and splitting techniques and their combinations. Many region growing algorithms aggregate pixels starting with a set of seed points. The neighbouring pixels are then joined to these initial ‘regions’ and the process is continued until a certain threshold is reached. This threshold is normally a homogeneity criterion or a combination of size and homogeneity. Some of region growing algorithms are different types of texture segmentation algorithms (Tzotsos et al. 2006). Multi-resolution segmentation is a very commonly used region growing algorithm without the need of seed points (Baatz & Schape 2000) and is implemented in the commercial software Definiens eCognition/Developer. Espindola et al. (2006) proposed an objective function for selecting suitable parameters for region-growing algorithms to ensure best quality results. In region merging and splitting techniques the image is divided into subregions and these regions are merged or split based on their properties. Synthetic Aperture Radar (SAR) images are corrupted with a large amount of multiplicative speckle noise, which makes segmentation of SAR images a huge challenge. (Esch et al. 2008) proposed an optimization approach that enhances the quality of image segmentation using the software Definiens Developer. The optimization iteratively combines a sequence of multiscale segmentation, feature-based classification, and classification-based object refinement. The developed method was applied to a SAR image and the quantitative assessment of segmentation accuracy showed an improvement of over 20% in object accuracy by applying the proposed procedure. Aspert et al. (2007) proposed a new set of algorithms to analyze multi-temporal SAR sequences, taking advantage of information redundancies and complementarities. Several issues were tackled: filtering, edge detection and image segmentation methods capable of exploiting this multi-temporal

13
information. Caves et al. (1998) developed a range of measures for quantifying the performance of SAR segmentation algorithms.
b) Object-based image classification of SAR images Object-based classification method has been introduced to remote sensing image analysis for a long time, but it is rarely used for SAR imagery classification. Due to the complex content of SAR imagery, it is very hard to segment SAR imagery into meaningful image objects by existing segmentation algorithms, which in turn limits the application of object-based method in SAR image classification. Only a few studies have been conducted to classify SAR images using object-based approach in urban areas. Corr et al. (2003) developed an objected based classification scheme to classify interferometric polarimetric synthetic aperture radar (SAR) data in urban areas. Radiometric, polarimetric, interferometric and geometric properties were derived to resolve the ambiguities between some classes and separate images objects into different classes. Esch et al. (2005) developed a robust object-oriented approach to automatically detect built-up areas from high resolution radar imagery. They first introduced a classification-based optimization procedure to stabilize and improve the initial image segmentation step. Subsequently the identification of built-up areas is performed on the basis of three image segmentation levels in different spatial scales. Contextual and textural features along with shape-related and hierarchical characteristics play a major role. They illustrated the transferability and robustness of the presented approach by applying the developed classification scheme to E-SAR data of three complete flight tracks. Thiel et al. (2008) showed the potential and the limitations of TerraSAR-X in view of the automated object-oriented detection of human settlement. Only two classes were investigated in the study: urban areas and not urban areas. Two urban environments were analyzed in this study: the Upper Rhine Valley and the region of Munich in Germany. The presented approach towards the detection of urban areas by means of TerraSAR-X data achieves overall accuracies around of 95% and 89% - an indicator for the high potential of TerraSAR-X data in terms of identifying built-up areas. Object-based classification of SAR images in non-urban areas were carried out by a few researchers. Heremans et al. (2003) used object-based classification technique to detect flooded areas on ENVISAT/ASAR image and successfully delineated the flooded areas. Ross et al. (2002) used RADARSAT-1 images to monitor and map malaria using object-based approach in Kenya. Benz & Pottier (2001) employed the object based image analysis software eCognition on alpha, entropy and anisotropy and the span of fully polarimetric L-Band SAR data of the German airborne sensor, E-

14
SAR. They showed that by using eCognition land cover classes can be conveniently assigned to the scattering classes and ambiguities can be resolved by geometric and context object features. Several researchers combined radar and optical images for various applications by means of object-based classification. Li & Chen (2005) used optical and radar remote sensing images with DEM data to develop an approach towards operational wetland mapping which can deal with wetland complexity in Canada and significantly improve wetlands classification accuracy. They adopted an objected and rule-based wetland mapping method that integrates Landsat-7/ETM+, Radarsat-1/SAR images and DEM data. The test results indicate that the classification accuracy of the new method ranges from 71% to 92%, for open bog, open fen, treed bog, marsh and swamp at the three sites. Amarsaikhan et al. (2007) used an objected and rule-based algorithm to classify urban land-cover types using the features derived from optical and spaceborne SAR Interferometry (InSAR) data sets. The result of the rule-based method is compared with the results of a standard pixel-based supervised classification and it demonstrates a higher accuracy. Their research indicates that the integrated features of the optical and InSAR images can significantly improve the classification of land-cover types and the rule-based classification is a powerful tool in the production of a reliable land-cover map.

15
3. Study Area and Data Description
3.1 Description of the Study Area The study area is located in the north and northwest part of the GTA, Ontario, Canada, where rapid urban expansion and sprawl has encroached onto the Oak Ridges Moraine, one of the most distinct and environmentally significant landforms in southern Ontario. In terms of administrative areas, the study area is comprised of the town of Vaughan, Richmond Hill, the northwest part of former North York and Markham, the southern part of King, Aurora, and the west part of Brampton, in the Greater Toronto Area (Figure 3.1). In recent years, Vaughan and northern Richmond Hill has become the most dynamic rural-urban fringe of the GTA, experiencing rapid expansion and urban sprawl partly due to the incoming immigrants.
Figure 3.1 Map of the Greater Toronto Area (GTA), Ontario, Canada.
Study area is in the blue rectangle.
The major landuse/land-cover classes were high-density built-up areas (HDB), low-density built-up areas (LDB), roads, forests, parks, golf courses

16
(GC), water and four types of agricultural land (soya, corn, wheat and pasture).
3.2 Data Description Different types of data from different sources were used for this study. They are as follows: 1. RADARSAT-1 fine-beam C-HH SAR data 2. RADARSAT-2 ultra-fine-beam C-HH SAR data 3. Landsat ETM+ data 4. NTDB vector data 5. DEM 6. Reference data
1) RADARSAT-1 SAR data Five-date RADARSAT-1 fine-beam C-HH SAR images with a spatial resolution of 10 meters and a pixel spacing of 6.25 meter were acquired during May to August in 2002. The detailed descriptions of these images are given in Table 3.1. These five-date SAR images can be grouped into two categories based on the orbit and beam position. The first group, May 14, July 1 and August 18 images were acquired in an ascending orbit with Fine-2 beam-mode, except that the May 14 image was in beam-mode Fine 2 Far rather than Fine 2. The second group, July 16 and August 9 images were acquired with Fine 4 Near beam position in a descending orbit.
Table 3.1 RADARSAT Fine-Beam SAR Imagery
Acquisition date
Beam position
Orbit Incidence angle range (degree)
May 14 2002 Fine 2 Far Ascending 39.5-42.5
Jul. 1 2002 Fine 2 Ascending 39.3-42.1
Jul. 16 2002 Fine 4 Near Descending 43.2-45.5
Aug. 9 2002 Fine 4 Near Descending 43.2-45.5
Aug. 18 2002 Fine 2 Ascending 39.3-42.1
2) RADARSAT-2 SAR data Three-date RADARSAT-2 ultra-fine-beam C-HH SAR images with a pixel spacing of 1.56 meter and a spatial resolution of 3 meters were acquired over the north part of the Greater Toronto Area (GTA) during June to September in 2008. The images were all acquired in ascending orbit and at

17
incidence angle range of 30.6 to 32.0. The detailed descriptions of these images are given in Table 3.2. The RADARSAT-2 SAR images covered slightly less area than the RADARSAT-1 images.
Table 3.2 RADARSAT-2 Ultra-Fine-Beam SAR Imagery
Acquisition date
Beam mode Orbit Incidence angle range (degree)
Jun. 25 2008 U2 Ascending 30.62-32.04
Aug. 12 2008 U2 Ascending 30.62-32.04
Sep. 5 2008 U2 Ascending 30.62-32.04
3) Landsat ETM+ data Landsat 7 ETM+ data acquired in 2002 and 2005 was used in this study mainly to improve the visual quality of NTDB vectors for image registration and to help selecting ground reference data for classification calibration and validation.
4) National Topographic DataBase (NTDB) vector data NTDB vectors of 1:50,000 were used for georeferencing ASAR images and verifying collected ground truth data. These vectors include roads, railways, runways, rivers and streams, water bodies, forest, built-up areas, bridges and administrative boundaries etc.
5) DEM A DEM of 30m resolution was used in the study to orthorectify the ASAR images. The DEM was produced by DMTI Spatial Inc. based on the latest 1:50,000 NTDB vectors (Standards and Specifications V3.0 and later) with a cell resolution of 30 meters. Projection is UTM, datum is NAD83, and data format was ASCII grid text file and was later imported to PCIDSK format.
6) Reference data Orthophotos from 1999 were used as a reference to identify landuse/land cover in the field. Field data on various landuse/land-cover types, their roughness and moisture conditions, vegetation heights, gound-coverages were collected during each satellite overpass. Photographs were taken during fieldwork to assist image interpretation and analysis.

18
4. Methodologies
4.1 SAR Image Pre-processing 4.1.1 Image orthorectification To remove relief displacements and bring SAR images of different dates to the same database, multi-temporal RADARSAT-1 SAR images were orthorectified to the NTDB database at a pixel-spacing of 6.25 m using satellite orbital models, a DEM at 30 m resolution and ground control points. Similarly, multi-temporal RADARSAT-2 SAR images were orthorectified to the NTDB database at a pixel-spacing of 1.56 m. 4.1.2 Image filtering Radar speckle appears as a grainy "salt and pepper" texture in an image. This is caused by random constructive and destructive interference from the multiple scattering returns that will occur within each resolution cell. It is generally desirable to reduce speckle prior to interpretation and analysis. In Papers I and II, the RADARSAT-1 SAR images were not filtered because of the resolution. Linear features on the images such as roads would be affected to some degree if image filtering was conducted on the images of 10 meters resolution. The RADARSAT-2 SAR images of 3 meters resolution were filtered using Intensity-Driven Adaptive-Neighborhood technique proposed by Vasile et al. (2006). For each pixel, an adaptive neighborhood (AN) is determined by a region growing technique driven exclusively by the intensity image information. Afterwards, all the pixels within the obtained AN are used to yield the filtered values of the pixel, which can be derived from the locally linear minimum mean-squared error (LLMMSE) estimator. 4.1.3 Data transformation Both RADARSAT-1 and RADARSAT-2 SAR images were converted from 16-bit unsigned depth to 8-bit unsigned depth, as the resulting images were less time-dependent and experiments showed that it may lead to better segmentation. The simple linear rescale min-max algorithm was used with the max value set equal to the mean value plus two times the standard deviation value. In such a transformation only extreme values are excluded, resulting in a very reliable outcome for the majority of SAR images. Such a transformation not only significantly saved the computation time of

19
subsequent processes, but also made the segmentation algorithm perform better.
4.2 SAR Image Segmentation SAR image were segmented using the multi-resolution segmentation algorithm introduced by Baatz and Schape (2000), which was implemented in the commercial image analysis software, Definiens eCognition. The procedure for the multi-scale image segmentation can be described as a bottom-up region merging technique and is therefore regarded as a region based segmentation method. It starts with each pixel which is assumed to be an image object. Pairs of objects are merged to form larger object based on a homogeneity criterion which is comprised of color and shape components. A ‘merging cost’ is assigned to each possible merge. A merge takes place if the merging cost is less than a user-specified threshold, which is scale parameter in eCognition. The procedure stops when there are no more possible merges. In Paper I, only one segmentation level was created and it contained 44,123 image objects. In Papers II and III, two segmentation levels were produced. In Paper II, the lower level (level 1) contained 44,123 image objects and the higher level (level2) 9,049 image objects. The level 1 in Paper II was the same as the only segmentation level in Paper I. In Paper III, the lower level (level 1) and the higher level (level2) contained 131,251 and 25,345 image objects, respectively. Details about the parameters used in the process of segmentation can be found in Section 3 of Paper I, II and III.
4.3 Feature Extraction/Selection Image segmentation is a necessary step in object-based image classification. The image objects created by segmentation can be characterized by spectral, shape and textural features. A classifier can then utilize the feature values to assign each image object to a land cover class. In Paper I, a total of 68 features were extracted and calculated for all image objects on the only segmentation level. A feature reduction method called Minimum-redundancy-maximum-relevance (mRMR) feature selection which was proposed by Peng et al. (2005), was used to select a subset of the features. Feature reduction could considerably reduce the computational cost when neural network classifier was applied to classify image objects. It also allowed better neural network training. The 16 selected features used for neural network classification can be found in Table 2 in Paper I.

20
In Papers II and III, features were extracted from both the segmentation levels. Two segmentation levels were created because we wanted to use more textural and contextual information in the classification process. Texture and contextual information enable the classifier to know what the surrounding pixels are like and thus make a better judgement. If an image is segmented to meaningful objects, information such as mean value, standard deviation and texture can be acquired. However, if there is only one segmentation level, it is still hard to know much about the relationships between image objects and their neighbouring objects. The features such as ‘mean difference to neighbours’ can give some information about neighbouring objects, but they are not enough. Therefore, two segmentation levels were created. Classification would take place on the lower level, but the upper level could provide additional information for classification. The image objects on the lower level inherited features from their super objects on the upper level. Because an image object on the lower level is a part of its super object, the inherited feature values will give it more information about its neighbouring objects and its context. The extracted features are listed in Table 3 in Paper II and Paper III. Fewer features were used in Paper III than in Paper II because some features Paper II were correlated. If too many features were used, it would take very long time to export image objects with those features in eCognition for subsequent classification. Since the segmentation levels of RADARSAT-2 images contained much more objects than those of RADARSAT-1 images, it was necessary to only use uncorrelated features to facilitate the exporting process. Feature reduction process was not performed in Papers II and III. The SVM classifier used in Papers II and III could deal with thousands of features without causing enormous computational cost. The similarity of two or more features has a limited impact on the performance of SVM classifier.
4.4 Object-based and Rule-based Classification 4.4.1 Object-based NN classification Paper I employed neural network (NN) classifiers to classify image objects to land-cover types. The classification was performed in PCI Geomatica. Neural network classifiers are computer programs designed to simulate human learning process through establishment and reinforcement of linkages between input data and output data. NN presents a non-parametric, distribution-free approach to image classification. NN classifiers have been applied to multi-source, multi-dimension data and often produced better results than classical classifiers such as Maximum Likelihood Classifier (MLC).

21
4.4.2 Object-based SVM classification The support vector machine (SVM) represents a group of theoretically superior machine learning algorithms. The SVM employs optimization algorithms to locate the optimal boundaries between classes. Statistically, the optimal boundaries should minimize the confusion between classes. Studies have demonstrated considerable success in using SVM for land cover mapping using optical data (Belousov et al. 2002; Camps-Valls et al. 2004; Pal & Mather 2004; Pal & Mather 2005). Details of the theoretical development of SVM classifier can be found in Paper II or (Burges 1998; Muller et al. 2001). Paper II and Paper III used SVM to assign image objects to land cover classes. An SVM library called LIBSVM was chosen to perform the classification (Chang & Lin 2010). SVM was originally designed for binary (two-class) problems and used as a binary classifier. The one-against-one approach (Huang et al. 2002; Hsu & Lin 2002) was chosen to tackle multi-class problem. RBF kernel was considered in the study. In Paper II, the cross-validation process gave the best parameter C =2 and γ=0.03125 with five-fold cross-validation rate = 92.1%. In Paper III, the cross-validation process presented the best parameter C =8 and γ=0.5 with five-fold cross-validation rate = 85.7%. The training model was then used to predict the classes that image objects belong to. 4.4.3 Rule-based classification The similarity of radar backscatter or appearances of some classes on the SAR images may cause confusion among those classes in the object-based NN or SVM classification result. Knowledge-based rules containing class-related features could be designed to refine the classification result. In Paper III, confusion existed among several classes after the object-based SVM classification of the RADARSAT-2 images. For example, golf courses, roads, pasture and parks all exhibited low backscatter and therefore some image objects of these classes were not correctly classified in object-based SVM classification result. A class called low backscatter was used to represent these four classes. Forests and corn were not well separated. There was also some confusion between high-density built-up and low-density built-up areas in the result. Knowledge-based rules were developed and applied to resolve the confusion among the above mentioned classes. The classification flowchart and the rules can be found in Section 3.7 in Paper III.

22
In Paper I, golf courses, roads, pasture and parks were also confused with each other in the object-based NN classification result. 12% of corn areas were misclassified as forests. Forests were highly confused with low-density built-up areas while high-density built-up areas were not seriously confused with low-density built-up areas. The rule-based classification process in Paper I was similar to that in Paper III except that rules based on class-related features were developed to resolve the confusion between forests and low-density built-up areas and no rules were applied to solve the misclassification between high-density built-up and low-density built-up areas. Rule-based classification was not performed in Paper II.
4.5 Accuracy Assessment The classification results were compared with the validation or reference data and confusion matrices were constructed. The corresponding producer and user accuracies of each class were assessed and the quality of the whole classification map was evaluated by overall accuracy and Kappa coefficient of agreement (or Kappa) which were derived from the confusion matrices.

23
5. Results and Discussions
5.1 Image Segmentation SAR image segmentation is a difficult task owing to the complicated image content, especially in urban areas. It is nearly impossible to get very smooth boundaries between image objects when segmenting SAR images. Figure 5.1 shows examples of the segmentation results of RADARSAT-1 and RADARSAT-2 SAR images in the same urban area. Some new buildings appeared in RADARSAT-2 SAR images. Image (e) in Figure 5.1 was taken from the only segmentation level of RADARSAT-1 8-bit SAR images in Paper I. The segmentation level 1 in Paper II was identical to the only segmentation level in Paper I. Image (c) in Figure 5.1 was taken from a segmentation level of RADARSAT-1 16-bit SAR images, which contained approximately the same number of image objects as the only segmentation level of RADARSAT-1 8-bit SAR images in Paper I. Image (f) in Figure 5.1 was taken from segmentation level 2 of RADARSAT-2 8-bit SAR images in Paper III. Image (d) in Figure 5.1 was taken from a segmentation level of RADARSAT-2 16-bit SAR images, which contained approximately the same number of image objects as segmentation level 2 of RADARSAT-2 8-bit SAR images in Paper III. From visual interpretation, segmenting SAR images derived from 8-bit transformation produced better segmentation result than segmenting the original 16-bit SAR images. The boundaries between ground objects are better delineated in image (e) and (f) than in image (c) and (d). Image objects appear more compact and correspond to the ground objects to a certain extent in image (e) and (f). The segmentation results indicate that the data transformation method adopted in the study could help multi-resolution segmentation algorithm to generate better results. However, the segmentation results are not quite satisfactory as over-segmentation and under-segmentation still exist in some places. Specific features of SAR imagery should be given more consideration in the future development of SAR image segmentation algorithms. The segmentation result in image (f) is visually better than that in image (e). This can be explained by the fact that ground objects look more homogeneous in image (b) than in image (a). The higher resolution (3 meters) of RADARSAT-2 images makes some small ground objects clearly visible and separate from other objects, but it may also lead to over-segmentation for some patterns.

24
(a) (b)
(c) (d)
(e) (f) Figure 5.1 Segmentation results of RADARSAT-1 and RADARSAT-2 SAR
images in the same urban areas. (a): multi-temporal RADARSAT-1 SAR images; (b): multi-temporal RADARSAT-2 SAR images; (c): segmentation result using RADARSAT-1 16-bit SAR images; (d): segmentation result using RADARSAT-2 16-bit SAR images; (e): segmentation result using RADARSAT-1 images derived from 8-bit transformation; (f): segmentation result using RADARSAT-2 images derived from 8-bit transformation.

25
5.2 Image Classification Eleven land cover classes were extracted from both the RADARSAT-1 and RADARSAT-2 SAR images.
1) Paper I: Object-based NN and rule-based classification of
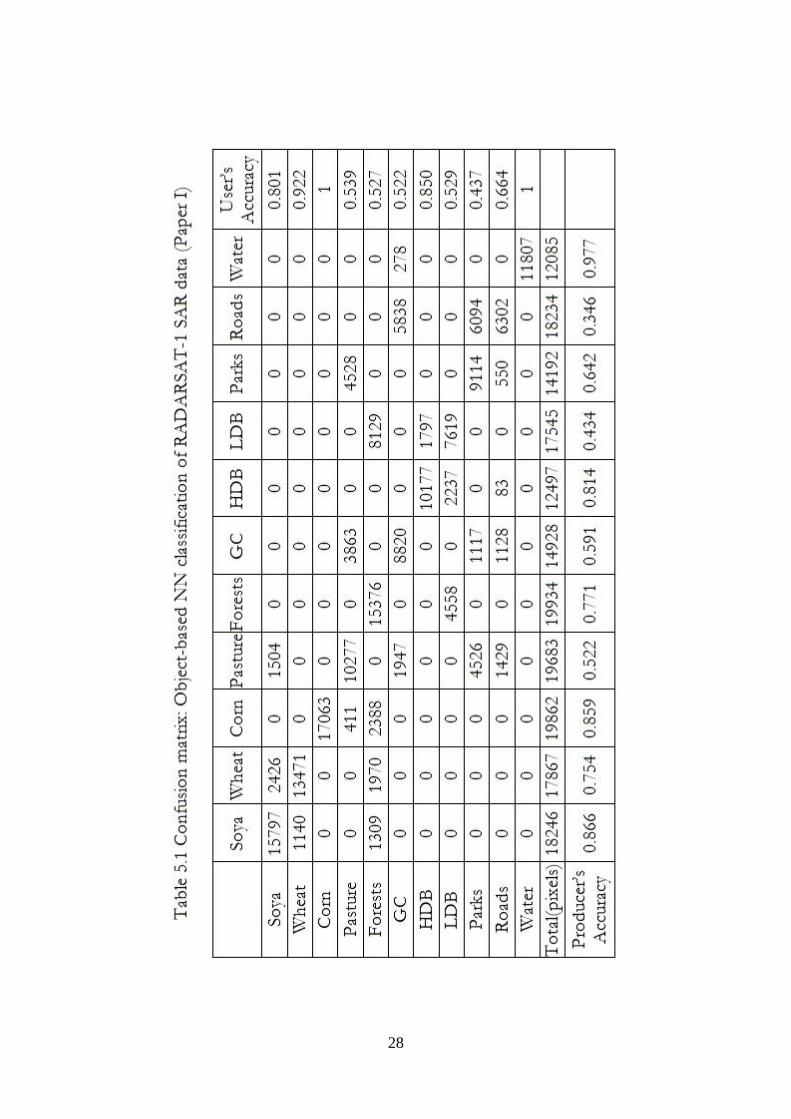
RADARSAT-1 SAR images The objected-based NN classification of RADARSAT-1 SAR images produced an overall accuracy of 67.9% with kappa of 0.647. The confusion matrix in Table 5.1 shows that soya, corn, high-density built-up areas and water were classified with very good results (over 80% accuracy). Low-density built-up areas were confused with forests while pasture, golf courses, parks and roads, however, were confused with one another due to their similar backscatter characteristics, thus had relatively low accuracies. After applying knowledge-based rules, the overall classification accuracy reached 87.9% and kappa reached 0.867. Table 5.2 presents the confusion matrix of final classification result. Omission errors and commission errors were considerably reduced and confusions between classes were well resolved. The producer’s accuracy of forests improved from 77.1% to 95.5% while that of parks improved from 64.2% to 92.1%. The producer’s accuracies of golf courses, pasture, low-density built-up areas and roads increased over 30%.
2) Paper II: Object-based SVM classification of RADARSAT-1 SAR
images The overall accuracy of the object-based SVM classification of RADARSAT-1 images was 84.2% and kappa was 0.826. The confusion matrix in Table 5.3 shows that high-density built-up areas, low-density built-up areas, water and wheat were classified with very good accuracies (over 90%). Though the producer’s accuracy of forests was very high, the user’s accuracy of forests was rather low. Pasture also had a high producer’s accuracy but a relatively low use’s accuracy. Soya and corn were not well-classified. Over 40% of the testing pixels of soya were assigned to corn or forests, while 38.7% of the testing pixels of corn were misclassified as forests. Pasture, golf courses, parks and roads all exhibit low backscatter and are usually hard to be correctly classified if no external knowledge is used. However, these classes were classified with acceptable accuracies using the object-based SVM approach. No knowledge-based rules were applied after the object-based SVM classification in Paper II.
26
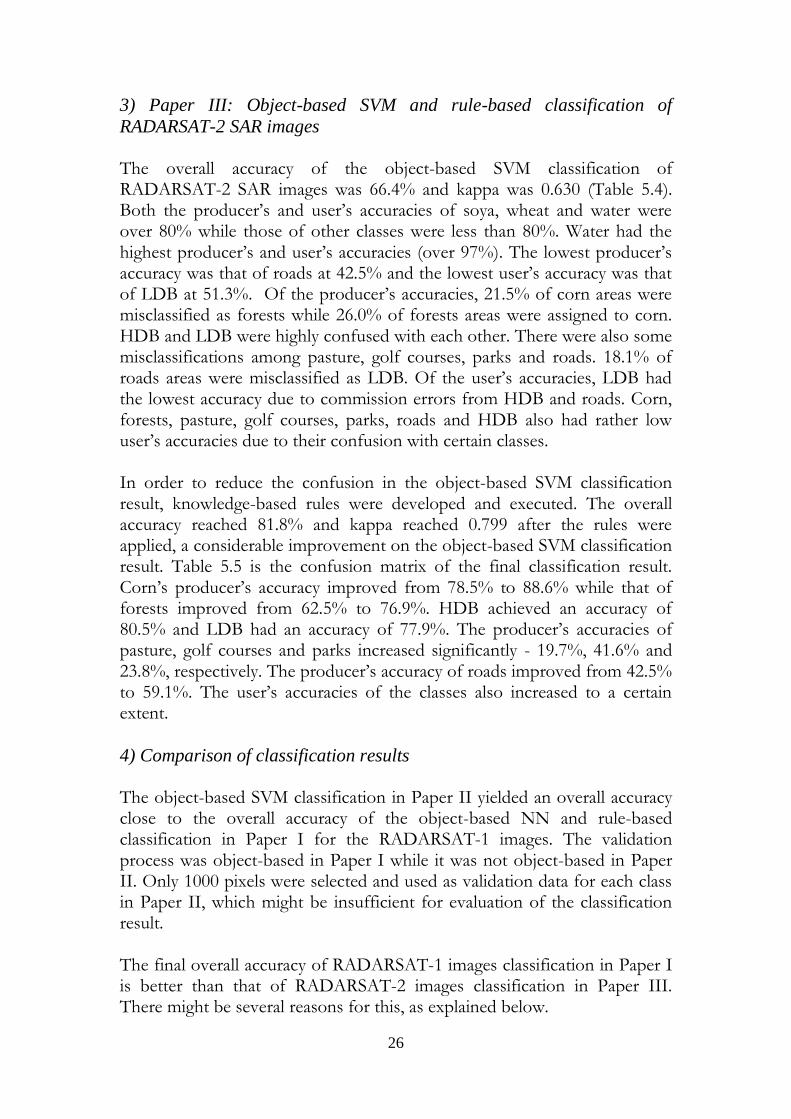
3) Paper III: Object-based SVM and rule-based classification of
RADARSAT-2 SAR images The overall accuracy of the object-based SVM classification of RADARSAT-2 SAR images was 66.4% and kappa was 0.630 (Table 5.4). Both the producer’s and user’s accuracies of soya, wheat and water were over 80% while those of other classes were less than 80%. Water had the highest producer’s and user’s accuracies (over 97%). The lowest producer’s accuracy was that of roads at 42.5% and the lowest user’s accuracy was that of LDB at 51.3%. Of the producer’s accuracies, 21.5% of corn areas were misclassified as forests while 26.0% of forests areas were assigned to corn. HDB and LDB were highly confused with each other. There were also some misclassifications among pasture, golf courses, parks and roads. 18.1% of roads areas were misclassified as LDB. Of the user’s accuracies, LDB had the lowest accuracy due to commission errors from HDB and roads. Corn, forests, pasture, golf courses, parks, roads and HDB also had rather low user’s accuracies due to their confusion with certain classes. In order to reduce the confusion in the object-based SVM classification result, knowledge-based rules were developed and executed. The overall accuracy reached 81.8% and kappa reached 0.799 after the rules were applied, a considerable improvement on the object-based SVM classification result. Table 5.5 is the confusion matrix of the final classification result. Corn’s producer’s accuracy improved from 78.5% to 88.6% while that of forests improved from 62.5% to 76.9%. HDB achieved an accuracy of 80.5% and LDB had an accuracy of 77.9%. The producer’s accuracies of pasture, golf courses and parks increased significantly - 19.7%, 41.6% and 23.8%, respectively. The producer’s accuracy of roads improved from 42.5% to 59.1%. The user’s accuracies of the classes also increased to a certain extent.
4) Comparison of classification results The object-based SVM classification in Paper II yielded an overall accuracy close to the overall accuracy of the object-based NN and rule-based classification in Paper I for the RADARSAT-1 images. The validation process was object-based in Paper I while it was not object-based in Paper II. Only 1000 pixels were selected and used as validation data for each class in Paper II, which might be insufficient for evaluation of the classification result. The final overall accuracy of RADARSAT-1 images classification in Paper I is better than that of RADARSAT-2 images classification in Paper III. There might be several reasons for this, as explained below.

27
The spatial resolution has a significant impact on the classification of SAR images. The higher resolution (3 meters) of the RADARSAT-2 images means that the images contain much more information and details than RADARSAT-1 images with 10-meter resolution, but it may also make the extraction of some land cover classes more difficult because of the increasing complexity of the images. The segmentation algorithm may generate a large number of image objects on RADARSAT-2 images which do not correspond to ground objects. The object-based classifier may not perform well for some parts of the RADARSAT-2 images due to the unsatisfactory segmentation result and information overload. However, the higher resolution of the RADARSAT-2 images enables the extraction of narrow roads in some places, which is impossible in the RADARSAT-1 images. Image objects of both narrow and wide roads were used as validation data for roads in the RADARSAT-2 images classification result, while only image objects of wide roads were used for validation in the RADARSAT-1 images classification result. Previous researches indicated that the use of multi-temporal, multi-look-direction, multi-incidence-angle and multi-polarization SAR images could improve classification accuracy (Weydahl 2002; Henderson & Xia 1997). The five-date RADARSAT-1 C-HH images used in Papers I and II can be grouped into two categories based on the orbit and beam position. Three of them were acquired in an ascending orbit with similar incidence angle while the other two images were acquired in a descending orbit with another incidence angle. However, the three-date RADARSAT-2 C-HH images used in Paper III were all acquired in an ascending orbit, at the same incidence angle. The RADARSAT-2 images acquired on different dates contain nearly the same information for non-vegetation classes. This may partly explain the confusion between high-density built-up and low-density built-up areas in the final RADARSAT-2 images classification result. High-density built-up and low-density built-up areas were not seriously confused with each other in the classification process of RADARSAT-1 images. Further research should investigate multi-temporal, multi-look-direction, multi-incidence-angle and multi-polarization RADARSAT-2 images for urban land cover mapping using the proposed object-based and rule-based approaches.
28

29

30

31

32

33
6. Conclusions and Future Research
6.1 Conclusions Five-date RADARSAT-1 C-HH SAR images and three-date RADARSAT-2 C-HH SAR images were investigated for urban land cover mapping in the Great Toronto Areas. Eleven land cover classes were extracted from both RADARSAT-1 and RADARSAT-2 SAR images. The combination of object-based neural network and rule-based approaches produced an overall accuracy of 87.9% with kappa of 0.867 for the classification of RADATSAT-1 SAR images while object-based SVM classification of RADATSAT-1 SAR images yielded an overall accuracy of 84.2% and kappa of 0.826. The object-based SVM and rule-based classification of the RADARSAT-2 SAR images achieved an overall accuracy of 81.8% and kappa of 0.799. Data transformation of SAR images from 16-bit depth to 8-bit improved the performance of the multi-resolution segmentation algorithm. The major confusion among some classes in the object-based NN or SVM classification results due to their similar radar backscatter could partly be resolved by applying well-designed knowledge-based rules. The higher resolution of RADARSAT-2 SAR images could reveal more details such as narrow roads in urban areas; however, it may increase the complexity of image contents, which can lead to lower classification accuracies for some land cover classes. The discrimination of high-density built-up and low-density built-up areas was easier in the RADARSAT-1 images than in the RADARSAT-2 images. This may be in part due to the fact that the three-date RADARSAT-2 C-HH images were all acquired in ascending orbit, at the same incidence angle while the five-date RADARSAT-1 C-HH images were acquired in ascending or descending orbit, at different incidence angles. Although misclassification still existed for some classes to a certain degree, the overall classification accuracy was satisfactory for both RADARSAT-1 and RADARSAT-2 SAR images. The research demonstrated that object-based and rule-based approaches have potential for operational urban land cover mapping from high-resolution space borne SAR images.
6.2 Future Research The very high resolution of RADARSAT-2 ultra-fine-beam images offers new opportunities to analyze urban environment in small or large scales, but

34
it also presents great challenges of identifying some land cover classes in urban areas due to the increased complexity of image contents. Further research is needed to investigate multi-temporal, multi-look-direction, multi-incidence-angle and multi-polarization RADARSAT-2 images for urban land cover mapping using the proposed object-based and rule-based approaches. RADARSAT-2 provides fully polarimetric SAR images at a spatial resolution of 8 meters. The fully polarimetric SAR images contain much more ground object properties than single-channel SAR images. It is of interest to integrate RADATSAT-2 ultra-fine-beam and fine quad-polarimetry data for urban land cover mapping as they complement each other.

35
References Akono, A. et al., 2000. Utilization of radar remote sensing and texture
analysis for urban cartography in Cameroon: Application to Yaounde City. In ERS-Envisat Symposium 'Looking Down to Earth in the New Millennium'. Gothenburg, Sweden. European Space Agency, pp. 877-889.
Amarsaikhan, D. et al., 2007. The integrated use of optical and InSAR data
for urban land-cover mapping. International Journal of Remote Sensing, 28(6), pp.1161-1171.
Aspert, F. et al., 2007. Time-Varying Segmentation for Mapping of Land
Cover Changes. In ENVISAT Symposium. Montreux, Switerland. Baatz, M. & Schape, A., 2000. Multiresolution Segmentation – an
optimization approach for high quality multi-scale image segmentation. In Angewandte Geographische Informationsverarbeitung XII. Beiträge zum AGIT-Symposium. Salzburg, pp. 12–23.
Baghdadi, N. et al., 2002. Potential of ERS and Radarsat data for surface
roughness monitoring over bare agricultural fields: Application to catchments in Northern France. International Journal of Remote Sensing, 23(17), pp.3427-3442.
Ban, Y. & Hu, H., 2007. RADARSAT fine-beam SAR data for land-cover
mapping and change detection in the rural-urban fringe of the Greater Toronto Area. In 2007 Urban Remote Sensing Joint Event, URS, Apr 11-13 2007.
Ban, Y., Hu, H. & Rangel, I., 2010. Fusion of Quickbird MS and
RADARSAT SAR data for urban land-cover mapping: Object-based and knowledge-based approach. International Journal of Remote Sensing, 31(6), pp.1391-1410.
Ban, Y. & Wu, Q., 2005. RADARSAT SAR data for landuse/land-cover
classification in the rural-urban fringe of the greater Toronto area. In Proceedings of 8th AGILE Conference on Geographic Information Science.
Baraldi, A. & Parmiggiani, F., 1995. Investigation of the textural
characteristics associated with gray level cooccurrence matrix statistical parameters. IEEE Transactions on Geoscience and Remote Sensing, 33(2), pp.293-304.

36
Belousov, A.I., Verzakov, S.A. & von Frese, J., 2002. A flexible classification approach with optimal generalisation performance: support vector machines. Chemometrics and Intelligent Laboratory Systems, 64(1), pp.15-25.
Benz, U. & Pottier, E., 2001. Object based analysis of polarimetric SAR data
in alpha-entropy-anisotropy decomposition using fuzzy classification by eCognition. In IEEE International Geoscience and Remote Sensing Symposium, 9-13 July 2001.
Benz, U.C. et al., 2004. Multi-resolution, object-oriented fuzzy analysis of
remote sensing data for GIS-ready information. ISPRS Journal of Photogrammetry and Remote Sensing, 58(3-4), pp.239-258.
Blaschke, T., Burnett, C. & Pekkarinen, A., 2004. Image Segmentation
Methods for Object-based Analysis and Classification. In Remote Sensing Image Analysis: Including the spatial domain. Dordrecht: Kluver Academic Publishers, pp. 211-236.
Bonci, E., Del Frate, F. & Solimini, D., 2006. Monitoring Urban changes in
Rome, Italy by multi-temporal ERS-SAR images. In 2006 IEEE International Geoscience and Remote Sensing Symposium, IGARSS.
Bryan, M., 1975. Interpretation of an Urban Scene Using Multi-Channel
Radar Imagery. Remote Sensing of Environment, 4(1), pp.49-66. Burges, C.J.C., 1998. A Tutorial on Support Vector Machines for Pattern
Recognition. Data Mining and Knowledge Discovery, 2(2), pp.121-167. Camps-Valls, G. et al., 2004. Robust support vector method for
hyperspectral data classification and knowledge discovery. IEEE Transactions on Geoscience and Remote Sensing, 42(7), pp.1530-1542.
Carleer, A. & Wolff, E., 2006. Urban land cover multi-level region-based
classification of VHR data by selecting relevant features. International Journal of Remote Sensing, 27(6), pp.1035-1051.
Carr, J.R. & De Miranda, F.P., 1998. Semivariogram in comparison to the
co-occurrence matrix for classification of image texture. IEEE Transactions on Geoscience and Remote Sensing, 36(6), pp.1945-1952.
Caves, R., Quegan, S. & White, R., 1998. Quantitative comparison of the
performance of SAR segmentation algorithms. IEEE Transactions on Image Processing, 7(11), pp.1534-1546.

37
CCRS (Canada Centre for Remote Sensing), 2007. Fundamentals of Remote Sensing.
Chamundeeswari, V., Singh, D. & Singh, K., 2008. Unsupervised land cover
classification of SAR images by contour tracing. In 2007 IEEE International Geoscience and Remote Sensing Symposium.
Chang, C. & Lin, C., 2010. LIBSVM : a library for support vector machines,
Available at: http://www.csie.ntu.edu.tw/~cjlin/libsvm. [Accessed Nov.1, 2010].
Chou, T. et al., 2005. Spatial knowledge databases as applied to the detection
of changes in urban land use. International Journal of Remote Sensing, 26(14), pp.3047-3068.
Corr, D. et al., 2003. Classification of urban SAR imagery using object
oriented techniques. In 2003 IEEE International Geoscience and Remote Sensing Symposium.
Crawford, M.M. & Ricard, M.R., 1998. Hierarchical classification of SAR
data using a markov random field model. Proceedings of the IEEE Southwest Symposium on Image Analysis and Interpretation, pp.81-86.
Dekker, R.J., 2003. Texture analysis and classification of ERS SAR images
for map updating of urban areas in the Netherlands. IEEE Transactions on Geoscience and Remote Sensing, 41(9 PART I), pp.1950-1958.
Del Frate, F., Lichtenegger, J. & Solimini, D., 1999. Monitoring urban areas
by using ERS-SAR data and neural networks algorithms. In 1999 International Geoscience and Remote Sensing Symposium (IGARSS), 5, pp.2696-2698.
Del Frate, F., Pacifici, F. & Solimini, D., 2007. Urban land cover in Rome,
Italy, monitored by single-parameter multi-temporal SAR images. In 2007 Urban Remote Sensing Joint Event, URS, Apr 11-13 2007.
Dell'Acqua, F. et al., 2003. Simulation and analysis of fine resolution SAR
images in urban areas. In URBAN 2003. 2nd GRSS/ISPRS Joint Workshop on Remote Sensing and Data Fusion over Urban Areas. Berlin, Germany.
Dell'Acqua, F., Gamba, P. & Trianni, G., 2006. Semi-automatic choice of
scale-dependent features for satellite SAR image classification. Pattern

38
Recognition Letters, 27(4), pp.244-251. Dell'Acqua, F. & Gamba, P., 2006. Discriminating urban environments
using multiscale texture and multiple SAR images. International Journal of Remote Sensing, 27(18), pp.3797-3812.
Dell'Acqua, F. & Gamba, P., 2003. Texture-based characterization of urban
environmental on satellite SAR images. IEEE Transactions on Geoscience and Remote Sensing, 41(1), pp.153-159.
Dell'Acqua, F., Gamba, P. & Lisini, G., 2003. Improvements to urban area
characterization using multitemporal and multiangle SAR images. IEEE Transactions on Geoscience and Remote Sensing, 41(9), pp.1996-2004.
Delliere, J., Maitre, H. & Maruani, A., 2007. SAR measurement simulation
on urban structures using a FDTD technique. In 2007 Urban Remote Sensing Joint Event, URS.
Dong, Y., Forster, B. & Ticehurst, C., 1997. Radar backscatter analysis for
urban environments. International Journal of Remote Sensing, 18(6), pp.1351-1364.
Esch, T. et al., 2008. Improvement of image segmentation accuracy based
on multiscale optimization procedure. IEEE Geoscience and Remote Sensing Letters, 5(3), pp.463-467.
Esch, T., Roth, A. & Dech, S., 2005. Robust approach towards an
automated detection of built-up areas from high resolution radar imagery. In Proceedings of the ISPRS joint conference URBAN 2005 and URS 2005. Tempe, AZ, USA.
Espindola, G. et al., 2006. Parameter selection for region-growing image
segmentation algorithms using spatial autocorrelation. International Journal of Remote Sensing, 27(14), pp.3035-3040.
Franceschetti, G. et al., 2007. Simulation tools for interpretation of high
resolution SAR images of Urban areas. In 2007 Urban Remote Sensing Joint Event, URS, Apr 11-13 2007.
Franceschetti, G., Iodice, A. & Riccio, D., 2002. A canonical problem in
electromagnetic backscattering from buildings. IEEE Transactions on Geoscience and Remote Sensing, 40(8), pp.1787-1801.
Franceschetti, G. et al., 2003. SAR raw signal simulation for urban
39
structures. IEEE Transactions on Geoscience and Remote Sensing, 41(9 PART I), pp.1986-1995.
Fung, A. & Chen, K., 1992. Dependence of the surface backscattering
coefficients on roughness, frequency and polarization states. International Journal of Remote Sensing, 13(9), pp.1663-80.
Gamba, P., Dell'Acqua, F. & Trianni, G., 2007. Satellite SAR and human
settlement detection. In 2007 Urban Remote Sensing Joint Event, URS, Apr 11-13 2007.
Gao, J. & Skillcorn, D., 1998. Capability of SPOT - XS - data in producing
detailed land cover maps at the urban-rural periphery. International Journal of Remote Sensing, 19(15), p.2877.
Garestier, F. et al., 2006. PolInSAR analysis of X-band data over vegetated
and urban areas. IEEE Transactions on Geoscience and Remote Sensing, 44(2), pp.356-364.
Gomez-Chova, L. et al., 2006. Urban monitoring using multi-temporal SAR
and multi-spectral data. Pattern Recognition Letters, 27(4), pp.234-243. Haack, B.N., 1984. L- and X-Band Like- and Cross-Polarized Synthetic
Aperture Radar for Investigating Urban Environments. Photogrammetric Engineering and Remote Sensing, 50(3), pp.331-340.
Haralick, R.M., 1979. Statistical and Structural Approaches to Texture.
Proceedings of the IEEE, 67(5), pp.786-804. He, C., Xia, G. & Sun, H., 2006. An adaptive and iterative method of urban
area extraction from SAR images. IEEE Geoscience and Remote Sensing Letters, 3(4), pp.504-507.
Henderson, F.M. & Xia, Z., 1997. SAR applications in human settlement
detection, population estimation and urban land use pattern analysis: a status report. IEEE Transactions on Geoscience and Remote Sensing, 35(1), pp.79-85.
Heremans, R. et al., 2003. Automatic detection of flooded areas on
ENVISAT/ASAR images using an object-oriented classification technique and an active contour algorithm. In Proceedings of International Conference on Recent Advances in Space Technologies, 20-22 Nov. 2003.
Holah, N. et al., 2005. Potential of ASAR/ENVISAT for the

40
characterization of soil surface parameters over bare agricultural fields. Remote Sensing of Environment, 96(1), pp.78-86.
Hsu, C. & Lin, C., 2002. A comparison of methods for multiclass support
vector machines. IEEE Transactions on Neural Networks, 13(2), pp.415-425.
Huang, C., Davis, L. & Townshend, J., 2002. An assessment of support
vector machines for land cover classification. International Journal of Remote Sensing, 23(4), pp.725-749.
Hussin, Y.A., 1995. Effect of polarization and incidence angle on radar
return from urban features using L-band aircraft radar data. In Proceedings of the 1995 International Geoscience and Remote Sensing Symposium.
Kandaswamy, U., Adjeroh, D.A. & Lee, M., 2005. Efficient texture analysis
of SAR imagery. IEEE Transactions on Geoscience and Remote Sensing, 43(9), pp.2075-2083.
Lee, J. & Pottier, E., 2009. Polarimetric radar imaging: from basics to applications,
CRC Press. Li, J. & Chen, W., 2005. A rule-based method for mapping Canada's
wetlands using optical, radar and DEM data. International Journal of Remote Sensing, 26(22), pp.5051-5069.
Manjunath, B. & Chellappa, R., 1991. Unsupervised texture segmentation
using Markov random field models. IEEE Transactions on Pattern Analysis and Machine Intelligence, 13(5), pp.478-482.
Manjunath, B. & Ma, W., 1996. Texture features for browsing and retrieval
of image data. IEEE Transactions on Pattern Analysis and Machine Intelligence, 18(8), pp.837-842.
Marpu, P.R., 2009. Geographic Object-based Image Analysis. Germany:
Technische Universitat at Bergakademie Freiberg. Muller, K. et al., 2001. An introduction to kernel-based learning algorithms.
IEEE Transactions on Neural Networks, 12(2), pp.181-201. Niu, X. & Ban, Y., 2010. Multitemporal Radarsat-2 Polarimetric SAR Data
for Urban Land Cover Classification. In ISPRS International Archives of the Photogrammetry, Remote Sensing and Spatial Information Sciences.

41
Pal, M. & Mather, P., 2005. Support vector machines for classification in
remote sensing. International Journal of Remote Sensing, 26(5), pp.1007-1011.
Pal, M. & Mather, P., 2004. Assessment of the effectiveness of support
vector machines for hyperspectral data. Future Generation Computer Systems, 20(7), pp.1215-1225.
Paudyal, D.R., Eiumnoh, A. & Aschbacher, J., 1995. Textural information in
SAR images for land-cover applications. In Proceedings of the 1995 International Geoscience and Remote Sensing Symposium.
Peng, H., Ding, C. & Long, F., 2005. Minimum redundancy-maximum
relevance feature selection. IEEE Intelligent Systems, 20(6), pp.70-71. Pun, C. & Lee, M., 2003. Log-polar wavelet energy signatures for rotation
and scale invariant texture classification. IEEE Transactions on Pattern Analysis and Machine Intelligence, 25(5), pp.590-603.
Ross, S. et al., 2002. On the use of RADARSAT-1 for monitoring malaria
risk in Kenya. In 3th International Symposiumon Retrieval of Bio- and Geophysical Parameters from SAR Data for Land Applications, Sep 11-14 2001.
Sabins, F.F., 1997. Remote Sensing Principles and Interpretation 3rd ed., Waveland
Press. Schneider, R.Z. et al., 2006. Polarimetric and interferometric
characterization of coherent scatterers in urban areas. IEEE Transactions on Geoscience and Remote Sensing, 44(4), pp.971-983.
Shackelford, A.K. & Davis, C.H., 2003. A combined fuzzy pixel-based and
object-based approach for classification of high-resolution multispectral data over urban areas. IEEE Transactions on Geoscience and Remote Sensing, 41(10 PART I), pp.2354-2363.
Shi, Z. & Fung, K., 1994. A comparison of digital speckle filters. In
Proceedings of 1994 IEEE International Geoscience and Remote Sensing Symposium.
Soergel, U., Thoennessen, U. & Stilla, U., 2002. Utilization of LIDAR DEM
for SAR Image Analysis in Dense Urban Areas. In proceedings of the ISPRS Technical Commission III Symposium 2002. Photogrammetric

42
Computer Vision. Graz, Austria. Soh, L. & Tsatsoulis, C., 1999. Texture analysis of SAR sea ice imagery using
gray level co-occurrence matrices. IEEE Transactions on Geoscience and Remote Sensing, 37(2 I), pp.780-795.
Thiel, M., Esch, T. & Schenk, A., 2008. Object-Oriented Detection of
Urban Areas from TerraSAR-X Data. In The International Archives of the Photogrammetry, Remote Sensing and Spatial Information Sciences.
Tison, C. et al., 2004. A new statistical model for Markovian classification of
Urban areas in high-Resolution SAR images. IEEE Transactions on Geoscience and Remote Sensing, 42(10), pp.2046-2057.
Tzotsos, A., Iosifidis, C. & Argialas, D., 2006. Integrating texture features
into a region-based multi-scale image segmentation algorithm. In 1st International Conference on Object-based Image Analysis (OBIA 2006). Salzburg University, Austria.
UN Department of Economic and Social Affairs, 2005. World Urbanization
Prospects: The 2005 Revision. Available at: http://www.un.org/esa/population/publications/WUP2005/2005wup.htm [Accessed January 19, 2009].
Vasile, G. et al., 2006. Intensity-driven adaptive-neighborhood technique for
polarimetric and interferometric SAR parameters estimation. IEEE Transactions on Geoscience and Remote Sensing, 44(6), pp.1609-1620.
Weng, Q. & Quattrochi, D., 2006. Urban Remote Sensing, Taylor & Francis,
Inc. Weydahl, D.J., 2002. Backscatter changes of urban features using multiple
incidence angle RADARSAT images. Canadian Journal of Remote Sensing, 28(6), pp.782-793.
Xia, Z. & Henderson, F.M., 1997. Understanding the relationships between
radar response patterns and the bio- and geophysical parameters of urban areas. IEEE Transactions on Geoscience and Remote Sensing, 35(1), pp.93-101.