urban meteorological networks
TRANSCRIPT

Urban Meteorological Networks:An exemplar of the future of high density weather d ata?
Professor Lee ChapmanSchool of Geography, Earth and Environmental Sciences
College of Life & Environmental SciencesUniversity of Birmingham, UK

Measuring the Urban Climate
• Over 50% now live in Cities• The heterogeneous nature of the
urban environment results in a mosaic of microclimates across our cities.
• Urban population subject to amodified climate
• The UHI can be a killer in heatwave conditions
• But….• Measurements in urban environments are challenging• We can’t rely on models for everything – what about the need
for monitoring?• Observations have provided the most important basis for the detection
and attribution of climate change to date (IPCC, 2001)
• So, what are the options?
Lemmen & Warren (2004)

Canopy UHI: Station Pairs
Wilby (2003)

Canopy UHI: Mobile Transects
Voogt (2000)

Surface UHI: Satellite Imagery
Tomlinson et al (2012a, 2012b)

Urban Meteorological Networks
• Studies are often limited to station pairs due to sparse coverage in urban areas
• National networks ‘avoid’ cities as they are unrepresentative of the regional climate
• Issues with site location• Other problems – e.g. vandalism
• Many cities just have a single ‘urban’ weather station• Clearly insufficient to resolve the complex urban environment• Many more sites are needed
• This was the situation for the last 200 years...
• Advances in technology, communications and miniaturisation of electronics are changing the measurement paradigm
• Enabling innovation, increasing reliability and at a lower cost
• A new generation of high resolution ‘Urban Meteorological Networks’ is emerging.
• Near-real time communications• Potential to become permanent installations (as opposed to field campaigns)• Operate over a range of spatial scales

Oklahoma Mesonet
• 120 monitoring stations run by the University of Oklahoma• High quality and uniform instrumentation based on 10m towers;
Air Temperature (1.5m & 9m), Relative Humidity, Windspeed & Direction, Rainfall, Pressure, Solar Radiation
• Applications include agriculture, tornadoes and monitoring fire risk• http://www.mesonet.org/ (Brock et al, 1995)

Oklahoma City Micronet
• Oklahoma city micronet (Basara et al, 2011)• Scaled down version of the ‘mesonet’ in the city• 4 mesonet sites (Air Temperature, humidity, pressure, wind and rainfall)• 32 micronet sites located on traffic lights• Communications via WiFi• Currently run out of funding

City Scale Networks
Muller et al (2013)

Birmingham Urban Climate Laboratory
• The primary focus of the HiTemp project was to provide a series of demonstration sensor networks to measure air temperature
• The design is a nested network of sensors:• 25 full weather stations [coarse array]• 84 low cost air temperature sensors located in schools [wide array]
• Birmingham is now one of the most densely instrumented urban area in the world.

Coarse Array: AWS Network
• The coarse array consists of 25 full weather stations located across Birmingham.
• Located in ‘representative’ sites in schools across the city and so also used for school outreach.
• Additional sites in the surrounding rural areas to record background conditions (e.g. Sandwell & Sutton park)
• Average spacing: 1 per 10km2

Equipment: Weather Stations
• A full suite of weather variables are available (air temperature, humidity, wind speed, wind direction, barometric pressure, precipitation, solar radiation).
• Data loggers (CR1000), communications and mountings (Campbell Scientific)
• Vaisala WXT520 – precipitation, wind speed, wind direction, temperature, relative humidity, pressure
• SKYE SKS1110 pyranometer
• Power: Solar
• Data Communication: GSM/GPRS

Wide Area Array: Air Temperature Network
• The wide area array consists of 84 air temperature sensors located in schools
• Plus a few in ‘rural’ schools /parks/farms outside conurbation
• Average spacing: 1 per 3km2
• Extensive metadata collected at all sites for quality control.
• Deployment based around the ‘Internet of Things’

The Internet of Things
• Literally means things that connect to the internet– Computers– Smart Phones– Curtains, lights, central heating...– Sensors
• Since 2008, these things now outnumber users online
• Lots of potential via the smart cities agenda– Miniaturisation of technology– Decreasing cost of sensor networks
Low Cost Air Temperature Sensors
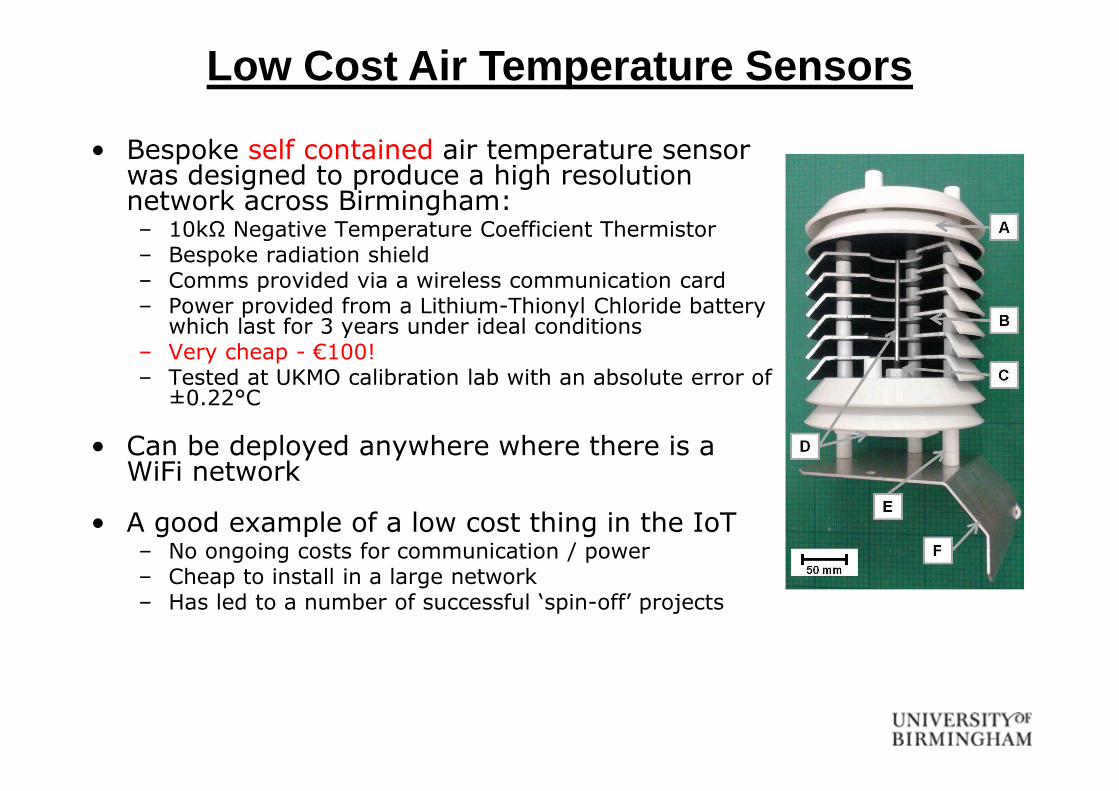
• Bespoke self contained air temperature sensor was designed to produce a high resolution network across Birmingham:– 10kΩ Negative Temperature Coefficient Thermistor– Bespoke radiation shield– Comms provided via a wireless communication card– Power provided from a Lithium-Thionyl Chloride battery
which last for 3 years under ideal conditions– Very cheap - €100!– Tested at UKMO calibration lab with an absolute error of
±0.22°C
• Can be deployed anywhere where there is a WiFi network
• A good example of a low cost thing in the IoT– No ongoing costs for communication / power– Cheap to install in a large network– Has led to a number of successful ‘spin-off’ projects

But is ‘cheap’ any good?
Young et al, 2014

Birmingham Urban Climate Laboratory
N
Tu T
r
Tsu
b


Use Case: BUCCANEER• Birmingham Urban Climate Change Adaptation with
Neighbourhood Estimates of Environmental Risk• 2 year Knowledge Transfer Partnership with Birmingham City• Linked climate change scenarios with urban heat data to show
combined impact at different spatial and temporal scales.• Used as a planning tool to target adaptation measures (e.g. Urban
Greening)

Heat Health Risk
• Identifies where vulnerable population live in relation to the urban heat island
• Elderly• Ill health• High population density• High rise buildings
• Informs heatwave protection plans and prioritisation of other adaptation measures

Key Challenges
• Many networks have proved to be unsustainable over the medium term, often not outlasting the demonstration phase. Why?
• Time consuming:• Ongoing QA/QC – some can be automated, but rotation of sensors to allow for
calibration is very time consuming. Sensor drift is a known issue with low cost sensors (Fiebrich et al, 2010)
• Metadata needs regular updating
• Expensive:• Needs dedicated technical support• GSM communications are a monthly ongoing cost
• Time consuming + expensive = unsustainable...• ...unless end-users (as well as academics) can foot the bill
• Sustainable Urban Meteorological Networks workshop brought together key end users of urban meteorological data:
• Insufficient financial support available in the public sector• Preference for bespoke monitoring networks from the private sector
• So are UMN’s the future for weather data in cities?

• NO!• It is very unusual for Urban Meteorological Networks to survive
the demonstration phase• They still represent the old paradigm of observations.
• New approaches are needed which are sustainable and allow us to instrument the urban environment at an unprecedented scale– Allows us to measure the micrcolimate instead of worrying about
representative locations– Do representative locations actually exist anyway in an urban area!?
• The Internet of Things is one such disruptive technology• Are there any others?
Future Thinking

Crowdsourcing
• “In the next century, planet earth will don an electronic skin. It will use the Internet as a scaffold to support and transmit its sensations. These will probe and monitor cities, the atmosphere, highways, conversations, our bodies, even our dreams” (Neil Goss)
• The term ‘crowdsourcing’ has gained much popularity; traditionally defined as ‘obtaining data or information by enlisting the services of a large number of people’,
• It now often refers to obtaining information from a range of public sensors, typically via the Internet.
• Data is often routinely collected – it just needs harvesting and /or repurposing
• Many other scientific disciplines are using this data, but less so in the atmospheric sciences
• There is a vast range of data out there, just ready to be used...

Smart Devices

Mobile Phones

Mobile Phones
Overeem et al, 2013; Muller et al; 2015

Vehicles

Summary
• Other technologies are our best hope of monitoring the urban climate at a high resolution
• Quality Assurance / Control is the crucial step to make these techniques accepted by the scientific community
• Effort needs to be focussed into a few key networks to be repurposed as testbeds for modelling campaigns and investigating the viability of these more sustainable techniques (e.g. IoT, crowdsourcing)
• These techniques can then be rapidly applied across the world and will continue to build our urban climate resilience
• The current paradigm of measurements is unsustainable. Innovation is the future of high resolution weather data.