urban residential comfort in relation to...
TRANSCRIPT

Proceedings of 7th
Windsor Conference The changing context of comfort in an
unpredictable world Cumberland Lodge Windsor UK 12-15 April 2012 London
Network for Comfort and Energy Use in Buildings httpnceuborguk
URBAN RESIDENTIAL COMFORT IN RELATION TO INDOOR
AND OUTDOOR AIR TEMPERATURES IN IBADAN NIGERIA
By
Adewale Oluseyi Adunola
Department of Architecture Obafemi Awolowo University Ile-Ife Nigeria
E-mail wadunolayahoocom
Abstract
Indoor and outdoor air temperatures remain the dominant climatic factor affecting
thermal comfort in the tropics A thermal comfort survey was conducted in Ibadan
metropolis Nigeria Ten percent (12) of the 119 neighbourhoods identified from the
metropolitan map were selected by stratified random sampling comprising 2 low 3
medium and 7 high residential densities Indoor and outdoor measurements of air
temperature and other relevant climatic elements were done in representative buildings in
the neighbourhoods Significant variations of air temperature and thermal response
manifested across the residential densities and neighbourhoods The variation of
temperature across residential densities and the effect on indoor thermal comfort give
inference to the impact of the urban microclimate on indoor comfort Mean comfort vote
was related to indoor and outdoor temperature by linear equations The equations
confirmed the concept of the dynamic relationship between architecture and climate
Keywords air temperature thermal comfort tropical climate urban microclimate urban
residential densities
Introduction
The influence of heat is pronounced in the tropics due to the impact of high levels
of solar radiation The heat intensity is felt within buildings by the residents as described
by the high levels of indoor temperatures The substantial levels of activity congestion
and industrial processes in the tropical city environment also contribute to the buildup of
heat All these add to the discomfort experienced According to Emmanuel (2005) urban
transition is currently at its peak in the tropical regions leading to congestion and thermal
discomfort Jusuf et al (2007) also stated that the urban air temperature is gradually rising
in all cities in the world caused by drastic reduction in the green area in cities For
Ibadan metropolis in Nigeria the study area specifically Adesoye (2011) found that
mean maximum temperature has been on the increase from 30oC in 1979 to 335
oC in
2009 The level of indoor thermal comfort obtainable in the high temperature conditions
is of concern especially with the treat of climate change
Indoor and outdoor air temperatures remain the dominant climatic factor affecting
thermal comfort in the tropics The afternoon period in the tropics is noted for hot
discomfort due to the impact of intense solar radiation which leads to high temperatures
during the period This consistent impact of high insolation affects buildings and dictates
levels of indoor comfort to a high degree It must be established in principle that
buildings generally and the residential building in particular must provide a functionally
acceptable thermal environment The home environment should present an atmosphere
suitable for its purpose of being a place of rest The variation of temperatures across
residential densities in urban areas and the effect on indoor thermal comfort is a pointer
to the impact of the urban microclimate on the built environment in cities
A thermal comfort field survey was carried out in Ibadan metropolis with a view
to relating the indoor comfort of residents to the outdoor and indoor air temperatures
across the different residential neighbouhoods According to Humphreys (1975) field
studies of thermal comfort are with two purposes (1) to find a way of describing the
thermal environment which correlates well with human response thus enabling reliable
predictions to be made and (2) to define the range of conditions found to be pleasant or
tolerable by the population concerned This contextual study was aimed at examining
residentsrsquo thermal response in relation to the dominant climatic factor of air temperature
in the tropical environment
Literature Review
A building can be climate-responsive Beng (1994) observed that climate as a
prime factor in built form is the mainspring for all the sensual qualities that add up to a
vital tropical architecture The building envelope is a designed selective filter excluding
unwanted influences like excessive radiation but admitting the desirable and useful
elements like appropriate daylighting It should be the designerrsquos aim to ensure the
required indoor conditions with little or no use of energy other than from ambient or
renewable sources (Szokolay and Brisbin 2004) The thermal behaviour of a building
which is a product of the interaction between architecture and climate has great effect on
the energy use and sustainability of the building
There is a variety of climatic influences and effects on individuals buildings and
communities The architectural design is traditionally shaped by the challenges and
opportunities of the regional climate Givoni (1998) asserted that the urban climate and
the building indoor climate are both parts of a climatological continuum There is an
operational regional natural climate which is modified at the urban scale by the structure
of the town or city This is further modified at the site scale by the individual building
The analysis of the local climatic conditions is the starting point in formulating building
and urban design principles aimed at maximizing comfort and minimizing the use of
energy for heating and cooling Different comfort standards are justified for countries
with different climatic conditions and stages of economic development According to
Givoni (1998) studies have indicated that persons living in hot countries prefer higher
temperatures than the recommendations by the American and European standards such as
ASHRAE comfort nomogram and Fangerrsquos Comfort Equation This necessitates further
evaluation of tropical indoor comfort
It was shown by Humphreys (1978) Auliciems (1981) and deDear (1998) that
thermal neutrality is a function of the prevailing climate in a location The correlation
equations related neutrality temperature to mean outdoor temperature In Haase and
Amato (2009) climatic condition was considered from the findings as the most important
factor in the determination of thermal comfort Also according to Nicol and Humphreys
(2010) the derivation of an adaptive equation for thermal comfort in free-running
buildings established a relationship between indoor comfort and outdoor climate The
paper described how the indoor comfort conditions were related to the running mean of
the outdoor temperature and addressed the effect of air movement and humidity The
dependence of indoor environmental conditions on the external climatic condition was
emphasized According to Humphreys (1975) in most of the studies of thermal comfort a
far greater part of the variation in response can be attributed to change in temperature
than to changes in either humidity or air movement It must also be emphasized that the
concept of adaptive thermal comfort is the basis of the thermal experience in the urban
spatial environment Surveys which show the effect of adaptive actions in significantly
increasing the tolerance of subjects in real contextual situations are listed in deDear
(1998) As stated by Humphreys et al (2007) the concept is that thermal comfort is self-
regulating whereby people take actions to attain comfort
Furthermore there is presently a dynamic interaction between the built and
natural environments that needs to be balanced as stated by Pearlmutter (2000) This is
because of human requirement for thermal comfort Being warm-blooded humans have
to maintain core temperatures at 37ordmC in diverse climatic environments There should be
a return to the bio-climatic concept of design in architecture Studies have indicated the
importance of the dynamic interaction between climate and architecture which emphasize
that climatic analysis is important for the effective design of buildings The role that
building physical spatial and location characteristics play in the modification of climatic
factors indoors is recognized The tropical urban microclimate needs to be analyzed to
adequately approach the bio-climatic building design for indoor comfort The impact of
air temperature on the thermal comfort of urban residents is a subject of interest
Study Area
Ibadan metropolis is an urban centre located on latitude 7023rsquoN and longitude
3055rsquoE in the South-Western part of Nigeria (Fig 1) The city ranges in elevation from
150m above sea level in the valley area to 275m on the major north-south ridge which
crosses the central part of the city (httpwwwabsoluteastronomycomtopicsIbadan)
Figure 2 shows the distribution of the residential building densities in the metropolis
Ibadan falls within the warm-humid tropical climate with a seasonally humid
classification because of its inland location The climatic pattern is dominated by periods
of high rainfall especially in the rainy season There are considerable solar radiation
intensity and high temperatures high humidity light winds and long periods of still air
There are two broad seasonal patterns in Ibadan namely the dry season (November to
April) and the rainy season (May to October) The weather conditions in Ibadan as well
as in other places in Nigeria and other West African countries during the course of a
given year actually depends on the location of the place in relation to the fluctuating
surface position of the Inter-Tropical Discontinuity (ITD) in the region (Ojo 1977)
Figure 1 The site of Ibadan
Source Adapted from Ayeni (1994)
According to the analysis of the Ibadan climate given by BBC Weather
(httpenwikipeadiaorgwikiIbadanNigeria) the record highest temperatures of 39oC
occurred in February and 38oC in March and April The mean maximum temperature was
highest in February and March (34oC) closely followed by April January and November
(33oC) The months with the lowest mean maximum temperatures were August (27
oC)
and July (28oC) The record lowest temperature was 10
oC in January The mean
minimum temperature was least in January July August and December (21oC) and was
highest in March and April (23oC) With respect to the sunshine hours highest value of
198 was in February November and December followed by 170 in January April and
May From the analysis the month of April in which the survey was done rightly qualified
as one of the expected hot and uncomfortable months in the study area
Figure 2 Ibadan metropolis showing the building densities
Source Adapted from Asiyanbola (2011)
Methodology
A thermal comfort survey was conducted in Ibadan metropolis to examine the
adaptive thermal comfort of the residents and the thermal experience of the residents in
relation to the air temperatures Ten percent (12) of the 119 neighbourhoods identified
from the metropolitan map were selected by stratified random sampling comprising 2
low 3 medium and 7 high residential densities The total number of houses in each of the
neighbourhoods was estimated to be an average value of 885 based on data from National
Bureau of Statistics (2008) A sample size of five percent of this gave 44 houses in each
neighbourhood which were selected using systematic random sampling to give a total of
528 houses for the survey For each selected building an adult resident filled a
questionnaire indicating the indoor thermal response at different periods of the day using
the ASHRAE thermal comfort scale (Table 1) A special afternoon indoor thermal
comfort assessment was also done in each house The survey was done for a period of
one day in each house with respondents monitoring their respective thermal sensation
during the different periods of the day The thermal scale was explained and the rating
system translated to the respondents Care was taken not to translate the response lsquohotrsquo
literally because there is a regional cultural belief that the home should not be described
as hot Instead the translation for lsquohotrsquo was lsquovery warmrsquo because warm was a culturally
milder word lsquoNeutralrsquo was also translated as lsquoneither warm nor coolrsquo The respondents
that were literate filled the questionnaire independently as they monitored their thermal
feelings during the day but about 15 of respondents with lower literacy level were
interviewed to complete the questionnaire from memory The indoor and measurements
of relevant climatic elements were done in representative buildings in the
neighbourhoods Measured were outdoor and indoor air temperature (T) relative
humidity (RH) outdoor and indoor air velocity (AV) The weather-measuring
instruments used comprised the following La Crosse Technology Instant Transmission
Plus Weather Stations which offered immediate update of all outdoor and indoor climatic
data measured from transmitters (with the indoor temperature range of -99oC to +599
oC
with 01oC resolution outdoor temperature range of -399
oC to 599
oC with 01
oC
resolution and humidity range of 1 to 99 with1 resolution) Smart Sensor Intell Plus
Electronic Anemometers (with wind speed range of 0 to 30ms 01ms resolution and 5
accuracy) and Multi-Thermo Digital Instruments (with resolution of 01 o
C and accuracy
of plusmn1 o
C) The survey was done in April which was analyzed to be one of the hottest
months in the study area The measurements were taken on sunny days in the month and
additional measurements were taken for each location on other days in the same month to
verify the data Along with the measurements of the environmental parameters the
different entities of personal spatial location and adaptive factors relevant to thermal
comfort were recorded and analyzed to have a comprehensive assessment of the adaptive
thermal response of the residents
Table 1 The ASHRAE Scale of warmth
THERMAL RESPONSE NUMBERING
Hot +3
Warm +2
Slightly warm +1
Neutral 0
Slightly cool -1
Cool -2
Cold -3
Research Findings
Relevant data was collected from the study and analyzed and the findings are
hereby discussed in this section under the following sub-headings
1 Characteristics of the Respondents Buildings and Neghbourhoods
A total number of 528 respondents were surveyed in Ibadan metropolis Out of
this number 271 were male (513) and 257 were female (487) 428 of the
respondentsrsquo were of age 18-30 years 456 were 31-54 years and 116 were 55 years
and above With respect to their length of stay in their respective houses 18 had stayed
for 1-2 years 547) had stayed for 3-10 years and 273 had stayed for over 10 years
Their value judgments were therefore reliable
The total number of residential buildings selected in Ibadan metropolis for the
survey was 528 with 88 located in low density neighbourhoods 132 located in medium
density neighbourhoods and 308 located in high density neighbourhoods 44 buildings
each were selected within the following 12 neighbourhoods New Bodija Idi Ishin (2 low
density) Abayomi Odo-Ona Elewe Ijokodo (3 medium density) Mokola Agbowo
Table 2 Some characteristics of the 12 surveyed neighbourhoods in Ibadan metropolis
NEIGHBOURHOOD BUILDING
DENSITY
LEVEL
OF
TRAFFIC
TERRAIN PRESENCE
OF GREEN
AREAS
Idi-Ishin Low Low Level lowland High
Mokola High High Hilly Very Low
Abayomi Medium High Level lowland Low
Apata High High HillyLevel lowland Very Low
Oke Ado High Medium Level lowlandHilly Very Low
Aliwo High High Level lowland Very Low
New Bodija Low Medium Level lowland Medium
Challenge High Medium Level lowland Low
Odo Ona Elewe Medium Medium ValleyLevel lowland Medium
Agbowo High Medium Level lowland Medium
Ijokodo Medium Medium Level lowland Low
Ile-titun High High Level lowland Very low
Source Adunola (2011)
Challenge Apata Aliwo Oke-Ado Ile-titun (7 high density) The residential building
types consisted of 63 face-to-face bungalows (119) 202 face-to-face storey buildings
(383) 107 bungalow flats (203) 107 storey flats (203) and 49 duplex buildings
(93) The face-to-face types are built such that rooms are lined up facing one another
in two rows with a central corridor space in-between The storey classification are
residential buildings with two or three floors According to the typology there were 60
traditional buildings (114) 237 vernacular buildings (449) and 231 contemporary
buildings (438) Photographs of typical buildings in these classifications are provided
in the Appendix The analysis of the design plan and form of the buildings gave a
categorization of 128 linear buildings (242) 350 compact buildings (663) and 49
compact buildings enclosing courtyards (93) Expectedly the 12 neighbourhoods
exhibited different characteristics of green landscape terrain and vehicular traffic The
neighbourhood characteristics are presented in Table 2
2 Measured Indoor and Outdoor Conditions across Neighbourhoods
It was found that outdoor and indoor temperatures were higher in the afternoon
and lower in the late night and early morning The reverse was the case for the relative
humidity which had lower values in the afternoon and higher values in the early morning
and night Of concern were the maximum recorded temperatures From the measured
data the outdoor temperatures were usually highest from about 100pm to 400pm while
the indoor temperatures were highest from about 200pm to 500pm These signified the
periods of hot discomfort in the day The maximum outdoor temperature and maximum
indoor temperature varied slightly across the neighbourhoods (Table 3) It was noted that
the high density neighbourhoods had the highest values while the low density
neighbourhoods had the least values Maximum values of measured outdoor and indoor
temperatures ranged from 341 o
C to 369 o
C and from 325oC to 35
oC respectively The
reduction in maximum temperatures from outdoor to indoor was in the range of 16 ndash 19
deg C This was significant in establishing the impact of the building envelope on the
climate However the finding also inferred that many of the residential buildings in
Ibadan metropolis were generally not very effective in reducing the high outdoor
temperatures of the afternoon period The implication was that many of the buildings
needed more thermal effectiveness either in terms of design or fabric or both
The measurements of outdoor and indoor temperatures taken during the survey
were found to be strongly correlated to the neighbourhood characteristics of building
density level of traffic and presence of green areas (Table 4) The air temperature
variation across the neighbourhoods was therefore taken as an indication of the influence
of the different neighbourhood characteristics such as density traffic and landscape
features The diversity of the urban form was therefore inferred as a factor that affected
the urban microclimate Figures 3 and 4 indicate the variations of the indoor and outdoor
temperatures across the 12 surveyed neighbourhoods in the metropolis A graph
indicating a typical variation of outdoor and indoor temperature values in one of the
houses is shown in Fig 5
The relative humidity values varied slightly across the neighbourhoods from a
minimum of 54 measured at 245pm to a maximum of 80 measured at 730am The
outdoor air velocity ranged from averages of 02ms to 18ms across the neighbourhoods
with periods of still air recorded in the afternoon period Indoor air velocity was low
ranging from a minimum of 0ms to a maximum of 02ms with the average values
usually between 0 and 01ms Extensive periods of still air were recorded indoors
Table 3 Maximum recorded temperatures
NEIGHBOURHOOD MAXIMUM OUTDOOR
TEMPERATURE (oC)
MAXIMUM INDOOR
TEMPERATURE (oC)
Idi-Ishin 341 325
Mokola 369 343
Abayomi 364 339
Apata 365 341
Oke Ado 369 344
Aliwo 363 347
New Bodija 343 325
Challenge 362 341
Odo Ona Elewe 355 339
Agbowo 364 341
Ijokodo 355 339
Ile-titun 366 350
Source Adunola (2011)
Table 4 Correlation of Air Temperature and Neighbourhood Characteristics
Building Density
Level of Traffic
Terrain Presence of Green Areas
Outdoor Temperature Morning 613 371 -022 241 Pearson Correlation
000 000 618 000 Significance (2-tailed)
528 528 528 528 N
Outdoor Temperature Afternoon 613 371 -022 241 Pearson Correlation
000 000 618 000 Significance (2-tailed)
528 528 528 528 N
Outdoor Temperature Evening 613 371 -022 241 Pearson Correlation
000 000 618 000 Significance (2-tailed)
528 528 528 528 N
Outdoor Temperature Night 401 -027 -030 -172 Pearson Correlation
000 543 497 000 Significance (2-tailed)
528 528 528 528 N
Indoor Temperature Morning 610 300 -009 160 Pearson Correlation
000 000 834 000 Significance (2-tailed)
528 528 528 528 N
Indoor Temperature Afternoon 615 356 -019 223 Pearson Correlation
000 000 663 000 Significance (2-tailed)
528 528 528 528 N
Indoor Temperature Evening 571 193 007 049 Pearson Correlation
000 000 870 263 Significance (2-tailed)
528 528 528 528 N
Indoor Temperature Night 584 361 -071 223 Pearson Correlation
000 000 101 000 Significance (2-tailed)
528 528 528 528 N
25
26
27
28
29
30
31
32
33
34
35
36
9 10 11 12 13 14 15 16 17 18 19 20 21
TemperatureoC
Time of the day
Indoor Temp (oC) Idi-IshinIndoor Temp (oC) MokolaIndoor Temp (oC) AbayomiIndoor Temp (oC) ApataIndoor Temp (oC) Oke-AdoIndoor Temp (oC) AliwoIndoor Temp (oC) New BodijaIndoor Temp (oC) ChallengeIndoor Temp (oC) Odo-Ona-EleweIndoor Temp (oC) AgbowoIndoor Temp (oC) IjokodoIndoor Temp (oC) Ile-titun
Figure 3 Graph of indoor temperature in the 12 neighbourhoods in April 2010
measurements on 2 3 5-10 12-15 April
25
26
27
28
29
30
31
32
33
34
35
36
37
38
9 10 11 12 13 14 15 16 17 18 19 20 21
TemperatureoC
Time of the dayOutdoor Temp (oC) Idi-IshinOutdoor Temp (oC) MokolaOutdoor Temp (oC) AbayomiOutdoor Temp (oC) ApataOutdoor Temp (oC) Oke-AdoOutdoor Temp (oC) AliwoOutdoor Temp (oC) New BodijaOutdoor Temp (oC) ChallengeOutdoor Temp (oC) Odo-Ona-EleweOutdoor Temp (oC) AgbowoOutdoor Temp (oC) IjokodoOutdoor Temp (oC) Ile-titun
Figure 4 Graph of outdoor temperature in the 12 neighbourhoods in April 2010
measurements on 2 3 5-10 12-15 April
0
5
10
15
20
25
30
35
40
9 10 11 12 13 14 15 16 17 18 19 20 21Time of the day
Temp oC
Outdoor Temperature (oC)
Indoor Temperature (oC)
Figure 5 Typical Outdoor and Indoor temperature variation for a house in the study area
3 Variation of Thermal Response in the Metropolis
There was significant variation of thermal responses across the residential densities and
house types The following bar charts (Figures 6 and 7) provide further explanation of the
distribution of the respondentsrsquo thermal responses which were used to compute the values
of the mean comfort votes across the different cases that were considered The
distribution of the responses indicated that there were variations in the indoor thermal
experience of the respondents living in the different categories of residential densities
building types and typologies The analysis showed that the face to face bungalow and
face to face storey house types were uncomfortable for respondents while the bungalow
flats storey flats and the duplex house types were reported more comfortable The
dynamism of the responses was shown in the way the votes were distributed over almost
every thermal response category in each considered case This signified the variety that is
attributable to human psychological response to thermal comfort However it was also
noted that majority of respondents usually gave their responses in three adjacent thermal
response categories This justified the use of the mean vote for the total population since
the majority always gave their thermal responses in similar response categories on the
thermal sensation scale
It was remarkable that the mean votes of adaptive thermal responses varied across
the periods of the day and across the neighbourhoods (Table 5) The values obtained
reflected the results of the earlier analysis of air temperatures across the neighbourhoods
The buildings in the low density neighbourhoods were generally comfortable while
Figure 6 The distribution of thermal responses for the afternoon special assessment
across building densities and building types in the study area
Figure 7 The distribution of thermal responses for the afternoon special assessment
across building densities and design typologies in the study area
buildings in the high density neighbourhoods were uncomfortable as assessed by the
respondents in the afternoon period The calculated combined mean votes for all
respondents could however be used to give a general description of the temporal variation
of the thermal comfort within the buildings in the study area The combined mean vote
for morning was -1335 (cool) and combined mean vote for afternoon was +0857
(warm) The combined mean vote for evening was +0195 (slightly warm) while the
combined mean vote for night was -0619 (slightly cool) These values indicated that the
responses followed the pattern of outdoor and indoor air temperature temporal variations
in the metropolis as shown earlier in Figs 3 and 4 Air temperature was therefore
confirmed as a very significant parameter of thermal comfort in the study area The
variation of temperatures across residential densities and the effect on indoor thermal
comfort is a pointer to the impact of the urban microclimate on the built environment in
Table 5 This is a table of the mean comfort votes of respondents in the different periods
of the day
Neighbourhood
Building Density
Number of
Respondents
Mean Vote
Morning
(10am)
Mean Vote
Afternoon
(3pm)
Mean
Vote
Evening
(6pm)
Mean
Vote
Night
(9pm)
New Bodija- Low 44 -1818 -0591 -1341 -2000
Mokola- High 44 -0364 +1705 +1318 +0523
Ijokodo- Medium 44 -1143 +0452 -0643 -1619
Abayomi- Medium 44 -1636 +0591 +0455 -0318
Oke Ado- High 44 -1293 +1698 +0690 +0119
Aliwo- High 44 -1045 +1364 +1182 +0455
Apata- Apata 44 -1886 +1636 +0159 -0886
Ile titun- High 44 -1238 +1907 +0762 -0244
Idi Ishin- Low 44 -2023 -1114 -1477 -2227
Odo Ona Elewe-
Medium
44 -1477 +1205 +0318 -0614
Challenge- High 44 -0905 +1333 +1238 +0548
Agbowo- High 44 -1132 -0026 -0351 -1189
COMBINED VOTE 528 -1335 +0857 +0195 -0619
Source Adunola (2011)
the metropolis The mean comfort votes for the low medium and high density
neighbourhoods implied decreasing indoor comfort level with increasing density The
impact of building density was found remarkable on air temperature and the indoor
comfort
4 Variation of Mean Comfort Vote with Air Temperature
The pattern of variation of the Mean Comfort Votes of the Adaptive thermal
responses with indoor and outdoor air temperatures were of interest in this study Table 6
indicates the various indoor and outdoor temperatures and the corresponding mean
comfort votes of adaptive thermal response Graphs were plotted to relate indoor
temperature and mean comfort vote as well as outdoor temperature and mean comfort
vote The graphs indicated significant linear relationships with high R Square values
Table 6 Air temperatures and Residentsrsquo Mean Comfort Votes
Outdoor Temperature oC Indoor Temperature oC Mean Comfort Vote
morning
286 294 -1761
282 290 -1920
285 303 -1284
292 286 -1096
293 300 -1139
294 292 -0719
afternoon
366 339 1114
341 325 -0829
355 335 0837
369 341 1518
364 343 0902
360 350 1632
evening
320 331 0307
315 321 -1409
328 330 -0151
337 341 0977
322 329 0964
330 336 0555
night
292 309 -0602
273 297 -2114
280 304 -1105
275 300 0042
285 310 0118
Source Adunola (2011)
The data from the table was analyzed to produce the graph (Fig 7) with the equation
relating mean comfort vote to indoor temperature given as
y = 0483x ndash 1559 (1)
where y = mean comfort vote and x = indoor temperature R Square value was 0722
which implied a very strong linear relationship The second graph for the outdoor
temperature (Fig 8) also indicated a linear equation as follows
y = 0280x ndash 9062 (2)
where y = mean comfort vote and x = outdoor temperature R Square value was 0635
which implied a very strong relationship
These equations can be used to provide estimated corresponding values of mean
votes of respondents and the indoor and outdoor temperatures It must be noted however
that there were several other factors that influenced the mean vote along with air
temperature The data collected for all other variables were analyzed All the sets of
predictor variables explained remarkable percentages of the variance of the adaptive
thermal response in the afternoon period as follows building spatial characteristics-
357 (F= 14797 ρle005) location characteristics- 268 (F= 31710 ρle005) outdoor
climatic factors 212 (F= 34382 ρle005) personal characteristics- 204 (F= 10093
ρle005) adaptive actions- 146 (F= 5810 ρle005) indoor climatic factors 118 (F=
22866 ρle005) The set of a combination of all the listed variables ndash personal adaptive
action climatic spatial and location characteristics as predictor variables explained
521 of the variance of the adaptive thermal response (F= 10474 ρle005)
When interpreting the respective results obtained for indoor temperature from
equation (1) and outdoor temperatures from equation (2) therefore the substantial
contextual input of other variables of adaptive thermal comfort especially adaptive
actions must be recognized It was deduced that the respondentrsquos adaptive actions
enabled them to tolerate the high values of indoor and outdoor temperatures recorded in
the study The adaptive nature of human thermal comfort has been expressed as being a
means of extending the comfort conditions within spaces as occupants utilize the adaptive
opportunities available to them The uncomfortable thermal conditions in the periods of
discomfort enabled the principle of adaptive comfort to be operational The adaptive
principle states that if a change occurs such as to produce discomfort people react in
ways which tend to restore their comfort (Nicol and Humphreys 2002)
y = 0483x - 1559Rsup2 = 0722
-25
-2
-15
-1
-05
0
05
1
15
2
0 5 10 15 20 25 30 35 40
Mean vote ofAdaptive thermal
response
Indoor Temperature oC
Figure 7 Graph relating Mean Comfort Vote of residents and Indoor Temperature in
Ibadan in April 2010
y = 0280x - 9062Rsup2 = 0635
-25
-2
-15
-1
-05
0
05
1
15
2
0 5 10 15 20 25 30 35 40
Mean vote of Adaptive thermal
response
Outdoor temperature oC
Figure 8 Graph relating Mean Comfort Vote of residents and Outdoor Temperature in
Ibadan in April 2010
Conclusion
Maximum values of measured outdoor and indoor temperatures ranged from 341
oC to 369
oC and from 325
oC to 35
oC respectively This occurred in the afternoon period
making it the most uncomfortable in the study area The reduction of 16 -19 deg C from
the outdoor maximum to the indoor maximum temperatures was a confirmation of the
interaction between the buildings and the climate It was inferred that many of the
buildings in the study area needed more thermal effectiveness either in terms of design or
fabric composition or both to be able to further reduce indoor temperatures and the
discomfort impact of the urban microclimate Indoor and outdoor air temperatures varied
across the neighbourhoods and the air temperature of the city built environment was
found to be influenced by the urban neighbourhood characteristics This inferred the
influence of urban form on the urban microclimate Variations were found in the obtained
mean comfort votes of adaptive thermal responses across the residential neighbourhoods
building densities and house types The thermal response of residents were found to be a
function of the indoor and outdoor temperatures respectively Both indoor and outdoor air
temperatures were respectively confirmed as strong determinants of the mean comfort
vote of the respondents with equations relating them
From the findings some recommendations can be made towards the attainment of
better indoor environment in Ibadan and other Nigerian cities based on the physiological
needs of the residents for comfortable indoor thermal environment Effective urban
design in tropical regions needs the input of research findings on indoor thermal comfort
because building thermal comfort affects the sustainability of the urban environment It
was found that air temperatures were higher in neighbourhoods with high building
density and high level of traffic The master plan of urban centres should therefore be
prepared with adequate thermal comfort considerations at both the micro and macro
levels Appropriate building densities have to be considered for urban neighbourhoods A
decongestion programme should be embarked on for presently high density
neighbourhoods to reduce the thermal discomfort in such neighbourhoods There should
be introduction of green areas in the cities with recreational parks located in the central
areas to help in reducing air temperatures Planting of trees in all neighbourhoods within
the cities should be effected to enhance air movement and provide shade from the heat of
direct solar radiation If adequate steps are taken to reduce air temperatures in the city the
built environment will be more comfortable
References
Adesoye PO (2011) Analysis of Climatic Data of Ibadan Metropolis Implications for
Green City In Adeyemo R (ed) Urban Agriculture Cities and Climate Change
Alex Von Humboldt Fdn Cuvillier Verlag Goumlttingen Germany pp 51-57
Adunola AO (2011) Adaptive Thermal Comfort in Residential Buildings in Ibadan
Metropolis Unpublished PhD Thesis Obafemi Awolowo University Ile-Ife
Nigeria
Asiyanbola RA (2011) Gender and Urban Housing Settings in Africa-Nigeria Paper
presented at the International RC21 Conference on lsquoThe Struggle to Belong-
Dealing with Diversity in 21st Century Urban Settingsrsquo Amsterdam 7-9 Jul2011
Retrieved from httpwwwrc21orgconferencesamsterdam2011edocs on
Sept8 2011
Auliciems A (1981) Toward a Psycho-physiological Model of Thermal Perception
International Journal of Biometeorology Vol 25 No 2 pp 109-122
Ayeni B (1994) The Metropolitan Area of Ibadan Its Growth and Spatial Structure In
Filani MO Akintola FO and Ikporukpo CO (eds) Ibadan Region
Geography Dept UI Rex Charles Publication Ibadan
Beng TH (1994) Tropical Architecture and Interiors Page One Books London UK
deDear R (1998) A global database for thermal comfort field experiments ASHRAE
Transactions Vol 104(1b) pp 1141-1152
Emmanuel MR (2005) An Urban Approach to Climate-sensitive Design Strategies for
the Tropics Taylor and Francis UK
Givoni B (1998) Climate Considerations in Building and Urban Design John Wiley
and Sons UK
Haase M and Amato A (2009) An Investigation of the Potential for Natural
Ventilation and Building Orientation to Achieve Thermal Comfort in Warm and
Humid Climates Solar Energy Vol 83 No3 pp 389-399
httpenwikipeadiaorgwikiIbadanNigeria Ibadan climate- BBC Weather Analysis
Chart Retrieved on Apr10 2010
httpwwwabsoluteastronomycomtopicsIbadan Ibadan climate Retrieved on
Aug152011
Humphreys MA (1975) Fields Studies of Thermal Comfort Compared and Applied
Symposium on Physiological Requirements of the Microclimate Prague BRE 8 -
10 Sept 1975
Humphreys MA (1978) Outdoor temperatures and comfort indoors Bld Res And
Practice (Journal of CIB) Vol6 No2 pp 92-105
Humphreys MA Nicol JF and Raja IA (2007) Field studies of indoor thermal
comfort and progress of the adaptive approach In Santamouris M (ed)
Advances in Building Energy Research Vol1 Earthscan pp 55-88
Jusuf S K Wong NH Hagen E Anggoro R and Hong Y (2007) The Influence of
Land Use on the Urban Heat Island in Singapore Habitat International Vol 31
No 2 pp232-242
National Bureau of Statistics (2008) Annual Abstract of Statistics 2008 National Bureau
of Statistics Nigeria
Nicol JF and Humphreys MA (2002) Adaptive Thermal Comfort and Sustainable
Thermal Standards for Buildings Energy and Buildings Vol34 No6 pp 563 ndash
572
Nicol JF and Humphreys MA (2010) Derivation of the Adaptive Equations for
Thermal Comfort in Free-running Buildings in European Standard EN 15251
Building and Environment Vol 45 Issue 1Jan2010 pp11-17
Ojo O (1977) The Climates of West Africa Heinemann Educational Books Ltd
London UK
Pearlmutter D (2000) Architecture and Climate the Environmental Continuum
Geography Compass Vol1 No 4 pp 752-778
Szokolay SV and Brisbin C (2004) Introduction to Architectural Science Elsevier
Publishers UK
Appendix
Photographs of typical house types in Ibadan metropolis
A face to face bungalow in the study area
A face to face storey house in the study area
A storey flat in the study area
A duplex in the study area
A traditional house in the study area
A vernacular house in the study area
A contemporary house in the study area
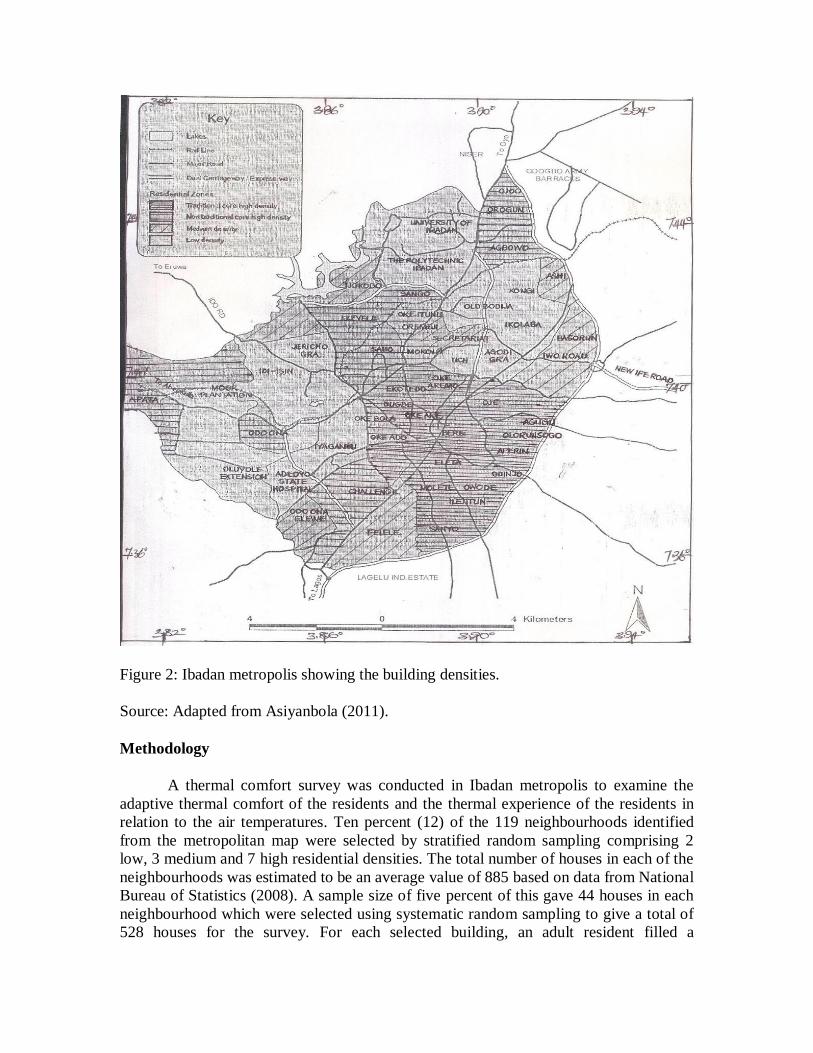
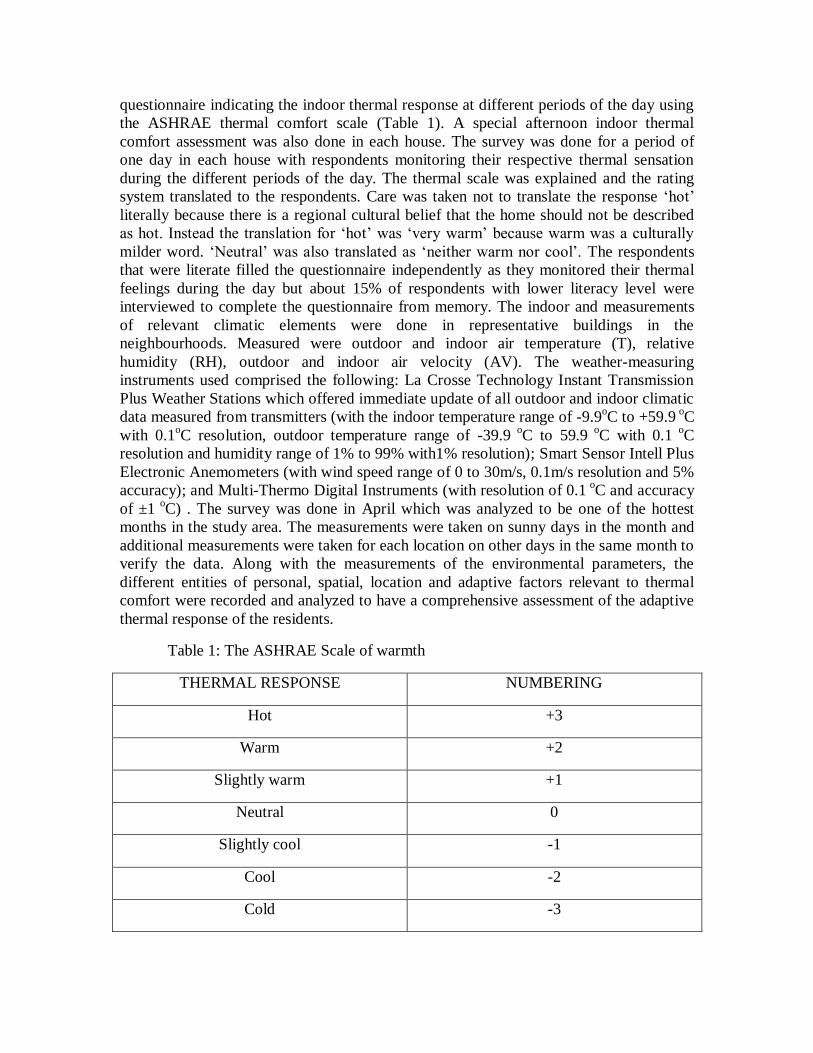
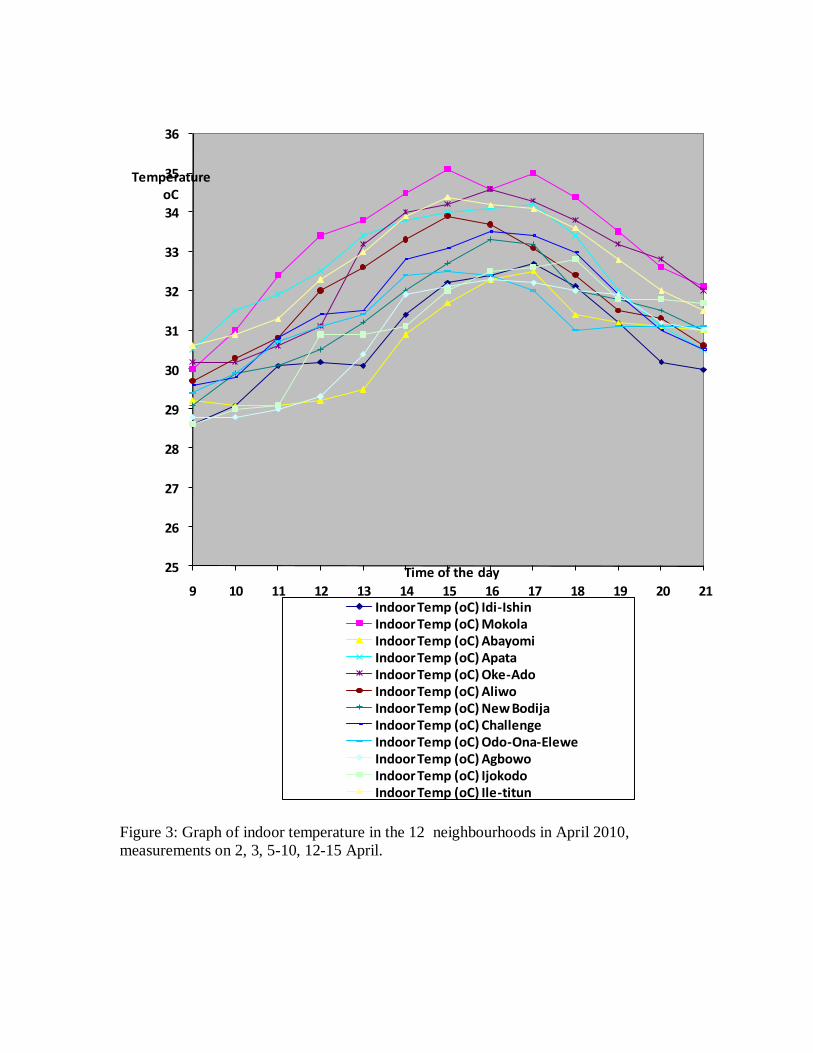
25
26
27
28
29
30
31
32
33
34
35
36
9 10 11 12 13 14 15 16 17 18 19 20 21
TemperatureoC
Time of the day
Indoor Temp (oC) Idi-IshinIndoor Temp (oC) MokolaIndoor Temp (oC) AbayomiIndoor Temp (oC) ApataIndoor Temp (oC) Oke-AdoIndoor Temp (oC) AliwoIndoor Temp (oC) New BodijaIndoor Temp (oC) ChallengeIndoor Temp (oC) Odo-Ona-EleweIndoor Temp (oC) AgbowoIndoor Temp (oC) IjokodoIndoor Temp (oC) Ile-titun
Figure 3 Graph of indoor temperature in the 12 neighbourhoods in April 2010
measurements on 2 3 5-10 12-15 April
25
26
27
28
29
30
31
32
33
34
35
36
37
38
9 10 11 12 13 14 15 16 17 18 19 20 21
TemperatureoC
Time of the dayOutdoor Temp (oC) Idi-IshinOutdoor Temp (oC) MokolaOutdoor Temp (oC) AbayomiOutdoor Temp (oC) ApataOutdoor Temp (oC) Oke-AdoOutdoor Temp (oC) AliwoOutdoor Temp (oC) New BodijaOutdoor Temp (oC) ChallengeOutdoor Temp (oC) Odo-Ona-EleweOutdoor Temp (oC) AgbowoOutdoor Temp (oC) IjokodoOutdoor Temp (oC) Ile-titun
Figure 4 Graph of outdoor temperature in the 12 neighbourhoods in April 2010
measurements on 2 3 5-10 12-15 April
0
5
10
15
20
25
30
35
40
9 10 11 12 13 14 15 16 17 18 19 20 21Time of the day
Temp oC
Outdoor Temperature (oC)
Indoor Temperature (oC)
Figure 5 Typical Outdoor and Indoor temperature variation for a house in the study area
3 Variation of Thermal Response in the Metropolis
There was significant variation of thermal responses across the residential densities and
house types The following bar charts (Figures 6 and 7) provide further explanation of the
distribution of the respondentsrsquo thermal responses which were used to compute the values
of the mean comfort votes across the different cases that were considered The
distribution of the responses indicated that there were variations in the indoor thermal
experience of the respondents living in the different categories of residential densities
building types and typologies The analysis showed that the face to face bungalow and
face to face storey house types were uncomfortable for respondents while the bungalow
flats storey flats and the duplex house types were reported more comfortable The
dynamism of the responses was shown in the way the votes were distributed over almost
every thermal response category in each considered case This signified the variety that is
attributable to human psychological response to thermal comfort However it was also
noted that majority of respondents usually gave their responses in three adjacent thermal
response categories This justified the use of the mean vote for the total population since
the majority always gave their thermal responses in similar response categories on the
thermal sensation scale
It was remarkable that the mean votes of adaptive thermal responses varied across
the periods of the day and across the neighbourhoods (Table 5) The values obtained
reflected the results of the earlier analysis of air temperatures across the neighbourhoods
The buildings in the low density neighbourhoods were generally comfortable while
Figure 6 The distribution of thermal responses for the afternoon special assessment
across building densities and building types in the study area
Figure 7 The distribution of thermal responses for the afternoon special assessment
across building densities and design typologies in the study area
buildings in the high density neighbourhoods were uncomfortable as assessed by the
respondents in the afternoon period The calculated combined mean votes for all
respondents could however be used to give a general description of the temporal variation
of the thermal comfort within the buildings in the study area The combined mean vote
for morning was -1335 (cool) and combined mean vote for afternoon was +0857
(warm) The combined mean vote for evening was +0195 (slightly warm) while the
combined mean vote for night was -0619 (slightly cool) These values indicated that the
responses followed the pattern of outdoor and indoor air temperature temporal variations
in the metropolis as shown earlier in Figs 3 and 4 Air temperature was therefore
confirmed as a very significant parameter of thermal comfort in the study area The
variation of temperatures across residential densities and the effect on indoor thermal
comfort is a pointer to the impact of the urban microclimate on the built environment in
Table 5 This is a table of the mean comfort votes of respondents in the different periods
of the day
Neighbourhood
Building Density
Number of
Respondents
Mean Vote
Morning
(10am)
Mean Vote
Afternoon
(3pm)
Mean
Vote
Evening
(6pm)
Mean
Vote
Night
(9pm)
New Bodija- Low 44 -1818 -0591 -1341 -2000
Mokola- High 44 -0364 +1705 +1318 +0523
Ijokodo- Medium 44 -1143 +0452 -0643 -1619
Abayomi- Medium 44 -1636 +0591 +0455 -0318
Oke Ado- High 44 -1293 +1698 +0690 +0119
Aliwo- High 44 -1045 +1364 +1182 +0455
Apata- Apata 44 -1886 +1636 +0159 -0886
Ile titun- High 44 -1238 +1907 +0762 -0244
Idi Ishin- Low 44 -2023 -1114 -1477 -2227
Odo Ona Elewe-
Medium
44 -1477 +1205 +0318 -0614
Challenge- High 44 -0905 +1333 +1238 +0548
Agbowo- High 44 -1132 -0026 -0351 -1189
COMBINED VOTE 528 -1335 +0857 +0195 -0619
Source Adunola (2011)
the metropolis The mean comfort votes for the low medium and high density
neighbourhoods implied decreasing indoor comfort level with increasing density The
impact of building density was found remarkable on air temperature and the indoor
comfort
4 Variation of Mean Comfort Vote with Air Temperature
The pattern of variation of the Mean Comfort Votes of the Adaptive thermal
responses with indoor and outdoor air temperatures were of interest in this study Table 6
indicates the various indoor and outdoor temperatures and the corresponding mean
comfort votes of adaptive thermal response Graphs were plotted to relate indoor
temperature and mean comfort vote as well as outdoor temperature and mean comfort
vote The graphs indicated significant linear relationships with high R Square values
Table 6 Air temperatures and Residentsrsquo Mean Comfort Votes
Outdoor Temperature oC Indoor Temperature oC Mean Comfort Vote
morning
286 294 -1761
282 290 -1920
285 303 -1284
292 286 -1096
293 300 -1139
294 292 -0719
afternoon
366 339 1114
341 325 -0829
355 335 0837
369 341 1518
364 343 0902
360 350 1632
evening
320 331 0307
315 321 -1409
328 330 -0151
337 341 0977
322 329 0964
330 336 0555
night
292 309 -0602
273 297 -2114
280 304 -1105
275 300 0042
285 310 0118
Source Adunola (2011)
The data from the table was analyzed to produce the graph (Fig 7) with the equation
relating mean comfort vote to indoor temperature given as
y = 0483x ndash 1559 (1)
where y = mean comfort vote and x = indoor temperature R Square value was 0722
which implied a very strong linear relationship The second graph for the outdoor
temperature (Fig 8) also indicated a linear equation as follows
y = 0280x ndash 9062 (2)
where y = mean comfort vote and x = outdoor temperature R Square value was 0635
which implied a very strong relationship
These equations can be used to provide estimated corresponding values of mean
votes of respondents and the indoor and outdoor temperatures It must be noted however
that there were several other factors that influenced the mean vote along with air
temperature The data collected for all other variables were analyzed All the sets of
predictor variables explained remarkable percentages of the variance of the adaptive
thermal response in the afternoon period as follows building spatial characteristics-
357 (F= 14797 ρle005) location characteristics- 268 (F= 31710 ρle005) outdoor
climatic factors 212 (F= 34382 ρle005) personal characteristics- 204 (F= 10093
ρle005) adaptive actions- 146 (F= 5810 ρle005) indoor climatic factors 118 (F=
22866 ρle005) The set of a combination of all the listed variables ndash personal adaptive
action climatic spatial and location characteristics as predictor variables explained
521 of the variance of the adaptive thermal response (F= 10474 ρle005)
When interpreting the respective results obtained for indoor temperature from
equation (1) and outdoor temperatures from equation (2) therefore the substantial
contextual input of other variables of adaptive thermal comfort especially adaptive
actions must be recognized It was deduced that the respondentrsquos adaptive actions
enabled them to tolerate the high values of indoor and outdoor temperatures recorded in
the study The adaptive nature of human thermal comfort has been expressed as being a
means of extending the comfort conditions within spaces as occupants utilize the adaptive
opportunities available to them The uncomfortable thermal conditions in the periods of
discomfort enabled the principle of adaptive comfort to be operational The adaptive
principle states that if a change occurs such as to produce discomfort people react in
ways which tend to restore their comfort (Nicol and Humphreys 2002)
y = 0483x - 1559Rsup2 = 0722
-25
-2
-15
-1
-05
0
05
1
15
2
0 5 10 15 20 25 30 35 40
Mean vote ofAdaptive thermal
response
Indoor Temperature oC
Figure 7 Graph relating Mean Comfort Vote of residents and Indoor Temperature in
Ibadan in April 2010
y = 0280x - 9062Rsup2 = 0635
-25
-2
-15
-1
-05
0
05
1
15
2
0 5 10 15 20 25 30 35 40
Mean vote of Adaptive thermal
response
Outdoor temperature oC
Figure 8 Graph relating Mean Comfort Vote of residents and Outdoor Temperature in
Ibadan in April 2010
Conclusion
Maximum values of measured outdoor and indoor temperatures ranged from 341
oC to 369
oC and from 325
oC to 35
oC respectively This occurred in the afternoon period
making it the most uncomfortable in the study area The reduction of 16 -19 deg C from
the outdoor maximum to the indoor maximum temperatures was a confirmation of the
interaction between the buildings and the climate It was inferred that many of the
buildings in the study area needed more thermal effectiveness either in terms of design or
fabric composition or both to be able to further reduce indoor temperatures and the
discomfort impact of the urban microclimate Indoor and outdoor air temperatures varied
across the neighbourhoods and the air temperature of the city built environment was
found to be influenced by the urban neighbourhood characteristics This inferred the
influence of urban form on the urban microclimate Variations were found in the obtained
mean comfort votes of adaptive thermal responses across the residential neighbourhoods
building densities and house types The thermal response of residents were found to be a
function of the indoor and outdoor temperatures respectively Both indoor and outdoor air
temperatures were respectively confirmed as strong determinants of the mean comfort
vote of the respondents with equations relating them
From the findings some recommendations can be made towards the attainment of
better indoor environment in Ibadan and other Nigerian cities based on the physiological
needs of the residents for comfortable indoor thermal environment Effective urban
design in tropical regions needs the input of research findings on indoor thermal comfort
because building thermal comfort affects the sustainability of the urban environment It
was found that air temperatures were higher in neighbourhoods with high building
density and high level of traffic The master plan of urban centres should therefore be
prepared with adequate thermal comfort considerations at both the micro and macro
levels Appropriate building densities have to be considered for urban neighbourhoods A
decongestion programme should be embarked on for presently high density
neighbourhoods to reduce the thermal discomfort in such neighbourhoods There should
be introduction of green areas in the cities with recreational parks located in the central
areas to help in reducing air temperatures Planting of trees in all neighbourhoods within
the cities should be effected to enhance air movement and provide shade from the heat of
direct solar radiation If adequate steps are taken to reduce air temperatures in the city the
built environment will be more comfortable
References
Adesoye PO (2011) Analysis of Climatic Data of Ibadan Metropolis Implications for
Green City In Adeyemo R (ed) Urban Agriculture Cities and Climate Change
Alex Von Humboldt Fdn Cuvillier Verlag Goumlttingen Germany pp 51-57
Adunola AO (2011) Adaptive Thermal Comfort in Residential Buildings in Ibadan
Metropolis Unpublished PhD Thesis Obafemi Awolowo University Ile-Ife
Nigeria
Asiyanbola RA (2011) Gender and Urban Housing Settings in Africa-Nigeria Paper
presented at the International RC21 Conference on lsquoThe Struggle to Belong-
Dealing with Diversity in 21st Century Urban Settingsrsquo Amsterdam 7-9 Jul2011
Retrieved from httpwwwrc21orgconferencesamsterdam2011edocs on
Sept8 2011
Auliciems A (1981) Toward a Psycho-physiological Model of Thermal Perception
International Journal of Biometeorology Vol 25 No 2 pp 109-122
Ayeni B (1994) The Metropolitan Area of Ibadan Its Growth and Spatial Structure In
Filani MO Akintola FO and Ikporukpo CO (eds) Ibadan Region
Geography Dept UI Rex Charles Publication Ibadan
Beng TH (1994) Tropical Architecture and Interiors Page One Books London UK
deDear R (1998) A global database for thermal comfort field experiments ASHRAE
Transactions Vol 104(1b) pp 1141-1152
Emmanuel MR (2005) An Urban Approach to Climate-sensitive Design Strategies for
the Tropics Taylor and Francis UK
Givoni B (1998) Climate Considerations in Building and Urban Design John Wiley
and Sons UK
Haase M and Amato A (2009) An Investigation of the Potential for Natural
Ventilation and Building Orientation to Achieve Thermal Comfort in Warm and
Humid Climates Solar Energy Vol 83 No3 pp 389-399
httpenwikipeadiaorgwikiIbadanNigeria Ibadan climate- BBC Weather Analysis
Chart Retrieved on Apr10 2010
httpwwwabsoluteastronomycomtopicsIbadan Ibadan climate Retrieved on
Aug152011
Humphreys MA (1975) Fields Studies of Thermal Comfort Compared and Applied
Symposium on Physiological Requirements of the Microclimate Prague BRE 8 -
10 Sept 1975
Humphreys MA (1978) Outdoor temperatures and comfort indoors Bld Res And
Practice (Journal of CIB) Vol6 No2 pp 92-105
Humphreys MA Nicol JF and Raja IA (2007) Field studies of indoor thermal
comfort and progress of the adaptive approach In Santamouris M (ed)
Advances in Building Energy Research Vol1 Earthscan pp 55-88
Jusuf S K Wong NH Hagen E Anggoro R and Hong Y (2007) The Influence of
Land Use on the Urban Heat Island in Singapore Habitat International Vol 31
No 2 pp232-242
National Bureau of Statistics (2008) Annual Abstract of Statistics 2008 National Bureau
of Statistics Nigeria
Nicol JF and Humphreys MA (2002) Adaptive Thermal Comfort and Sustainable
Thermal Standards for Buildings Energy and Buildings Vol34 No6 pp 563 ndash
572
Nicol JF and Humphreys MA (2010) Derivation of the Adaptive Equations for
Thermal Comfort in Free-running Buildings in European Standard EN 15251
Building and Environment Vol 45 Issue 1Jan2010 pp11-17
Ojo O (1977) The Climates of West Africa Heinemann Educational Books Ltd
London UK
Pearlmutter D (2000) Architecture and Climate the Environmental Continuum
Geography Compass Vol1 No 4 pp 752-778
Szokolay SV and Brisbin C (2004) Introduction to Architectural Science Elsevier
Publishers UK
Appendix
Photographs of typical house types in Ibadan metropolis
A face to face bungalow in the study area
A face to face storey house in the study area
A storey flat in the study area
A duplex in the study area
A traditional house in the study area
A vernacular house in the study area
A contemporary house in the study area

25
26
27
28
29
30
31
32
33
34
35
36
37
38
9 10 11 12 13 14 15 16 17 18 19 20 21
TemperatureoC
Time of the dayOutdoor Temp (oC) Idi-IshinOutdoor Temp (oC) MokolaOutdoor Temp (oC) AbayomiOutdoor Temp (oC) ApataOutdoor Temp (oC) Oke-AdoOutdoor Temp (oC) AliwoOutdoor Temp (oC) New BodijaOutdoor Temp (oC) ChallengeOutdoor Temp (oC) Odo-Ona-EleweOutdoor Temp (oC) AgbowoOutdoor Temp (oC) IjokodoOutdoor Temp (oC) Ile-titun
Figure 4 Graph of outdoor temperature in the 12 neighbourhoods in April 2010
measurements on 2 3 5-10 12-15 April
0
5
10
15
20
25
30
35
40
9 10 11 12 13 14 15 16 17 18 19 20 21Time of the day
Temp oC
Outdoor Temperature (oC)
Indoor Temperature (oC)
Figure 5 Typical Outdoor and Indoor temperature variation for a house in the study area
3 Variation of Thermal Response in the Metropolis
There was significant variation of thermal responses across the residential densities and
house types The following bar charts (Figures 6 and 7) provide further explanation of the
distribution of the respondentsrsquo thermal responses which were used to compute the values
of the mean comfort votes across the different cases that were considered The
distribution of the responses indicated that there were variations in the indoor thermal
experience of the respondents living in the different categories of residential densities
building types and typologies The analysis showed that the face to face bungalow and
face to face storey house types were uncomfortable for respondents while the bungalow
flats storey flats and the duplex house types were reported more comfortable The
dynamism of the responses was shown in the way the votes were distributed over almost
every thermal response category in each considered case This signified the variety that is
attributable to human psychological response to thermal comfort However it was also
noted that majority of respondents usually gave their responses in three adjacent thermal
response categories This justified the use of the mean vote for the total population since
the majority always gave their thermal responses in similar response categories on the
thermal sensation scale
It was remarkable that the mean votes of adaptive thermal responses varied across
the periods of the day and across the neighbourhoods (Table 5) The values obtained
reflected the results of the earlier analysis of air temperatures across the neighbourhoods
The buildings in the low density neighbourhoods were generally comfortable while
Figure 6 The distribution of thermal responses for the afternoon special assessment
across building densities and building types in the study area
Figure 7 The distribution of thermal responses for the afternoon special assessment
across building densities and design typologies in the study area
buildings in the high density neighbourhoods were uncomfortable as assessed by the
respondents in the afternoon period The calculated combined mean votes for all
respondents could however be used to give a general description of the temporal variation
of the thermal comfort within the buildings in the study area The combined mean vote
for morning was -1335 (cool) and combined mean vote for afternoon was +0857
(warm) The combined mean vote for evening was +0195 (slightly warm) while the
combined mean vote for night was -0619 (slightly cool) These values indicated that the
responses followed the pattern of outdoor and indoor air temperature temporal variations
in the metropolis as shown earlier in Figs 3 and 4 Air temperature was therefore
confirmed as a very significant parameter of thermal comfort in the study area The
variation of temperatures across residential densities and the effect on indoor thermal
comfort is a pointer to the impact of the urban microclimate on the built environment in
Table 5 This is a table of the mean comfort votes of respondents in the different periods
of the day
Neighbourhood
Building Density
Number of
Respondents
Mean Vote
Morning
(10am)
Mean Vote
Afternoon
(3pm)
Mean
Vote
Evening
(6pm)
Mean
Vote
Night
(9pm)
New Bodija- Low 44 -1818 -0591 -1341 -2000
Mokola- High 44 -0364 +1705 +1318 +0523
Ijokodo- Medium 44 -1143 +0452 -0643 -1619
Abayomi- Medium 44 -1636 +0591 +0455 -0318
Oke Ado- High 44 -1293 +1698 +0690 +0119
Aliwo- High 44 -1045 +1364 +1182 +0455
Apata- Apata 44 -1886 +1636 +0159 -0886
Ile titun- High 44 -1238 +1907 +0762 -0244
Idi Ishin- Low 44 -2023 -1114 -1477 -2227
Odo Ona Elewe-
Medium
44 -1477 +1205 +0318 -0614
Challenge- High 44 -0905 +1333 +1238 +0548
Agbowo- High 44 -1132 -0026 -0351 -1189
COMBINED VOTE 528 -1335 +0857 +0195 -0619
Source Adunola (2011)
the metropolis The mean comfort votes for the low medium and high density
neighbourhoods implied decreasing indoor comfort level with increasing density The
impact of building density was found remarkable on air temperature and the indoor
comfort
4 Variation of Mean Comfort Vote with Air Temperature
The pattern of variation of the Mean Comfort Votes of the Adaptive thermal
responses with indoor and outdoor air temperatures were of interest in this study Table 6
indicates the various indoor and outdoor temperatures and the corresponding mean
comfort votes of adaptive thermal response Graphs were plotted to relate indoor
temperature and mean comfort vote as well as outdoor temperature and mean comfort
vote The graphs indicated significant linear relationships with high R Square values
Table 6 Air temperatures and Residentsrsquo Mean Comfort Votes
Outdoor Temperature oC Indoor Temperature oC Mean Comfort Vote
morning
286 294 -1761
282 290 -1920
285 303 -1284
292 286 -1096
293 300 -1139
294 292 -0719
afternoon
366 339 1114
341 325 -0829
355 335 0837
369 341 1518
364 343 0902
360 350 1632
evening
320 331 0307
315 321 -1409
328 330 -0151
337 341 0977
322 329 0964
330 336 0555
night
292 309 -0602
273 297 -2114
280 304 -1105
275 300 0042
285 310 0118
Source Adunola (2011)
The data from the table was analyzed to produce the graph (Fig 7) with the equation
relating mean comfort vote to indoor temperature given as
y = 0483x ndash 1559 (1)
where y = mean comfort vote and x = indoor temperature R Square value was 0722
which implied a very strong linear relationship The second graph for the outdoor
temperature (Fig 8) also indicated a linear equation as follows
y = 0280x ndash 9062 (2)
where y = mean comfort vote and x = outdoor temperature R Square value was 0635
which implied a very strong relationship
These equations can be used to provide estimated corresponding values of mean
votes of respondents and the indoor and outdoor temperatures It must be noted however
that there were several other factors that influenced the mean vote along with air
temperature The data collected for all other variables were analyzed All the sets of
predictor variables explained remarkable percentages of the variance of the adaptive
thermal response in the afternoon period as follows building spatial characteristics-
357 (F= 14797 ρle005) location characteristics- 268 (F= 31710 ρle005) outdoor
climatic factors 212 (F= 34382 ρle005) personal characteristics- 204 (F= 10093
ρle005) adaptive actions- 146 (F= 5810 ρle005) indoor climatic factors 118 (F=
22866 ρle005) The set of a combination of all the listed variables ndash personal adaptive
action climatic spatial and location characteristics as predictor variables explained
521 of the variance of the adaptive thermal response (F= 10474 ρle005)
When interpreting the respective results obtained for indoor temperature from
equation (1) and outdoor temperatures from equation (2) therefore the substantial
contextual input of other variables of adaptive thermal comfort especially adaptive
actions must be recognized It was deduced that the respondentrsquos adaptive actions
enabled them to tolerate the high values of indoor and outdoor temperatures recorded in
the study The adaptive nature of human thermal comfort has been expressed as being a
means of extending the comfort conditions within spaces as occupants utilize the adaptive
opportunities available to them The uncomfortable thermal conditions in the periods of
discomfort enabled the principle of adaptive comfort to be operational The adaptive
principle states that if a change occurs such as to produce discomfort people react in
ways which tend to restore their comfort (Nicol and Humphreys 2002)
y = 0483x - 1559Rsup2 = 0722
-25
-2
-15
-1
-05
0
05
1
15
2
0 5 10 15 20 25 30 35 40
Mean vote ofAdaptive thermal
response
Indoor Temperature oC
Figure 7 Graph relating Mean Comfort Vote of residents and Indoor Temperature in
Ibadan in April 2010
y = 0280x - 9062Rsup2 = 0635
-25
-2
-15
-1
-05
0
05
1
15
2
0 5 10 15 20 25 30 35 40
Mean vote of Adaptive thermal
response
Outdoor temperature oC
Figure 8 Graph relating Mean Comfort Vote of residents and Outdoor Temperature in
Ibadan in April 2010
Conclusion
Maximum values of measured outdoor and indoor temperatures ranged from 341
oC to 369
oC and from 325
oC to 35
oC respectively This occurred in the afternoon period
making it the most uncomfortable in the study area The reduction of 16 -19 deg C from
the outdoor maximum to the indoor maximum temperatures was a confirmation of the
interaction between the buildings and the climate It was inferred that many of the
buildings in the study area needed more thermal effectiveness either in terms of design or
fabric composition or both to be able to further reduce indoor temperatures and the
discomfort impact of the urban microclimate Indoor and outdoor air temperatures varied
across the neighbourhoods and the air temperature of the city built environment was
found to be influenced by the urban neighbourhood characteristics This inferred the
influence of urban form on the urban microclimate Variations were found in the obtained
mean comfort votes of adaptive thermal responses across the residential neighbourhoods
building densities and house types The thermal response of residents were found to be a
function of the indoor and outdoor temperatures respectively Both indoor and outdoor air
temperatures were respectively confirmed as strong determinants of the mean comfort
vote of the respondents with equations relating them
From the findings some recommendations can be made towards the attainment of
better indoor environment in Ibadan and other Nigerian cities based on the physiological
needs of the residents for comfortable indoor thermal environment Effective urban
design in tropical regions needs the input of research findings on indoor thermal comfort
because building thermal comfort affects the sustainability of the urban environment It
was found that air temperatures were higher in neighbourhoods with high building
density and high level of traffic The master plan of urban centres should therefore be
prepared with adequate thermal comfort considerations at both the micro and macro
levels Appropriate building densities have to be considered for urban neighbourhoods A
decongestion programme should be embarked on for presently high density
neighbourhoods to reduce the thermal discomfort in such neighbourhoods There should
be introduction of green areas in the cities with recreational parks located in the central
areas to help in reducing air temperatures Planting of trees in all neighbourhoods within
the cities should be effected to enhance air movement and provide shade from the heat of
direct solar radiation If adequate steps are taken to reduce air temperatures in the city the
built environment will be more comfortable
References
Adesoye PO (2011) Analysis of Climatic Data of Ibadan Metropolis Implications for
Green City In Adeyemo R (ed) Urban Agriculture Cities and Climate Change
Alex Von Humboldt Fdn Cuvillier Verlag Goumlttingen Germany pp 51-57
Adunola AO (2011) Adaptive Thermal Comfort in Residential Buildings in Ibadan
Metropolis Unpublished PhD Thesis Obafemi Awolowo University Ile-Ife
Nigeria
Asiyanbola RA (2011) Gender and Urban Housing Settings in Africa-Nigeria Paper
presented at the International RC21 Conference on lsquoThe Struggle to Belong-
Dealing with Diversity in 21st Century Urban Settingsrsquo Amsterdam 7-9 Jul2011
Retrieved from httpwwwrc21orgconferencesamsterdam2011edocs on
Sept8 2011
Auliciems A (1981) Toward a Psycho-physiological Model of Thermal Perception
International Journal of Biometeorology Vol 25 No 2 pp 109-122
Ayeni B (1994) The Metropolitan Area of Ibadan Its Growth and Spatial Structure In
Filani MO Akintola FO and Ikporukpo CO (eds) Ibadan Region
Geography Dept UI Rex Charles Publication Ibadan
Beng TH (1994) Tropical Architecture and Interiors Page One Books London UK
deDear R (1998) A global database for thermal comfort field experiments ASHRAE
Transactions Vol 104(1b) pp 1141-1152
Emmanuel MR (2005) An Urban Approach to Climate-sensitive Design Strategies for
the Tropics Taylor and Francis UK
Givoni B (1998) Climate Considerations in Building and Urban Design John Wiley
and Sons UK
Haase M and Amato A (2009) An Investigation of the Potential for Natural
Ventilation and Building Orientation to Achieve Thermal Comfort in Warm and
Humid Climates Solar Energy Vol 83 No3 pp 389-399
httpenwikipeadiaorgwikiIbadanNigeria Ibadan climate- BBC Weather Analysis
Chart Retrieved on Apr10 2010
httpwwwabsoluteastronomycomtopicsIbadan Ibadan climate Retrieved on
Aug152011
Humphreys MA (1975) Fields Studies of Thermal Comfort Compared and Applied
Symposium on Physiological Requirements of the Microclimate Prague BRE 8 -
10 Sept 1975
Humphreys MA (1978) Outdoor temperatures and comfort indoors Bld Res And
Practice (Journal of CIB) Vol6 No2 pp 92-105
Humphreys MA Nicol JF and Raja IA (2007) Field studies of indoor thermal
comfort and progress of the adaptive approach In Santamouris M (ed)
Advances in Building Energy Research Vol1 Earthscan pp 55-88
Jusuf S K Wong NH Hagen E Anggoro R and Hong Y (2007) The Influence of
Land Use on the Urban Heat Island in Singapore Habitat International Vol 31
No 2 pp232-242
National Bureau of Statistics (2008) Annual Abstract of Statistics 2008 National Bureau
of Statistics Nigeria
Nicol JF and Humphreys MA (2002) Adaptive Thermal Comfort and Sustainable
Thermal Standards for Buildings Energy and Buildings Vol34 No6 pp 563 ndash
572
Nicol JF and Humphreys MA (2010) Derivation of the Adaptive Equations for
Thermal Comfort in Free-running Buildings in European Standard EN 15251
Building and Environment Vol 45 Issue 1Jan2010 pp11-17
Ojo O (1977) The Climates of West Africa Heinemann Educational Books Ltd
London UK
Pearlmutter D (2000) Architecture and Climate the Environmental Continuum
Geography Compass Vol1 No 4 pp 752-778
Szokolay SV and Brisbin C (2004) Introduction to Architectural Science Elsevier
Publishers UK
Appendix
Photographs of typical house types in Ibadan metropolis
A face to face bungalow in the study area
A face to face storey house in the study area
A storey flat in the study area
A duplex in the study area
A traditional house in the study area
A vernacular house in the study area
A contemporary house in the study area

0
5
10
15
20
25
30
35
40
9 10 11 12 13 14 15 16 17 18 19 20 21Time of the day
Temp oC
Outdoor Temperature (oC)
Indoor Temperature (oC)
Figure 5 Typical Outdoor and Indoor temperature variation for a house in the study area
3 Variation of Thermal Response in the Metropolis
There was significant variation of thermal responses across the residential densities and
house types The following bar charts (Figures 6 and 7) provide further explanation of the
distribution of the respondentsrsquo thermal responses which were used to compute the values
of the mean comfort votes across the different cases that were considered The
distribution of the responses indicated that there were variations in the indoor thermal
experience of the respondents living in the different categories of residential densities
building types and typologies The analysis showed that the face to face bungalow and
face to face storey house types were uncomfortable for respondents while the bungalow
flats storey flats and the duplex house types were reported more comfortable The
dynamism of the responses was shown in the way the votes were distributed over almost
every thermal response category in each considered case This signified the variety that is
attributable to human psychological response to thermal comfort However it was also
noted that majority of respondents usually gave their responses in three adjacent thermal
response categories This justified the use of the mean vote for the total population since
the majority always gave their thermal responses in similar response categories on the
thermal sensation scale
It was remarkable that the mean votes of adaptive thermal responses varied across
the periods of the day and across the neighbourhoods (Table 5) The values obtained
reflected the results of the earlier analysis of air temperatures across the neighbourhoods
The buildings in the low density neighbourhoods were generally comfortable while
Figure 6 The distribution of thermal responses for the afternoon special assessment
across building densities and building types in the study area
Figure 7 The distribution of thermal responses for the afternoon special assessment
across building densities and design typologies in the study area
buildings in the high density neighbourhoods were uncomfortable as assessed by the
respondents in the afternoon period The calculated combined mean votes for all
respondents could however be used to give a general description of the temporal variation
of the thermal comfort within the buildings in the study area The combined mean vote
for morning was -1335 (cool) and combined mean vote for afternoon was +0857
(warm) The combined mean vote for evening was +0195 (slightly warm) while the
combined mean vote for night was -0619 (slightly cool) These values indicated that the
responses followed the pattern of outdoor and indoor air temperature temporal variations
in the metropolis as shown earlier in Figs 3 and 4 Air temperature was therefore
confirmed as a very significant parameter of thermal comfort in the study area The
variation of temperatures across residential densities and the effect on indoor thermal
comfort is a pointer to the impact of the urban microclimate on the built environment in
Table 5 This is a table of the mean comfort votes of respondents in the different periods
of the day
Neighbourhood
Building Density
Number of
Respondents
Mean Vote
Morning
(10am)
Mean Vote
Afternoon
(3pm)
Mean
Vote
Evening
(6pm)
Mean
Vote
Night
(9pm)
New Bodija- Low 44 -1818 -0591 -1341 -2000
Mokola- High 44 -0364 +1705 +1318 +0523
Ijokodo- Medium 44 -1143 +0452 -0643 -1619
Abayomi- Medium 44 -1636 +0591 +0455 -0318
Oke Ado- High 44 -1293 +1698 +0690 +0119
Aliwo- High 44 -1045 +1364 +1182 +0455
Apata- Apata 44 -1886 +1636 +0159 -0886
Ile titun- High 44 -1238 +1907 +0762 -0244
Idi Ishin- Low 44 -2023 -1114 -1477 -2227
Odo Ona Elewe-
Medium
44 -1477 +1205 +0318 -0614
Challenge- High 44 -0905 +1333 +1238 +0548
Agbowo- High 44 -1132 -0026 -0351 -1189
COMBINED VOTE 528 -1335 +0857 +0195 -0619
Source Adunola (2011)
the metropolis The mean comfort votes for the low medium and high density
neighbourhoods implied decreasing indoor comfort level with increasing density The
impact of building density was found remarkable on air temperature and the indoor
comfort
4 Variation of Mean Comfort Vote with Air Temperature
The pattern of variation of the Mean Comfort Votes of the Adaptive thermal
responses with indoor and outdoor air temperatures were of interest in this study Table 6
indicates the various indoor and outdoor temperatures and the corresponding mean
comfort votes of adaptive thermal response Graphs were plotted to relate indoor
temperature and mean comfort vote as well as outdoor temperature and mean comfort
vote The graphs indicated significant linear relationships with high R Square values
Table 6 Air temperatures and Residentsrsquo Mean Comfort Votes
Outdoor Temperature oC Indoor Temperature oC Mean Comfort Vote
morning
286 294 -1761
282 290 -1920
285 303 -1284
292 286 -1096
293 300 -1139
294 292 -0719
afternoon
366 339 1114
341 325 -0829
355 335 0837
369 341 1518
364 343 0902
360 350 1632
evening
320 331 0307
315 321 -1409
328 330 -0151
337 341 0977
322 329 0964
330 336 0555
night
292 309 -0602
273 297 -2114
280 304 -1105
275 300 0042
285 310 0118
Source Adunola (2011)
The data from the table was analyzed to produce the graph (Fig 7) with the equation
relating mean comfort vote to indoor temperature given as
y = 0483x ndash 1559 (1)
where y = mean comfort vote and x = indoor temperature R Square value was 0722
which implied a very strong linear relationship The second graph for the outdoor
temperature (Fig 8) also indicated a linear equation as follows
y = 0280x ndash 9062 (2)
where y = mean comfort vote and x = outdoor temperature R Square value was 0635
which implied a very strong relationship
These equations can be used to provide estimated corresponding values of mean
votes of respondents and the indoor and outdoor temperatures It must be noted however
that there were several other factors that influenced the mean vote along with air
temperature The data collected for all other variables were analyzed All the sets of
predictor variables explained remarkable percentages of the variance of the adaptive
thermal response in the afternoon period as follows building spatial characteristics-
357 (F= 14797 ρle005) location characteristics- 268 (F= 31710 ρle005) outdoor
climatic factors 212 (F= 34382 ρle005) personal characteristics- 204 (F= 10093
ρle005) adaptive actions- 146 (F= 5810 ρle005) indoor climatic factors 118 (F=
22866 ρle005) The set of a combination of all the listed variables ndash personal adaptive
action climatic spatial and location characteristics as predictor variables explained
521 of the variance of the adaptive thermal response (F= 10474 ρle005)
When interpreting the respective results obtained for indoor temperature from
equation (1) and outdoor temperatures from equation (2) therefore the substantial
contextual input of other variables of adaptive thermal comfort especially adaptive
actions must be recognized It was deduced that the respondentrsquos adaptive actions
enabled them to tolerate the high values of indoor and outdoor temperatures recorded in
the study The adaptive nature of human thermal comfort has been expressed as being a
means of extending the comfort conditions within spaces as occupants utilize the adaptive
opportunities available to them The uncomfortable thermal conditions in the periods of
discomfort enabled the principle of adaptive comfort to be operational The adaptive
principle states that if a change occurs such as to produce discomfort people react in
ways which tend to restore their comfort (Nicol and Humphreys 2002)
y = 0483x - 1559Rsup2 = 0722
-25
-2
-15
-1
-05
0
05
1
15
2
0 5 10 15 20 25 30 35 40
Mean vote ofAdaptive thermal
response
Indoor Temperature oC
Figure 7 Graph relating Mean Comfort Vote of residents and Indoor Temperature in
Ibadan in April 2010
y = 0280x - 9062Rsup2 = 0635
-25
-2
-15
-1
-05
0
05
1
15
2
0 5 10 15 20 25 30 35 40
Mean vote of Adaptive thermal
response
Outdoor temperature oC
Figure 8 Graph relating Mean Comfort Vote of residents and Outdoor Temperature in
Ibadan in April 2010
Conclusion
Maximum values of measured outdoor and indoor temperatures ranged from 341
oC to 369
oC and from 325
oC to 35
oC respectively This occurred in the afternoon period
making it the most uncomfortable in the study area The reduction of 16 -19 deg C from
the outdoor maximum to the indoor maximum temperatures was a confirmation of the
interaction between the buildings and the climate It was inferred that many of the
buildings in the study area needed more thermal effectiveness either in terms of design or
fabric composition or both to be able to further reduce indoor temperatures and the
discomfort impact of the urban microclimate Indoor and outdoor air temperatures varied
across the neighbourhoods and the air temperature of the city built environment was
found to be influenced by the urban neighbourhood characteristics This inferred the
influence of urban form on the urban microclimate Variations were found in the obtained
mean comfort votes of adaptive thermal responses across the residential neighbourhoods
building densities and house types The thermal response of residents were found to be a
function of the indoor and outdoor temperatures respectively Both indoor and outdoor air
temperatures were respectively confirmed as strong determinants of the mean comfort
vote of the respondents with equations relating them
From the findings some recommendations can be made towards the attainment of
better indoor environment in Ibadan and other Nigerian cities based on the physiological
needs of the residents for comfortable indoor thermal environment Effective urban
design in tropical regions needs the input of research findings on indoor thermal comfort
because building thermal comfort affects the sustainability of the urban environment It
was found that air temperatures were higher in neighbourhoods with high building
density and high level of traffic The master plan of urban centres should therefore be
prepared with adequate thermal comfort considerations at both the micro and macro
levels Appropriate building densities have to be considered for urban neighbourhoods A
decongestion programme should be embarked on for presently high density
neighbourhoods to reduce the thermal discomfort in such neighbourhoods There should
be introduction of green areas in the cities with recreational parks located in the central
areas to help in reducing air temperatures Planting of trees in all neighbourhoods within
the cities should be effected to enhance air movement and provide shade from the heat of
direct solar radiation If adequate steps are taken to reduce air temperatures in the city the
built environment will be more comfortable
References
Adesoye PO (2011) Analysis of Climatic Data of Ibadan Metropolis Implications for
Green City In Adeyemo R (ed) Urban Agriculture Cities and Climate Change
Alex Von Humboldt Fdn Cuvillier Verlag Goumlttingen Germany pp 51-57
Adunola AO (2011) Adaptive Thermal Comfort in Residential Buildings in Ibadan
Metropolis Unpublished PhD Thesis Obafemi Awolowo University Ile-Ife
Nigeria
Asiyanbola RA (2011) Gender and Urban Housing Settings in Africa-Nigeria Paper
presented at the International RC21 Conference on lsquoThe Struggle to Belong-
Dealing with Diversity in 21st Century Urban Settingsrsquo Amsterdam 7-9 Jul2011
Retrieved from httpwwwrc21orgconferencesamsterdam2011edocs on
Sept8 2011
Auliciems A (1981) Toward a Psycho-physiological Model of Thermal Perception
International Journal of Biometeorology Vol 25 No 2 pp 109-122
Ayeni B (1994) The Metropolitan Area of Ibadan Its Growth and Spatial Structure In
Filani MO Akintola FO and Ikporukpo CO (eds) Ibadan Region
Geography Dept UI Rex Charles Publication Ibadan
Beng TH (1994) Tropical Architecture and Interiors Page One Books London UK
deDear R (1998) A global database for thermal comfort field experiments ASHRAE
Transactions Vol 104(1b) pp 1141-1152
Emmanuel MR (2005) An Urban Approach to Climate-sensitive Design Strategies for
the Tropics Taylor and Francis UK
Givoni B (1998) Climate Considerations in Building and Urban Design John Wiley
and Sons UK
Haase M and Amato A (2009) An Investigation of the Potential for Natural
Ventilation and Building Orientation to Achieve Thermal Comfort in Warm and
Humid Climates Solar Energy Vol 83 No3 pp 389-399
httpenwikipeadiaorgwikiIbadanNigeria Ibadan climate- BBC Weather Analysis
Chart Retrieved on Apr10 2010
httpwwwabsoluteastronomycomtopicsIbadan Ibadan climate Retrieved on
Aug152011
Humphreys MA (1975) Fields Studies of Thermal Comfort Compared and Applied
Symposium on Physiological Requirements of the Microclimate Prague BRE 8 -
10 Sept 1975
Humphreys MA (1978) Outdoor temperatures and comfort indoors Bld Res And
Practice (Journal of CIB) Vol6 No2 pp 92-105
Humphreys MA Nicol JF and Raja IA (2007) Field studies of indoor thermal
comfort and progress of the adaptive approach In Santamouris M (ed)
Advances in Building Energy Research Vol1 Earthscan pp 55-88
Jusuf S K Wong NH Hagen E Anggoro R and Hong Y (2007) The Influence of
Land Use on the Urban Heat Island in Singapore Habitat International Vol 31
No 2 pp232-242
National Bureau of Statistics (2008) Annual Abstract of Statistics 2008 National Bureau
of Statistics Nigeria
Nicol JF and Humphreys MA (2002) Adaptive Thermal Comfort and Sustainable
Thermal Standards for Buildings Energy and Buildings Vol34 No6 pp 563 ndash
572
Nicol JF and Humphreys MA (2010) Derivation of the Adaptive Equations for
Thermal Comfort in Free-running Buildings in European Standard EN 15251
Building and Environment Vol 45 Issue 1Jan2010 pp11-17
Ojo O (1977) The Climates of West Africa Heinemann Educational Books Ltd
London UK
Pearlmutter D (2000) Architecture and Climate the Environmental Continuum
Geography Compass Vol1 No 4 pp 752-778
Szokolay SV and Brisbin C (2004) Introduction to Architectural Science Elsevier
Publishers UK
Appendix
Photographs of typical house types in Ibadan metropolis
A face to face bungalow in the study area
A face to face storey house in the study area
A storey flat in the study area
A duplex in the study area
A traditional house in the study area
A vernacular house in the study area
A contemporary house in the study area

A face to face storey house in the study area
A storey flat in the study area
A duplex in the study area
A traditional house in the study area
A vernacular house in the study area
A contemporary house in the study area

A traditional house in the study area
A vernacular house in the study area
A contemporary house in the study area