urban-rural differences in longwave radiation Łódź case study
TRANSCRIPT

K. Fortuniak, W. Pawlak, M. Siedlecki, and M. Zieliński
Department of Meteorology and Climatology University of Łódź, Poland
Urban-rural differences in longwave radiation – Łódź case study

The physical processes leading to urban-rural differences in longwave radiation are well understood, but there is a limited number of publications which gives quantitative information on the differences. The aim of this work is to estimate urban-rural differences of longwave radiation components in Łódź, central Poland.
Motivation

Parameters: L↓, L↑ and L*
Sites: Lipowa – urban Annosław – rural
Period: the 3 years of continuous measurements (2011.11.01 – 2014.10.31) at two sites
Sensors: CNR1 (Lipowa – urban site), CNR4 (Annosław – rural site)
Frequency: 5 min
Loggers: Campbell Sci.
Data

Measurement sites
10 km
Urban site Łódź, Lipowa 81 str. 208 m a.s.l. 51°45’45’’ N, 19°26’43’’ E
Rural site Annosław 208 m n.p.m. 51°45’01’’ N, 19°26’42’’ E
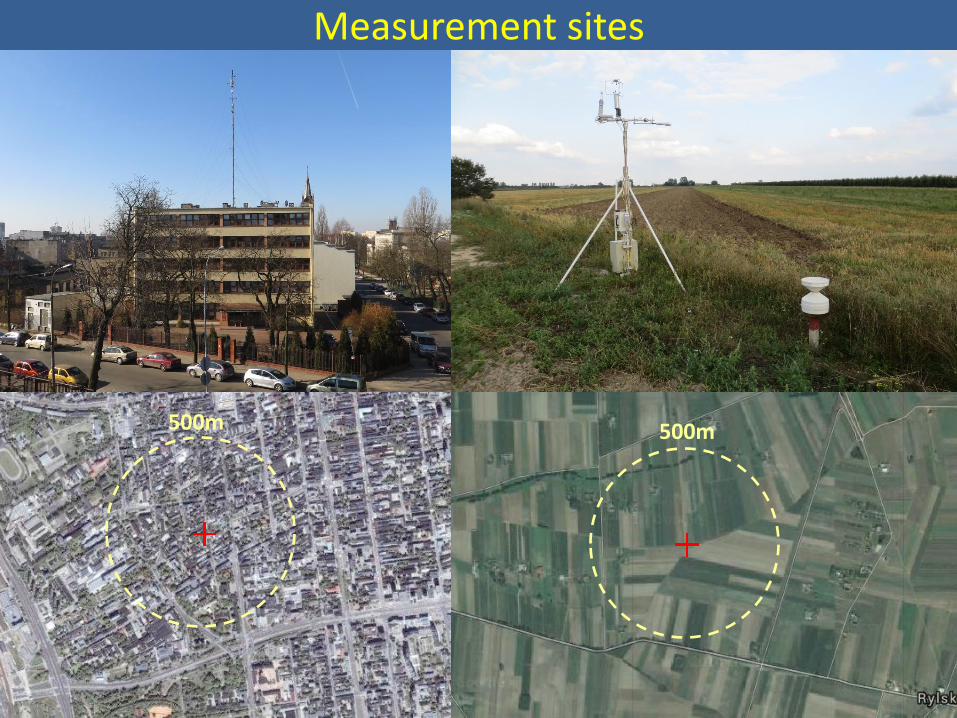
Measurement sites
500m 500m

Because of site distance (65 km) the urban-rural differences were analyzed in two ways:
Differences in statistical measures (differences between mean values and percentiles – first we calculated mean daily courses in months and then compared statistics at both sites; the same for percentiles)
Differences in selected cases of clear (L*> 90th percentile) and cloudy (L* <10th percentile) situations (first we calculated the differences between two sites for the selected cases and then analyzed in statistical way).
Methodology

Daily course of L↓ in months in Łódź (urban site) Raw data (dots), mean values, absolute maxima and minima, 2, 10, 90 and 98 percentiles.
Downward radiation

Daily course of L↓ in months in Annosław (rural site) Raw data (dots), mean values, absolute maxima and minima, 2,10,90 and 98 percentiles.
Downward radiation

Daily course of L↓ in months in Annosław (rural site) and in Łódź (urban site) Mean values, 2 and 98 percentiles.
Downward radiation

Daily course of L↓ u−L↓ r in months. Differences between mean, 2% and 98% percentiles for urban and rural sites in absolute units and in relation to urban values.
Downward radiation

Daily course of L↓ u−L↓ r in months. Differences between mean, and mean differences in cloudy and clear situations for urban and rural sites in absolute units and in relation to urban values.
Downward radiation

Daily course of L↓ u−L↓ r in months. Differences between mean, 2% and 98% percentiles, and mean differences in cloudy and clear situations for urban and rural sites in absolute units and in relation to urban values.
Downward radiation

Daily course of L↑ in months in Łódź (urban station) Raw data (dots), mean values, absolute maxima and minima, 2,10,90 and 98 percentiles.
Upward radiation

Daily course of L↑ in months in Annosław (rural station) Raw data (dots), mean values, absolute maxima and minima, 2,10,90 and 98 percentiles.
Upward radiation

Daily course of L↑ in months in Annosław (rural site) and in Łódź (urban site) Mean values, 2 and 98 percentiles.
Upward radiation
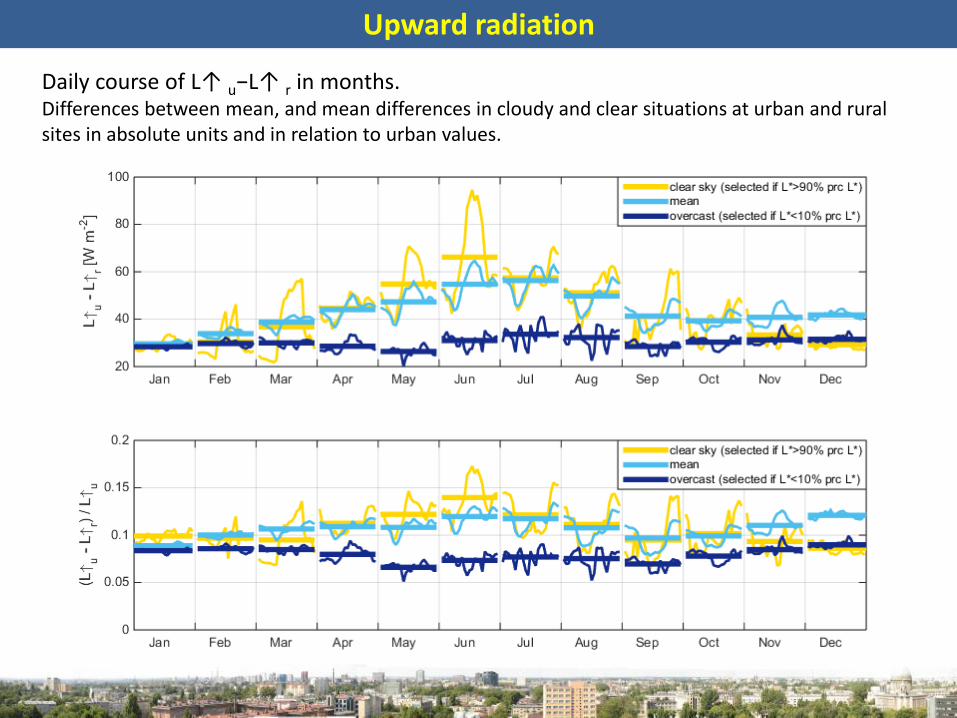
Daily course of L↑ u−L↑ r in months. Differences between mean, and mean differences in cloudy and clear situations at urban and rural sites in absolute units and in relation to urban values.
Upward radiation

Daily course of L*=L↑−L↓ in months in Łódź (urban site) Raw data (dots), mean values, absolute maxima and minima, 2,10,90 and 98 percentiles.
Longwave radiation balance

Daily course of L*=L↑−L↓ in months in Annosław (rural station) Raw data (dots), mean values, absolute maxima and minima, 2,10,90 and 98 percentiles.
Longwave radiation balance

Daily course of L*=L↑−L↓ in months in Annosław (rural station) and in Łódź (urban site) Raw data (dots), mean values, absolute maxima and minima, 2,10,90 and 98 percentiles.
Longwave radiation balance

Daily course of L*u−L*r in months. Differences between mean, 98% percentile, and mean differences in cloudy and clear situations for urban and rural sites in absolute units and in relation to urban values.
Longwave radiation balance

• The downward longwave radiation is about 20-30 Wm–2 (average 28 Wm–2) higher in the city with slightly pronounced maximum in summer.
• No clear diurnal course is observed for L↓differences. • The differences in L↓ are higher in cloudy situations, lower in cloudless. • The differences in relation to L↓ at urban areas are at the level of 8-10% all over the
year.
• The differences in L↑ in clear sky situations varies from 30 Wm–2 in winter to almost 70 Wm–2 in summer, the similar differences are observed for mean values (average 43 Wm–2) with slightly lower maximum in summer (60 Wm–2).
• In cloudy days L↑ differences remain at the same level 30 Wm–2 all over the year. • In spring and early summer L↑ differences are higher in afternoons and lower in
early mornings. • The differences in L* vary from about 10 Wm–2 in winter 20-30 Wm–2 in summer for
mean (average 14 Wm–2) and cloudless days. • In cloudy situations no urban-rural differences are observed. • Similarly to L↑ in spring and early summer differences in L* are higher in afternoons
and lower in early mornings.
Conclusions