urban shallow lake (taihu, china) of water quality and
TRANSCRIPT

Page 1/25
Spatiotemporal Heterogeneities and Driving Factorsof Water Quality and Trophic State of a TypicalUrban Shallow Lake (Taihu, China)Yonggui Wang
China University of GeosciencesYanqi Guo ( [email protected] )
China University of Geosciences https://orcid.org/0000-0002-5305-3056Yanxin Zhao
Chinese Academy for Environmental PlanningLunche Wang
China University of GeosciencesYan Chen
Chinese Academy for Environmental PlanningLing Yang
China University of Geosciences
Research Article
Keywords: Lake Taihu, water quality, eutrophication, spatiotemporal heterogeneities, driving factors,urban shallow lakes
Posted Date: November 9th, 2021
DOI: https://doi.org/10.21203/rs.3.rs-988334/v1
License: This work is licensed under a Creative Commons Attribution 4.0 International License. Read Full License

Page 2/25
AbstractWater quality deterioration and eutrophication of urban shallow lakes are global ecological problems withincreasing concern and greater environmental efforts. In this study, spatiotemporal changes of waterquality and eutrophication over 2015-2019 in Lake Taihu, were assessed using the monthly time series of7 water quality parameters measured at 17 sites. The whole lake was divided into 7 sub-lakes and trophiccondition was evaluated by trophic level index (TLI). Taihu had poor water quality overall which wasmainly astricted by the total nitrogen (TN) and the total phosphorus (TP) and maintained a light-eutropher state, but it had improved in the last �ve years. It is found that all nutrient parameters reachedrelatively higher concentrations in the northwestern and northern Taihu with combined cluster analysisand spatial interpolation methods. Meiliang Bay was the most polluted and nutrient-rich area. Mann-Kendall test highlighted the fact that the TP and chlorophyll-a (Chl-a) concentrations increasedsigni�cantly while the TN and �ve-day biochemical oxygen demand (BOD5) decreased. The nutrientloading input from the northwestern areas with high human activity and the geomorphologicalcharacteristic of the northern closed bays were the main contributors to the spatial heterogeneity in waterquality. The main driving force of N pollution was the declining river in�ow N loading. And P pollutionwas affected more by accumulated endogenous pollution, decline aquatic plants area, as well as closelylinked with algae biomass. Further water pollution and eutrophication mitigation of Taihu should focuson the limitation of algae and those heavily polluted closed bays.
HighlightsWater quality exhibited signi�cant spatial heterogeneity, poor in the northwest but better in thesoutheast.
Concentrations of TP and Chl-a were increased signi�cantly for the last �ve years.
The main driving force of nitrogen pollution was river in�ow.
Endogenous pollution took responsibility for phosphorus pollution.
The Chl-a concentration was closely linked with TP and algae biomass.
1 IntroductionWith the speed-up of industrialization, urbanization and agriculture, abundant industrial, domestic andrural wastewater in�ow into urban lakes, accelerating water quality deterioration and eutrophicationulteriorly. Shallow lakes have the characteristics of low water depth with strong hydrodynamicdisturbance and intense lake-land, air-water and water-sediment interactions, which makes them morevulnerable to water pollution (Hatvani et al., 2020). Such phenomenon has been found in a lot shallowlakes, such as Lake Erie (North America) (Steffen et al. 2014), Lake Kasimagaura (Japan) (Xu et al.2010), Lake Victoria(African) (Olokotum et al. 2020)and Lake Chaohu and Taihu (China) (Qin 2020;Zhang and Kong 2015). As shallow lakes usually have the crucial functions of drinking-water source,aquaculture and irrigation, a series of protective programs have been launched to control the decline in

Page 3/25
freshwater quality (Qin 2007; Schindler 2006). China has paid impressive environmental efforts toalleviate water pollution for these three decades and gained certain positive effects in some lake basins(Ma et al. 2020; Qin et al. 2019). However, the water environment of many lakes still has not beenfundamentally improved. The root cause lies in that the driving forces of water pollution in different lakesvary with basin natural environment (e.g., geomorphological characteristic of the lake, monsoon),anthropogenic activities (e.g., wastewater e�uent, water diversion project, government treatment policy)and also change over time. Therefore, the analysis of spatiotemporal heterogeneity of water quality andeutrophication status of different lakes individually is helpful to identify the main parameters thatpolluted the water body and distinguish the driving forces of water quality, so as to maintain waterenvironment sustainability according to local conditions.
Lake Taihu (referred to as “Taihu” below), a typical large urban shallow lake, has long been a popularresearch site in the world due to its frequent water environment deterioration events (Paerl et al. 2011; Qinet al. 2010; Qin et al. 2013). Taihu is the distribution center of a combination of mass point source andnon-point source sewage with a complex river network (228 rivers or channels) (Taihu Basin Authority OfMinistry Of Water Resources 2019), which is greatly affected by human activities (Gao et al. 2002; Wanget al. 2019). With intensive treatment after the occurrence of Wuxi water pollution incident of Taihu inMay 2007, the water environment quality of Taihu improved apparently. However, the frequency andformation area of cyanobacterial bloom in Taihu seems to have a rising trend since 2015 (Yang et al.2016; Zhang et al. 2021). So it is necessary to analyze the water quality and trophic state changefeatures of Taihu and judge whether there are any abnormal phenomena after 2015.
Numerous studies have shown that the water quality and eutrophication of Taihu affected by thehydrology, weather condition and the aquatic vegetation multiply (Wang et al. 2019; Wu et al. 2015; Zhaet al. 2018). However, some problems and shortcomings in the existing research still need to beaddressed. Pats of studies are limited to focus on a certain area of Taihu, such as Meiliang Bay and WuliBay (Wang et al. 2019; Wang et al. 2019), and some are limited to analysis of TN, TP concentrationsseparately(Zhu et al. 2013; Zhu et al. 2021). Earlier studies reveal that eutrophication of Taihu can bemanaged by limiting the nutrient inputs (N or P) to the waterbody (Dai et al. 2016; Xie et al. 2017).However, it is di�cult to achieve satisfactory effects only by taking this treatment blindly under the newsituation, especially since 2015. In other words, it is urgent to identify diverse driving factors of waterquality and take corresponding measures nowadays by analyzing more nutrient, physical and ecologicalwater quality parameters (e.g., permanganate index (CODMn), ammonia nitrogen (NH3-N), �ve-daybiochemical oxygen demand (BOD5), secchi disk (SD), Chlorophyll a (Chl-a)) and exploring the pollutionsituation in different sub-lakes of the whole Taihu in more detail. In light of the above, analyzinglongitudinal time series data and contrasting each Taihu sub-lake area horizontally of multiple waterquality parameters plus with Trophic Level Index (TLI) are helpful to �ll the lack of the previous research.
The primary objectives of this study are as follows: (1) Exploring the temporal and spatial variationcharacteristics of water quality and trophic state of Taihu from 2015 to 2019. (2) Identifying the mainfactors affecting the water quality of Taihu and its changing trend. (3) Exploring the in�ow rivers

Page 4/25
pollution load, the hydrometeorological conditions, shape of the lake and other factors concerning waterquality. These conclusions sever as a theoretical basis for the comprehensive treatment of Taihu in linewith seasonal and local circumstances.
2 Materials And Methods
2.1 Study area and data sourcesTaihu (119°52' 120°36'E and 30°55' 31°32'N),the third largest freshwater lake in China, is a typicalsubtropical shallow lake located in the southeastern of the Yangtze River Delta, with a maximum waterdepth of 2.6m and an average water depth of 1.9m (Zhang et al. 2014). The Taihu Basin, is one of themost industrialized, urbanized and densely populated areas in China, playing an important role indrinking water supply, �ood controlling, tourism supporting and recreation, shipping and aquaculture. Thenorthwest sector of Taihu accounts for 83% of the total runoff into the lake, and the out�ow rivers areconcentrated in the southeast sector.
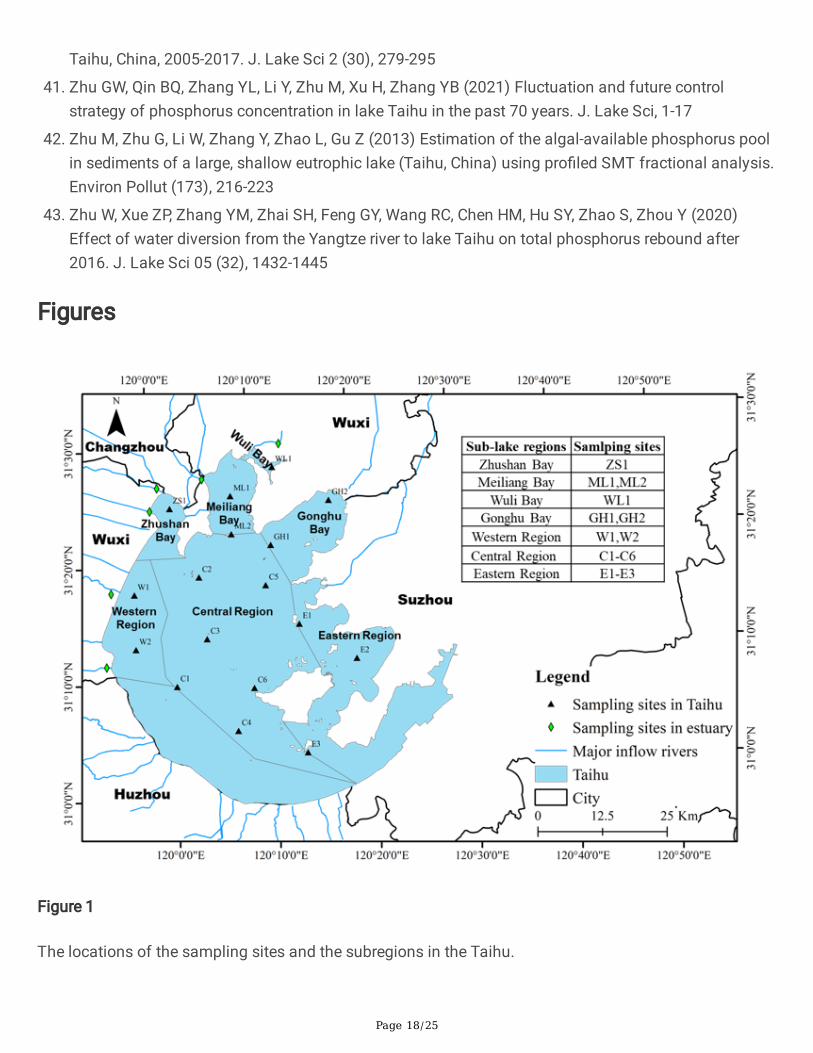
In this study, datasets from 17 sampling sites were divided into 7 regions according to the Taihu BasinAuthority of Ministry of Water Resources to analyze the spatiotemporal of water quality of Taihu. The 7subregions are the Zhushan Bay, Meiliang Bay, Wuli Bay, Gonghu Bay, Eastern Region, Western Region,and Central Region (Fig. 1), respectively. The datasets were collected from 2015 to 2019 on a monthlybasis and the monitoring parameters include CODMn, TN, TP, NH3-N, BOD5, SD, Chl-a. The unit of SD and
Chl-a is meter (m) and mg/m3 separately, and the units of the rest parameters are all mg/L. Water qualityand hydrology data in this paper were obtained from Taihu Basin Ecology and Environmental ScienceResearch Center.
2.2 Methods For Data AnalysisAfter preprocessing the data (outlier detection and �ltering of typos), the concentration of each parameterwas calculated by the mean values of all sampling sites in its spatial range. According to thecharacteristics of the natural environment in Taihu Lake Basin, the seasons were divided into spring(March to May), summer (June to August), autumn (September to November) and winter (December toFebruary). The seasonal and annual mean concentration was calculated from the monthly means.
The Single Factor Evaluation method is used to assess the water quality level of each sampling site. Themain idea is to compare the monitoring value of each water quality parameter with the standard value ofthe target parameter according to the Environmental Quality Standard for Surface Water of China(GB3838-2002). After comparing all of the evaluation parameters, the worst water quality parameter levelis selected as the level for the entire water body.
The trophic condition of Taihu was assessed by Trophic Level Index (TLI) (China EnvironmentalMonitoring Station, 2001) (Wang et al. 2002). For both qualitative and quantitative aspects, TLI is a

Page 5/25
weighted sum based on the correlations between Chl-a and other four parameters (TP, TN, SD andCODMn). The calculation includes Equations (1) - (6) :
(1)
(2)
(3)
(4)
(5)
(6)
where, j present Chl-a, TN, TP, SD or CODMn, TLI(j) is trophic level index of j, Wj is correlative weight foreach parameter (Chl-a, 0.266; TP, 0.188; TN, 0.179; SD, 0.183; CODMn, 0.183) (Wang et al. 2019). The unitof each parameter is consistent with the description in the preceding text.
The TLI ranges from 0 to 100, with high values representing high eutrophication levels. Trophic status isclassi�ed into �ve grades based on the TLI scores: oligotropher (TLI < 30); mesotropher (30 ≤ TLI ≤ 50);light-eutropher (50 < TLI≤ 60); middle-eutropher (60 < TLI≤ 70); hyper-eutropher (TLI > 70). The trophicstatus of each sampling site was assessed from the corresponding TLI calculated value, and the TLIvalue of the whole Taihu is the mean value of all sampling sites.
The spatial distribution of Taihu water environment was drawn by Inverse Distance Weighted (IDW)method using Arcgis software. Hierarchical cluster analysis (HCA) was carried out on the above-mentioned divided seven lakes, and the lakes with similar water quality were divided into a group.
The Mann-Kendall (MK) statistical test is selected to analyze the long-term trend of the water qualitysequence. MK test, a rank-based non-parametric method, has been widely used for detecting trends inhydrometeorological time series(Ali et al. 2019; Kisi and Ay 2014; Wu and Qian 2017). Comparing toparametric tests, it has no requirements of homoscedasticity or prior assumptions on the distribution ofthe data sample and is less sensitive to outliers. As the MK test statistic is determined by the ranks andsequences of time series rather than the original values, it is robust when dealing with non-normallydistributed data, censored data, and time series with missing values, which are commonly encountered inhydrometeorological time series (Wang et al. 2020; Yue and Wang 2004). Pearson’s CorrelationCoe�cient is used to estimate the correlation between different water quality indexes.
3 Results And Discussion
TLI(Σ)=m
∑j=1
Wj × TLI(j)
TLI (Chl − a) = 10 [2.5 + 1.086ln (Chl − a)]
TLI (TP) = 10 [9.436 + 1.624ln (TP)]
TLI (TN) = 10 [5.453 + 1.694ln (TN)]
TLI (SD) = 10 [5.118 − 1.94ln (SD)]
TLI (CODMn) = 10 [0.109 + 2.661ln (CODMn)]

Page 6/25
3.1 Water quality assessment and eutrophication stateevaluation of TaihuIn the China Environmental Quality Standards for Surface Water (GB3838-2002), when the water qualityreaches GB Level III, it is deemed as quali�ed. The mean concentration of BOD5, CODMn and NH3-N forTaihu in 2015-2019 was 2.25, 3.94 and 0.15 mg/L (Table 1), meeting Levell I, Level and Level separately. It indicated that the water quality of these three parameters for Taihu was relatively superior.The TP concentration of Taihu reached 0.076mg/L, belonging to Level (0.05-0.1 mg/L), and the TNconcentration was as high as 1.589mg/L, belonging to Level (1.5-2.0 mg/L). The data above showedthat TN and TP were the principal indexes determining the water quality of Taihu.
Table 1
The average concentration of each water quality parameter in different lake areas from2015 to 2019
Lake area CODMn
(mg/L)
BOD5
(mg/L)
NH3-N
(mg/L)
TN
(mg/L)
TP
(mg/L)
SD
(m)
Chl-a
(mg/m3)
Zhushan Bay 4.68 3.56 0.67 3.67 0.15 0.39 23.52
Meiliang Bay 4.36 2.74 0.11 1.59 0.08 0.40 28.04
Wuli Bay 4.37 3.30 0.13 1.02 0.07 0.50 26.33
Gonghu Bay 4.04 2.30 0.13 1.42 0.07 0.44 17.71
Western Region 4.22 2.56 0.24 2.01 0.10 0.32 21.72
Central Region 3.79 1.93 0.10 1.48 0.07 0.34 15.51
Eastern Region 3.31 1.56 0.07 1.12 0.05 0.37 10.58
Taihu 3.94 2.25 0.15 1.59 0.08 0.37 18.19
During the past �ve years, the overall proportion of water quality was mainly of Level IV (42.66%),followed by Level III and Level V, accounting for 31.25% and 20.73% respectively (Fig. 2). The proportionbeing above average (reaching or superior to Level ) increased from 24.48% in 2015 to 33.82% in 2019,while Level IV reduced by 14 percentage points approximately. The data told us that the water quality ofTaihu was generally poor with a slight improvement in the last �ve years. The proportion of seriouspollution (reaching or inferior to Level V) increased, rather than declined, reminding us that the waterpollution treatment of Taihu still had a long way to go. Taihu had been in a state of lightly eutrophicoverall for these years. The mean TLI of Taihu during 2015-2019 was 53.6, with a �uctuation of53.1~54.6.
Water pollution in different sub-lakes varied greatly. Among 7 sub-lake areas, Zhushan Bay had the worstwater quality, whose sum proportion of reaching or inferior to Level was up to 90%. The water quality in

Page 7/25
Western Region and Meiliang Bay also was poor, for they both accounted for less than 25% of the Level II-III. The Eastern Region had the best water quality. The TLI of each sub-lake was in the order as ZhushanBay (59.8) > Western Region (56.7) >Meiliang Bay (55.7) >Central Region (53.3) > Gonghu Bay (53.0) >Wulihu Bay (52.7) > 50 (lightly eutrophic) > Eastern Region (49.2). The TLI of Zhushan Bay wassigni�cantly higher than that of other sub-lakes and it reached middle-eutropher in nearly half of theobservation months, announcing that Zhushan Bay was the focus area affecting the water quality ofTaihu.
3.2 Spatial heterogeneities of water quality and trophic state in Taihu
3.2.1 Spatial variation of water quality and cluster analysis of sub-lakesConcentration maps were representations of the spatial variability of water quality parameters and TLIand were prepared by spatial interpolation of the �ve-year mean concentration of 17 sampling sites usingthe Inverse Distance Weighted (IDW) method (Fig. 3). The water quality of Taihu showed obvious spatialheterogeneity: the concentrations of every parameter (except SD) and TLI were all lower from thenorthwest to the southeast, indicating that the water quality in the northwestern Taihu was worse thanthat in the southeast.
SD is an integrated response parameter of lake plankton and both organic and inorganic solutions,re�ecting the clarity and turbidity of the lake directly. Low values of SD appeared in the Western Region(0.32m) as well as the Central Region (0.34m). Due to a large number of rivers with a huge amount ofsediment entering the Western Region, the SD value of this area was the lowest. In the Central Region,open lake surface with a higher monthly mean wind speed than that of the lakeshore (Zhang et al. 2003),sediments were easily suspended under the disturbance of wind and �ow, resulting in a highconcentration of suspended substances in water. So the SD value was low in this area. High values of SDappeared in Wuli Bay (0.496m) and Gonghu Bay (0.44m).
The seven sub-lakes were divided into three groups basing on the monthly mean concentration of sevenparameters by hierarchical clustering analysis (HCA) (Fig. 3i). Zhushan Bay, whose water quality was theworst, belonging to a single group. The second group contained Wuli Bay, Meiliang Bay and WesternRegion with poor water quality; The last group was the Eastern Region, Central Region and Gonghu Bayrepresenting better water quality. The clustering result was also consistent with the above conclusions ofspatial heterogeneity—the water quality of Taihu improved from northwest sector to southeast.
3.2.2 Factors Determining Water Quality SpatialHeterogeneityThe north and northwest of Taihu were the most polluted area. The main reason for this spatialheterogeneity might lie in the pollutant loads of the major rivers around the lake. According to the Health

Page 8/25
Status Report of Taihu Lake (Taihu Basin Authority Of Ministry Of Water Resources 2019), the HuxiRegion, including the Western Region and Zhushan Bay, accounted for 68.4% of the total in�ow water ofTaihu. Cities along rivers had developed industry and agriculture and high population density withnumerous ports, so the pollution load of river in�ow was tremendous. Xie (Xie et al. 2017) made statisticson the net pollution load of the Western Region, Zhushan Bay, Meiliang Bay and the Southern Regionfrom 2007 to 2014, �nding that the Western Region and Zhushan Bay were the main areas where mostpollution remained. The problem of water pollution in Zhushan Bay has existed for a long time due to theexternal nutrient loading from rivers. After the occurrence of Wuxi water pollution incident of Taihu in May2007 (Zhang et al. 2010), the gates of Zhihugang and Wujingang, originally connected to Meiliang Bay,were closed, resulting in most of the pollutants diverted to Zhushan Bay (Hu et al. 2010), which greatlyaffected the water environment of Zhushan Bay, making it the most polluted area with the most seriousdegradation of lake ecosystem and the highest occurrence of algal bloom in frequency.
To analyze the impact of external pollution source input carrying by the river channel in the north andnorthwest of Taihu on the lake body scienti�cally, monitoring sites on estuary were divided according tothe location of sub-lakes. Correlation analysis was carried out between the quarterly mean water qualityparameter (CODMn, NH3-N, TN and TP) concentration in four sub-lakes (Zhushan Bay, Wuli Bay, MeiliangBay, and Western Region) with the corresponding concentration of in�ow river water (Fig. 4). The resultsshowed that the quality parameters concentrations of Zhushan Bay and Wuli Bay were greatly affectedby the river in�ow. The concentration of CODMn, NH3-N, TN of the lake water in Zhushan Bay, CODMn, TN,TP in the Wuli Bay, and the TN concentration of the Western Region were signi�cantly related (p<0.05 orP<0.01) to the concentration �uctuation of estuary water.
Therefore, nutrient-rich wastewater from the northern and northwestern regions was the chief reason forserious water pollution in the Western Region, Zhushan Bay, Meiliang Bay. The improvement of waterquality of river in�ow was the main reason for the promotion of water quality in the north and northwestof Taihu synchronously, and then ameliorate other lake areas and the whole Taihu. The NH3-N and TNconcentrations of the estuary water were much higher than that of the lake water, suggesting that theexternal input N loading was the main source of N pollution in Taihu.
There were many pocket-like bays in the northern and northwestern Taihu. Zhushan Bay, Meiliang Bayand Wuli Bay were all relatively closed waters independent of the big Taihu. These areas received a largeamount of sewage from nearby cities like Wuxi and Changzhou, and the pollution load into the lake bayfar exceeded their assimilative capacity. The �ow movement in the small lake bay was slow and waterexchange with big Taihu was blocked due to geomorphology. Under the combined action of thesereasons, pollutants in lake bay were not easy to transfer to the open lake area and accumulated in situ.Plus poor self-puri�cation ability, these bays became heavily polluted areas of Taihu. As for the factorsaffecting the spatial characteristics of Chl-a, the monsoon must be mentioned. In summer, the southeastmonsoon prevailed in Taihu and blew the algae to the northwest, resulting in a higher Chl-a concentrationin the northwest.

Page 9/25
In this study, the Chl-a concentration and TLI of Gonghu Bay were relatively low, indicating the waterquality was relatively good. The improvement of water quality in Gonghu Bay might be related to WaterDiversion from the Yangtze River Project (WDP). Although Gonghu Bay was also a pocket-liked bay,bene�ting from the WDP, it had both Yangtze River in�ow—whose nutrition concentration (e.g., TP) waslower compared with other major rivers entering Taihu (Zhu et al. 2020)—and channels for out�ow, whichhad a positive effect on the water exchange and alleviating the eutrophication statue (Yan et al. 2011).
According to the results of correlation analysis in Fig. 4, there was no signi�cant correlation between TPconcentration of lake water and estuary water in most lake areas, except Wuli Bay. Compared with theother sub-lakes, the area of Wulihu Bay (8.6km2) was the smallest, even smaller than 1/7 of the secondsmallest bay—Zhushan Bay (68.3 km2). Wuli Bay extended into the interior of the coastal city Wuxi, withslow water �ow, long water exchange cycle and poor water self-puri�cation capacity. Thus, the waterquality parameters of Wuli Bay were greatly affected by the river in�ow, synchronous �uctuatingobviously, especially the TP concentration. This phenomenon showed that the smaller and more closedlake area is more affected by the river in�ow pollution.
3.3 Temporal Trends Of Water Quality In Taihu
3.3.1 Annual dynamic of water qualityThe interannual variation of seven parameters and TLI for Taihu from 2015 to 019 is shown in Fig. 5. Mktest is applied to estimate the long-term variation trend of each parameter on the scale of the whole Taihuand sub-lakes basing on monthly mean concentration (Fig. 6). Results of the MK illustrated that theconcentration of BOD5 (p<0.05) and TN (p<0.01) of Taihu decreased signi�cantly and the value of TP(p<0.01), SD (p<0.01) and Chl-a (p<0.05) increased notably in the last �ve years.
The concentration of CODMn, BOD5 and NH3-N had always maintained a good state for these years, andall met Level in 2019. Although CODMn and NH3-N didn’t show signi�cant trends as far as the wholeTaihu is concerned, the concentration of these two parameters in more than half of the sub-lakes declinedapparently in 2019 comparing with that in 2015 (Fig. 5b). The NH3-N concentration in Zhushan Bayshowed a remarkable downward trend, dropping from 0.84 mg/L in 2015 to 0.46 mg/L in 2019, adramatic reduction of 45.24%.
As for TN, although the concentration of most sub-lakes never met Level , it is gratifying that theconcentration of the big Taihu and six sub-lakes, except Wuli Bay, all had marked downward trends(p<0.05). The TN concentration for Taihu declined from 1.69mg/L in 2015 to 1.42 mg/L in 2019, and allsub-lakes except Wuli Bay had reductions close to or more than 25%. Although TN concentration ofZhushan Bay declined from 4.28mg/L in 2015 to 3.1mg/L(inferior to Level )in 2019, its concentrationstill much higher than the mean concentration of lake-level about 1.31mg/L, inferior to Level . Wuli Baywas the only sub-lake where TN concentration increased.

Page 10/25
The TP and Chl-a concentration in Taihu showed signi�cant upward trends as well as in most sub-lakes.The TP concentration of Zhushan Bay was the highest among the seven sub-lakes, and it �uctuatedbetween 0.127-0.176 mg/L, reaching Level for a long time. And it had the biggest growth rate (>150%)of Chl-a in concentration �ve years. The concentration of TP in Wuli Bay raised from 0.046 mg/L in 2015to 0.092 mg/L in 2019, with a growth of 100%, and its Chl-a concentration increased by more than 100%.
The SD value in all sub-lakes increased in 2019 comparing to 2015, showing that the turbidity of Taihudecreased and the underwater light environment improved. The TLI in the big Taihu and each sub-lakewas relatively stable. Zhushan Bay reached middle-eutropher and the Eastern Region was mesotropherwhile the rest belong to light-eutropher.
After �ve years, the concentration of CODMn, BOD5, TN and NH3-N in Zhushan Lake decreased obviously,and its water quality improvement was the most signi�cant among all sub-lakes. But it is undeniable thatit was still the worst area in Taihu. Another area, Wuli Bay, which was usually be neglected, should bepaid attention to for its water quality had deteriorated comparing with other sub-lakes.
3.3.2 Drivers Of Water Quality Long Term Trends In Taihu(1) Decline of pollutant concentration in rivers in�ow leads the decrease of concentration of TN, CODMn,BOD5 and NH3-N
In recent years, the concentrations of CODMn, BOD5, NH3-N and TN in Taihu reduced in varying degrees(Fig. 5; Fig. 6), which mainly pro�ted from the water quality improvement of rivers in�ow. A series ofcountermeasures aimed at decreasing wastewater e�uent discharge and water quality improvement hasbeen implemented, including but not limited to the upgrading and reconstruction of sewage treatmentplants in the basin, the shutdown of heavy polluting and substandard enterprises, the construction ofhigh standard farmland, the installation of sewage pipeline network and reduction in the usage ofchemical fertilizer (Qin et al. 2019). All these measures made the water quality of the rivers around thelake better and further improved the water environment of Taihu.
Taihu remained light-eutropher stably for recent years. The main reason for TLI changed slightly in thelong term was that the value of TN, CODMn and SD alleviated while the TP and Chl-a concentrationincreased. As a result, the value of TLI remained steadily under the synchronous interaction forimprovement and deterioration.
(2) Accumulation of P loading in sediment and the release of endogenous pollution make TPconcentration increase
The TP and Chl-a concentration rebounded since 2014-2015, which was a remarkable phenomenon thathad been identi�ed in several latest studies (Wang et al. 2019; Zhang et al. 2021; Zhu et al. 2018; Zhu etal. 2021). Under the condition that the mean TP concentration of the in�ow entering the northwestern,

Page 11/25
western and southern Taihu decreased from 0.14mg/l in 2015 to 0.12mg/l in 2019 year by year (Fig. 4),while the TP concentration in Taihu raised from 0.061mg/l in 2015 to 0.081mg/l in 2019 (Fig. 5), whichwas not di�cult to draw forth a point of view: the increase of TP concentration in Taihu was mainly dueto endogenous pollution. Similar conclusions have been found in other lakes. Lau (Lau and Lane2002)found that Lake Barton Broad (Norfolk, UK), with a very high reduction (i.e. 90%) of external Ploading, still maintained a high in-lake TP concentration throughout the 11-year period. Theseobservations supported the notion that it was di�cult to restore a eutrophic lake solely by nutrientreduction.
The sources of phosphorus nutrients in Taihu consisted of exogenous and endogenous sources. Thelargest component of the former was the runoff input carrying amounts of pollution load into the lake.The latter mainly came from the release of sediment, decomposition of dead organisms and enclosureaquaculture (Wang et al. 2019). Compared to N, P is more likely to combine with metal ions to formsediments deposited at the bottom of the lake, and the proportion of TP �owing out of the lake is small,so the P concentration of sediment is always at a high level in the annual accumulation despite thedecline of external P loading. The content of nutrients in sediments of Zhushan Bay, Western Region,Meiliang Bay and Gonghu Bay was relatively high (Mao et al. 2020).
(3)Sharp reduction of submerged vegetation area in 2015 reduced the absorption of nutrients
Aquatic plants, a main factor affecting the nutrients release of the sediment, serve to change the qualityof lake water, retard stormy waves, immobilize bottom mud, increase water transparency, and suppressthe growth and reproduction of algae (Wang et al. 2019). However, the distribution area of aquatic plantsof Taihu reduced sharply in 2015, being the smallest in the past decade (Taihu Basin Authority OfMinistry Of Water Resources 2019). The submerged vegetation area in 2013 was 682 km2, while the areain 2016 was only 184 km2 (Table 2). Although the distribution area gradually increased after 2016, thescope has not recovered to half of the largest distribution area in 2013. Wang (Wang et al. 2019) alsofound this great change by remote-sensing image interpretation, announcing that the high-intensity, large-scale, and mechanized salvage of aquatic plants conducted by the local government are the main reasonfor the sharp decrease of submerged macrophyte. The decrease of submerged vegetation not onlyreduced the absorption of P directly but also indirectly inhibit the growth of algae by competing withalgae for nutrients (Wu et al. 2021). The effects of these functions were weakened after the sharpreduction of submerged plant area, which led to the increase of Chl-a and TP concentration in the lake.
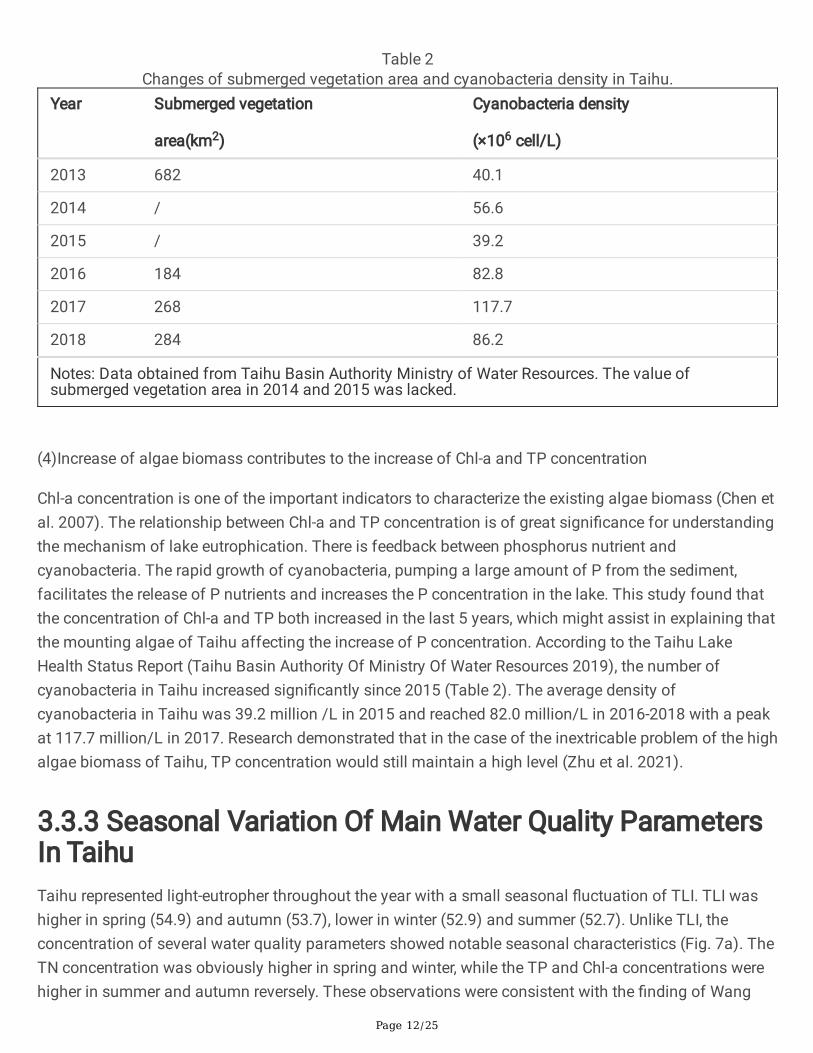
Page 12/25
Table 2Changes of submerged vegetation area and cyanobacteria density in Taihu.
Year Submerged vegetation
area(km2)
Cyanobacteria density
(×106 cell/L)
2013 682 40.1
2014 / 56.6
2015 / 39.2
2016 184 82.8
2017 268 117.7
2018 284 86.2
Notes: Data obtained from Taihu Basin Authority Ministry of Water Resources. The value ofsubmerged vegetation area in 2014 and 2015 was lacked.
(4)Increase of algae biomass contributes to the increase of Chl-a and TP concentration
Chl-a concentration is one of the important indicators to characterize the existing algae biomass (Chen etal. 2007). The relationship between Chl-a and TP concentration is of great signi�cance for understandingthe mechanism of lake eutrophication. There is feedback between phosphorus nutrient andcyanobacteria. The rapid growth of cyanobacteria, pumping a large amount of P from the sediment,facilitates the release of P nutrients and increases the P concentration in the lake. This study found thatthe concentration of Chl-a and TP both increased in the last 5 years, which might assist in explaining thatthe mounting algae of Taihu affecting the increase of P concentration. According to the Taihu LakeHealth Status Report (Taihu Basin Authority Of Ministry Of Water Resources 2019), the number ofcyanobacteria in Taihu increased signi�cantly since 2015 (Table 2). The average density ofcyanobacteria in Taihu was 39.2 million /L in 2015 and reached 82.0 million/L in 2016-2018 with a peakat 117.7 million/L in 2017. Research demonstrated that in the case of the inextricable problem of the highalgae biomass of Taihu, TP concentration would still maintain a high level (Zhu et al. 2021).
3.3.3 Seasonal Variation Of Main Water Quality ParametersIn TaihuTaihu represented light-eutropher throughout the year with a small seasonal �uctuation of TLI. TLI washigher in spring (54.9) and autumn (53.7), lower in winter (52.9) and summer (52.7). Unlike TLI, theconcentration of several water quality parameters showed notable seasonal characteristics (Fig. 7a). TheTN concentration was obviously higher in spring and winter, while the TP and Chl-a concentrations werehigher in summer and autumn reversely. These observations were consistent with the �nding of Wang

Page 13/25
(Wang et al. 2019) and Zha (Zha et al. 2018). The correlation analysis (Fig. 7b) was applied for the sevenwater quality parameters with two hydrological parameters, water temperature (WT) and water level (Z),basing on the monthly monitoring data of each sampling site to explore the factors in�uencing seasonalchange.
(1)TN concentration
There was a signi�cant negative correlation between TN concentration and water temperature, and aslight negative correlation between TN and water level. The external input route of N loading carrying bysurface and underground runoff may explain the cause of the above-mentioned feature—the monthlymean TN concentration of Taihu was consistent with that of the estuary water (Fig. 4). On the one hand,the low precipitation and water level in winter condense the N concentration in the lake; on the other hand,the heavy use of fertilization during the spring cultivation period raises TN concentration. Therefore, forthe seasonal pollution prevention of N of Taihu, attention should be paid to the adjustment of the waterlevel in the dry season and the strict limitation of the input of non-point source N load.
(2)TP and Chl-a concentration
The inter-relationships between Chl-a and TP and water temperature were highly sensitive to seasonalperiodicity (Fig. 7b). May, June and November were the months with large cyanobacteria blooms in Taihuaccording to the multi-year data of The Health Status Report of Taihu Lake, and these periodscorresponded to the high concentration of TP and Chl-a. Chl-a concentration was particularly higher innorthern and northwestern Taihu (Meiliang Bay, Wuli Bay, Zhushan Bay and Gonghu Bay) in summer. Thepotential reasons for such spatial-temporal characteristics might be as follows. For one thing, the watertemperature of Taihu was higher in summer and autumn, which was conducive to the growth of algae.For another, algae tend to accumulate in the northwestern areas and windward shores of Taihu owing tothe southeast monsoon prevailing in summer, which caused the difference of Chl-a concentration inspace. In addition, as a primary producer, the algal biomass and Chl-a concentration in lakes may bemore affected by hydrometeorological conditions such as intense rainfall and strong winds thannutrients (Zhu et al. 2018). Therefore, it is necessary to prevent the great impact of hydrological andmeteorological conditions on cyanobacteria bloom.
Figure 8 showed the linear correlation between the monthly average concentrations of TP and Chl-a infour sub-lakes. The �tting relationship of Wuli Bay was very good, with R² up to 0.921, and other sub-lakes had poorer curve �tting. This observation illustrated that Chl-a and TP both had a much more tightrelationship with each other in relatively closed and small lake bay areas.
(3)SD value
In summer and autumn, the spatial disparity of SD value was unapparent and the SD �uctuating between0.33m-0.44m (Fig. 7). However, in spring and winter, the spatial difference was displayed notably. In theclosed lake bay areas (Wuli Bay, Gonghu Bay, Meiliang Bay, Zhushan Bay), the SD values were apparently

Page 14/25
higher than the yearly mean SD value (0.37m), while the open areas, such as the Eastern Region, CentralRegion and Western Region, were lower than mean value. The seasonal variation in different lake areaswas related to the seasonal change of wind speed and algae growth in different sub-lakes. For sub-lakeswith large area and light eutrophication, the in�uence of wind on transparency was dominant (Zhang etal. 2003), so the seasonal change of SD values in these areas was small. However, for thoseeutrophication hardest-hit lake bays, the rapid proliferation of algae in spring and summer led to thedecrease of transparency. And in winter, the wind speed and algae area in the lake bays were small, so theSD value rebounded.
4 ConclusionIn this study, the spatiotemporal distribution characteristics of the water quality and trophic state in Taihuwere analyzed based on the monitoring datasets represented by nutrient, physical and biologicalparameters and trophic level index (TLI) from 2015 to 2019. The results indicated that Taihu wasgenerally in a state of light-eutropher and the water quality in Taihu these years remained poor, mainlybelonging to GB Level . TN (GB Level ) and TP (GB Level ) were the key parameters determining thequality level.
In terms of spatial heterogeneity, the water quality in northern and northwestern Taihu was worse thanthat in the southeastern area. And Zhushan Bay was the most serious polluted and eutrophication(middle-eutropher) sub-lake as well as the area with the most obvious improvement in water qualityaccording to the statistical analysis and cluster analysis. For the long-term trends, the value of BOD5, TNand SD appeared markedly favorable prognosis while the concentrations of TP and Chl-a showedalarming uptrends. The �ndings in this paper were basically consistent with previously published relevantresearch results. The river in�ow carrying tremendous nutrient-rich wastewater in the northern andnorthwestern Taihu dominantly caused the spatial heterogeneity of water pollution in Taihu Lake.Besides, the topographic (the shape and area of sub-lakes) and meteorological factors (monsoondirection and wind speed) also contributed to the spatial disparity. Bene�ted from the reduction of theexternal input nutrient loading into the lake by comprehensive control measures of Taihu, the N pollutionof Taihu was alleviated. However, the reason for the rebound of the TP and Chl-a concentration might liein the accumulated pollution loading in the sediment, the sharp decline of the aquatic plants in 2015 andthe high algae biomass in the lake. As for seasonal variation, the value of TN, TP, Chl-a and SD indifferent seasons were impacted by the water temperature, water level, wind speed and the shape of bays,as well as the agricultural activities around the lake and algae reproduction habit.
The present situation of water pollution and eutrophication in Taihu is still grim. TN, TP and Chl-a arethree indicators that need considerable attention, especially the close linkage between Chl-a and TPconcentration. To better govern water pollution and eutrophication in Taihu, it is necessary to reduce theexternal nutrients input, endogenous pollution loading and algae biomass. Closed lake bays with seriouspollution need more careful treatment according to local conditions.

Page 15/25
DeclarationsAuthors Contributions The authors state that they participated in the design of the article prepared in thefollowing way: Y,W: Conceptualization, Writing-Original Draft & Review & Editing, project administration.Y.G: Writing - Original Draft & Review & Editing, Visualization, Supervision. Y.Z: Resources, Supervision,Funding acquisition. L,W: Writing- Review & Editing. Y,C: Investigation, Methodology. L,Y: Formal analysis.
Funding This work was supported by the National Nature Science Foundation of China (No. 41807471)and the Open Research Fund Program of MNR Key Laboratory for Geo-Environmental Monitoring of GreatBay Area (SZU51029202010).
Data availability Not applicable
Ethical Approval The authors express their ethical approval of the contents of the submitted work.
Consent to Participate The authors express their consent to have participated in the submitted work.
Consent to Publish The authors state that the data used is in the public domain and may be published.
Competing Interests The authors have no con�icts of interest to declare that are relevant to the contentof this article
References1. Ali R, Kuriqi A, Abubaker S, Kisi O (2019) Long-term trends and seasonality detection of the observed
�ow in Yangtze river using Mann-Kendall and Sen's innovative trend method. Water-Sui 9 (11), 1855
2. Chen YG, Liu WL, Han HJ, Hu WP (2007) Relationships between chlorophyll-a content and tn and tpconcentrations in water bodies of Taihu lake, China. Chin J. Ecol 12 (26), 2062-2068
3. Dai XL, Qian PQ, Ye L, Song T (2016) Changes in nitrogen and phosphorus concentrations in lakeTaihu, 1985-2015. J. Lake Sci 05 (28), 935-943
4. Gao C, Zhu JG, Dou YJ (2002) Contribution of agricultural non-point source pollution to water qualitydeterioration in tai lake watershed: recent trends and research priorities. Resour. Environ. Yangtze.Basin 03, 260-263
5. Hu KM, Pang Y, Xie F, Jiang Y, Yang ST (2010) Effects of Zhihugang and Wujingang closing sluiceson water environment of lake Zhushan, lake Taihu. J. Lake Sci 06 (22), 923-929
�. Kisi O, Ay M (2014) Comparison of Mann–Kendall and innovative trend method for water qualityparameters of the Kizilirmak river, Turkey. Journal of hydrology (Amsterdam) (513), 362-375
7. Lau SSS, Lane SN (2002) Biological and chemical factors in�uencing shallow lake eutrophication: along-term study. Sci Total Environ 3 (288), 167-181
�. Ma T, Zhao N, Ni Y, Yi J, Wilson JP, He L, Du Y, Pei T, Zhou C, Song C, Cheng W (2020) China'simproving inland surface water quality since 2003. Sci Adv 1 (6), eaau3798

Page 16/25
9. Mao XW, Wu HY, Xu F (2020) Analysis of pollution characteristics of main nutrients in Taihu lakesediment. Water Res Prot 4 (36), 100-104
10. Olokotum M, Mitroi V, Troussellier M, Semyalo R, Bernard C, Montuelle B, Okello W, Quiblier C,Humbert J (2020) A review of the socioecological causes and consequences of cyanobacterialblooms in lake Victoria. Harmful Algae (96), 101829
11. Paerl H, Xu H, Mccarthy M, Zhu G, Qin B, Li Y, Gardner W (2011) Controlling harmful cyanobacterialblooms in a hyper-eutrophic lake (lake Taihu, China): the need for a dual nutrient (n & p)management strategy. Water Res 5 (45), 1973-1983
12. Qin B, Zhu G, Gao G, Zhang Y, Li W, Paerl HW, Carmichael WW (2010) A drinking water crisis in lakeTaihu, China: linkage to climatic variability and lake management. Environ Manage 1 (45), 105-12
13. Qin B, Gao G, Zhu G, Zhang Y, Song Y, Tang X, Xu H, Deng J (2013) Lake eutrophication and itsecosystem response. Chinese Science Bulletin 9 (58), 961-970
14. Qin B, Paerl HW, Brookes JD, Liu J, Jeppesen E, Zhu G, Zhang Y, Xu H, Shi K, Deng J (2019) Why lakeTaihu continues to be plagued with cyanobacterial blooms through 10 years (2007-2017) efforts. SciBull (Beijing) 6 (64), 354-356
15. Qin BQ (2007) Mechanism of occurrence of lake eutrophication in midstream and downstream ofYangtze river and countermeasures for controlling it. Bull. Chin Acad. Sci 6 (22), 503-505
1�. Qin BQ (2020) Shallow lake limnology and control of eutrophication in lake Taihu. J. Lake Sci 5 (32),1229-1243
17. Schindler DW (2006) Recent advances in the understanding and management of eutrophication.Limnol Oceanogr 1part2 (51), 356-363
1�. Steffen M, Belisle B, Watson S, Boyer G, Wilhelm S (2014) Status, causes and controls ofcyanobacterial blooms in lake erie. J Great Lakes Res 2 (40), 215-225
19. Taihu Basin Authority Of Ministry Of Water Resources 2019 The health status report of Taihulake(2018)
20. Wang F, Shao W, Yu H, Kan G, He X, Zhang D, Ren M, Wang G (2020) Re-evaluation of the power ofthe Mann-Kendall test for detecting monotonic trends in hydrometeorological time series. Frontiers inEarth Science (8), 14
21. Wang H, Chen HX, Xu ZA, Lu BY (2019) Variation trend of total phosphorus and its controlling factorsin lake Taihu, 2010-2017. J. Lake Sci 4 (31), 919-929
22. Wang J, Fu Z, Qiao H, Liu F (2019) Assessment of eutrophication and water quality in the estuarinearea of lake Wuli, lake Taihu, China. Sci Total Environ Pt 1 (650), 1392-1402
23. Wang M, Zhang JY, Chen QW, Shi WQ, Sun QG (2019) Variations in nitrogen and phosphorousconcentrations and major phytoplankton species in the northwestern lake Taihu between 2003-2012.Acta Ecol Sinica 1 (39), 164-172
24. Wang MC, Liu XQ, Zhang JH (2002) Evaluate method and classi�cation standard on lakeeutrophication. Environ Monit.China 5 (18), 47-49

Page 17/25
25. Wang S, Gao Y, Li Q, Gao J, Zhai S, Zhou Y, Cheng Y (2019) Long-term and inter-monthly dynamics ofaquatic vegetation and its relation with environmental factors in Taihu lake, China. Sci Total EnvironPt 1 (651), 367-380
2�. Wu DH, Jia GH, Wu HY (2021) Chlorophyll-a concentration variation characteristics of the algae-dominant and macrophyte-dominant areas in lake Taihu and its driving factors, 2007-2019. J. LakeSci, 1-13
27. Wu H, Qian H (2017) Innovative trend analysis of annual and seasonal rainfall and extreme values inShaanxi, China, since the 1950s. Int J Climatol 5 (37), 2582-2592
2�. Wu T, Qin B, Brookes JD, Shi K, Zhu G, Zhu M, Yan W, Wang Z (2015) The in�uence of changes inwind patterns on the areal extension of surface cyanobacterial blooms in a large shallow lake inChina. Sci Total Environ (518-519), 24-30
29. Xie AL, Xu F, Xiang L, Xu B, Lin LC, Wang CL (2017) Trend analysis for pollutant load of major riversaround Taihu lake and its impact on water quality in Taihu lake. J. Hohai Uni(Natural Sciences) 05(45), 391-397
30. Xu KQ, Qi LH, Ebie Y, Inamori Y, Sudo R (2010) Measures and policies for lake eutrophication inJapan. China Environ Sci z1 (30), 86-91
31. Yan SW, Yu H, Zhang LL, Xu J, Wang ZP (2011) Water quantity and pollutant �uxes of in�ow andout�ow rivers of lake Taihu 2009. J. Lake Sci 06 (23), 855-862
32. Yang Z, Zhang M, Shi X, Kong F, Ma R, Yu Y (2016) Nutrient reduction magni�es the impact ofextreme weather on cyanobacterial bloom formation in large shallow lake Taihu (China). Water Res(103), 302-310
33. Yue S, Wang C (2004) The Mann-Kendall test modi�ed by effective sample size to detect trend inserially correlated hydrological series. Water Resour Manag 3 (18), 201-218
34. Zha HM, Zhu MY, Zhu GW, Yang ZS, Xu H, Shen RJ, Zhong CN (2018) Seasonal difference in waterquality between lake and in�ow/out�ow rivers of lake Taihu, China. Environ Sci 03 (39), 1102-1112
35. Zhang HJ, Zhuang Y, Sheng Y, Ji K, Ye L, Chen LZ (2021) Research on the cause of total phosphorusincrease in Taihu lake since 2015. Arid Environ Monit 01 (35), 6-9+27
3�. Zhang M, Kong FX (2015) The process, spatial and temporal distributions and mitigation strategiesof the eutrophi-cation of lake Chaohu(1984-2013). J. Lake Sci, 791-798
37. Zhang Q, Kong M, Tang WY (2014) Water quality assessment in the surface waters from Taihu lakeand its main tributaries. Resour.Environ.Yangtze Basin 000 (23), 73-80
3�. Zhang XJ, Chen C, Ding J, Hou A, Li Y, Niu ZB, Su X, Xu Y, Edward AL (2010) The 2007 water crisis inWuxi, China: analysis of the origin. J Hazard Mater 1 (182)
39. Zhang YL, Qin BQ, Chen WM, Hu WP, Yang DT (2003) Distribution, seasonal variation and correlationanalysis of the transparency in Taihu lake. Trans. Oceanol. Limnol 02, 30-36
40. Zhu GW, Qin BQ, Zhang YL, Xu H, Zhu MY, Yang HW, Li KY, Min S, Shen RJ, Zhong CN (2018)Variation and driving factors of nutrients and chlorophyll-a concentrations in northern region of lake
Page 18/25
Taihu, China, 2005-2017. J. Lake Sci 2 (30), 279-295
41. Zhu GW, Qin BQ, Zhang YL, Li Y, Zhu M, Xu H, Zhang YB (2021) Fluctuation and future controlstrategy of phosphorus concentration in lake Taihu in the past 70 years. J. Lake Sci, 1-17
42. Zhu M, Zhu G, Li W, Zhang Y, Zhao L, Gu Z (2013) Estimation of the algal-available phosphorus poolin sediments of a large, shallow eutrophic lake (Taihu, China) using pro�led SMT fractional analysis.Environ Pollut (173), 216-223
43. Zhu W, Xue ZP, Zhang YM, Zhai SH, Feng GY, Wang RC, Chen HM, Hu SY, Zhao S, Zhou Y (2020)Effect of water diversion from the Yangtze river to lake Taihu on total phosphorus rebound after2016. J. Lake Sci 05 (32), 1432-1445
Figures
Figure 1
The locations of the sampling sites and the subregions in the Taihu.

Page 19/25
Figure 2
(a) Annual change of water quality levels proportion and TLI of Taihu in 2015-2019. (b) The total waterquality levels proportion and the mean TLI in sub-lakes during 2015-2019.

Page 20/25
Figure 3
(a-h) Spatial variation trends of different water quality parameters and TLI of Taihu. (i) Cluster analysisresults of seven sub-lakes.

Page 21/25
Figure 4
Observed changes in water quality measures for seasonal time series across four sub lake areas of thenorthwest of Taihu during the period 2015-2019. **: P<0.01; *: P<0.05.

Page 22/25
Figure 5
(a) Annual changes of water quality parameters and TLI of each sub-lakes and the Taihu from 2015 to2019; (b) The rate of change in parameters concentration comparing 2015 with 2019.

Page 23/25
Figure 6
MK test results of long term trend for water quality parameters of Taihu from 2015 to 2019.

Page 24/25
Figure 7
(a) Seasonal change of the concentrations TN, TP, SD and Chl-a. (b) Correlation statistics of quality andhydrological parameters at site-level of Taihu using monthly serial data from 2015 to 2019.

Page 25/25
Figure 8
The correlation between monthly mean Chl-a and TP concentration in four sub-lakes.