urban sprawl: a temporal study of the impact of the it...
TRANSCRIPT

Transactions | Vol. 38, No. 1, 2016 | 25
Urban Sprawl: A Temporal Study of the Impact of the IT Parks in Pune using Remote Sensing
Ujjwala Khare, Prajakta Thakur and Neeraj Bhagat, Pune, Maharashtra
Abstract The expansion of urban areas is common in metropolitan cities of India. Pune also has experienced rapid growth in the fringe areas of the city. This is mainly on account of the development of the Information Technology (IT) Parks. These IT Parks have been established in different parts of Pune city. The major ones include Hinjewadi, Talwade, Kharadi and others like the IT parks in Magarpatta area. This area has been undergoing rapid changes in land use in the last few years. The changes in the land use that have occurred in areas surrounding Hinjewadi, Talwade and Kharadi IT parks during the last two decades have been studied by analysing the LANDSAT TM images of different time periods. The satellite images of the 1992, 2001 and 2011 were analysed to detect the temporal changes in the land use and land cover.
This paper attempts to study the changes in land use / land cover which has taken place in these villages in the last two decades. Such a study can be done effectively with the help of remote sensing and GIS techniques. The tertiary sector has experienced a rapid growth especially during the last decade near the IT Park. The occupation structure of these villages is also studied and related to the changes that are due to the development of the IT Park.
The land use of study area has been analysed using the ground truth applied to the satellite images for these years. Using the digital image processing techniques, the satellite images were classified and land use / land cover maps were derived, some of which include agricultural land, water bodies, barren land, fallow land and settlements. There has been a major change in the area under cultivation due to the establishment of the IT Park. There is also a phenomenal change in the percentage of area under settlements and barren land. These changes will have an impact on the landscape in future.
Keywords: land use / land cover, remote sensing, GIS, digital image processing.
Trans.Inst.Indian GeographersISSN 0970-9851
IntroductionThe IT Park in Pune has other advantages such as the availability of skilled workforce. Pune has a very well developed industrial infrastructure, and the growth of the city into a software centre has led to a major spurt in the development of social infrastructure facilities, which now rank among the best
in India. Pune being the centre of learning, education and research, the easy availability of software engineers is an advantage.
Sprawl generally refers to some type of development with impacts such as loss of agricultural land, open space, and ecologically sensitive habitats. In simpler words, as population increases in an area or a

26 | Transactions | Vol. 38, No. 1, 2016
city expands to accommodate the growth; this expansion is considered as sprawl. Usually sprawls take place on the urban fringe, at the edge of an urban area or along the highways.
Urban sprawl as defined by Ottensmann in 1977 was given as the scattering of new development on isolated tracts separated from other areas by vacant land. It was also described by Gordon and Richardson (1997) as the leapfrog development.
The main causes of urban sprawl in the Indian cities is due to certain factors like high rate of urbanization, low prices of land outside the city limits, unplanned land development, lower taxes, availability of land which is not cultivated etc. It includes the loss of agricultural land and the change in the land use mainly in the fringe areas. The boundary of a city expands to accommodate the urban growth.
Transport is the key factor for urban sprawl and its improvement leads to more along the transport routes. Urban sprawl refers to the outgrowth of the urban areas which are unplanned and uncoordinated Gohad and Diwan (2012).
The IT Park in Pune has other advantages such as the availability of skilled workforce. The MIDC has provided a lot of infrastructural facilities like power, water, electricity, communication facility, hotel, shopping complexes, banks, etc. These IT Parks are located in the fringe area due to advantage of lower rent. Today due to the process of urbanization cities are growing at an alarming rate. Rapid urban development and increasing land use changes due to increasing population and economic growth in selected landscapes is being witnessed of late in India and other developing countries Jensen (1990).
The continuing liberalization and economic reform programmers in India since 1991 have given an impact to the Indian economy particularly in the Information and Communicators sector. Steps taken by the State to promote this sector include the establishment of Information Technology Parks in different parts of the country. It is often argued that the process of economic liberalization and associated structural reform would accelerate rural–urban (RU) migration and boost the pace of urbanization. Linking of India with global economy would lead to massive inflow of foreign capital as also rise in indigenous investment resulting in an increase in employment opportunities within or around the existing urban centres Madhavilata et. al. (2007). The establishment of the Rajiv Gandhi Info-Tech Park at Hinjewadi and IT Parks in Talwade and Kharadi have resulted in the transformations of the area in the vicinity. These IT Parks are located in the fringe area due to certain advantages like of lower rent, educational hub etc.
The special planning authority in development of industrial areas in the state, the Maharashtra Industrial Development Corporation (MIDC) set up the Rajiv Gandhi InfoTech Park on the outskirts of Pune at Hinjewadi spread over 3000 acres of land to be developed at different phases. The IT Park at Talwade was set up over 190 acres of land and the IT Park at Kharadi was set up over 75 acres. MIDC provided well developed ready built up space or land to hundred per cent Export Oriented Units (EOUs). These units were registered for five years and they received tax benefits for software exports during this period. Though power was an issue in the State of Maharashtra, IT

Transactions | Vol. 38, No. 1, 2016 | 27
companies were not affected as the MIDC made special arrangements for them.
The present study aims at studying the changes due to the development process which is associated with the IT Parks. Geoinformatics is today extensively used for managing the rapidly growing information of our cities and villages Kundu (2001). Remote sensing and GIS can play an imperative role in the study of land use changes Laxmi et. al. (2011). These techniques can be used to understand and interpret the changes in land use in a more efficient manner. Geographic Information System (GIS) is a system of hardware, software and procedures designed to support the capture, management, manipulation, analysis, modelling and display of spatially referenced data for solving complex planning and management problems Manonmani (2010).
Aim and objectives The aim of the study is to assess the temporal changes in land use land cover in the surroundings of the IT Park.
To reach the aim following objectives were used:1. To classify the satellite images
(LANDSAT, TM, ETM+) for LU/LC and study the temporal changes
2. To compare the socio-economic impact of the selected parameters on the villages located in the proximity of the IT Parks
3. To compare the LU/LC and socio economic changes of the villages located around the IT parks.
Study areaThe elevation of study area is about 580 metres above mean sea level. The villages
are located in the north-west outskirts of Pune within the commuting distance from the heart of the Pune City. Hinjewadi IT Park is close to Pune-Mumbai Express Highway and Talwade IT Park is close to Pune-Nasik Highway, and the Mumbai international airport is about 3 – 3.5 hours’ drive. Kharadi IT Park is situated on east side of Pune city along the right bank of River Mula-Mutha. Kharadi IT Park is close to Pune – Ahmednagar Highway (SH51), the airport is approximately 7.5 km from the Kharadi. The study area spread over four tehsils namely Haveli, Khed, Maval and Mulashi (Paud).
Pune (18º 32’ N 73º51’ E / 18º 53’ N, 73º 85’ E), the cultural capital of Maharashtra is a rapidly growing urban city. Pune lays on the leeward side of the Sahyadri ranges also known as the Western Ghats. It is located at the confluence of Mula and the Mutha rivers, which are tributaries of the Bhima River. The highest point just outside the urban area is Sinhagarh fort (1300m above msl). The climate of Pune is on the whole dry and invigorating. The cold season from December to February is followed by the hot season lasting up to early June. The period from early June to about the beginning of October is of southwest monsoon. The succeeding period up to November is post-monsoon season. The climate of Pune is pleasant and is an asset to its citizen. Pune experiences four district seasons: summer, monsoon, post-monsoon and winter. Tropical summer months are from March to May; with maximum temperature ranging from 35oC to 38oC).
Data and MethodologyThe change in land use and land cover for the time period 20 years was analysed by using

28 | Transactions | Vol. 38, No. 1, 2016
satellite images at around10 year interval 1992, 2000 and 2011. The images were downloaded from internet. After scanning the topographical map of study area, it was georeferenced using Arc GIS 9.3 software.
The satellite images were used to plan the survey in the study area using FCC (False Colour Composite) format. The villages in the study area were then surveyed and the ground control points for each class were then used for the generation of the training sites and using those classes, the supervised classification was performed and the classified output was derived.
Table 1: satellite details
Path/ row and date Satellite data147/47, 12-02-1992 LANDSAT TM147/47, 02-02-2000 LANDSAT ETM147/47, 08-02-2011 LANDSAT ETM
Source: Compiled by authors
Survey for the location was carried out using GPS (Global Positioning System) instrument. The GPS data was then used to identify the survey locations on the Toposheet and Satellite images. The Hinjewadi, Talwade and Kharadi IT Parks were identified as the centre of the study and proximity circles were drawn using the Arc GIS software to identify the nearest villages on the basis of distance from the IT Park. The proximity circles having the distance of 3, 5, 7 and 9 km were used and the study area was identified for the further analysis.
The villages in the study area were surveyed and primary data was collected for eighteen villages with the help of the questionnaire method (20% sample collected for each village). The data then was compiled, tabulated and analysed for understanding the impact of IT Park and related activities on the socio-economic behaviour of the villagers. Few socio-economic parameters were selected and data was analysed.
Fig.1: Location Map (Source: compiled by authors)
Locations of IT Parks
IT Parks Latitude anLongitude
Hinjewadi 18o35’37”N 73o43’46”E
Talwade 18°41’51”N 73°47’29”E
Kharadi 18°33’17”N, 73°56’52”E

Transactions | Vol. 38, No. 1, 2016 | 29
SPATIAL DATA ASPATIAL DATA
SATELLITE DATA
TOPOGRAPHC MAPS
PRIMARY DATA (FIELD SURVEY)
SECONDARY DATALU/LC
GEOMETRIC AND ATMOSPHERIC CORRECTION
DIGITIZATION - VILLAGE
BOUNDARIES
DATA ATTACHMENT
STUDY AREA DELINEATION
IMAGE CLASSIFICATION (MXL) FOR 1992, 2000 AND
2011
ATTRIBUTE ANALYSIS FINDING IMPACT OF IT PARK
COMPARISON AND STUDY OF CHANGING LANDUSE USING LU/LC CLASSIFIED OUTPUT
SPATIAL DATA
Fig. 2: Flowchart explaining Methodology (Source: compiled by authors)
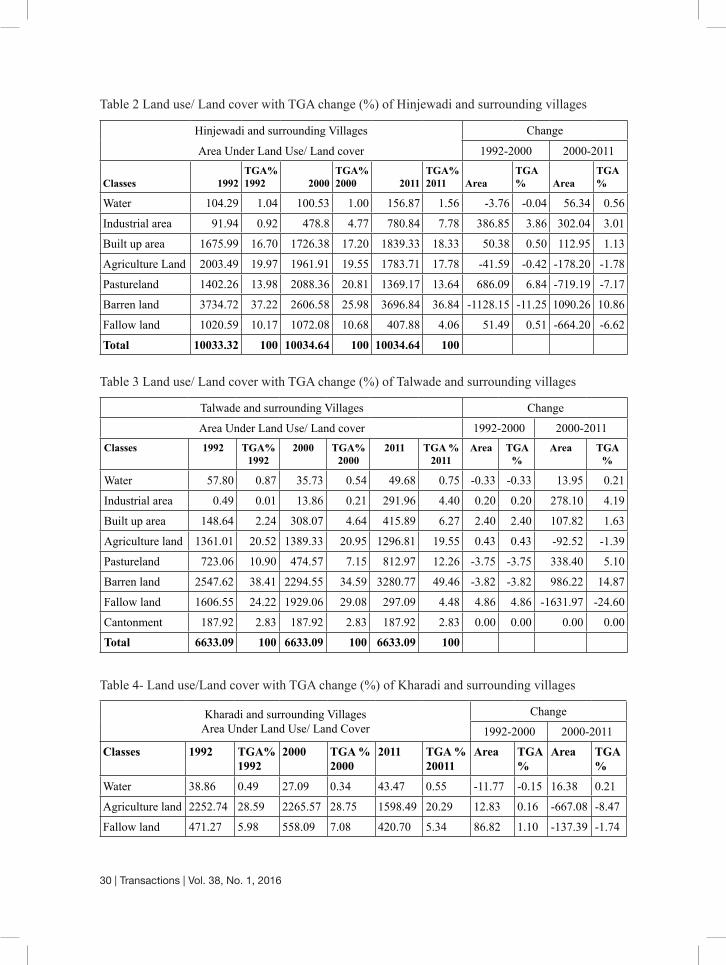
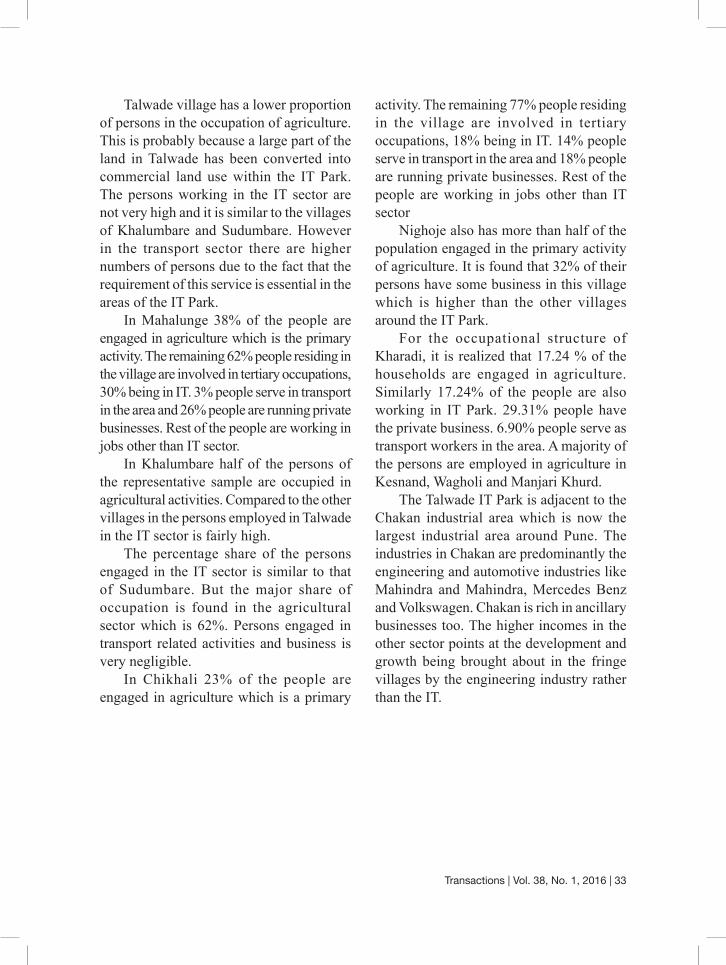
Results and DiscussionsLand- Use/ Land-Cover Classification:It can be observed from figure 3 (See page No.37) that land use in Hinjewadi, Talwade and Kharadi IT Parks and surrounding village has undergone a significant change within a span of two decades. This may be mainly due to the establishment of IT Park in Hinjewadi, Talwade and Kharadi. The changes can be mainly observed through changes in built up area, industrial area and fallow land.
The growth of the IT Park demands an increase in the built up area which is reflected in the category of the built up area. It can be seen that there is a phenomenal increase in the built up area and industrial area the time span of two decades (Table 2, 3, 4). The fallow land has declined in three IT parks area from 10.17% to 4.06% TGA and 24.4% to 4.48% TGA in the last twenty years. Agriculture and fallow together have lost 20 per cent of land in 20 years which is now under built up area and industrial land use.
30 | Transactions | Vol. 38, No. 1, 2016
Table 2 Land use/ Land cover with TGA change (%) of Hinjewadi and surrounding villages
Hinjewadi and surrounding Villages
Area Under Land Use/ Land cover
Change
1992-2000 2000-2011
Classes 1992TGA% 1992 2000
TGA% 2000 2011
TGA% 2011 Area
TGA % Area
TGA %
Water 104.29 1.04 100.53 1.00 156.87 1.56 -3.76 -0.04 56.34 0.56
Industrial area 91.94 0.92 478.8 4.77 780.84 7.78 386.85 3.86 302.04 3.01
Built up area 1675.99 16.70 1726.38 17.20 1839.33 18.33 50.38 0.50 112.95 1.13
Agriculture Land 2003.49 19.97 1961.91 19.55 1783.71 17.78 -41.59 -0.42 -178.20 -1.78
Pastureland 1402.26 13.98 2088.36 20.81 1369.17 13.64 686.09 6.84 -719.19 -7.17
Barren land 3734.72 37.22 2606.58 25.98 3696.84 36.84 -1128.15 -11.25 1090.26 10.86
Fallow land 1020.59 10.17 1072.08 10.68 407.88 4.06 51.49 0.51 -664.20 -6.62
Total 10033.32 100 10034.64 100 10034.64 100
Table 3 Land use/ Land cover with TGA change (%) of Talwade and surrounding villages
Talwade and surrounding Villages Change
Area Under Land Use/ Land cover 1992-2000 2000-2011Classes 1992 TGA%
19922000 TGA%
20002011 TGA %
2011Area TGA
%Area TGA
%
Water 57.80 0.87 35.73 0.54 49.68 0.75 -0.33 -0.33 13.95 0.21
Industrial area 0.49 0.01 13.86 0.21 291.96 4.40 0.20 0.20 278.10 4.19
Built up area 148.64 2.24 308.07 4.64 415.89 6.27 2.40 2.40 107.82 1.63
Agriculture land 1361.01 20.52 1389.33 20.95 1296.81 19.55 0.43 0.43 -92.52 -1.39
Pastureland 723.06 10.90 474.57 7.15 812.97 12.26 -3.75 -3.75 338.40 5.10
Barren land 2547.62 38.41 2294.55 34.59 3280.77 49.46 -3.82 -3.82 986.22 14.87
Fallow land 1606.55 24.22 1929.06 29.08 297.09 4.48 4.86 4.86 -1631.97 -24.60
Cantonment 187.92 2.83 187.92 2.83 187.92 2.83 0.00 0.00 0.00 0.00
Total 6633.09 100 6633.09 100 6633.09 100
Table 4- Land use/Land cover with TGA change (%) of Kharadi and surrounding villages
Kharadi and surrounding VillagesArea Under Land Use/ Land Cover
Change
1992-2000 2000-2011
Classes 1992 TGA% 1992
2000 TGA % 2000
2011 TGA % 20011
Area TGA%
Area TGA%
Water 38.86 0.49 27.09 0.34 43.47 0.55 -11.77 -0.15 16.38 0.21
Agriculture land 2252.74 28.59 2265.57 28.75 1598.49 20.29 12.83 0.16 -667.08 -8.47
Fallow land 471.27 5.98 558.09 7.08 420.70 5.34 86.82 1.10 -137.39 -1.74

Transactions | Vol. 38, No. 1, 2016 | 31
Barren land 2576.05 32.69 2008.21 25.49 2288.70 29.04 -567.84 -7.21 280.49 3.56
Hilly Grassland 2290.79 29.07 2214.09 28.10 2058.93 26.13 -76.70 -0.97 -155.16 -1.97
Built up Area 250.19 3.18 806.85 10.24 1461.15 18.54 556.66 7.06 654.30 8.30
Industrial area 0.00 0.00 0.00 0.00 8.46 0.11 0.00 0.00 8.46 0.11
Total 7879.90 100.00 7879.90 100.00 7879.90 100.00
TGA-Total Geographic Area
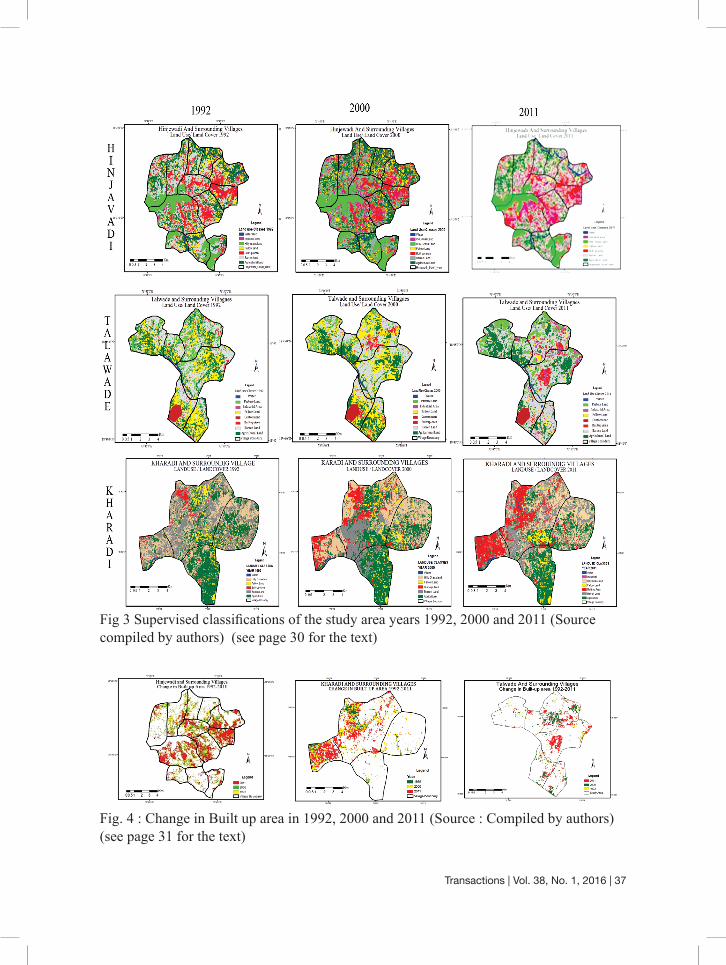
During the time span of twenty years has shown enormous increase in built up land in the study region. (Fig. 4 See page No.37). Among the three IT parks, a clear development is observed in the villages around the Hinjewadi IT Park. The nodal village of Hinjewadi and the already urbanised Wakad and Sus areas show a relatively enhanced development in comparison with the other villages in the fringe of the Hinjewadi. The changes in the built up area around Talwade can
be attributed to the IT parks as well as the Chakan industrial area. For the third IT Park at Kharadi the increase in built up area is due to urbanisation and partly due to the IT parks.
Socio Economic AnalysisUsing the primary surveyed data, the nature of employment has been taken as one of the socio-economic parameters for understanding the impact of IT Park
2.1 Occupation Structure

32 | Transactions | Vol. 38, No. 1, 2016
Fig 5 Occupation Structure (Source : Compiled by authors)
The occupation structure defines the economic activities in the villages, and it has helped to realize the impact of the IT Park and industrial sector on these rural areas.
The sample studies made from the villages of Hinjewadi, Marunji, Mann, Nere and Nande show that agriculture is the main occupation of these villages. The percentage share of the people employed in agriculture ranges from 40 to 60%`
The village of Chande has the highest percentage share of persons employed in agriculture. However, the village of Sus has shown a decline in the persons employed in agriculture which is probably due to the increase in the built up area, new road connections like the Pashan- Sus road, and the impact of IT Park. The impact of the IT Park on the employment of the villages in the vicinity is not very well marked. This is mainly due to the fact that these villages do not have any skilled labour due to the lack of the educational background with technical knowledge. Majority of the workers who are employed in the IT industry are watchmen, drivers, gardeners, sweepers and other such unskilled jobs.
The villages of Mann, Chande, Nande and Nere have a very small percentage of workers in the IT Park. The percentage of workers in business is small. The person investing in small businesses is marginal. The village of Sus has a higher percentage of workers in commercial business. This is due to the additional income which the farmers have gained due to the selling of their lands to MIDC. The business of transport vehicles has grown sizeably in this village over the past few years due to the requirement of the commuting facilities within and around the IT Park. The overall pattern of occupation shows that the impact of the IT Park is not very well established. The study of other socio economic parameters like education, nature of the family structure would help in providing a better understanding about the impact of the IT Park on the occupational structure. The impact of the IT Park on the occupational structure is mainly found in the village of Hinjewadi. The persons in the other sample villages have not gained in employment in the IT sector to a great extent.
Transactions | Vol. 38, No. 1, 2016 | 33
Talwade village has a lower proportion of persons in the occupation of agriculture. This is probably because a large part of the land in Talwade has been converted into commercial land use within the IT Park. The persons working in the IT sector are not very high and it is similar to the villages of Khalumbare and Sudumbare. However in the transport sector there are higher numbers of persons due to the fact that the requirement of this service is essential in the areas of the IT Park.
In Mahalunge 38% of the people are engaged in agriculture which is the primary activity. The remaining 62% people residing in the village are involved in tertiary occupations, 30% being in IT. 3% people serve in transport in the area and 26% people are running private businesses. Rest of the people are working in jobs other than IT sector.
In Khalumbare half of the persons of the representative sample are occupied in agricultural activities. Compared to the other villages in the persons employed in Talwade in the IT sector is fairly high.
The percentage share of the persons engaged in the IT sector is similar to that of Sudumbare. But the major share of occupation is found in the agricultural sector which is 62%. Persons engaged in transport related activities and business is very negligible.
In Chikhali 23% of the people are engaged in agriculture which is a primary
activity. The remaining 77% people residing in the village are involved in tertiary occupations, 18% being in IT. 14% people serve in transport in the area and 18% people are running private businesses. Rest of the people are working in jobs other than IT sector
Nighoje also has more than half of the population engaged in the primary activity of agriculture. It is found that 32% of their persons have some business in this village which is higher than the other villages around the IT Park.
For the occupational structure of Kharadi, it is realized that 17.24 % of the households are engaged in agriculture. Similarly 17.24% of the people are also working in IT Park. 29.31% people have the private business. 6.90% people serve as transport workers in the area. A majority of the persons are employed in agriculture in Kesnand, Wagholi and Manjari Khurd.
The Talwade IT Park is adjacent to the Chakan industrial area which is now the largest industrial area around Pune. The industries in Chakan are predominantly the engineering and automotive industries like Mahindra and Mahindra, Mercedes Benz and Volkswagen. Chakan is rich in ancillary businesses too. The higher incomes in the other sector points at the development and growth being brought about in the fringe villages by the engineering industry rather than the IT.

34 | Transactions | Vol. 38, No. 1, 2016
Fig 6 Range of Income Structure (Source : Compiled by authors)
2.2 Range of Income Structure
These maps represent the range of income structure with respect to the distance from the IT Park. The villages which are adjacent to the villages located near the IT Park have a lower income structure and those further away have a much lower income structure. This is true of the Hinjewadi and Talwade parks but there is not much variation in the Kharadi region which consists of more urbanized areas.
The higher incomes close to some villages like Man have been a result of the sale of agricultural land. However the income patterns of the villages in the outskirts seem to have no major impact or change on the IT Park.
ConclusionsUrban growth remains a major topic concerning GIS and Remote sensing application. RS and GIS have proved to be an effective means for extractive and processing of spatial information for monitory urban growth Masser (2001).
Based on the land use study of the Hinjewadi IT Park, it can be seen that there is a significant increase in the Industrial area across the two decades covered by the study. This study carried over the
two decades signals a strong industrial growth in the IT Park. The built up area has remained consistently stable over the two decades. In spite of the focus on the IT Park, the agricultural activity has reduced only marginally. This indicates that while the IT Park has come up fast the occupation structure in the fringe villages of the IT Park has not undergone a significant change so far as the traditional agricultural community is concerned. The barren land is seen to decrease in the initial developmental decade, but is seen to increase again in the second decade. Fallow land has shown a marginal increase over the first decade, whereas has shown a significant drop in the second decade, indicating increased cultivation.
The land use study of the Talwade IT Park shows that the Industrial area has shown an initial slow increase in the first decade of 1992 – 2000. However there has been a rapid increase in the industrial area in the second decade of 2000-2011. This increase has a known cause other than the advent of the IT Park. It could be attributed to the rapid growth of the Chakan industrial area which has predominantly engineering industry. The IT park of Talwade is surrounded by

Transactions | Vol. 38, No. 1, 2016 | 35
the engineering ancillary industry units and hence the growth could have been triggered more by the engineering industry than the IT Park. Built up area in the fringes of the Talwade IT park has shown a steady growth over the two decades under study. The built up area in this IT park shows up to be more than the industrial area. Barren land is seen to be reduced significantly to by 2011. This may be due to large scale construction on the barren land. Like seen in Hinjewadi area, area has remained constant over the study period. Again, like the Hinjewadi, in fringe villages the fallow land has come down over the decades under study.
The Kharadi IT Park is a built up complex of buildings. The built up area is seen to have increased over the two decades of the study. The villages were located along the Ahmednagar road and were already exposed to urbanization to a large extent. Due to the absence of any other industrial area in the surrounding region, Industrial area is not seen to be classified separately. Area under agriculture is seen to remain constant over the first decade in the study period, whereas has shown a decline in the second decade. This is due to predominantly change in the occupation structure. The change in occupation is not seen to be driven towards the IT sector.
The changes in land use do show an increase in the industrial activity and built up area, but do not show a significant reduction in the agricultural land use. The traditional occupation of farming still exists in the fringes in spite of the high tech IT park infrastructure having come up in close vicinity. The IT park impact has not led a clear urbanization and systematic development of the fringe villages.
The occupational structure of these three areas still shows that agriculture remains to be the mainstay of the villagers around the IT Park at Hinjewadi. Except for Hinjewadi and Sus most of the other villages do not have many workers at the IT parks. This is also true of Talwade where other occupations like transport related jobs are more prominent than IT related jobs in Kharadi person area engaged in IT, but jobs in the IT sector are the unskilled jobs.
Hence the developments which have taken place around the IT parks indicate that the villages have not benefited from them and development has not percolated into these villages. The changes in the built up area are mainly as a result of urbanization processes in and around the IT parks. It does not reflect upon the changes in the socio economic upliftment of the villages surrounding them. Most of these developments are haphazard and unplanned which is characteristic of the urban fringes. There seems a lot to be desired as far as the planning of settlements around the IT parks are concerned in these fringe areas.
ReferencesR. Gohad N. and Diwan G.R. (2012): Problems
and prospects of Pune Metropolitan, 43rd Regional Science Conference Regional, regionalization and planning.
Jensen J R (1990), IntroductoryDigital Image Processing: A Remote Sensing Perspective, Prentice- Hall, New Jersey, 379
K.MadhviLata, Dr.V. Krishna Prasad, Dr. K. V. S. Badarinath, Dr. V. Raghavaswamy. (2007) Measuring urban sprawl: A case study of Hydrabad, National Remote Sensing Agency (NRSA), Department of Space. Government of India, Hyderabad. www.GIS Devlopment.net

36 | Transactions | Vol. 38, No. 1, 2016
Kundu Amitabh (2001) Trends and Patterns of Urbanization and there economic emplication, India Infrastructure Report 2006 OxfordUniversity press pp-28-40.
Lakshmi Kantakumar N, Nikhil G Sawant, Shamita Kumar.(2011) Forecasting urban growth based on GIS, RS and SLEUTH model in Pune Metropolitan area, International Journal of Geoinfomatics and Geosciences, Volume 2, No 2,
Manomani I. K (2010) Assistant Professor Department of geography, Madurai Kamaraj University, Maduri. Spatio – Temporal Analysis of Land Use in Fringe area using GIS – a case Study of Madurai City, Tamil Nadu. International Journal of Geomatics and Geosciences Volume 1, No 2, 2010.
Masser (2001) Managing our urban future the roal of RS and GIS, Habitat international Volume 25, pp 39-50.
Dr. Ujjwala KhareAssociate Professor
Ms. Prajakta Thakur Research Scholar
Neeraj BhagatAssistant Professor
Research Centre and Post Graduate Department of Geography,
Nowrosjee Wadia College, Pune [email protected]
Transactions | Vol. 38, No. 1, 2016 | 37
Fig. 4 : Change in Built up area in 1992, 2000 and 2011 (Source : Compiled by authors) (see page 31 for the text)
Fig 3 Supervised classifications of the study area years 1992, 2000 and 2011 (Source compiled by authors) (see page 30 for the text)

38 | Transactions | Vol. 38, No. 1, 2016
Fig.2 : LULC map for 1990,2005 and 2012 of Nambul catchment (see page 41 for the text)
(see page 53 for the text)
(see page 59 for the text)