urban tree canopy assessment for the city of tukwila, wa ian scott davey resource group november 1,...
TRANSCRIPT

Urban Tree Canopy Assessmentfor
The City of Tukwila, WA
Ian ScottDavey Resource Group
November 1, 2012

Why Tree Canopy?
Measure Quality
• Public Tree Inventory(i-Tree Streets)
• Private Tree Inventory(i-Tree Eco)
Measure Quantity• Tree Canopy Assessment

How Did We Do It?

Quality Control/Quality Assurance
• Kappa Coefficient(Tukwila = 0.9315)
• i-Tree Canopy (~23%)

Results
Canopy25%
Impervious
51%
Pervious
18% Ba
re Soil2%
Open Water5%
City WideThe city limits of Tukwila encompass an area of 9.99 square miles (6,396 acres). • 25% ‒ Canopy, 1,616 acres• 51% ‒ Impervious surfaces, 3,242 acres• 18% ‒ Pervious surfaces, 1,132 acres • 5% ‒ Open water, 299 acres• 2% ‒ Bare soils, 108 acres

Results

Regional Commercial
Manufacturing Industrial Center/Heavy
Light Industrial
Tukwila Urban Center
Heavy Industrial
Neighborhood Commercial Center
Manufacturing Industrial Center/Light
Tukwila Valley South
Commercial Light Industrial
Residential Commercial Center
High Density Residential
Regional Commercial Mixed Use
Mixed Use Office
Low Density Residential
Office
Medium Density Residential
CanopyOpen Water AcresPerviousBare SoilOpen Water
Results
% Land Cover By Zone
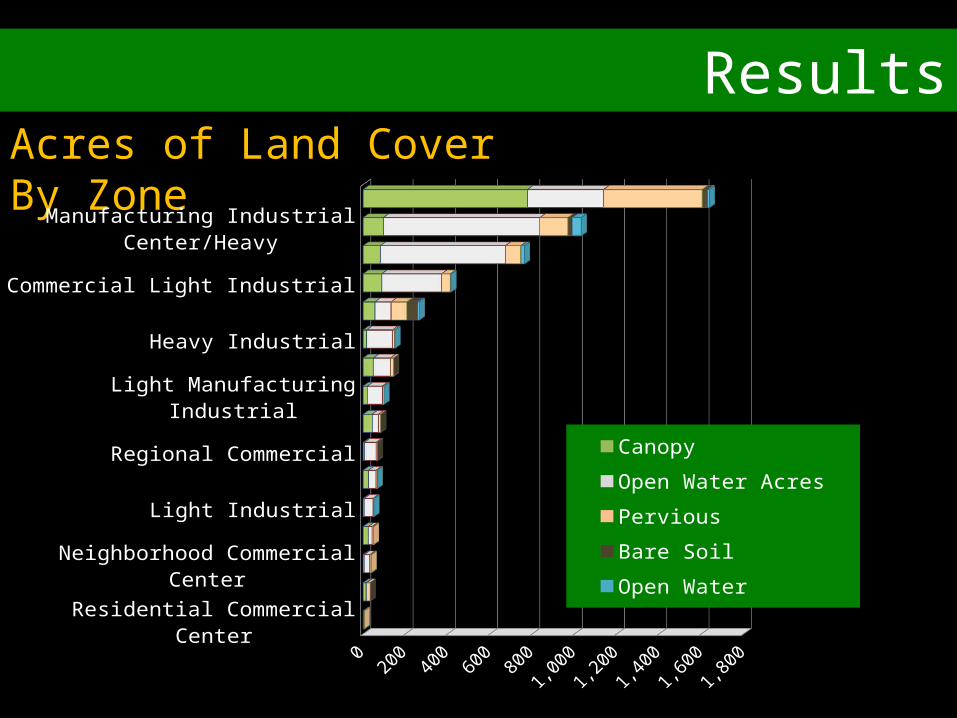
ResultsAcres of Land Cover By Zone
Residential Commercial CenterMixed Use Office
Neighborhood Commercial CenterOffice
Light IndustrialRegional Commercial Mixed Use
Regional CommercialMedium Density Residential
Light Manufacturing IndustrialHigh Density Residential
Heavy IndustrialTukwila Valley South
Commercial Light IndustrialTukwila Urban Center
Manufacturing Industrial Center/HeavyLow Density Residential
Canopy Open Water Acres
Pervious Bare Soil
Open Water

Results
Zone Class Canopy (%)
Impervious (%)
Pervious (%)
Bare Soil (%)
Open Water(%)
Medium Density Residential 51.33 35.10 13.50 0.05 -
Office 49.24 35.90 14.72 - -
Low Density Residential 47.44 21.95 28.51 1.43 0.60
Mixed Use Office 41.02 8.39 48.65 1.93 -
…. …. …. …. …. ….
Commercial Light Industrial 21.15 67.98 9.74 0.60 0.42
Tukwila Valley South 21.14 28.55 28.34 18.55 3.41
Manufacturing Industrial Center/Light 19.84 71.85 7.82 - 0.16
Neighborhood Commercial Center 13.19 69.91 16.77 - -
Heavy Industrial 10.92 80.78 6.44 0.34 1.51
Tukwila Urban Center 10.71 77.42 9.47 0.23 2.18
Light Industrial 9.89 80.71 8.12 0.68 0.60
Manufacturing Industrial Center/Heavy 9.28 71.61 12.87 1.84 4.23
Regional Commercial 8.58 80.52 9.60 1.01 -
Land Cover By Zone

ResultsCanopy in Parks Park Name Park Acres Canopy
AcresCanopy
PercentageSouthgate Park 4.96 4.96 100%Crystal Springs Park 8.48 8.29 98%
Pamela Drive Open Space 0.67 0.65 97%
Tukwila Park 6.39 5.84 91%Southgate Park 5.94 5.35 90%
Ikawa Park (Japanese Garden) 0.20 0.18 90%
Crystal Springs Park 2.55 1.79 70%Hazelnut Park 0.60 0.39 65%
… … … …
… … … …
Tukwila Community Center 12.75 3.24 25%
Riverton Park 4.88 1.21 25%Foster Golf Links 63.34 15.13 24%
Joseph Foster Memorial/Lee Philips Park 9.31 1.98 21%
Tukwila Pool 1.29 0.24 19%Duwamish Park 2.11 0.31 15%
57th Ave South Mini Park 0.38 0.05 13%
North Wind's Weir 2.58 0.07 3%GRAND TOTAL 265.07 100.87 38%

Results

Neighbor Cities
Canopy Context (%)
Bellevu
e
Kirklan
d
Merce
r Islan
d
Shorelin
e
Seatt
le
Tukwila
Renton
Tacoma
Bonney Lak
e
Port Ange
les
Vanco
uver
Portlan
d05
101520253035404550
3641 41
31
23 2529
13
43
27
18
32

Neighbor CitiesSeattle
Land Use
2010 Canopy (%)
Commercial 15.6
High Density Residential 32.5
Industrial 17.1
Low Density Residential 32.6
Resource Conservation 68.2
Public Right-of-Way 14.1
Land Use2011Canopy (%)
Medium Density Residential 51.33 Office 49.24 Low Density Residential 47.44 Mixed Use Office 41.02
Regional Commercial Mixed Use 37.47 High Density Residential 33.3
Residential Commercial Center 29.63 Commercial Light Industrial 21.15 Tukwila Valley South 21.14
Manufacturing Industrial Center/Light 19.84
Neighborhood Commercial Center 13.19
Heavy Industrial 10.92 Tukwila Urban Center 10.71 Light Industrial 9.89
Manufacturing Industrial Center/Heavy 9.28 Regional Commercial 8.58
Parks 38%
Land Use
2007 Canopy (%)
Single Family 25.7Multi-Family 17.1Commercial/Mixed Use 9.7Manufacturing 4.3Downtown 4.7Developed Park 25.5Major Institution 19.4Parks Natural Area 80.4
RentonTukwila

Setting Goals
Potential Canopy
City AcresExisting Acres
Existing %
Possible Acres
Possible%
6396 1615.77 25.26% 1040.91 41.54%

Setting Goals
Potential CanopyZone Class Zone Acres Existing Acres Existing % Possible Acres Possible%
Commercial Light Industrial 416.68 88.14 21.15% 39.77 30.70%
Heavy Industrial 151.13 16.51 10.92% 6.15 14.99%
High Density Residential 145.66 48.50 33.30% 15.94 44.24%
Lignt Industrial 51.59 5.10 9.89% 2.17 14.09%
Low Density Residential 1638.94 777.48 47.44% 384.99 70.93%
Manufacturing Industrial Center/Heavy 1033.73 95.94 9.28% 80.55 17.07%
Manufacturing Industrial Center/Light 99.34 19.71 19.84% 7.04 26.93%
Medium Density Residential 83.95 43.09 51.33% 11.37 64.87%
Mixed Use Office 34.20 14.03 41.02% 17.30 91.61%
Neighborhood Commercial Center 38.29 5.05 13.19% 6.42 29.96%
Office 49.72 24.48 49.24% 7.32 63.96%
Regional Commercial 69.34 5.95 8.58% 7.36 19.20%
Regional Commercial Mixed Use 66.77 25.02 37.47% 6.02 46.49%
Residential Commercial Center 5.67 1.68 29.63% 1.31 52.73%
Tukwila Urban Center 763.51 81.75 10.71% 71.55 20.08%
Tukwila Valley South 265.83 56.20 21.14% 124.65 68.03%

Communicating Value
I Tree VUE – Pollution Benefits by the Numbers
• Stored Carbon ~ 71,000 Tons $1.4M • Sequestered Carbon ~ 2300 Ton/yr $48K • Carbon Monoxide (CO) ~ 4.3 Ton/yr $4K• Nitrogen Dioxide (NO2) ~ 10 Ton/yr $89K• Ozone (O3) ~ 4.3 Ton/yr $240K• Sulfur Dioxide (SO2) ~ 8.5 Ton/yr $18K• Particulate Matter ~ 15.7 Ton/yr $94K
Yearly Benefit $423K

Communicating Value
Google Earth
• Exploring Potential Planting• Change in Time

Communicating Value

Communicating Value


Questions?