urbanization in ecuador: an overview using the fua definition
TRANSCRIPT
Institut de Recerca en Economia Aplicada Regional i Pública Document de Treball 2018/14, 18 pàg.
Research Institute of Applied Economics Working Paper 2018/14, 18 pag.
Grup de Recerca Anàlisi Quantitativa Regional Document de Treball 2018/07, 18 pàg.
Regional Quantitative Analysis Research Group Working Paper 2018/07, 18 pag.
“Urbanization in Ecuador: An overview using the FUA definition”
Obaco M & Díaz-Sánchez J P

WEBSITE: www.ub-irea.com • CONTACT: [email protected]
Universitat de Barcelona Av. Diagonal, 690 • 08034 Barcelona
The Research Institute of Applied Economics (IREA) in Barcelona was founded in 2005,
as a research institute in applied economics. Three consolidated research groups make up
the institute: AQR, RISK and GiM, and a large number of members are involved in the
Institute. IREA focuses on four priority lines of investigation: (i) the quantitative study of
regional and urban economic activity and analysis of regional and local economic policies,
(ii) study of public economic activity in markets, particularly in the fields of empirical
evaluation of privatization, the regulation and competition in the markets of public services
using state of industrial economy, (iii) risk analysis in finance and insurance, and (iv) the
development of micro and macro econometrics applied for the analysis of economic
activity, particularly for quantitative evaluation of public policies.
IREA Working Papers often represent preliminary work and are circulated to encourage
discussion. Citation of such a paper should account for its provisional character. For that
reason, IREA Working Papers may not be reproduced or distributed without the written
consent of the author. A revised version may be available directly from the author.
Any opinions expressed here are those of the author(s) and not those of IREA. Research
published in this series may include views on policy, but the institute itself takes no
institutional policy positions.
WEBSITE: www.ub.edu/aqr/ • CONTACT: [email protected]

Abstract
This paper presents an overview of the urbanization in Ecuador
during the period 1950 – 2010. First, it is shown that Ecuador
does not follow a suitable definition of urban areas, then the idea
of Functional Urban Areas (FUAs) definition is introduced. In this
line, 28 FUAs in Ecuador are analyzed. When Ecuadorian FUAs
population evolution over time is explored, it is possible to
observe that the urbanization of Ecuador had its peak between
1960 and 1980. Moreover, the highest increase of population in
recent decades is mostly driven by the urban growth of small
FUAs. In addition, the analysis suggests that the FUAs in Ecuador
are in line with the size and structure of the FUAs of a similar
developing country, Colombia, and the whole OECD sample of
FUAs. Finally, it is pointed that the population of Ecuador is
concentrated in the FUAs of metropolitan size (1.5 million of
inhabitants or more), which are below the average of the
metropolitan areas of the OECD.
JEL Classification: R12, R23. Keywords: Developing economies, Ecuador, FUAs, OECD, Urbanization.
Moisés Obaco: AQR-IREA, University of Barcelona, Av. Diagonal 690 (08034), Barcelona, Spain. Email: [email protected] Juan Pablo Díaz-Sánchez: Escuela Politécnica Nacional, Facultad de Ciencias, Quito, Ecuador. Email: [email protected]

1. Introduction
Cities are the engines of a country’s economic activity. The global
urbanization trend over the last decade shows, without doubting, that the world is
more urban than rural (Pesaresi et al., 2016). However, how to define “urban”
has been an important concern to the different international organizations and
researchers. In fact, one of the most ambitious goal of the Organization for
Economic Co-operation and Development (OECD) and European Commission is
to identify and standardize the international comparability of urban areas around
the world on the denomination of Functional Urban Areas-FUAs (OECD, 2013;
Brezzi, et al., 2012).
The FUAs has opened the international comparison of the urbanization to
more than 30 OECD and non-OECD countries, and therefore, they allow to
analyze the urban spatial structure and its trend across countries under a
standardized definition of urban areas (Veneri, 2017). The importance of
building the FUAs relies on having a new point of view of the urbanization
which becomes important for developing economies because it is considered
remarkable differences in the urbanization between developed and developing
economies. The urbanization in developing countries is characterized by extreme
poverty and bad quality of their institutions (Glaeser and Henderson, 2017).
Thus, the FUAs have allowed to international organizations and governments to
consider public policies for a better urban planning.
As for the FUAs construction, the FUAs require population and commuting
data. However, the lack of necessary data, especially in the developing countries,
has become a barrier in their identification process. In those cases, several
approaches have been used to identify them where there is not the standard data
available. For example, the OECD applies an alternative method to identify the
FUAs in China (OECD, 2015). Although, the Chinese FUAs identification does
not have the standard methodological approach, they allowed to understand the
urbanization system and economic performance of the Chinese functional urban
areas. The result shows that the Chinese FUAs are growing more concentrated
with 15 urban areas with more than 10 million of inhabitants.
Recently, Obaco et al. (2017) also propose an alternative approach to identify
FUAs. This methodology is applied in Ecuador. However, FUAs that were
identified in Ecuador have not been compared with the international FUAs of
OECD database as it has been done for the majority of cases. The underlying
reason is given by the fact that Ecuador is not member of the OECD. Thus, this
paper contributes to analyze the evolution of urbanization in Ecuador under the
FUAs definition and compare the FUAs in Ecuador with the international context

of the OECD. Additionally, the contribution of this work to the literature of the
FUAs is twofold. First, the comparison of the FUAs of Ecuador in the
international context will show if the Ecuadorian FUAs, based on a different
methodological approach, have a similar urban structure of the FUAs of the
OECD based on its standard approach. Indeed, comparing FUAs allows to go
further when anomalies in the patterns of countries with similar characteristics
are found. Second, this paper will also check the evolution of the Ecuadorian
urbanization applying a different concept of urbanization.
Results suggest that FUAs in Ecuador are in line with the size and structure of
the FUAs of a similar developing country such as Colombia, and the whole
OECD sample of FUAs. We also show that the share of the population
concentrated in the FUAs of metropolitan size (1.5 million or more) in Ecuador
are below the average of urbanization of the OECD sample. When the evolution
over time of the FUAs population is explored, we can observe that the
urbanization of Ecuador has faced the highest increase of population between
1960 and 1980. Moreover, another interesting finding is that the highest increase
in the population in the recent decades is mostly driven by the urban growth of
small FUAs.
The rest of this work is structured as follows. Section two presents the related
literature. Section three shows the introduction to the urbanization in Ecuador,
while section four introduces the FUA identification in Ecuador. Section five
presents the data, while the Ecuadorian urbanization through the FUAs definition
is presented in section six. Section seven shows the Ecuadorian FUAs in the
international context. Finally, section eight presents the conclusions of the paper.
2. Related literature
Several approaches have been used to define urban areas. The delimitation of
an urban area can be driven by a morphology, demography, or socio-economic
point of view (Ferreira et al., 2010). In particular, this work focuses on the
economic definition of cities which implies a functional delimitation of urban
areas from a socio-economic perspective. In that sense, a city is a dense area that
can be considered an independent market in which supply and demand for goods
and production factors are traded and an equilibrium price exists.
Commuting flows between cities is, by far, the most popular means of
functional cities labelled as Local Labor Markets (LLMs), which was developed
in the US at the beginning of the 90s. Commuting flows are also used for the
identification of Metropolitan Areas (Duranton, 2015; Puderer, 2008; Adams et
al., 1999). The use of commuting flows has been widely used in this literature.

That is the case of Fox and Kumar (1965) who propose a method to create local
areas based on commuting data, merging spatial areas hierarchically according to
workers’ daily travels. Similarly, Coombes et al. (1986), among others,
systematize this procedure by developing algorithms that are widely used in
many countries and regions in which the idea is to have a minimum of self-
containment of commuting flow within the LLMs (Casado-Díaz and Coombes,
2011).
However, the international comparability and the collection of statistical data
are general problems as most countries use different conceptions to define their
metropolitan areas. One of the most ambitious efforts of the Organization for
Economic Cooperation and Development (OECD), jointly with the European
Commission, is the identification and standardization of the economic urban
areas labelled as Functional Urban Areas (FUAs). This methodology identifies
1,251 FUAs of different sizes in more than 31 countries, which gave as a further
result of the OECD metropolitan dataset, which considers close to 300 cities with
populations of 500,000 inhabitants or more. Nowadays, many researchers prefer
the use of FUAs to perform economic analyses (OECD, 2013, OECD, 2016;
Schmidheiny and Suedekum, 2015; Veneri, 2016, 2017) instead of simply
geographical delimitations.1 For example, Veneri (2016) finds a better fitting
model for the zip’s law using FUAs rather than the administrative boundaries
given by the countries, and Veneri (2017) analyzes the urban spatial structure of
the FUAs across the world and find that there is an increasing trend in the
decentralization of the urban areas. Moreover, Ahrend et al. (2017) and Matano
et al. (2018) analyze agglomeration effects on labor productivity using FUAs as
units of analysis.
In detail, FUAs involve three identification steps (OECD, 2013). First, it is
explored the population density of the country, looking for grid cells of high
population density (grid cells with a minimum of 1,000 or 1,500 inhabitants –set
by the researcher- per km2). Next, it is identified clusters of grid cells of high
population density. Then, those clusters should contain a minimum of 50,000 or
100,000 inhabitants to be considered as an urban core, depending on the country.
These urban cores allow to identify the municipality of reference (head of the
FUAs). However, a minimum of 50% of the population must be contained in the
urban core. In the second step, those urban centers are connected as part of one
FUAs if two urban cores share at least a minimum of commuting flow (15%).2 In
1 For more information and list of countries, see http://www.oecd.org/cfe/regional-
policy/functionalurbanareasbycountry.htm 2 Polycentric FUAs is where there are two or more urban cores within the FUA. In many
European countries the minimum commuting flows applied might reach up to 50% (OECD,
2012).

a third step, it is identified the hinterland, which includes all the surrounded areas
that are not urban areas, but they are connected to the urban cores through a
minimum of commuting flows as well. The minimum is the same that has been
applied in the second step.
The OECD concept of FUAs has also been extended to those countries that are
not OECD members because generally they do not account for an own economic
definition of urban areas. In this case, the FUAs allow to compare, to evaluate
and to elaborate recommendations of public policies and urbanization around the
world. However, the lack of adequate data to elaborate the FUAs is a main
barrier in these countries. For example, in China (OECD, 2015), the very same
OECD modifies the FUAs methodology to take advantage of the available
information or characteristics of the country. In this case, a different minimum
threshold to identify urban cores is applied (550 inhabitants per km2) as this
country is not densely populated across the territory. To connect urban cores and
determine the hinterland, it is applied a decay function of the expected
commuting zone.
Similarly, Obaco et al. (2017) present a different methodology to identify
FUAs where there is not commuting data. The approach is based on a varying
travel time to connect urban cores and determine the hinterland of each FUA.
The final coverage of the travel time will depend on the geographical extension
of the urban cores because it is shown that larger urban cores have on average
more influence zones. However, this model needs a calibration of the parameters
to apply the varying travel time model. The model is based on the estimated
parameters from Colombia.3 Then, the model is applied in Ecuador. Following
this work, and the simplicity of the model to identify FUAs, the OECD has used
the same travel time approach to identify FUAs in other developing countries
such as Morroco and Viet Nam (OECD, 2018). However, the FUAs identified in
Ecuador have not been explored and have not been compared with the
international OECD database. In this work, we cover this gap.
3. Urban definition in Ecuador
Ecuador is a small developing open economy. It lies on northwest coast of
South America. It limits with Colombia at the north, Peru at the east and south,
and the Pacific Ocean at the west (see panel A of figure 1). Ecuador has an area
of 283,561 km2 and it is formed by four natural regions: The Coast, the
Highlands, the Amazon and the Galapagos Islands. Administrative division of
Ecuador is based on three levels. From higher to lower: provinces (25), cantons
3 For more detail, see Obaco et al., 2017.

(224), and parishes (1,024), (see panel B of figure 1).4 Provinces are the most
aggregated administrative division; meanwhile parishes are the closest to the
conceptualization of municipality. Ecuadorian authorities consider urban areas as
inhabitants living in the head of each canton, otherwise they are rural areas.
Thus, this characterization of urban does not consider peripheral population
beyond the head of the cantons.
In terms of population, Ecuador has about 17 million inhabitants in 2018. In
terms of ethnicity composition, Ecuador has a variety of self-identification ethnic
groups such as mestizo (majoritarian), indigenous, white, black and others. As
for the urbanization, it is considered that Ecuador has faced a rapid urbanization
process since 1960 (Villacis & Carrillo, 2012). The current urbanization rate is
about 65%, being lower than the average of Latin America that is around 70%.
However, Ecuadorian urbanization process is characterized by extreme poverty.
It is considered that around 35% of the urban population in Ecuador lives in
slums in 2014 (UN, 2015).
Considering the Ecuadorian authority definition of urban as a starting point,
most of the population is concentrated in two urban parishes: Guayaquil, which is
in the Coast, and Quito, which is in the Highlands. According to the 2010 census,
these two cities have 27% of the total population, and the 35% of the total urban
population; thus, these two urban areas could be considered as metropolitan
cities, nevertheless only Quito has this category.5
Figure 1. Ecuador
Source: INEC-Ecuador, Administrative boundaries based on the year 2010.
Elaboration: The authors.
4 Numbers of administrative divisions according to the 2010 census of population and dwelling. 5 According to the 2010 census, the four most populated cities are Guayaquil has 2’291,158
inhabitants, Quito has 1’619,146, Cuenca has 331,888 and Santo Domingo has 305,632
inhabitants.

4. FUAs identification in Ecuador
As it was mentioned, the urban identification in Ecuador does not follow
international standards of urban areas. Thus, we cannot determine the total
number of cities existing in Ecuador. We focus only in the FUAs identification to
explore urbanization in Ecuador.
We use the FUAs identification made by Obaco et al. (2017).6 These authors
based on satellite imagery of LandScan data to identify population density and
travel time using the road network system of Google maps and Open Street Maps
to cover the connection between urban cores and the hinterlands. Data used for
the identification is between 2010 and 2014. The novelty of this approach is
given by allowing to vary the travel time according the parameters of expansion
that are calculated on the geographical extension of the urban cores. The
parameters for the travel time model which is based on the commuting flows of
Colombia. Then, it is applied in Ecuador. The preferred identification of FUAs is
based in which allows to verify more urban cores across the country. As Ecuador
is not a densely populated country, authors analyze the 28 FUAs that were
identified under a minimum threshold of 500 inhabitants or more per squared
kilometer and 25,000 inhabitants in order to be considered as an urban core. The
28 FUAs allow to have representative urban cores in the Amazon (not highly
populated region). They are composed by 34 urban cores in Ecuador, allowing
for some polycentricity structure. If the thresholds were increased to the
minimum applied by the OECD (1,000 inhab. and 50,000 inhab. to be an urban
core), 20 urban cores could be identified with a total of 20 FUAs. Thus, we
present the main analysis using the 28 FUAs. Moreover, results do not change
when the 20 FUAs are analyzed as they are mostly small sized. Thus, the model
was validated on sensibility test and robustness checks.
Figure 2 shows the 28 identified FUAs in Ecuador. The Ecuadorian FUAs
system is majorly dominated by small FUAs. The two FUAs of metropolitan size
are Guayaquil and Quito. There are 11 FUAs in the Coastal region, 13 in the
Highlands, and 4 in the Amazon. Thus, we have a sample that covers
urbanization even in the less populated zones of Ecuador. In Galapagos the
population density is too much lower than in the Amazon, thus the Galapagos
Islands are not included in the final list of FUAs. The Ecuadorian FUAs show the
heterogeneous composition in terms of administrative boundaries because they
are very small in the Highland, and large in Coastal and Amazon regions.
6 For further detail, see Obaco et al. (2017).

However, the administrative boundaries are relatively large compared with the
urban core extension in most of the cases. The FUAs cover around the 7% of the
total country extension and the two metropolitan areas around 3% of the total
country’s extension.
Figure 2. FUAs in Ecuador
Source: INEC-Ecuador, and Obaco et al. (2017). Administrative boundaries and population
based on the year 2010 -2014.
Elaboration: The authors.
5. Data
We use information from the Ecuadorian censuses in order to explore the
urbanization process over time. The first census was in 1950. The historical
population comes from the National Institute of Statistical and Census (INEC).7
To compare the FUAs of Ecuador with the international OECD dataset, we
divide the OECD’s FUA in four groups: OECD, Europe, Colombia and Ecuador.
7 The data from Ecuador is available at http://www.ecuadorencifras.gob.ec/banco-de-
informacion/. Moreover, we assume that the geographical extension of the FUAs identified
through the period 2014 – 2010 are the same and fixed over time, because there is not
information of the historical boundaries of the parishes over the time. The OECD database is
available at http://www.oecd.org/cfe/regional-policy/functionalurbanareasbycountry.htm.

6. Urbanization in Ecuador
Figure 3 shows the total FUAs population according to their respective
Ecuadorian censuses. The number of people living in FUAs has rapidly increased
between 1950 and 2010. In 1950, the total FUAs population was around 40% of
the total population, being mostly settled in the rural area. In 1972, the
population living in FUAs reached around the 50% of the total; and, in 1990, the
population living in FUAs reached the 60%. For 2010, the total population living
in FUAs is around 63%. Thus, the highest increase in the urban population is
presented from 1962 to 1982, around 0.77% per year.
Figure 3. Population living in the FUAs
Source: INEC, Ecuador. Elaboration: The authors.
Table 1 shows the average of the FUAs size distribution of the 28 FUAs
according to the information gathered in the censuses. In 1950, the FUAs size
distribution was below 0.5 million, composed by 26 FUAs of below 0.2 million
and 2 FUAs between 0.2 and 0.5 million. In 1990, appears the first FUAs of large
metropolitan size, and one FUA between 0.5 and 1.5 million, 3 FUAs were
between 0.2 and 23 FUAs were below 0.2 million. In 2010, the distribution is
given by 2 FUAs larger than 1.5 million, there are no FUAs between 0.5 and 1.5
million, 10 FUAs were between 0.2 and 0.5 million, and the remaining (16
FUAs) were below 0.2 million.
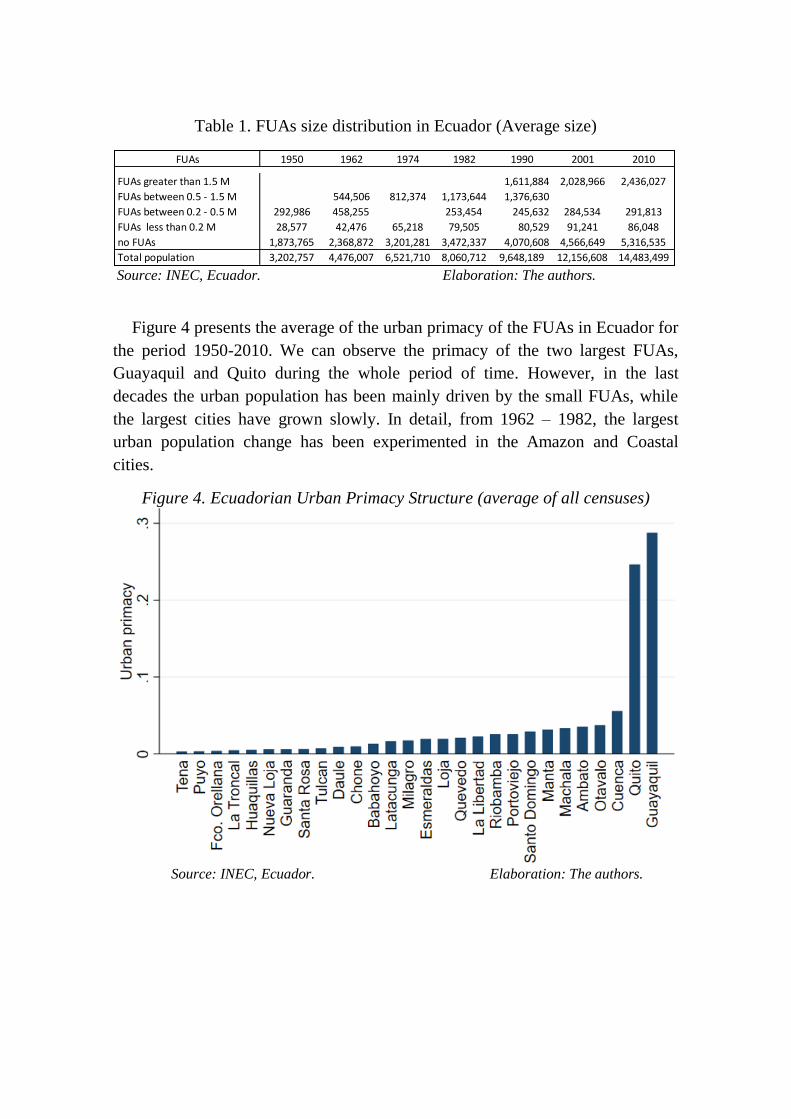
Table 1. FUAs size distribution in Ecuador (Average size)
Source: INEC, Ecuador. Elaboration: The authors.
Figure 4 presents the average of the urban primacy of the FUAs in Ecuador for
the period 1950-2010. We can observe the primacy of the two largest FUAs,
Guayaquil and Quito during the whole period of time. However, in the last
decades the urban population has been mainly driven by the small FUAs, while
the largest cities have grown slowly. In detail, from 1962 – 1982, the largest
urban population change has been experimented in the Amazon and Coastal
cities.
Figure 4. Ecuadorian Urban Primacy Structure (average of all censuses)
Source: INEC, Ecuador. Elaboration: The authors.
FUAs 1950 1962 1974 1982 1990 2001 2010
FUAs greater than 1.5 M 1,611,884 2,028,966 2,436,027
FUAs between 0.5 - 1.5 M 544,506 812,374 1,173,644 1,376,630
FUAs between 0.2 - 0.5 M 292,986 458,255 253,454 245,632 284,534 291,813
FUAs less than 0.2 M 28,577 42,476 65,218 79,505 80,529 91,241 86,048
no FUAs 1,873,765 2,368,872 3,201,281 3,472,337 4,070,608 4,566,649 5,316,535
Total population 3,202,757 4,476,007 6,521,710 8,060,712 9,648,189 12,156,608 14,483,499

7. The international context
Figure 4 shows the composition of the Ecuadorian FUAs system and a
comparison to OECD countries, Europe, and Colombia in the year 2014. The
comparison to Colombia is relatively important because both, Ecuador and
Colombia share borders.8 There were identified 53 FUAs in Colombia. As we
can see, both systems are quite homogeneous. The Ecuadorian urban structure is
still growing, and this growth is based on the small and medium sized FUAs
(lower than half million inhabitants). If we compare the FUAs in Ecuador
identified with the minimum threshold applied by the OECD, the same structure
of these FUAs are based on the small FUA size. Additionally, a weak
composition of metropolitan size (between 0.5 and 1.5 million inhabitants) is
observed.
Clearly, Ecuadorian FUAs structure follows the international pattern. Europe
is the exception since it has a more diverse composition. Furthermore, like
Ecuador, Colombia has larger administrative boundaries compared with the real
extensions of the urban cores.
Figures 5 shows the share of population contained in the FUAs of
metropolitan size with respect to the total population by country. When the FUAs
of metropolitan size (Guayaquil and Quito) of Ecuador are compared with 290
FUAs of the metropolitan size of 32 countries, the Ecuadorian metropolitan areas
are below the global average, and even below their Latin America partners
(Colombia, Chile and Mexico). 9 The same results are obtained when we
compared with the 20 FUAs of different threshold.
8 The Latin America sample of FUAs considers Mexico, Chile and Colombia. We use this year
because the FUAs of Ecuador and Colombia have full information for this year. The OECD
sample does not present information either for the FUAs of Ecuador and Colombia. 9 Information of the FUAs was gathered from https://measuringurban.oecd.org/#story=0, the
Information of Ecuador was taken from Obaco et al. (2017). Information about Turkey and
China are not available yet.

Figure 4. FUAs size classification in the year 2014
Note: Information taken from OECD and INEC, Ecuador. Elaboration: The authors.
Figure 5. Share of metropolitan areas in overall population in the year 2014
Note: Information taken from OECD and INEC, Ecuador. Elaboration: The authors.
8. Conclusions
This work presents the urbanization process of Ecuador using the concept of
Functional Urban Area and also compares with the international context. As for
the urbanization in Ecuador several considerations are obtain. First, we show that
Ecuador does not provide a clear concept of urban areas that draws the attention.
Second, the lack of commuting data is also presented in the country. These two
important facts are relevant for a better planning of urban areas.
Later, we analyze 28 FUAs identified in Ecuador. Most FUAs are small size,
one of medium size and two of large metropolitan sizes in Ecuador. The largest
increasing of the urban population is given during the period of 1962 – 1982.
Additionally, the two largest cities, Guayaquil and Quito, are being prevailing
over time, although the urban growth is mainly driven by the small FUAs in the
last decades. This is important because it could show some trend to the
decentralization of the urban system.
Next, we compare the data of Ecuador with the international database of the
OECD. The FUAs of Ecuador also follow the composition of the urban structure
of Colombia and the whole sample of the OECD that means to be composed
mainly by the small FUAs size. Moreover, the largest two Ecuadorian cities are
below the average of the metropolitan FUAs of the OECD.
Finally, we highlight the importance of standardizing the concept of urban
areas to give a better comparison among countries. In this line, the OECD
presents an important advance in the collection of data that is shown in this work.
References
Adams, J. S., VanDrasek, B. J. & Phillips, E. G. (1999). Metropolitan Area
Definition in the United States. Urban Geography, 20(8), 695–726.
Ahrend, R., Farchy, E., Kaplanis, I. & Lembcke, A., (2017). What Makes Cities
More Productive? Evidence from Five OECD Countries on the Role of
Urban Governance. Journal of Regional Science, 57(3), 385-410.
Brezzi, M., Piacentini, M. & Sanchez-Serra, D. (2012). Measuring Metropolitan
Areas: A Comparative Approach in OECD Countries. In E. Fernández
Bazquez and F. Rubiera Morellón (eds.), Defining the Spatial Scale in
Modern Regional Analysis: New Challenges from Data at Local Level,
Advances in Spatial Science, Springer, 71-89.
Casado-Díaz, J. M., & Coombes, M. (2011). The delineation of 21st century
local labour market areas: a critical review and a research agenda. Boletín
de la Asociación de Geógrafos Españoles, 57, 7-32.
Coombes, M.G., Green, A.E. & Openshaw, S. (1986). An efficient algorithm to
generate official statistical reporting areas: the case of the 1984 Travel-to-
Work Areas revision in Britain. Journal of the Operational Research
Society, 37, 943-953.
Delaunay, D. (1985). Demografía en el Ecuador una bibliografía: Poblaciones de
las parroquias of Ecuador 1950 – 1982. Centro Ecuatoriano de Investigación
Geográfica, Documentos de Investigación (CEDIG), Serie Demografía y
Geografía de la Población, Quito, June N. (1) & (2).
Duque, J. Royuela, V. & Noreña, M. (2012). A Stepwise Procedure to Determine
a Suitable Scale for the Spatial Delimitation of Urban Slums. Springer:
Defining the Spatial Scale in Modern Regional Analysis, 237-254.
Duranton, G. (2015). A proposal to delineate metropolitan areas in Colombia.
Desarrollo y Sociedad, (75), 223–264.

Ferreira, J. A., Condessa, B., Castro e Almeida, J. & Pinto, P. (2010). Urban
settlements delimitation in low-density areas-An application to the
municipality of Tomar (Portugal). Landscape and Urban Planning, 97(3),
156–167.
Fox, K. A. & Kumar, T. K. (1965). The functional economic area: delineation
and implications for economic analysis and policy, Papers and Proceedings
of the Regional Science Association, 15, 57–85.
Glaeser, E. L. & Henderson, J.V. (2017). Urban economics for the developing
World: An introduction. Journal of Urban Economics, 98 (1), 1–5.
Jaitman, L. (2015). Urban infrastructure in Latin America and the Caribbean:
policy priorities. Latin America Economic Review (24:13), Spinger Open, 1
– 57.
Matano, A. Obaco, M. & Royuela, V. (2018). What drives the spatial wage
premium for formal and informal workers? The case of Ecuador. AQR-IREA
working paper (6): 35.
Obaco, M. Royuela, V. & Vítores, X. (2017). Computing Functional Urban
Areas using a hierarchical travel time approach: An applied case in Ecuador.
AQR-IREA working paper (5): 46.
OECD. (2012). Redefining Urban: A New Way to Measure Metropolitan Areas,
OECD Publishing, Paris.
OECD. (2013). Definition of functional urban areas (FUA) for the OECD
metropolitan database. Paris: OECD Publishing.
OECD. (2015). OECD Urban Policy Reviews: China. OECD Publishing, Paris
OECD. (2016). Making Cities Work for All. Data and Actions for Inclusive
Growth. Paris: OECD Publishing.
OECD. (2018). OECD Urban Policy Reviews: VietNam. OECD Publishing,
Paris.
Pesaresi, M. Melchiorri, M. Siragusa, A. & Kemper, T. (2016). Atlas of the
Human Planet 2016: Mapping Human Presence on Earth, with the Global
Human Settlement Layer. European Commission, EUR - Scientific and
Technical Research Reports, ISBN: 978-92-79-62022-5.
Puderer, H. (2008). Defining and Measuring Metropolitan Areas: A Comparison
Between Canada and the United States Geography. Geography Working
Paper Series Defining, 92, 1-12.
Royuela, V. Castells-Quintana, D. & Melguizo, C. (2017). Las ciudades
españolas tras la gran recesión una mirada a la población el empleo y los
precios de la vivienda. Papeles de Economía Española, No 153. ISSN: 0210-
9107.
Sanchez-Serra, D. (2016). Functional Urban Areas in Colombia. Regional
Development Working Papers, 2016/08, OECD Publishing, Paris.
Schmidheiny, K. & Suedekum, J. (2015). The pan-European population
distribution across consistently defined functional urban areas. Economics
Letters, (133), 10 -13.
United Nations. (2004). Urban Indicators Guidelines: Monitoring the Habitat
Agenda and the Millennium Development Goals.

United Nations. (2015). World Urbanization Prospects: The 2014 Revision.
Department of Economic and Social Affairs, Population Division,
(ST/ESA/SER.A/366).
Veneri, P. (2016). City size distribution across the OECD: Does the definition of
cities matter? Computers, Environment and Urban Systems (59), 86 – 94.
Veneri. (2017). Urban spatial structure in OECD cities: Is urban population
decentralising or clustering?. Papers in Regional Science,
doi:10.1111/pirs.12300.
Villacis, B. & Carrillo, D. (2012). Estadística Demográfica en el Ecuador:
Diagnóstico y Propuestas. Instituto Nacional de Estadística y Censos
(INEC). Quito – Ecuador.

Research Institute of Applied Economics Working Paper 2013/14 , pàg. 32
Regional Quantitative Analysis Research Group Working Paper 2013/06, pag. 32