urilgso site officiers - rhode island department of ... · urilgso site officiers heathere. sto e...
TRANSCRIPT
Rl Department of Environmental Management QualityAssurance Project PlanNarragansett Bay Fixed-Site Water Quality Monitoring Network Seasonal Monitoring
NETWORK OFFICERS
URIlGSO SITE OFFICIERS
Heather E. Sto eUniversity of ode Island's Graduate School of Oceanography (URl/GSO)South Ferry Road Narragansett, RI 02882Tel: 401.874-6860 [email protected]
~ ..
Dr. c~ce OviattURI/G Manne Ecosystems Laboratory (MERL)South Ferry Road Narragansett, RI 02882Tel: 401.874-6661 [email protected]
Date
2 FINAL DRAFT


RI Department of Environmental Management Quality Assurance Project PlanNarragansett Bay Fixed-Site Water Quality Monitoring Network Seasonal Monitoring
NBC SITE OFFICER
(}~()~J bateCathy (Walker) Oliver
Narragansett Bay Commission (NBC)2 Ernest StreetTel: 401.461.8848 ext. 267
Providence, RI [email protected]
4 FINAL DRAFT
RI Department of Environmental Management Quality Assurance Project Plan Narragansett Bay Fixed-Site Water Quality Monitoring Network Seasonal Monitoring
2.0 Table of Contents
2.0 Table of Contents ............................................................................................................................ 5
3.0 Distribution List .............................................................................................................................. 9
4.1 Project Organization ...................................................................................................................... 10 4.2 Project Organizational Chart ........................................................................................................... 10 4.3 Communication Pathways ............................................................................................................... 10 4.4 Site Manager Duties ........................................................................................................................ 11 4.5 Training ........................................................................................................................................... 11
5.1 Problem Definition/Background ................................................................................................... 13 5.2 Narragansett Bay Watershed ..................................................................................................... 14 5.3 Water Quality History ............................................................................................................... 15
6.1 Project Description and Schedule .................................................................................................. 18 6.2 Tasks ......................................................................................................................................... 18
Task 1 NBFSMN: QAPP Preparation ............................................................................................... 18 Task 1A NBFSMN: Site Review ...................................................................................................... 18 Task 2 Site Preparation ...................................................................................................................... 18 Task 3 Monitoring ............................................................................................................................. 19 Task 3A Laboratory Analysis ............................................................................................................ 19 Task 4 Year End Review ................................................................................................................... 19 Task 4A Equipment Review ............................................................................................................. 19 Task 4B Final Report ........................................................................................................................ 19
6.3 Project Schedule ........................................................................................................................ 20
7.1 Project Quality Objectives and Measurement Performance Criteria.............................................. 21 7.2 Measurement Performance Criteria ........................................................................................... 21
8.1 Sampling Process Design .............................................................................................................. 23 8.2 Sampling Design Rationale ....................................................................................................... 23
Task 1A Real Time Continuous Monitoring .................................................................................... 23 Task 1B Chlorophyll Monitoring: Measuring Total Chlorophyll ..................................................... 23 Task 2 Narragansett Bay Fixed-Station Water Quality Monitoring Sites ...................................... 23
9.1 Sampling Procedures and Requirements ....................................................................................... 24 9.2 Sampling Procedures ................................................................................................................. 24 9.3 Equipment Cleaning .................................................................................................................. 24 9.4 Field Equipment Calibration and Maintenance ......................................................................... 24
10.1 Data Management, Verification, and Documentation ................................................................... 25 10.2 Data Management ..................................................................................................................... 25
Task 1 Calibration Protocols........................................................................................................ 25 Task 2 Field Protocols ................................................................................................................. 25 Task 2A Chlorophyll collection and Analysis Protocols. ............................................................... 25
10.3 Verification ............................................................................................................................... 25 Task 1 QA/QC Measures ............................................................................................................. 25
10.2 Documentation .......................................................................................................................... 26 Task 1 Metadata Documentation ................................................................................................. 26 Task 2 Raw Files .......................................................................................................................... 27 Task 3 Edited files ....................................................................................................................... 27
5
RI Department of Environmental Management Quality Assurance Project Plan Narragansett Bay Fixed-Site Water Quality Monitoring Network Seasonal Monitoring
Task 4 Corrected files .................................................................................................................. 27
11.0 Field Analytical Method Requirements ......................................................................................... 28
12.0 Fixed Laboratory Analytical Method Requirements ..................................................................... 29
13.0 Quality Control Requirements ....................................................................................................... 30
14.0 Data Acquisition Requirements ..................................................................................................... 31
15.0 Documentation, Records, and Data Management ......................................................................... 31
16.0 Assessments and Response Actions .............................................................................................. 31
17.0 QA Management Report ............................................................................................................... 32
18.0 Verification and Validation Requirements .................................................................................... 32
19.0 Verification and Validation Procedures......................................................................................... 33
20.0 Data Usability/Reconciliation with Project Quality Objectives ..................................................... 33
References ................................................................................................................................................. 34
Appendix A Sampling Station Information .......................................................................................... 35
Appendix B Field Sampling and Lab Calibration Manual .................................................................... 37
Appendix C Data Review and Editing Manuals and Standard Operating Procedures ............................ 37
Attachment A. Field Sampling Standard Operating Procedures ............................................................... 38
6
RI Department of Environmental Management Quality Assurance Project Plan Narragansett Bay Fixed-Site Water Quality Monitoring Network Seasonal Monitoring
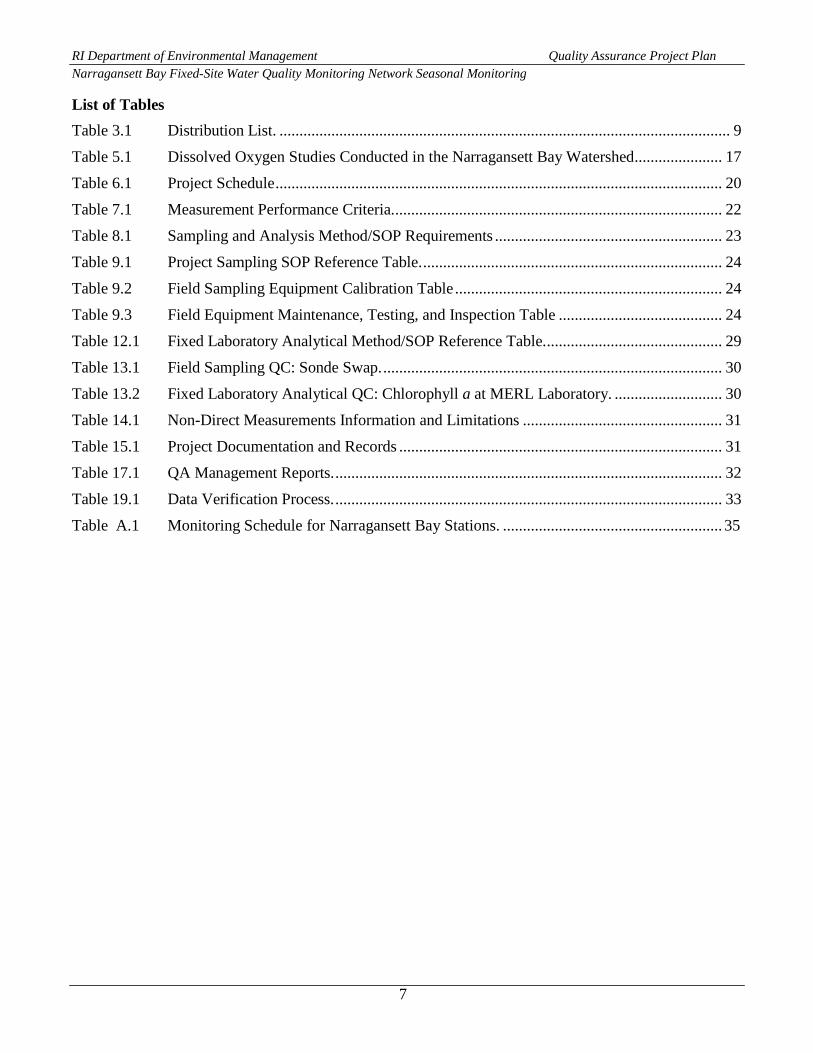
List of Tables Table 3.1 Distribution List. ................................................................................................................. 9
Table 5.1 Dissolved Oxygen Studies Conducted in the Narragansett Bay Watershed ...................... 17
Table 6.1 Project Schedule ................................................................................................................ 20
Table 7.1 Measurement Performance Criteria. .................................................................................. 22
Table 8.1 Sampling and Analysis Method/SOP Requirements ......................................................... 23
Table 9.1 Project Sampling SOP Reference Table. ........................................................................... 24
Table 9.2 Field Sampling Equipment Calibration Table ................................................................... 24
Table 9.3 Field Equipment Maintenance, Testing, and Inspection Table ......................................... 24
Table 12.1 Fixed Laboratory Analytical Method/SOP Reference Table. ............................................ 29
Table 13.1 Field Sampling QC: Sonde Swap. ..................................................................................... 30
Table 13.2 Fixed Laboratory Analytical QC: Chlorophyll a at MERL Laboratory. ........................... 30
Table 14.1 Non-Direct Measurements Information and Limitations .................................................. 31
Table 15.1 Project Documentation and Records ................................................................................. 31
Table 17.1 QA Management Reports. ................................................................................................. 32
Table 19.1 Data Verification Process. ................................................................................................. 33
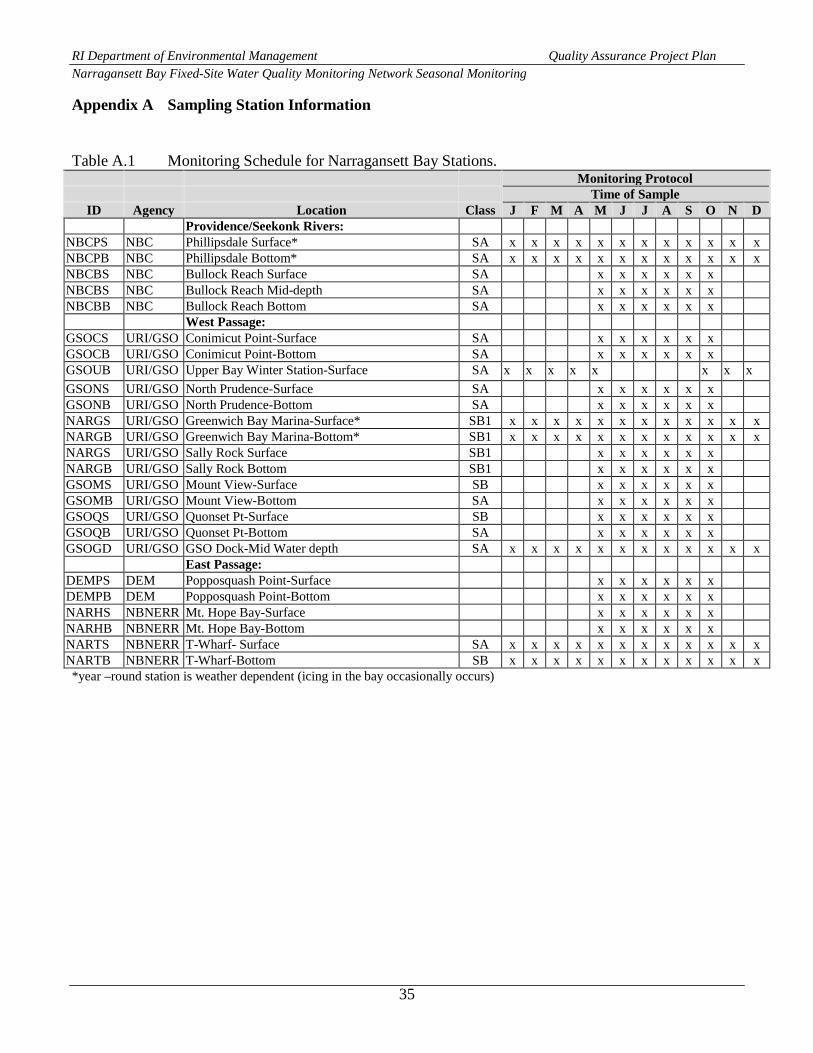
Table A.1 Monitoring Schedule for Narragansett Bay Stations. ....................................................... 35
7

RI Department of Environmental Management Quality Assurance Project Plan Narragansett Bay Fixed-Site Water Quality Monitoring Network Seasonal Monitoring
List of Figures Figure 4.1 Project Organizational Chart ................................................................................................ 10
Figure 5.1 Narragansett Bay Watershed ................................................................................................ 15
Figure A.1 Narragansett Bay Fixed-Site Water Quality Monitoring Sampling Stations ......................... 37
8

RI Department of Environmental Management Quality Assurance Project Plan Narragansett Bay Fixed-Site Water Quality Monitoring Network Seasonal Monitoring
3.0 Distribution List
Table 3.1 Distribution List. QAPP Recipient Organization Telephone Number Address
Sue Kiernan RIDEM-OWR 401.222.4700 ext. 7600 235 Promenade Street Providence, RI 02908 [email protected]
Steve DiMattei Region I New England EPA
617.918.8369 11 Technology Drive North Chelmsford, MA 01863 [email protected]
Bob Stankelis NBNERR 401.683.7365 401.222.4700 ext.4417
55 South Reserve Dr. Prudence Island, RI 02874 [email protected]
Dr. Daisy Durant NBNERR 401.683.6780 55 South Reserve Dr. Prudence Island, RI 02874 [email protected]
Chris Comeau NBC 401.461.8848 2 Ernest Street Providence, RI 02905 [email protected]
Cathy (Walker) Oliver NBC 401.461.8848 ext. 267 2 Ernest Street Providence, RI 02905 [email protected]
Tom Uva NBC 401.461.8848 ext. 471 2 Ernest Street Providence, RI 02905 [email protected]
Heather Stoffel RIDEM/ URI/GSO 401.874-6860 South Ferry Road Narragansett, RI 02882 [email protected] [email protected]
Dr. Candace Oviatt URI/GSO 401.874-6661 South Ferry Road Narragansett, RI 02882 [email protected]
9

RI Department of Environmental Management Quality Assurance Project Plan Narragansett Bay Fixed-Site Water Quality Monitoring Network Seasonal Monitoring
4.1 Project Organization
4.2 Project Organizational Chart
Narragansett Bay Fixed-Site Water Quality Monitoring Network
Approval Authority EPA Region I
Lead Organization Rhode Island Department of Environmental Management (401.222.4700)
Lead Organization Project Manager Sue Kiernan (401.222.4700 ext. 7600)
Lead Organization QA Officer Heather Stoffel (401.222.4700 ext 7520)
@URI/GSO(401.874.6860)
NBC (401.461-8848) Role: Station Operations Contact: Cathy Oliver (ext.267 )
URI/GSO (401.874.6860) Role: Station Operations Contact: Heather Stoffel
MERL Laboratory (401.874.6661) Role: Chlorophyll analysis Contact: Dr. Candace Oviatt
NBNERR (401.683.6780) Role: Station Operations Contact: Dr. Daisy Durant
NBC (401.461-8848) Role: Field Sampling Contact: Jeff Tortorella (ext. 268)
Sara Nadeau (ext. 265)
URI/GSO (401.874.6860) Role: Field Sampling Contact: Edwin Requintina
URI/GSO (401.874.6651) Role: Lab Analysis Contact: Laura Reed
Figure 4.1 Project Organizational Chart.
4.3 Communication Pathways The monitoring efforts of the Narragansett Bay Fixed-Site Water Quality Monitoring Network (NBFSMN) occur at a minimum during summer season, generally from May through October. Some monitoring efforts are conducted year-round when applicable. The teams will be comprised of RIDEM employees, URI/GSO- MERL lab, NBNERR, NBC staff, interns, and volunteers. NBFSMN will collaboratively determine sampling needs and identify the critical stations each year prior to the sampling season.
The QA officer and project manager will contact all potential monitoring agencies prior to the monitoring season for a collaborative meeting/discussion. The premise is to identify monitoring
10
RI Department of Environmental Management Quality Assurance Project Plan Narragansett Bay Fixed-Site Water Quality Monitoring Network Seasonal Monitoring
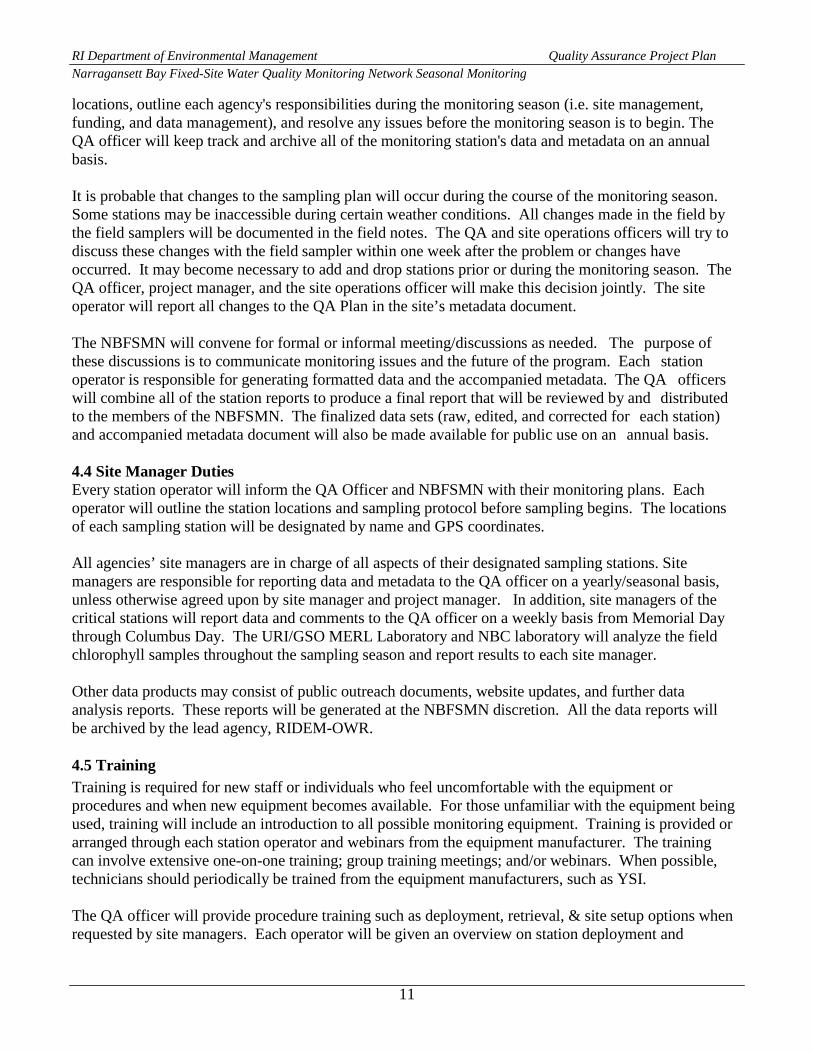
locations, outline each agency's responsibilities during the monitoring season (i.e. site management, funding, and data management), and resolve any issues before the monitoring season is to begin. The QA officer will keep track and archive all of the monitoring station's data and metadata on an annual basis.
It is probable that changes to the sampling plan will occur during the course of the monitoring season. Some stations may be inaccessible during certain weather conditions. All changes made in the field by the field samplers will be documented in the field notes. The QA and site operations officers will try to discuss these changes with the field sampler within one week after the problem or changes have occurred. It may become necessary to add and drop stations prior or during the monitoring season. The QA officer, project manager, and the site operations officer will make this decision jointly. The site operator will report all changes to the QA Plan in the site’s metadata document.
The NBFSMN will convene for formal or informal meeting/discussions as needed. The purpose of these discussions is to communicate monitoring issues and the future of the program. Each station operator is responsible for generating formatted data and the accompanied metadata. The QA officers will combine all of the station reports to produce a final report that will be reviewed by and distributed to the members of the NBFSMN. The finalized data sets (raw, edited, and corrected for each station) and accompanied metadata document will also be made available for public use on an annual basis.
4.4 Site Manager Duties Every station operator will inform the QA Officer and NBFSMN with their monitoring plans. Each operator will outline the station locations and sampling protocol before sampling begins. The locations of each sampling station will be designated by name and GPS coordinates.
All agencies’ site managers are in charge of all aspects of their designated sampling stations. Site managers are responsible for reporting data and metadata to the QA officer on a yearly/seasonal basis, unless otherwise agreed upon by site manager and project manager. In addition, site managers of the critical stations will report data and comments to the QA officer on a weekly basis from Memorial Day through Columbus Day. The URI/GSO MERL Laboratory and NBC laboratory will analyze the field chlorophyll samples throughout the sampling season and report results to each site manager.
Other data products may consist of public outreach documents, website updates, and further data analysis reports. These reports will be generated at the NBFSMN discretion. All the data reports will be archived by the lead agency, RIDEM-OWR.
4.5 Training Training is required for new staff or individuals who feel uncomfortable with the equipment or procedures and when new equipment becomes available. For those unfamiliar with the equipment being used, training will include an introduction to all possible monitoring equipment. Training is provided or arranged through each station operator and webinars from the equipment manufacturer. The training can involve extensive one-on-one training; group training meetings; and/or webinars. When possible, technicians should periodically be trained from the equipment manufacturers, such as YSI.
The QA officer will provide procedure training such as deployment, retrieval, & site setup options when requested by site managers. Each operator will be given an overview on station deployment and
11
RI Department of Environmental Management Quality Assurance Project Plan Narragansett Bay Fixed-Site Water Quality Monitoring Network Seasonal Monitoring
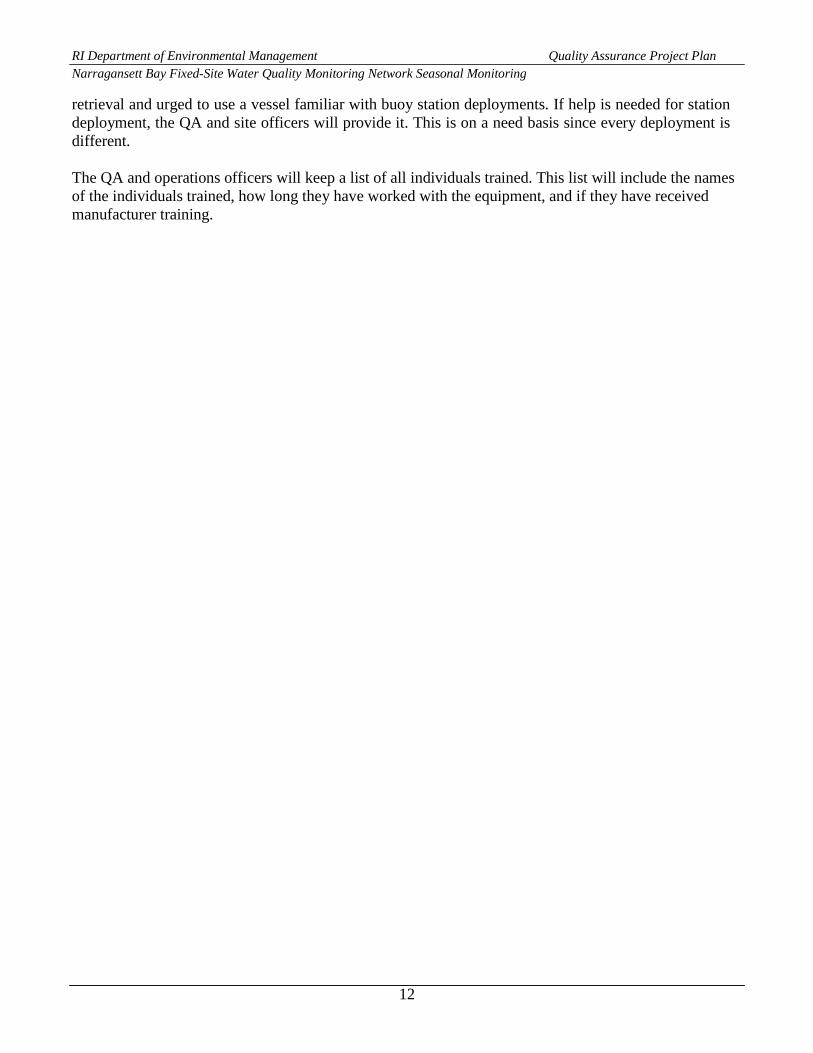
retrieval and urged to use a vessel familiar with buoy station deployments. If help is needed for station deployment, the QA and site officers will provide it. This is on a need basis since every deployment is different.
The QA and operations officers will keep a list of all individuals trained. This list will include the names of the individuals trained, how long they have worked with the equipment, and if they have received manufacturer training.
12
RI Department of Environmental Management Quality Assurance Project Plan Narragansett Bay Fixed-Site Water Quality Monitoring Network Seasonal Monitoring
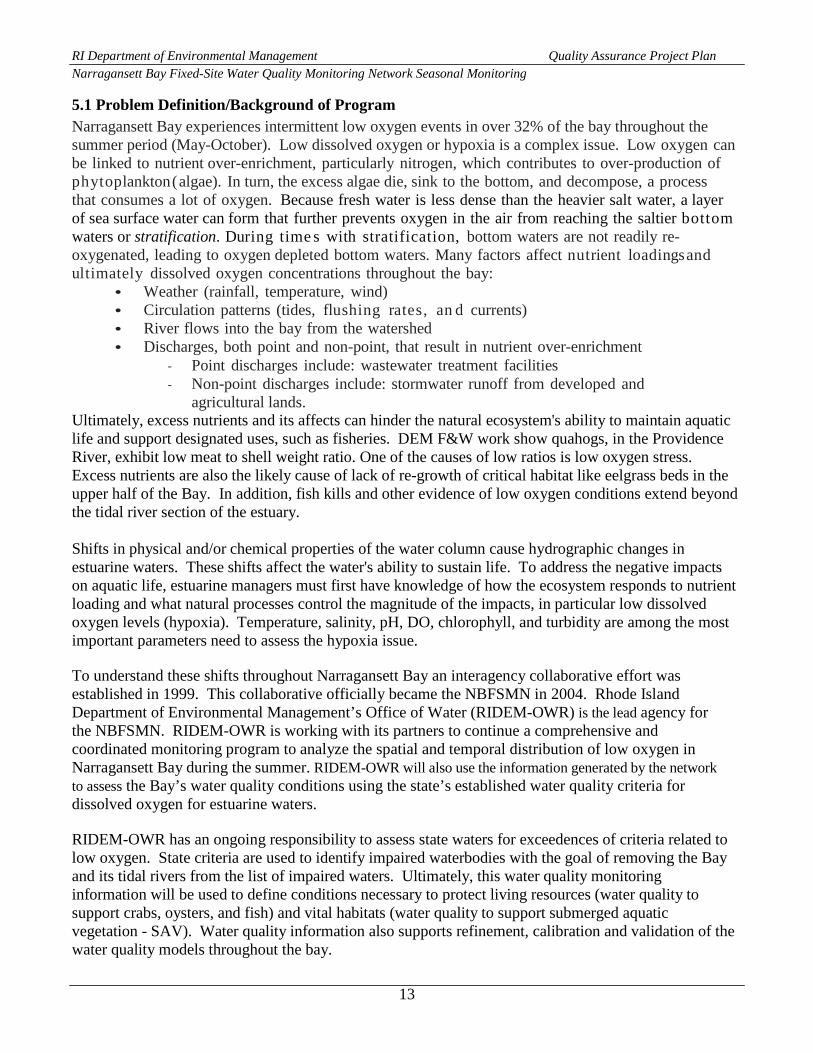
5.1 Problem Definition/Background of Program Narragansett Bay experiences intermittent low oxygen events in over 32% of the bay throughout the summer period (May-October). Low dissolved oxygen or hypoxia is a complex issue. Low oxygen can be linked to nutrient over-enrichment, particularly nitrogen, which contributes to over-production of phytoplankton ( algae). In turn, the excess algae die, sink to the bottom, and decompose, a process that consumes a lot of oxygen. Because fresh water is less dense than the heavier salt water, a layer of sea surface water can form that further prevents oxygen in the air from reaching the saltier bottom waters or stratification. During time s with stratification, bottom waters are not readily re- oxygenated, leading to oxygen depleted bottom waters. Many factors affect nutrient loadings and ultimately dissolved oxygen concentrations throughout the bay:
• Weather (rainfall, temperature, wind)• Circulation patterns (tides, flushing rates, an d currents)• River flows into the bay from the watershed• Discharges, both point and non-point, that result in nutrient over-enrichment
- Point discharges include: wastewater treatment facilities - Non-point discharges include: stormwater runoff from developed and
agricultural lands. Ultimately, excess nutrients and its affects can hinder the natural ecosystem's ability to maintain aquatic life and support designated uses, such as fisheries. DEM F&W work show quahogs, in the Providence River, exhibit low meat to shell weight ratio. One of the causes of low ratios is low oxygen stress. Excess nutrients are also the likely cause of lack of re-growth of critical habitat like eelgrass beds in the upper half of the Bay. In addition, fish kills and other evidence of low oxygen conditions extend beyond the tidal river section of the estuary.
Shifts in physical and/or chemical properties of the water column cause hydrographic changes in estuarine waters. These shifts affect the water's ability to sustain life. To address the negative impacts on aquatic life, estuarine managers must first have knowledge of how the ecosystem responds to nutrient loading and what natural processes control the magnitude of the impacts, in particular low dissolved oxygen levels (hypoxia). Temperature, salinity, pH, DO, chlorophyll, and turbidity are among the most important parameters need to assess the hypoxia issue.
To understand these shifts throughout Narragansett Bay an interagency collaborative effort was established in 1999. This collaborative officially became the NBFSMN in 2004. Rhode Island Department of Environmental Management’s Office of Water (RIDEM-OWR) is the lead agency for the NBFSMN. RIDEM-OWR is working with its partners to continue a comprehensive and coordinated monitoring program to analyze the spatial and temporal distribution of low oxygen in Narragansett Bay during the summer. RIDEM-OWR will also use the information generated by the network to assess the Bay’s water quality conditions using the state’s established water quality criteria for dissolved oxygen for estuarine waters.
RIDEM-OWR has an ongoing responsibility to assess state waters for exceedences of criteria related to low oxygen. State criteria are used to identify impaired waterbodies with the goal of removing the Bay and its tidal rivers from the list of impaired waters. Ultimately, this water quality monitoring information will be used to define conditions necessary to protect living resources (water quality to support crabs, oysters, and fish) and vital habitats (water quality to support submerged aquatic vegetation - SAV). Water quality information also supports refinement, calibration and validation of the water quality models throughout the bay.
13
RI Department of Environmental Management Quality Assurance Project Plan Narragansett Bay Fixed-Site Water Quality Monitoring Network Seasonal Monitoring
The data from the network will also be used to assess trends overtime, identify impaired waters, and assess effectiveness of management decisions (i.e. waste water treatment facilities (WWTF) upgrades, TMDL efforts, and stormwater treatment). This is a long-term monitoring strategy to provide assistance in gathering baseline information, provide support for other programs, and evaluate management decisions.
The network will achieve the goal by documenting the bay's summer season water quality conditions to determine the extent of damaging effects of eutrophication in Narragansett Bay. Continuous long-term monitoring provides information needed to define the temporal variability of water quality. This level of observation will capture events that occur on short time scales (hours to days) or during times when it is impractical to deploy field crews. Continuous monitoring captures the daily variability in water quality to provide scientists with the information necessary to fully assess criteria attainment throughout the bay. Continuous monitoring provides early warning of potential harmful algae blooms and low- dissolved oxygen related fish kills, allowing managers to coordinate appropriate supplemental sampling (e.g., plankton sampling). Having these stations operational for the long term, many years, allows for inter-annual variability to be described, trends, identified, evaluation of implemented management indicatives’, and identify potential effects of climate change.
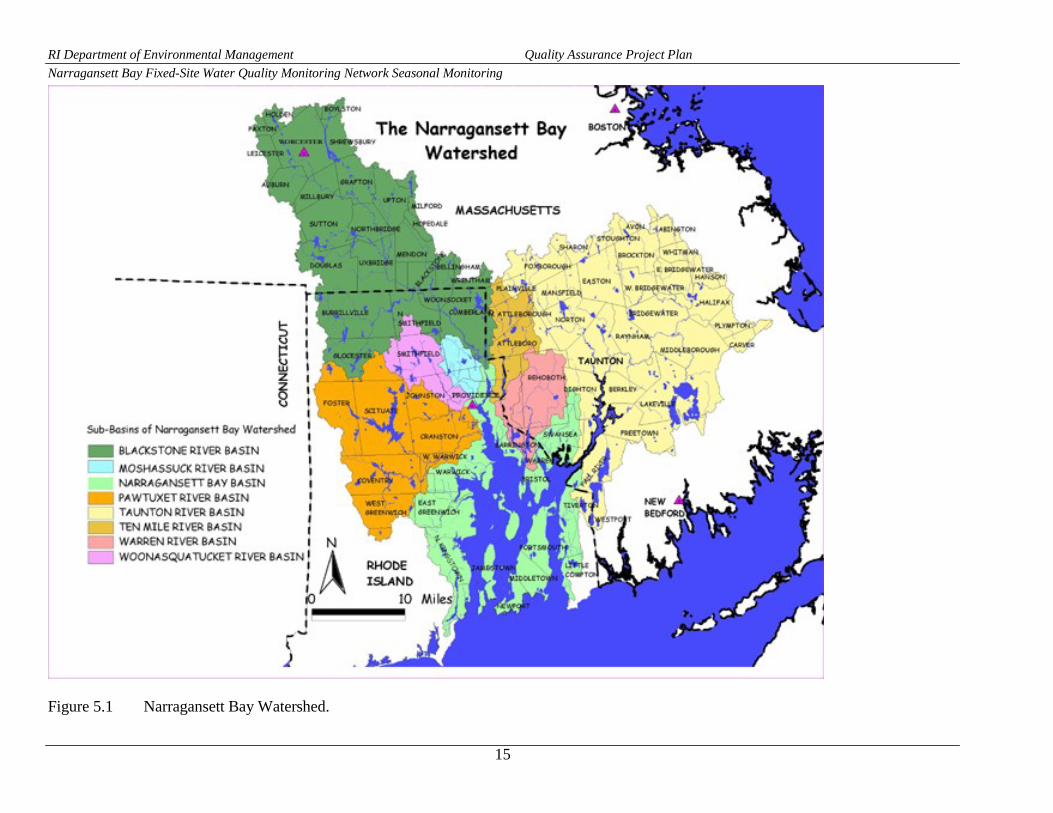
5.2 Narragansett Bay Watershed Narragansett Bay covers approximately 147 square miles with an undulating shoreline that creates a string of sheltered coves where water circulation may be restricted. These characteristics, and other factors such as the location of urban areas on the Bay’s shoreline and within its watershed, make it difficult to characterize the water quality of all the small coves and harbors. In general, there is a clear north to south gradient of pollution in the main channels of the Bay. The highest pollutant levels are documented in the urbanized Providence / Seekonk tidal rivers and the Fall River /Taunton River area, and slightly lower levels in the urbanizing areas such as Greenwich Bay and the upper Bay (between Conimicut Point and Prudence Island). Levels of pollutants in the open bay channels continue to decrease south towards the mouth of the Bay, with lowest levels at the openings to Block Island Sound. Small harbors and coves, such as Wickford Harbor and Newport Harbor can experience significant pollutant impacts due to poor flushing, which exacerbates the level and impact of local pollutant sources.
The Narragansett Bay watershed covers a land area of 1,657 square miles. Forty percent of the Bay’s watershed is in Rhode Island; the remaining 60% is in Massachusetts. Figure 5.1 is a map of the Narragansett Bay watershed.
14
RI Department of Environmental Management Quality Assurance Project Plan Narragansett Bay Fixed-Site Water Quality Monitoring Network Seasonal Monitoring
Figure 5.1 Narragansett Bay Watershed.
15
RI Department of Environmental Management Quality Assurance Project Plan Narragansett Bay Fixed-Site Water Quality Monitoring Network Seasonal Monitoring
5.3 Water Quality History Poor water quality conditions have been known to exist in the Greenwich Bay, Seekonk and Providence Rivers for prior to 1999. From 2001-2013, several studies observed lower than expected oxygen concentrations (< 2 mg/L) in the Upper Bay region. The data revealed that hypoxic events extends into the upper Bay, and the upper West Passage as well as parts of the upper West Passage during summer, at times crossing more than a third of the Bay. Presently, over 32% of Narragansett Bay is impaired for hypoxia based on previous studies based on data analysis from the NBFSMN (Watershed Counts, 2013). The Bay experiences seasonal intermittent hypoxic events with the potential to threaten ecological h e a l t h seasonally (May-October). Low oxygen or hypoxic events can have adverse affects on aquatic life. The persistent lack of oxygen in the bottom waters is one of the leading causes of aquatic life die- off. One low oxygen event can severely negatively impact all stages of marine life (i.e. growth rate reductions and fish kills). These negative effects on finfish and shellfish populations have implications for commercial fisheries. The State of Rhode Island has dissolved oxygen criteria for Narragansett Bay to protect marine life.
These stresses on marine life became even more apparent during the summer of 2003. In August 2003, data confirmed that dissolved oxygen levels had declined causing a hypoxic event the bottom waters throughout the upper bay. In the western section of Upper Narragansett Bay, known as Greenwich Bay, bottom conditions became anoxic. This resulted largest fish kill recorded by officials. Events causing fish kills, like in 2003, are sporadic. Fish kills in Narragansett Bay, including its coves, occurred in 2001, 2003, 2006, and 2008. Although fish kills do not occur every year, low oxygen events occur each year in impaired areas causing adverse effects on the marine ecosystem.
The reports target low dissolved oxygen and nutrient enrichment (eutrophication) among the major causes for impairments and stressors on marine life in the estuary. These areas include the Seekonk and Providence Rivers, which are located in the major urban center of Rhode Island, to the Mt View area in the West Passage and the Poppasquash Point area in the East Passage. The impaired waters of Narragansett Bay also include two embayments, Greenwich Bay and Mt. Hope Bay.
Management and monitoring strategies have now been adopted and implemented to address eutrophication issues throughout Narragansett Bay. The major management strategies are to evaluate the upgrades to the urban waste entering the system from point sources. Recent history shows over 50% of the nutrient loadings entering the bay throughout the watershed come from urban sewage (Vadeboncoeur, A., et.al, 2010). Other strategies include monitoring physical conditions to better understand the spatial extent of hypoxia conditions throughout the bay. Along with monitoring conditions, the data generated by NBFSMN will be used to evaluate management plans for nutrient reductions.
The NBFSMN is in place to document the management initiatives. Many of the WWTFs in the Narragansett Bay watershed have completed most upgrades to work towards meeting the mandated 50% reduction in nitrogen loading. A few WWTFs are still working to complete upgrades to their facilities throughout the Narragansett Bay watershed to further reduce the amount of nutrient loading to the bay. These efforts are designed to minimize the adverse effects of a eutrophic system. Monitoring the changes that occur in the Bay is imperative to assess the management initiatives as the WWTFs and others work to meet reduce requirements for nutrient loadings to the bay throughout the watershed.
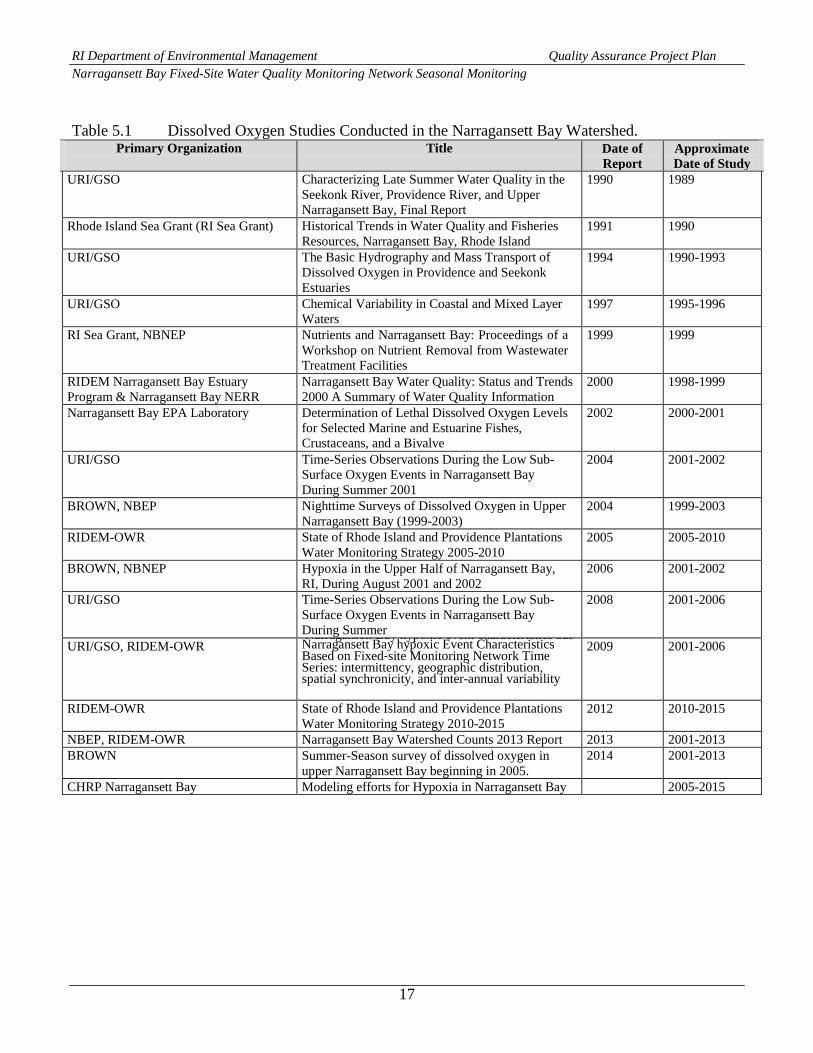
A list of some applicable studies appears in Table 5.1. More details about each study can be found in the Preliminary Data Report.
16
RI Department of Environmental Management Quality Assurance Project Plan Narragansett Bay Fixed-Site Water Quality Monitoring Network Seasonal Monitoring
Table 5.1 Dissolved Oxygen Studies Conducted in the Narragansett Bay Watershed. Primary Organization Title Date of
Report Approximate Date of Study
URI/GSO Characterizing Late Summer Water Quality in the Seekonk River, Providence River, and Upper Narragansett Bay, Final Report
1990 1989
Rhode Island Sea Grant (RI Sea Grant) Historical Trends in Water Quality and Fisheries Resources, Narragansett Bay, Rhode Island
1991 1990
URI/GSO The Basic Hydrography and Mass Transport of Dissolved Oxygen in Providence and Seekonk Estuaries
1994 1990-1993
URI/GSO Chemical Variability in Coastal and Mixed Layer Waters
1997 1995-1996
RI Sea Grant, NBNEP Nutrients and Narragansett Bay: Proceedings of a Workshop on Nutrient Removal from Wastewater Treatment Facilities
1999 1999
RIDEM Narragansett Bay Estuary Program & Narragansett Bay NERR
Narragansett Bay Water Quality: Status and Trends 2000 A Summary of Water Quality Information
2000 1998-1999
Narragansett Bay EPA Laboratory Determination of Lethal Dissolved Oxygen Levels for Selected Marine and Estuarine Fishes, Crustaceans, and a Bivalve
2002 2000-2001
URI/GSO Time-Series Observations During the Low Sub- Surface Oxygen Events in Narragansett Bay During Summer 2001
2004 2001-2002
BROWN, NBEP Nighttime Surveys of Dissolved Oxygen in Upper Narragansett Bay (1999-2003)
2004 1999-2003
RIDEM-OWR State of Rhode Island and Providence Plantations Water Monitoring Strategy 2005-2010
2005 2005-2010
BROWN, NBNEP Hypoxia in the Upper Half of Narragansett Bay, RI, During August 2001 and 2002
2006 2001-2002
URI/GSO Time-Series Observations During the Low Sub- Surface Oxygen Events in Narragansett Bay During Summer
2008 2001-2006
URI/GSO, RIDEM-OWR Narragansett Bay hypoxic event characteristics basNarragansett Bay hypoxic Event Characteristics Based on Fixed‐site Monitoring Network Time Series: intermittency, geographic distribution, spatial synchronicity, and inter-annual variability
2009 2001-2006
RIDEM-OWR State of Rhode Island and Providence Plantations Water Monitoring Strategy 2010-2015
2012 2010-2015
NBEP, RIDEM-OWR Narragansett Bay Watershed Counts 2013 Report 2013 2001-2013 BROWN Summer-Season survey of dissolved oxygen in
upper Narragansett Bay beginning in 2005. 2014 2001-2013
CHRP Narragansett Bay Modeling efforts for Hypoxia in Narragansett Bay 2005-2015
17

RI Department of Environmental Management Quality Assurance Project Plan Narragansett Bay Fixed-Site Water Quality Monitoring Network Seasonal Monitoring
6.1 Project Description and Schedule
6.2 Tasks The following tasks outline the steps needed to accomplish the objectives of the sampling program.
Task 1 NBFSMN: QAPP Preparation/Revision (every fifth year of the program) Table 5.1 lists the various studies that have been completed in the Narragansett Bay watershed over the last five years. Monitoring efforts have been consolidated to be more effective and efficient in acquiring and distributing data.
During a review of the existing data, the network decided that monitoring efforts have to be collected using similar methodology. As part of the QAPP development/revision, the NBFSMN will review sampling methods and develop or revise standard operating procedures for this program.
The QAPP will be used to guide monitoring efforts and outline the chain of command.
Task 1A NBFSMN: Site Review (yearly) The monitoring sites and station locations are determined prior to each sampling season. Each agency will designate stations locations based on their own research needs and other factors. Other factors that influence the selection of sample sites include accessibility to the site, tidal influences at the site, and receiving water classification. Annually, NBFSMN will determine by the consensus and the approved by the project manager, which station data, should be made available for use within NBFSMN.
Task 2 Site Preparation (yearly) Prior to the sampling season (buoy deployment or station installation), all sites will prepare equipment for deployment. Since each site uses different equipment, preparation protocols are at the site manager’s discretion.
Each site will be responsible for the following preparation activities: • Replacing old/damaged equipment or ordering new site setups• Program equipment to meet monitoring SOP (i.e. standard time, 15-min. sampling intervals)• Setup mooring systems• Equipment preparations (calibrations, painting, cleaning, etc)• Function tests prior to deployment• Buoy deployment and/or station installation (this can be coordinated through QA Officer)
Guidance on site preparation will be available through the QA officer and SOPs. Equipment needs should be completed at the end of the previous sampling season, since the purchasing process can be quite extensive. Any concerns or suggestions for improvement should be discussed with the QA officers and the project manager.
Task 3 Monitoring (season & year-round) The sampling period may vary from seasonal to year round depending upon station location and the site operator’s discretion. Routine maintenance will be conducted at each site by lab/field technicians. Sonde maintenance (calibrated and field maintenance) will be conducted on a bi-monthly basis for a minimum sampling period of June to October. A longer deployment period may be used when applicable (i.e. winter months when fouling is minimal). Calibrations procedures are conducted using
18
RI Department of Environmental Management Quality Assurance Project Plan Narragansett Bay Fixed-Site Water Quality Monitoring Network Seasonal Monitoring
the same protocols based on the YSI manual (see appendix B). These procedures were agreed upon by the NBFSMN.
During the sonde swap or field maintenance, all components should be checked and confirmed to be operational. In addition, the tube and sonde supports are cleaned to remove bio-fouling. Debris should be cleared from the inside and outside of the tube as well as from any telemetry cables or the floating mechanism (if applicable). Once everything has been cleaned, the new sonde is deployed (Appendix B).
In the field, during the sonde swap process, a three-way in situ match-up is conducted. The new (freshly calibrated) sonde reading will be checked against the old (retrieved) sonde reading and a third reading using a profiler sonde at the same depth. The last reading of the retrieved sonde is compared to the profile results and the first reading of the newly deployed sonde. This three-way comparison assures that the new and old sondes are both reading each parameter within a certain tolerance. This triple sonde check also allows for notation on whether or not the parameters are normal, fluctuating, or stable.
For more information and guidance with monitoring, see appendix B and C.
Task 3A Laboratory Analysis (yearly) Chlorophyll and other nutrient samples will be collected whenever possible throughout the field season. Sampling is up to the site operator’s judgment. If samples are not taken, it should be noted in the field notes. The chlorophyll field samples can be frozen and processed during the year. The designated labs are to report the results to the respective site managers before or during the year-end review period.
Task 4-Year End Review (yearly) At the end of each field season, the data gathered is processed using QA/QC guidance adapted from the NERRS CDMO manual. Each site is responsible for quality controlling its own data unless otherwise arranged with the project manager. Any problems or concerns about the data processing will be discussed with the QA officer. All data from all stations is gathered by the QA officer for review on an annual basis.
The goal is to have the QA/QC of the data completed during the winter of the following year the data was collected. The data will be available for distribution the following year from when the data was collected. Three forms of the data will be made available (raw data, edited data, and corrected data) and accompanied by a metadata document (document explaining the dataset and changes that have occurred between the three formats).
For more information and guidance with QA/QC procedures see appendix C.
Task 4A Equipment Assessment (yearly) Water quality stations are to be assessed on a minimum of a seasonal basis. Buoy stations require replacement of some mooring equipment (such as shackles and line) yearly. Other equipment repairs and replacement are to be conducted during the year-end review. All equipment must be purchased before or during the site preparation task.
Station upgrades, replacements, and repairs are to be discussed with the project manager during the year-end review. The quality assurance officers will provide guidance on equipment assessments.
19
RI Department of Environmental Management Quality Assurance Project Plan Narragansett Bay Fixed-Site Water Quality Monitoring Network Seasonal Monitoring
Task 4b Final Report (yearly) Each year the site managers will provide the project manager with an annual report of the stations. This report will consist of the formatted raw data, metadata, and edited data (when applicable). The quality assurance officer and the project manger will produce a collective annual report. The collective report will consist of a program metadata file all forms of the data (raw, edited, & corrected) from all sites, and each sites metadata document. In addition, the data will be made available for distribution through RIDEM to the public.
6.3 Project Schedule
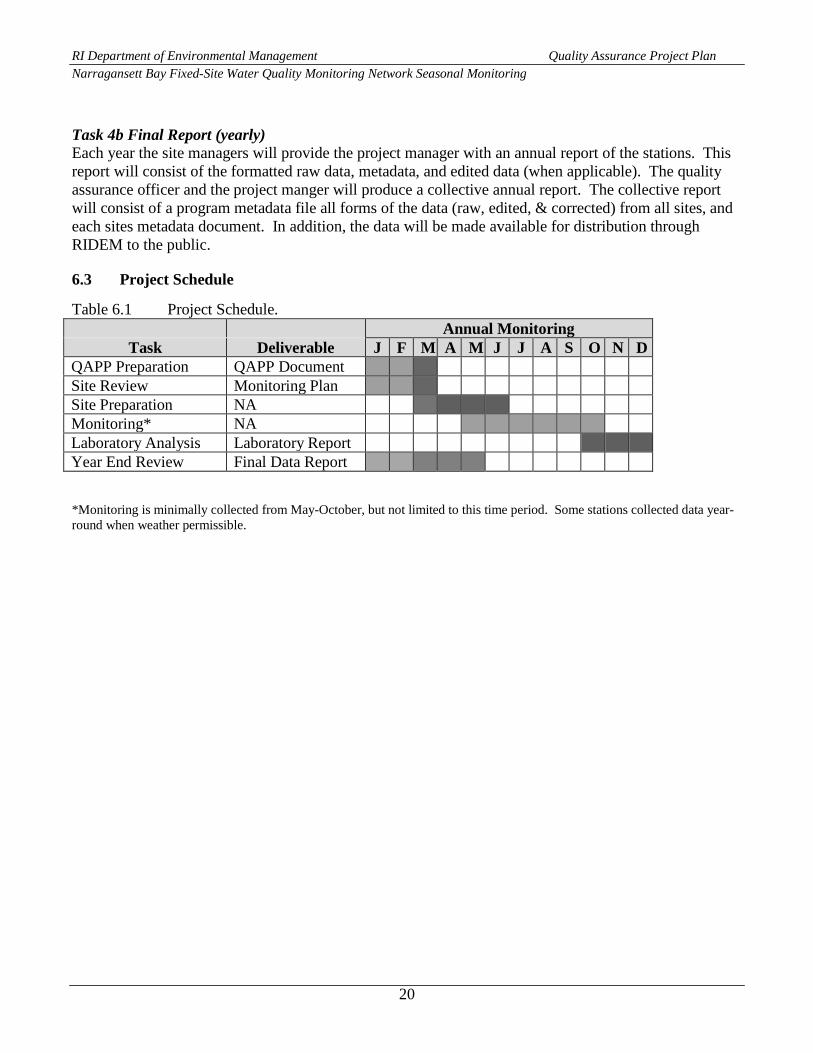
Table 6.1 Project Schedule. Annual Monitoring
Task Deliverable J F M A M J J A S O N D QAPP Preparation QAPP Document Site Review Monitoring Plan Site Preparation NA Monitoring* NA Laboratory Analysis Laboratory Report Year End Review Final Data Report
*Monitoring is minimally collected from May-October, but not limited to this time period. Some stations collected data year-round when weather permissible.
20

21
RI Department of Environmental Management Quality Assurance Project Plan Narragansett Bay Fixed-Site Water Quality Monitoring Network Seasonal Monitoring
7.1 Project Quality Objectives and Measurement Performance Criteria Collecting high quality data is one of the most important goals of the network. Specific data quality objectives include method detection limits, precision, accuracy, representation, comparability, and completeness. All the data quality objectives will be met if all the data is collected and managed in a similar fashion.
7.2 Measurement Performance Criteria Precision
Data is collected every 15minutes using compatible equipment on a bi-monthly servicing schedule. All agencies follow the same procedures for lab calibrations, field sampling, and post deployment checks to ensure precise methodology. This gives the network confidence in the data collected. Accuracy
The QA/QC methods check the accuracy of the data collected. Field samples are taken with independent instruments to provide quality assurance of the data. This is done through grab samples and a three point field check of all sensors ensures the accuracy of the data for each deployment. Representational The selected stations and sampling frequency were chosen for their depiction of conditions in Narragansett Bay watershed during the summer season. The sampling targets the summer because this is the highest potential for water quality standard violations with respect to dissolved oxygen. The continuous monitoring will measure actual environmental conditions throughout the season. In addition, real-time connections to the data will be used to minimize the risk of erroneous data caused by instrumentation failures. Comparability To maximize the quality of the data collected, and to collect data that is comparable with other studies, accepted sampling procedures will be used during this study. All samples collected will be sent to laboratories that use Standard Methods. Other environmental data (i.e., flow rates, rainfall, weather conditions) will be gathered to support assessments of the water quality monitoring data.
The Project Manager and the QA Officer will study the results of these analyses. If discrepancies exist between the samples, the data will be used with qualifications and discussed in the final report.
Sensitivity Analytical methods were selected such that detection limits will not limit the usefulness of the data set.
Completeness The monitoring strategy for this program is to have continuous data throughout the most critical times to assess the hypoxia issue. The dataset is considered complete. Measurement performance criteria help determine the completeness of a data set. Table 7.1 documents the measurement performance criteria for this project.
RI Department of Environmental Management Quality Assurance Project Plan Narragansett Bay Fixed-Site Water Quality Monitoring Network Seasonal Monitoring
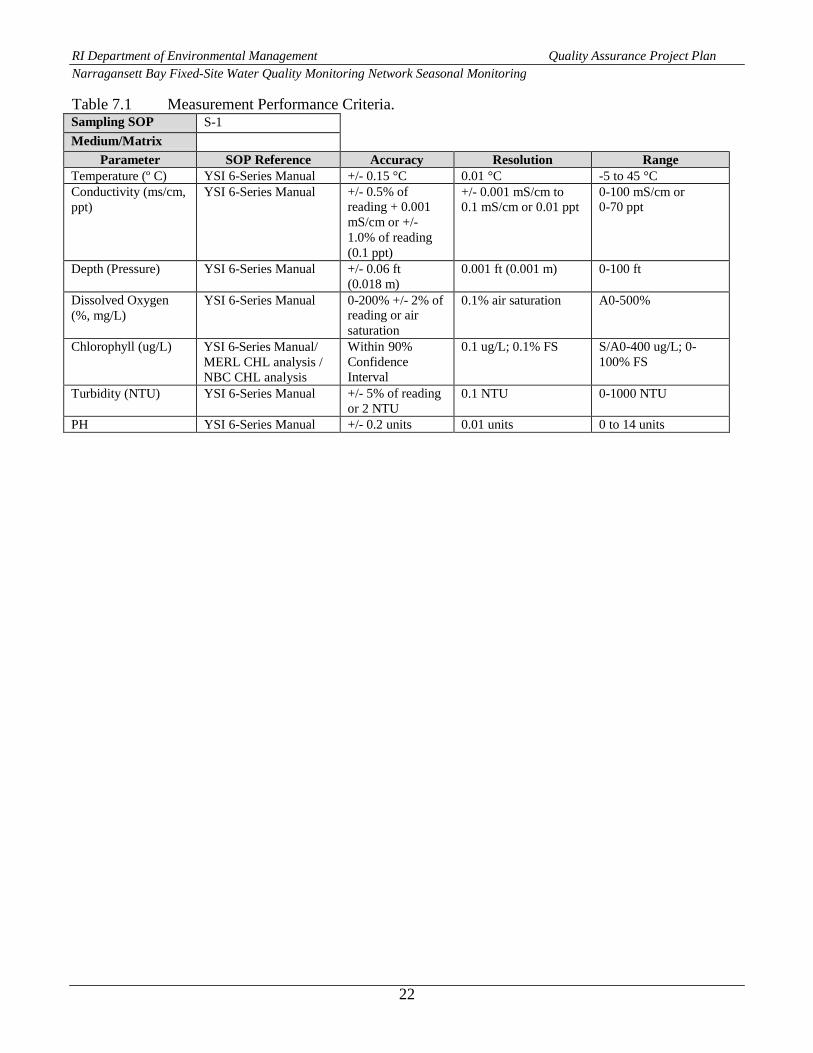
Table 7.1 Measurement Performance Criteria. Sampling SOP S-1 Medium/Matrix
Parameter SOP Reference Accuracy Resolution Range Temperature (º C) YSI 6-Series Manual +/- 0.15 °C 0.01 °C -5 to 45 °C Conductivity (ms/cm, ppt)
YSI 6-Series Manual +/- 0.5% of reading + 0.001 mS/cm or +/- 1.0% of reading (0.1 ppt)
+/- 0.001 mS/cm to 0.1 mS/cm or 0.01 ppt
0-100 mS/cm or 0-70 ppt
Depth (Pressure) YSI 6-Series Manual +/- 0.06 ft (0.018 m)
0.001 ft (0.001 m) 0-100 ft
Dissolved Oxygen (%, mg/L)
YSI 6-Series Manual 0-200% +/- 2% of reading or air saturation
0.1% air saturation A0-500%
Chlorophyll (ug/L) YSI 6-Series Manual/ MERL CHL analysis / NBC CHL analysis
Within 90% Confidence Interval
0.1 ug/L; 0.1% FS S/A0-400 ug/L; 0- 100% FS
Turbidity (NTU) YSI 6-Series Manual +/- 5% of reading or 2 NTU
0.1 NTU 0-1000 NTU
PH YSI 6-Series Manual +/- 0.2 units 0.01 units 0 to 14 units
22
RI Department of Environmental Management Quality Assurance Project Plan Narragansett Bay Fixed-Site Water Quality Monitoring Network Seasonal Monitoring
8.1 Sampling Process Design
8.2 Sampling Design Rationale Task 1A Real Time Continuous Monitoring Task 1 outlined in Section 6.2 describes the process for deciding sampling stations. Stations were chosen based on existing information and the need for real-time data by managers and users throughout the monitoring season. To aid in choosing stations, sources were ranked based on monitoring importance to the watershed. Detailed information for each location is found in Table A.1 in Appendix A. Tables A.2 and A.3 in Appendix A describe the exact location and monitoring protocol for each station. In general, continuous monitoring will occur during the summer months.
Task 1B Chlorophyll Monitoring: Measuring Total Chlorophyll Table A.2 documents the monitoring protocol for sampling. At all locations, chlorophyll readings will be taken on a continuous basis using the YSI 6-Series sondes. In addition, water samples will be collected for chlorophyll analysis whenever possible. Ideally, the water samples will be taken on the same interval as the sonde swaps for quality assurance purposes. The field technician will collect water and filtered within a 4-hour holding time limit in accordance to standard operation procedures (S-2).
Documentation of the samples is to be included in the field notes. The chlorophyll analysis information will be documented in the metadata.
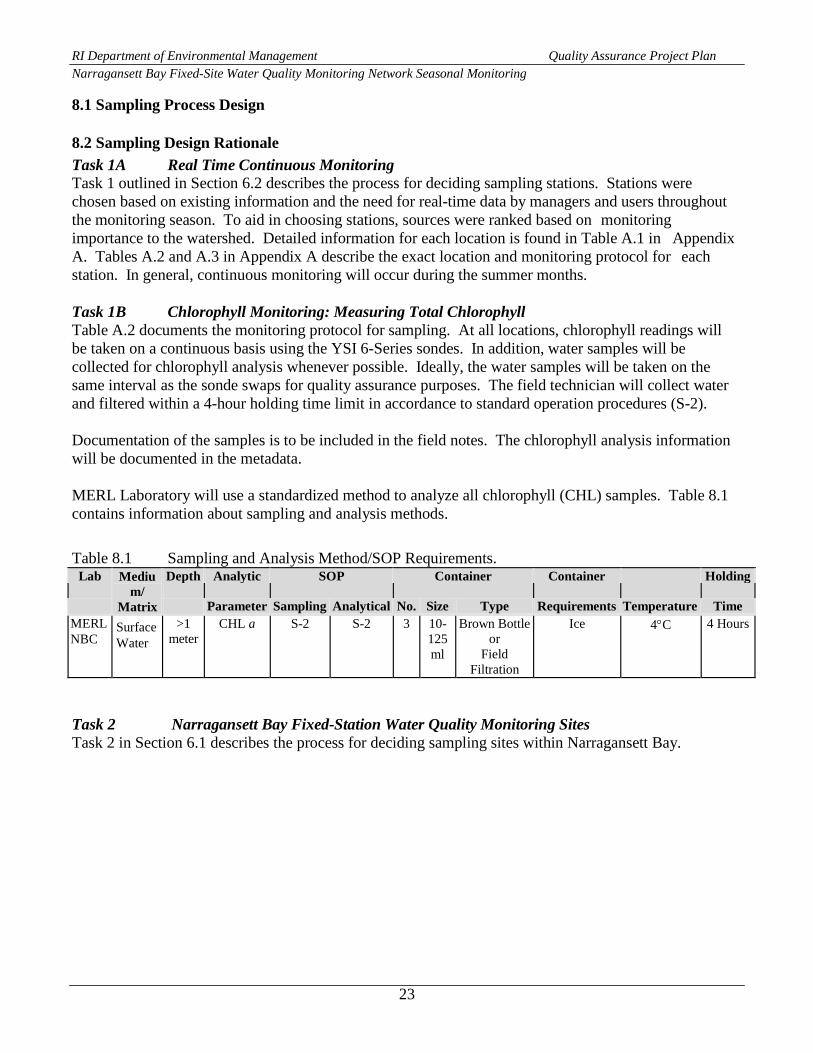
MERL Laboratory will use a standardized method to analyze all chlorophyll (CHL) samples. Table 8.1 contains information about sampling and analysis methods.
Table 8.1 Sampling and Analysis Method/SOP Requirements. Lab Mediu
m/ Matrix
Depth Analytic SOP Container Container Holding
Parameter Sampling Analytical No. Size Type Requirements Temperature Time MERL NBC
Surface Water
>1 meter
CHL a S-2 S-2 3 10- 125 ml
Brown Bottle or
Field Filtration
Ice 4°C 4 Hours
Task 2 Narragansett Bay Fixed-Station Water Quality Monitoring Sites Task 2 in Section 6.1 describes the process for deciding sampling sites within Narragansett Bay.
23

RI Department of Environmental Management Quality Assurance Project Plan
Reference Number /Title Originating Organization
Equipment Identification Modified for Work Project
Comments
Field Sampling SOP 1 (S-1) Calibration Procedures
RIDEM-OWR YSI 6-Series Sondes No
Field Sampling SOP 2 (S-2) CHL sampling Procedures
URI/GSO- MERL
Non-applicable No
Field Sampling SOP 2 (S-2b) CHL sampling Procedures
NBC Non-applicable No
Field Sampling SOP 3 (S-3) Sonde Swap Protocols
RIDEM-OWR YSI 6-Series Sondes Yes Modified from CDMO manual
Field Sampling SOP 4 (S-4) QA/QC Procedures
RIDEM-OWR Non-applicable Yes Modified from CDMO manual
DCP communications and programming SOP-5 (S-5)
YSI/other YSI 6200/Campbell Scientific/Loggernet Manuals
No
Station Preparation Guide SOP-6 (S-6) URI/GSO Buoy Manual No
Equipment Procedure Frequency of Calibration
Acceptance Criteria Corrective Action
SOP Reference
YSI 6-Series Sondes Calibration Bi-Monthly toMonthly
In accordance to the YSI Manual for each Parameter
Send to Factory
S-1
YSI DCP and communications electronics
Program Before Sampling Season
Functionality, 15 min sampling rate
Send to Factory
S-5
Narragansett Bay Fixed-Site Water Quality Monitoring Network Seasonal Monitoring
9.1 Sampling Procedures and Requirements 9.2 Sampling Procedures Standard operating procedures (SOP) for field sampling are located in Attachment A of this report. Table 9.1 Project Sampling SOP Reference Table.
9.3 Equipment Cleaning All, seasonally deployed, station equipment will be cleaned and tested for functionality prior to deployment. Equipment can be prepped with anti-fouling agents to reduce damage during deployment.
Equipment, maintained throughout the season, is to be cleaned after post-calibration checks. During each sonde swap, field technicians are to inspect all station equipment. Field technicians are responsible for keeping the critical components clean and operational throughout the sampling season.
9.4 Field Equipment Calibration and Maintenance The site operator will ensure that all field equipment is operating properly.
Table 9.2 Field Sampling Equipment Calibration Table.
Table 9.3 Field Equipment Maintenance, Testing, and Inspection Table. Equipment Activity Frequency Acceptance Criteria Corrective
Action SOP
Reference Station Preparation Clean, Paint,
test Once before Sampling Season or as Needed
Visibly free of debris, new hardware when necessary
Send to Factory
S-6
Profile Profile bi-monthly to monthly Within 90% of field equipment
Data deletion/ correction
S-3
CHL Sampling Filter Water Sample Bi-monthly to
monthly
Within 90% of field equipment regression
Data deletion/ correction
S-2
24
RI Department of Environmental Management Quality Assurance Project Plan Narragansett Bay Fixed-Site Water Quality Monitoring Network Seasonal Monitoring
10.1 DATA MANAGEMENT, QA/QC, AND DOCUMENTATION
10.2 Data Management Task 1 Calibration Protocols All agencies will maintain records of calibration, deployment, and post-deployment readings to provide the necessary information for data QA/QC procedures and help identify faulty equipment. At the completion of sampling season, all log sheets, files, and notebooks will be made available to the project manager upon request.
Specifically, protocol will follow the National Estuarine Research Reserve System-Wide Monitoring Program (SWMP) and/or the YSI 6-Series Multi-Parameter Water Quality Monitor Standard Operating Procedure (Latest Version) in conjunction with all appropriate manufacturer equipment manuals. These manuals are included in this document (see B and C) or through request to the quality assurance officer.
Task 2 Field Protocols The field protocols are weather and time dependent. These procedures consist of assessment of the station; sonde swap, water column profiling, and taking grab chlorophyll samples. All technicians must record field notes every time a station is visited. The standard operating procedure for this task may vary from site to site. Therefore, the SOP-3 is to be used as a guide.
Task 2A Chlorophyll collection and Analysis Protocols At all locations, chlorophyll readings will be taken on a continuous basis using the YSI 6-Series sondes. In addition, water samples will be collected for chlorophyll analysis whenever possible. Ideally, the water samples will be taken on the same interval as the sonde swaps for quality assurance purposes. The field technician will collect water and filtered within a 4-hour holding time limit in accordance to standard operation procedures (S-2).
Chlorophyll and other nutrient samples will be collected throughout the field season as determined by the NBFSMN. The chlorophyll field samples can be frozen and processed during the end of the year review. The designated labs are to report the results to the respective site managers before or during the year-end review period.
The field samples are used to calculate chlorophyll-a values using a regression analysis. This data analysis will be generated at the site manager’s discretion unless otherwise determined by the NBFSMN.
10.3 Verification Task 1 QA/QC Measures
The QA/QC management of water quality data consists of the following components: (1) Data acquisition and visual inspection of the data in EcoWatch or other compatible programs. (2) Pre-processing of the raw file in Excel to insert a station code, correct the time format, verify
the file configuration, verify the depth units and format the headers and values using a CDMO developed Excel macro or EQWinformat.xls.
(3) Data validation of the file in EQWin or Excel using data checks, queries, reports and graphs. (4) Data archival on CD, DVD, a separate computer or hard drive or to the local network.
25
RI Department of Environmental Management Quality Assurance Project Plan Narragansett Bay Fixed-Site Water Quality Monitoring Network Seasonal Monitoring
(5) Data editing to remove errors, outliers, out of water data, pre- and post-deployment data in Excel.
(6) Data Correcting to replace calibration errors, fouling, and outliers with linearly calculated values.
(7) Data documentation (metadata) to explain all suspect, deleted, calculated, and missing data. (8) Data submission to the project manager of the yearly data.
Data editing and review procedure will follow the YSI 6-Series Data Review and Editing Protocol (Appendix C of the NERRS CDMO Operations Manual, see attached).
10.4 Documentation Task 1 Metadata Documentation Metadata explains all aspects of the data from the research objectives to the data QA/QC and should be created as each dataset is processed. The metadata documentation is based on Chapter 6 of the NERRS CDMO manual (see appendix C).
Each Site manager is responsible for including the following sections in each station’s metadata document: 1) Associated researchers and projects (link to other products or programs) - Describe briefly otherresearch (data collection) that highlights the NBFSMN. 2) Data collection period - Include each YSI deployment and retrieval date and time (first and lastreadings in the water) for each monitoring site for the year. 3) Coded variable definitions – Explain the five-letter sampling site code.4) Anomalous/Suspect Data - This section should explain in detail all data that were retained, but areconsidered suspect or anomalous. List the exact dates, times, and variables that are considered suspect and WHY. Anomalous data should be left in the data file when you have no factual reason to delete them (even though the data look suspicious) and note them as suspect data in this section. 5) Deleted Data - This section should explain in detail all data that were collected but deleted from therecord. List the exact dates, times, and variables that were removed and WHY. This section should include data correction methods used (i.e. calibration error corrections, linear calculations, and/or fouling correction equations). 6) Missing data - This section will incorporate the use of a blanket statement for data that were nevercollected (missing data). 7) Time adjustments-This section is to include any variation to the sampling schedule (every 15minutes on the quarter hour using local standard time, LST). 8) Post deployment information - Use this section for documentation of post calibration informationfor instruments deployed at each site. 9) Other remarks/notes - Use this section for further documentation of the research data set. Includeinformation on localized weather events (dates and amounts of rain, major storms or weather patterns affecting the area, etc.) that may have affected data recorded at the sites.
The QA officer is responsible to providing a comprehensive metadata document including all agency contacts, data referencing/ownership, distribution, sensor specifications, site descriptions, research methods, and research objectives.
26
RI Department of Environmental Management Quality Assurance Project Plan Task 2 Raw Files Raw files will be included in each sites final report. The raw files are formatted according to the YSI 6- Series Data Reporting. The raw files will contain the data collected by parameter during each deployment and be label according to agency, site, and deployment date. For further details on formatting see appendix C. Task 3 Edited files Edited files will be included in each sites final report. The edited files are formatted according to the Data Review and Editing Protocol. The edited files will contain the QA data including data deletions. The edited dataset will be label according to station code and year collected. Edited data are in seasonal/annual format using Excel. For further details on formatting see appendix C. Task 4 Corrected files Corrected files will be included in each sites final report. The corrected files are formatted according to the Data Review and Editing Protocol. The corrected files will contain the QA data including data calculations and a column for combine date and time. The corrected dataset will be label according to station code and year collected. Corrected data are in a seasonal/annual format using Excel including graphics. For further details on formatting see appendix C.
27
RI Department of Environmental Management Quality Assurance Project Plan Narragansett Bay Fixed-Site Water Quality Monitoring Network Seasonal Monitoring
11.1 Field Analytical Method Requirements During sampling, no field analyses will take place.
28
RI Department of Environmental Management Quality Assurance Project Plan Narragansett Bay Fixed-Site Water Quality Monitoring Network Seasonal Monitoring
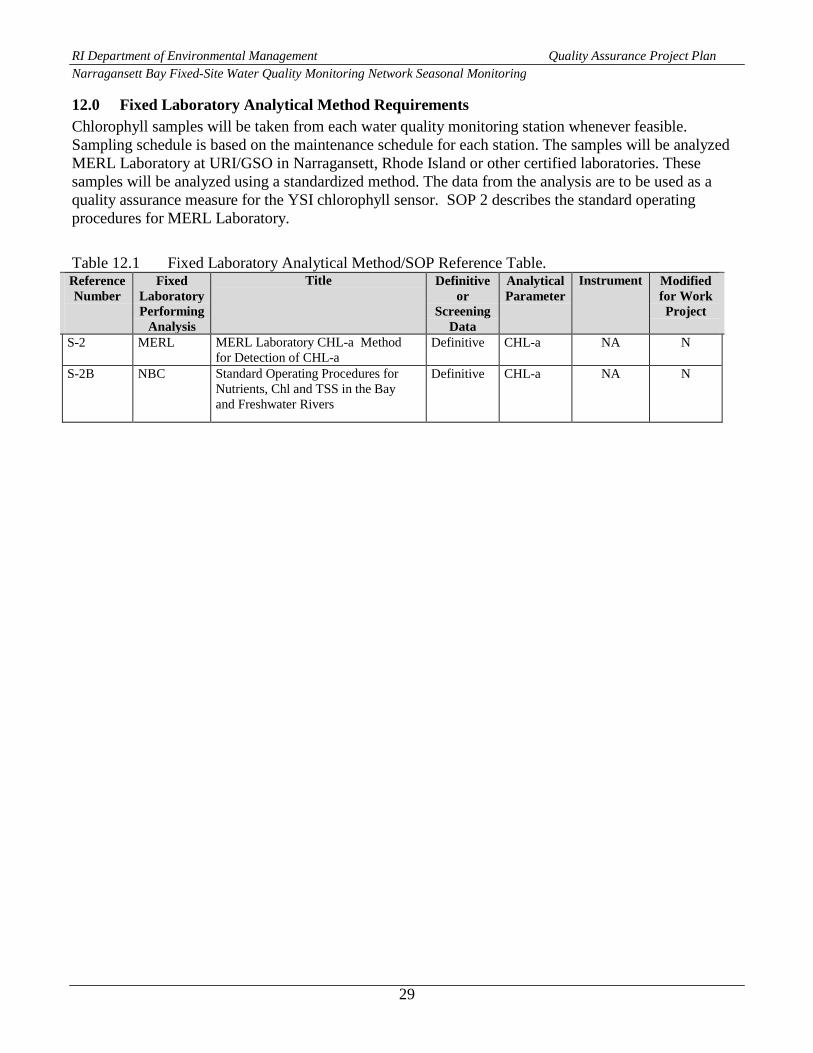
12.0 Fixed Laboratory Analytical Method Requirements Chlorophyll samples will be taken from each water quality monitoring station whenever feasible. Sampling schedule is based on the maintenance schedule for each station. The samples will be analyzed MERL Laboratory at URI/GSO in Narragansett, Rhode Island or other certified laboratories. These samples will be analyzed using a standardized method. The data from the analysis are to be used as a quality assurance measure for the YSI chlorophyll sensor. SOP 2 describes the standard operating procedures for MERL Laboratory.
Table 12.1 Fixed Laboratory Analytical Method/SOP Reference Table. Reference Number
Fixed Laboratory Performing
Analysis
Title Definitive or
Screening Data
Analytical Parameter
Instrument Modified for Work Project
S-2 MERL MERL Laboratory CHL-a Method for Detection of CHL-a
Definitive CHL-a NA N
S-2B NBC Standard Operating Procedures for Nutrients, Chl and TSS in the Bay and Freshwater Rivers
Definitive CHL-a NA N
29

RI Department of Environmental Management Quality Assurance Project Plan Narragansett Bay Fixed-Site Water Quality Monitoring Network Seasonal Monitoring 13.0 Quality Control Requirements
Table 13.1 Field Sampling QC: Sonde Swap. Sampling SOP S-1 Medium/ Matrix Surface Water Analytical Parameter
Temp, Sal, DO, pH, CHL
Concentration Level <1 Analytical Method/ SOP Reference
S-4
QC Frequency/ Number
Method/SOP QC Acceptance Limits
Corrective Action Person Responsible for Corrective Action
Data Quality Indicator
Measurement Performance Criteria
15-min sampling using LST
L-1 Discuss any problems in the field with sampler.
Site Manager Precision Within 95% Confidence Interval
Table 13.2 Fixed Laboratories Analytical QC: Chlorophyll a at MERL Laboratory and NBC Laboratory Sampling SOP S-2, S-2B Medium/ Matrix Surface Water Analytical Parameter
CHL a (ug/L)
Concentration Level <1 Analytical Method/ SOP Reference
Standard Method
QC Frequency/ Number
Method/SOP QC Acceptance Limits
Corrective Action Person Responsible for Corrective Action
Data Quality Indicator
Measurement Performance Criteria
Method Blank 1 Per Batch L-1 Re-prepare Batch MERL/NBC Staff Bias- Contamination Reagent Blank 1 Per Batch L-1 Re-prepare Batch MERL/NBC Staff Bias- Contamination Laboratory Duplicate
1 per 10 samples L-1 Reanalyze MERL/NBC Staff Precision-Lab Within 95% Confidence Interval
30
RI Department of Environmental Management Quality Assurance Project Plan Narragansett Bay Fixed-Site Water Quality Monitoring Network Seasonal Monitoring
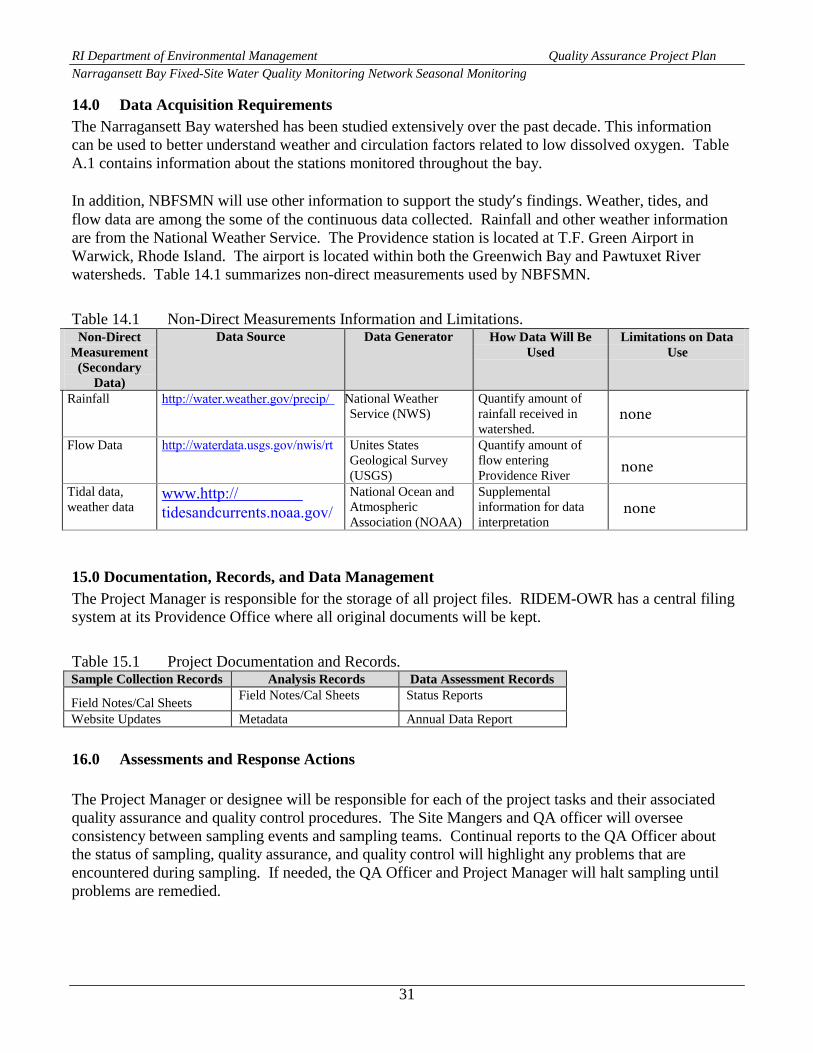
14.0 Data Acquisition Requirements The Narragansett Bay watershed has been studied extensively over the past decade. This information can be used to better understand weather and circulation factors related to low dissolved oxygen. Table A.1 contains information about the stations monitored throughout the bay.
In addition, NBFSMN will use other information to support the study’s findings. Weather, tides, and flow data are among the some of the continuous data collected. Rainfall and other weather information are from the National Weather Service. The Providence station is located at T.F. Green Airport in Warwick, Rhode Island. The airport is located within both the Greenwich Bay and Pawtuxet River watersheds. Table 14.1 summarizes non-direct measurements used by NBFSMN.
Table 14.1 Non-Direct Measurements Information and Limitations. Non-Direct
Measurement (Secondary
Data)
Data Source Data Generator How Data Will Be Used
Limitations on Data Use
Rainfall http://water.weather.gov/precip/ National Weather Service (NWS)
Quantify amount of rainfall received in watershed.
Flow Data http://waterdata.usgs.gov/nwis/rt Unites States Geological Survey (USGS)
Quantify amount of flow entering Providence River
Tidal data, weather data
www.http://tidesandcurrents.noaa.gov/
National Ocean and Atmospheric Association (NOAA)
Supplemental information for data interpretation
15.0 Documentation, Records, and Data Management The Project Manager is responsible for the storage of all project files. RIDEM-OWR has a central filing system at its Providence Office where all original documents will be kept.
Table 15.1 Project Documentation and Records. Sample Collection Records Analysis Records Data Assessment Records
Field Notes/Cal Sheets Field Notes/Cal Sheets Status Reports
Website Updates Metadata Annual Data Report
16.0 Assessments and Response Actions
The Project Manager or designee will be responsible for each of the project tasks and their associated quality assurance and quality control procedures. The Site Mangers and QA officer will oversee consistency between sampling events and sampling teams. Continual reports to the QA Officer about the status of sampling, quality assurance, and quality control will highlight any problems that are encountered during sampling. If needed, the QA Officer and Project Manager will halt sampling until problems are remedied.
31
none
none
none
RI Department of Environmental Management Quality Assurance Project Plan
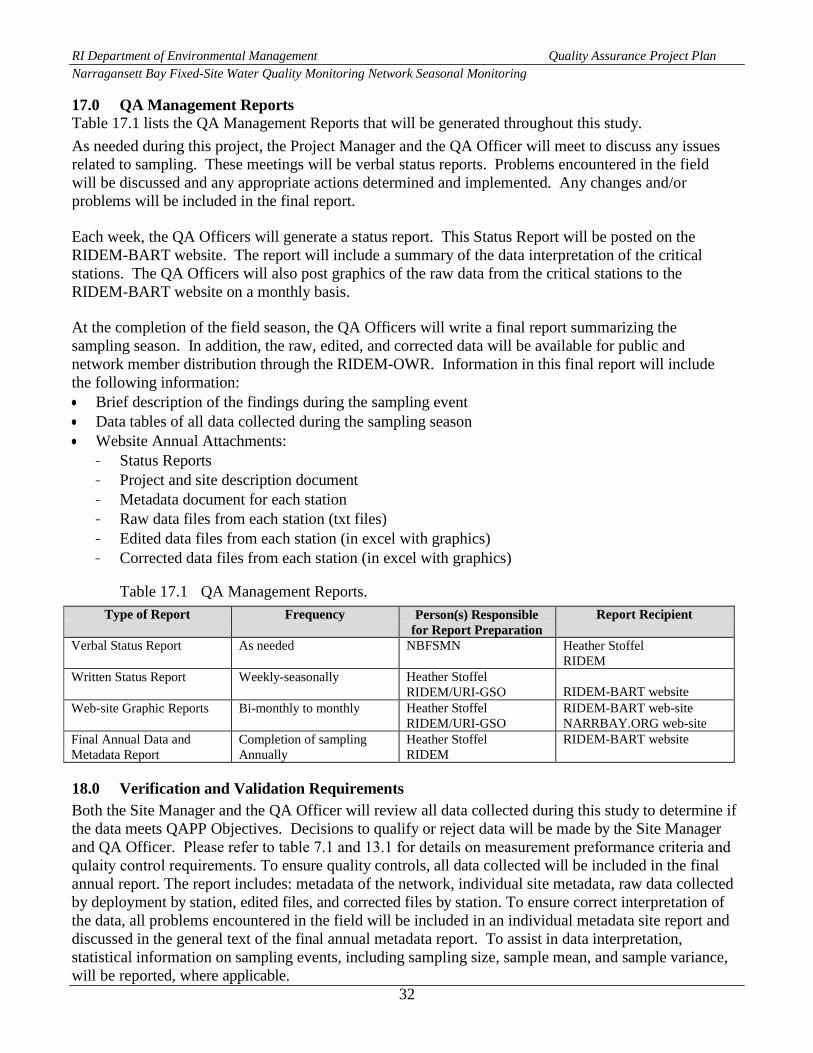
Type of Report Frequency Person(s) Responsible for Report Preparation
Report Recipient
Verbal Status Report As needed NBFSMN Heather Stoffel RIDEM
Written Status Report Weekly-seasonally Heather Stoffel RIDEM/URI-GSO RIDEM-BART website
Web-site Graphic Reports Bi-monthly to monthly Heather Stoffel RIDEM/URI-GSO
RIDEM-BART web-site NARRBAY.ORG web-site
Final Annual Data and Metadata Report
Completion of sampling Annually
Heather Stoffel RIDEM
RIDEM-BART website
Narragansett Bay Fixed-Site Water Quality Monitoring Network Seasonal Monitoring
17.0 QA Management Reports Table 17.1 lists the QA Management Reports that will be generated throughout this study. As needed during this project, the Project Manager and the QA Officer will meet to discuss any issues related to sampling. These meetings will be verbal status reports. Problems encountered in the field will be discussed and any appropriate actions determined and implemented. Any changes and/or problems will be included in the final report.
Each week, the QA Officers will generate a status report. This Status Report will be posted on the RIDEM-BART website. The report will include a summary of the data interpretation of the critical stations. The QA Officers will also post graphics of the raw data from the critical stations to the RIDEM-BART website on a monthly basis.
At the completion of the field season, the QA Officers will write a final report summarizing the sampling season. In addition, the raw, edited, and corrected data will be available for public and network member distribution through the RIDEM-OWR. Information in this final report will include the following information: • Brief description of the findings during the sampling event• Data tables of all data collected during the sampling season• Website Annual Attachments:
− Status Reports− Project and site description document− Metadata document for each station− Raw data files from each station (txt files)− Edited data files from each station (in excel with graphics)− Corrected data files from each station (in excel with graphics)
Table 17.1 QA Management Reports.
18.0 Verification and Validation Requirements Both the Site Manager and the QA Officer will review all data collected during this study to determine if the data meets QAPP Objectives. Decisions to qualify or reject data will be made by the Site Manager and QA Officer. Please refer to table 7.1 and 13.1 for details on measurement preformance criteria and qulaity control requirements. To ensure quality controls, all data collected will be included in the final annual report. The report includes: metadata of the network, individual site metadata, raw data collected by deployment by station, edited files, and corrected files by station. To ensure correct interpretation of the data, all problems encountered in the field will be included in an individual metadata site report and discussed in the general text of the final annual metadata report. To assist in data interpretation, statistical information on sampling events, including sampling size, sample mean, and sample variance, will be reported, where applicable.
32
RI Department of Environmental Management Quality Assurance Project Plan Narragansett Bay Fixed-Site Water Quality Monitoring Network Seasonal Monitoring
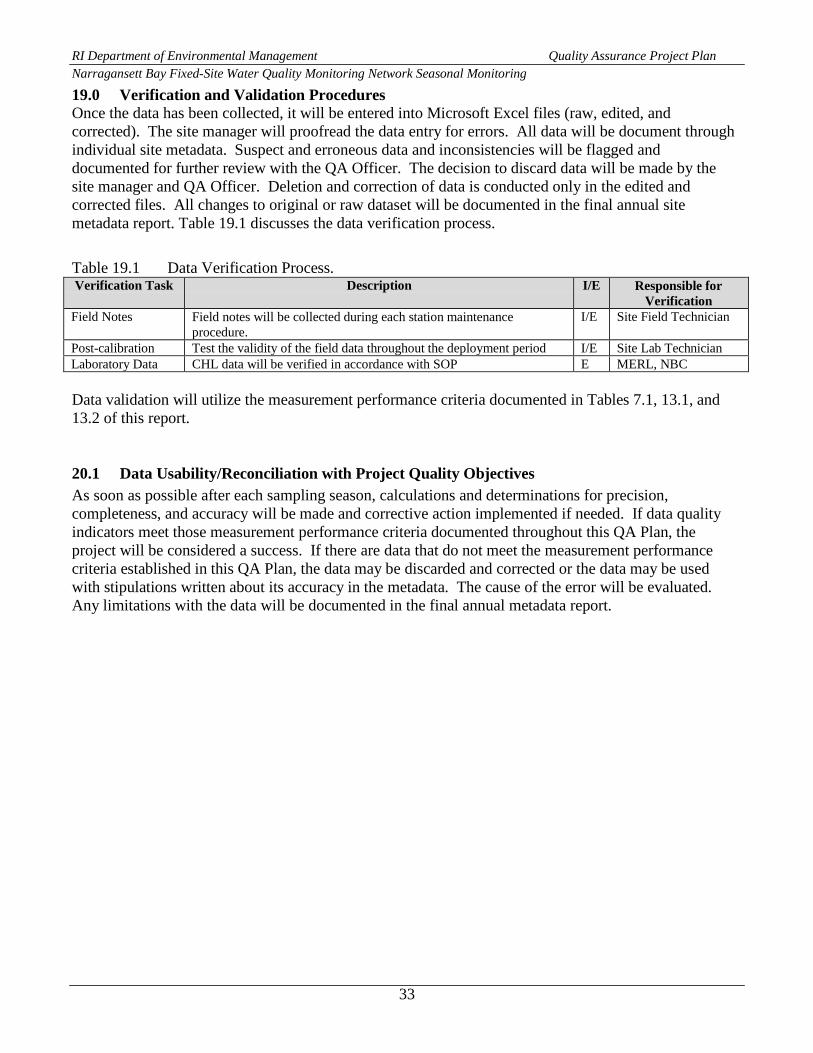
19.0 Verification and Validation Procedures Once the data has been collected, it will be entered into Microsoft Excel files (raw, edited, and corrected). The site manager will proofread the data entry for errors. All data will be document through individual site metadata. Suspect and erroneous data and inconsistencies will be flagged and documented for further review with the QA Officer. The decision to discard data will be made by the site manager and QA Officer. Deletion and correction of data is conducted only in the edited and corrected files. All changes to original or raw dataset will be documented in the final annual site metadata report. Table 19.1 discusses the data verification process.
Table 19.1 Data Verification Process. Verification Task Description I/E Responsible for
Verification Field Notes Field notes will be collected during each station maintenance
procedure. I/E Site Field Technician
Post-calibration Test the validity of the field data throughout the deployment period I/E Site Lab Technician Laboratory Data CHL data will be verified in accordance with SOP E MERL, NBC
Data validation will utilize the measurement performance criteria documented in Tables 7.1, 13.1, and 13.2 of this report.
20.1 Data Usability/Reconciliation with Project Quality Objectives As soon as possible after each sampling season, calculations and determinations for precision, completeness, and accuracy will be made and corrective action implemented if needed. If data quality indicators meet those measurement performance criteria documented throughout this QA Plan, the project will be considered a success. If there are data that do not meet the measurement performance criteria established in this QA Plan, the data may be discarded and corrected or the data may be used with stipulations written about its accuracy in the metadata. The cause of the error will be evaluated. Any limitations with the data will be documented in the final annual metadata report.
33

RI Department of Environmental Management Quality Assurance Project Plan Narragansett Bay Fixed-Site Water Quality Monitoring Network Seasonal Monitoring
References Bergondo, D., Kester, D.R., Stoffel, H.E., Woods, W.L., (2005). Time series observations during the low sub-surface oxygen events in Narragansett Bay during summer 2001, Marine Chemistry, 97: 90-103.
Codiga, D.L., H.E. Stoffel, C.F. Deacutis, S. Kiernan, and C.A. Oviatt. 2009. Narragansett Bay hypoxic event characteristics based on fixed‐site monitoring network time series: intermittency, geographic distribution, spatial synchronicity, and interannual variability. Estuaries and Coasts 32:621‐641.
Colt, A. 2008. The Rhode Island Bays, Rivers, & Watersheds Coordination Team’s Bays, Rivers, and Watersheds Systems‐Level Plan: 2009‐2013
Deacutis, C.F., Murray, D., Prell, W., Saarman, E., and Korhun, L., 2006, Hypoxia in the Upper Half of Narragansett Bay, RI, During August 2001 and 2002, in Natural and Anthropogenic Influences on the Mount Hope Bay Ecosystem, Northeastern Naturalist 13(Special Issue 4):173-198.
Deacutis, C.F., Murray, D., Warren, P., Saarman, E., Korhun, L., Cicchettii, G., 2003. Hypoxic Waters of Narragansett Bay. Northeast Naturalist, in press.
Deacutis, C.F., 1999. Nutrient Impacts and Signs of Problems in Narragansett Bay. p7-23. In: Kerr, M. (Ed.), 1999. Nutrients and Narragansett Bay: Proceedings of a Workshop on Nutrient Removal from Wastewater Treatment Facilities. Rhode Island Sea Grant. Narragansett, RI.
Doering, P.H., Oviatt, C.A., Welsh, B.L., 1990. Characterizing Water Quality in the Seekonk River, Providence River, and Upper Narragansett Bay, Final Report.
Deacutis, C. and S. Kiernan. 2006. Sensors monitor water quality in Narragansett Bay. 41o N 3:7‐8.
Rhode Island Department of Environmental Management (RIDEM-OWR), 2005. State of Rhode Island and Providence Plantations Water Quality Monitoring Strategy 2005-2010, RIDEM, Providence, RI.
Saarman, E., Prell, W., Murray, D.W., Deacutis, C., 2008. Chapter 11: Summer bottom water dissolved oxygen in Upper Narragansett Bay. In: Science for Ecosystem-based Estuarine Management: Narragansett Bay in the 21st Century, Desbonnet & Costa-Pierce (eds.), Springer Series In Environmental Management, 325-347.
Stoffel, H. and S. Kiernan, 2008. NBFSMN Final Grant Report: 2005-2008.
Tamara D. Small, Melissa R. Ide, Jennifer M. Keesee, 2013. CDMO NERR SWMP DATA MANAGEMENT MANUAL Version 6.5. In support of the NERR System-wide Monitoring Program. NOAA National Estuarine Research Reserve Centralized Data Management Office c/o Belle W. Baruch Institute of Marine and Coastal Sciences
Watershed Counts, 2013. Watershed Counts 2013 Annual Report.
YSI, Inc., 2011. YSI 6-Series Installation and Operations Manual, Yellow Springs, OH
Vadeboncoeur, A., Hamburg, S.P., and Pryor, D. 2010. Modeled Nitrogen Loading to Narragansett Bay: 1850 to 2015. Estuaries and Coasts. 33:1113-1127.
34
RI Department of Environmental Management Quality Assurance Project Plan Narragansett Bay Fixed-Site Water Quality Monitoring Network Seasonal Monitoring
Appendix A Sampling Station Information
Table A.1 Monitoring Schedule for Narragansett Bay Stations. Monitoring Protocol
Time of Sample ID Agency Location Class J F M A M J J A S O N D
Providence/Seekonk Rivers: NBCPS NBC Phillipsdale Surface* SA x x x x x x x x x x x x NBCPB NBC Phillipsdale Bottom* SA x x x x x x x x x x x x NBCBS NBC Bullock Reach Surface SA x x x x x x NBCBS NBC Bullock Reach Mid-depth SA x x x x x x NBCBB NBC Bullock Reach Bottom SA x x x x x x
West Passage: GSOCS URI/GSO Conimicut Point-Surface SA x x x x x x GSOCB URI/GSO Conimicut Point-Bottom SA x x x x x x GSOUB URI/GSO Upper Bay Winter Station-Surface SA x x x x x x x x GSONS URI/GSO North Prudence-Surface SA x x x x x x GSONB URI/GSO North Prudence-Bottom SA x x x x x x NARGS URI/GSO Greenwich Bay Marina-Surface* SB1 x x x x x x x x x x x x NARGB URI/GSO Greenwich Bay Marina-Bottom* SB1 x x x x x x x x x x x x NARGS URI/GSO Sally Rock Surface SB1 x x x x x x NARGB URI/GSO Sally Rock Bottom SB1 x x x x x x GSOMS URI/GSO Mount View-Surface SB x x x x x x GSOMB URI/GSO Mount View-Bottom SA x x x x x x GSOQS URI/GSO Quonset Pt-Surface SB x x x x x x GSOQB URI/GSO Quonset Pt-Bottom SA x x x x x x GSOGD URI/GSO GSO Dock-Mid Water depth SA x x x x x x x x x x x x
East Passage: DEMPS DEM Popposquash Point-Surface x x x x x x DEMPB DEM Popposquash Point-Bottom x x x x x x NARHS NBNERR Mt. Hope Bay-Surface x x x x x x NARHB NBNERR Mt. Hope Bay-Bottom x x x x x x NARTS NBNERR T-Wharf- Surface SA x x x x x x x x x x x x NARTB NBNERR T-Wharf-Bottom SB x x x x x x x x x x x x *year –round station is weather dependent (icing in the bay occasionally occurs)
35

RI Department of Environmental Management Quality Assurance Project Plan Narragansett Bay Fixed-Site Water Quality Monitoring Network Seasonal Monitoring
Figure A.1 Narragansett Bay Fixed-Site Water Quality Monitoring Sampling Stations
36
RI Department of Environmental Management Quality Assurance Project Plan Narragansett Bay Fixed-Site Water Quality Monitoring Network Seasonal Monitoring
Appendix B Field Sampling and Lab Calibration Manual
YSI Incorporated. (2011). 6-Series Multiparameter Water Quality Sondes User Manual
(http://www.ysi.com/media/pdfs/069300-YSI-6-Series-Manual-RevJ.pdf)
Appendix C Data Review and Editing Manuals and SOPs
Data formatting, editing and review procedures were adapted from Water Quality Data Review and Editing Protocol (Chapter 5 of the NERRS CDMO Operations Manual).
This protocol was adapted for the NBFSMN using National Estuarine Research Reserve System-Wide Monitoring Program (SWMP) format as its main guide using Excel instead of CDMO software.
Use the following links to view CDMO NERRS Operations Manual and SOPs:
http://cdmo.baruch.sc.edu/documents/manual.pdf
37
RI Department of Environmental Management Quality Assurance Project Plan Narragansett Bay Fixed-Site Water Quality Monitoring Network Seasonal Monitoring
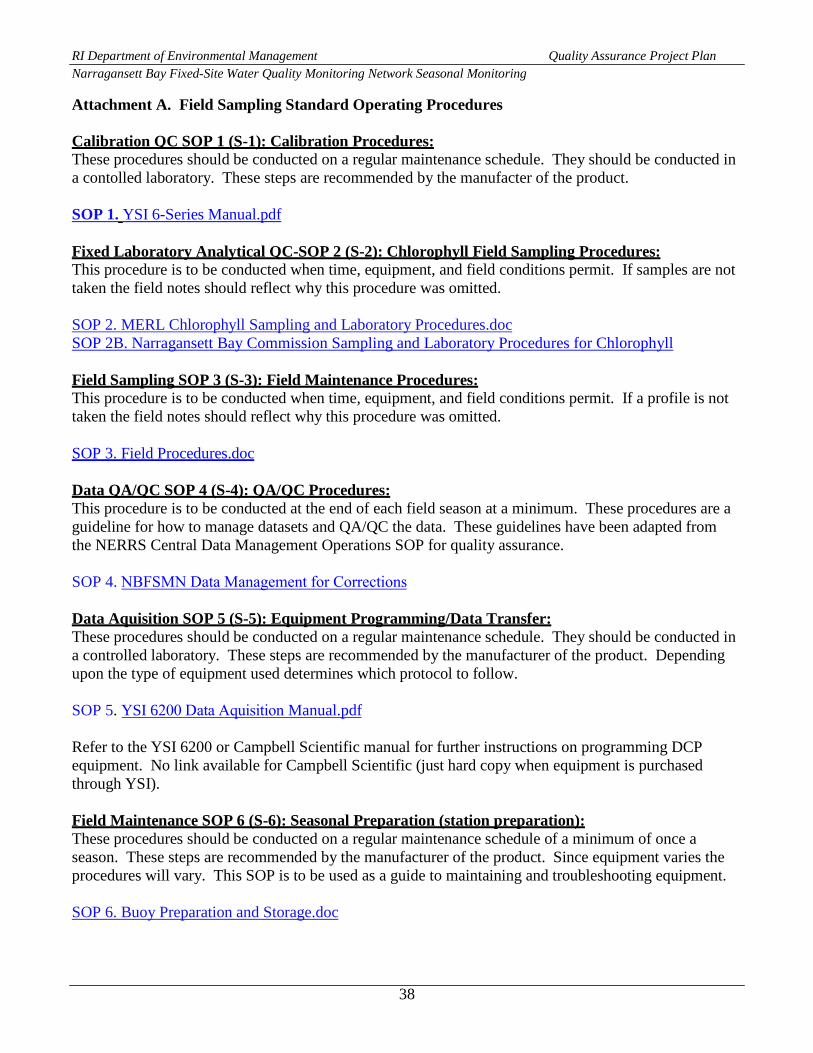
Attachment A. Field Sampling Standard Operating Procedures
Calibration QC SOP 1 (S-1): Calibration Procedures: These procedures should be conducted on a regular maintenance schedule. They should be conducted in a contolled laboratory. These steps are recommended by the manufacter of the product.
SOP 1. YSI 6-Series Manual.pdf
Fixed Laboratory Analytical QC-SOP 2 (S-2): Chlorophyll Field Sampling Procedures: This procedure is to be conducted when time, equipment, and field conditions permit. If samples are not taken the field notes should reflect why this procedure was omitted.
SOP 2. MERL Chlorophyll Sampling and Laboratory Procedures.doc SOP 2B. Narragansett Bay Commission Sampling and Laboratory Procedures for Chlorophyll
Field Sampling SOP 3 (S-3): Field Maintenance Procedures: This procedure is to be conducted when time, equipment, and field conditions permit. If a profile is not taken the field notes should reflect why this procedure was omitted.
SOP 3. Field Procedures.doc
Data QA/QC SOP 4 (S-4): QA/QC Procedures: This procedure is to be conducted at the end of each field season at a minimum. These procedures are a guideline for how to manage datasets and QA/QC the data. These guidelines have been adapted from the NERRS Central Data Management Operations SOP for quality assurance.
SOP 4. NBFSMN Data Management for Corrections
Data Aquisition SOP 5 (S-5): Equipment Programming/Data Transfer: These procedures should be conducted on a regular maintenance schedule. They should be conducted in a controlled laboratory. These steps are recommended by the manufacturer of the product. Depending upon the type of equipment used determines which protocol to follow.
SOP 5. YSI 6200 Data Aquisition Manual.pdf
Refer to the YSI 6200 or Campbell Scientific manual for further instructions on programming DCP equipment. No link available for Campbell Scientific (just hard copy when equipment is purchased through YSI).
Field Maintenance SOP 6 (S-6): Seasonal Preparation (station preparation): These procedures should be conducted on a regular maintenance schedule of a minimum of once a season. These steps are recommended by the manufacturer of the product. Since equipment varies the procedures will vary. This SOP is to be used as a guide to maintaining and troubleshooting equipment.
SOP 6. Buoy Preparation and Storage.doc
38

Revised June 2, 2003 Page 1 of 18
SOP-2 MERL Chlorophyll Sampling and Laboratory Procedures
University Of Rhode Island Marine Ecosystems Research Laboratory
Standard Operating Procedure
for
EXTRACTION AND ANALYSIS OF CHLOROPHYLL a AND PHAEOPHYTIN a IN SEAWATER
USING A TURNER DESIGNS MODEL 700 FLUOROMETER
Summary of changes in this version: This SOP has been revised to reflect improvements to the method and to correct inadequacies in the previous versions.
1.0 OBJECTIVE
The purpose of this Standard Operating Procedure is to describe a fluorometric procedure for the analysis of chlorophyll a and phaeophytin a that can be performed in the laboratory or at sea. The methods follow those described by the U.S. Environmental Protection Agency (Arar and Collins, 1997)1.
1.1 SUMMARY OF METHOD
Briefly, water samples are filtered through glass fiber filters (GF/F) by low-vacuum filtration, which are then allowed to steep in 90% acetone to extract the pigments. The extract is centrifuged and the supernatant analyzed using a fluorometer to measure the fluorescence of chlorophyll and, after acidification, of phaeophytin. Fluorescence is then converted to concentration based on a 6 to 10-point linear regression calibration.
1.2 INTERFERENCES
Any substance extracted from the filtered sample that fluoresces in the red region of the spectrum may interfere with the measurements of chlorophyll a and phaeophytin a. The relative concentrations of chlorophylls a, b, and c will vary with the taxonomic composition of the phytoplankton. Depending on the concentrations (and the ratios of those concentrations) present in the samples, chlorophylls b and c may interfere significantly with chlorophyll a and phaeophytin a measurements due to spectral overlaps. Knowledge of the phytoplankton assemblage will aid the analyst in determining the need for additional (or alternative) analytical methods (e.g., spectrophotometric methods) described elsewhere.
2.0 PREPARATION
2.1 EQUIPMENT, GLASSWARE, MISCELLANEOUS SUPPLIES
• All apparatus must be clean and acid-free. Soak glassware in detergent (e.g., Joy, or similar dishwashing or laboratory grade detergent) and water for 4 hours; rinse three times each with deionized water (DIW), and once with 90% acetone.
• Turner Designs Model 700 Series Fluorometer (or similarly equipped fluorometer) with the
1Arar, E.J., and G.B. Collins. 1997. In Vitro Determination of Chlorophyll a and Phaeophytin a in Marine and FreshwaterPhytoplankton by Fluorescence. Method 445.0, Version 1.2 (September 1997). U.S. Environmental Protection Agency, Environmental Monitoring Systems Laboratory, Office of Research and Development, Cincinnati, OH.
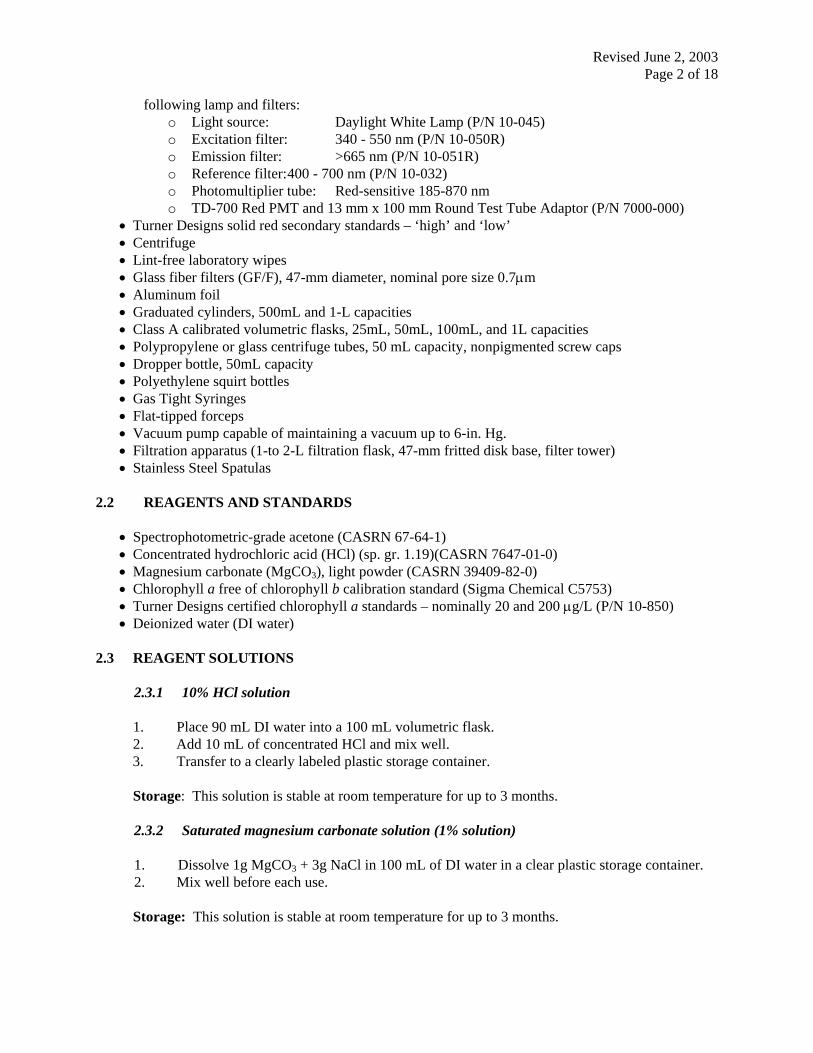
Revised June 2, 2003 Page 2 of 18
following lamp and filters: o Light source: Daylight White Lamp (P/N 10-045) o Excitation filter: 340 - 550 nm (P/N 10-050R) o Emission filter: >665 nm (P/N 10-051R) o Reference filter: 400 - 700 nm (P/N 10-032)o Photomultiplier tube: Red-sensitive 185-870 nmo TD-700 Red PMT and 13 mm x 100 mm Round Test Tube Adaptor (P/N 7000-000)
• Turner Designs solid red secondary standards – ‘high’ and ‘low’• Centrifuge• Lint-free laboratory wipes• Glass fiber filters (GF/F), 47-mm diameter, nominal pore size 0.7µm• Aluminum foil• Graduated cylinders, 500mL and 1-L capacities• Class A calibrated volumetric flasks, 25mL, 50mL, 100mL, and 1L capacities• Polypropylene or glass centrifuge tubes, 50 mL capacity, nonpigmented screw caps• Dropper bottle, 50mL capacity• Polyethylene squirt bottles• Gas Tight Syringes• Flat-tipped forceps• Vacuum pump capable of maintaining a vacuum up to 6-in. Hg.• Filtration apparatus (1-to 2-L filtration flask, 47-mm fritted disk base, filter tower)• Stainless Steel Spatulas
2.2 REAGENTS AND STANDARDS
• Spectrophotometric-grade acetone (CASRN 67-64-1)• Concentrated hydrochloric acid (HCl) (sp. gr. 1.19)(CASRN 7647-01-0)• Magnesium carbonate (MgCO3), light powder (CASRN 39409-82-0)• Chlorophyll a free of chlorophyll b calibration standard (Sigma Chemical C5753)• Turner Designs certified chlorophyll a standards – nominally 20 and 200 µg/L (P/N 10-850)• Deionized water (DI water)
2.3 REAGENT SOLUTIONS
2.3.1 10% HCl solution
1. Place 90 mL DI water into a 100 mL volumetric flask.2. Add 10 mL of concentrated HCl and mix well.3. Transfer to a clearly labeled plastic storage container.
Storage: This solution is stable at room temperature for up to 3 months.
2.3.2 Saturated magnesium carbonate solution (1% solution)
1. Dissolve 1g MgCO3 + 3g NaCl in 100 mL of DI water in a clear plastic storage container.2. Mix well before each use.
Storage: This solution is stable at room temperature for up to 3 months.
Revised June 2, 2003 Page 3 of 18
2.3.3 Aqueous buffered acetone solution (90% acetone) 1. Measure 100 mL of DI water using a 1L graduated cylinder and transfer to a storage
container. 2. Measure 900 mL of acetone using a 1L graduated cylinder, transfer to the container, and
mix. 3. Add 10 drops (using an eye dropper) of 1N NaHCO3 buffer solution to assure an alkaline
solution. (Sodium bicarbonate solution: 8.4g NaHCO3 dissolved in 100 mL DI water mixed well.)
Storage: Store at room temperature for up to 3 months. 2.4 STANDARD SOLUTIONS All standard solutions prepared in volumetric flasks are prepared by adding the material of interest, a small amount of solvent, mixed to dissolved, and then brought to volume. All materials of interest and solvents must be at room temperature prior to preparation of standards.
2.4.1 Chlorophyll a Primary Stock Solution (~20 mg/L)
1. The chlorophyll a dry standard will be shipped in a flame-sealed amber glass ampoule; the standard must be stored in the dark and at -20°C until just prior to use.
2. Tap the ampoule until all of the dried chlorophyll is in the bottom of the ampoule. In subdued light, carefully break the tip of the ampoule to open, and completely transfer the contents into a 1000 mL volumetric flask.
3. Dilute the chlorophyll to volume with 90% buffered acetone. (For example: If a nominal weight of 1 mg chlorophyll is added to a 500 mL volumetric flask, then the primary stock solution will be 2000 µg/L chlorophyll). Label the flask, and wrap with aluminum foil to protect from light.
Storage: Store at -20°C and in the dark; minimize time between preparation of primary standard,
spectrophotometric determination of primary standard concentration, and calibration of fluorometer with secondary standards. A 24-hr period is optimal although the solution is stable for > 6 months (Arar and Collins, 1997).
2.4.2 Determination of Primary Chlorophyll a Standard Concentration
The concentration of the primary chlorophyll a standard must be determined spectrophotometrically using a multiwavelength spectrophotometer. There are a number of valid spectrophotometric methods and equations available for determination of chlorophyll concentration. The calculation method used at the Marine Ecological Research Laboratory multiplies the absorbance values at 664 nm and 647 nm by the constants 11.93 and 1.93 respectively, and takes the difference of the two values. The final equation is as follows:
Chl a = (11.93 * λ664) – (1.93 * λ647) Where, Chl a = concentration (mg/L) of chlorophyll a measured,
λ664 = sample absorbance at 664 nm, and
λ647 = sample absorbance at 665 nm
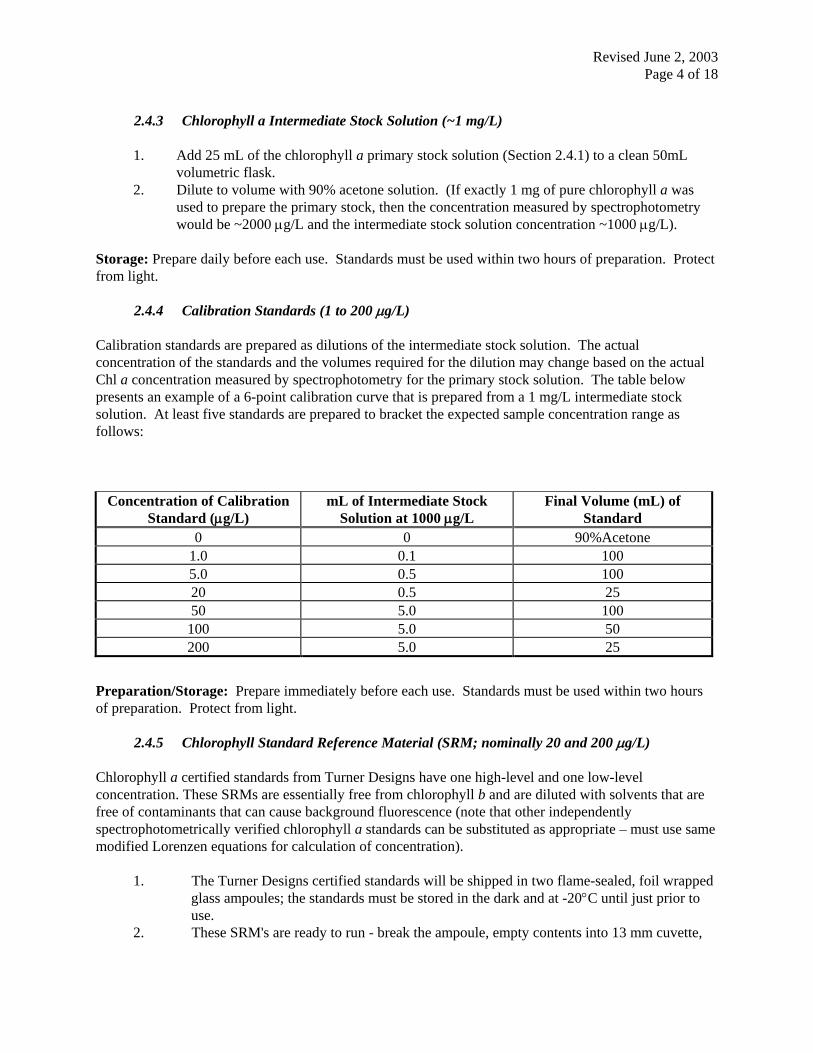
Revised June 2, 2003 Page 4 of 18
2.4.3 Chlorophyll a Intermediate Stock Solution (~1 mg/L)
1. Add 25 mL of the chlorophyll a primary stock solution (Section 2.4.1) to a clean 50mL
volumetric flask. 2. Dilute to volume with 90% acetone solution. (If exactly 1 mg of pure chlorophyll a was
used to prepare the primary stock, then the concentration measured by spectrophotometry would be ~2000 µg/L and the intermediate stock solution concentration ~1000 µg/L).
Storage: Prepare daily before each use. Standards must be used within two hours of preparation. Protect from light.
2.4.4 Calibration Standards (1 to 200 µg/L) Calibration standards are prepared as dilutions of the intermediate stock solution. The actual concentration of the standards and the volumes required for the dilution may change based on the actual Chl a concentration measured by spectrophotometry for the primary stock solution. The table below presents an example of a 6-point calibration curve that is prepared from a 1 mg/L intermediate stock solution. At least five standards are prepared to bracket the expected sample concentration range as follows:
Concentration of Calibration Standard (µg/L)
mL of Intermediate Stock Solution at 1000 µg/L
Final Volume (mL) of Standard
0 0 90%Acetone 1.0 0.1 100 5.0 0.5 100 20 0.5 25 50 5.0 100
100 5.0 50 200 5.0 25
Preparation/Storage: Prepare immediately before each use. Standards must be used within two hours of preparation. Protect from light.
2.4.5 Chlorophyll Standard Reference Material (SRM; nominally 20 and 200 µg/L) Chlorophyll a certified standards from Turner Designs have one high-level and one low-level concentration. These SRMs are essentially free from chlorophyll b and are diluted with solvents that are free of contaminants that can cause background fluorescence (note that other independently spectrophotometrically verified chlorophyll a standards can be substituted as appropriate – must use same modified Lorenzen equations for calculation of concentration).
1. The Turner Designs certified standards will be shipped in two flame-sealed, foil wrapped glass ampoules; the standards must be stored in the dark and at -20°C until just prior to use.
2. These SRM's are ready to run - break the ampoule, empty contents into 13 mm cuvette,

Revised June 2, 2003 Page 5 of 18
and analyze.
Storage: Store at -20°C and in the dark until just prior to use; minimize time between delivery and analysis of standard. A 24-hr period is optimal although the solution is stable for 2 months (Turner Designs specifications).
2.4.6 Solid Secondary or Check Standards (high and low)
The Turner Designs solid red secondary standards provide a simple and stable alternative to multiple calibrations with a primary standard and replace the use of coproporphyrin solutions as a check standard. Once the instrument is calibrated with a primary standard, the solid secondary standards can be used effectively to check the calibration, with only occasional verification with a primary standard (i.e. Turner Designs SRM). Thus, the solid secondary standards make it simple to check for instrument drift and to perform routine calibration checks. The Turner Designs solid secondary standards are sealed in a single holder that contains two fluorometric standard concentrations: one high-level and one low-level concentration equivalent. The solid secondary standards require no special storage conditions and can be stored in a drawer or on the benchtop. They are not photosensitive or temperature sensitive. Degradation is minimal after years of environmental exposure.
3.0 CALIBRATION
The Turner Designs 700 fluorometer is calibrated following a three-step process. First, the instrument sensitivity is set against a standard of ~80% full scale (200 µg/L). Then a 6-point linear regression calibration for calculating sample concentrations is performed by analyzing the calibration standards prepared in Section 2.4.4. The standards are analyzed using the same procedures used to analyze samples (Section 4.0). This is conducted to ensure the linearity in response of the instrument over the range of calibration that will be used to determine the concentration of actual samples. Once calibrated, the instrument calibration should be stable for at least a year. The stability of the calibration is monitored during the routine analysis of samples by comparing the analysis of the solid check standards to the results obtained for the solid check standards during the initial calibration. The calibration is also verified against a chlorophyll a SRM following calibration and then on an annual basis to ensure the instrument remains in calibration. If the instrument is out of calibration (see Section 3.2), a new 6-point linear regression calibration must be preformed. If the instrument sensitivity settings are ever changed, it is recommended that the entire three-step calibration process be preformed.
3.1 CALIBRATION OF TURNER 700 FLUOROMETER
The following 3-step process should be used for calibration of the TD-700 instrument initially and whenever instrument checks (solid standards) fail to meet the acceptance criteria defined in Section 6.0.
3.1.1 Setting the Instrument Sensitivity
The process of setting the instrument sensitivity is detailed in the Turner Designs Model 700 manual. It is recommended that the manual be consulted prior to conducting the steps that are listed below.
1. Turn on instrument using power button located on the right side of the front of themachine and allow the instrument to warm up for 60 minutes.
2. Press the <ENT> key to move the Home screen to the Setup menu.
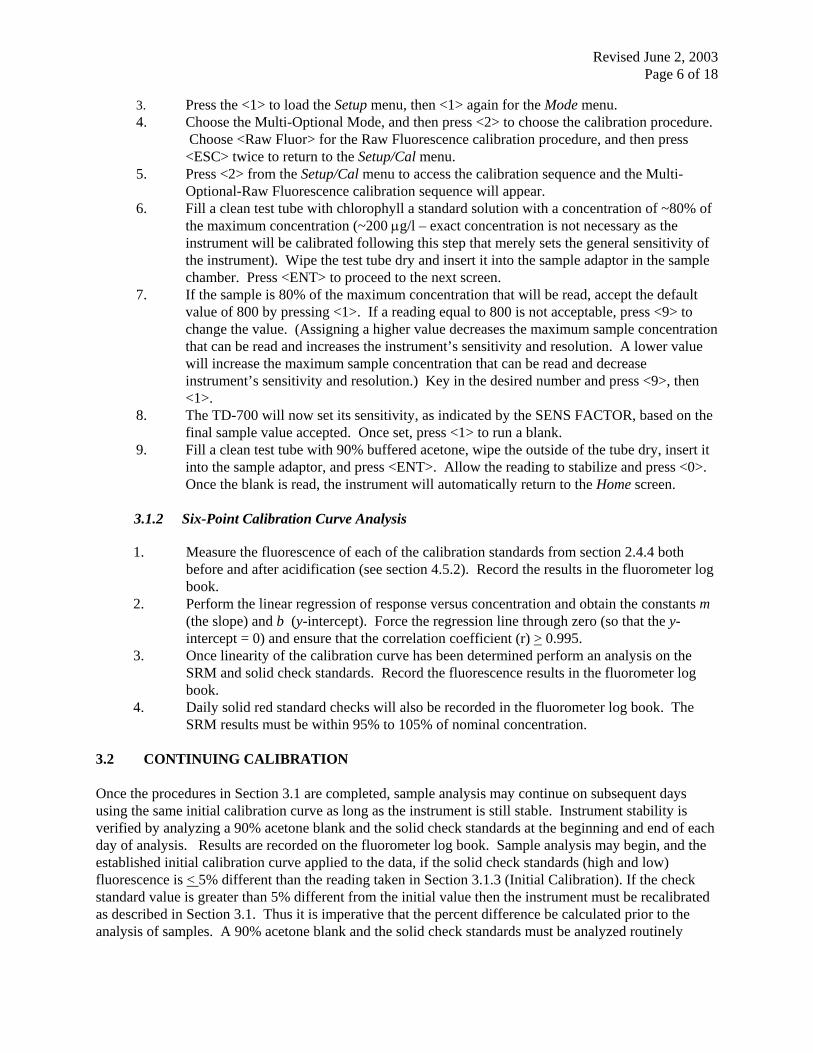
Revised June 2, 2003 Page 6 of 18
3. Press the <1> to load the Setup menu, then <1> again for the Mode menu. 4. Choose the Multi-Optional Mode, and then press <2> to choose the calibration procedure.
Choose <Raw Fluor> for the Raw Fluorescence calibration procedure, and then press <ESC> twice to return to the Setup/Cal menu.
5. Press <2> from the Setup/Cal menu to access the calibration sequence and the Multi-Optional-Raw Fluorescence calibration sequence will appear.
6. Fill a clean test tube with chlorophyll a standard solution with a concentration of ~80% of the maximum concentration (~200 µg/l – exact concentration is not necessary as the instrument will be calibrated following this step that merely sets the general sensitivity of the instrument). Wipe the test tube dry and insert it into the sample adaptor in the sample chamber. Press <ENT> to proceed to the next screen.
7. If the sample is 80% of the maximum concentration that will be read, accept the default value of 800 by pressing <1>. If a reading equal to 800 is not acceptable, press <9> to change the value. (Assigning a higher value decreases the maximum sample concentration that can be read and increases the instrument’s sensitivity and resolution. A lower value will increase the maximum sample concentration that can be read and decrease instrument’s sensitivity and resolution.) Key in the desired number and press <9>, then <1>.
8. The TD-700 will now set its sensitivity, as indicated by the SENS FACTOR, based on the final sample value accepted. Once set, press <1> to run a blank.
9. Fill a clean test tube with 90% buffered acetone, wipe the outside of the tube dry, insert it into the sample adaptor, and press <ENT>. Allow the reading to stabilize and press <0>. Once the blank is read, the instrument will automatically return to the Home screen.
3.1.2 Six-Point Calibration Curve Analysis 1. Measure the fluorescence of each of the calibration standards from section 2.4.4 both
before and after acidification (see section 4.5.2). Record the results in the fluorometer log book.
2. Perform the linear regression of response versus concentration and obtain the constants m (the slope) and b (y-intercept). Force the regression line through zero (so that the y-intercept = 0) and ensure that the correlation coefficient (r) > 0.995.
3. Once linearity of the calibration curve has been determined perform an analysis on the SRM and solid check standards. Record the fluorescence results in the fluorometer log book.
4. Daily solid red standard checks will also be recorded in the fluorometer log book. The SRM results must be within 95% to 105% of nominal concentration.
3.2 CONTINUING CALIBRATION Once the procedures in Section 3.1 are completed, sample analysis may continue on subsequent days using the same initial calibration curve as long as the instrument is still stable. Instrument stability is verified by analyzing a 90% acetone blank and the solid check standards at the beginning and end of each day of analysis. Results are recorded on the fluorometer log book. Sample analysis may begin, and the established initial calibration curve applied to the data, if the solid check standards (high and low) fluorescence is < 5% different than the reading taken in Section 3.1.3 (Initial Calibration). If the check standard value is greater than 5% different from the initial value then the instrument must be recalibrated as described in Section 3.1. Thus it is imperative that the percent difference be calculated prior to the analysis of samples. A 90% acetone blank and the solid check standards must be analyzed routinely
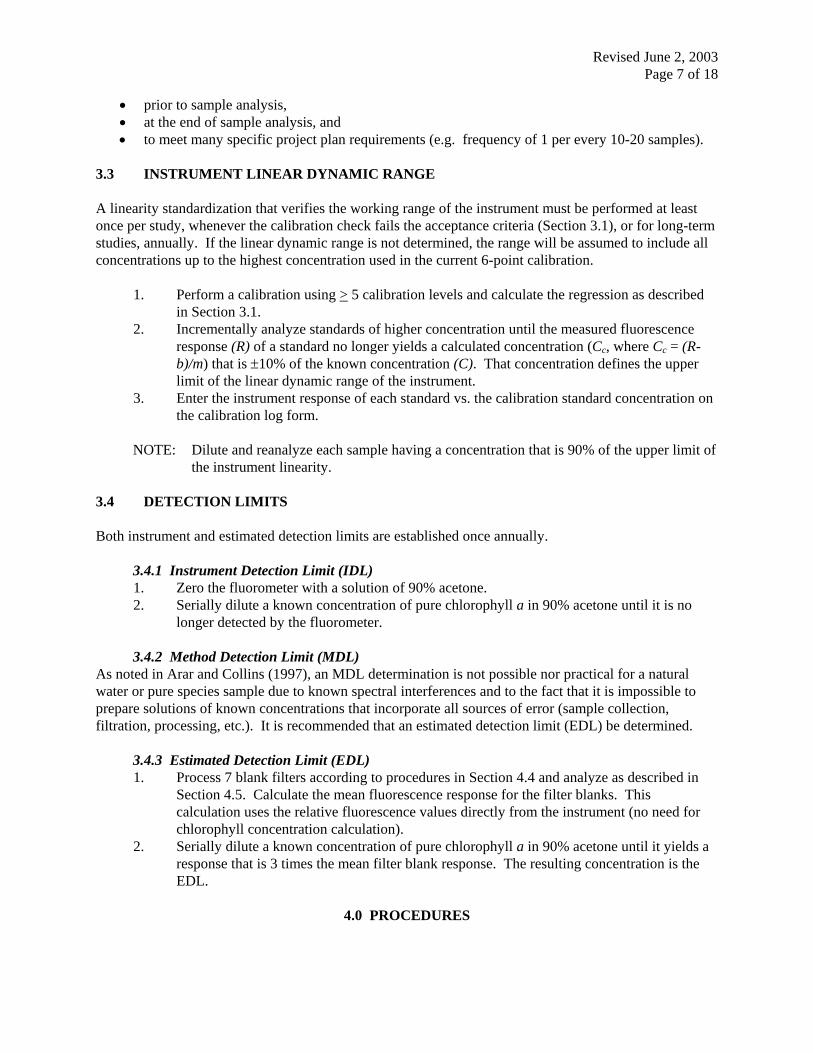
Revised June 2, 2003 Page 7 of 18
• prior to sample analysis,• at the end of sample analysis, and• to meet many specific project plan requirements (e.g. frequency of 1 per every 10-20 samples).
3.3 INSTRUMENT LINEAR DYNAMIC RANGE
A linearity standardization that verifies the working range of the instrument must be performed at least once per study, whenever the calibration check fails the acceptance criteria (Section 3.1), or for long-term studies, annually. If the linear dynamic range is not determined, the range will be assumed to include all concentrations up to the highest concentration used in the current 6-point calibration.
1. Perform a calibration using > 5 calibration levels and calculate the regression as describedin Section 3.1.
2. Incrementally analyze standards of higher concentration until the measured fluorescenceresponse (R) of a standard no longer yields a calculated concentration (Cc, where Cc = (R- b)/m) that is ±10% of the known concentration (C). That concentration defines the upperlimit of the linear dynamic range of the instrument.
3. Enter the instrument response of each standard vs. the calibration standard concentration onthe calibration log form.
NOTE: Dilute and reanalyze each sample having a concentration that is 90% of the upper limit of the instrument linearity.
3.4 DETECTION LIMITS
Both instrument and estimated detection limits are established once annually.
3.4.1 Instrument Detection Limit (IDL) 1. Zero the fluorometer with a solution of 90% acetone.2. Serially dilute a known concentration of pure chlorophyll a in 90% acetone until it is no
longer detected by the fluorometer.
3.4.2 Method Detection Limit (MDL) As noted in Arar and Collins (1997), an MDL determination is not possible nor practical for a natural water or pure species sample due to known spectral interferences and to the fact that it is impossible to prepare solutions of known concentrations that incorporate all sources of error (sample collection, filtration, processing, etc.). It is recommended that an estimated detection limit (EDL) be determined.
3.4.3 Estimated Detection Limit (EDL) 1. Process 7 blank filters according to procedures in Section 4.4 and analyze as described in
Section 4.5. Calculate the mean fluorescence response for the filter blanks. This calculation uses the relative fluorescence values directly from the instrument (no need for chlorophyll concentration calculation).
2. Serially dilute a known concentration of pure chlorophyll a in 90% acetone until it yields aresponse that is 3 times the mean filter blank response. The resulting concentration is the EDL.
4.0 PROCEDURES
Revised June 2, 2003 Page 8 of 18
Personnel who have been trained by a qualified analyst may perform the following analytical procedures. 4.1 SAMPLE COLLECTION AND STORAGE Collect whole water by using either a pumping system or a water sampling bottle (e.g., Niskin or similar bottle). If sample filtration cannot be performed immediately store samples on ice or at 4oC and protect from exposure to light. 4.2 SAMPLE FILTRATION
1. Rinse the filtration unit with DI water and place a 47-mm GF/F filter on the base of the unit. 2. Thoroughly mix the sample by gently inverting it three to five times. Measure a 10 to 200
mL subsample (depending on sample concentration and particulates) with a calibrated pipette or in a graduated cylinder. Rinse the pipette or cylinder between each use.
3. Pour the subsample into the reservoir of the filtration apparatus, add two to ten drops of the magnesium carbonate solution, and apply a vacuum (not to exceed 20 kPa).
4. Do not filter until dry between measured aliquots. NOTE: Final filtration volumes may be designated by the Project Manager or Chief Scientist and are often stipulated in project specific work plans. Filtration volume will depend on the phytoplankton density (and other suspended solids) in the water. In nearshore waters, filter in increments of 10 mL; in open waters, filter in increments of 200 mL. NOTE: Turn off the vacuum pump before filtering to dryness.
5. Fold filter in half using forceps (do not touch the center of the filter), wrap in aluminum foil, and store frozen (-20°C) until extracted. NOTE: Samples must be stored in the dark until analysis.
6. Record the volume filtered on the Sample Collection/Analysis datasheet or if a consistent volume is sampled for a program, the volume can be written directly on the sample label and only deviations from the standard volume recorded on sample or station logs.
Storage: (1) The sample filters can be stored frozen for up to 4 weeks without significant loss of
chlorophyll a. (2) Samples must be stored in dark and store (-20°C) until analysis. 4.3 FIELD FILTER BLANK Prepare a minimum of one blank filter each day that samples are filtered or approximately one (1) filter for every 20 samples processed, and whenever a new lot of filters are used. In the field, remove a glass fiber filter (GF/F) from the storage container, fold, wrap in aluminum foil, and store frozen at -20°C as if it contained a routine sample. 4.4 SAMPLE EXTRACTION Perform the following operations in subdued light.
1. Remove filter from aluminum foil and place in numbered centrifuge tube. Record the
sample code and the tube number on the data sheet. 2. Add 10 – 30 mL of 90% buffered acetone (depending on the estimated chlorophyll
concentration and the filter volume) to each centrifuge tube, cap, and shake tube so that filters are completely submerged in the acetone solution.
Revised June 2, 2003 Page 9 of 18
3. Place all tubes in a light sealed container and store in freezer for 20 to 24 hours, avoiding exposure to light.
4. Field filter blanks are processed identically to the field samples. 4.5 SAMPLE ANALYSIS
4.5.1 Instrument Set-up Perform the following in subdued light:
1. Turn on instrument and allow 30 to 60 minutes to warm up. 2. Fill a clean cuvette with the 90% acetone solvent solution that is used for sample
extractions. Dry and place the cuvette into the fluorometer. 3. Press <*> to read value (this initiates the discrete sample analysis timer – set to have a 7
second delay and then a 12 second averaging period). 4. Record the meter reading in the fluorometer log book. 5. Place the solid red check standard into the instrument with the letter “L” (etched on top of
the solid standard holder) on the left hand side. Make sure that the metal pin is completely seated in the notches of the 13 mm round cuvette holder. Press <*> to read the value.
6. Record the meter reading in the fluorometer log book. 7. Pull solid standard out and rotate 180°, and reinsert with the letter “H” on the left hand side.
Make sure that the metal pin is completely seated in the notches of the 13 mm round cuvette holder.
8. Press <*> to read value. 9. Record the meter reading on the Check Standard Calibration Log Form. 10. Repeat blank and solid check standard readings at the end of the day (additional readings
may be required by individual projects, e.g. following every 10 or 20 samples).
4.5.2 Sample Analysis Perform the following procedure in subdued light.
1. Centrifuge samples for 5 minutes (making sure centrifuge is balanced) at setting 5 in an International Equipment Company clinical centrifuge. Following centrifuging, allow samples to warm to room temperature (keep centrifuge tubes capped until analysis).
2. After centrifuging, decant supernatant into a clean large test tube, cover with Parafilm and invert 5 times.
3. Fill a smaller test tube with the extract, dry, and clean the test tube of all fingerprints, etc., and insert into instrument.
4. Press “*” once the reading has begun to stabilize (~ 30 seconds), this will initiate the discrete sample averaging sequence. During the delay period “DELAY” will appear in the upper right hand corner of the display. This will change to “AVE” during the averaging period and then “DONE” when it is finished. The reading will freeze for 5 seconds once it is “DONE”. Record the meter reading on the Sample Collection/Analysis Log Form.
5. All samples must be analyzed within the calibrated range of the instrument. If the relative fluorescence value for any sample is higher than the highest standard then dilute the sample and reanalyze.
6. Add 1 drop of 0.6 N HCl acid. The instrument reading should drop rapidly after acidification wait until it stabilizes (~90 seconds) before hitting “*” to take the after acidification reading.
Revised June 2, 2003 Page 10 of 18
7. Record the instrument reading on the Sample Collection/Analysis Log Form.
5.0 CALCULATIONS
5.1 CALIBRATION FACTORS
The calibration factors (Fs and r) are calculated as the slopes of linear regressions between standard concentrations, fluorescence before acidification (Rb), and fluorescence after acidification (Ra). Load the standard concentrations, Rb and Ra values into an excel spreadsheet (a template has been developed) and calculate the calibration factors as:
Fs = response factor = slope of regression of concentrations versus Rb r = ratio of Rb and Ra = slope of regression of Rb versus Ra
This is similar to the method used to calibrate the older analog fluorometer, where shutter specific Fs and r would be calculated based on single calibration points (i.e. Fs=Concentration/Rb and r=Rb/Ra). The Turner Designs Model 700 is a digital fluorometer that allows for a wide-range of concentrations to be measured at one sensitivity setting (i.e. no changing shutters). This allows for the calculation of calibration factors based on a single point or multiple points. In order to increase confidence and accuracy of the calibration, it is recommended that a multiple point (6) regression be used to calculate the calibration factors as described herein.
5.2 CORRECTED CHLOROPHYLL a AND PHAEOPHYTIN a (µg/L)
Calculate the uncorrected chlorophyll a (chl ae) and phaeophytin a (pha ae) concentrations (µg/L) in the sample extract as follows:
chl ae (µg/L) = Fs (r / r-1) (Rb - Ra)
pha ae (µg/L) = Fs (r / r-1) (rRa - Rb) where,
Fs = response factor for the calibration standard used. Rb = fluorescence of sample extract before acidification. Ra = fluorescence of sample extract after acidification. r = before-to-after acidification ratio of pure chlorophyll a solution.
These calculations are performed in a spreadsheet once the raw data and new calibration data are entered. The spreadsheet also calculates the volume corrected chlorophyll a (chl ae) and phaeophytin a (pha ae) concentrations (µg/L) for the sample (i.e., concentration in nature) as follows:
chl ae = (chl ae X e) / V
pha as = (pha ae X e) / V where,
V = volume (mL) filtered e = extraction volume (mL)
Perform all calculations values in a spreadsheet.
Revised June 2, 2003 Page 11 of 18
5.3 PERCENT DIFFERENCE Calculate the percent difference between the initial and continuing readings of the solid check standards and SRM as follows:
% Difference = [(Initial reading - continuing check reading)/ Initial reading] X 100
6.0 QUALITY CONTROL The project work plan will define the quality control requirements for specific projects. General guidance is provided in this section. 6.1 FIELD FILTER BLANKS (FFB)
1. Prepare a minimum of one blank filter each day that samples are filtered or approximately one (1) filtered for every 20 samples processed, and whenever a new lot of filters are used.
2. Calculate the average "concentration" of the filter blanks. If the blank average ≥10% of the sample values (batch average), measure ten additional filter blanks from a particular batch of filters.
3. The project work plan must define whether the filter blank value will be subtracted from the field sample data or only reported with the data.
6.2 LABORATORY ANALYSIS DUPLICATES
Laboratory analysis duplicates are prepared by splitting the extract from a single filter into separate aliquots and measuring response separately.
1. Analyze a minimum of one duplicate sample with every batch of ≤20 samples. 2. Calculate the relative percent difference (RPD) of uncorrected values of chlorophyll a. 3. Reanalyze the batch of samples if the chlorophyll RPD exceeds 15% for samples that are
approximately 10X the instrument detection limit. (The RPD for phaeophytin a might typically range from 10% to 50%.)
RPD = [(C1 - C2)/ (C1 + C2)]200 6.3 FIELD DUPLICATES
It is recommended that a minimum of one field duplicate is collected and processed in the field with every 20 samples. The RPD for field duplicates should be within 50%. 6.4 CHECK STANDARDS The solid check standards must be analyzed at the start and end of each day of analysis (additional measurements may be required by individual project plans – i.e. once every 10 or 20 samples). For most projects, it is expected that both high and low solid check standards will be analyzed, but specific project requirements may use only one depending on the range of chlorophyll a concentrations that are analyzed (i.e. in oligotrophic waters the fluorometer may be calibrated at a higher sensitivity (lower concentrations) and the high solid check standard would not be applicable). The solid check standard (high and low)

Revised June 2, 2003 Page 12 of 18
fluorescence must be < 5% RPD of the initial reading measured during instrument calibration. If a check standard value is greater than 5% different from the initial value then the instrument must be recalibrated as described in Section 3.1.
6.5 STANDARD REFERENCE MATERIAL
It is also recommended that independently verified chlorophyll standards or standard reference material (SRM; e.g. Turner Designs certified standards) be analyzed at least once per year (more often if specified by project requirements) to ensure that the instrument is in calibration. The SRM (high and low) fluorescence must be < 5% of the nominal concentrations. The SRM will be analyzed following calibration of the instrument as verification of the calibration, and then at least annually to check stability of the calibration. If the SRM value is greater than 5% different from nominal then the instrument must be recalibrated as described in Section 3.1. Normally both the low and high SRM concentrations will be analyzed unless project specific chlorophyll a concentration ranges exclude the high SRM value (i.e. focused on lower concentration range).
7.0 INSTRUMENT MAINTENANCE
The Turner Designs Model 700 fluorometer is a durable instrument that requires minimal maintenance. However, in order to ensure the proper operation of the instrument, a few simple checks and cleaning procedures will be performed if the instrument fails to calibrate.
1. Remove the cover to the sample compartment and verify that the compartment is dry and allcomponents, including the filters, lamp, and electronics, are clean.
2. If the compartment and components are not clean, perform the following procedures.a) Wash the filters with soap and water, rinse thoroughly with tap water followed by DI
water, and dry using a lint-free wipe.b) Clean bulb using a lint-free wipe.c) Insert fresh desiccant packets to the filter chamber if necessary. This will minimize
fogging of the filters and optics.3. Replace lamps and filters as needed.4. Check sample test tubes for scratches, dirt, etc., and determine if they match optically (i.e.,
giving the same fluorescence reading within ±5%. If the cuvettes do not match, select onlyone and use it throughout the entire analytical process.
Record all maintenance activities on the Instrument History Record Form (Attachment 1) maintained in the instrument maintenance log. If any instrument optical components are cleaned or replaced the instrument must be recalibrated.
8.0 TRAINING
A Certificate of Training (Attachment 2) will be issued to the trainee once proficiency of this procedure is demonstrated. The original certificate will be maintained in Quality Assurance Unit.
Before beginning training on instrument operation and calibration and sample extraction and analysis, the trainee will read this SOP in entirety and several sections of the instrument manual that are essential for instrument operation.

Revised June 2, 2003 Page 13 of 18
8.1 INSTRUMENT OPERATION AND CALIBRATION
Individuals assigned to operate the Turner Designs Model 700 fluorometer must be supervised and trained in the procedures for calibrating and operating the instrument. Personnel performing these procedures must demonstrate proficiency in the following activities.
1. Preparing chlorophyll standards for the initial calibration (> 5 levels). 2. Determining the linearity of the initial calibration. 3. Setting up the instrument. 4. Running calibration standards, check standards, and samples.
Personnel will be certified to operate the instrument without supervision when they have successfully performed the above operations three times without instruction. Training on calibrations should only be preformed when a new calibration is necessary. Optional training on calibration of the instrument should include all aspects of calibration (making standards, running them on the instrument, calculating calibration factors, etc.), EXCEPT setting the instrument sensitivity and the initial two-point instrument calibration. These two steps should only be conducted when necessary (i.e. change optics components, replace lamp or photomultiplier tube, sensitivity adjustment changed for other methods). 8.2 EXTRACTION AND ANALYSIS Individuals performing analyses according to this SOP must be supervised and trained by qualified technical staff. Personnel performing this method for the first time should demonstrate proficiency in the extraction of sample filters. (20 to 30 natural samples should be collected.) A set of 10 or more samples should be extracted and analyzed according to this procedure. The relative standard deviation (RSD) of uncorrected values of chlorophyll a should not exceed 15% for samples that are approximately 10X instrument detection limit. (The RSD for phaeophytin a might typically range from 10% to 50%.)
9.0 SAFETY
Safety considerations are noted throughout this SOP. 9.1 PERSONAL PROTECTION
Safety glasses, lab coats, and disposable polyethylene gloves must be worn during all laboratory operations (sample collection, filtration, extraction, and analysis). 9.2 SAMPLE STORAGE
1. Store sample filters at -20°C and in the dark as soon as possible after sample collection; short-term storage on ice is acceptable for no more than 4 h. Filters may be stored frozen for up to 4 weeks without significant loss of chlorophyll a.
2. Store extracted samples in the dark, or at a minimum in subdued light, until analyzed. Approximately 25 to 50 samples can be extracted and analyzed in an 8-hour day. Once a sample is extracted, the extract must be analyzed within 24 hours.
9.3 WASTE HANDLING AND DISPOSAL

Revised June 2, 2003 Page 14 of 18
All laboratory waste containing acetone or HCl must be handled and disposed of according to Safety and Risk Management guidelines.
ATTACHMENTS
1. Instrument History Record Form2. Certificate of Training
Revised June 2, 2003 Page 15 of 18
APPROVALS Author
Technical Reviewer
Quality Systems Manager
Signature Date
Revised June 2, 2003 Page 16 of 18
ATTACHMENT 1
Instrument History Record Form
Turner Designs Model-10-AU Fluorometer
Date of Action Description of Maintenance Performed and Results Performed by
Start End
Revised June 2, 2003 Page 17 of 18
ATTACHMENT 2
CERTIFICATE OF TRAINING
SOP No. 5-265-05
SOP Title: Extraction and Analysis of Chlorophyll a and Phaeophytin a in Seawater Using a Turner Model 10-AU Fluorometer
Trainee:_____________________________________________________
Instructor:____________________________________________________
Date Training Completed (Date/Instructor's Initials):
SOP Read:____________________
Instrument Operation and Calibration:______________________
Extraction and Analysis:______________________
Comments:
The above mentioned trainee has satisfactorily completed the training requirements associated with this SOP. Supporting documentation (if needed) is attached.
Approved by:________________________________________________
Date:_________________

Revised June 2, 2003 Page 18 of 18
X-Sender: [email protected] Date: Thu, 13 Nov 2003 10:45:38 -0500 To: "Mickelson, Mike" <[email protected]>, Candace Oviatt <[email protected]>, [email protected], Brooke Longval <[email protected]> From: Kim Whitman <[email protected]> Subject: Re: URI chlorophyll spectrophotometer. Mime-Version: 1.0
Mike,
I finally found the reference to the spectrophotometer equation we use. The 664 nm- 647 nm is in Jeffrey and Humphrey (1975). The equation is good for higher plants and green algae containing chlorophylls a and b and compare well to SCOR-Unesco or Parsons-Strickland with 1-3% error (comparison done by Lorenzen and Jeffrey (1980)).
Jeffrey, S.W. and Humphrey, G. F. 1975. New Spectrophotometric equations for determining chlorophylls a, b, c1 and c2 in higher plants, algae, and natural phytoplankton. Biochem. Physiol. Pflanz. 167: 191-194.
Lorenzen, C. J. and S. W. Jeffrey. 1980. Determination of chlorophyll in seawater. Report of inte-rcalibration tests. UNESCO Technical Papers in Marine Science No. 35. UNESCO, Paris. 20 pp.
The equation we use has been the same for more than 20 years (note I have only been here just over 3 years). I am going to have one our technicians search the older and more recent literature concerning spectrophotometer equations etc. and go through some of MERL's procedural notes concerning chlorophyll calculations. She is busy, so it may take her a little while to compile all of the information. I tried to answer your questions below, but I was unclear as to what you were referring to in the second question.
Kim
Question: When you use your chlorophyll spectrophotometer equation, do you subtract absorbance at 750nm? I don't see that on your xls file. No, the equation I was given did not include the correction for turbidity (subtraction at 750nm). However, turbidity has a stronger influence at lower wavelengths.
Question: Do you see any equations on the Turner Designs calibration sheets? What calibration sheets are you referring to?
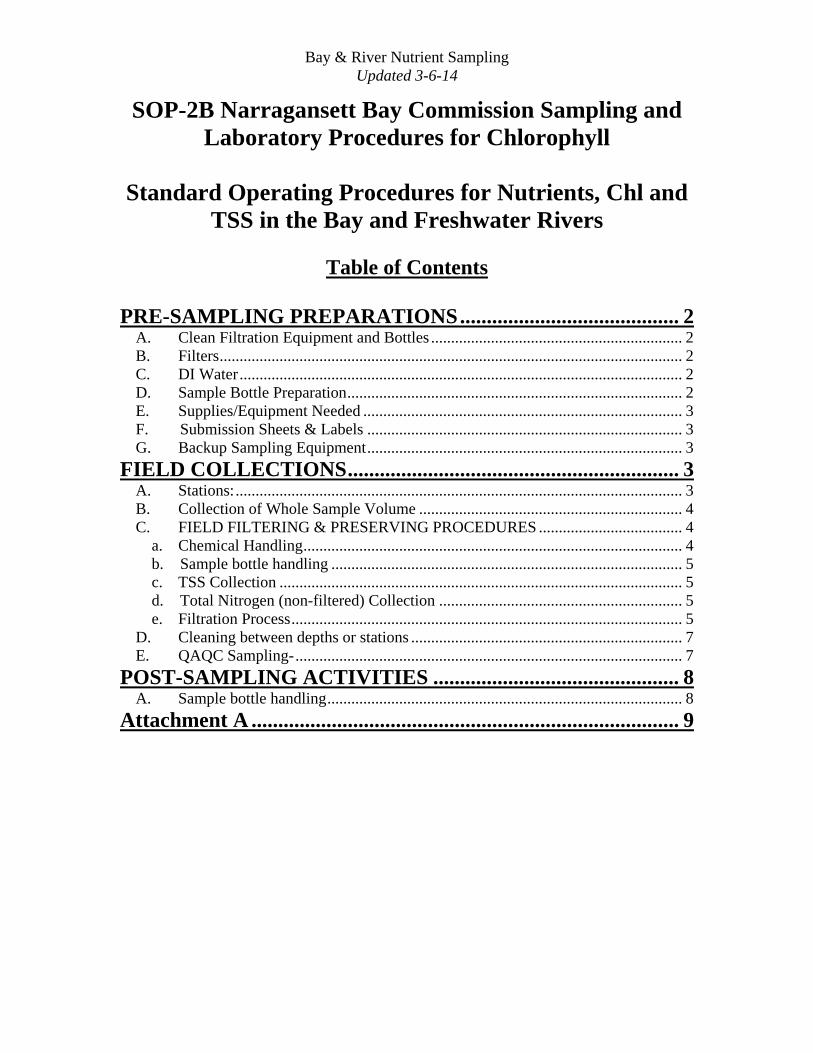
Bay & River Nutrient Sampling Updated 3-6-14
SOP-2B Narragansett Bay Commission Sampling and Laboratory Procedures for Chlorophyll
Standard Operating Procedures for Nutrients, Chl and TSS in the Bay and Freshwater Rivers
Table of Contents
PRE-SAMPLING PREPARATIONS ......................................... 2A. Clean Filtration Equipment and Bottles ............................................................... 2 B. Filters .................................................................................................................... 2 C. DI Water ............................................................................................................... 2 D. Sample Bottle Preparation .................................................................................... 2 E. Supplies/Equipment Needed ................................................................................ 3 F. Submission Sheets & Labels ............................................................................... 3 G. Backup Sampling Equipment ............................................................................... 3
FIELD COLLECTIONS .............................................................. 3A. Stations: ................................................................................................................ 3 B. Collection of Whole Sample Volume .................................................................. 4 C. FIELD FILTERING & PRESERVING PROCEDURES .................................... 4
a. Chemical Handling ............................................................................................... 4b. Sample bottle handling ........................................................................................ 5c. TSS Collection ..................................................................................................... 5d. Total Nitrogen (non-filtered) Collection ............................................................. 5e. Filtration Process .................................................................................................. 5
D. Cleaning between depths or stations .................................................................... 7 E. QAQC Sampling- ................................................................................................. 7
POST-SAMPLING ACTIVITIES .............................................. 8A. Sample bottle handling ......................................................................................... 8
Attachment A ................................................................................ 9
Bay & River Nutrient Sampling Updated 3-6-14
PRE-SAMPLING PREPARATIONS
A. Clean Filtration Equipment and Bottles a. BE SURE TO USE GLOVES DURING ALL CLEANING PROCEDURES
AND HANDLING OF EQUIPMENTb. Acid wash all carboys and containers in 10% HCl and then soak in 10% HCL
for 24 to 48 hours, then rinse in DI until pH returns to pre- acidified DI levelsand store with DI. Acid rinse, then DI rinse the plastic chlorophyll filteringdevices.
c. Between sampling days, suction and pump tubings are flushed with non-phosphate detergent, 10% HCl and then DI sufficient volume until pH returnsto normal DI value, and then bagged into clean bags
d. Be sure filtration equipment is stored in a manner that prevents contamination(all should be covered with plastic).
B. Filters a. Use 0.45 micron pore size in-line GW filters for dissolved nutrient filtering
(Dissolved Nutrients…NO2, NO3, TDN, OrthoPhos, Silicate)b. Use 0.7 um pore size 47 mm diameter TCLP GF/F filters for chlorophyll
filtering. Using gloves and clean tweezers, place these in cleaned filterapparatus day before sampling. There is 1 filter apparatus to use at allstations.
C. DI Water a. Bring 2, 4- Liter acid-cleaned bottles of DI into field for blankb. Fill two HCL-cleaned squirt bottles with DI for rinsing filtration equipment.
D. Sample Bottle Preparation a. Bottles needed per station:
• 1 – 1 Liter bottle for initial sample collection• 4 – 125 mL clear plastic bottles (for nutrient collection)• 1 - 125 mL brown plastic bottle (for dissolved ammonia collection)• 1 – 250 mL bottle (for TSS collection)
b. 1 to 2 complete extra station sets of bottles in case of contamination ormishap.
c. Bottles needed for QA/QC procedures:• Field Blanks- 5 - 125 mL plastic bottles (4 clear, 1 brown), 1 – 250
mL TSS bottle• Duplicates- 5 - 125 mL plastic bottles (4 clear, 1 brown), 1 – 250 mL
TSS bottle• Equipment Blanks (when determined necessary)- 5– 125 mL plastic
bottles (4 clear, 1 brown)
Bay & River Nutrient Sampling Updated 3-6-14
d. Make sure all bottles are kept closed until collection of sample
E. Supplies/Equipment Needed a. Use prepared list for River Nutrient Sampling and Bay Nutrient Sampling
located in this SOP folder.
F. Submission Sheets & Labels a. Print out submission sheets day before.b. Ask EMDA Clerk to print out labels 1-2 days ahead
G. Backup Sampling Equipment c. Whenever feasible, backup equipment should be taken in the field for use in
the event of problems with sampling gear, such as a water pump failure. Thefollowing is a list of suggested equipment that should be available if problemsoccur:
• Backup water pump system (if available)• Backup filtration apparatuses• Spare batteries to run pump unit
FIELD COLLECTIONS It is important to remember to keep all containers closed until immediately before filling. Do not use any container that appears dirty, or appears to have been previously used. Be sure to place bottles and caps on a clean surface or hold with gloves.
A. Stations: RIVER STATIONS a. Pawtuxet River @ Terminal Falls- Off Broad Street near bridge at last falls
before entering Bay, take from Bridge.b. Woonasquatucket River @ Valley Street- At Donigian Park just upstream
of Valley Streetc. Moshassuck River @ Mill Street- Mill Street, from bridge.d. Blackstone River @ Slater Mill- Across from Slater Mill. Take Exit 28 off
of I-95, School St. exit, take a left at end of exit, toward Visitors Center,follow road until see Apex Tire & Auto on right, pull into this parking lot andpark there, walk across street toward river, take sample upstream of waterfalland as far away from the wall as possible.
e. Woonasquatucket River @ Manton Avenue- Same as fecal samplinglocation S-9
f. Moshassuck River @ Higginson Avenue- Same as fecal sampling locationS-1
Bay & River Nutrient Sampling Updated 3-6-14
g. Blackstone River @ Stateline–h. Blackstone River @ Rte 116 Bike Path-i. Woonasquatucket River @ Esmond Mill Rd, Smithfield- j. Ten Mile River @ Outlet of Omega Pond- k. Ten Mile River @ Central Ave- l. Runnins River @ River Road on RI-MA Border- m. Palmer River @ Old Providence Rd, Swansea- n. Lee's River @ Rt. 6, Swansea- o. Warren Reservoir/Kickemuit River- p. Coles River @ Milford Rd, Swansea- q. Taunton River @ Berkley Bridge-
BAY STATIONS
Station Name Station Location
Latitude (N) Longitude (W) Conimicut Point (2005-9/5/06) 41°43.434 71° 21.226
Conimicut Point (9/6/06-present) 41° 43.340 71° 21.288
Edgewood Yacht Club 41°46.603 71° 23.061 Pomham Rocks 41°46.477 71° 22.404 India Point Park 41°43.421 71° 21.239 Phillipsdale Landing 41° 50.597 71° 22.308 Bullock's Reach Buoy 41° 43.976 71° 22.201 Pawtuxet at Red Can
B. Collection of Whole Sample Volume a. Using the peristaltic pump and clean tubing, lower suction tube to proper
depth (just below surface for rivers, 0.5-1 meter for bay surface collectionsand approx 1 meter above bottom for bay bottom collections) and pumpforward until tubing is flushed with 3 times the volume of the tubing ( seeAttachment A for calculation).
b. Make sure river sample is from as close to mid-stream as possible.c. Then fill and discard a 500 mL rinse of whole sample into the 1-liter sample
bottle after agitation.d. Fill a second time, cap bottle and bring to work-bench area.
C. FIELD FILTERING & PRESERVING PROCEDURES a. Chemical Handling - Review the dangers and take all needed safety
precautions in order to use the needed preservatives for chlorophyll and NBClab ammonium samples in the lab. In both cases, minimum volumes, i.e. drops,
Bay & River Nutrient Sampling Updated 3-6-14
will be added to particulate matter for chlorophyll and filtrate for ammonium. Use syringes or pipettes, in both cases, to apply the solutions. The chloroform needs to be added after the bottle is rinsed with filtrate, which the general sampling SOP requires.
b. Sample bottle handling • Be sure when removing caps of sample bottles to hold or place face
down when off of bottle so as not to contaminate with anything in the air.
• Pre-label all bottles. Each site (a field blank should be considered a site with the same number of bottles) should have:
1. 1-filtered TNIT (total dissolved nitrogen) - FROZEN, 2. 1-filtered TNIT NF (total nitrogen) - FROZEN, 3. 1-filtered for Nitrite, Nitrate, Orthophosphate - FROZEN, 4. 1-filtered for Silicate –FROZEN, 5. 1-filtered for Ammonia (add chloroform preservative for
BAY samples; in brown bottle) – REFRIGERATED 6. 1-non-filtered for TSS (250 mL bottle) – REFRIGERATED
c. TSS Collection 1. Pour off approximately 200 mL of unfiltered sample water into
250 mL plastic TSS bottle. Label bottle correctly and place in cooler with ice.
d. Total Nitrogen (non-filtered) Collection 2. Pour a very small amount of sample water into TN NF 125 mL
bottle. Cap bottle, shake and pour liquid out. Repeat this 1-2 more times.
3. Pour off unfiltered sample water to fill 125 mL plastic bottle about ¾ full. Label bottle correctly and place in cooler with ice.
e. Filtration Process
Chlorophyll (for Bay samples only) • This process involves using a syringe to push sample water through
a filter. The substance to be analyzed is then left on the filter and the remaining filtered water can be discarded. The only thing needed for this analysis is the glass fiber filter.
1. Prepare cleaned filter apparatus in holder set-up with
chlorophyll GF/F, 0.7 um, 47 mm diameter filter. (It is best to prepare filter apparatus before going out, with filter already in place.)
Bay & River Nutrient Sampling Updated 3-6-14
a. Filter and inside of filter apparatus should not be touched. Tweezers should be used in ALL handling of filters.
2. After agitating water to mix, pull up about 20 mL sample water into disposable plastic 60 mL syringe from initial sample water container. Rinse syringe by shaking water inside it and then dispensing water into “waste” container. Repeat this two times.
3. Pull up exactly 50 mL of sample water into syringe. Attach syringe to filter apparatus. Slowly push water through filter and into extra bottle. If water went through filter relatively easily try to filter another 50 mL of sample water through without pushing water too hard. Stop if filtering becomes too difficult.
4. If volume is different than 100 ml, record volume filtered onto label and submission sheet along with other needed information.
5. Gently agitate Magnesium Carbonate solution in small brown bottle. Fill small plastic disposable pipet with a little bit of the MgCO3 solution.
6. Remove 60 mL syringe from filter apparatus and take off top of filter apparatus so top of filter is exposed. Place 3-5 drops of MgCO3 around filter. Rinse pipet with small amount of DI water and place in plastic bag for reuse.
7. Using two pair of tweezers carefully fold filter in half and place into plastic Petri dish. Label dish with any needed info with sharpie (i.e. if volume is something other than 100 ml). Wrap in aluminum foil and place in whirl pack bag with LIMS label and then into a dark jar/bag in cooler.
8. Rinse syringe and filter apparatus with DI water if reusing (see rinsing procedures).
Dissolved Nutrients Remaining water in original sample bottle will be used for filtration into 125 mL bottles for dissolved nutrients. The filter can be discarded after filtration at each station. 4. Prepare clean in-line filtration set up with 0.45 micron GW in-
line filters and peristaltic pump. 5. Cap bottle of sample water and slowly invert bottle a couple of
times. This is to keep water mixed, before drawing water with pump.
6. Place clean tubing down into center of sample collection bottle and begin pumping sample water from original sample container into each dissolved nutrients bottle.
Bay & River Nutrient Sampling Updated 3-6-14
7. Pump a small amount of water into final nutrients bottle. Then cap bottle, shake and empty contents out to rinse the bottle with sample water. Repeat 1-2 times.
8. Fill bottle approximately ¾ full (unless it is for URI, then only ½ full) with filtered sample water. Use brown bottle for ammonia.
9. Place label on bottles with date, time and initials. 10. FOR BAY SAMPLES ONLY- (freshwater river samples to do
not get chloroform): Place approximately 3 drops of chloroform into ammonia bottle, cap and invert for preservation.
11. Make sure LIMS numbers correlate correctly from submission sheet to bottle and sufficient notes are recorded on sheet to decipher the type of sample it is (ex. bottom or surface, type of filter if necessary, etc)
12. Place all bottles in cooler with several ice packs. 13. Replace in-line filter with each new sample location.
D. Cleaning between depths or stations a. Use clean gloves during all handling of equipment. b. Raise suction tubing immediately after filling whole sample volume bottle and
pump DI through the tubing 3 times, in order to fully rinse the entire area of the tubing 3 times (use calculation in Attachment A if necessary).
c. Turn off pump and place suction tube in clean bag until next site. d. (for Bay Sampling only) Use new syringe at each station or depth if possible.
Rinse all syringes with DI prior to use. e. (for Bay Sampling only) Disassemble chlorophyll filter holder, submerge and
gently agitate parts in DI 4 liter carboy, only partially filled, for this purpose. Place Eco Funnel strainer on top of carboy and pour out DI water with filter holders, tweezers, etc. into it. Then use DI squeeze bottle to clean each part, reassemble and place on new filters, to ready for next station.
E. QAQC Sampling-
a. Field Blanks • The procedure for collecting a field blank consists of transporting
sufficient DI water into the field and collecting a sample using identical sampling, filtering, and preserving procedures (if applicable) as described under sampling procedures above.
1. After all station samples have been collected, use the DI water
as if it were the sample water from another location by filling the collection bottle with DI water, using whatever method is used at the regular sites (i.e. If pump and tubing are used to fill
Bay & River Nutrient Sampling Updated 3-6-14
the sample containers, then use pump and tubing to pump DI into the same kind of sample container for the field blank).
2. This water will then be filtered or collected just as each of the regular samples are done.
b. Duplicates
• Duplicate samples shall be collected as determined by the project managers. Approximately 10 percent of all samples collected shall be quality control samples.
1. This consists of collecting double the amount of sample water
and following the procedures twice that were outlined above in Step C: Field Filtering & Preserving Procedures, therefore processing 2 sets of samples for one sample location.
c. Equipment Blanks (in EMDA lab)
• Equipment Blank samples shall be collected as determined by the project managers. Approximately 10 percent of all samples collected shall be quality control samples.
1. These consist of filling normally process-cleaned 125-mL
bottles with DI water
2. Additional tests may be requested based on information needed for QA Protocol Development.
POST-SAMPLING ACTIVITIES A. Sample bottle handling-
a. Once all sample bottles are brought back to the NBC, TSS bottles of sample volume should be brought to the NBC laboratory for processing immediately if laboratory personnel are still available. If all labeling and submission sheets have been double checked, then bring all samples including nutrient bottles to lab for analyses. If there is a need to store samples in the EMDA lab overnight, all will be frozen except samples preserved with chloroform for ammonia and TSS samples.
B. Place all equipment/boxes in the Nutrient Sampling area in the back of the EMDA
lab in proper place. Discard of any trash. C. Begin washing/rinsing process with all bottles and equipment needed for future
nutrient sampling if time allows.
Bay & River Nutrient Sampling Updated 3-6-14
Attachment A Hose Clearing Times: It is imperative that sufficient hose clearing time be allowed to ensure the hose is fully rinsed with DI and the water being sampled is obtained from the intended depth. There are two ways to determine how much water must pass through the hose:
• Air Plug method:
1. Turn the pump on with the draw end of the hose above the water surface to place air into the hose.
2. Turn off the pump and lower the hose to the sample depth. 3. Turn on the pump and watch for the air to completely exit the
hose then begin sampling.
• Calculated clearing times: 1. Each time a new hose or pump is installed, a clearing time can
be calculated in the following manner to ensure there is sufficient waiting time to clear the hose:
a. Calculate the volume of the hose in gallons: (r/12)2 *
3.14 * L * 7.48 = V, Where r = radius (inches) of hose inner diameter L = length (feet) of hose V = volume (gallons)
b. Determine pump capacity (gallons per minute pumped) from the pump specifications.
c. Calculate time to flush hose: V/(gpm) = time, where
Gpm = gallons per minute pumped Time = minutes to flush hose
d. Multiply the time by 1.25 as a minimum clearing time
for the hose.
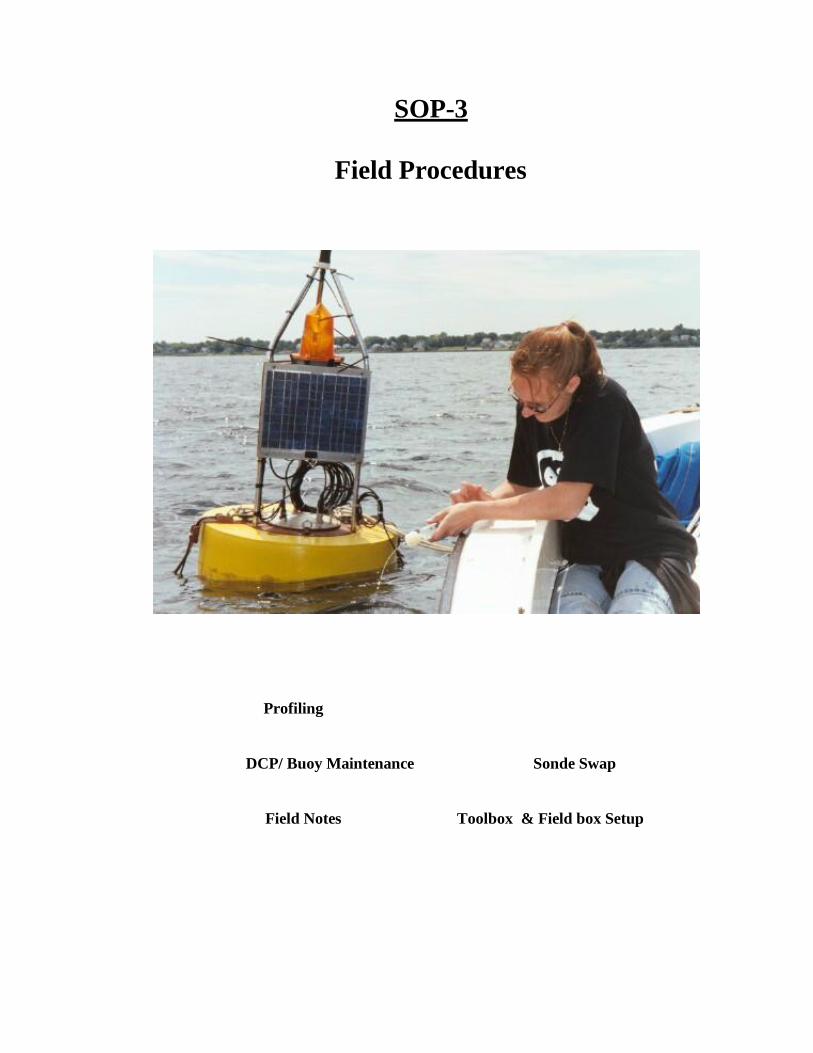
SOP-3
Field Procedures
Profiling
DCP/ Buoy Maintenance Sonde Swap
Field Notes Toolbox & Field box Setup
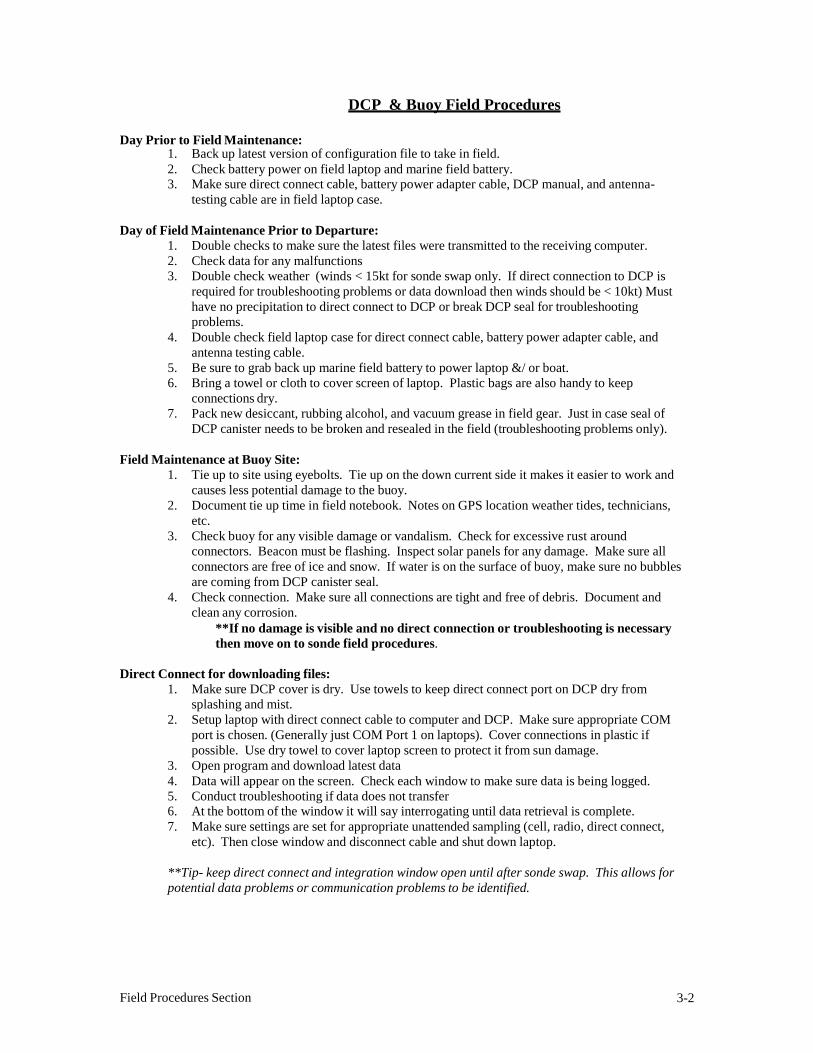
DCP & Buoy Field Procedures
Day Prior to Field Maintenance: 1. Back up latest version of configuration file to take in field.2. Check battery power on field laptop and marine field battery.3. Make sure direct connect cable, battery power adapter cable, DCP manual, and antenna-
testing cable are in field laptop case.
Day of Field Maintenance Prior to Departure: 1. Double checks to make sure the latest files were transmitted to the receiving computer.2. Check data for any malfunctions3. Double check weather (winds < 15kt for sonde swap only. If direct connection to DCP is
required for troubleshooting problems or data download then winds should be < 10kt) Musthave no precipitation to direct connect to DCP or break DCP seal for troubleshootingproblems.
4. Double check field laptop case for direct connect cable, battery power adapter cable, andantenna testing cable.
5. Be sure to grab back up marine field battery to power laptop &/ or boat.6. Bring a towel or cloth to cover screen of laptop. Plastic bags are also handy to keep
connections dry.7. Pack new desiccant, rubbing alcohol, and vacuum grease in field gear. Just in case seal of
DCP canister needs to be broken and resealed in the field (troubleshooting problems only).
Field Maintenance at Buoy Site: 1. Tie up to site using eyebolts. Tie up on the down current side it makes it easier to work and
causes less potential damage to the buoy.2. Document tie up time in field notebook. Notes on GPS location weather tides, technicians,
etc.3. Check buoy for any visible damage or vandalism. Check for excessive rust around
connectors. Beacon must be flashing. Inspect solar panels for any damage. Make sure allconnectors are free of ice and snow. If water is on the surface of buoy, make sure no bubblesare coming from DCP canister seal.
4. Check connection. Make sure all connections are tight and free of debris. Document andclean any corrosion.
**If no damage is visible and no direct connection or troubleshooting is necessary then move on to sonde field procedures.
Direct Connect for downloading files: 1. Make sure DCP cover is dry. Use towels to keep direct connect port on DCP dry from
splashing and mist.2. Setup laptop with direct connect cable to computer and DCP. Make sure appropriate COM
port is chosen. (Generally just COM Port 1 on laptops). Cover connections in plastic ifpossible. Use dry towel to cover laptop screen to protect it from sun damage.
3. Open program and download latest data4. Data will appear on the screen. Check each window to make sure data is being logged.5. Conduct troubleshooting if data does not transfer6. At the bottom of the window it will say interrogating until data retrieval is complete.7. Make sure settings are set for appropriate unattended sampling (cell, radio, direct connect,
etc). Then close window and disconnect cable and shut down laptop.
**Tip- keep direct connect and integration window open until after sonde swap. This allows for potential data problems or communication problems to be identified.
Field Procedures Section 3-2
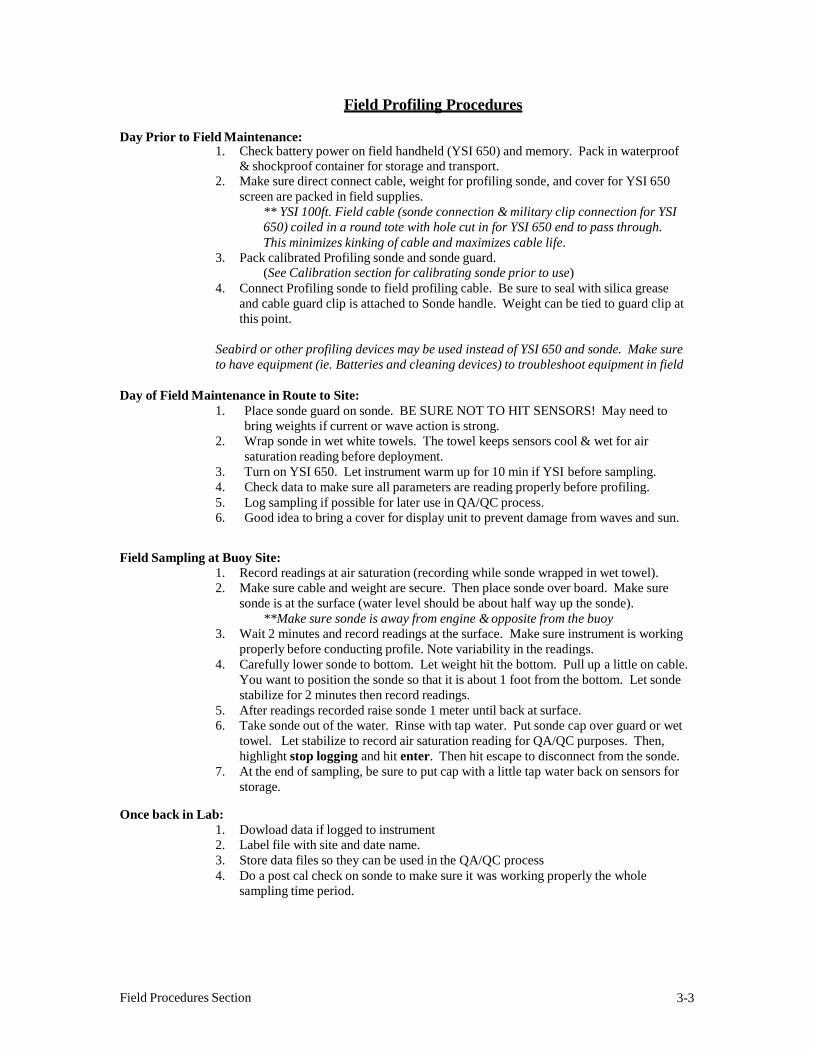
Field Profiling Procedures
Day Prior to Field Maintenance:
1. Check battery power on field handheld (YSI 650) and memory. Pack in waterproof & shockproof container for storage and transport.
2. Make sure direct connect cable, weight for profiling sonde, and cover for YSI 650 screen are packed in field supplies.
** YSI 100ft. Field cable (sonde connection & military clip connection for YSI 650) coiled in a round tote with hole cut in for YSI 650 end to pass through. This minimizes kinking of cable and maximizes cable life.
3. Pack calibrated Profiling sonde and sonde guard. (See Calibration section for calibrating sonde prior to use)
4. Connect Profiling sonde to field profiling cable. Be sure to seal with silica grease and cable guard clip is attached to Sonde handle. Weight can be tied to guard clip at this point.
Seabird or other profiling devices may be used instead of YSI 650 and sonde. Make sure to have equipment (ie. Batteries and cleaning devices) to troubleshoot equipment in field
Day of Field Maintenance in Route to Site:
1. Place sonde guard on sonde. BE SURE NOT TO HIT SENSORS! May need to bring weights if current or wave action is strong.
2. Wrap sonde in wet white towels. The towel keeps sensors cool & wet for air saturation reading before deployment.
3. Turn on YSI 650. Let instrument warm up for 10 min if YSI before sampling. 4. Check data to make sure all parameters are reading properly before profiling. 5. Log sampling if possible for later use in QA/QC process. 6. Good idea to bring a cover for display unit to prevent damage from waves and sun.
Field Sampling at Buoy Site: 1. Record readings at air saturation (recording while sonde wrapped in wet towel). 2. Make sure cable and weight are secure. Then place sonde over board. Make sure
sonde is at the surface (water level should be about half way up the sonde). **Make sure sonde is away from engine & opposite from the buoy
3. Wait 2 minutes and record readings at the surface. Make sure instrument is working properly before conducting profile. Note variability in the readings.
4. Carefully lower sonde to bottom. Let weight hit the bottom. Pull up a little on cable. You want to position the sonde so that it is about 1 foot from the bottom. Let sonde stabilize for 2 minutes then record readings.
5. After readings recorded raise sonde 1 meter until back at surface. 6. Take sonde out of the water. Rinse with tap water. Put sonde cap over guard or wet
towel. Let stabilize to record air saturation reading for QA/QC purposes. Then, highlight stop logging and hit enter. Then hit escape to disconnect from the sonde.
7. At the end of sampling, be sure to put cap with a little tap water back on sensors for storage.
Once back in Lab:
1. Dowload data if logged to instrument 2. Label file with site and date name. 3. Store data files so they can be used in the QA/QC process 4. Do a post cal check on sonde to make sure it was working properly the whole
sampling time period.
Field Procedures Section 3-3

5. Field Notes Suggestions
Day Prior to Field Maintenance: 1. Be sure to use a weatherproof notebook.2. Make sure to pack back up writing utensils (pens, permanent markers, & pencils).3. Prep field note book by setting it up with the following headings:
Field Sampling At Buoy Site: Figure 5-2. Field Notes.
1. Fill in every section by following all field procedures.2. If for some reason a field procedure is skipped be sure to note why.3. Always a good idea to have one person to record field notes.4. In Buoy comment section, if nothing is to report be sure to note: everything is
operational.5. REMEMBER MORE INFO IS ALWAYS BETTER THAN NOT ENOUGH!!
GOOD FIELD NOTES ARE FUNDIMENTAL TO GOOD DATA!!
Field Procedures Section 3-4
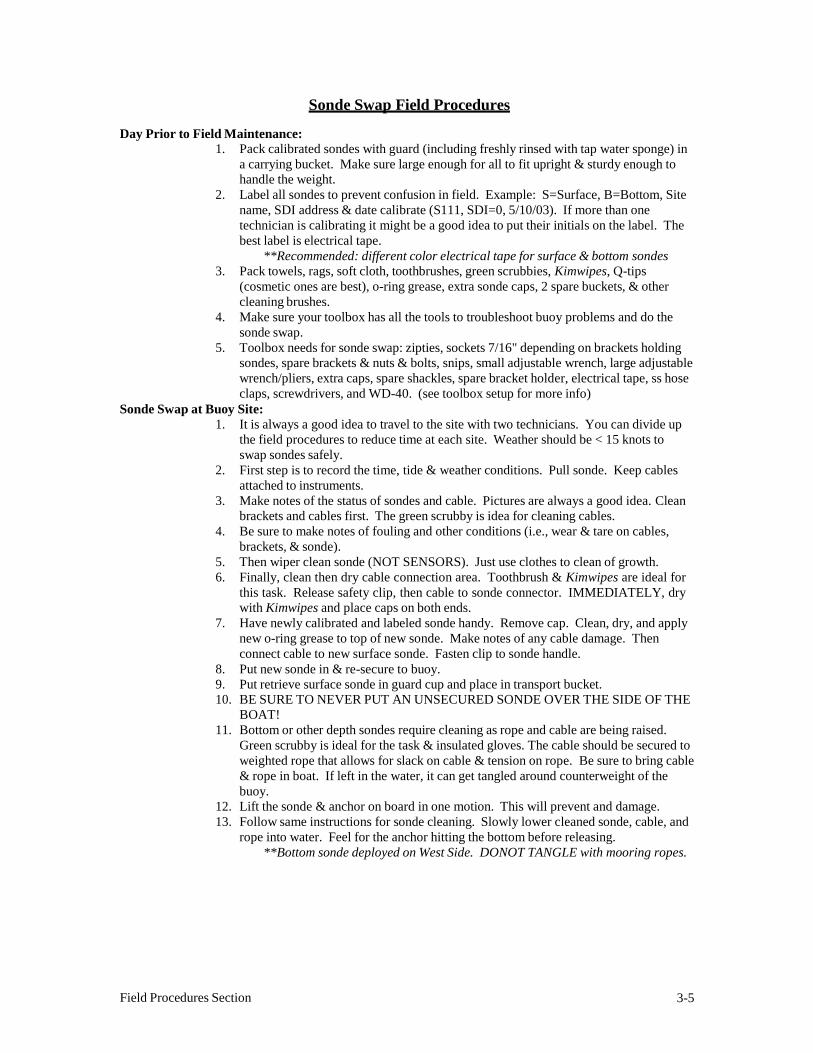
Sonde Swap Field Procedures
Day Prior to Field Maintenance: 1. Pack calibrated sondes with guard (including freshly rinsed with tap water sponge) in
a carrying bucket. Make sure large enough for all to fit upright & sturdy enough tohandle the weight.
2. Label all sondes to prevent confusion in field. Example: S=Surface, B=Bottom, Sitename, SDI address & date calibrate (S111, SDI=0, 5/10/03). If more than onetechnician is calibrating it might be a good idea to put their initials on the label. Thebest label is electrical tape.
**Recommended: different color electrical tape for surface & bottom sondes 3. Pack towels, rags, soft cloth, toothbrushes, green scrubbies, Kimwipes, Q-tips
(cosmetic ones are best), o-ring grease, extra sonde caps, 2 spare buckets, & othercleaning brushes.
4. Make sure your toolbox has all the tools to troubleshoot buoy problems and do thesonde swap.
5. Toolbox needs for sonde swap: zipties, sockets 7/16" depending on brackets holdingsondes, spare brackets & nuts & bolts, snips, small adjustable wrench, large adjustablewrench/pliers, extra caps, spare shackles, spare bracket holder, electrical tape, ss hoseclaps, screwdrivers, and WD-40. (see toolbox setup for more info)
Sonde Swap at Buoy Site: 1. It is always a good idea to travel to the site with two technicians. You can divide up
the field procedures to reduce time at each site. Weather should be < 15 knots toswap sondes safely.
2. First step is to record the time, tide & weather conditions. Pull sonde. Keep cablesattached to instruments.
3. Make notes of the status of sondes and cable. Pictures are always a good idea. Cleanbrackets and cables first. The green scrubby is idea for cleaning cables.
4. Be sure to make notes of fouling and other conditions (i.e., wear & tare on cables,brackets, & sonde).
5. Then wiper clean sonde (NOT SENSORS). Just use clothes to clean of growth.6. Finally, clean then dry cable connection area. Toothbrush & Kimwipes are ideal for
this task. Release safety clip, then cable to sonde connector. IMMEDIATELY, drywith Kimwipes and place caps on both ends.
7. Have newly calibrated and labeled sonde handy. Remove cap. Clean, dry, and applynew o-ring grease to top of new sonde. Make notes of any cable damage. Thenconnect cable to new surface sonde. Fasten clip to sonde handle.
8. Put new sonde in & re-secure to buoy.9. Put retrieve surface sonde in guard cup and place in transport bucket.10. BE SURE TO NEVER PUT AN UNSECURED SONDE OVER THE SIDE OF THE
BOAT!11. Bottom or other depth sondes require cleaning as rope and cable are being raised.
Green scrubby is ideal for the task & insulated gloves. The cable should be secured toweighted rope that allows for slack on cable & tension on rope. Be sure to bring cable& rope in boat. If left in the water, it can get tangled around counterweight of thebuoy.
12. Lift the sonde & anchor on board in one motion. This will prevent and damage.13. Follow same instructions for sonde cleaning. Slowly lower cleaned sonde, cable, and
rope into water. Feel for the anchor hitting the bottom before releasing.**Bottom sonde deployed on West Side. DONOT TANGLE with mooring ropes.
Field Procedures Section 3-5
Toolbox & Field Box Suggestions
Toolbox Contents:
• Snips, screwdrivers, WD-40, vacuum tester, sockets (7/16, ½), Allen wrench, Allenhead bolts for DCP can/ss bucket, bolts for antenna, zipties, o-ring grease, caps, o-rings, DO changing supplies (membranes, KCL solution, utility knife), adjustablewrenches (2 sizes), pliers (2 sizes), seizing wire, bracket fixtures, shackles, electricaltape, duct tape, and lock de-icier.
Field Box Contents:
• GPS, charts, Kimwipes, Q-tips, field notebook, pens, back-up batteries (AA & C),battery tester, back-up configuration discs, Ziplock bags, YSI 650, flashlight, back-upbeacon flasher, operation manuals, field checklist, cell phone, and float plan w/contact info.
Field Procedures Section 3-6
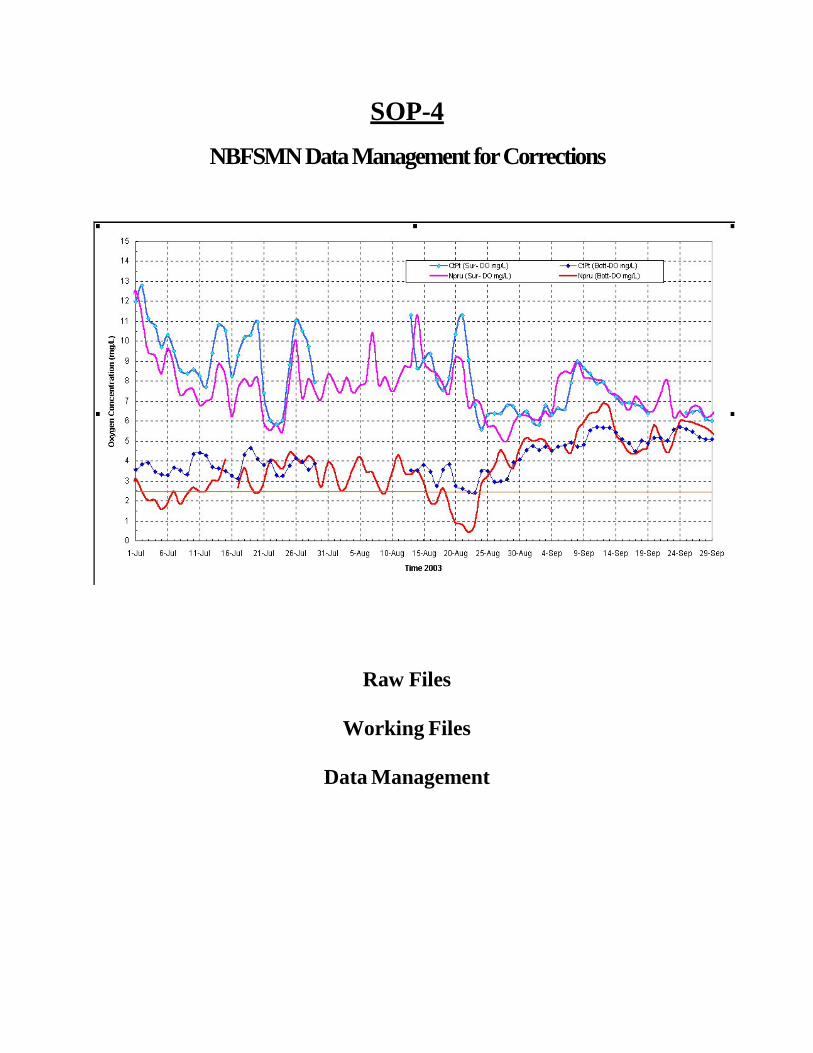
SOP-4
NBFSMN Data Management for Corrections
Raw Files
Working Files
Data Management

Data management is used as a quality control measure for the data collected by a continuous water-quality monitoring program. To ensure the highest quality data, the data must be triple checked and be well documented. The data is triple checked by using the calibration/post-calibration information, the sonde swap information, and the spot check or profile information. All of these steps require accurate documentation to be meaningful in the data management process.
The data management process consists of downloading and formatting the raw files, examining the data for sensor operation outliers, checking for subtle instrumentation variability, possible data correction alternatives, and formatting the final data files. All of these steps need to be processes and archived uniformly.
Raw Files: There are three main pathways data is downloaded. Data is downloaded directly from the sonde,
from the YSI handheld logger (YSI 650), and transferred to a base station computer. All use YSI compatible software. Therefore, all files are downloadable. For the purposes of this manual, we will just discuss downloading for the sonde and transferred data from the DCP to the base station computer. The YSI 650 downloading procedures are available in the appendices of this manual or from the YSI 650 Operations Manual.
The software allows for two types of downloads: a dat format or a comma delimited format, producing txt or csv files. From there, the data parameters can format for consistency and then exported into a csv or txt file for further QA/QC using a number of software packages. Some of these software packages are MS Excel, MS Access, and Matlab. For the purposes of this manual the data will be exported into MS Excel to explain some of the QA/QC procedures.
Downloading from the Files- The sonde will need to be downloaded only when it has been programmed to log internally. The
downloading procedures described in the YSI manual. When data is not available through sonde, the files from the DCP or datalogger can be used. Files should be in text format and stored by deployment date. Files are formatted by parameters using the following formatting from the YSI manual:
Parameter Short Name Units Format a.
b.
c.
d.
Date
Time
Date & Time
Water Temperature
Date
Time
C
Temp
mm/dd/yyyy
hh:mm:ss
mm/dd/yyyy hh:mm
°C
mm/dd/yyyy
hh:mm:ss
00.00
e. Specific Conductivity SpCond mS/cm 00.00
f. Salinity Sal ppt 00.00
g. Dissolved Oxygen DO % 000.0
h. Dissolved Oxygen DO_mgl mg/L 00.00
i. DO Charge DO c units 00.0
j. Depth Depth m 0.000
k. pH pH units 00.00
l. pH mV pH mV 00.0
m. Chlorophyll CHL ug/L 00.0
n. Total Fluorescence FS % 00.0
o. Turbidity Turb NTU 00.0
Data Management 4-2

The data order and measurement units of the YSI data logger output can be changed, if need be. See the YSI and/or software manuals for these features.
Working Files (Setting Up Files in Excel for QA/QC) :
1. If the site has surface and bottom readings, it is best to set up a file with both readings in the samespreadsheet. It will add important insight into the review and editing process. Copy and paste in thetemplate.
Figure 6-5. Excel Headings for working file
2. Save the file according to the map code, agency, site, and year. Use the extension working.xls. Thiswill become your working file. There is no need to use abbreviations for names in Excel.
Example: B5.GSOmv2004.working.xls
3. Now graph the parameters. Use the column D date and time for the X-axis on all graphs. Use thefollowing template as a guide. Feel free to add other graphs. This template only offers theminimum to guide the review and editing process. Simply copy and paste the data from the txt filesinto this template. Make adjustments based on the parameters measured. The working files aref o r internal use only by the data reviewer. Only the final formatted files are to be used fordata distribution.
graphing template for surface and bottom sondes.xls
4. Other program such as Matlab, Streamline and CDMO can also be used for review. The correctionsare completed in excel and edited and corrected files are distributed in excel for the most universaluser format.
5. In the end, each station will post a raw, edited, and corrected version of the dataset on a yearly basis.These datasets are posted to the RIDEM-OWR BART webpage. (www.ridem.gov/BART).
Once formatted properly and graphed the working files is ready for data review and editing. The working file is used to create the review file, editing file, and final formatted file. The next section will explain the principles behind editing the raw data and general guidelines for deleting data. These guidelines come directly from the CDMO manual and were adopted in 2004. There may be adjustments made in future sampling seasons.
Data Management 4-3

Data Management QA/QC and Correction Protocols:
This section will cover the general philosophies for data acceptance and rejection. These protocols come directly from the CDMO manual (http://cdmo.baruch.sc.edu/documents/manual.pdf). Introduction-
The following document has been prepared to aid users of the YSI products in ascertaining the reliability of the data from their deployments. This document is clearly not designed to be the final word on the data review and editing issue, but instead to simply be a starting point for consideration, rejection, and modification by the NERR System-wide Monitoring Program as more experience is acquired and more data are generated and processed.
The general philosophy for data acceptance or rejection will be based on absolute and discretionary factors.
Absolute: In the first phase of data review and editing, values sometimes can be rejected on the basis of absolute factors via software statements with no detailed analysis of the study by the Data Manager or reviewer at each site.
Discretionary: These are other instances in which the data must be examined before absolute rejection. In the second phase, we are recommending that the data reviewer evaluate each deployment study. These anomalies can be somewhat subjective. Discretionary anomalies are based on pre- and post- calibration information, field information, profiling data, etc.
Absolute data rejections- Following the absolute data rejection criteria begin the data review process. All data that is rejected is to
be deleted only during the data review process. Document all deletions. Leave the data cells blank. Save the file using the same format as the master file with data review.xls as the extension instead of masterfile.xls.
The Value Recorded in the Sonde Memory is Outside the Listed Range Specifications of the Instrument: The following criteria are based on the latest YSI 6-Series Environmental Monitoring Systems
Operating Manual sensor specifications and are what the NERR CDMO error checking criteria are based on. The Narragansett Bay Water Quality Monitoring Network has adopted the follow criteria, as well.
Temperature: -5 to 45 oC Specific Conductivity: 0 to 100 mS/cm Salinity: 0 to 70 ppt Dissolved Oxygen (% Saturation): 0 to 200 and 200 to 500 % air saturation Dissolved Oxygen (mg/L): 0 to 20 and 20 to 50 mg/L Shallow Depth: 0 to 9.1m pH: 2 to 14 units Chlorophyll: 0 to 500 ug/L Turbidity: 0 to 1000 NTU
Always reject data that are outside of the range of the probes. The only exceptions to the absolute data rejection for out-of-range values are for the shallow depth, chlorophyll, and turbidity probes. These exceptions are explained under their respective headings in this document.
An Unexpected Tidal Fluctuation or an Improperly Deployed Sonde: Usually a very low (near zero) or a very sharp decline in conductivity readings will indicate these
situations even when the unit is known to be at a site characterized by brackish water. This effect is demonstrated in Figure 6-6A where it is evident that the water level has dropped below the conductivity sensor on several occasions. In the study associated with Figure 6-6B, the sonde seemingly came out of the water midway through the study and remained there.
Reject all of the data in these areas of the data record, not just conductivity/salinity because it is impossible to tell whether the other sensors were in the water at the time of measurement. Remember to leave the time stamp within the dataset during the data review process.
Times of pre- and post-deployment when transporting the sonde:
Data Management 4-4
Figure 6-7 and the beginning of Figure 6-9 show that the beginning and end (tails) of data (pre- and post- deployment) are not in range of the other readings. Note that the time on the sonde is not always the same as what is on your watch, especially during daylight savings. Remember that any data collection including that of the data sondes should be recorded in standard time only NOT daylight savings time.
All data should be examined for these types of data, and the tails should be rejected and deleted from the deployment record.
In DCP setup, the DCP will record –1000000 or NaN when the sonde is not connected or is having difficulty communicating with the sondes. Reasons for the DCP to record –1000000 or NaN are as follows:
• Cable communication errors. Examples are leaking cable, broken cable, pins bent, etc.
• Internal codes of the sonde. Generally, this occurs when the sonde has not been updated. The sonde andDCP codes don't match up. Examples are a newly repaired DCP trying to communicate with oldersondes. To prevent this from happening, keep track of the software version the sonde is using. This isfound under the status menu of the sonde. The DCP will have trouble communicating with versionsolder that 2.16 and will not communicate with the YSI 6000.
• During the sonde swap, when the sonde has been disconnected from the cable.
All –1000000 are to be deleted from the data set. Document the reason for the recorded –100000 in themetadata. DO NOT DELETE THE TIME STAMP! ALL TIME STAMPS ARE TO REMAIN IN THE DATA SET.
No sensor installed Values:
All probes will register a value even if there is no sensor installed on the sonde. This is a situation that cannot be replicated (for example, the motherboard does not always register the same values when the sensors are missing)!
Always delete data for sensors that have not been installed. Always document when you are missing a sensor for each deployment.
In time, experience may indicate other absolute data rejection criteria. At this time, the Narragansett Bay Water Quality Monitoring Network has agreed upon all of the above absolute data rejection criteria.
Data Management 4-5
Discretionary data rejection- In this part of the procedure, data analysis of all recorded parameters should be carried out by or under
t h e supervision of the site Data Manager. If anomalies are observed, the anomalous data may be marked as an anomaly, left in the data set and documented, or rejected and removed at the discretion of the data reviewer or data manager in the final format for distribution. Data rejection, anomaly documentation, and data deletions are done during the data review process.
Data review and editing should take place as soon as possible after sonde recovery so that the details of the deployment will be fresh in the minds of the site personnel and if anomalies are found, corrective action can be attempted prior to the next deployment. Immediately after recovery of the sonde, both YSI and the CDMO recommend an upload of the data file in the PC6000 format followed by cursory analysis of the data using the plotting function of the YSI-supplied Streamline, EcoWatch, or other compatible programs. The DCP transferred data should be reviewed on a daily to weekly basis. This action will provide insight into whether problems occurred with any of the sensors during deployment, which might be grounds for rejection of portions of the data. It also helps to reduce erroneous data by providing an opportunity to troubleshoot problems as soon as possible.
All files should be archived at the individual sites (AKA base station computer). These are the true raw files. Therefore, all data records (good and suspect) will be present. Also PC6000 (.dat) files can always be used to export comma-delimited files using EcoWatch , Streamline, or other compatible programs.
In the discretionary evaluation of the data, each sensor should be evaluated individually. Usually the data manager should be looking for a discontinuity (sudden jumps high or low - to out of range values or other anomalies) in the data, which indicates a sensor has failed catastrophically during the deployment. This type of failure can be either reversible (wiper covering Chlorophyll sensor) or irreversible (broken pH probe, for example).
In general, all data resulting from a known failure of a sensor within a particular deployment should be rejected. However, an exception to this general rule may apply in some turbidity studies as discussed below. A listing of possible failure mechanisms for each sensor is provided below. In some cases a figure documenting a data discontinuity, which appears to be associated with the failure mechanism, is also provided.
REMEMBER TO DOCUMENT ALL ANOMOLIES IN THE METADATA WHETHER DELETED OR NOT!
It is a good idea, if using Excel for the data review process, to highlight all suspect data. It will make the data reviewer's job easier to review these anomalies in more detail later, if they are highlighted.
Data Management 4-6
Time: On occasion, time jumps (from seconds to minutes) can occur in the data logger file for no apparent
reason. There are two explanations for this. First, the data logger could have been interrupted by an uploading session while the sensors were trying to record water quality data or the contacts between the batteries and the sonde (the metal coil) had gotten damp and needed cleaning.
It is important to document in the metadata when the time was off. The CDMO pre-processing Excel macro will correct all times for you to the nearest half or quarter-hour. All time stamps must be accounted for.
Time Gaps in the data file & Internal Device Error statement- If time gaps are observed in the uploaded data file or if a time gap is suspected, then you may have an
Internal Device Error problem with the sonde. This is an indication of a handshaking problem between the internal boards of the instrument. When the board that runs the sensors transfers the sensors' signal to another internal board, there occasionally can be a communication problem. When a communication problem does occur, an Internal Device Error statement appears and there is a statement on a time line that the error has occurred INSTEAD of the data. Thus, when an Internal Device Error occurs there are no data at all at for that particular time. The message indicates that a sample is missing. It does not mean that the data before or after the error message is bad. In the file report, the only evidence of an internal device error is a time gap in the data.
Note: An internal device error statement is only visible in the “viewed data” and not in an “uploaded data” PC6000 formatted file. View the data on the screen using the View command from the sonde and look for the internal device error log.
Any data that is recorded in the memory is probably okay since internal device errors do not affect sensor performance, only internal communication. Contact YSI to determine how to recover your data.
Temperature: The temperature sensor on the YSI 6030 probe rarely fails. If it does fail, the malfunction is inevitably
irreversible and due to leakage of environmental water into the thermistor container. Although we have only very limited experience, the failure of the temperature sensor is usually signaled by jumpy and/or clearly incorrect readings. If a problem is suspected, the accuracy of the thermistor can be checked on return vs. another Model 6000 or a mercury-in-glass thermometer.
If a clear point of temperature discontinuity is present in a data record, all temperature readings from that point on should be eliminated from the final format to be used for distribution. This point might be signaled by a sharp jump in temperature to an unexpected value or an overall drift that seems unreasonable.
Since the data from most all other sensors (salinity, specific conductivity, depth, dissolved oxygen mg/L, pH, turbidity and chlorophyll-a) is temperature compensated using the values from the thermistor, all values for all logged parameters (EXCEPT percent saturation and conductivity) after a temperature probe failure should be viewed as suspect and eliminated from the official record. Thus, because of the ubiquity of temperature compensation, failure of the temperature sensor is particularly serious for the overall data record. This is demonstrated in Figure 6-8 where the temperature sensor failed during the study. However, remember that temperature probe failure is extremely rare. All suspect and erroneous data should be documented.
Data Management 4-7
Conductivity/Salinity: The conductivity sensor of the YSI 6030 probe seldom shows catastrophic failure. If an error occurs, the
symptom is usually a drift of the overall conductivity output due to a changing of the cell constant during deployment. This cell constant change is, in turn, usually due to the presence of fouling in the cell compartment that causes a change in the effective volume. If the perturbation only involves the coating of the cell and electrodes with a layer of fouling, the change in cell constant is usually not significant. However, the formation of barnacles in the cell constant will result in readings that are in error.
A post deployment check of the sensor in a solution of known conductivity (not necessarily a primary standard) will allow the data reviewer to assess the extent of the drift. Cleaning of the sensor as described in the manual almost always reverses the drift caused by significant change in the cell volume. If a reversible drift is suspected, a linear compensation based on quality assurance data (pre-, mid-, and post-deployment) is possible using an appropriate calculation. YSI recommends that the decision as to whether to employ this (or any) compensation be left in the hands of the data reviewer. Any data compensation calculations will occur during the data editing process. If a drift has occurred, only highlight and document the extent of the drift during the data review process. Discretionary compensation calculations and data removal calculations are used by the Narragansett Bay Water Quality Monitoring Network and only present in the corrected version of the data.
In the unlikely event of a total sensor failure, a sharp discontinuity will usually appear in the output. All readings (salinity, specific conductivity, dissolved oxygen mg/L and depth) after this type of failure should be eliminated from the final format for distribution.
Remember though that sharp discontinuities in conductivity can also be due to the sonde being out of the water, as is described in the Absolute Data Rejection section above or as a result of an incorrect calibration. The BEST indicator of determining whether a sonde was out of the water is to use the Conductivity data. See figure 6- 6A and 6-6B. Use the conductivity data in conjunction with depth values to help with decision-making. In addition, it is recommended to use other salinity information, the profile data, rainfall data, and flow data when available.
If the sonde was determined to be out of the water, reject ALL YSI data in these areas of the data record because it is impossible to tell whether the other sensors were in the water at the time of measurement.
Occasional Low Salinity/Conductivity Spikes- Occasional low value spikes that are not consistent with the overall data record may be real (Figure 6-
12). Generally, these spikes are caused by organisms getting stuck within the sensor opening or from sediment build-up. Reject or accept spikes in conductivity and salinity values at the site’s discretion.
The best way to visually examine these types of spikes is to plot surface and bottom salinity readings for each site together on the same y-axis. In addition, plot the salinity readings with rainfall or flow data on a secondary y-axis. The spikes are easily highlighted by plotting the x-axis using the date and time (use the date and time formatted in the same column).
To automate data screening for low salinity spikes, agencies have adopted different methods. For 2004, the data manager used a 95-percental rejection method based on a running monthly average. Generally, there are two comparable methods used to screen for data spikes:
i. Since not all parameters are normally distributed, such as conductivity, a 95%rejection method can be applied. Any value that is outside the 95% rangearound the median (median based on monthly averages). See data manager formore info.
ii. Another method used by NBFSMN, incorporates overall max and min dataobserved at the site and rate of change between each data point. The rate ofchange is based upon the 95%, 2 times the standard deviation or 2 times theneighest neighbor rule.
iii. If surface & bottom salinity are available for the station, then plot together anddelete salinity values from the bottom that are significantly less than surface. Inaddition, plot with river flow data to determine if spikes are real or erroneous.
However, do not reject or delete the data, unless you are absolutely sure that they are erroneous data. If you do not reject the data, leave the data in the file and document them as anomalous in the metadata. If you do reject them, delete and document them in the metadata.
Data Management 4-8
pH:
Like the conductivity sensor, the pH probe seldom shows catastrophic failure. However, the probes only have about a two year life span. If an error does occur, the symptom is usually a drift of the overall pH output due to a perturbation of the reference electrode during deployment. A post deployment check of the sensor in a solution of known pH (usually pH 7 & pH 10buffers) will allow for assessment of the extent of the drift. The drift is usually confined to the sensor offset, not the sensitivity, and while not reversible per se, can normally be “calibrated out” prior to the next deployment. If a reversible drift is suspected, a linear compensation based on quality assurance data (pre-, mid-, and post deployment) is possible. A decision to employ this (or any) compensation should be left in the hands of the data reviewer.
In the event of a complete sensor failure (most likely due to breakage of the glass bulb), a. a sharp discontinuity may appear in the output,b. the readings may either be totally unreasonable,c. the ISE1 mV output in the Diagnostics submenu may be exactly 0 mV no matter what
solution the sensor is immersed in, and/ord. readings will show a great deal of noise.
All readings after this type of failure should be eliminated from the final data set for distribution. A more subtle clue to a near sensor failure (due to probe age or due to the gel drying up) indicates that
the sensor will read from 5 to 6 units no matter what calibration solution it is in. The probe will not calibrate to any calibration standard. All readings from this type of failure should be eliminated from the final format. Another clue to a near sensor failure due to probe age is that the pH sensor appears to be working fine when the probe is submerged in a particular pH standard (for example, if the standard is a pH of10, the probe’s readings will be near 10), and it appears to track changes in pH; but when you try to calibrate the probe, the calibration is not accepted. After soaking the probe to restore it, it may appear to work properly and accept calibration. However, within a few weeks the message “calibration not accepted” may again be generated during calibration.
YSI technical support stated that this problem might also indicate that the internal coefficients for the pH calculations are incorrect (which will be the case for a newly installed pH probe). Corrective action in this case includes clearing the internal coefficient values and re-calibrating with a 2-point calibration. Contact YSI for specific procedures to check, clear, and reset the sonde internal coefficients. All readings from this type of failure should be examined carefully before being submitted to the final format for distribution.
If an offset has been documented throughout the whole deployment, NBFSMN applies a correction constant to adjust data to line up overall dataset. This is only done when there is inconsistencies among sensors and not other parameters. The corrections are only applied to the corrected files, highlighted in dataset, and documented in metadata.
Data Management 4-9
Dissolved Oxygen:
The oxygen sensor of the YSI 6030 probe is susceptible to both drift and catastrophic failure during deployment. Optical DO sensors dramatically reduce this because of the wiper and structure of sensor. Drift is usually caused by deposition of a layer of biological fouling on the sensor membrane. The puncturing of this membrane by biological fouling usually causes catastrophic failure. A post-deployment check of the sensor in a medium of known DO content (usually water-saturated air or air-saturated water) will allow the reviewer to assess the extent of the drift. If a reversible drift is suspected, a linear compensation based on quality assurance data (pre, mid-, and/or post deployment) is possible. YSI recommends that the decision as to whether to employ this (or any) compensation be left in the hands of the data reviewer. NBFSMN applies this principle to the corrected dataset.
If the membrane is improperly installed or is punctured during the deployment, the sensor output is generally characterized by a large discontinuity. Figures 6-10 and 6-11A-C demonstrate this effect that is suspected to be due to membrane holes. Figure 6-10 shows DO failure at the beginning of the deployment and could well be due to improper membrane installation. Figures 6-11A-C shows failures during the deployment that are likely due to a membrane puncture from debris or animal activity. In most cases, the DO readings become unreasonably high very quickly and then drift off to varying extents. In Figure 6-11C however, the readings simply rise precipitously at the suspected point of puncture and then become noisy. For both symptoms, YSI suspects that the cause of the error is “cross talk” through the membrane hole between the DO and conductivity sensors in the conductive brackish water medium.
In all cases, all percent saturation and dissolved oxygen mg/L readings after the discontinuity should be eliminated from the final data set for that deployment record. Note, however, that sensor malfunctions from membrane punctures usually affect only the DO data of the deployment in question -- reconditioning and re- membrane the probe correctly prior to the next deployment will likely return the sensor to its proper operating condition.
The dissolved oxygen sensor can occasionally fail during a deployment due to electrochemical or materials failure (fouling of the anode, internal short in the probe, etc.). These problems are usually characterized by a discontinuity in the data record and can usually be confirmed by the presence of high DO charge and/or noisy or negative readings during the post deployment check of the DO sensor. As for membrane punctures, the sensor is not likely to recover function during a deployment once these events have occurred and therefore, all DO readings associated with this deployment after the discontinuity should probably be eliminated. Some of the latter symptoms (internal shorts, material breakdown from age) are irreversible and will require probe replacement. For fouling of the electrodes, however, probe function can usually be restored by reconditioning the probe face with the fine sandpaper found in the 6035 kit.
Membrane Fouling- A post deployment check of the sensor in a wet towel or aerated bath (100% air saturation) will allow the
data reviewer to assess the extent of the drift. Cleaning of the sensor as described in the manual almost always reverses the drift caused by significant change in the cell volume. If a reversible drift is suspected, a linear compensation based on quality assurance data (pre-, mid-, and post-deployment) is possible using PC6000 software or calculating it linearly in Excel. YSI recommends that the decision as to whether to employ this (or any) compensation be left in the hands of the data reviewer. Any data compensation calculations will occur during the data editing process. If a drift has occurred, only highlight and document the extent of the drift during the data review process. Discretionary compensation calculations and data removal calculations are still under review by the Narragansett Bay Water Quality Monitoring Network.
Data Management 4-10
Depth1: The shallow depth sensor is a non-vented probe that is very susceptible to changes in barometric
p r e s s u r e . Negative depth values are a possibility when the sondes are deployed in shallow estuaries, as shown in Figure C-7. Do not reject the depth values or the data for the other probes based on negative depth readings alone. Examine the other probe’s readings (primarily specific conductivity) to determine whether or not the sonde was actually out of the water. (See the information about how the specific conductivity can be used as an indicator of the instrument being out of the water).
Make sure that the probe was out of the water before rejecting and deleting the negative depth and other sensor values! If the depth probe was out of the water, the depth reading(s) will be negative and the other probe reading(s) (especially specific conductivity and salinity) will also be bad (Figure C-1A and C-1B). Reject, delete, and document all data after it has been determined that the sonde was out of the water.
If the depth probe was not out of the water and the depth readings are negative, the other probe readings will be in line with the previous data (Figure C-7). Do not reject the data but mark the negative depth data as anomalous and document it in the metadata.
From discussions with YSI’s John McDonald (January 1997), it was determined that with the non- vented level probe, measurements could be as much as 0.39m (1.3 feet) off with an intense low pressure hurricane event. Keep this in mind when evaluating these data.
Note: The outlier program will still flag negative depth values (anything < zero), but this is done on purpose to warn you that the data may be erroneous and that the data need to be examined and evaluated.
1 Even though the depth probe is not supposed to measure below zero, it was agreed at the NERRS meeting at St. Simons Island, GA (November 1996) that negative depth would be allowed (and categorized as anomalous) due to the way the sensor could be influenced by low pressure weather systems.
Data Management 4-11
Turbidity:
The 6026 turbidity sensor associated with the YSI 6000 is usually not susceptible to drift per se. This means that there will generally be little need for manual compensation of readings during a deployment due to the fouling or sensor drift that may affect the conductivity, pH, and dissolved oxygen sensors. The turbidity sensor can, however, produce erroneous readings for reasons other than drift such as mechanical failures. Examples of these are leakage of water into the sensor housing and scratches on the optics caused by an improperly installed wiper. The sensor can fail completely during deployment as shown in Figure 6-13 where the flat readings are almost certainly due to complete loss of probe sensitivity. Clearly, turbidity readings after this type of discontinuity should be rejected (Figure 6-13).
High Positive (>1000) and Large Negative Values- Sometimes turbidity readings can be erroneously high (>1000 NTU) and then erroneously large negative
readings. Or sometimes turbidity readings will be in the normal range of the instrument (0 to 1000 NTU) and then become large negative values. The most common problems associated with turbidity data like what is described above are likely due to one of the following:
(1) The presence of a large quantity of debris such as algae or Spartina, (2) animals in the probe compartment, (3) the wiper parking over the optics, or (4) when there are actual turbidity values that the sensor is experiencing that are > 1000 NTU
(greater than the range the probe can measure). This is a real event that the probe is experiencing and is not an error! Figure 9 shows that after a failure of a water control structure (see water level values before 14/07/96 0:00) which released a huge volume of water into the system that Delaware NERR was measuring, turbidity was increased beyond 1000 NTU which caused the turbidity sensor to “roll over” (see next paragraph).
In 1-3 above, the sensor is affected by a direct interference from a foreign body or the wiper. Sometimes the wiper can be jammed over the optics by debris or the wiper will park over the optics due to a dirty wiper blade. Note, in some cases you will need to replace the wiper and recalibrate the probe. All scenarios listed above can cause very high and large negative readings. Before the release of Version 3.10 sonde software for the YSI 6000UPG in January 1997, there was a “rollover” problem with the turbidity probe. When the A/D converter of the turbidity probe senses a very high reading, it “rolls over” and the output of the system becomes large and then negative. Thus, wiper malfunctions, direct interference in the optics, or turbidity values >1000 during a reading are usually characterized by very large, negative NTU data points as shown in Figures 6-15 and 6-16. The distribution of new sonde software (Version 3.10 and higher) from YSI corrected this problem.
The turbidity probe is an optical probe, which causes it to behave very differently that the rest of the probes. However, as opposed to the other sensors, if there is a malfunction it can be completely reversed within a given deployment. Thus, if the impediment is removed from the optics via natural causes in subsequent readings, there is no reason to suspect their validity.
If it is determined that there was an animal living in the YSI instrument, or debris was seen attached to the wiper area, or the wiper was stuck in the middle of the turbidity window, then reject and delete the data. This is where deployment notes are important to note any unusual circumstances regarding the instrument deployment. Make sure to review the turbidity data from each deployment and make a judgment as to the possible reliability of the data if large negative spikes occur and whether this data should be included in the SWMP data logger database.
However, since, in most cases, it cannot be determined whether or not the anomalous value is due to animal, debris, wiper, or natural causes, it is recommended that all anomalous data remain in the database. The values should be documented as anomalous in the metadata and left in the data file.
TIP: Small meshed netting over the sensor guard secured with cable tires can protect the probes from debris and animals taking up residence in the probe area. Contact YSI for the suggested mesh size and type.
Small Negative Values- Just a small amount of water left on the probes (from the cup that the probes are stored in) can
contaminate the zero turbidity standard when calibrating the turbidity probe. Contamination can cause the zero
Data Management 4-12
calibration to be off by +5 to +8 NTUs. So when the probe really experiences zero turbidity, the values are -5 to -8 NTU. Therefore, shake or dry off the instrument and probes thoroughly before continuing with calibration.
Due to this small calibration error possibility, small negative turbidity values should be kept in the data file and documented as anomalous due to this small calibration error.
Occasional High Positive Turbidity Spikes- Occasional high positive spikes that are not consistent with the overall data record may be real (Figure 6-
17). Reject or accept spikes in turbidity values at the site’s discretion. However, do not reject or delete the data, unless you are absolutely sure that they are erroneous data. If
you do not reject the data, leave the data in the file and document them as anomalous in the metadata. If you do reject them, delete and document them in the metadata.
Data Management 4-13
Chlorophyll:
The YSI 6025 is designed to estimate the phytoplankton content of study site water. One key factor to consider with the YSI 6025 chlorophyll sensor is that it has significant limitations associated with its use that the user should appreciate fully before using. For more detail information on the 6025 sensor refer to Appendix I in the YSI 6-Series Environmental Monitoring Systems: YSI Environmental Operations Manual.
Since the chlorophyll sensor estimates total chlorophyll, it is required for field grab samples to taken and analyzed using the method described in SOP-2. The extractive analysis readings are to be obtained at a minimum of every sonde swap, if possible. These data are to be used to post calibrate the sensor. The best method for re- calculating the chlorophyll sensor is as follows:
(1) Tablulate all extractive analysis readings with YSI readings for the most appropriate times. Use 3 YSI readings (45 mins.- (3) 15- min. readings) with the three extraction samples
(2) Calculate a linear regression (using all data from the whole season) to best describe the relationship between the extracted samples and the YSI sensors distribution.
(3) Recalculate all YSI sensor data using the regression model (equation). (4) Other data adjustments caused by sensor failure, spikes, low negative values can be deleted and
adjusted before or after the regression model is applied. It is up to the user on which method they are more comfortable with.
The 6025 chlorophyll sensor associated with the YSI 6600, 6600EDS, 6820, 6920 and 600OMS is usually not susceptible to drift per se. This means that there will generally be little need for manual compensation of readings during a deployment due to the fouling or sensor drift that may affect the conductivity, pH, and dissolved oxygen sensors. The chlorophyll sensor can, however, produce erroneous readings for reasons other than drift such as mechanical failures. Examples of these are leakage of water into the sensor housing and scratches on the optics caused by an improperly installed wiper. The sensor can fail completely during deployment as shown in Figure 6-13 where the flat readings are almost certainly due to complete loss of probe sensitivity. Clearly, chlorophyll readings after this type of discontinuity should be rejected (Figure 6-13).
High Positive (>500) and Large Negative Values- Sometimes chlorophyll readings can be erroneously high (>500ug/L) and then record normal readings. .
The most common problems associated with turbidity data like what is described above are likely due to one of the following:
a. The presence of a large quantity of debris such as algaeb. animals in the probe compartment,c. the wiper parking over the optics, ord. When there are actual chlorophyll values that the sensor is experiencing that are > 500ug/L
(greater than the range the probe can measure). This is a real event that the probe isexperiencing and is not an error! However, it is reading the fluorescence for a piece ofmacroalgae. This is not representative of the phytoplankton in the water column.
In 1-3 above, the sensor is affected by a direct interference from a foreign body or the wiper. Sometimes the wiper can be jammed over the optics by debris or the wiper will park over the optics due to a dirty wiper blade. Note, in some cases you will need to replace the wiper and recalibrate the probe. All scenarios listed above can cause very high and large negative readings.
The chlorophyll probe is an optical probe, which causes it to behave very differently that the rest of the probes. It has a tendency to produce a lot of "noise" or highly variable readings. However, as opposed to the other sensors, if there is a malfunction it can be completely reversed within a given deployment. Thus, if the impediment is removed from the optics via natural causes in subsequent readings, there is no reason to suspect their validity.
If it is determined that there was an animal living in the YSI instrument, or debris was seen attached to the wiper area, or the wiper was stuck in the middle of the turbidity window, then reject and delete the data. This is where deployment notes are important to note any unusual circumstances regarding the instrument deployment. Make sure to review the chlorophyll data from each deployment and make a judgment as to the possible reliability of the data if large spikes occur and whether this data should be included in the final formatted data set.
Data Management 4-14
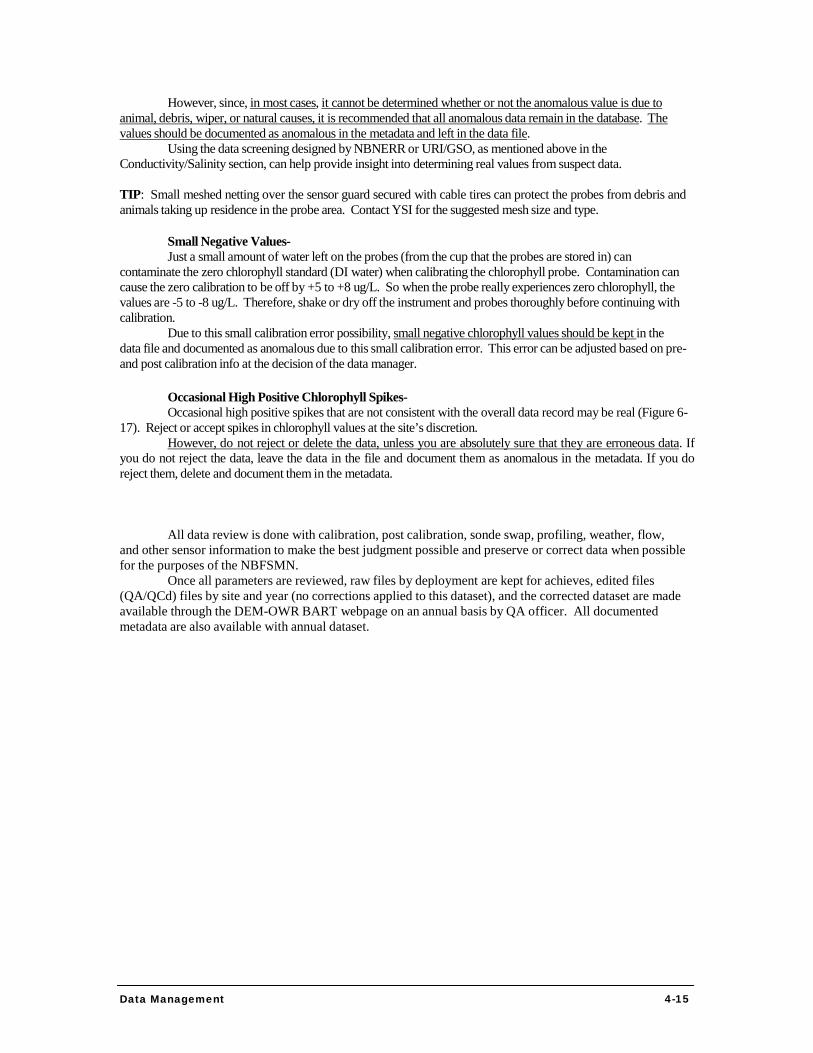
However, since, in most cases, it cannot be determined whether or not the anomalous value is due to animal, debris, wiper, or natural causes, it is recommended that all anomalous data remain in the database. The values should be documented as anomalous in the metadata and left in the data file.
Using the data screening designed by NBNERR or URI/GSO, as mentioned above in the Conductivity/Salinity section, can help provide insight into determining real values from suspect data.
TIP: Small meshed netting over the sensor guard secured with cable tires can protect the probes from debris and animals taking up residence in the probe area. Contact YSI for the suggested mesh size and type.
Small Negative Values- Just a small amount of water left on the probes (from the cup that the probes are stored in) can
contaminate the zero chlorophyll standard (DI water) when calibrating the chlorophyll probe. Contamination can cause the zero calibration to be off by +5 to +8 ug/L. So when the probe really experiences zero chlorophyll, the values are -5 to -8 ug/L. Therefore, shake or dry off the instrument and probes thoroughly before continuing with calibration.
Due to this small calibration error possibility, small negative chlorophyll values should be kept in the data file and documented as anomalous due to this small calibration error. This error can be adjusted based on pre- and post calibration info at the decision of the data manager.
Occasional High Positive Chlorophyll Spikes- Occasional high positive spikes that are not consistent with the overall data record may be real (Figure 6-
17). Reject or accept spikes in chlorophyll values at the site’s discretion. However, do not reject or delete the data, unless you are absolutely sure that they are erroneous data. If
you do not reject the data, leave the data in the file and document them as anomalous in the metadata. If you do reject them, delete and document them in the metadata.
All data review is done with calibration, post calibration, sonde swap, profiling, weather, flow, and other sensor information to make the best judgment possible and preserve or correct data when possible for the purposes of the NBFSMN.
Once all parameters are reviewed, raw files by deployment are kept for achieves, edited files (QA/QCd) files by site and year (no corrections applied to this dataset), and the corrected dataset are made available through the DEM-OWR BART webpage on an annual basis by QA officer. All documented metadata are also available with annual dataset.
Data Management 4-15
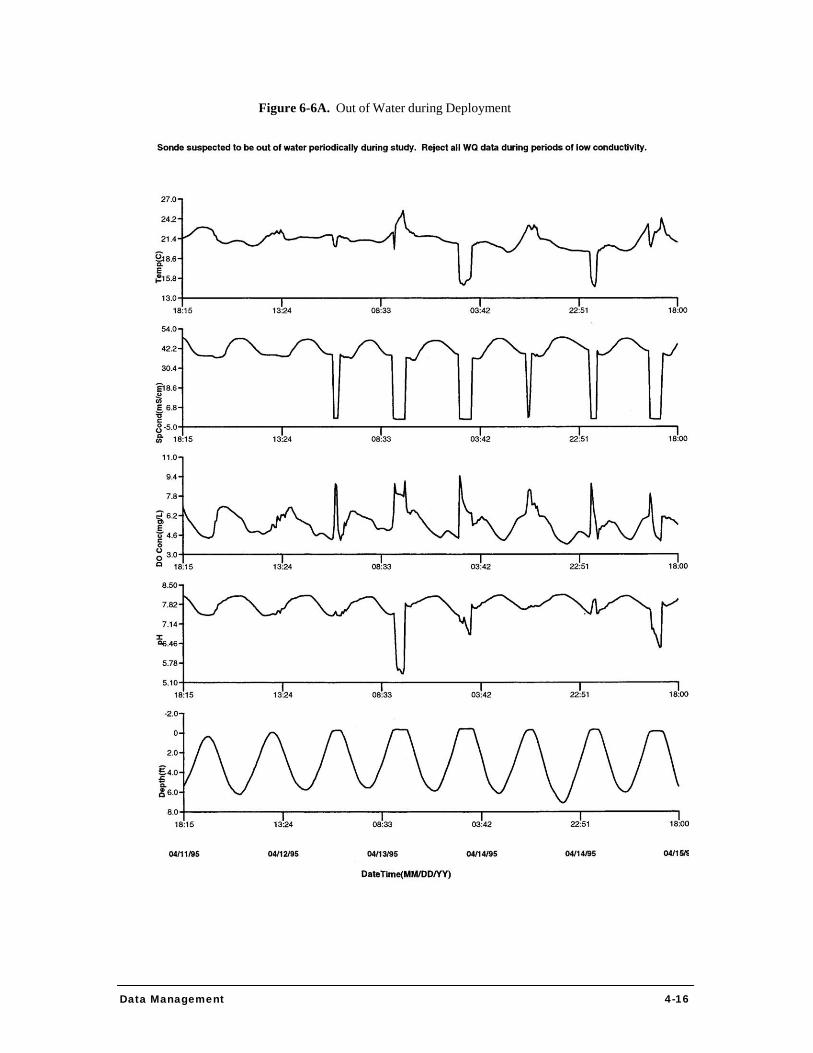
Figure 6-6A. Out of Water during Deployment
Data Management 4-16
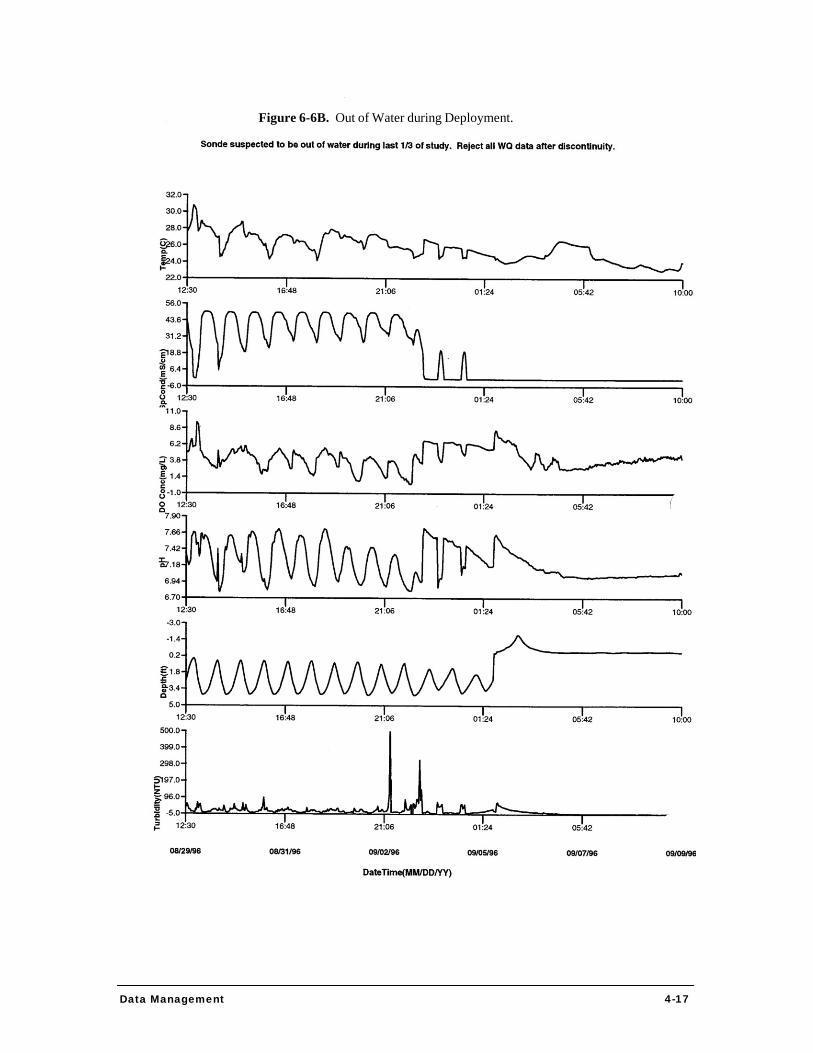
Figure 6-6B. Out of Water during Deployment.
Data Management 4-17
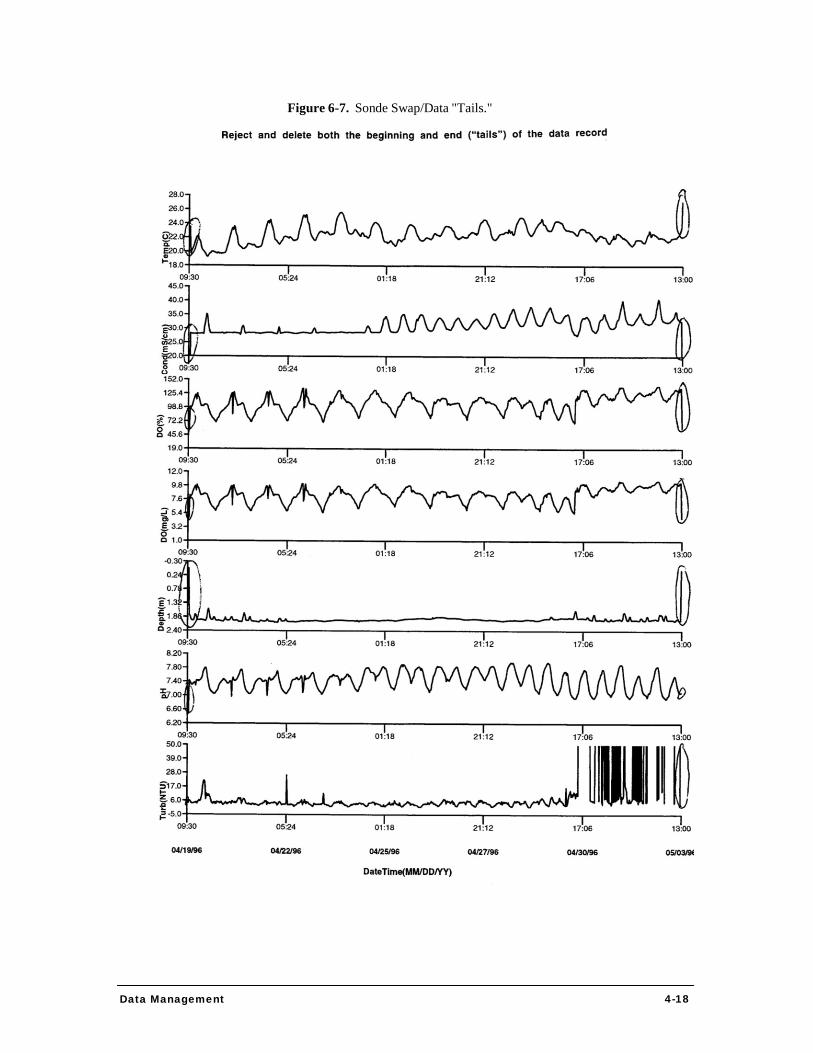
Figure 6-7. Sonde Swap/Data "Tails."
Data Management 4-18

Figure 6-8. Temperature Probe Failure.
Data Management 4-19
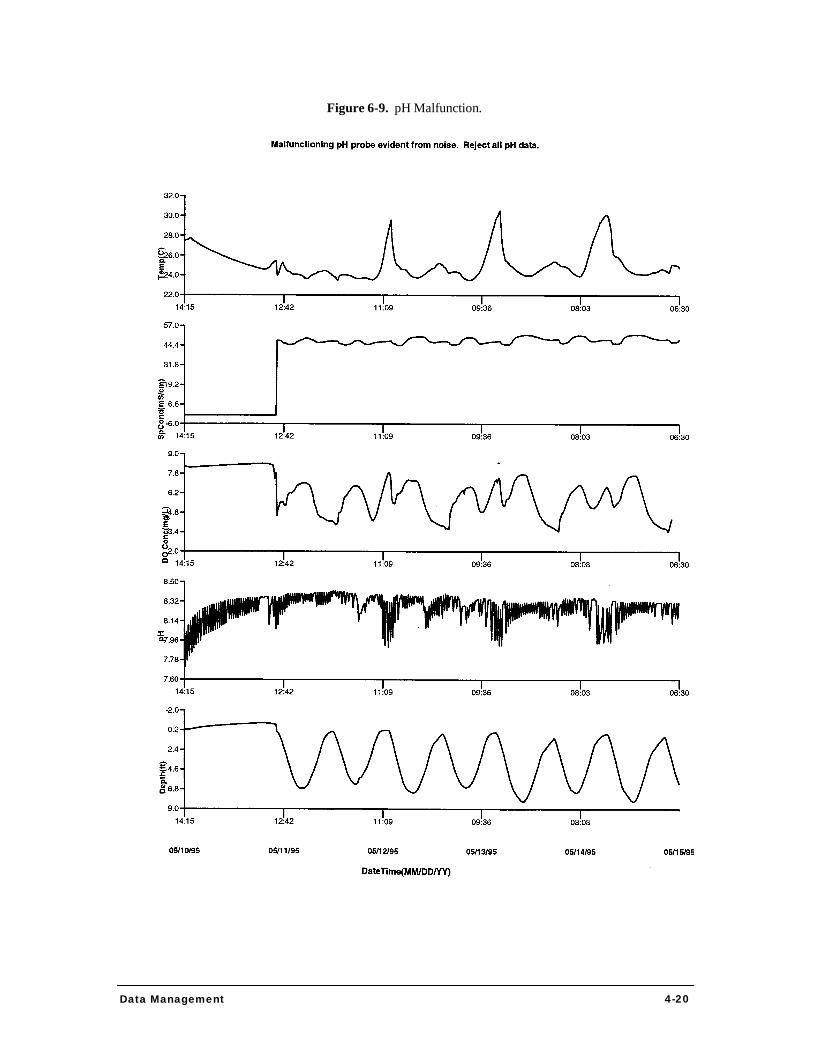
Figure 6-9. pH Malfunction.
Data Management 4-20
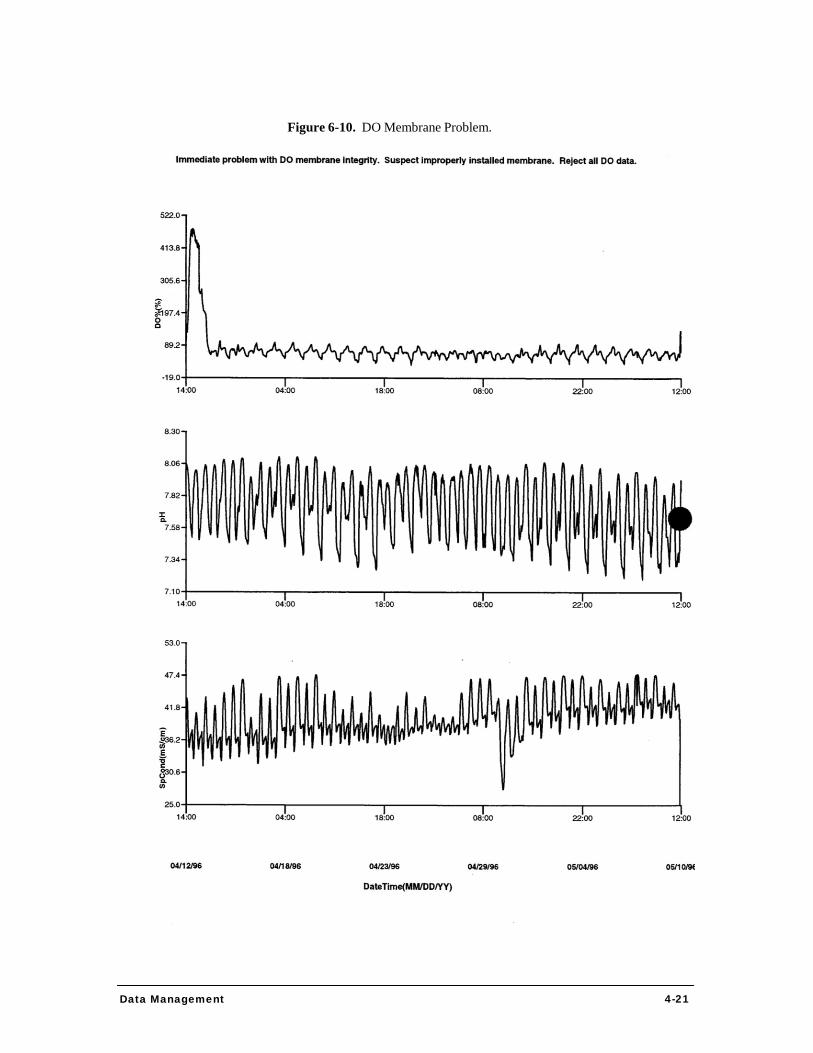
Figure 6-10. DO Membrane Problem.
Data Management 4-21
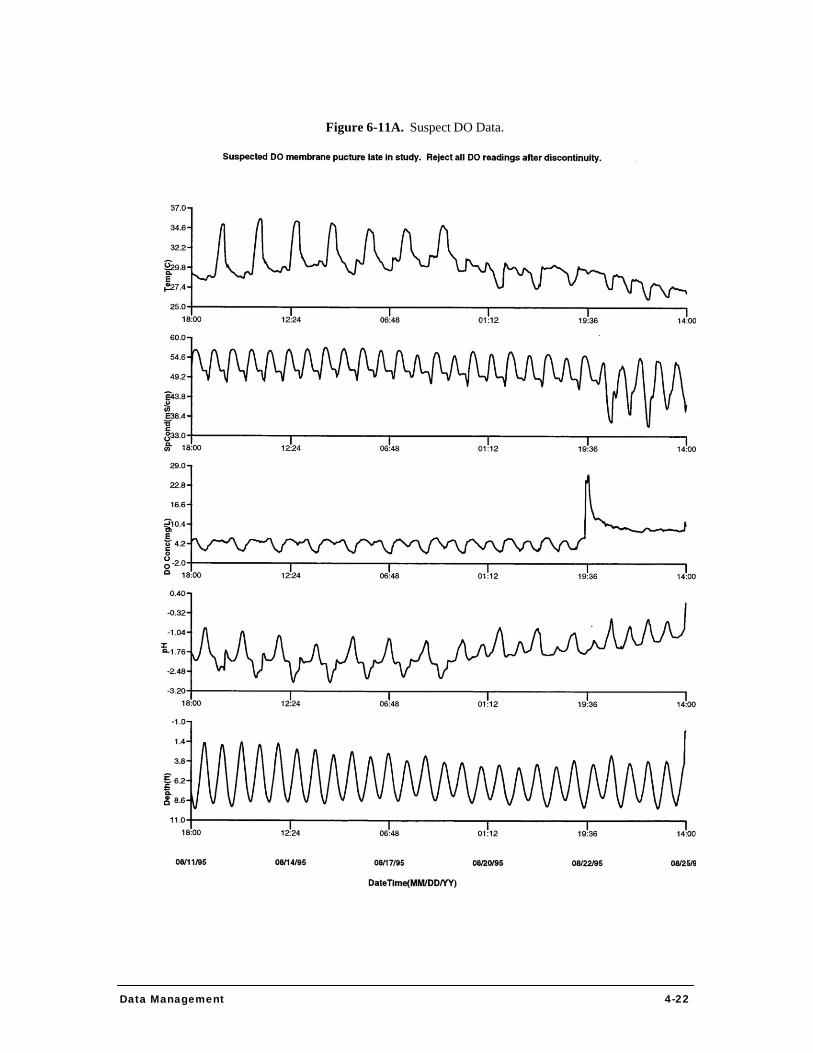
Figure 6-11A. Suspect DO Data.
Data Management 4-22
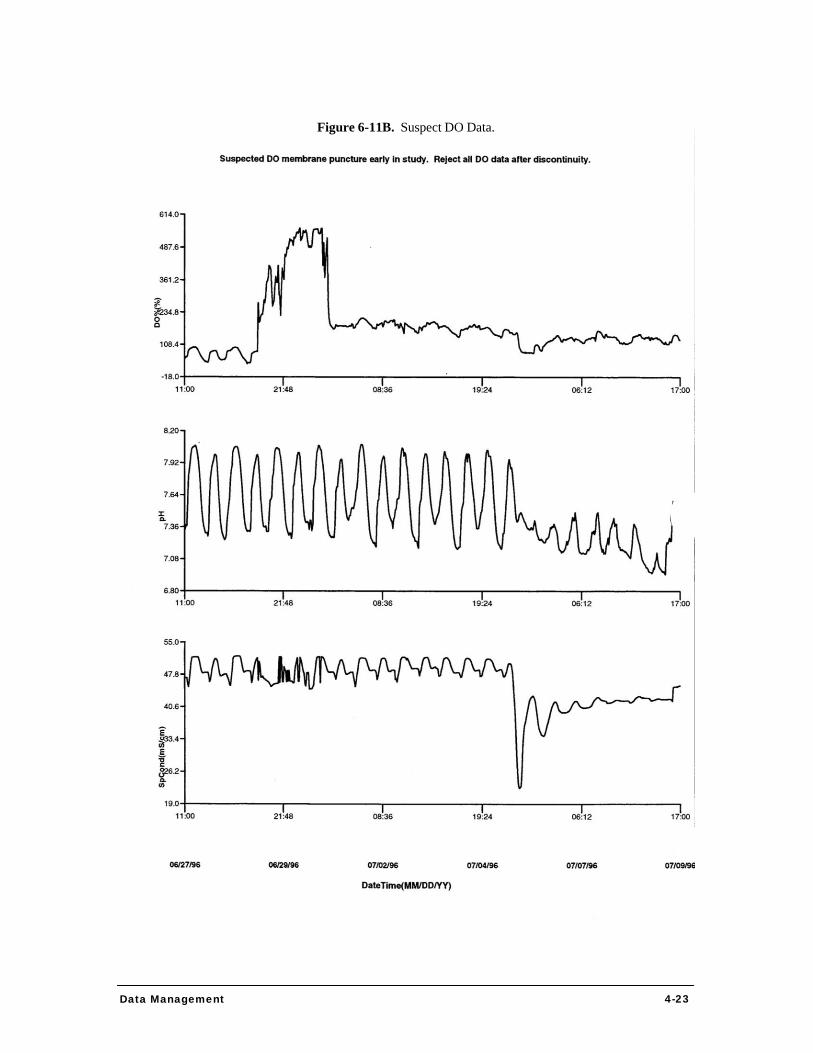
Figure 6-11B. Suspect DO Data.
Data Management 4-23
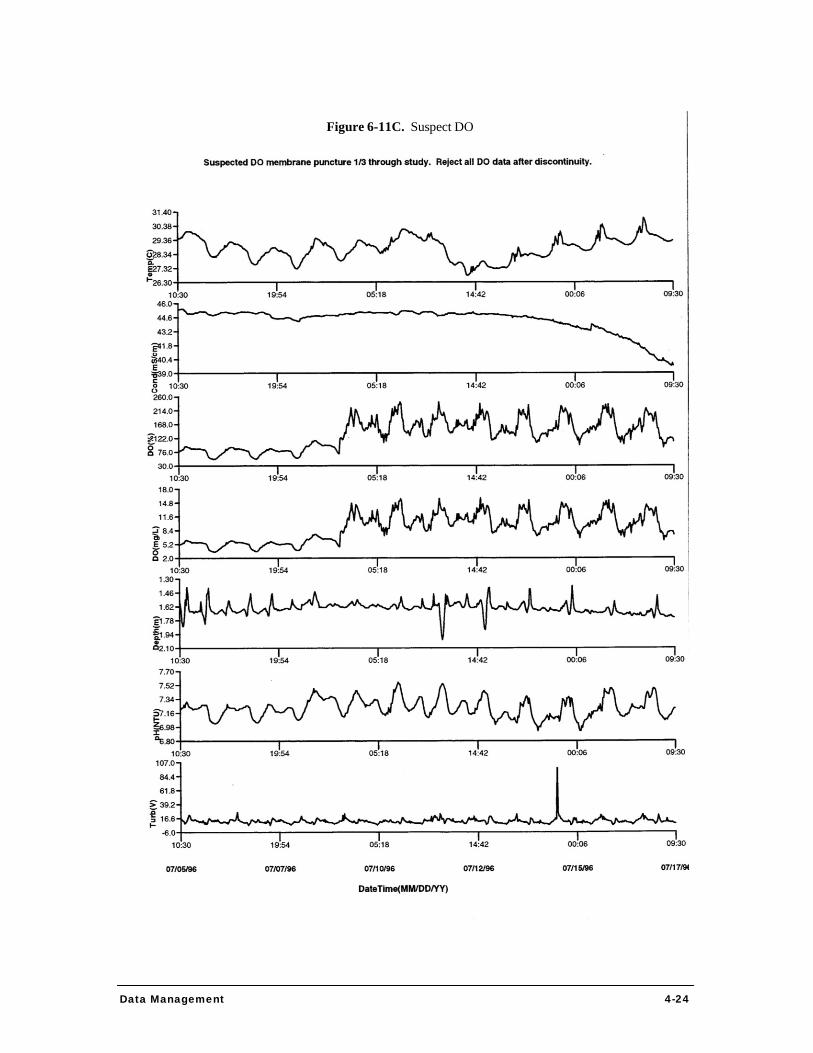
Figure 6-11C. Suspect DO
Data Management 4-24
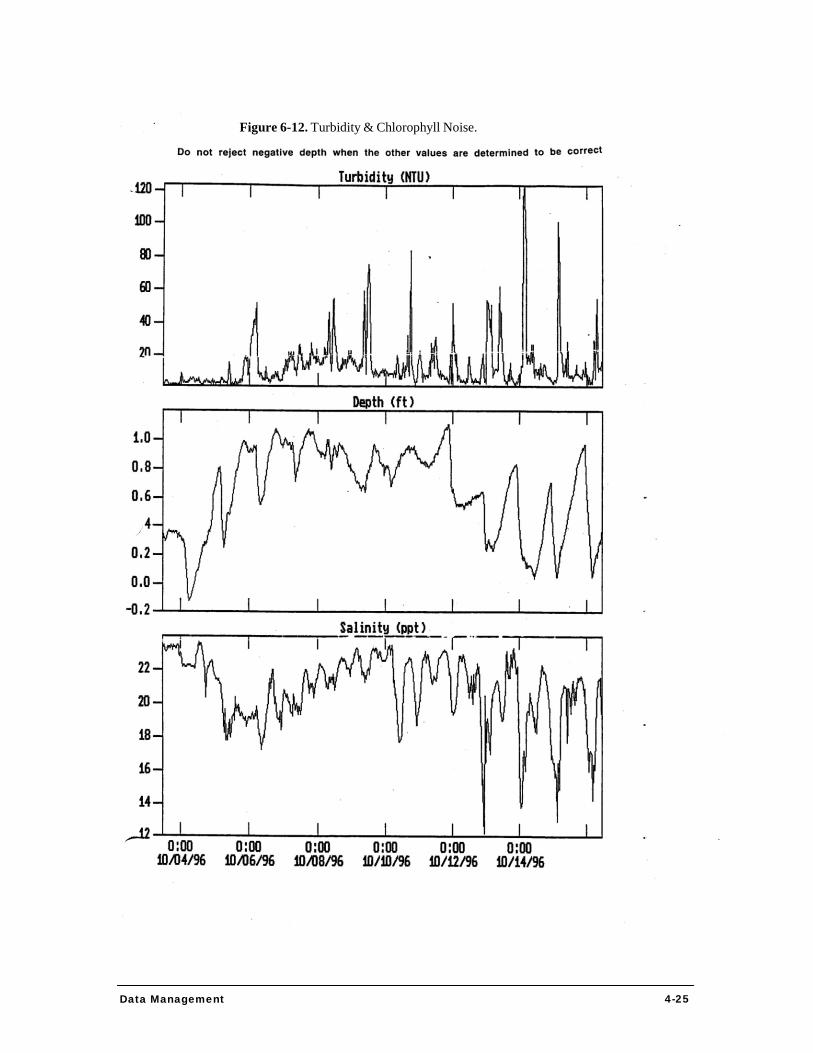
Figure 6-12. Turbidity & Chlorophyll Noise.
Data Management 4-25

Figure 6-13. Turbidity Probe Failure.
Data Management 4-26
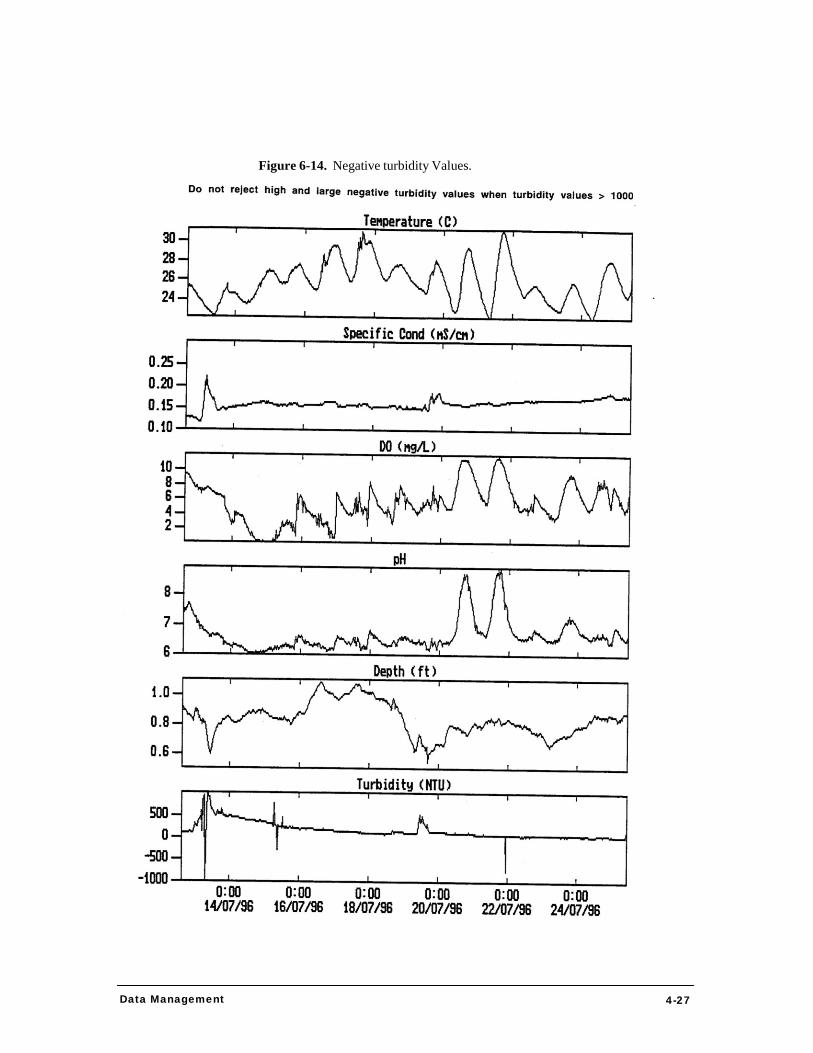
Figure 6-14. Negative turbidity Values.
Data Management 4-27
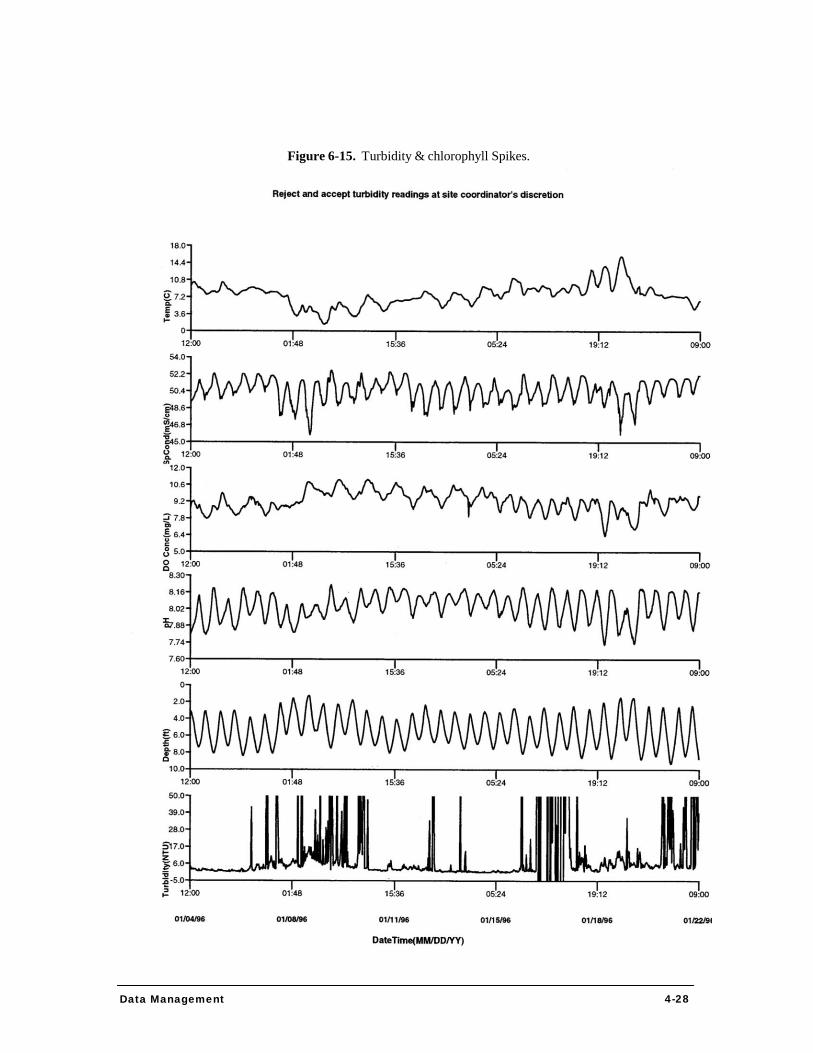
Figure 6-15. Turbidity & chlorophyll Spikes.
Data Management 4-28

Figure 6-16. Highly Negative Turbidity Readings.
Data Management 4-29
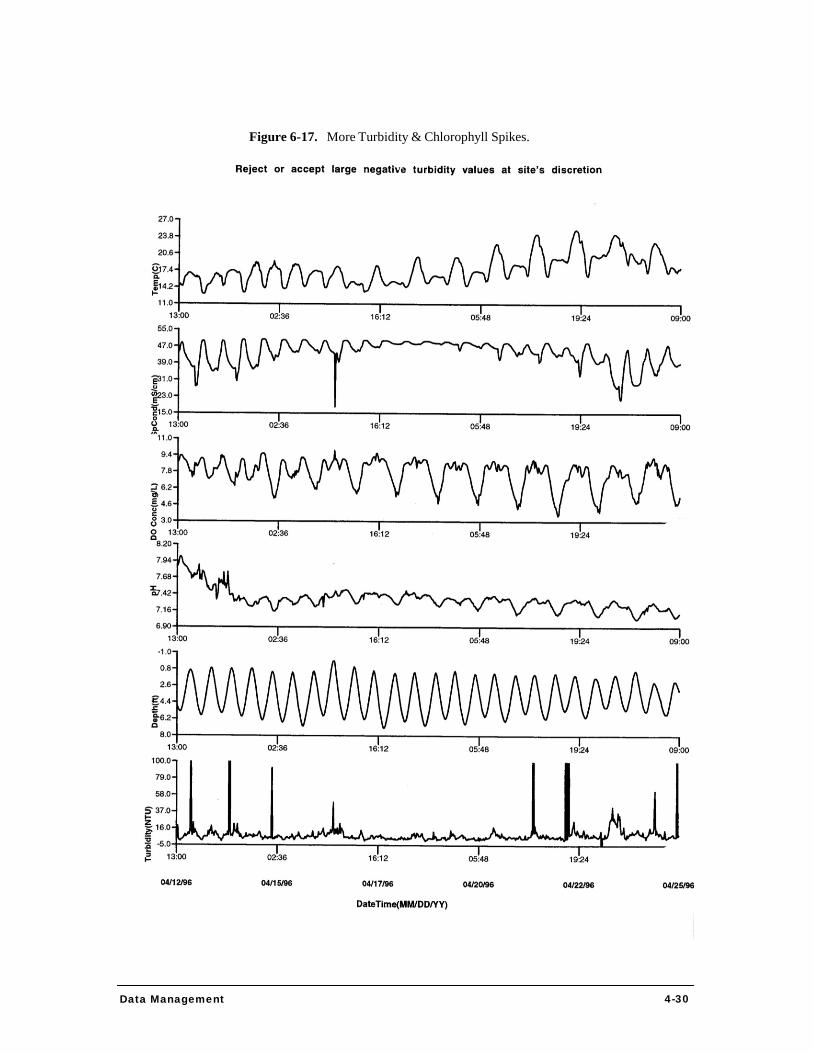
Figure 6-17. More Turbidity & Chlorophyll Spikes.
Data Management 4-30
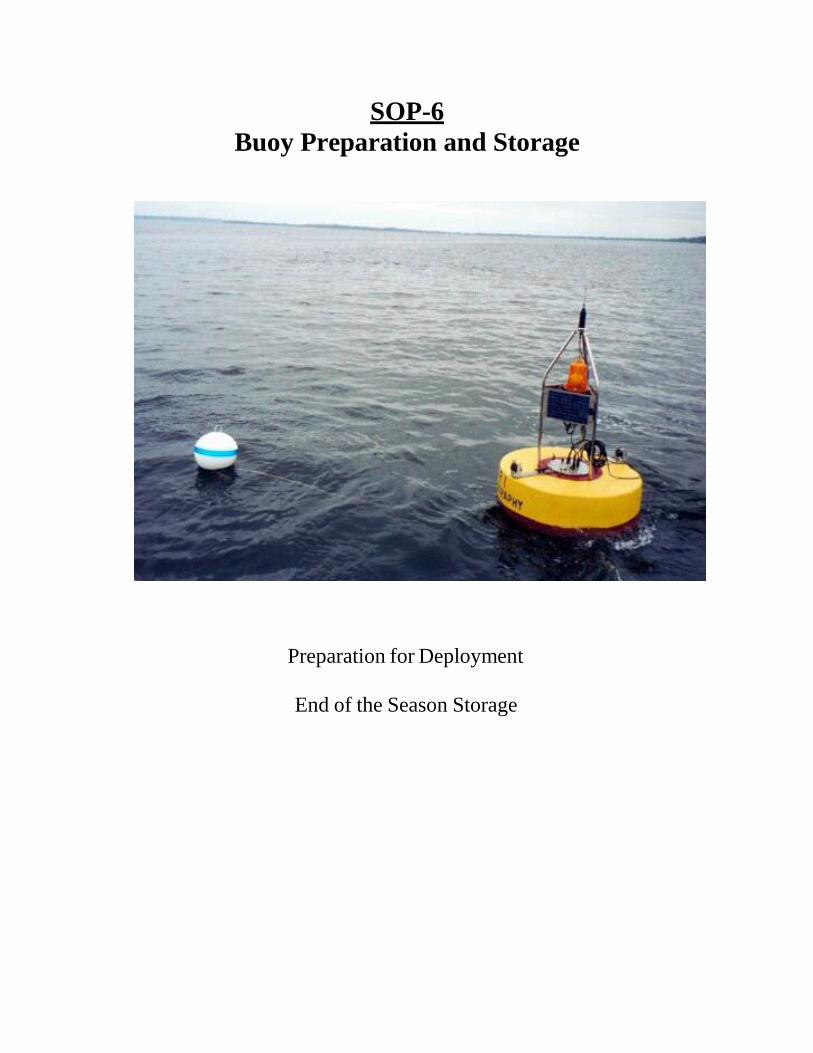
SOP-6 Buoy Preparation and Storage
Preparation for Deployment
End of the Season Storage
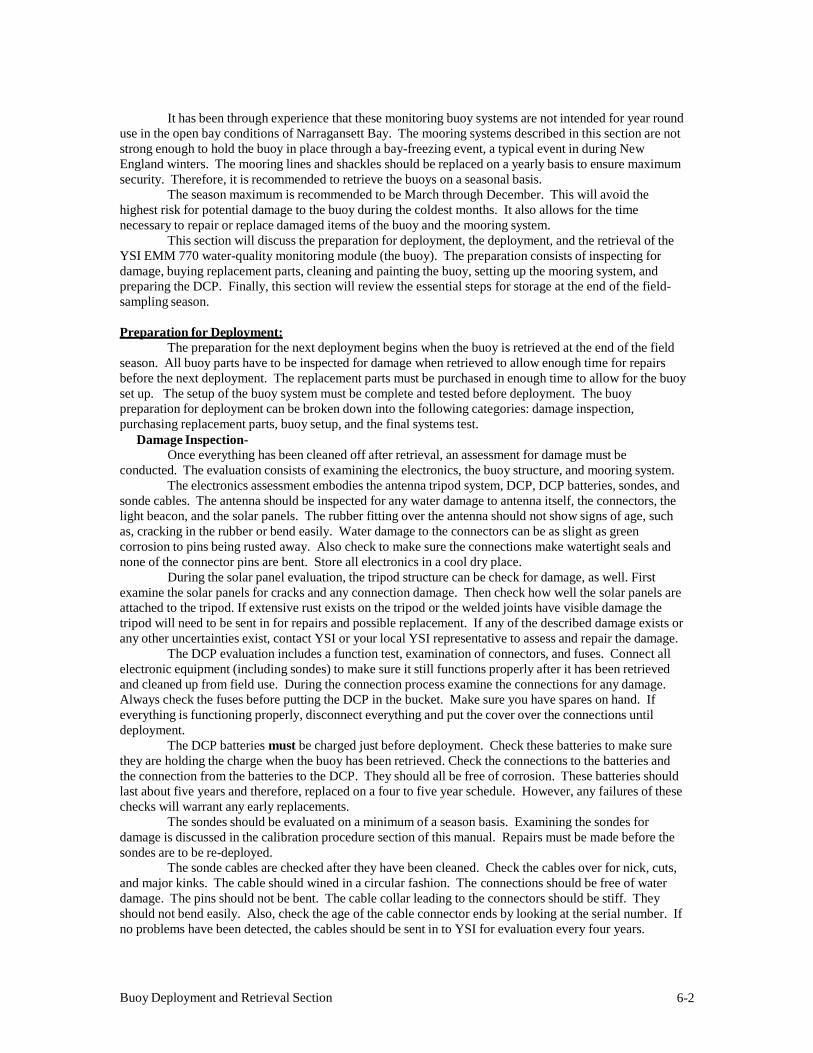
It has been through experience that these monitoring buoy systems are not intended for year round use in the open bay conditions of Narragansett Bay. The mooring systems described in this section are not strong enough to hold the buoy in place through a bay-freezing event, a typical event in during New England winters. The mooring lines and shackles should be replaced on a yearly basis to ensure maximum security. Therefore, it is recommended to retrieve the buoys on a seasonal basis.
The season maximum is recommended to be March through December. This will avoid the highest risk for potential damage to the buoy during the coldest months. It also allows for the time necessary to repair or replace damaged items of the buoy and the mooring system.
This section will discuss the preparation for deployment, the deployment, and the retrieval of the YSI EMM 770 water-quality monitoring module (the buoy). The preparation consists of inspecting for damage, buying replacement parts, cleaning and painting the buoy, setting up the mooring system, and preparing the DCP. Finally, this section will review the essential steps for storage at the end of the field- sampling season.
Preparation for Deployment: The preparation for the next deployment begins when the buoy is retrieved at the end of the field
season. All buoy parts have to be inspected for damage when retrieved to allow enough time for repairs before the next deployment. The replacement parts must be purchased in enough time to allow for the buoy set up. The setup of the buoy system must be complete and tested before deployment. The buoy preparation for deployment can be broken down into the following categories: damage inspection, purchasing replacement parts, buoy setup, and the final systems test.
Damage Inspection- Once everything has been cleaned off after retrieval, an assessment for damage must be
conducted. The evaluation consists of examining the electronics, the buoy structure, and mooring system. The electronics assessment embodies the antenna tripod system, DCP, DCP batteries, sondes, and
sonde cables. The antenna should be inspected for any water damage to antenna itself, the connectors, the light beacon, and the solar panels. The rubber fitting over the antenna should not show signs of age, such as, cracking in the rubber or bend easily. Water damage to the connectors can be as slight as green corrosion to pins being rusted away. Also check to make sure the connections make watertight seals and none of the connector pins are bent. Store all electronics in a cool dry place.
During the solar panel evaluation, the tripod structure can be check for damage, as well. First examine the solar panels for cracks and any connection damage. Then check how well the solar panels are attached to the tripod. If extensive rust exists on the tripod or the welded joints have visible damage the tripod will need to be sent in for repairs and possible replacement. If any of the described damage exists or any other uncertainties exist, contact YSI or your local YSI representative to assess and repair the damage.
The DCP evaluation includes a function test, examination of connectors, and fuses. Connect all electronic equipment (including sondes) to make sure it still functions properly after it has been retrieved and cleaned up from field use. During the connection process examine the connections for any damage. Always check the fuses before putting the DCP in the bucket. Make sure you have spares on hand. If everything is functioning properly, disconnect everything and put the cover over the connections until deployment.
The DCP batteries must be charged just before deployment. Check these batteries to make sure they are holding the charge when the buoy has been retrieved. Check the connections to the batteries and the connection from the batteries to the DCP. They should all be free of corrosion. These batteries should last about five years and therefore, replaced on a four to five year schedule. However, any failures of these checks will warrant any early replacements.
The sondes should be evaluated on a minimum of a season basis. Examining the sondes for damage is discussed in the calibration procedure section of this manual. Repairs must be made before the sondes are to be re-deployed.
The sonde cables are checked after they have been cleaned. Check the cables over for nick, cuts, and major kinks. The cable should wined in a circular fashion. The connections should be free of water damage. The pins should not be bent. The cable collar leading to the connectors should be stiff. They should not bend easily. Also, check the age of the cable connector ends by looking at the serial number. If no problems have been detected, the cables should be sent in to YSI for evaluation every four years.
Buoy Deployment and Retrieval Section 6-2
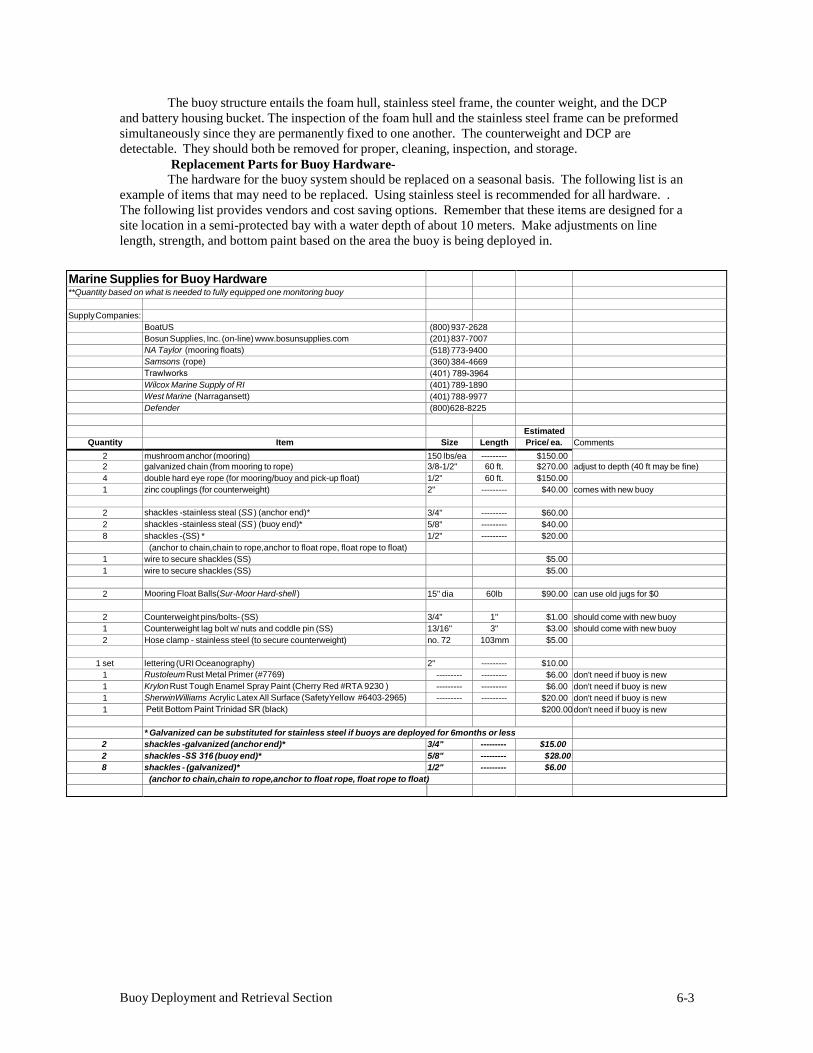
The buoy structure entails the foam hull, stainless steel frame, the counter weight, and the DCP and battery housing bucket. The inspection of the foam hull and the stainless steel frame can be preformed simultaneously since they are permanently fixed to one another. The counterweight and DCP are detectable. They should both be removed for proper, cleaning, inspection, and storage.
Replacement Parts for Buoy Hardware- The hardware for the buoy system should be replaced on a seasonal basis. The following list is an
example of items that may need to be replaced. Using stainless steel is recommended for all hardware. . The following list provides vendors and cost saving options. Remember that these items are designed for a site location in a semi-protected bay with a water depth of about 10 meters. Make adjustments on line length, strength, and bottom paint based on the area the buoy is being deployed in.
Marine Supplies for Buoy Hardware **Quantity based on what is needed to fully equipped one monitoring buoy
Supply Companies: BoatUS (800) 937-2628 Bosun Supplies, Inc. (on-line) www.bosunsupplies.com (201) 837-7007 NA Taylor (mooring floats) (518) 773-9400 Samsons (rope) (360) 384-4669 Trawlworks (401) 789-3964 Wilcox Marine Supply of RI (401) 789-1890 West Marine (Narragansett) (401) 788-9977 Defender (800)628-8225
Estimated Quantity Item Size Length Price/ ea. Comments
2 mushroom anchor (mooring) 150 lbs/ea --------- $150.00 2 galvanized chain (from mooring to rope) 3/8-1/2" 60 ft. $270.00 adjust to depth (40 ft may be fine) 4 double hard eye rope (for mooring/buoy and pick-up float) 1/2" 60 ft. $150.00 1 zinc couplings (for counterweight) 2" --------- $40.00 comes with new buoy
2 shackles -stainless steal (SS ) (anchor end)* 3/4" --------- $60.00 2 shackles -stainless steal (SS ) (buoy end)* 5/8" --------- $40.00 8 shackles -(SS) * 1/2" --------- $20.00
(anchor to chain,chain to rope,anchor to float rope, float rope to float) 1 wire to secure shackles (SS) $5.00 1 wire to secure shackles (SS) $5.00
2 Mooring Float Balls(Sur-Moor Hard-shell ) 15" dia 60lb $90.00 can use old jugs for $0
2 Counterweight pins/bolts- (SS) 3/4" 1" $1.00 should come with new buoy 1 Counterweight lag bolt w/ nuts and coddle pin (SS) 13/16" 3" $3.00 should come with new buoy 2 Hose clamp - stainless steel (to secure counterweight) no. 72 103mm $5.00
1 set lettering (URI Oceanography) 2" --------- $10.00 1 Rustoleum Rust Metal Primer (#7769) --------- --------- $6.00 don't need if buoy is new 1 Krylon Rust Tough Enamel Spray Paint (Cherry Red #RTA 9230 ) --------- --------- $6.00 don't need if buoy is new 1 SherwinWilliams Acrylic Latex All Surface (SafetyYellow #6403-2965) --------- --------- $20.00 don't need if buoy is new 1 Petit Bottom Paint Trinidad SR (black) $200.00 don't need if buoy is new
* Galvanized can be substituted for stainless steel if buoys are deployed for 6months or less2 shackles -galvanized (anchor end)* 3/4" --------- $15.00 2 shackles -SS 316 (buoy end)* 5/8" --------- $28.00 8 shackles - (galvanized)* 1/2" --------- $6.00
(anchor to chain,chain to rope,anchor to float rope, float rope to float)
Buoy Deployment and Retrieval Section 6-3

Buoy Setup- Once all replacement parts have been received and a deployment date has been set, the buoy can
be setup for deployment. The new mooring systems can be assembled at anytime. The next step consists of cleaning and painting the buoy hull, counterweight, sonde support systems, and the sondes and sensors just prior to deployment. The electronics need to be setup for a systems check. The systems check should be done several times before deployment with a final system check the day before deployment. The final setup of securing the moorings to the buoy and securing the sondes to the buoy are completed during the actually deployment.
As soon as the replacement parts have been purchased, the mooring lines, chain, pick-up line, and mooring should be shackled together. The shackles should be ceased to prevent loosening during deployment. Do NOT shackle the mooring system to the buoy until the deployment. The mooring system needs to be separate from the buoy for transportation purposes. Examples of mooring systems are as follows:
Mooring Systems-
Figure 3-1. Two-Point Mooring System Figure 3-2. Counterweight and Mounting tube.
The second step in setting up a buoy for deployment requires cleaning and painting the buoy. A copper-based anti-fouling paint is recommended. YSI recommends Pettit Trinidad SR p/n 1877 for the buoy and the sensors. The lettering and contact info should be put on after the buoy has been cleaned and painted. The following is a list of procedures for cleaning, prepping, and painting of all buoy equipment:
Cleaning and Painting- 1. Clean all surfaces at the end of the season and at the beginning of the next sampling season.
Power washing is recommended. The end of season cleaning prevents damage from salt deposits. The beginning of season cleaning helps to prep surfaces for painting.
2. Prep surfaces for painting. Sanding or scrapping of old chipped paint may be necessary.Apply tape to guide painting process.
Always, wear appropriate safety gear. Anti-fouling paint is harmful! 3. Apply one coat at a time. Let dry for 24 hours between coats. Thick coats may help deter
growth. Paint in a cool, well ventilated, and dry place. Leave space for anodes on counterweight, etc.
Anti-fouling paint should be applied just prior to deployment (1-2 weeks). The paint's effectiveness will deteriorate if painted too far in advance.
4. The sonde, sensors, and their buoy support structures should be painted, as well. Refer torecommendations by YSI on painting process for YSI sondes and sensors.Remember: Two thin coats are better than one thick one.
5. The bucket that holds the electronics should be cleaned. The o-ring lip to the bucket must besmooth and free of any debris to be able to create an airtight seal. Once these steps have beencompleted the buoy is ready for the electronics.
Buoy Deployment and Retrieval Section 6-4
The electronics consist of the DCP, two batteries, and the antenna tripod. The DCP and other equipment must be prepped before installing it in the bucket. The DCP stainless steal plate should be cleaned when retrieved from the field. It should be stored in a clean, dry place and covered to prevent dust from possibly damaging the electronics of the DCP. The following are the procedures for preparing the DCP for deployment:
DCP Installation- 1. Take out of storage and clean the bottom side of the DCP cover. This side of the DCP must
be free of dirt to ensure and air tight seal.2. Charge the DCP batteries. Sometimes requires 24 hours.3. Connect the fully charged batteries to the DCP and listen for a long beep. The long beep
indicates power is getting to the DCP.4. Direct connect to the DCP to check proper function. Back–up configuration files. Then
disconnect and prepare DCP and batteries to be installed in the buoy bucket.5. Once charged, install the batteries and the protective bar across the top allowing the power
cable to pass through.6. Insert desiccant into the bucket. Several are better than just one.7. Connect the power cable to the DCP. You should hear a beep as the DCP powers up.8. Apply vacuum grease to the underside of the bucket and the o-ring for the bucket. Then
place the DCP on top of the bucket. Make sure o-ring stays in the grove of the bucket. Becareful not to pinch or dent o-ring. Seal using Allen screws.
9. Once this is completed take the air vent off apply a vacuum seal to make sure the seal holds.Replace the valve.
10. Best to connect DCP and seal bucket and deploy either with buoy or after deployment.11. Once in field, after the DCP has been properly attached, attach the solar panel. Use lock
washers to secure it on the buoy frame. Connect the power and communication cables to theDCP ports and install sondes and cables to complete the DCP setup. The beacon should flashabout every 4 seconds.
Be sure to use sondes and sensors that you plan on using at the buoy site. The buoy is now ready for its systems test, deployment, and use.
End of Field Season Storage: Storage Options- 1. All items can be stored indoors once cleaned. This is the best option to aviod possible rusting
of steel components. Make sure all electronics power are disconnected for storage.2. The buoy and mooring systems can be stored outdoors, if indoor facilities are not available.
All items should be cleaned and covered with a tarp when possible.3. For sonde and DCP storage refer to YSI manual, calibration section of this manual,
Campbell Scientific, and/or YSI 6200 manual. ALL ELECTRONICS MUST BE STORED IN A TEMPERATURE CONTROLLED ENVIRONMENT!
Buoy Deployment and Retrieval Section 6-5