urrlted saw33 qcntnl accauntlnfg office gao i
TRANSCRIPT
GAO Urrlted Saw33 Qcntnl Accauntlnfg Office
I%-= Evaluation and Methodology - . .
.
GAO/-10.1.4


Preface
GAO assists congressional decisionmakers in their deliberative process by furnishing analytical infor- mation on issues and options under consideration. Many diverse methodologies are needed to develop sound and timely answers to the questions that are posed by the Congress. To provide GAO evaluators with basic information about the more commonly used methodologies, GAO’s policy guidance includes documents such as methodology transfer papers and technical guidelines.
This methodology transfer paper addresses the logic of program evaluation designs. It provides a systematic approach to designing evaluations that takes into account the questions guiding a study, the constraints evaluators face in conducting it, and the information needs of its intended user. Taking the time to design evaluations carefully is a critical step toward ensuring overall job quality. Indeed, the most important outcome of a careful, sound design should be an evaluation whose quality is high in quite specific ways.
Evaluation designs are characterized by the manner in which the evaluators have
l defined and posed the evaluation questions for study,
l developed a methodological approach for answering those questions,
l formulated a data collection plan that anticipates problems, and
. detailed an analysis plan for answering the study questions with appropriate data.
Designing Evaluations is a guide to the successful completion of these design tasks. It also provides a discussion of three kinds of evaluation questions- descriptive, normative, and causal-and various methodological approaches appropriate to each one. For illustration, the paper contains a narration of a design undertaken by the Program Evaluation and
Page 1 GAO/‘PEAtD10.1.4 Desk Eva.l~~~tiona

Preface
Methodology Division (PEMD) in response to a con- gressional request. The original paper was authored by Ray Rist and Carl Wisler in July 1984. This reis- sued (1991) version, prepared by Carl Wisler, supersedes the earlier edition.
Designing Evaluations is one of a series of papers issued by the Program Evaluation and Methodology Division. The purpose of the series is to provide GAO evaluators with guides to various aspects of audit and evaluation methodology, to illustrate applications, and to indicate where more detailed information is available.
We look forward to receiving comments from the readers of this paper. They should be addressed to Eleanor Chelimsky at 202-275-1854.
Werner Grosshans Assistant Comptroller General Office of Policy
L azq Eleanor Chelimsky Assistant Comptroller General for Program Evaluation and Methodology
Page 2 GAO/PEMIHO.lA Deei Ehluations

Y
Page 3 GAO/PEMD-10.1.4 Ih@irtg Evaluations
contents
Preface
Chapter 1 Why Spend Time on Design?
1
6
Chapter 2 The Design Process
Chapter 3
Asking the Right Question Considering the Evaluation’s Constraints Assessing the Design
11 11 19 24
28 Typ& of Design The Sample Survey 30
The Case Study 40 The Field Exp&iment The Use of Available Data Linking a Design to the Evaluation
Questions
47 58 63
Chapter 4 67 Developing a Design: An Example
The Context The Request Design Phase 1: Finding an Approach Design Phase 2: Assessing Alternatives Design Phase 3: Settling on a Strategy
67 68 70 72 77
Bibliography 79
Glossary 87
Papers in This Series
90
Tables Table 3.1: Evaluation Strategies and Types of Design
28
Page 4 GAO/PEMD10.1.4 Desii Evaluation
Y
1
I
Contenta
Table 3.2: Characteristics of Four Evaluation Strategies
29
Table 3.3: Some Basic Contrasts Between Three Field Experiment Designs
48
Figure Figure 3.1: Linking a Design to the Evaluation Questions
64
Abbreviations
GAO JSARP PEMD
WIN
Aid to Families with Dependent Children U.S. General Accounting Office Job Search Assistance Research Project Program Evaluation and Methodology
Division Work Incentive
Page 6 GAO,‘PEMD10.1.4 DesIging Evaluations

Chapter 1
Why Spend Time on Design?
According to a Chinese adage, even a thousand-mile journey must begin with the first step. The likeli- hood of reaching one’s destination is much enhanced if the first step and the subsequent steps take the traveler in the correct direction, Wandering about here and there without a clear sense of pur- pose or direction consumes time, energy, and resources. It also diminishes the possibility that one will ever arrive. One can be much more prepared for a journey by collecting the necessary maps, studying alternative routes, and making informed estimates of the time, costs, and hazards one is likely to confront.
It is no less true that front-end planning is neces- sary to designing and implementing an evaluation successfully. Systematic attention to evaluation design is a safeguard against using time and resources ineffectively, It is also a safeguard against performing an evaluation of poor quality and limited usefulness.
The goal of the evaluation design process is, of course, to produce a design for a particular evalua- tion. But what exactly is an evaluation design? Because there may be different views about the answer to this question, it is well to state what is understood in this paper. Evaluation pertains to the systematic examination of events or conditions that have (or are presumed to have) occurred at an ear- lier time or that are unfolding as the evaluation takes place. But to be examined, these events or conditions must exist, must be describable, must have occurred or be occurring. Evaluation is, thus, retrospective in that the emphasis is on what has been or is being observed, not on what is likely to happen (as in forecasting).lThe designs and the design process outlined in this paper are focused on the observed performance of completed or ongoing programs.
‘Despite the retrospective character of evaluation, program evs.,- uation findings can often be used as a sound basis for calculating future costs or projecting the likely effects of a program.
n
Page 6 GAO,‘PEMD10.1.4 Desiging Evaluations

chapter 1 Why Spend Time on Deeigu?
To further characterize evaluation design, it is useful to look closely at the questions we pose and the answers we seek. Evaluation questions can be divided into three kinds: descriptive questions, nor- mative questions, and impact (cause-and-effect) questions. The answers to descriptive questions provide, as the name implies, descriptive informa- tion about specific conditions or events-the number of people who received Medicaid benefits in 1990, the construction cost of a nuclear power plant, and so on. The answers to normative ques- tions (which, unlike descriptive questions, focus on what should be rather than what is) compare an observed outcome to an expected level of perform- ance. An example is the comparison between airline safety violations and the standard that has been set for safety. The answers to impact (cause-and- effect) questions help reveal whether observed con- ditions or events can be attributed to program oper- ations. For example, if we observe changes in the weight of newborns, what part of those changes is the effect of a federal nutrition program? In sum, the design ideas presented here are aimed at pro- ducing answers to descriptive, normative, and impact (cause-and-effect) questions.
Given these questions, what elements of a design should be specified before information is collected? The most important elements can be listed as
kind of information to be acquired, sources of information (for example, types of respondents), methods to be used for sampling sources (for example, random sampling), methods of collecting information (for example, structured interviews and self-administered questionnaires), timing and frequency of information collection, basis for comparing outcomes with and without a program (for impact or cause-and-effect questions), and analysis plan.
Page 7 GAO/PEMD10.1.4 Desiging Evaluations
Y

Chapter 1 Why Spend Time on Design?
They form the basis on which a design is con- structed. As will be seen, the choices that are made for each element are major determinants of the quality of the information that can be acquired, the strength of the conclusion that can be drawn, and the evaluation’s cost, timeliness, and usefulness.
Before each component in this design process is identified and discussed, it would be well to address systematically why it is important to take the time to be concerned with evaluation design. First, and probably most importantly, careful, sound design enhances quality. But it is also likely to contain costs and ensure the timeliness of the findings, especially when the evaluation questions are diffi- cult and complex. Further, good design increases the strength and specificity of findings and recom- mendations, decreases vulnerability to methodolog- ical criticism, and improves customer satisfaction,
In thinking about these reasons for taking time to design an evaluation carefully, one may well find that guaranteeing evaluation quality is the preemi- nent concern, the critical dimension of the design effort. Stated differently, the most important out- come of a careful, sound design should be that the overall quality of the evaluation is enhanced in a number of specific ways.
An evaluation design can usually be recognized by the way it has
1. defined and posed the evaluation questions for study,
2. developed the methodological strategies for answering these questions,
3. formulated a data collection plan that anticipates and addresses the problems and obstacles that are likely to be encountered, and
Page 8 GAO/PlWDlO.l.4 De&&g Evaluations
Chapter 1 Why Spend The on Deeign?
4. detailed an analysis plan that will ensure that the questions that are posed are answered with the appropriate data in the best possible fashion.
A well-designed evaluation will be more powerful and germane than one in which attention has not been paid to laying out the methodological strategy and planning the data collection and analysis care- fully. It will also develop a stronger foundation and be more convincing in its conclusions and recom- mendations. Implementation also will be strength- ened, because once the design has been established, less time will be lost in having to make ad hoc deci- sions about what to do next. Good front-end plan ning can substantially reduce the many uncertainties of an evaluation. It helps provide a clear sense of direction and pm-pose to the effort.
Similarly, good front-end planning contains evalua- tion costs by preventing (1) “down time” from making sporadic and episodic decisions on what to do next, (2) waste of staff time on the collection and analysis of data that are irrelevant to the question, (3) duplication of data collection, and (4) unplanned data analysis in a search for relevant findings. It must be recognized that careful attention to design does take time and does necessitate front-end costs. However, the investment can save time and costs later in the evaluation, and this is especially true for big, complex projects. There is, of course, no assurance that careful work will require less expen- diture of resources than ill-defined studies.
Attention to the design process also makes for high quality by focusing on the usefulness of the product to the intended recipient. If attention is paid to the needs of the user in terms of information or recom- mendations, the design process can systematically address these needs and make sure that they are integrated into the project. In this way, the rele- vance of an evaluation can be strengthened by tying
Page 9 GAO/PEMB1O.1.4 Desighg Evahatio~~~
chapter 1 Why Spend Time on De&i?
it specifically to the concerns of its user. In addi- tion, a concern with relevance is likely to increase the user’s satisfaction with the product.
A sound design can help ensure timeliness. A tight and logical design can reduce the time that accumu- lates on a project because of excessive or unneces- sary data collection, the lack of a clear data analysis plan, or the constant “cooking” of the data, as when the omission of a sound methodological strategy has made it impossible to answer the eval- uation questions directly. The timeliness of findings with respect to the needs of the customer can make or break a technically adequate approach. It is not enough that a study be conducted with a high degree of technical precision to argue for its quality; the study must also be conducted in time to allow the findings to be of service to the user.
In summary, to spend the time to develop a sound design is to invest time in building high quality into the effort. Devoting attention to evaluation design means that factors that will affect the quality of the results can be addressed. Not allowing the time that is necessary for this vital stage of the project is, in the end, self-defeating. It can be a crippling, if not a fatal, blow to any evaluation that skips quickly through this step. The pressure of wanting to get into the field as soon as possible has to be held in check while systematic planning takes place. The design is what guides the data collection and analysis.
Having looked at why it is important to design evalu- ations well, we can turn our attention to the various components and processes that are inherent in eval- uation design. Our discussion is in five major parts: asking the right question, adequately considering the constraints, assessing the design, settling on a strategy that considers strengths and weaknesses, and rigorously monitoring the design and incorpo- rating it into the management strategies of the per- sons who are responsible for the evaluation.
Page 10 GAO/PEMD-10.1.4 Deaiging Ehmluations
Chapter 2
The Design Process
Asking the Right The first and surely the most fundamental aspect of
Question every design effort is to ensure that the questions that are posed for the evaluation are the correct ones.’ Posing a question incorrectly is an excellent way to lead a study in the wrong direction. It is obvious that one must ask the right question, but deciding what is exactly the “right question” is not necessarily easy* In fact, reaching agreement with the sponsors, users, program operators, and others on the contents and implications of a question can be difficult and challenging. Among the several rea- sons for the strenuousness of the task is that the formulation of a problem has preeminent impor- tance in the remaining phases of the evaluation. How a problem is stated has implications for the kinds of data to be collected, the sources of data, the analyses that will be necessary in trying to answer the question, and the conclusions that will be drawn.
Consider a brief example: juvenile delinquency and the question of what motivates young people to commit delinquent acts. The question about motiva- tion could be posed in a variety of ways. One could ask about the personality traits of young persons and whether particular traits are associated with differences in who does or does not commit crimes. Asking the question this way entails data, data sources, and program initiatives that are different from those that are required in examining, for example, the social conditions of young persons; here, the focus might be on family life, schooling, peer groups, employment opportunities, or the like. To stretch the example further, each of these two ways of posing the question about what motivates juveniles to commit crime would lead to evaluations quite different from either asking whether juveniles commit crimes because of a temporary hormonal
‘Often studies have more than one key question or a cluster of questions. Every question has to be given the same serious attention.
Page 11 GAO/PEMD10.1.4 Desiging Evaluations

Chapter 2 The Design Process
imbalance or asking whether a youth culture uses crime as a “rite of passage” into adulthood.
Posing a question in four quite different ways shows clearly how the way in which a problem is stated has implications for an evaluation design. How an issue is defined influences directly how variables or dimensions are to be selected and examined and how the analysis will test the strength of the relationship between a cause and its expected consequence.
Question formulation is important also in that the concerns of the customer must be attended to. How a question is framed has to take the information needs and spheres of influence of the intended audi- ence into consideration. Does the customer need to know the general effectiveness of a nationwide pro- gram? Or is the concern limited, for example, to individual problem sites and public attitudes to the program in those sites? The difference of type in these two questions is extremely important for evaluation design, and attention to the difference allows the evaluator to help make the job useful to its sponsor.
Clarifying the Issue Working toward the formulation of the right ques- tion has two phases (Cronbach, 1982, pp. 210-44). In the first phase, the largest number and widest range of potential questions (and methods by which to address these questions) ought to be considered, even if they do not seem especially plausible or defensible. For example, congressional staff often begin with a very broad concern, so that it is neces- sary to try out a number of less sweeping questions in order to determine the priorities of the staff and to develop researchable questions. Thus, it is often useful for the evaluator and requester to work through in detail which questions can be answered easily, which are more difficult, expensive, and time-consuming, and which cannot be answered at all and why. The evaluator is in a much stronger
Page 12 GAO/PEMD10.1.4 Desiging Evaluations

Chapter 2 The Design Process
position to defend the final phrasing of a question if it is apparent that a number of alternatives have been systematically considered and rejected.
During this phase, the evaluator has several impor- tant aids for developing a range of questions. One is to imagine the various stages of the program-its goals, objectives, start-up procedures, implementa- tion processes, anticipated outcomes-and to ask all the questions that could be asked about each stage. For example, in considering program objec- tives, the evaluator could ask questions about the clarity and precision of those objectives, the criteria that have been developed for testing whether the objectives have been met, the relationship between the objectives and program goals, and whether the objectives have been clearly transmitted to and understood by the persons who are responsible for the program’s implementation.
Another aid is to focus on the nature of the pro- gram’s objectives-on whether they are short term or long term, intense or weak, continuous or spo- radic, behavioral or attitudinal, and so on. Yet another aid is to think of questions that would describe the program as it exists or that would judge the program against an existing norm or that would point out the outcomes that are a direct result of the program.
Each of these three kinds of question-descriptive, normative, and impact (cause-and-effect)-necessi- tates a different design consideration. What is important for the evaluator is to separate a poten- tial question into one of the three types and then to consider the implications of each type of question for the development of a design. To choose a set of evaluation questions is to choose a certain cluster of design options for answering them. Design options are discussed in chapter 3.
The second phase of formulating the right question is to match possible questions against the resources
Page 13 GAO/PEMDlO.1.4 Lkaiging Evaluations

Chapter 2 The Design PmceSs
that will be available for the project. We discuss this in the following section.
Deciding Which It is one thing to agree on which questions are most Questions Are important and have highest priority. It is quite
Feasible to Answer another to know whether the questions are answer- able and, if so, at what costs in money, staff, and time. In the second phase of formulating the right question, the evaluator ought not to assume that a design developed to answer questions of highest priority can be implemented within the given constraints.
For example, the evaluator might determine that it would be very informative to collect data over sev- eral years, but the requirements of money, staff, and time might necessitate a less comprehensive or less complex design that could answer fewer ques- tions, less conclusively, within given constraints. An alternative design that might be appropriate could focus on what a particular group of people remem- bers about a program or service during the years in which they were involved with it. Here, in place of the long-term, objective monitoring of events during years to come, the evaluator would substitute a look backward that is dependent on the memory and attitudes of the people involved with the program in the past.
Another less comprehensive alternative, of lower quality, would be to inquire of the group at only two future points in time rather than to make numerous inquiries over several points in time. In other words, the design option can influence the technical quality of the evidence and, hence, the expectations about what the evaluation can accomplish.
Page 14 GAO/PEMLHO.1.4 De&&g Evaluations
i
Chapter 2 The Des&n Process
Meeting an Information Need Reasonably
A large-scale and expensive evaluation is not likely to seem reasonable for a program that is small, dif- fuse, and short in duration. Similarly, a study that will allow national generalizability will probably require effort and resources quite different from those of a narrower study. To make national gener- alizations from a single case study, for example, is difficult, if not impossible. That is, whether or not an information need can be reasonably met has to do with how conclusive the answer to the question being investigated has to be. Questions that call for a high degree of conclusiveness in the answers will, of necessity, require stronger designs than ques- tions for which brief descriptions or quick assess- ments are adequate answers. For example, to ask for a description of the children who receive ser- vices from an education program for migrants is quite different from asking whether those services are affecting their attendance in school, academic achievement, and proficiency in English. The first question could be answered descriptively with the collection and tabulation of demographic data, but the second is an impact (cause-andeffect) question that demands knowledge about, first, what is hap- pening to similar children who are not in the pro- gram; second, how the children who are in the program were performing before they joined it; and third, whether other possible causes for how the children are performing that have nothing to do with the program can be justifiably excluded.
The “Strength Versus Weakness” Issue
Strong evaluations employ methods of analysis that are appropriate to the question, support the answer with evidence, document the assumptions, proce- dures, and modes of analysis, and rule out the com- peting evidence. Strong studies pose questions clearly, address them appropriately, and draw inferences commensurate with the power of the design and the availability, validity, and reliability of the data. Strength should not be equated with complexity. Nor should strength be equated with the degree of statistical manipulation of data.
Page 15 GAO/PEMD-10.1.4 Desiging Evahations
Chapter 2 The Design Process
Neither infatuation with complexity nor statistical incantation makes an evaluation stronger.
The strength of an evaluation is not defined by a particular method. Longitudinal, experimental, quasi-experimental, before-and-after, and case study evaluations can be either strong or weak. A case study design will always be weaker than a sample survey design in terms of its external validity. A simple before-and-after design without controls will always present problems of internal validity. Yet sample surveys and control groups can be impossible for a variety of reasons. That is, the strength of an evaluation has to be judged within the context of the question, the time and cost con- straints, the design, the technical adequacy of the data collection and analysis, and the presentation of the findings. A strong study is technically adequate and useful-in short, it is high in quality (Che- limsky, 1983).
Evaluators have considered the concept of strength at some length. Some argue that strong evaluations employ methods that allow the evaluator to make causal, as opposed to correlational, statements about a policy or program. It is argued that saying that program intervention X caused outcome Y among the program’s participants is a stronger statement than saying that X and Y are associated but it is not clear that X caused Y. In this argument, the notion of strength is related to the judgment that causal statements are more powerful than cor- relational statements. Another argument is that the strength of a study or a method can be determined by comparing what was done with what was possible.
Pilot Versus Full Study
Formulating the right question is a necessary but not a sufficient condition for success. There is still the matter of translating the design and analytic assumptions into practice-into pragmatic deci- sions and patterns of implementation that will
Page 16 GAO/PEMDlO.l.C Desiging Evaluations

Chapter 2 The Design Process
allow the evaluator to find the stipulated data and analyze them. In short, the evaluator must ask whether the design matches the area of inquiry. Answering this question is a “reality check” on whether the assumptions about the kinds and avail- ability of data hold true, on whether the legislation and regulations bear resemblance to what has been implemented, and on whether the proposed analysis strategies will answer the question conclusively.
At this stage of an evaluation, the entire endeavor is still quite vulnerable and tentative. What if the data are not available? What if the program is nothing like its description in its documents or the grant application? What if the methodology will not allow for sufficiently conclusive answers to the evaluation questions? Any one of these situations could call an entire study into question.
That the condition of an evaluation can be preca- rious in these ways argues for a limited exploration of the question before a full-scale, perhaps expen- sive, evaluation is undertaken. This limited explora- tion is referred to as a “pilot phase,” when the initial assumptions about the program, data, and evaluation methodology can be tested in the field. Testing the work at one or more sites allows the evaluator to confirm that data are available, what their form will be, and by what means they can be gathered.
Site selection for the pilot phase is important. Rather than choosing a site where the pilot could be easily conducted, it is critical to choose a site that represents an average, if not the worst, case. Choosing a noncontroversial site may hide the resis- tance an evaluator is likely to experience at other sites.
The pilot phase allows for a check on program oper- ations and delivery of services in order to ascertain whether what is assumed to exist does. Finding that
Page 17 GAO/PEMJHO.1.4 Desii Evaluations
Chapter 2 The Design Process
it does not may suggest a need to refocus the ques- tion to ask why the program that has been imple- mented is so different from what was proposed. This phase allows also for limited data collection, which provides an opportunity to assess whether the analysis methodology will be appropriate and what alternative interpretations of the data may be possible.
The study’s pilot phase is very useful. It is an important opportunity to correct aspects of the design that can determine the success or the failure of the overall effort. To undertake a large-scale, full-blown study without this phase is a high-risk proposition. To allocate staff and financial resources and engage the time and cooperation of the persons in the programs to be studied without making as certain as possible that what is proposed will work is to court serious problems. It may well be that conducting a pilot will confirm what was originally designed, but to move ahead with this confirmation is preferable to merely assuming that everything will fall successfully into place.
To be sure, there are instances when a pilot is not possible: time pressures may not allow it, resources may be so scarce that there is but one opportunity for field work, or the availability of staff may be constrained. Yet the evaluator ought to recognize that not performing a pilot test increases the likeli- hood of problems and difficulties, even to the degree that the study cannot be completed success- fully. The evaluator must give high priority to the pilot phase when considering time, resources, and staff.
A frequently posed question is how much pilot work is necessary before the large-scale evaluation is undertaken. There is no “cookbook” answer. The pilot is an evaluation tool that increases the odds that the effort will be high in quality. By itself, the pilot cannot provide a fail-safe guarantee. It can suggest alternative data collection and analysis
Page 18 GAO/PEMIMO.l.P Lksiging Evaluations

Chapter 2 TheDedgnProeess
strategies. It can also stimulate further thinking about and clarification of the evaluation. The pilot is a strategy for reducing uncertainty. That uncer- tainty cannot be reduced to zero does not detract from the pilot’s utility.
Perhaps the best answer to how extensive a pilot ought to be is a second question: How much uncer- tainty is the evaluator willing to tolerate as the evaluation begins? Only the evaluator can make the trade-off between the scope and resources of the pilot and problems on the project.
Considering the Evaluation’s Constraints
Time is a constraint. It shapes the scope of the eval- uation question and the range of activities that can be undertaken to answer it. It demands trade-offs and establishes boundaries to what can be accom- plished. It continually forces the evaluator to think in terms of what can be done versus what might be desirable. Because time is finite (and there is never enough of it), the evaluator has to plan the study in “real time” with its inevitable constraints on what question can be posed, what data can be collected, and what analysis can be undertaken.
A rule of thumb is that the time for a study and the scope of the question being addressed ought to be directly related. Tightly structured and narrow investigations are more appropriate when time is short. Any increase in the scope of a study should be accompanied by a commensurate increase in the amount of time that is available for it. The failure to recognize and plan for this link between time and scope is the Achilles heel of evaluation.
Linking scope and time in the study design is impor- tant because the scope is determined by the diffi- culty of the evaluation, the importance of the subject, and the needs of the user, and these are also determinants of time. Though it may be self- evident to say so, difficult evaluations, important evaluations, and evaluations in which there is a
Page 19 GAO/PEMBIO.1.4 Desi@ng Evahatiom
Chapter 2 TheDesignProeess
great deal of interest have different demands with respect to time than other evaluations. No project is “too long” or “too short” within this context.
The need of the study’s audience as a time con- straint merits additional comment. Evaluations are requested and conducted because someone per- ceives a need for information. Producing that infor- mation without a sensitivity to the user’s timetable diminishes its usefulness. For example, a report to the Congress may answer the questions correctly but will be of little or no use if it is delivered after the legislative hearings for which it is needed or after the preparation of a new budget for the program.
Cost is a constraint. The financial resources avail- able for conducting a study partly determine the limits of the study. Having very few resources means that the evaluator will have to consider tight limitations on the questions, the modes of data col- lection, the numbers of sites and respondents, and the extent and elegance of the analysis. As the resources expand, the constraints on the study become less confining. Having more funds might mean, for example, either longer time in the field or the opportunity to have multiple interviews with respondents or to visit more sites or choose larger samples for sites. Each of these items has a price tag. What the evaluator is able to purchase depends on what funds are available.
It should be stressed that regardless of what funds are available, design alternatives should be consid- ered. Cost is simply an important constraint within which the design work has to proceed. If only a stipulated sum is available, the evaluator has to determine what can be done with that sum in order to provide information that is relevant to the ques- tions. The same resources might allow three or four quite distinct approaches to an evaluation. The
Page 20 GAO/PJMDlO.lA Desigine Evaluations
chapter 2 The Design Process
challenge is to consider the strengths and weak- nesses of the various approaches. Like the con- straint of time, cost does not determine the design. It helps establish the range of options that can be realistically examined. Even when resources can be expanded, cost is still a constraint. However, the design problem then becomes one of cost-effective- ness, or getting value for the dollar, rather than one of what can be done within a stipulated sum.
One other point: the quality of an evaluation does not depend on its cost. A $500,000 evaluation is not necessarily five times more worthy than a $100,000 evaluation. An expensive study poorly designed and executed is, in the end, worth less than one that costs less but addresses a significant question, is tightly reasoned, and is carefully executed. A study should be costly only when the questions and the means of answering them necessitate a large expen- diture. As with the constraint of time, there is a direct correlation between the scope of a study and the money available for conducting it.
Staff expertise is a constraint. The design for an evaluation ought not to be more intricate or com- plex than what the staff can successfully execute. Developing highly sophisticated computer simula- tions or econometric models as part of an evaluation when the skills for using them are not available to the evaluation team is simply a gross mismatch of resources. The skills of the staff have to be taken into account when the design is developed,
It is perhaps too negative to consider staff expertise as only a constraint. In the alternative view, the design accounts for the range of available staff expertise and plans a study that uses that expertise to the maximum. It is just as much a mismatch to plan a design that is pedantic, low in power, and completely unsophisticated when the staff are capable of much more and the questions demand more as it is to create a design that is too complex for the expertise available. In either instance, of
Page 21 GAO/PEMDIO.lA &Bigfng Evaluatiom
I
Chapter 2 The Design Process
course, a design is determined not by expertise but by the nature of the questions.
A realistic understanding of the skills of the staff can play an important role in the kinds of design options that can be considered. An option that requires skills that the staff do not have will fail, no matter how appropriate the option may be to the evaluation questions. A staff with a high degree of technical training in a variety of evaluation strate- gies is a tremendous asset and greatly expands the options.
Some designs demand a level of expertise that is not available. When this happens, consultants can be brought into the study or the staff can be given short intensive courses or complex and difficult portions of the design can be isolated and per- formed under contract by evaluators specializing in the appropriate type of study. In other words, the stress is on considering the options available. Pref- erence should be given to building the capability of current staff. When this cannot be done, or time and cost do not allow it, expertise can be procured from outside in order to fulfill the demands of the design.
Location and facilities are secondary constraints in comparison to the others we have discussed, but they do impinge on the design process and influence the options. Lacation has to be considered from sev- eral aspects. One is the location of the evaluator vis- a-vis where the evaluation is to be conducted. Loca- tion is less critical for a national study, since most areas can be reached by air within a few hours, but it increases in importance if the study examines only a few individual projects. The accessibility and continuity of data collection may be jeopardized if the evaluator is on the east coast and the sites are in the South, in the Midwest, and on the west coast. A situation such as this may have to incorporate local persons as members of the evaluation team and may increase the utility of a mail questionnaire
Page 22 GAO/PEMlSIO.1.4DesigingEvaluatiom
I
I
1

Chapter 2 TheDe&pPk-ocess
or telephone interviews compared to face-to-face interviews.
Another aspect of location has to do with the social and cultural mores of the area where the evaluation is to be conducted. For example, to gain valid and insightful data on attitudes toward rural mental health clinics, it may be wise not to send inter- viewers from urban areas. Good interviewing neces- sitates empathy between the persons involved, and it may be hard to generate between an interviewer and a respondent whose backgrounds are very different.
A third aspect of location is the stability of the pop ulation being studied. A neighborhood where resi- dence is transient may necessitate a different strategy from a neighborhood where most people have lived in the same house for 40 years and have no intention of moving.
Finally, the evaluator must consider whether a trip to a site is justified at all. For example, if it costs $3,000 to travel to a remote town to ascertain whether a school there is using a $1,500-computer provided by a US. Department of Education gram, the choice of not going is defensible.
The constraint of facilities on the design options also has more than one aspect. One has to do with data collection and data processing. For example, if the study involves entering large aggregates of data into a computer, the equipment to do so must be available, or the money must be available for con- tracting the work. Similarly, if the design calls for data analysis at computer terminals with phone connections to the main computer, the equipment is a must. The absence of such faciiities limits both the kind and the extent of the data one can collect.
Page 23 GAO/l'EMD-1O.l.4Desi&@Evaluations
1

chapter 2 TheDesiguPFoceas
Another aspect is the need for periodic access to facilities that are not under the auspices of the pro- ject or program being studied. For example, to inter- view welfare clients in a welfare office about the treatment and service they are receiving there may be to risk highly biased answers. How candid can a client be, knowing that the caseworker who has made decisions on food, clothing, and rental allowances for the client’s family is in the next room? “Neutral turf” cannot guarantee candid answers, but it may lessen anxiety and it can con- tribute to the authenticity of the evaluator’s promise of anonymity and confidentiality. The example applies equally to interviews with persons who hold positions of power and influence.
Assessing the Design
Once a design has been selected, the impetus is to move full steam ahead into the execution of the study. However, the evaluator must fight this impulse and take time to look back on what has been accomplished, on the design that has finally been selected, and on what the implications are for the subsequent phases of the study.
The end of the design phase is an important mile- stone. It is here that the evaluator must have a clear understanding of what has been chosen, what has been omitted, what strengths and weaknesses have been embedded in the design, what the needs of the customer are, how usefully the design is likely to meet those needs, and whether the constraints of time, cost, staff, location, and facilities have been fully and adequately addressed.
GAO’s Program Evaluation and Methodology Divi- sion has developed and uses a job review system that includes a detailed and systematic assessment of the design phase. This system helps establish the basis for moving forward into implementation. It may be useful to other evaluators in judging their own designs. Five key questions figure prominently in the review system.
Page 24 GAO/PEMD1O.1.4 Desighg Evaluationa

chapter 2 The Design Process
1. How appropriate is the design for answering the questions posed for the study? The evaluator ought to be able to match the design components system- atically to the study questions in order to demon- strate that all key questions are being addressed and that methods are available for doing so. Even though this entails a judgment, the evaluator should assess the match between the strength of the design and the information necessary to answer the study questions. If the design is either too weak or too strong for the questions, serious consideration has to be given to whether the design ought to be imple- mented or whether the questions ought to be modi- fied. This judgment about the appropriateness of the design is critical, because if the study begins with an inappropriate design, it is difficult to com- pensate later for the basic incongruity.
2. How adequate is the design for answering the questions posed for the study? The emphasis here is on the completeness of the design, the expected pre- cision of the answers, the tightness of the logic, the thought given to the limitations of the design, and the implications for the analysis of the data, First, the evaluator should have reviewed the literature and should give evidence of knowing what was undertaken previously in the area from both sub- stantive and methodological viewpoints. That is, the evaluator should be aware of not only what kinds of questions have been asked and answered in the past but also what designs, measures, and data analysis strategies have been used. A careful study of the literature prevents ‘*rediscovering” or dupli- cating existing work. Thus, in judging the adequacy of the design, the evaluator must link it to previous evaluations.
Second, the design should explicitly state the evalu- ation questions that determined the selection of the design. Knowing the evaluation questions that were thought germane and those that were not gives the reader a basis for assessing the strength of the design. Since every evaluation design is constrained
Page 26 GAO/PEMD-10.1.4 Desiging Evalnationa
chapter 2 The Design Pmcess
by a number of factors, recognizing them and can- didly describing their effect provides important clues to whether the design can adequately answer the study questions.
Third, there is a need to be explicit about the limita- tions of the study. How conclusive is the study likely to be, given the design? How detailed are the data collection and data analysis plans? What trade- offs were made in developing these plans? The answers to these questions provide data on the design’s adequacy.
3. How feasible is the execution of the design within the required time and proposed resources?Ade- quate and appropriate designs may not be feasible if they ignore time and cost--that-is, if they are not practical, The completeness and elegance of a design can be quickly relegated to secondary impor- tance if the design presents major obstacles in the execution, Further, asking about feasibility puts an important check on studies that simply cannot be done. For example, discovering that a particular evaluation with a true experimental design cannot be executed may prevent proceeding with a project that will fail.
4. How appropriate is the design with regard to the user’s needs for information, conclusiveness, and timeliness? What kind of information is needed? How conclusive does it have to be? When does it have to be delivered? Being able to determine how well the design responds to the user’s needs requires the evaluator and the user to be in close agreement and continuous consultation. In the absence of cooperation, the evaluator is left to pre- sume what will be of relevance-and presumption is a poor substitute for knowledge. Since evalua- tions are undertaken because of a need for infonna- tion, the degree to which they provide useful information is an inescapable and critical design consideration.
Page 26 GAO/PEMD10.1.4 Deaiging Evaluatioiw
chapter 2 TheDesignProcess
5, How adequate were the negotiations with the user regarding the relationship between the infor- mation need and the study design? It is one thing to know what the user needs and when it is needed. It is quite another to agree on how the questions ought to be framed so that the information can be gathered. If the user has causal questions in mind while the evaluator believes that only a descriptive study is feasible+ and if the gap between these two perspectives is not resolved, the user’s satisfaction with the final study is likely to be quite low and the ensuing report may not be used.
Further, the consideration of time is relevant to the size, complexity, and completeness of the evalua- tion that is finally undertaken. If the user is inte- grally involved in determining the project’s timetables and products, the evaluator will know how to decide whether what is proposed can be accomplished. To ignore, or only guess at, rather than negotiate and agree on a timetable would be to risk the relevance of the whole effort. The negotia- tions with the user should be carefully scrutinized at the end of the design phase to make sure that there is common understanding and agreement on what is being proposed for the remaining phases of the evaluation.
Page 27 GAO/PEMD10.1.4 Deaieing Evaluations
Chapter 3
Types of Design
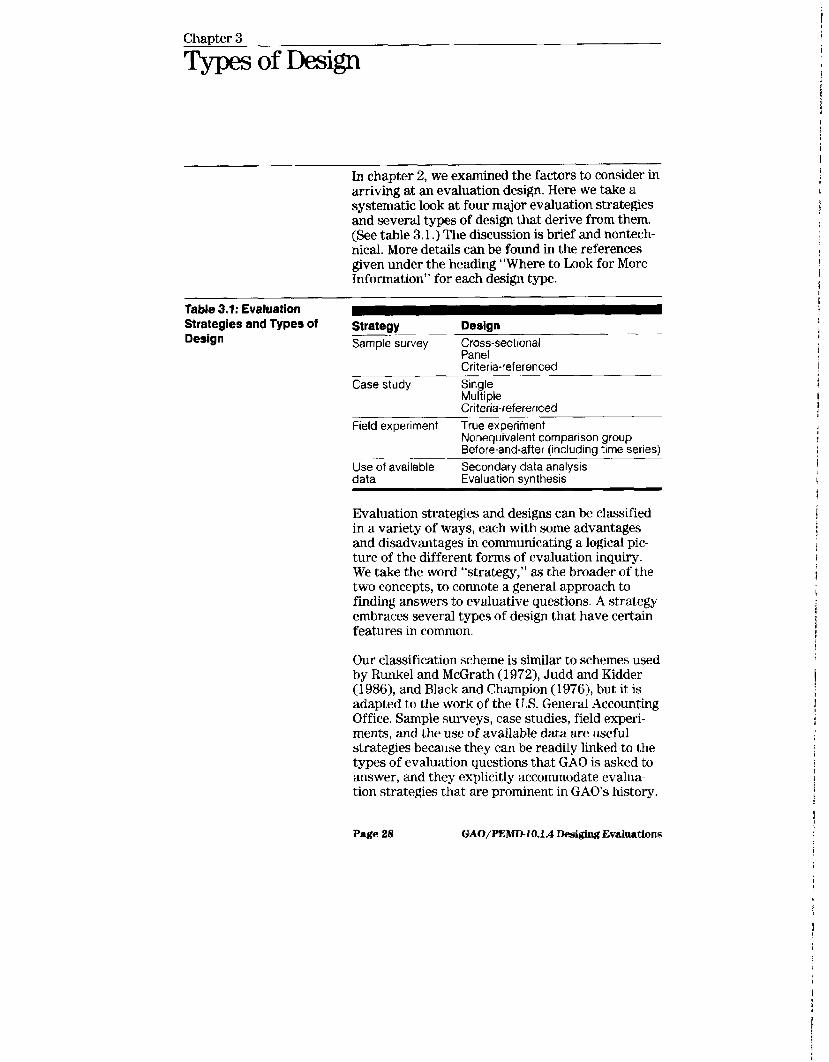
In chapter 2, we examined the factors to consider in arriving at an evaluation design. Here we take a systematic look at four major evaluation strategies and several types of design that derive from them. (See table 3.1.) The discussion is brief and nontech- nical. More details can be found in the references given under the heading “Where to Look for More Information” for each design type.
Table 3.1: Evaluation Strategies and Types of Design
Strategy Sample survey
Design Cross-sectional Panel Criteria-referenced
Case study Single Multiple Criteria-referenced
Field experiment
Use of available data
True experiinent Nonequivalent comparison group Before-and-after (including time series)
Secondary data analysis Evaluation synthesis
Evaluation strategies and designs can be classified in a variety of ways, each with some advantages and disadvantages in communicating a logical pic- ture of the different forms of evaluation inquiry. We take the word “strategy,” as the broader of the two concepts, to connote a general approach to finding answers to evaluative questions. A strategy embraces several types of design that have certain features in common.
Our classification scheme is similar to schemes used by Runkel and McGrath (1972), Judd and Kidder (1986), and Black and Champion (1976), but it is adapted to the work of the U.S. General Accounting Office. Sample surveys, case studies, field experi- ments, and the use of available data are useful strategies because they can be readily linked to the types of evaluation questions that GAO is asked to answer, and they explicitly accommodate evalua- tion strategies that are prominent in GAO’s history.
Page 28 GAO/PEMDlO.l.4 Desiging Evahatiom

Chapter 3 Types of De!sign
For simplicity, we speak only of program evalua- tion, but we imply the evaluation of policies also.
Some of the design elements we identified in chapter l-in particular, kinds of information, sam- pling methods, and the comparison base-help dis- tinguish the evaluation strategies. Table 3.2 shows the relationship between these three design ele- ments and the four evaluation strategies, the types of questions, and the availability of data. In the rest of this chapter, we discuss this relationship in detail. Other design elements-information sources, information collection methods, the timing and fre- quency of information collection, and information analysis plans-are essential in specifying a design but are less useful in making distinctions among the major evaluation strategies.
Table 3.2: Characteristics of Four Evaluation Strateaies Type of evaluation Design element question Need for most
Evaluation commonly Kind of explicit
strategy addressed $taiiility
information comparison base
Sample Descriptive New data Tends to be Probability Noa survey and collection quantitative
normative sampling
Case study Descriptive New data Tends to be and collection
Nonprobability Noa qualitative;
normative sampling
can be quantitative
Field Impact New data Quantitative experiment (cause and
Probability or Yes; essential collection or qualitative
effect) nonprobability to the design sampling
Use of Descriptive, ;;;;lable Tends to be available data normative,
Probability or May or may quantitative;
and impact nonprobability not be
can be sampling available (cause and qualitative effect)
% this classrficatlon, sample surveys and case studies do not have an explicit comparison base by definition. This definition is not uni- versal.
Page 29 GAO/PEMD-I0.1.4 Desiging Evaluations

Chapter 3 Types of Dcs$n
Two points about the use of the classification scheme should be stressed. First, as we indicated in chapter 2, a program evaluation design emerges not only from the evaluation questions but also from constraints such as time, cost, and staff. Therefore, the scheme cannot be used independently as a “cookbook” for evaluation. Second, and related to the first point, every evaluation design is likely to be a blend of several types. Often, two or more design types are combined with advantage.
Each of this chapter’s sections on the four evalua- tion strategies is broken down into subsections on specific design types that may be applicable in GAO. For each type of design, we give several kinds of information: a description of the design, appro- priate applications, planning and implementation considerations, and sources of more information. The last section of the chapter makes further con- nections between evaluation questions and the design types.
The Sample Survey
In a sample survey, data are collected from a sample of a population to determine the incidence, distribution, and interrelation of naturally occur- ring events and conditions1 The overriding concern in the sample survey strategy is to collect informa- tion in such a way that conclusions can be drawn about elements of the population that are not in the sample as well as about elements that are she sample. A characteristic of the strategj%s the use of probability sampling, which permits a generaliza- tion from the findings about the sample to the pop- ulation of interest. In probability sampling, each unit in the population has a known, nonzero probability of being selected for the sample by
‘The special case in which the sample equals the population is called a “census.” The word “survey” is sometimes used to describe a structured method of data collection without the goal of drawing conclusions about what has not been observed. We do not use the term in this narrow sense.
Page 30 GAO/PEMLhIO.IA Desiging Evaluations
Chapter 3 Types of Design
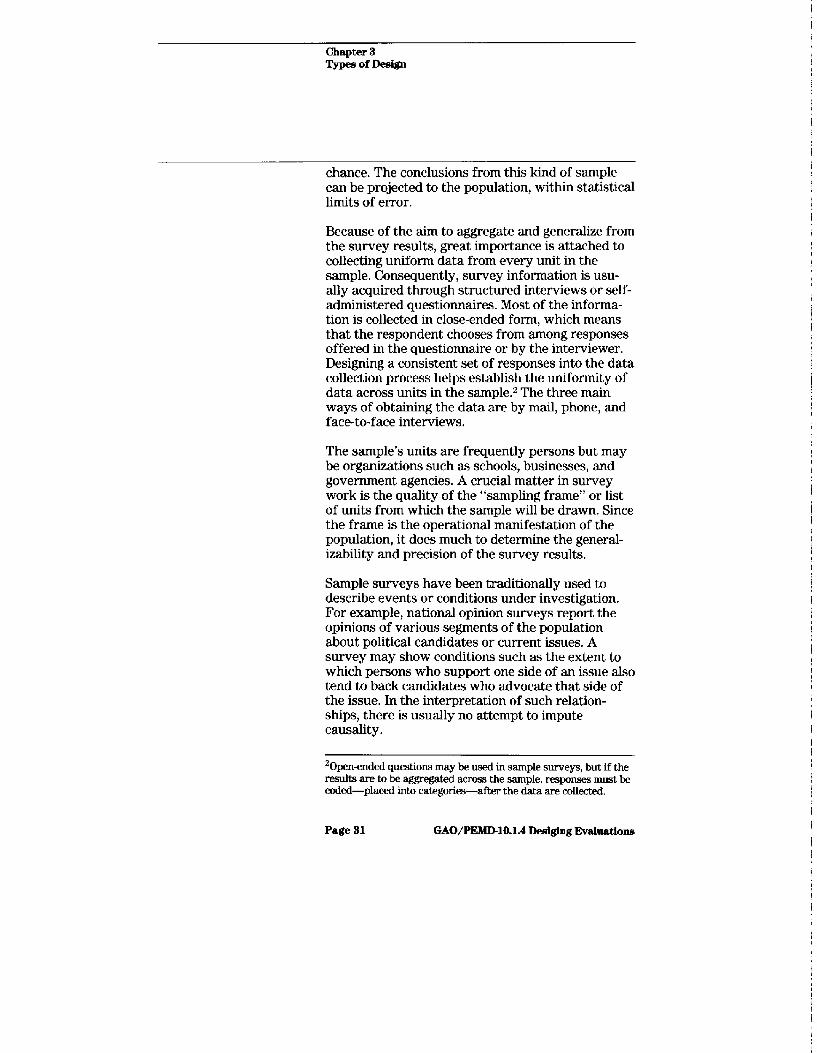
chance. The conclusions from this kind of sample can be projected to the population, within statistical limits of error.
Because of the aim to aggregate and generalize from the survey results, great importance is attached to collecting uniform data from every unit in the sample. Consequently, survey information is usu- ally acquired through structured interviews or self- administered questionnaires. Most of the informa- tion is collected in close-ended form, which means that the respondent chooses from among responses offered in the questionnaire or by the interviewer. Designing a consistent set of responses into the data collection process heips establish the uniformity of data across units in the sample.2 The three main ways of obtaining the data are by mail, phone, and face-to-face interviews.
The sample’s units are frequently persons but may be organizations such as schools, businesses, and government agencies. A crucial matter in survey work is the quality of the “sampling frame” or list of units from which the sample will be drawn. Since the frame is the operational manifestation of the population, it does much to determine the general- izability and precision of the survey results.
Sample surveys have been traditionally used to describe events or conditions under investigation. For example, national opinion surveys report the opinions of various segments of the population about political candidates or current issues. A survey may show conditions such as the extent to which persons who support one side of an issue also tend to back candidates who advocate that side of the issue. In the interpretation of such relation- ships, there is usually no attempt to impute causality.
@pen-ended questions may be used in sample surveys, but if the results are to be aggregated across the sample, responses must be coded-placed into categories-after the data are collected,
Page 31 GAO/PEMMO.1.4 Dedghg Evahations

chapter 3 Types of Design
However, some analysts attempt to go beyond the purely descriptive or normative interpretations of sample surveys and draw causal inferences about relationships between the events or conditions being reported. The conclusions are frequently dis- puted, but there are circumstances in which causal inferences from sample survey data are warranted. Special data analysis methods are used to draw qualified causal interpretations but even these pro- cedures may not silence methodological criticism. In the rest of this section, we describe the designs for cross-sectional, panel, and c&era-referenced sample surveys.
The Cross-Sectional A cross-sectional design, in which measurements Survey are made at a single point in time, is the simplest
form of sample survey.
Applications
EXAMPLE: In 1971, a survey was made of 3,880 families (11,6 19 persons) to provide descriptive information on the use of and expenditures for health services, A probability sample was drawn from the total U. S. population not residing in insti- tutions. Because of special interest in low-income, central-city residents, rural residents, and the eld- erly, these groups were sampled in numbers beyond their proportion in the population so that suffi- ciently precise projections could be made for these groups. Data were collected by holding interviews in homes, and some of this information was verified by checking other records such as those maintained by hospitals and insurance companies. Information produced by the survey, which was projected to the national population, included the kind of health ser- vices that people receive, where and why they receive them, how the services are paid for, and how much they cost.
When the need for information is for a description of a large population, a cross-sectional sample survey may be the best approach. It can be used to
Page 32 GAO/PEMIMO.lA l&ii Evahationu

chapter 3 Types of Design
Planning and Implementation
acquire factual information-such as the living con- ditions of the elderly or the costs of operating gov- ernment programs. It can also be used to determine attitudes and opinions-such as the degree of satis- faction among the beneficiaries of a government program.
Because the design requires rigorous sampling pro- cedures, the population must be well-defined. The kind of information that is sought must be clear enough that structured forms of data collection can work. A sample survey design cannot be used when it is not possible to settle on a particular sampling frame before the data are collected. It is hard to use when the information that is sought must be acquired by unstructured, probing questions and when a full understanding of events and conditions must be pieced together by asking different ques- tions of different respondents.3
A cross-sectional design can sometimes be used for imputing causal relationships between conditions, as in inferring that educational attainment has an effect on income. Other evaluation designs, such as the true experiment or nonequivalent comparison group designs, are ordinarily more appropriate, when they are feasible. However, practical consid- erations may rule out these and other designs, and the cross-sectional design may be chosen for lack of a better alternative. When the cross-sectional design is used for causal inferences, the data must be ana- lyzed by structural equation models and related techniques, although the data collection procedures are the same as for descriptive applications (see, for example, Hayduk, 1987).
Sampling. Having a sampling frame that closely approximates the population of interest and
3A procedure that is suitable for this situation, called “multiple matrix sampling,” applies to each respondent a subset of the total number of questions.
Page 33 GAO/‘PJBfDlO.l.4 Desislng Evaluationa

Chapter 3 Types of Design
drawing the sample in accordance with statistical requirements are crucial to the success of the cross- sectional sample survey. The size of a sample is determined by how statistically precise the findings must be when the sample results are used to esti- mate population parameters such as the mean and variance.
Pretesting the Instruments. To ensure the uni- formity of the data, the data collection instruments must be unambiguous and likely to elicit complete, unbiased answers from the respondents. Pretesting the instruments a number of times before using them in the survey is an essential preparatory step.
Nonrespondent Follow-up. The failure of a sampling urut to respond to a data collection instrument or the failure to respond to certain questions may dis- tort the results when the data are aggregated. Fur- ther attempts must be made to acquire missing information from the respondents, and the data analysis must adjust, as well as possible, for infor- mation that cannot be obtained.
Causal Inference. The procedures for making causal inferences from sample survey data require hypoth- eses about how two or more factors may be related to one another. Causal analysis methods use the hypotheses to test the consistency of the data. That is, the credibility of causal inferences from sample survey data rests heavily on the plausibility of the hypotheses. For plausible hypotheses, a premium is placed on broad literature reviews and a thorough understanding of the events and conditions in question.
Where to Look for More Information
Babbie (1990), Bainbridge (1989), Fowler (1988), and Warwick and Lininger (1975) are general refer- ences on the sample survey strategy. Kish (1987) covers design issues for sample surveys as well as other designs. Kish (1965) provides a comprehen- sive treatment of sampling procedures, while
Page 34 GAO/PEMD10.1.4 Desiging Evaluations
chapter 3 Types of Design
Kalton (1983), Henry (1990), Scheaffer, Menden- hall, and Ott (1990), Sudman (1976), and U.S. Gen- eral Accounting Office (1986a) give introductory treatments. Data collection methods are the subject of Bradburn and Sudman (1979), Converse and Presser (1986), Fowler and Mangione (1990), Payne (1951), and US. General Accounting Office (1985 and 1986b). Groves (1989) offers a broad look at survey errors and costs. Routine data analysis methods are covered in numerous texts on descrip tive and inferential statistics, and the US. General Accounting Office plans to issue an elementary introduction to such methods in 1991. Examples of advanced techniques may be found in Lee, Forthofer, and Lorimor (1989) and Hayduk (1987).
The Panel Survey A panel survey is similar to a cross-sectional survey but has the added feature that information is acquired from a given sample unit at two or more points in time.
Applications
EXAMPLE: The “panel study of income dynamics,” carried out by the Institute for Survey Research at the University of Michigan, is based on annual interviews with a nationally representative sample of 6,000 families. The extensive economic and social data that are collected can be used to answer many descriptive questions about occupation, education, income, and family characteristics. Because follow- up interviews are made with the same families, questions can also be asked about changes in their occupation, education, income, and activities.
The panel design adds the important element of time to the sample survey strategy. When the survey is used to provide descriptive information, the panel design makes it possible to measure
Page a6 GAO/PEMD-10.1.4 Des&ing Evaluatiorm
i
chapter 3 Types of Design
Planning and Implementation
changes in facts, attitudes, and opinions4 For making decisions about government programs and policies, dynamic information-that is, information about change-is frequently more useful than static information.
The panel survey’s use of time is also important when the survey data are used for causal inference. In this application, the panel design may help settle the question of whether, of two factors that appear to be causally related, one is the cause and the other is the effect.
Sampling, Pretesting the Instruments, Nonrespon- dent Follow-Up, and Causal Inference. Panel survey designs are similar to cross-sectional designs in the need for attention to these activities.
Panel Maintenance. To the extent that sample units leave the sample, changes in the sample may be mistaken for changes in the conditions being assessed. Therefore, keeping the panel intact is an important priority. When sample units are unavoid- ably lost, it is necessary to attempt adjustments to minimize distortion in the results.
Where to Look for More The references in the discussion on cross-sectional Information survey designs are applicable.
The Criteria- Referenced Survey
Sometimes the evaluation question is, How do out- comes associated with participation in a program compare to the program’s objectives? Often, a nor- mative question like this is best answered with a
4Change can alsO be measured by two or more cross-sectional, time-separated surveys if the samples and data collection proce- dures are consistent (see Babbie, 1990, for details). However, it is possible to associate change on a measure not with an individual but with populations, so that the kinds of questions that can be answered are more limited than with the panel design.
Page 36 GAO/PEMD10.1.4 Desiging Evaluation
Chapter 3 Types of Design
sample survey design (although a criteria-refer- enced case study design may sometimes be used).
EXAMPLE: A soil conservation program has the objective of reducing soil loss by 2 tons per acre per year in selected counties. A panel survey could be designed in which actual soil loss on the land that is subject to the program could be compared to the cri- terion That is, two measurements of soil depth 1 year apart could be recorded for a probability sample of locations in the targeted counties. Subject to the limitations of measurement and sampling error, the amount of soil loss in the counties could be estimated and then compared to the program objective.
This criteria-referenced survey design employs a probability sample to acquire information on the program’s outcome because a conclusion is sought about a representative sample of the program’s population.
A normative evaluation question may also ask, How does actual program implementation match what was intended, or how well does it match a standard of operating performance? The attention is not on outcomes but on processes and procedures.
EXAMPLE: Federal policies require that commercial airlines observe certain safety procedures. A cri- teria-referenced design could produce information on the extent to which actual procedures conform to these criteria. A population of maintenance activ- ities-engine overhauls, for example-could be sam- pled to see if required steps were followed. The infraction rate, projected to the population, could then be compared to the standard rate, which might be zero.
Page 37 GAO/PEMIMO.lA Desiging Evalmationa
chapter 3 Types of Design
In this example, the safety procedures are a means to an end-the passengers’ safety-but the evalua- tion is focused not on the result but on the imple- mentation of the program’s policy on safety.
Applications Whether dealing with outcomes or process, evalu- ators can use criteria-referenced designs to answer normative questions, which always compare actual performance to an external standard of perform- ance, However, criteria-referenced designs do not generally permit inferences about whether a pro- gram has caused the outcomes that have been observed. Causal inference is not possible, because the criteria-referenced model does not produce an estimate of what the outcomes would have been in the absence of the program.
An audit model-the “criterion, condition, cause, and effect” model-is a special case of the criteria- referenced design that is widely used in GAO.6 Out- comes, the condition, are often compared to an objective, or a criterion, and the difference is taken as an indication of the extent to which the objective has been missed, achieved, or exceeded. However, it is not ordinarily possible to link the achievement of the objective to the program, because other factors not accounted for may enter into failure or success in meeting the objective.
A variety of evaluation questions lead to the choice of the criteria-referenced design. For service pro- grams, examples are questions about whether the right participants are being served, the intended services are being provided, the program is oper- ating in compliance with legal requirements, and the service providers are properly qualified. Regu- latory programs give rise to similar questions:
“The word “cause” in the audit model has a different meaning from the usual notion of causation. “Purported cause” would be a more accurate term, because the criteria-referenced design does not permit inference about causation.
Page 38 GAO,‘PEMDIO.1.4 Desiging Evaluations
Chapter 3 Types of Design
Planning and Implementation
whether activities are being regulated in compliance with the statutory requirements, inspections are being carried out, and due process is being followed.
Sometimes outcome questions are framed in terms of criteria. Did the missile hit the right target? Did the participants of the training program get jobs? Did the sale of timber yield the expected return? Did supplies of strategic minerals meet the quotas?
Whenever the evaluation questions are normative, criteria-referenced designs are called for. Fre- quently, but not always, a sample survey is embedded in a criteria-referenced design so that the conclusions can be regarded as representative of the population.
Consensus About the Criteria. It is often difficult to gain consensus about the objectives of federal pro- grams. It follows that in those cases it is also hard to decide which criterion to use in an evaluation. The best way is usually to use not one criterion but several criteria, to allow for the objectives of the several interests in the program-legislators, participants, taxpayers, and so on. The problem of consensus is usually of less concern with imple- mentation criteria, because statutes and regulations are more likely to be specific about implementation requirements.
Measuring Performance Against the Criteria. Just as it may be difficult to reach consensus on the objectives of a program, so there is likely to be debate about the procedures for measuring per- formance against the criteria. For example, Are tests of military weapons against simulated enemy targets a satisfactory way of estimating the probability that the weapons will hit real enemy targets? Similarly, views may differ about the
Page 39 GAO/PEMDlO.l.4 Desieing Evaluations

Chapter 3 Types of Desigu
appropriate way to measure performance against implementation criteria.
Where to Look for More Information
Herbert (1979) outlines the normative design as used by auditors. Provus (1971) covers the “dis- crepancy model,” an early treatment of the norma- tive approach in evaluation, and Steinmetz (1983) is a later reference for the same model. Popham (1975) on educational evaluation focuses on cri- teria-referenced evaluation. The performance-moni- toring approach of Wholey (1979) includes the comparison of actual program performance to that which is expected.
The Case Study The case study strategy is less well defined than the other evaluation strategies we have identified and, indeed, different practitioners may use the term to mean quite different things. For GAO’s purposes, a case study is an analytic description of an event, a process, an institution, or a program (HoagIin et al., 1982).
One of the most commonly given reasons for choosing a case study design is that the thing to be described is so complex that the data collection has to probe deeply beyond the boundaries of a sample survey, for example. The information to be acquired will be similarly complex, especially when a comprehensive understanding is wanted about how a process works or when an explanation is sought for a large pattern of events,
Case studies are frequently used successfully to address both descriptive and normative questions when there is no requirement to generalize from the findings. Impact (cause-and-effect) questions are
Page 40 GAO/PEMD-10.1.4 Desiging Evaluations
Chapter 3 Types of Design
sometimes considered, but reasoning about cau- sality from case study evidence is much more debatable.”
We present three types of case study design: single case, multiple case, and criteria-referenced designs. Even in a study with multiple cases, the sample size is usually small. However, if the sample size is rela- tively large and data collection is at least partially structured, the case study strategy may be similar to the sample survey strategy, except that the latter requires a probability sample.
The Single Case In single case designs, information is acquired about a single individual, entity, or process.
EXAMPLE: The Agency for International Develop- ment fostered the introduction of hybrid maize into Kenya. An evaluation using a single case design acquired detailed information about the processes of introducing the maize, cultivating it, making it known to the populace, and using it. The evaluation report is a minihistory constructed from interviews and archival documents.
Single case evaluations are valued especially for their utility in answering certain kinds of descrip- tive questions. Ordinarily, much attention is given to acquiring qualitative information that describes
‘The use of case studies to draw inferences about causality has heen approached from diverse points of view. The scope of this paper permits only two examples. One approach is called “ana- lytic induction” and involves establishing a hypothesis about the cause of an effect and then searching among cases for an instance that refutes the hypothesis. When one is found, a new hypothesis about a new cause is established, and the cycle continues until a hypothesis cannot be refuted. The cause, or pattern of causes, associated with that hypothesis is then taken as a likely explana- tion for the effect. Another is in “single case experimental” designs, originated largely in the area of psychology and related to field experiments. With substantial control over and manipula- tion of the hypothesized cause in a single case, inferences can be made about causcandeffect relationships.
Page 41 GAO/PEMDlO.1,4 Desiging Evaluations
chapter 3 Types of Design
Applications
events and conditions from many points of view. Interviewing and observing are the common data collection techniques. The amount of structure imposed on the data collection may range from the flexibility of ethnography or investigative reporting to the highly structured interviews of sample surveys. There is some tendency to use case studies in conjunction with another strategy. For example, case studies providing qualitative data might be used along with a sample survey to provide quanti- tative data. However, case studies are also fre- quently used alone.
Three applications of single case studies are illus- trative, exploratory, and critical instance. These and other applications are described in detail in Case Study Evaluations (U.S. General Accounting office, 1990) another paper in this series.
An illustrative case study describes an event or a condition. A common application is to describe a federal program, which may be unfamiliar and seem abstract, in concrete terms and with examples. The aim is to provide information to readers who lack personal experience of what the program is and how it works.
An exploratory case study can serve one or another of at least two purposes. One is as a precursor to a possibly larger evaluation. The case study tells whether a program can be evaluated on a larger scale and how the evaluation might be designed and carried out. For example, a single case study might test the feasibility of measuring program outcomes, refine the evaluation questions, or help in choosing a method of collecting data for the larger study. The other purpose of an exploratory case study is to provide preliminary information, with no further study necessarily intended.
Page 42 GAO/PEMD-10.1.4 Desiging Evaluations
chapter 3 Types of Design
Planning and Implementation
A single case study may also be used to examine a critical instance closely. Most common is the investi- gation of one problem or event, such as a cost overrun on a nuclear reactor. In this example, the question is normative and the issue is probably complex, requiring an m-depth study.
Selecting a Case. The choice of a case clearly presents a problem, except for the critical instance case study, ln which the instance itself prompts the study. In other applications, the results depend to some degree on the case that is chosen. If it is expected that they will differ greatly from case to case, it may be necessary to use a multiple case design.
Information Collection. Because the goal is to collect in-depth information about a complex case, data collection may be challenging. Although case studies typically require a mix of quantitative and qualitative data, particular care is required with the latter because there is a tendency to be less rigorous in obtaining qualitative information. For example, if the data collection is unstructured, the reliability of the data may be doubted. The question is whether two data collection teams examining the same case could end up with quite different findings. Steps must be taken in the planning stages to avoid this form of unreliability. Yin (1989) suggests three principles to help establish construct validity and reliability in a case study: (1) use multiple sources of evidence, (2) create a case study data base, and (3) maintain a chain of evidence.
Data Analysis and Reporting. Because analyzing and reporting qualitative data can be difficult, the design for the single case study must have explicit plans for these tasks. Miles and Huberman (1984) offer many suggestions for manipulating and dis- playing qualitative information. Tesch (I990)
Page 43 GAO/PEMD-lOJ.4 Desiging Evaluations
chapter 3 Typesof~4P
I
describes computer programs that can be used to analyze qualitative data.
Where to Look for More Information
Yin (1989) and U.S. General Accounting Office (1990) set forth general approaches to the case study strategy. Hoaglin et al. (1982) devote a chapter to case studies. Patton (1990) gives an overall approach to “qualitative” evaluation. In a somewhat broader social science context, Strauss and Corbin (1990) give prescriptions for qualitative research and Marshall and Rossman (1989) cover the design of qualitative research. With respect to analysis of qualitative data, Miles and Huberman (1984), Strauss (1987), and Tesch (1990) offer many suggestions.
Multiple Cases Single case designs are weak when the evaluation question requires drawing an inference from one case to a larger group. A multiple case study design may produce stronger conclusions. In our classifica- tion, an important distinction between the multiple case study design and sample survey designs is that the latter require probability samples while the former does not.
EXAMPLE: A program known popularly as the “general revenue sharing act” appropriated federal funds for nearly 38,000 state and local jurisdictions. An evaluation intended to answer both descriptive and impact (cause-and-effect) questions used the multiple case study design. Sixty-five jurisdictions were chosen judgmentally for in-depth data collec- tion, including questionnaires, interviews, public records, and less formal observations. In selecting the sample, the evaluators considered some of the nation’s most populous states, counties, and cities but also considered diversity in the types of juris- diction. Budget constraints required a geographi- cally clustered sample.
Page 44 GAO/PEMD-10.1.1 Desiging Evaluations
k

Chapter 3 Types of Design
Planning and Implementation
In this example, the evaluators weighed the need for in-depth information and the need to make gen- eralizations, and they chose in-depth information over a probability sample. They tried to minimize the limitations of their data by using a relatively large and diverse sample.
The multiple case study design may be appropriate in evaluating either program operations or program results (and it can be useful for exploratory appli- cations as described for single case designs). The aim is usually to draw conclusions about a program from a study of cases within the program, but sometimes the conclusions must be limited to state- ments about the cases. When the aim is to make inferences about a program, the best application is probably to base a description of the program’s operations on cases from a very homogeneous pro- gram. The least defensible application is to try to determine a program’s results from cases taken from a heterogeneous program.
Selecting Cases. Since the evaluation strategy does not involve probability sampling, the goal of sam- pling shifts from one of getting a statistically defen- sible sample to something else, frequently one that involves getting variety among the cases.7 The hope is that ensuring variation in the cases will avoid bias in the picture that is constructed of the program.
Information Collection. Even though the intent of the evaluation may not be to literally aggregate information from multiple cases, the frequent need to make statements about a program as a whole or
7Variety is not the only criterion. For other possibilities, see U.S. General Accounting Office (1990) and Patton (1990). Also, when the evaluation question is about cause and effect, see Yin (1989) or Bersen and Barlow (1976) for a discussion of how the sampling problem is analogous to the problem of replicating experiments.
k
Page 45 GAO/PEMIHO.1.4 Desiging Evaluations

Chapter 3 Types of Des&n
to compare across cases suggests the need for uni- formity in the information collection. This may con- flict with the in-depth, unstructured mode of inquiry that produces the rich, detailed information that may be sought with case studies. If there are multiple data collection teams across cases, extra attention must be given to data reliability.
Data Analysis and Reporting. Multiple sites make analysis more complicated and reporting more volu- minous. The analysis techniques suggested by Miles and Huberman (1984), Strauss (1987), Strauss and Corbin (1990) and the software described by Tesch (1990) may be useful.
Where to Look for More The references in the section on single case designs Information apply.
The Criteria- Referenced Case
Case studies can be adapted for answering norma- tive questions about how well program operations or outcomes meet their criteria.
EXAMPLE: Social workers must be able to rule out fraudulent claims under the Social Security Disability Insurance Program. To make sure of the uniform application of the law, program admin- istrators have developed standard procedures for substantiating claims for benefits under the pro- gram. A case study could compare procedures actu- ally used by social workers to those prescribed by the program’s administrators.
The examination of a number of cases might expose violations of prescribed claims-verification proce- dures. Unlike the criteria-referenced survey design, the criteria-referenced case study would not permit an estimate of the frequency with which violations occur. It could show only that violations do or do not occur and, if they do, it might give a clue as to why. Of course, if the number of cases is small and
Page 46 GAO/PEMD10.1.4 Desighg Evaluationa
Chapter 3 Types of Dedgn
violations are rare, the fact that there are violations may go undetected with the case study approach.
Applications The applications of the criteria-referenced case study design are similar to those of the counterpart design under the sample survey strategy. The major difference stems from the fact that data from case studies cannot be statistically projected to a popula- tion. However, for a fixed expenditure of resources, the case study may allow deeper understanding of a program’s operations or outcomes and how these compare to the criteria that have been set for the program. Since case studies can be expensive, care must be taken to ensure the accuracy of cost esti- mates before choosing case studies over other designs. Two applications are likely: an exploration that looks forward to a more comprehensive project and a determination of the possibility, if not the probability, that a criterion has not been met.
Planning and Implementation
How to reach consensus on the criteria and how to measure performance against a criterion-issues that are important in criteria-referenced sample surveys-are considerations in criteria-referenced case studies. In addition, the question of how to choose cases for study is crucial because the conclu- sions may differ, depending on the sample of cases.
Where to Look for More The references cited above for case studies and for Information criteria-referenced survey designs are applicable.
The Field Experiment
The main use of field experiment designs is to draw causal inferences about programs-that is, to answer impact (cause-and-effect) questions. These designs allow the evaluator to compare, for example, a group of persons who are possibly affected by a program to others who have not been exposed to the program. The evaluation question might be, Does the National School Lunch Program
Page 47 GAO/Pm10.1.4 Desii Evaluations

Chapter 3 Types of Design
improve children’s health? To answer the question, the evaluator could compare a measurement of the health of children participating in the program to a measurement of the health of similar children who are not participating.
Field experiments are distinguishable from labora- tory experiments and experimental simulations in that field experiments take place in much less con- trived settings. Conducting an inquiry in the field gives reality to the evaluation, but it is often at the expense of some accuracy in the results. From a practical point of view, GAO’s only plausible choice among the three is usually experiments in the field. True experiments, nonequivalent comparison groups, and before-and-after studies-the field experiment designs we outline below-have in common that measurements are made after a pro- gram has been implemented. Their major difference is in the base to which program participants’ out- comes are compared, as can be seen in the first row of table 3.3. Two other important differences-the persuasiveness of causal arguments derived from the designs and the ease of administration-are shown in rows two and three.
Table 3.3: Some Basic Contrasts Between Three Field Experiment Designs Design
Nonequivalent Basis for contrast True experiment comparison group Before and after Measurements of . ..others in a program participants randomly assigned are compared to comparison group measurements of... Persuasiveness of . ..generally strong argument about the causal effect of program on DarticiDants is...
Administenng the . ..usually difficult design is...
. ..others in a nonequivalent comparison group
. ..quite variable
. ..often difficult
..same participants before program implementation
.usually weak except for interrupted series subtype
. ..relatively easy
Page 48 GAO/PEMD-10.1.4 Desiging Evaluations
chapter 3 Types of Design
The True Experiment
The characteristic of a true experimental design is that some units of study are randomly assigned to a treatment group and some are assigned to one or more comparison groups.8 Random assignment means that every unit available to the experiment has a known probability of being assigned to each group and that the assignment is made by chance, as in the flip of a coin. The program’s effects are estimated by comparing outcomes for the treatment group with outcomes for each comparison group.
EXAMPLE: The Emergency School Aid Act made grants to school districts to ease the problems of school desegregation, An evaluation question was, Do children in schools participating in the program have attitudes about desegregation that are dif- ferent from those of children in schools that are desegregating but not participating in the program? For each district receiving a grant, a list was formed of all schools eligible to participate in the program. The units available to the evaluation consisted of the schools eligible to participate in the program. Within each school district, some schools were ran- domly assigned to receive program funds in the treatment group, and the remainder became the comparison group.
Although the true experimental design is unlikely to be applied much by GAO evaluators, it is an impor- tant design in other evaluation settings in that it is usually the strongest design for causal inference and provides a useful yardstick by which to assess weaknesses or potential weaknesses in a cause-and- effect design. The great strength of the true experi- mental design is that it ordinarily permits very per- suasive statements about the cause of observed outcomes.
%I some experiments, tits are assigned randomly to several levels of treatment-for example, different guaranteed income levels.
Page 49 GAO/PEMD10.1.4 Desiging Evaluations
chapter 3 Types of Design
Applications
Planning and Implementation
An outcome may have several causes. In evaluating a government program to find out whether it causes a particular outcome, the simplest true experi- mental design establishes one group that is exposed to the program and another that is not. The differ- ence in their outcomes is attributed, with some qualifications, to the program. The causal conclu- sion is justified because, under random assignment, most of the factors that determine outcomes other than the program itself are evenly distributed between the two groups; their effects tend to cancel one another out in a comparison of the two groups. Thus, only the program’s effect, if any, accounts for the difference.
When the evaluation question is about cause and effect and there is no ethical or administrative obstacle to random assignment, the true experiment is usually the design of choice. The basic design is used frequently in many different forms in medical and agricultural evaluations but less often in other fields.
The true experiment is seldom, if ever, feasible for GAO because evaluators must have control over the process by which participants in a program are assigned to it, and this control generally rests with the executive branch. Being able to make random assignments is essential: the true experimental design is not possible without it. The obstacles might be overcome in a joint initiative between the executive branch and the evaluators, making a true experiment possible. Also, GAO occasionally reviews true experiments carried out by evaluators in the executive branch.
Generalization. If the ability to generalize is a goal, a true experimental design may be unwarranted. Generalization requires that the units in the experi- ment be a probability sample drawn from a popula- tion of interest, but with a probability sample, more
Page SO GAO/PEMD10.1.4 De&& Evaluationa

chapter 3 Types of Design
than a few units are likely to refuse to participate.g Sometimes, as in the school example above, this may not be a problem because participation in the experiment may be a condition of program partici- pation. In other true experiments, limitations in the available units may not be serious because either generalization from the results to a broad popula- tion is not a goal or the effects of treatment are expected to be reasonably uniform within the popu- lation In the latter case, an attempt can be made to generalize even without a probability sample from the population of interest. Such may be likely in some fields like medicine, where relatively constant treatment effects may be expected, but is less likely in evaluating government programs and policies.
Maintenance of Experimental Conditions, In order to apply the logic of random assignment to rea- soning about cause and effect, the evaluator must ensure that the composition of the groups, and thus the integrity of the experiment, is maintained. One of the chief threats to causal reasoning from a true experiment is that the members of the treatment and comparison groups may drop out at different rates. If people drop out more from one group than from another-as they might if they find the treat- ment disagreeable, for example-then the evalu- ator’s estimate of treatment effects may be distorted. Likewise, if the treatment is allowed to weaken or to vary from participant to participant
‘It is important to bear in mind that a random sample from a pop ulation and random assignment to a treatment or comparison group are two quite different things. The first is for the purpose of generalizing from a sample to a population; random sampling helps ensure external validity. The second is for inferring cause- and-effect relationships; random assignment helps ensure internal Validity.
Page 61 GAO/PEMD-10.1.4 Desiging Evahations

chapter 3 Types of Dedgn
or to spill over to a comparison group, the findings from the evaluation will be compromised.
Where to Look for More Information
Judd and Kenny (1981) and Rossi and Freeman (1989) are general evaluation texts that give consid- erable attention to the true experiment. More inten- sive treatments may be found in Boruch and Wothke (1985), Hausman and Wise (1985), Keppel (1982), Keppel and Zedeck (1989), and Spector (1981). Many references listed under the none- quivalent comparison group design apply here as well.
The Nonequivalent As with the true experiment, the main purpose of Comparison Group the nonequivalent comparison group design is to
Design answer impact (cause-and-effect) questions. A fur- ther parallel is that both designs consist of a treat- ment group and one or more comparison groups. Unlike the groups in the true experiment, however, membership in nonequivalent comparison groups is not randomly assigned. This difference is important because it implies that, since the groups will not be equivalent, causal statements about treatment effects may be substantially weakened.
EXAMPLE: Occupational training programs try to provide people with skills to help them obtain and keep good jobs. An evaluation question might be, Are the average weekly earnings of program gradu- ates higher than would have been expected had they not participated in the training? Participants have ordinarily selected themselves for enrollment in such programs, which rules out random assign- ment. It may be possible to compare the partici- pants with members of another group, but the members of the participant group and the compar- ison group will almost certainly not be equivalent in age, gender, race, and work motivation. Therefore, the raw difference in their earnings would probably not be an appropriate indicator of the effect of the
Page 62 GAO/PJMD-10.1.4 Desii Evaluations
Chapter 3 Types of Design
Applications
Planning and Implementation
training program, but other comparisons might be suitable for drawing cause-and-effect inferences.
This example is intended to show that when treat- ment and comparison groups are not randomly assigned, it is usually not possible to infer that the “raw” difference between the groups has been caused by the treatment. In other words, the two groups probably differ with regard to other factors that affect the difference in outcome, so that the raw difference should be adjusted to compensate for the lack of equivalence between the groups. Using adjustment procedures, including such statis- tical techniques as the analysis of covariance, may strengthen the evaluation conclusions.
Nonequivalent comparison group designs are widely used to answer impact (cause-and-effect) questions because they are administratively easier to implement than true experiments and, in appro- priate circumstances, they permit relatively strong causal statements. Evaluations of health, education, and criminal justice programs can generally collect data from untreated comparison groups but cannot, as we noted above, easily assign subjects randomly to groups in a true experimental design, For example, an evaluation designed to look at the effects of correctional treatment on the recidivism of released criminals through a true experiment would probably not be feasible, because judges base their sentences on the severity of a crime, number of prior offenses, and similar factors, and they would not ordinarily be willing to randomize the correctional treatment that they declare.
Formation of Comparison Groups. The aim of a nonequivalent comparison group design is to draw causal inferences about a program’s effects. The evaluator’s two most important considerations in doing this are the choice of the comparison groups and the nature of the comparisons. In the absence
Page 63 GAO,‘PEMMO.1.4 Desiging Evaluations
of random assignment, treatment groups and com- parison groups may differ substantially. Great dis- similarity usually weakens the conclusions, because it is not possible to rule out factors other than the program as plausible causes for the results. For example, to evaluate a nutritional program for pregnant women, it might be administratively con- venient to compare program participants in an urban area with nonparticipants in a rural area. This would be unwise, however, because dietary and other such differences between the two groups could easiIy account for differences in the status of their health and thereby exaggerate or conceal the effects of the program. Therefore, in most circum- stances it is advisable to form treatment and com- parison groups that are as alike as possible.1o
Naturally Occurring Comparison Groups. For many evaluations, the evaluator is not the one who formed the treatment and comparison groups. Rather, the evaluator is often presented with a situ- ation in which some people have been exposed to the program and others have not. Although the presence of naturally constituted comparison groups somewhat limits the evaluator’s options, the general logic of the design is the same.
Nature of the Comparisons. The way in which treat- ment groups are compared to comparison groups involves statistical techniques beyond the scope of this paper. We can point out, however, that it is important that plans for the comparison be made early, because it will be necessary to collect data on precisely how the groups are not equivalent,
Design Sensitivity. It is crucially important that experimental designs be sensitive enough to detect
‘*The evaluator who has precise control over assignments to the group may prefer instead the “regression discontinuity,” or biased assignment, design, in which the groups are distinctly dif- ferent in !-mown ways that can be adjusted for by statistical procedures.
Page 64 GAO/PEMD-10.1.4 Desiging Evaluations
Chapter 3 Types of Design
effects if they exist, A number of factors, such as sampling error, measurement error, subject varia- bility, and the type of statistical analysis used, determine the likelihood that a given evaluation will reveal a true effect. Lipsey (1990) provides a broad overview of the most important considera- tions in developing a design.
Where to Look for More Information
Many design issues are covered by Cook and Camp- bell (1979), Cronbach (1982), Judd and Kenny (19Sl), Kish (1987), Mohr (1988), Posavac and Carey (1989), Rossi and Freeman (1989), and Saxe and Fine (1981). Design sensitivity and statistical power are treated by Cohen (1988), Kraemer and Thiemann (1987), and Lipsey (1990). Achen (1986), Anderson et al. (1980), Keppel and Zedeck (1989), and Pedhazur (1982), as well as many of the pre- ceding authors, address data analysis issues.
The Before-and- After Design
The distinguishing feature of before-and-after designs is that they compare outcomes for the units of study before the units were exposed to a pro- gram to outcomes measured one or more times after they began to participate in it. There is no compar- ison group as it exists in the other designs.
EXAMPLE: A training program was established to help increase the earnings of workers who had few job skills. For a random sample of trainees, an eval- uation reported their average weekly income before and after their participation in the program.
Although this simple version of a before-and-after design can be used to answer questions about the amount of change that has been observed, it does not allow the attribution of that change to exposure to the program. This is because it is not possible to separate the effects of the training program from other influences on the workers such as the availa- bility of jobs in the labor market, which would also affect their earnings. The absence of a comparison
Page 66 GAO/PEMDlO.1.4 Desiging Evaluations
ChapiXV 3 Types of De&n
Applications
group sharply weakens the kinds of conclusions that can be drawn because comparison groups help rule out alternative explanations for the observed outcomes.
Before-and-after designs can be strengthened by the addition of more observations on outcomes. That is, instead of looking at a given outcome at two points in time, the evaluator can take a look at many points in time; with a sufficient number of points, an interrupted time series analysis can be applied to the before-and-after design to help draw causal inferences. (Such longitudinal data can also be used to advantage with the nonequivalent comparison group design: comparisons can be made between two or more time series.)
EXAMPLE: After the development of a measles vaccine early in the 1960’s, the Centers for Disease Control instituted a nationwide measles eradication program, Grants were made to state and local health authorities to pay for immunization. By 1972, a long series of data was available that reported cases of measles by $-week periods. The evaluation question was, What was the effect of the federal measles eradication program on the number of measles cases? The answer, provided by a before- and-after design using interrupted time series anal- ysis, required distinguishing the effects of the fed- eral program from the effects of private physicians acting in concert with state and local health authorities.
Before-and-after designs with a number of observa- tions over time may provide defensible answers to impact (cause-and-effect) questions. Multiple obser- vations before and after an event help rule out alternative explanations, just as comparison groups do in other designs.
GAO evaluators are most likely to apply before-and- after designs that employ interrupted time series
Page 66 GAO/PEMDlO.lA Desiging Evaluations
i

Chapter 3 Types of DesigJl
Planning and Implementation
analysis to data either collected by GAO or made available from other public sources. The Bureau of the Census, the National Center for Health Statis- tics, the National Center for Educational Statistics, the Bureau of Labor Statistics, and many other such agencies may provide data for investigating the effects of introducing, withdrawing, or modifying national programs. Evaluators will find that the best application is for studies in which a long series of observations has been interrupted by a sharp change in the operation of a federal program.
Alternative Causal Explanations. The general weak- ness of before-and-after designs arises from the absence of comparison groups that could help rule out alternative causal explanations, However, using an interrupted time series can often help make causal arguments relatively strong.
Number of Observations. The simple before-and- after design is seldom satisfactory for cause-and- effect arguments, although it may suffice for mea- suring change, The traditional rule of thumb for interrupted time series analyses says that at least 50 observations are required, but some analysis methods use fewer (Forehand, 1982).
Data Consistency. When measurements are made repeatedly, definitions and procedures may change. Care must be taken to see that time series are free of definitional and measurement changes, because these can be mistaken for program effects.
Where to Look for More Information
Many of the references for design and analysis of the nonequivalent comparison group design cover the before-and-after design as well. In addition, Forehand (1982) and McCleary and Hay (1980) spe- cifically address the time-series design.
Page 67 GAO/PEMDlO.lA DesQing Evaluationa
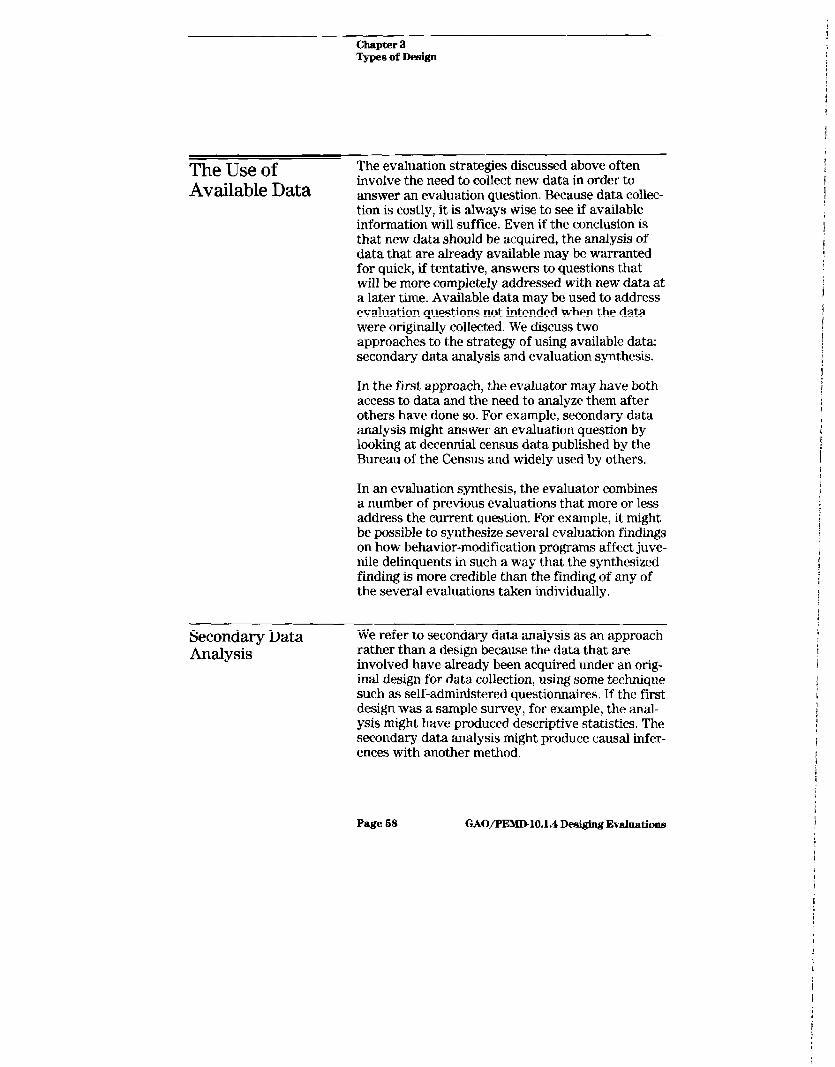
Chapter 3 Types of Design
The Use of Available Data
The evaluation strategies discussed above often involve the need to collect new data in order to answer an evaluation question. Because data collec- tion is costly, it is always wise to see if available information will suffice. Even if the conclusion is that new data should be acquired, the analysis of data that are already available may be warranted for quick, if tentative, answers to questions that will be more completely addressed with new data at a later time. Available data may be used to address evaluation questions not intended when the data were originally collected. We discuss two approaches to the strategy of using available data: secondary data analysis and evaluation synthesis.
In the first approach, the evaluator may have both access to data and the need to analyze them after others have done so. For example, secondary data analysis might answer an evaluation question by looking at decennial census data published by the Bureau of the Census and widely used by others.
In an evaluation synthesis, the evaluator combines a number of previous evaluations that more or less address the current question. For example, it might be possible to synthesize several evaluation findings on how behavior-modification programs affect juve- nile delinquents in such a way that the synthesized finding is more credible than the finding of any of the several evaluations taken individually.
Secondary Data Analysis
We refer to secondary data analysis as an approach rather than a design because the data that are involved have already been acquired under an orig- inal design for data collection, using some technique such as self-administered questionnaires. If the first design was a sample survey, for example, the anal- ysis might, have produced descriptive statistics. The secondary data analysis might produce causal infer- ences with another method.
Page 68 GAO/PEMDlO.ld Desighg Evaluations

Chapter 3 Type8 of Design
Applications
Planning and Implementation
EXAMPLE: Data from 11 sample surveys were used in a major secondary analysis that sought to describe the effects of family background, cognitive skills, personality traits, and years of schooling on personal economic success. The data that were available varied from survey to survey, but overall the investigation focused on American men 25 to 54 years old, and economic success was expressed as either annual earnings or an index of occupational status. Multivariate statistical methods were used to draw inferences about cause-and-effect relation- ships among the variables.
Probably the most common application of sec- ondary data analysis in GAO is in answering ques- tions that were not posed when the data were collected. Many large data sets produced by sample surveys or as part of a program’s administrative procedures are available for secondary analysis. The most likely answers in secondary data analysis are descriptive, but normative and impact (cause- and-effect) questions can be considered.
Access to Data. Some data bases, such as those pro- duced by the Bureau of the Census, are relatively easy to obtain. Others, such as those produced by private research firms, may be much more difficult or even impossible to acquire. Confidentiality and privacy restrictions may prevent access to certain data.
Documentation of Data Bases. There are generally two kinds of documentation problems. Automated data may be difficult to read if the information has been recorded idiosyncratically. The second problem arises when it is hard to understand how the data were collected. How were the variables defined? What was the sample? How were the data collected? How were the data processed and tabu- lated? How were composite variables, such as
Page 69 GAO/PEMD10.1.4 Desiging Evaluations
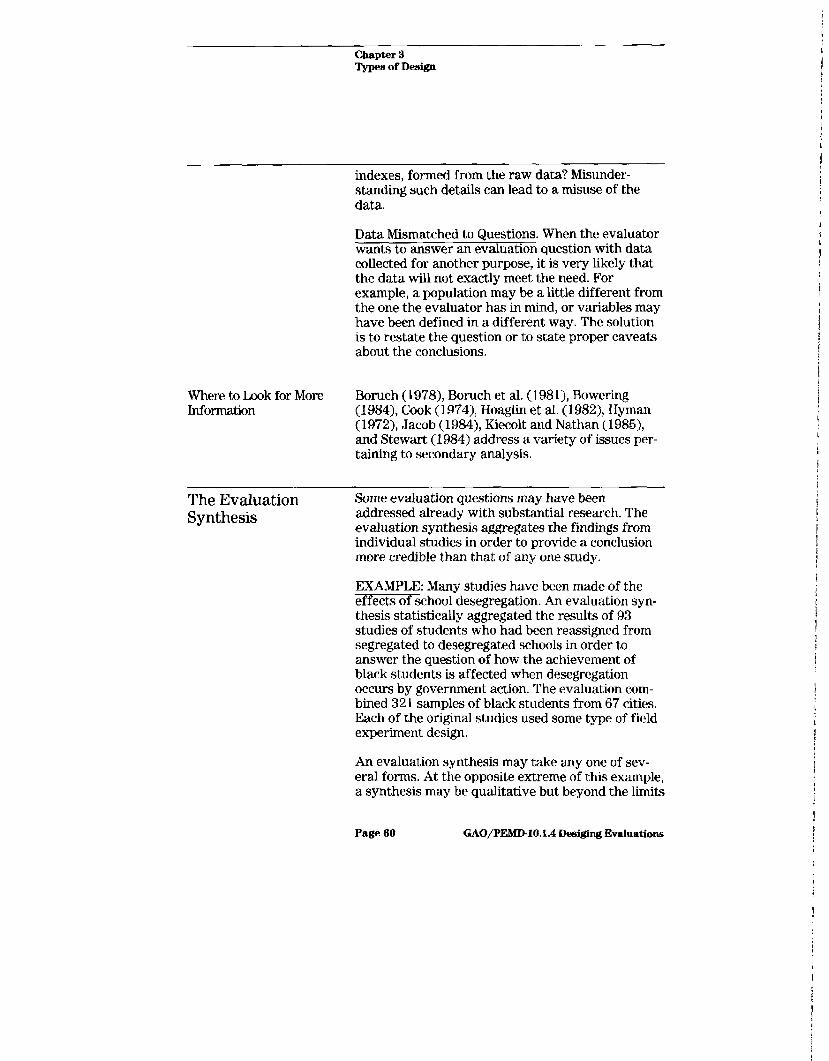
chapter 3 TypesofDesii
indexes, formed from the raw data? Misunder- standing such details can lead to a misuse of the data.
Data Mismatched to Questions. When the evaluator wants to answer an evaluation question with data collected for another purpose, it is very likely that the data will not exactly meet the need. For example, a population may be a little different from the one the evaluator has in mind, or variables may have been defined in a different way. The solution is to restate the question or to state proper caveats about the conclusions.
Where to Look for More Information
Boruch (1978), Boruch et al. (1981), Bowering (1984), Cook (1974), Hoaglin et al. (19823, Hyman (1972), Jacob (1984), Kiecolt and Nathan (1985), and Stewart (1984) address a variety of issues per- taining to secondary analysis.
The Evaluation Synthesis
Some evaluation questions may have been addressed already with substantial research. The evaluation synthesis aggregates the findings from individual studies in order to provide a conclusion more credible than that of any one study.
EXAMPLE: Many studies have been made of the effects of school desegregation. An evaluation syn- thesis statistically aggregated the results of 93 studies of students who had been reassigned from segregated to desegregated schools in order to answer the question of how the achievement of black students is affected when desegregation occurs by government action. The evaluation com- bined 321 samples of black students from 67 cities. Each of the original studies used some type of field experiment design.
An evaluation synthesis may take any one of sev- eral forms. At the opposite extreme of this example, a synthesis may be qualitative but beyond the limits
Page 60 GAO/PEMD-lOJ.4 Desiging Evaluations

Applications
of a typical literature review. The evidence is weighed and qualitatively combined, but there is no attempt to statistically aggregate the results of indi- vidual studies.
A variety of synthesis procedures have been pro posed for statistically cumulating the results of sev- eral studies. Probably the most widely used procedure for answering questions about program effects is “metaanalysis,” which is a way of aver- aging “effect sizes” from several studies. Effect size is proportional to the difference in outcome between a treatment group and a comparison group.
Some form of synthesis is appropriate when avail- able evidence can answer or partially answer an evaluation question, When there is much informa- tion of high quality, a synthesis alone may satisfac- torily answer the question. If the information falls considerably short, it may be useful to perform an evaluation synthesis for a tentative, relatively quick answer and to follow some other strategy for a more definitive answer.
When an issue is highly controversial, the evalua- tion synthesis may help resolve it, because the syn- thesis takes account of the variable quality of conflicting evidence. The evaluations being reviewed for the synthesis may be graded for quality. Judgments may be made about what to include from them in the synthesis, or all usable information may be included, as in some forms of meta-analysis. For the latter, the relationship between quality and effect is statistically analyzed.
Syntheses almost always identify gaps in available information. Finding gaps is not the aim of the eval- uation synthesis, but when a dedicated search for information reveals them, they can be useful in
Page 6 1 GAO/PETbID-10.1.4 Desighg Evaluations

Chapter 3 IypesofDesign
clarifying a debate. Of course, knowing about infor- mation gaps may usefully trigger the gathering of new evidence.
Planning and Implementation
Choice of Form. The nature of the evidence deter- mines the appropriate form. Quantitative tech- niques such as meta-analysis are probably the most stringent, but all syntheses require information about how the evaluations being examined were conducted. This means that the evaluator must become familiar with the literature before settling on a form to use.
Selection of Studies. In synthesizing evaluations, the evaluator must make important decisions about how to define the population of applicable studies and how to ensure that the population or an appro- priate sample of it will be examined. Typically, the evaluator systematically screens the population, selecting specific studies for consideration.
Reliability of Procedures. A synthesis typically involves the detailed review of many studies, which may be undertaken by several staff members. When the work is divided among evaluators, attention must be given to the reliability of the synthesis pro- cedures that the staff members use. Although con- sistency of procedure does not alone ensure sound conclusions, it is necessary. Uniform procedures, such as the use of codebooks, must be established and checks should be made to verify their effectiveness.
Where to Look for More Information
US. General Accounting Office (1983), Light and Pillemer (1984), and Yeaton and Wortman (1984) give relatively broad treatments of the evaluation synthesis. Glass, McGaw, and Smith (1981), Hedges and Olkin (1985) Hunter and Schmidt (1989), Hunter, Schmidt, and Jackson (1982), Rosenthal (1984), Wachter and Straf (1990), and Wolf (1986) are focused on meta-analysis. Cooper (1984) and
Page 62 GAO/PEMD-10.1.4 Desising Evaluations

Chapter 3 Types of Design
Jackson (1980) discuss integrative research reviews. Yin and Heald (1975) discuss a method for aggregating across case studies, and Noblit and Hare (1988) treat considerations involved in syn- thesizing qualitative studies.
tinking a Design With particular strategies, designs, and approaches
to the Evaluation in mind, the evaluator should consider the type of
Questions evaluation question being asked and a number of design-screening questions in order to narrow the choices. The point of departure is the evaluation question. Is it descriptive (about how a high-tech training program was implemented)? Is it normative (about whether the job-placement goals of the high- tech training program were met)? Is it causal (about whether the high-tech training program had an effect on job-placement rates)? The answer will partly determine the design or approach to choose.
The choice of what design or approach to settle on is further narrowed with the help of several design- screening questions about the definitiveness needed in the conclusions and the kind of constraints that are expected. An example of the former is, Must we be able to generalize from what we examine in the evaluation to some Iarger class of things? Examples of the latter are, Can a comparison group be formed? Do we have 6 months or 18 months in which to perform the evaluation?
Figure 3.1 is a decision tree that illustrates this pro- cess of choosing an evaluation design. The branches at the top of the figure point the way to the answer about the type of evaluation question [descriptive, normative, or causal). Branches further down in the figure point out the place at which to ask design- screening questions (Do we want to generalize the findings? Can a comparison group be found or formed? Can subjects be randomly assigned to groups? Can outcomes be measured over time?).
Page 63 GAO/PEMDlO.lA Desighg Evaluations
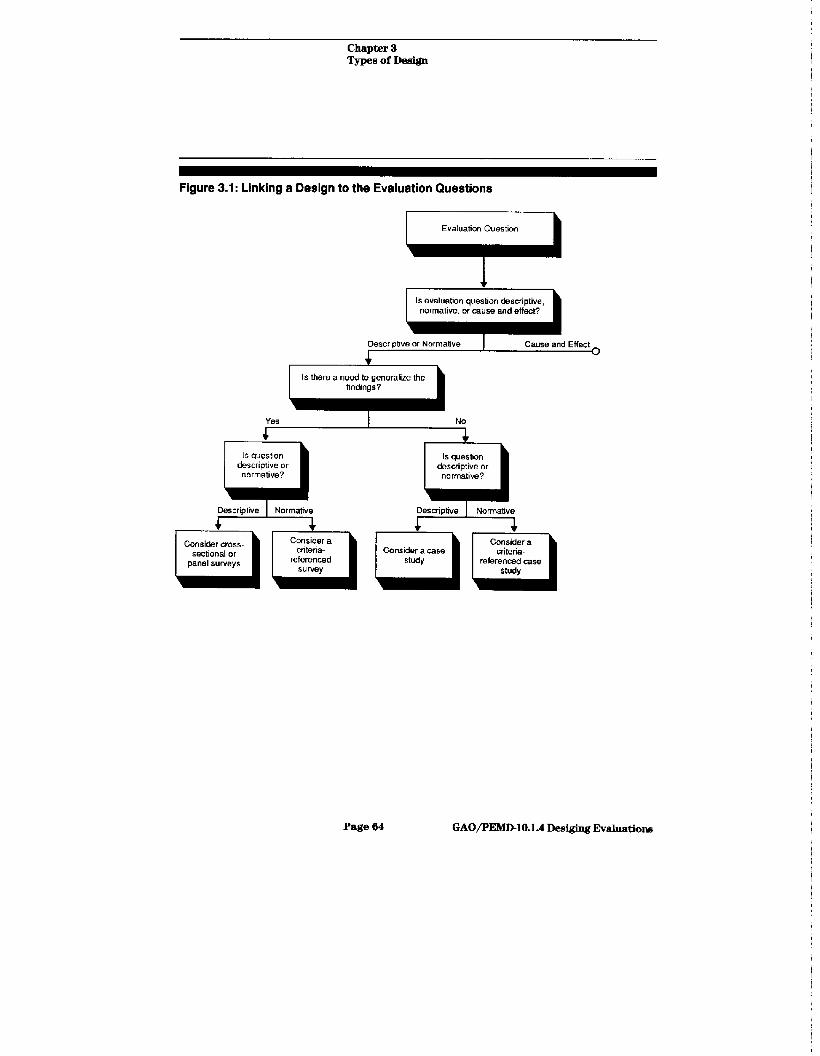
Chapter 3 Types of Design
Figure 3.1: Linking a Design to the Evaluation Questions
Evaluation Question
Is evaluation question clesaiptivs, normative. or cause and effect?
Descriptive or Normative Cause and Effect
Page 64 GAO/PEMBlO.lA Desiging Evaluationa

Chapter 3 TYP-of~rn
Causa and Effect
+ Can a
r-l
comparison group be found
or formed?
Consider combining a
sample survey i-l with nonequivalent
comparison gr0tp
analysis techniques or a
before-and- after design with
a sample I
Page 65
Can outmmes be measured
over time?
Consider a befora-and- cl after design
No
GAO/PEMD10.1.4 Desiging Evaluations
Y

chapter 3 Types of Design
It must be stressed that the design-screening ques- tions in the figure are illustrative and that the figure presents only selected technical matters. For example, approaches using available data have been omitted. Other, equally important factors in choosing a design have also been omitted. They include the availability of resources, the intended use of the evaluation, and the date when the evalu- ation report is expected. When these factors represent constraints, they put boundaries around what can be done.
As a design evolves, and as the evaluation questions become more specific and research possibilities more narrow, the evaluator must balance the tech- nical considerations against the constraints. For example, it might be necessary to choose between collecting new data, which might answer the evalu- ation questions comprehensively, and using avail- able data, which is usually the least expensive course and the quickest but may leave some ave- nues unexplored.
The decision tree almost always ends with the instruction to consider a particular type of design. However, we emphasize the tentativeness in “con- sider,” because we do not want to suggest that there is only one way of designing evaluations. Answers to design-screening questions are not usually as clear-cut as the decision tree suggests, and the rela- tive importance of even these questions may be debated. Furthermore, most evaluations must answer several questions, and where there are sev- eral questions, there may be several design types. Even with only one question, it may be advisable to employ more than one design. The strengths and the weaknesses of several designs may offset one another. Thus, the decision tree is not a rigid proce- dure but a conceptual guide for a systematic consid- eration of design alternatives (McGrath, Martin, and Kulka, 1982).
Page 66 GAO/PEMD-10.1.4 Desiging Evaluations
Chapter 4
Developing a Design: An kmple
We have been stressing a consistent theme-that the development of an evaluation design is a sys- tematic process that takes tune, thought, and craft. The evaluator must pay careful attention to the for- mulation of questions and the means of answering them. This painstaking work can be lengthy at the start of a job, but postponing or eliminating it is an invitation to costly delays, incomplete or mediocre data collection, and uncertain analysis. To generate a design is to think strategically; it is to see the link between the questions being asked and the way in which to collect and analyze the data for answering them. Our theme is exemplified in the narrative that follows about the development of a design for a congressionally requested evaluation of the effects of 1981 changes to the Aid to Families with Dependent Children (AFDC) program.
The Context The Omnibus Budget Reconciliation Act of 1981 mandated important changes to AFDC, a major wel- fare program at the center of debate about welfare and work. On the one hand were people who sug- gested that providing welfare income reduces a recipient’s motivation to work and creates depen- dence on welfare and a permanent underclass of nonworkers; these people favored strict eligibility criteria for the program and work requirements for welfare recipients. On the other hand were some who suggested that work incentives and work requirements are irrelevant to a welfare population composed largely of households headed by women with small children, who either cannot find work or cannot find work that pays enough to meet their daycare, transportation, or medical expenses.
The AFDC program had grown during the 1960’s from 3,O million to 7.3 million in recipients and from $1.1 billion to $3.5 billion in costs. By 1980, the caseload was 11.1 million persons and the yearly costs $12.5 billion. Throughout the period, attempts were made to slow the growth.
Page 67 GAO/PElKD10.1.4 Desiging Evaluations

Y
Chapter 4 Developing a Deslgm An Example
For example, AFDC’s expansion during the 1960’s, both in the level of benefits and in the categories of eligibility, had been accompanied by a movement to encourage mothers who were receiving benefits to work. In 1962, a community work and training pro- gram had emphasized voluntary training and social services as an alternative to prolonged participation in AFDC.
Another strategy had been to reduce the loo-per- cent federal tax on the earnings of AFDC families, a tax that was seen as a “disincentive” to work because each dollar earned was a welfare dollar lost. Modifying this strategy in 1967, the Congress incorporated an “earned-income disregard” provi- sion into the AFDC program, allowing recipients to earn $30 each month with no reduction in bene- fits-a tax rate of 0 percent-and disregarding one third of all additional earnings.
Along with this change, the Congress enacted the Work Incentive (WIN) program, in which AFDC recipients could volunteer to receive training ser- vices. During the 1970’s, however, as the caseload continued to grow, registration in WIN was made mandatory for some AFDC households.
The changes in the AFDC regulations that were specified in the 1981 Omnibus Budget Reconcilia- tion Act focused again on work requirements by allowing the states to operate mandatory “workfare” programs, Other amendments to the legislation changed the policy of allowing working welfare families to accumulate more income than that available to nonworking welfare families. One of the key provisions limited the earned-income dis- regard to 4 months and the total income of an AFDC household to 150 percent of the AFDC need stan- dards established by each of the states.
The Request In June 1982, the House Committee on Ways and Means asked GAO to study the 1981 modifications
Page 68 GAO/PEMDlO.l.4 Desiging Evaluaticma
chapter4 Developing a Deem AnExample
of the AFDC program. The changes were expected to remove many working AFDC families from the program’s rolls, causing many of them to lose their eligibility for Medicaid. Other families would be able to remain on the rolls but with significantly reduced benefits. One concern of the committee wti that, faced with the prospect of losing benefits or seeing them greatly diminished, the families would simply choose to work less or quit working entirely. By cutting back on work, they could retain their eli- gibility for AFDC and Medicaid, However, faced with the loss of benefits, families might instead increase their work effort in order to compensate for the loss.
The committee specifically asked GAO to ascertain (1) the economic well-being, 6 to 12 months after the act’s effective date, of the AFDC families that had been removed from the rolls and that had had their benefits reduced and (2) whether families losing benefits had returned to the rolls or compen- sated for their welfare losses by cutting back on work.
If working families who would lose AFDC or have their grants reduced were to lessen their work effort in order to stay on the rolls, projected budget savings from the legislated changes would be negated or diminished. Therefore, GAO was asked to estimate the budgetary effect of the program changes. The request also required GAO to find out whether the changes had affected family or house- hold composition and to provide information about the demographic, income, and resource characteris- tics of the AFDC families both before and after the change and the frequency with which they moved on and off the rolls. The committee asked GAO to make its report early in 1984, which it did with the April 2 report entitled An Evaluation of the 1981 AFDC Changes: Initial Analyses (PEMD-84-6), issued by the Program Evaluation and Methodology Division. The final report entitled An Evaluation of
Page 69 GAO/PJBlD10.1.4 Desiging Evaluations

Chapter 4 Developing a Des@ An Example
the 1981 AFDC Changes: Final Report (PEMD-85-4) was issued on July 2,1985.
- Design Phase 1: The evaluators began by expIoring ways of stating
Finding an Approach
the key questions and strategies for answering them. They reviewed the substantive and the meth- odological literature and acquired information on the program’s operations. They explored the rele- vance of available data, and they consulted with the committee’s staff and other experts.
The literature review centered on welfare depen- dence, the effects of earlier changes in the program, and the methods other researchers had used to address questions of similar scope and complexity. A systematic reading of the voluminous literature on these topics generated a number of important insights that guided further thinking and refine- ment of the study. For example, the reading on wel. fare dependence led to three hypotheses on the 20- year growth of the AFDC caseload. Similarly, the review pointed out areas where information is lacking, such as on the rate at which people leave welfare programs and do not return within a speci- fied time.
The evaluators found that the literature on program effects stressed the need for a longitudinal perspec- tive. They found that the reports relating work to changes in the AFDC tax rates were informative on design approaches as well as on findings. In reviewing the earlier research methods, the evalu- ators were interested in identifying both designs and measures that fell short or were especially vul- nerable and those that were successful. Thus, the review indicated what not to do and suggested strategies that were promising and worth further consideration.
The evaluators also explored the relevance of avail- able data. The ability to make use of existing data
Page 70 GAO/PEMD-10.1.4 Desiging Evaluationa

chapter 4 Developing a Designz An Example
sets has the advantage of cutting the cost of col- lecting, organizing, verifying, and automating infor- mation. Five data sets were identified and carefully scrutinized.
The consultation with experts included contact with committee staff, economists, political scientists, social welfare analysts, policy analysts, evaluation specialists, and statisticians. Discussions ranged over a wide number of substantive and methodolog- ical issues, and they were held frequently to allow an ongoing critique of the design as it was being for- mulated. The consultation continued throughout the study, suggesting valuable leads to pursue and dead ends to avoid.
In acquiring information on the operation of the AFDC program, the evaluators paid attention to broad operational procedures but also concentrated on three areas. The first was how the states deter- mined AFDC benefits before and after the 1981 act and when and how the changes were implemented. The second was how the program was related to other programs from state to state. The third was the relationship in the states between the participa- tion of AFDC families and local economic condi- tions. Clearly germane to the questions posed by the committee, these interests were stated as questions in language sufficiently general to allow the explo- ration of multiple ideas and sources of information. The goal was not to foreclose prematurely on poten- tially useful material that might lead to a thorough understanding of the program‘s history, how it changed when federal policy was translated to the local level, and whatever would increase the possi- bility of making cause-and-effect statements.
After about 6 weeks, this group of evaluators, as a design team, began to feel confident about two of several possible designs. Then they began to link alternative designs to evaluation questions.
Page 71 GAO/PEMD10.1.4 Desieing Evaluationa
Chapter 4 Developing a Designt An Fxample
Design Phase 2: Assessing Alternatives
The constraints that came to light in phase 1 shaped subsequent thinking about the job and sharpened the assessment of various alternatives. This allowed the evaluators to refine the evaluation questions, which they did in phase 2, so that they could settle on a strategy and a final design.
The first of the constraints began to influence the design when the discussions with experts and numerous visits to the states made it readily apparent that the “national” AFDC program is actually 50 different AFLIC programs, one for each state. The heterogeneity was evident in the fact that each state develops its own payment levels and procedures for setting work and child-care expense deductions within the framework of the federal regulations.
For example, the evaluators found considerable variation with respect to two-parent families in requirements about the presence of an unemployed parent, “need” standards, the percentage of the need standard being paid to recipients, and deduc- tions allowable for child-care and work expenses. The variations meant that quite dissimilar grant payments were being made to families whose com- position and financial circumstances were identical. The circumstance placed pronounced limitations on the evaluators’ ability to generalize from individual states to the nation.
A second constraint was that the states had not timed their implementation of the changes uni- formly. Most states began to implement most of the changes in October 1981, but some states did not implement some provisions until 6 months later, in spring 1982. The variation meant that an aggrega- tion of data from all states would be problematic and that generalizations would be limited. Conse- quently, the baseline for making comparisons would have to shift from state to state.
Page 72 GAO/PEMD1O.1.4 Desiging Evaluationa
chapter4 Developing a Desigm An Example
Another constraint was that the study could not be predicated on the simple assumption that AFDC recipients would make choices between welfare funds and employment funds. AFDC provides direct income support but also enables the recipients to draw on a number of services, most notably health care under the Medicaid program. Any study of why people choose to stay in or leave the AFDC program has to account for the other benefits. They could play an important, if not decisive, role in influencing financial decisions.
A constraint of a different type had to do with the size of the population of working AFDC recipients. The changes in the legislation were of immediate relevance to working families, but their proportion is small in relation to the total caseload. Nationally, the 1979 figure was about 14 percent, but in some states it was as low as 6 or 7 percent. The small per- centages meant that data would have to be collected in a way such that the numbers of earners would be high enough to make statistical projections meaningful.
These and other constraints told the evaluators that to refine the evaluation questions, they would have to pose a study within, rather than between, the states. Similarly, the evaluators began to see the degree to which the study would be able to isolate the effect of the legislative changes from other causal factors, particularly when addressing AFDC recipients’ decisions to stop working and stay on the rolls or to remain off the rolls and seek to support themselves through their own earnings. That is, the 1981 changes to the program were initiated at a time when state economies varied widely, so that the economy could not be “held constant,” or pre- sumed to be comparable among the states. Thus, it had to be considered a possible cause in earners’ decisions. The evaluators also found that their questions would have to account for reductions in other social welfare programs.
e
Page 73 GAO/PEMD-10.1.4 Desising Evaluationa

chapter 4 Developing a Dfdgw An Example
As the design team refined the questions, given the constraints on answering them, it was able to examine data collection and analysis strategies. That is, what the evaluators had learned about the questions, and the considerations of time, cost, staff availability, and user needs, enabled the design team to pull together and assess methods for gath- ering and analyzing data. The evaluators saw two broad strategies, one that would primarily analyze available data and one that would require the col- lection of original data.
It was thought that using one of the five available data sets would be an economical and quick way to report early findings to the Congress. A data set called the “Job Search Assistance Research Project” (JSARP) was the most promising for a study of the effects of the changes in the legislation. JSARP was begun by the U.S. Department of Labor late in 1978 as a large-scale effort to measure the effects of job- search assistance, public-service employment, and job training on the employment, earnings, and wel- fare dependence of low-income persons (not all of whom were AFDC participants). Ten jurisdictions under the Comprehensive Employment and Training Act of 1973 were chosen as “treatment” sites, where special demonstration programs were established to improve the employment opportuni- ties of the target population. Each site was matched with a comparison site as similar as possible in racial and ethnic composition, unemployment rate, primary industries and occupations, size, and loca- tion. The researchers interviewed 30,000 respon- dents in spring 1979, when the demonstration programs were being initiated. Slightly fewer than 3,000 of the respondents had been AFDC recipients for at least part of the year prior to the interview. In 1980, a follow-up interview with 5,700 of the original respondents used substantially the same interviewing instrument; among these respondents were all who had indicated earlier that they had AFDC support, and a large proportion had incomes below 225 percent of the poverty Iine. Thus, JSARP
Page 74 GAO/PEMD-10.1.4 Desii Evahatiom
Chapter 4 Developine a De&w An Example
provides a lengthy record of earnings, other income, work behavior, job search, job training, and family composition for a large sample prior to the institu- tion of the 1981 changes to AFDC.
The evaluators therefore thought that using a before-and-after design and the JSARP data, they could interview the same respondents (or others selected for their similarity to the JSARP respon- dents) with the same or nearly the same data collec- tion instrument to find out their experiences of the 1981 changes. This would provide for a comparison of work and welfare patterns before and after the program change, although it would not establish with certainty whether the 1981 act was the sole cause of any difference between the two interview periods. Nevertheless, statistical analyses might lead to defensible conclusions about cause.
The alternative strategy, the one that was eventu- ally selected, involved collecting before-and-after data at five sites across the country, making inter- views at the five sites with members of working AFDC households who were terminated from AFDC when the 1981 act was implemented, and analyzing national before-and-after data on AFDC caseloads and costs. Of the designs we discussed in chapter 3, this approach included three designs-a none- quivalent comparison group design, a one-group before-and-after design, and a national interrupted time series design.
The plan for the nonequivalent comparison group design was to identify at each site two samples of AFDC recipients, one from a year and a month before the changes and one from the month immedi- ately preceding them. The earlier group would pro- vide a baseline from which to look at the dynamics of work and welfare both immediately before and after the implementation of the act. Both samples would allow for separate subsamples of working and nonworking AFDC recipients, Depending on the
Page 76 GAO/PEMD-10.1.4 Deeiging Evaluationa
Chapter 4 Developing a Design: Au Example
completeness of case records at the sites, the fol- lowing information could be compared: length of participation in AFDC, percentage of AFDC house- holds with earnings at different times, percentage of households leaving and then returning to the rolls, average dollar amounts of AFDC benefits and earned income, percentage of households drawing on various other welfare benefits, and reasons for the termination of AFDC payments. Thus, the com- parisons could be both within and between groups and of several types across three points in time (the baseline and before and after implementation). The evaluators could compare the static characteristics of earners and nonearners, the employment status of the various groups, and the relationship between changes in administrative practices and the behavior of the respondents in terms of the time they spent on AFDC’s rolls, their average net earn- ings, and what they did because of changes in AFDC benefits.
Having decided on this approach, the evaluators constructed interviews within the case study com- ponent that were intended to collect data on and assess the economic well-being of the persons who were removed from the rolls, how they coped with the loss of benefits, and whether they worked more to keep up an income, Here, the comparisons were to be within groups of households before and after the program changes. For example, the evaluators could compare household composition, employment status, earnings, and total disposable income. Of particular interest would be data on whether people increased their work effort or shifted their reliance for support to other programs such as General Assistance or Unemployment Insurance.
The national analysis component, with its inter- rupted time series analysis, would rely on data pro- vided by the U.S. Department of Health and Human Services and by state welfare departments on the operation of AFDC programs, including the imple- mentation of the 1981 provisions, and on caseloads
Page 76 GAO/PEMDlO.l.4 Desiging Evaluation
Chapter 4 Developing a Deeigm An ExtipIe
and outlays for AFDC and related programs. The objectives that were planned were to document the degree to which the 1981 AFDC provisions re>re- sented change from past practices, to explore their effects on national AFDC caseloads and costs, and to determine whether some states tried to negate or reduce the effects of certain provisions. The design team planned for a request of all the states to pro- vide GAO with the results of their own independent evaluations,
Two smaller and complementary components were also posited. One would use archival data and the other would require conducting interviews with state and local program officials and staff. The archival data would include information on AFDC caseload fluctuations and local economic conditions. Collecting these data would explore the degree to which different patterns of dependence on AFDC in three periods might be the product of events other than the AFDC changes, such as a deteriorating labor market.
Design Phase 3: Settling on a Strategy
In the end, a choice has to be made between com- peting design options. The difficulty for the evalu- ator making this choice is in assessing the alternatives. Each one will have strengths and weaknesses, so that the decision comes to what will be both most feasible and most defensible. In the AFDC study, the choice was made in favor of the multistrategy approach. The JSARP approach using available data and interviewing a sample of the original respondents was dropped.
To be sure, both approaches had strengths, and strong arguments were made for both. The scales tipped against the simpler approach when it came to weaknesses. There were several reservations about using the JSARP data. There were problems of accuracy, precision, and completeness (largely because the respondents’ report of AFDC participa- tion were retrospective to as far as 18 months).
Page 77 GAO/PEMD10.1.4 m8iging Evaluations
j

Chapter 4 Developing a De6igm An Example
There was a possibility of bias, since 23 percent of the original respondents did not turn up for the second set of interviews, and the difficulty of finding the respondents for the new study could be even greater. There were not enough earners in the sample. And, finally, practical problems included the fact that the JSARP data were not for public use and might not be obtainable.
In light of all this, the multistrategy approach was adopted. Even with it, there was concern about the availability of case records, finding respondents who had left the AFDC program, the extensive time required to code case records at sites that did not have automated data, the ability to control for dis- parate economic conditions site by site, and the sheer volume of data that would have to be gath- ered, coded, analyzed, and reported. However, com- pared to the concern about JSARP, which tended to be analytical, these problems were more simply pro- cedural. In the end, it was concluded that the ana- lytical problems were a greater threat to the ability to answer the study questions than the procedural ones.
Page 78 GAO/PEMD-10.1.4 Desiging Evaluations
Bibliography
Achen, C. H. The Statistical Analysis of Quasi- Experiments. Gali- fornia Press, 1986.
Anderson, S., et al. Statistical Methods for Compar- ative Studies. New York: o n J 1980.
Babbie, E. R. The Practice of Social Research, 5th ed. Belmont, calif.: Wadsworth, 1989.
Babbie, E. R. Survey Research Methods, 2nd ed. Bel- mont, Calif.: Wadsworth, 1990.
Bainbridge, W. S. Survey Research: A Computer- Assisted Introductvh, 1989.
Black, J. A., and D. J. Champion. Methods and Issues in Social Research. New York: John Wiley and Sons, 1976.
Boruch, R. F. (ed.) Secondary Analysis. San Fran- cisco: Jossey-Bass, 19’18.
Boruch, R. F., et al. Reanalyzing Program Evalua- tions: Policies and Practices for Secondary Analysis of Social and Educational Programs. San Francisco: Jossey-Bass, 1981.
Boruch, R. F., and W. Wothke (eds.). Randomization and Field Experimentation. San Francisco: Jossey- Bass, 1985.
Bowering, D. J. (ed.) Secondary Analysis of Avail- able Data Bases. San Francisco: Jossey-Bass, 1984.
Bradburn, N. M., and S. Sudman and Associates. Improving Interview Method and Questionnaire 1 esign. an
Chelimsky, E. “The Definition and Measurement of Evaluation Quality as a Management Tool.” In R. G.
c
Page 79 GAO/PEMBlO.1.4 Desighg Evaluations

Bibliography
St. Pierre (ed.). Management and Organization of Program Evaluation, pp. 113-26. San Francisco: Jossey-Bass, 1983.
Cohen, J. Statistical Power Analysis for the Behav- ioral Sciences, 2nd ed. Hillsdale, N.J.: Lawrence Erlbaum, 1988
Converse, J. M., and S. Presser. Survey Questions: Handcrafting the Standardized Questionnaire. New- bury Park, Calif.: Sage, 1986.
Cook, T. D. “The Potential and Limitations of Sec- ondary Data Analysis.” In M. W. Apple, M, J. Sub- koviak, and H. S. Lufler, Jr. (eds.). Educational Evaluation: Analysis and Responsibility, pp. 155- 222. Berkeley, Calif.: McCutchan, 1974.
Cook, T. D., and D. T. Campbell. Quasi-Experimen- tation: Design and Analysis Issues for Field Set- tings. Chicago: Rand McNally, 1979.
Cooper, H. M. The Integrative Research Review: A Systematic Approach, 2nd ed. Newbury Park, Calif.: Sage, 1989.
Cronbach, L. J. Designing Evaluations of Educa- tional and Social Programs. San Francisco: Jossey- Bass, 1982.
Forehand, G. A. (ed.). Applications of Time Series Analysis to Evaluation. San Francisco: JosseyBass, 1982.
Fowler, F. J., Jr. Survey Research Methods, rev. ed. Newbury Park, Calif.: Sage, 1988.
Fowler, F. J., Jr., and T. W. Mangione. Standardized Survey~Inter&ewing: MinimizingInterviewer- Related Error. Newburv Park. Calif.: Sage. 1990.
Page 80 GAO/‘PEMD-10.1.4 Desigins Ekaluationa

Bibliography
Glass, G. V., B. McGaw, and M. L. Smith. Meta-Anal- ysis in Social Research. Newbury Park, Calif.: Sage, 1981.
Groves, R. M. Survey Errors and Survey Costs. New York: John Wiley and Sons, 1989.
Hausman, J. A., and D. A. Wise (eds.). Social Exper- imentation. Chicago: University of Chis 1985.
Hayduk, L. A. Structural Equation Modeling with LISREL. Baltimore: Johns Hopkins University Press, 1987.
Hedges, L. V., and I. Olkin. Statistical Methods for Meta-Analysis. New York: Academic Press, 1985.
Henry, G. T. Practical Sampling. Newbury Park, Calif.: Sage, 1990.
Herbert, L. Auditing the Performance of Manage- ment. Belmoi tions, 1979.
Hersen, M., and D. H. Barlow. Single Case Experi- mental Designs. New York: Pergamon, 19’/6.
Hoaglin, D. C., et al. Data for Decisions. Cambridge, Mass.: Abt Books, 1982,
Hunter, J. E., and F. L. Schmidt. Methods of Meta- Analysis: Correcting Error and Bias in Research Findings. Newbury Park, Calif.: Sage, 1989.
Hunter, J. E., F. L. Schmidt, and G. B. Jackson. Meta-Analysis: Cumulating Research Findings Across Studies. Newbury Park, Calif.: Sage, 1982.
Hyman, H. H. Secondary Analysis of Sample Surveys. Middletown, Corm.: Wesleyan University Press, 1972.
Page 81 GAO/PEMD-10.1.4 Desii Evaluation
Bibliography
Jackson, G. B. “Methods for Integrative Reviews.” Review of Educational Research, 50 (1980) 438-60.
Jacob, H. Using Published Data: Errors and Reme- dies. Newbury Park, Calif.: Sage, 1984.
Judd, C. M., and D. A. Kenny. Estimating the Effects of Social Interventions. Cambridge, Eng.: Cambridge University Press, 198 1.
Judd, C. M., and L. H. Kidder. Research Methods in Social Relations, 5th ed. New York: Holt, Rinehart and Winston, 1986.
Kalton, G. Introduction to Survey Sampling. New- bury Park, Calif.: Sage, 1983.
Keppel, G. Design and Analysis: A Researcher’s Handbook, 2nd ed. Englewood Cliffs, N.J.: Prentice- Hall, 1982.
Keppel, G., and S. Zedeck. Data Analysis for Research Designs. New York: W. H. Freeman, 1989.
Kiecolt, K. J., and L. E. Nathan. Secondary Analysis of Survey Data. Newbury Park, Calif.: Sage, 1985.
Kish, L. Survey Sampling, New York: John Wiley and Sons, 1965.
Kish, L. Statistical Design for Research. New York: John Wiley and Sons, 1987.
Kraemer, H. C., and S. Thiemann. How Many Sub- jects? Statistical Power Analysis in Research. New- bury Park, Calif.: Sage, 1987.
Lee, E. S., R. N. Forthofer, and R. J. Lorimor. Ana- lyzing Complex Survey Data. Newbury Park, CaIif.: Sage, 1989.
Page 82 GAO/PEMDlO.1A Desieing Evaluationa
Bibliography
Light, R. J., and D. B. Pillemer. Summing Up: The Science of Reviewing Research. Cambridge, Mass.: Harvard University Press, 1984.
Lipsey, M. Design Sensitivity: Statistical Power for Experimental Research. Newbury Park, Calif. : Sage, 1990.
Marshall, C., and G. G. Rossman. Designing Qualita- tive Research. Newbury Park, Calif.: Sage, 1989.
McCleary, R., and R. A. Hay. Applied Time Series Analysis for the Social Sciences. Newbury Park, Calif.: Sage, 1980.
McGrath, J. E., J. Martin, and R. A. Kulka. Judg- ment Calls in Research. Newbury Park, Caiige, 1982.
Miles, M. B., and M. Huberman. Qualitative Data Analysis. Newbury Park, Calif.: Sage, 1984.
Mohr, L. B. Impact Analysis for Program Evalua- tion. Chicago: Dorsey, 1988.
Noblit, G. W., and R. D. Hare. Meta-Ethnography: Synthesizing Qualitative Studies. Newbury Park, Calif.: Sage, 1988.
Patton, M. Q. Qualitative Evaluation and Research Methods, 2nd ed. Newbury Park, Calif.: Sage, 1990.
Payne, S. L. The Art of Asking Questions. Princeton, N.J.: Princeton University Press, 1951.
Pedhazur, E. L. Multiple Regression in Behavioral Research, 2nd ed. New York: Halt, Rinehart and Winston, 1982.
Popham, W. J. Educational Evaluation. Englewood Cliffs, N.J.: Prentice-Hall. 1975.
Page 83 GAO/PEMDlO.l.4 Dedging Evaluations

Bibliography
Posavac, E. J., and R. G. Carey. Program Evalua- tion: Methods and Case Studies, 3rd ed. Englewood Cliffs, N.J.: Prentice-Hall, 1989.
Provus, M. M. Discrepancy Evaluation. Berkeley, Calif.: McCutchan, 1971.
Rosenthal, R. Meta-Analytic Procedures for Social Research. Newbury Park, Calif.: Sage, 1984.
Rossi, P. H., and H. E. Freeman. Evaluation: A Sys- tematic Approach, 4th ed. Newbury Park, Calif.: Sage, 1989.
Runkel, P. J., and J. E, McGrath. Research on Human Behavior: A Systematic Guide to Method. New York: Holt, Rinehart, and Winston, 1972.
Saxe, L., and M. Fine. Social Experiments: Methods for Design and Evaluation. Newbury Park, Calif.: Sage, 1981.
Scheaffer, R. L., W. Mendenhall, and L. Ott. Elemen- tary Survey Sampling, 4th ed. Boston: PWS-Kent, 1990.
Spector, P. E. Research Designs. Newbury Park, Calif.: Sage, 1981.
Steinmetz, A. “The Discrepancy Evaluation Model.” In G. F. Madaus, M. Striven, and D. L. Stufflebeam (eds,) Evaluation Models: Viewooints on Educa- tion& and Human Services Evaluation. Boston: Kluwer-Nijhoff, 1983.
Stewart D. W. Secondarv Research: Information Sources’and Methods. Niwbury Park, Calif.: Sage, 1984.
Strauss, A. L. Qualitative Analysis for Social Scien- tists. Cambridge, Eng.: Cambridge University Press, m.
Page 84 GAO/PEMDlO.l .4 Desiging Evaluations

Bibliography
Strauss, A. L., and J. Corbin. Basics of Qualitative Research. Newbury Park, Cahf.: Sage, 1990.
Sudman, S. Applied Sampling. New York: Academic Press, 1976.
Tesch, R. Qualitative Research Analysis Types and Software Tools. New York: Taylor and Francis, 1990.
U.S. General Accounting Office. The Evaluation Synthesis, methods paper I. Washington, D,C.: April 1983.
U.S. General Accounting Office. Using Structured Interviewing Techniques, methodology transfer 5.: July 1986. paper .
U.S. General Accounting Office. Using Statistical yE;pg, transfer paper 6. Washington, DC.: April
U.S. General Accounting Office. Developing and Using Questionnaires, transfer pw ington, D.C.: July 1986b.
U.S. General Accounting Office. Case Study EvaIua- e, transfer paper 10.1.9. Washington, D.C.: November 1990.
Wachter, K. W., and M, L. Straf (eds.). The Future of Meta-Analysis. New York: The Russell Sage Foundation, 1990.
Warwick, D. P., and C. A. Lininger. The Sample Survey: Theory and Practice. New York McGraw- Hill, 19’15.
Wholey, J. S. Evaluation: Promise and Performance. Washington, D.C.: Urban Institute, 1979.
Page 86 GAO/PENJSlO.l.4 Dedging Evaluations
Bibliography
Wolf, F. M. Meta-Analysis: Quantitative Methods for Research Synthesis. Newbury Park, Calif.: Sage, 1986.
Yeaton, W. H., and P. M. Wortman (eds.). Issues in Data Synthesis. San Francisco: Jossey-Basm
Yin, R. K. Case Study Research: Design and Methods. rev. ed. Newbury Park, Calif.: Sage, 1989.
Yin, R. K., and K. A. Heald. “Using the Case Survey Method to Analyze Policy Studies.” Administrative Science Quarterly, 20 (September 1975), 371-81.
Page 86 GAO/F+EMD-1O.l.4DmigingEvaluationa

Bias The extent to which a measurement or a sampling or analytic method systematically underestimates or overestimates a value,
construct An attribute, usually unobservable, such as educa- tional attainment or socioeconomic status, that is represented by an observable measure.
Construct Validity The extent to which a measurement method accu- rately represents a construct and produces an observation distinct from that produced by a mea- sure of another construct.
Covariation The degree to which two measures vary together.
Cross-Sectional Data Observations collected on subjects or events at a single point in time.
External Validity The extent to which a finding applies (or can be generalized) to persons, objects, settings, or times other than those that were the subject of study.
Generalizability Used interchangeably with “external validity,”
Internal Validity The extent to which the causes of an effect are established by an inquiry.
Longitudinal Data Sometimes called “time series data,” observations collected over a period of time; the sample (instances or cases) may or may not be the same each time but the population remains constant.
Page87 GAO/PEMD-lO.l.4DesiiEvaluations
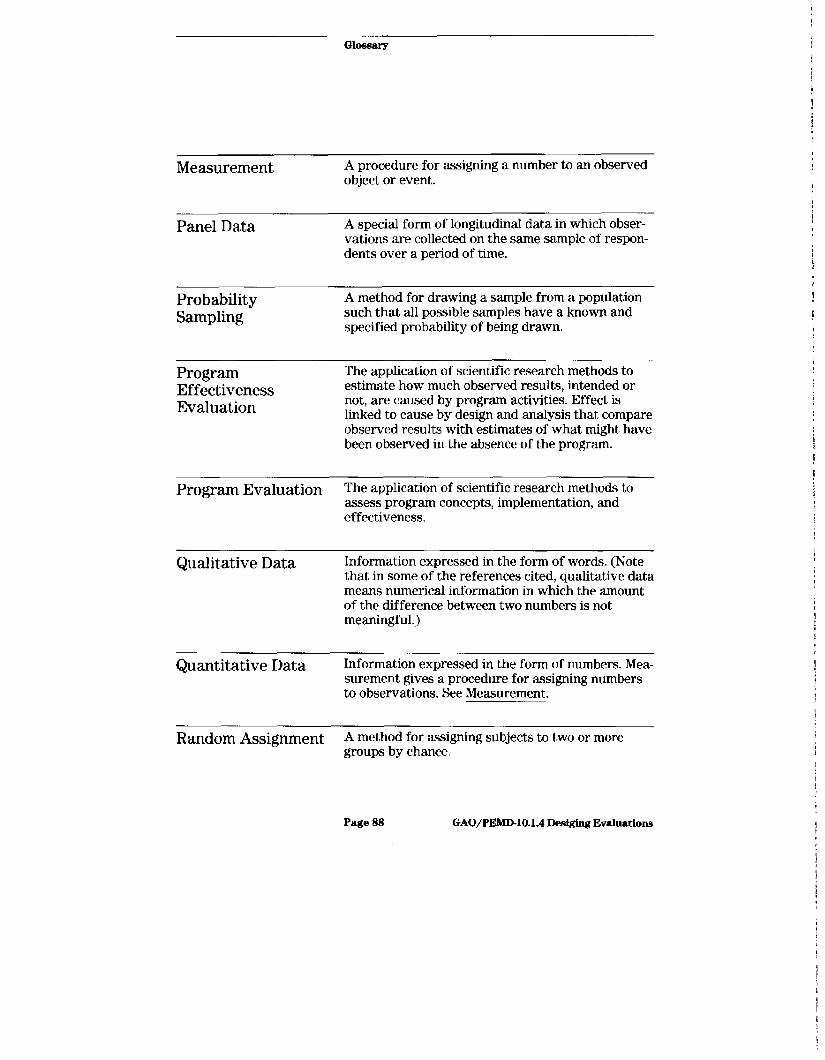
Measurement A procedure for assigning a number to an observed object or event.
Panel Data A special form of 1ongitudinaI data in which obser- vations are collected on the same sample of respon- dents over a period of time.
Probability Sampling
A method for drawing a sample from a population such that all possible samples have a known and specified probability of being drawn.
Program Effectiveness Evaluation
The application of scientific research methods to estimate how much observed results, intended or not, are caused by program activities. Effect is linked to cause by design and analysis that compare observed results with estimates of what might have been observed in the absence of the program.
Program Evaluation The application of scientific research methods to assess program concepts, implementation, and effectiveness.
Qualitative Data Information expressed in the form of words. [Note that in some of the references cited, qualitative data means numerical information in which the amount of the difference between two numbers is not meaningful.)
Quantitative Data Information expressed in the form of numbers. Mea- surement gives a procedure for assigning numbers to observations. See Measurement.
Random Assignment A method for assigning subjects to two or more groups by chance.
Page 88 GAO/PEMD-10.1.4 Desii Evaluations
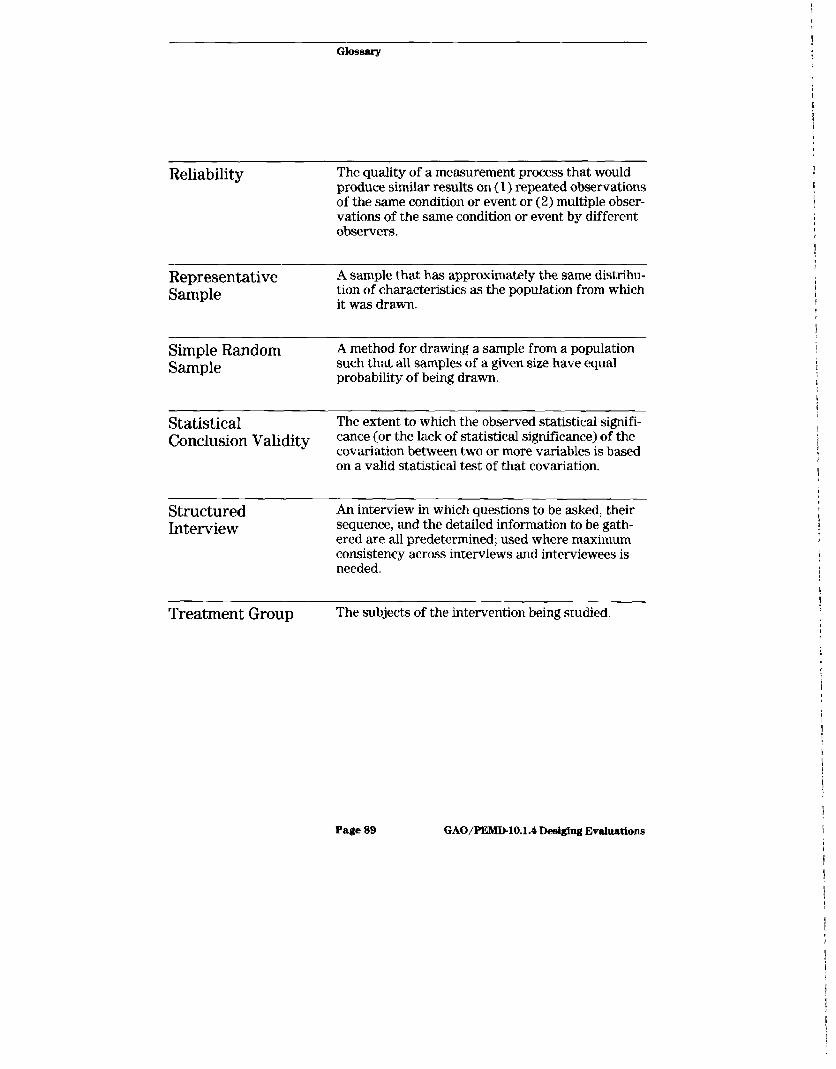
Reliability The quality of a measurement process that would produce similar results on (1) repeated observations of the same condition or event or (2) multiple obser- vations of the same condition or event by different observers.
Representative Sample
A sample that has approximately the same distribu- tion of characteristics as the population from which it was drawn,
Simple Random Sample
A method for drawing a sample from a population such that all samples of a given size have equal probability of being drawn.
Statistical The extent to which the observed statistical signifi- Conclusion Validity came (or the lack of statistical significance) of the
covariation between two or more variables is based on a valid statistical test of that covariation.
Structured Interview
An interview in which questions to be asked, their sequence, and the detailed information to be gath- ered are all predetermined, used where maximum consistency across interviews and interviewees is needed.
Treatment Group The subjects of the intervention being studied.
Page 89 GAO/PEMDlO.l.P Desiging Evaluations

Papers in This Series
(973317)
This is a flexible series continually being added to and updated. The interested reader should inquire about the possibility of additional papers in the series.
The Evaluation Synthesis. Transfer paper 10.1.2, formerly methods paper I.
Content Analysis: A Methodology for Structuring and Analyzing Written Material. Transfer paper 10.1.3, formerly methodology transfer paper 3.
Designing Evaluations. Transfer paper 10.1.4, for- merly methodology transfer paper 4.
Using Structured Interviewing Techniques. Transfer paper 10.1.5, formerly methodology transfer paper 5.
Using Statistical Sampling. Transfer paper 10.1.6, formerly methodology transfer paper 6.
Developing and Using Questionnaires. Transfer paper 10.1.7, formerly methodology transfer paper 7.
Case Study Evaluations. Transfer paper 10.1.9, for- merly methodology transfer paper 9.
Prospective Evaluation Methods: The Prospective Evaluation Synthesis. Transfer paper 10.1.10, for- merly methodology transfer paper 10.
Page 90 GAO/PEMD-10.1.4 Desiging Eval~~~tio~

U.S. Gened Accamm:m P.O. Box 6615 Gahherdmrg, MEI ZWBW
Ordersmayalmbepfrcarad~c*lifirac~268)276 6241.

United States General Accounting Office Washington, D.C. 20648
Official Business Penalty for Private Use $300