urry • cain • wasserman • minorsky • jackson • reece …4.5.pdfurry • cain • wasserman...
TRANSCRIPT

CAMPBELL BIOLOGY IN FOCUS
© 2014 Pearson Education, Inc.
Urry • Cain • Wasserman • Minorsky • Jackson • Reece
Lecture Presentations by Kathleen Fitzpatrick and Nicole Tunbridge
Unit 4.5
Broad Patterns of Evolution

© 2014 Pearson Education, Inc.
Overview: Lost Worlds
▪ Past organisms were very different from those now alive
▪ The fossil record shows evidence of macroevolution, broad changes above the species level; for example
▪ The emergence of terrestrial vertebrates ▪ The impact of mass extinctions▪ The origin of flight in birds

© 2014 Pearson Education, Inc.
Figure 23.1

© 2014 Pearson Education, Inc.
Figure 23.UN01
Cryolophosaurus skull

© 2014 Pearson Education, Inc.
Concept 23.1: The fossil record documents life’s history
▪ The fossil record reveals changes in the history of life on Earth

© 2014 Pearson Education, Inc.
Figure 23.2
Dimetrodon
Coccosteus cuspidatus
Stromatolites
Tappania
Tiktaalik
Hallucigenia
Dickinsoniacostata
3,500
1,500600560
510500
400375
300270
200175
100mya
0.5 m
4.5 cm
1 cm
1 m
2.5 cm
Rhomaleosaurusvictor

© 2014 Pearson Education, Inc.
The Fossil Record
▪ Sedimentary rocks are deposited into layers called strata and are the richest source of fossils
▪ The fossil record indicates that there have been great changes in the kinds of organisms on Earth at different points in time

© 2014 Pearson Education, Inc.
▪ Few individuals have fossilized, and even fewer have been discovered
▪ The fossil record is biased in favor of species that▪ Existed for a long time▪ Were abundant and widespread▪ Had hard parts

© 2014 Pearson Education, Inc.
How Rocks and Fossils Are Dated
▪ Sedimentary strata reveal the relative ages of fossils▪ The absolute ages of fossils can be determined by
radiometric dating▪ A “parent” isotope decays to a “daughter” isotope at
a constant rate▪ Each isotope has a known half-life, the time
required for half the parent isotope to decay

© 2014 Pearson Education, Inc.
Figure 23.3
½
¼⅛
Time (half-lives)
Frac
tion
of p
aren
tis
otop
e re
mai
ning
Remaining“parent”isotope
Accumulating“daughter”
isotope
1 2 4
1 16
3

© 2014 Pearson Education, Inc.
▪ Radiocarbon dating can be used to date fossils up to 75,000 years old
▪ For older fossils, some isotopes can be used to date volcanic rock layers above and below the fossil

© 2014 Pearson Education, Inc.
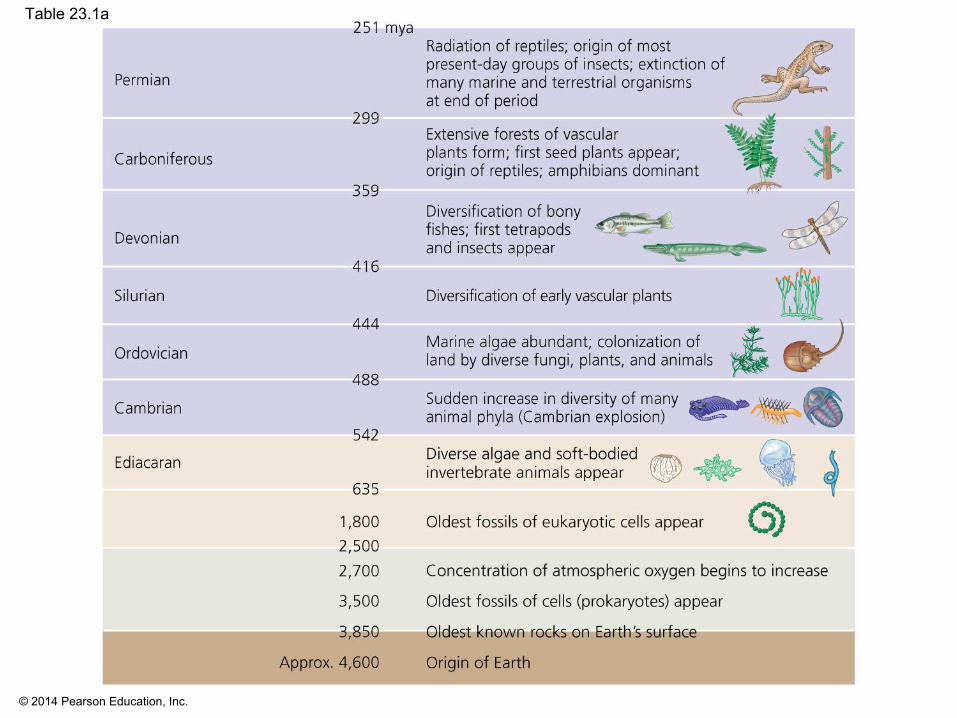
▪ The geologic record is a standard time scale dividing Earth’s history into the Hadean, Archaean, Proterozoic, and Phanerozoic eons
▪ The Phanerozoic encompasses most of the time that animals have existed on Earth
▪ The Phanerozoic is divided into three eras: the Paleozoic, Mesozoic, and Cenozoic
▪ Major boundaries between geological divisions correspond to extinction events in the fossil record
The Geologic Record

© 2014 Pearson Education, Inc.
Table 23.1
© 2014 Pearson Education, Inc.
Table 23.1a

© 2014 Pearson Education, Inc.
Table 23.1b

© 2014 Pearson Education, Inc.
▪ The oldest known fossils are stromatolites, rocks formed by the accumulation of sedimentary layers on bacterial mats
▪ Stromatolites date back 3.5 billion years ago▪ Prokaryotes were Earth’s sole inhabitants for more
than 1.5 billion years

© 2014 Pearson Education, Inc.
▪ Early prokaryotes released oxygen into the atmosphere through the process of photosynthesis
▪ The increase in atmospheric oxygen that began 2.4 billion years ago led to the extinction of many organisms
▪ The eukaryotes flourished in the oxygen-rich atmosphere and gave rise to multicellular organisms

© 2014 Pearson Education, Inc.
The Origin of New Groups of Organisms
▪ Mammals belong to the group of animals called tetrapods
▪ The evolution of unique mammalian features can be traced through gradual changes over time

© 2014 Pearson Education, Inc.
Figure 23.4
OTHERTETRA-PODS
Synapsid (300 mya)
Reptiles(includingdinosaurs and birds)
†Very late (non-mammalian)cynodonts
†Dimetrodon
Mammals
Synapsids
Therapsids
Cynodonts
Key to skull bonesArticular DentaryQuadrate Squamosal
Early cynodont (260 mya)
Temporalfenestra(partial view)
Hinge
Temporalfenestra
Hinge
Temporalfenestra
Hinge Hinge
Therapsid (280 mya)New hinge
Very late cynodont (195 mya)
Original hinge
Later cynodont (220 mya)

© 2014 Pearson Education, Inc.
▪ Synapsids (300 mya) had single-pointed teeth, large temporal fenestra, and a jaw hinge between the articular and quadrate bones

© 2014 Pearson Education, Inc.
▪ Therapsids (280 mya) had large dentary bones, long faces, and specialized teeth, including large canines

© 2014 Pearson Education, Inc.
Figure 23.4b
Synapsid (300 mya)
Therapsid (280 mya)
Key to skull bonesArticularQuadrateDentarySquamosal
Temporalfenestra
Temporalfenestra
Hinge
Hinge

© 2014 Pearson Education, Inc.
▪ Early cynodonts (260 mya) had large dentary bones in the lower jaw, large temporal fenestra in front of the jaw hinge, and teeth with several cusps

© 2014 Pearson Education, Inc.
▪ Later cynodonts (220 mya) had teeth with complex cusp patterns and an additional jaw hinge between the dentary and squamosal bones

© 2014 Pearson Education, Inc.
▪ Very late cynodonts (195 mya) lost the original articular-quadrate jaw hinge
▪ The articular and quadrate bones formed inner ear bones that functioned in transmitting sound
▪ In mammals, these bones became the hammer (malleus) and anvil (incus) bones of the ear

© 2014 Pearson Education, Inc.
Figure 23.4c
Key to skull bonesArticularQuadrateDentarySquamosal
Hinge
New hinge
Original hinge
Hinge
Temporalfenestra(partial view)
Early cynodont (260 mya)
Later cynodont (220 mya)
Very late cynodont (195 mya)

© 2014 Pearson Education, Inc.
▪ The history of life on Earth has seen the rise and fall of many groups of organisms
▪ The rise and fall of groups depend on speciation and extinction rates within the group
Concept 23.2: The rise and fall of groups of organisms reflect differences in speciation and extinction rates

© 2014 Pearson Education, Inc.
Figure 23.5
Commonancestor oflineages Aand B
Millions of years ago
Lineage BLineage A
†
†
†
†
†
†
4 3 2 1 0

© 2014 Pearson Education, Inc.
Plate Tectonics
▪ At three points in time, the landmasses of Earth have formed a supercontinent: 1.1 billion, 600 million, and 250 million years ago
▪ According to the theory of plate tectonics, Earth’s crust is composed of plates floating on Earth’s mantle
▪ Tectonic plates move slowly through the process of continental drift
▪ Oceanic and continental plates can separate, slide past each other, or collide
▪ Interactions between plates cause the formation of mountains and islands and earthquakes

© 2014 Pearson Education, Inc.
Figure 23.7
Eurasian Plate
PhilippinePlate
AustralianPlate
IndianPlate
ArabianPlate
AfricanPlate
AntarcticPlate
ScotiaPlate
NazcaPlate
SouthAmericanPlate
PacificPlate
CaribbeanPlate
NorthAmericanPlateJuan
de FucaPlate
Cocos Plate

© 2014 Pearson Education, Inc.
Consequences of Continental Drift
▪ Formation of the supercontinent Pangaea about 250 million years ago had many effects
▪ A deepening of ocean basins▪ A reduction in shallow water habitat▪ A colder and drier climate inland

© 2014 Pearson Education, Inc.
Figure 23.8
Collision ofIndia withEurasia
Present-daycontinents
Laurasia andGondwanalandmasses
The supercontinentPangaeaPangaea
Gondwana
Laurasia
Antarctica
Eurasia
AfricaIndia
Australia
North America
SouthAmerica Madagascar
Cen
ozoi
cM
esoz
oic
Pale
ozoi
c251 mya
135 mya
65.5 mya
45 mya
Present

© 2014 Pearson Education, Inc.
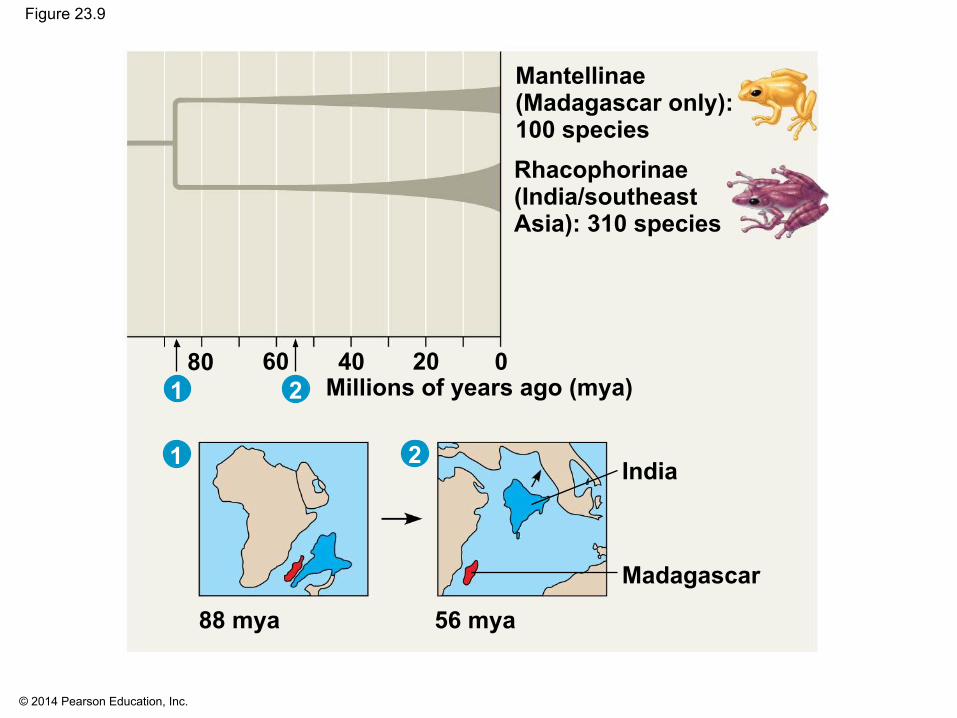
▪ Continental drift can cause a continent’s climate to change as it moves north or south
▪ Separation of landmasses can lead to allopatric speciation
▪ For example, frog species in the subfamilies Mantellinae and Rhacophorinae began to diverge when Madagascar separated from India
© 2014 Pearson Education, Inc.
Figure 23.9
Millions of years ago (mya)
Mantellinae(Madagascar only):100 speciesRhacophorinae(India/southeastAsia): 310 species
India
Madagascar
56 mya88 mya
1
1
2
280 60 40 20 0

© 2014 Pearson Education, Inc.
▪ The distribution of fossils and living groups reflects the historic movement of continents
▪ For example, the similarity of fossils in parts of South America and Africa is consistent with the idea that these continents were formerly attached

© 2014 Pearson Education, Inc.
Mass Extinctions
▪ The fossil record shows that most species that have ever lived are now extinct
▪ Extinction can be caused by changes to a species’ environment
▪ At times, the rate of extinction has increased dramatically and caused a mass extinction
▪ Mass extinction is the result of disruptive global environmental changes

© 2014 Pearson Education, Inc.
The “Big Five” Mass Extinction Events
▪ In each of the five mass extinction events, more than 50% of Earth’s species became extinct

© 2014 Pearson Education, Inc.
Figure 23.10
Time (mya)
Paleozoic Mesozoic Cenozoic
542 488 444 416 359 299 251 200 145 65.5 0E O S D C P Tr J PC N Q
0
100
200
300
400
500
600
700
800
900
1,000
1,100
EraPeriod
To
tal e
xtin
ctio
n ra
te(fa
mili
es p
er m
illio
n ye
ars)
:
Num
ber o
f fam
ilies
:
0
5
10
15
20
25
© 2014 Pearson Education, Inc.
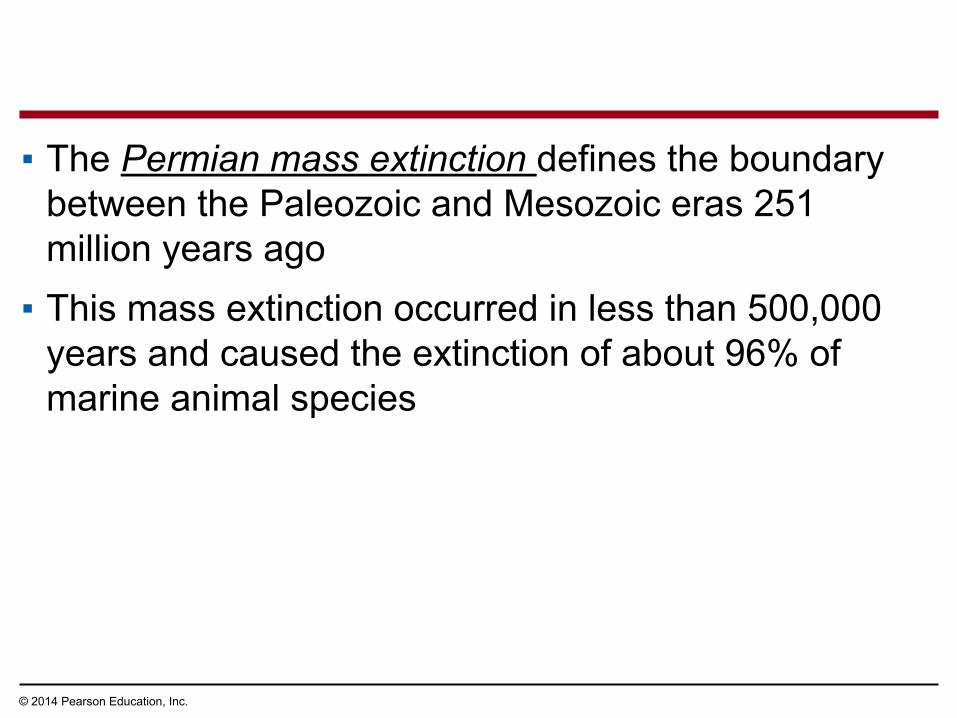
▪ The Permian mass extinction defines the boundary between the Paleozoic and Mesozoic eras 251 million years ago
▪ This mass extinction occurred in less than 500,000 years and caused the extinction of about 96% of marine animal species

© 2014 Pearson Education, Inc.
▪ A number of factors might have contributed to these extinctions
▪ Intense volcanism in what is now Siberia▪ Global warming resulting from the emission of large
amounts of CO2 from the volcanoes▪ Reduced temperature gradient from equator to poles▪ Oceanic anoxia from reduced mixing of ocean waters

© 2014 Pearson Education, Inc.
▪ The Cretaceous mass extinction 65.5 million years ago separates the Mesozoic from the Cenozoic
▪ Organisms that went extinct include about half of all marine species and many terrestrial plants and animals, including most dinosaurs

© 2014 Pearson Education, Inc.
▪ The presence of iridium in sedimentary rocks suggests a meteorite impact about 65 million years ago
▪ Dust clouds caused by the impact would have blocked sunlight and disturbed global climate
▪ The Chicxulub crater off the coast of Mexico is evidence of a meteorite collision that dates to the same time

© 2014 Pearson Education, Inc.
Figure 23.11
NORTHAMERICA
YucatánPeninsula
Chicxulubcrater

© 2014 Pearson Education, Inc.
Is a Sixth Mass Extinction Under Way?
▪ Scientists estimate that the current rate of extinction is 100 to 1,000 times the typical background rate
▪ Extinction rates tend to increase when global temperatures increase
▪ Data suggest that a sixth, human-caused mass extinction is likely to occur unless dramatic action is taken

© 2014 Pearson Education, Inc.
Figure 23.12
Mass extinctions
Cooler WarmerRelative temperature
0 1 2−2 −1−3−2
−1
0
1
2
3R
elat
ive
extin
ctio
n ra
te o
fm
arin
e an
imal
gen
era
3 4

© 2014 Pearson Education, Inc.
Consequences of Mass Extinctions
▪ Mass extinction can alter ecological communities and the niches available to organisms
▪ It can take 5–100 million years for diversity to recover following a mass extinction
▪ The type of organisms residing in a community can change with mass extinction
▪ For example, the percentage of marine predators increased after the Permian and Cretaceous mass extinctions
▪ Mass extinction can pave the way for adaptive radiations

© 2014 Pearson Education, Inc.
Figure 23.13
Time (mya)
Paleozoic Mesozoic Cenozoic
542 488 444 416 359 299 251 200 145 65.5 0E O S D C P Tr J PC N
Q
EraPeriod
0
10
20
30
40
50
Pred
ator
gen
era
(%)
Permian massextinction
Cretaceousmass extinction

© 2014 Pearson Education, Inc.
Adaptive Radiations
▪ Adaptive radiation is the evolution of many diversely adapted species from a common ancestor
▪ Adaptive radiations may follow▪ Mass extinctions▪ The evolution of novel characteristics▪ The colonization of new regions

© 2014 Pearson Education, Inc.
Worldwide Adaptive Radiations
▪ Mammals underwent an adaptive radiation after the extinction of terrestrial dinosaurs
▪ The disappearance of dinosaurs (except birds) allowed for the expansion of mammals in diversity and size
▪ Other notable radiations include photosynthetic prokaryotes, large predators in the Cambrian, land plants, insects, and tetrapods

© 2014 Pearson Education, Inc.
Figure 23.14
Ancestralmammal
ANCESTRALCYNODONT
Time (millions of years ago)250 200 150 100 50 0
Eutherians(5,010species)
Marsupials(324species)
Monotremes(5 species)

© 2014 Pearson Education, Inc.
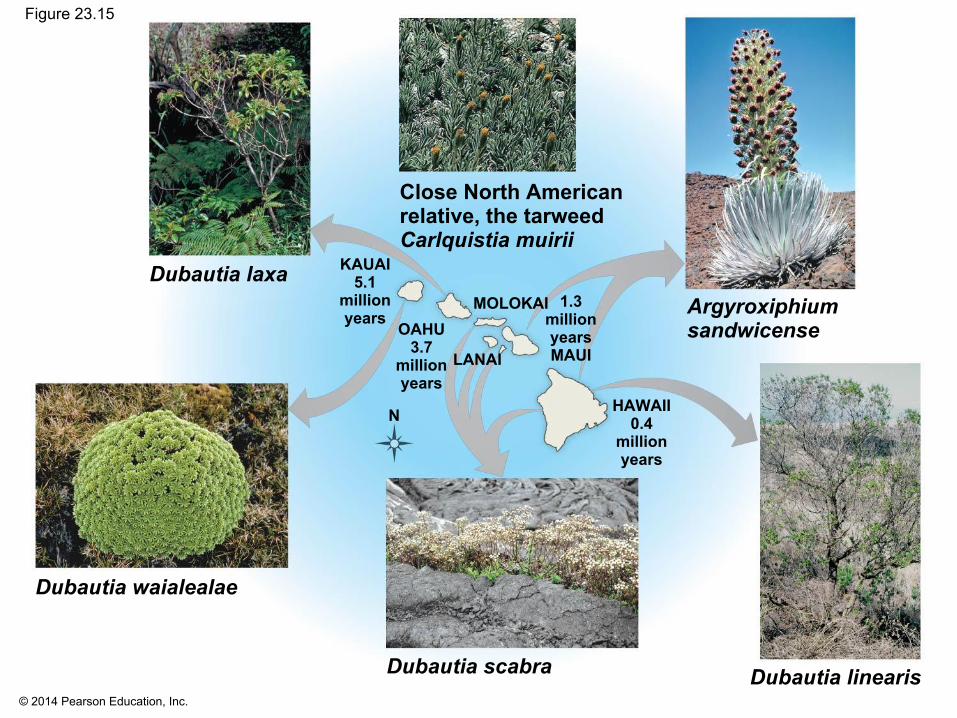
Regional Adaptive Radiations
▪ Adaptive radiations can occur when organisms colonize new environments with little competition
▪ The Hawaiian Islands are one of the world’s great showcases of adaptive radiation
© 2014 Pearson Education, Inc.
Figure 23.15
Close North Americanrelative, the tarweedCarlquistia muirii
Argyroxiphiumsandwicense
Dubautia linearisDubautia scabra
Dubautia waialealae
Dubautia laxa KAUAI5.1
millionyears
OAHU3.7
millionyears
HAWAII0.4
millionyears
1.3millionyearsMAUI
MOLOKAI
LANAI
N

© 2014 Pearson Education, Inc.
Figure 23.15a
KAUAI5.1
millionyears
OAHU3.7
millionyears
HAWAII
0.4millionyears
1.3 million years MAUI
MOLOKAI
LANAI
N

© 2014 Pearson Education, Inc.
▪ Studying genetic mechanisms of change can provide insight into large-scale evolutionary change
▪ Genes that program development influence the rate, timing, and spatial pattern of changes in an organism’s form as it develops into an adult
Concept 23.3: Major changes in body form can result from changes in the sequences and regulation of developmental genes

© 2014 Pearson Education, Inc.
Changes in Rate and Timing
▪ Heterochrony is an evolutionary change in the rate or timing of developmental events
▪ It can have a significant impact on body shape▪ The contrasting shapes of human and chimpanzee
skulls are the result of small changes in relative growth rates

© 2014 Pearson Education, Inc.
Figure 23.16
Chimpanzee infant Chimpanzee adult
Chimpanzee adultChimpanzee fetus
Human adultHuman fetus

© 2014 Pearson Education, Inc.
▪ Another example of heterochrony can be seen in the skeletal structure of bat wings, which resulted from increased growth rates of the finger bones

© 2014 Pearson Education, Inc.
Figure 23.17
Hand andfinger bones

© 2014 Pearson Education, Inc.
▪ Heterochrony can alter the timing of reproductive development relative to the development of nonreproductive organs
▪ In paedomorphosis, the rate of reproductive development accelerates compared with somatic development
▪ The sexually mature species may retain body features that were juvenile structures in an ancestral species

© 2014 Pearson Education, Inc.
Figure 23.18
Gills

© 2014 Pearson Education, Inc.
Changes in Spatial Pattern
▪ Substantial evolutionary change can also result from alterations in genes that control the placement and organization of body parts
▪ Homeotic genes determine such basic features as where wings and legs will develop on a bird or how a flower’s parts are arranged

© 2014 Pearson Education, Inc.
▪ Hox genes are a class of homeotic genes that provide positional information during animal development
▪ If Hox genes are expressed in the wrong location, body parts can be produced in the wrong location
▪ For example, in crustaceans, a swimming appendage can be produced instead of a feeding appendage

© 2014 Pearson Education, Inc.
The Evolution of Development
▪ Adaptive evolution of both new and existing genes may have played a key role in shaping the diversity of life
▪ Developmental genes may have been particularly important in this process

© 2014 Pearson Education, Inc.
Changes in Gene Sequence
▪ New morphological forms likely come from gene duplication events that produce new developmental genes
▪ A possible mechanism for the evolution of six-legged insects from a many-legged crustacean ancestor has been demonstrated in lab experiments
▪ Specific changes in the Ubx gene have been identified that can “turn off” leg development

© 2014 Pearson Education, Inc.
Figure 23.19
Hox gene 6 Hox gene 7 Hox gene 8
About 400 mya
Drosophila Artemia
Ubx

© 2014 Pearson Education, Inc.
Changes in Gene Regulation
▪ Changes in morphology likely result from changes in the regulation of developmental genes rather than changes in the sequence of developmental genes
▪ For example, threespine sticklebacks in lakes have fewer spines than their marine relatives
▪ The gene sequence remains the same, but the regulation of gene expression is different in the two groups of fish

© 2014 Pearson Education, Inc.
Concept 23.4: Evolution is not goal oriented
▪ Evolution is like tinkering—it is a process in which new forms arise by the slight modification of existing forms

© 2014 Pearson Education, Inc.
Evolutionary Novelties
▪ Most novel biological structures evolve in many stages from previously existing structures
▪ Complex eyes have evolved from simple photosensitive cells independently many times
▪ Exaptations are structures that evolve in one context but become co-opted for a different function
▪ Natural selection can only improve a structure in the context of its current utility

© 2014 Pearson Education, Inc.
Figure 23.21
(a) Patch of pigmented cellsPigmented cells(photoreceptors)
Nervefibers
Epithelium
Example: Patella, a limpet
(b) Eyecup
Nerve fibers
Pigmentedcells
Example: Pleurotomaria, aslit shell mollusc
(c) Pinhole camera-type eye
EpitheliumFluid-filledcavity
Opticnerve
Pigmentedlayer (retina)
Example: Nautilus
(d) Eye with primitive lens
Cellularmass(lens)
Cornea
Optic nerve
Example: Murex, a marinesnail
Cornea
Lens
RetinaOpticnerve
(e) Complex camera lens-type eye
Example: Loligo, a squid

© 2014 Pearson Education, Inc.
Evolutionary Trends
▪ Extracting a single evolutionary progression from the fossil record can be misleading
▪ Apparent trends should be examined in a broader context
▪ The species selection model suggests that differential speciation success may determine evolutionary trends
▪ Evolutionary trends do not imply an intrinsic drive toward a particular phenotype