u.s. academic scientific publishing - nsf · u.s. academic scientific publishing ... 1.6 variations...
TRANSCRIPT

U.S. Academic Scientific Publishing Working Paper | SRS 11-201 | November 2010 | by Harold Javitz, SRI International, 333 Ravenswood Ave, Menlo Park, CA 94025; Teresa Grimes, ORC Macro, 7315 Wisconsin Avenue, Suite 400W, Bethesda, MD 20814-3202, Derek Hill, National Science Foundation (NSF), Division of Science Resources Statistics Suite 965, 4201 Wilson Boulevard, Arlington, Virginia 22230, Alan Rapoport (NSF, retired), Robert Bell (NSF), Ron Fecso (formerly NSF, now U.S. Government Accountability Office), and Rolf Lehming (NSF) Disclaimer Working papers are intended to report exploratory results of research and analysis undertaken by
the Division of Science Resources Statistics. Any opinions, findings, conclusions, or
recommendations expressed in this working paper do not necessarily reflect the views of the
National Science Foundation. This working paper has been released to inform interested parties
of ongoing research or activities and to encourage further discussion of the topic.
Contact Derek Hill,
Science and Engineering Indicators Program
703-292-7805
Suggested Citation Javitz H, Grimes T, Hill D, Rapoport A, Bell R, Fecso R, Lehming R. 2010. U.S. Academic
Scientific Publishing. Working paper SRS 11-201. Arlington, VA: National Science Foundation,
Division of Science Resources Statistics.
Contents 1.0 Executive Summary .................................................................................................................. 4
1.1 Introduction ....................................................................................................................... 4 1.2 Research Objectives .......................................................................................................... 4 1.3 Resource Inputs, Institutional Characteristics, and Article Production ............................ 8 1.4 Variation Over Time and Among Kinds of Institutions ................................................. 11 1.5 Relationship Between Changes in Institutional Characteristics and Changes in Article
Production ...................................................................................................................... 13 1.6 Variations in Relationships For Different Fields of Science .......................................... 13 1.7 Study Limitations ............................................................................................................ 15
2.0 Overview of Report Structure ................................................................................................. 18 3.0 Introduction: Study Background, Historical Trends in Article Production, Methods for Counting Publications and Citations, and Attributing Counts to Institutions and Fields ............. 21
3.1 Background ..................................................................................................................... 21 3.2 Counting and Attributing Publications and Citations ..................................................... 22
4.0 Research Approach: Scope, Data Sources, and Analysis Methods ........................................ 25 4.1 Scope of Work ................................................................................................................ 25 4.2 Variables in the Database ................................................................................................ 26 4.3 Statistical Analysis Methods ........................................................................................... 27
5.0 Trends in Publications, Citations, and Resources ................................................................... 29 5.1 Publication and Citation Trends Across All Fields ......................................................... 29 5.2 Publication Trends by Field Groups ............................................................................... 33 5.3 Trends in Resources ........................................................................................................ 37
6.0 Variable Transformations: Inflation Adjustment and Lagging ............................................... 44 7.0 Decomposition of Variability: Between and Within Institution Components ........................ 46 8.0 Key Variables Associated with Institution-Level Publication Counts ................................... 47
8.1 Analyses of Fractional Count Publications in the Expanding Journal Set ...................... 47 8.2 Analyses of Whole Count Publications in the Expanding Journal Set ........................... 50 8.3 Path Analytic Model for Publication Counts .................................................................. 51 8.4 Visual Relationship Among Variables in the Path Model .............................................. 51
9.0 Adequacy of Model Fit: Time Trends in Resource Utilization per Publication Count and Model Fit by Institutional Characteristic ...................................................................................... 58
9.1 Trends in the Ratio of Expected and Observed Publication Counts ............................... 58 9.2 Scatterplot of Expected and Observed Publication Counts by Institution ...................... 62 9.3 Adequacy of Fit to Private R-1 Institutions .................................................................... 62 9.4 Adequacy of Fit for Institutions with Substantial Patenting Activity ............................. 65 9.5 Adequacy of Fit for Institutions with Higher Collaboration Indices .............................. 65 9.6 Adequacy of Fit for Institutions with Higher Relative Citation Indices ......................... 68 9.7 Adequacy of Fit for Fields with Higher NRC Quality Ratings ...................................... 72
10.0 Observed and Expected Publication Trends Within Institutions .......................................... 73 10.1 Scatterplot of Average Annual Changes of Expected and Observed Trends Within
Institutions ...................................................................................................................... 74 10.2 A Model for Both Between and Within Institution Variability .................................... 77 10.3 A Model for Within Institution Variability ................................................................... 79
2
10.4 Scatterplots of Average Annual Percent Change in Expected and Observed Publication Counts Using the HLM Model....................................................................................... 81
11.0 Key Factors Associated with Publication Counts at the Field Group Level ......................... 85 11.1 Analyses of Fractional Count Publications in the Expanding Journal Set .................... 85 11.2 Analyses of Whole Count Publications in the Expanding Journal Set ......................... 86 11.3 Improving Model’s Fit Using Field-Specific Publication Estimates ............................ 88 11.4 Ratio of Observed to Expected Publications Over Time .............................................. 88
Appendix A. U.S. Top 200 R&D Performing Academic Institutions .......................................... 92 Appendix B. Study Methodology ............................................................................................... 111 Appendix C. Variable Descriptions and Database References ................................................... 118 Appendix D. Analysis of Citation Counts .................................................................................. 141 Appendix E. Crosswalk of WebCASPAR and ipIQ Classifications .......................................... 146 Appendix F. Analysis of the Relative Citation Index ................................................................. 152 Appendix G. Analysis of Publication Counts in the Fixed Journal Set ...................................... 157 Appendix H. Regression Output for Section 9 ........................................................................... 161 Appendix I. Regression Output for Section 10 ........................................................................... 173 Appendix J. Regression Output for Section 11 ........................................................................... 183
3
1.0 Executive Summary 1.1 Introduction
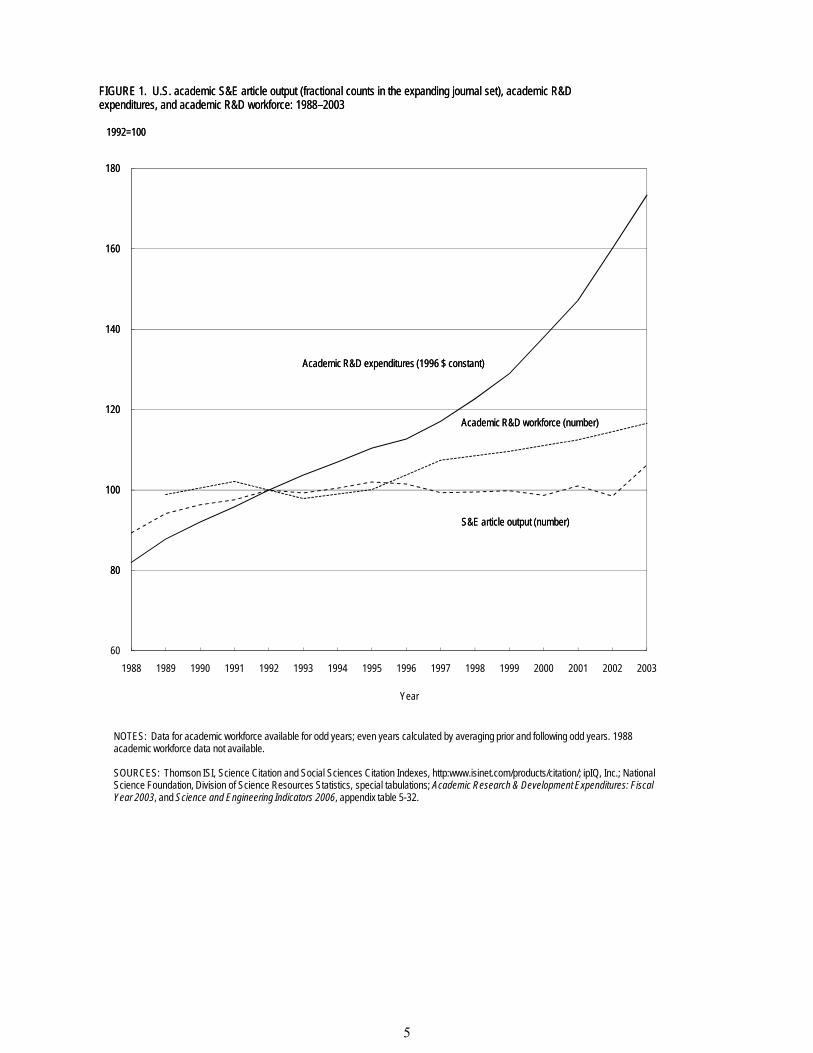
The publication of research results in peer-reviewed scientific journals is a key output of scientific research. In an unexpected development in the early 1990s, the absolute number of science and engineering (S&E) articles published by U.S. based scientists in the world’s major peer reviewed journals plateaued while resource inputs—funds and personnel—kept increasing (figure 1).1
The unprecedented plateau in the number of U.S. S&E articles should not be confused with a decades-long and familiar decline in the U.S. share of the world’s S&E articles. As other states built up their S&E capabilities, the U.S. share of the world’s articles in natural sciences and engineering dropped from 38% in 1973 to 28% in 2003. In an earlier report, “Changing U.S. Output of Scientific Articles: 1988–2003,” NSF described the dimensions of this “plateauing” and compared trends in the United States with those in other countries and regions that are major producers of scientific articles.
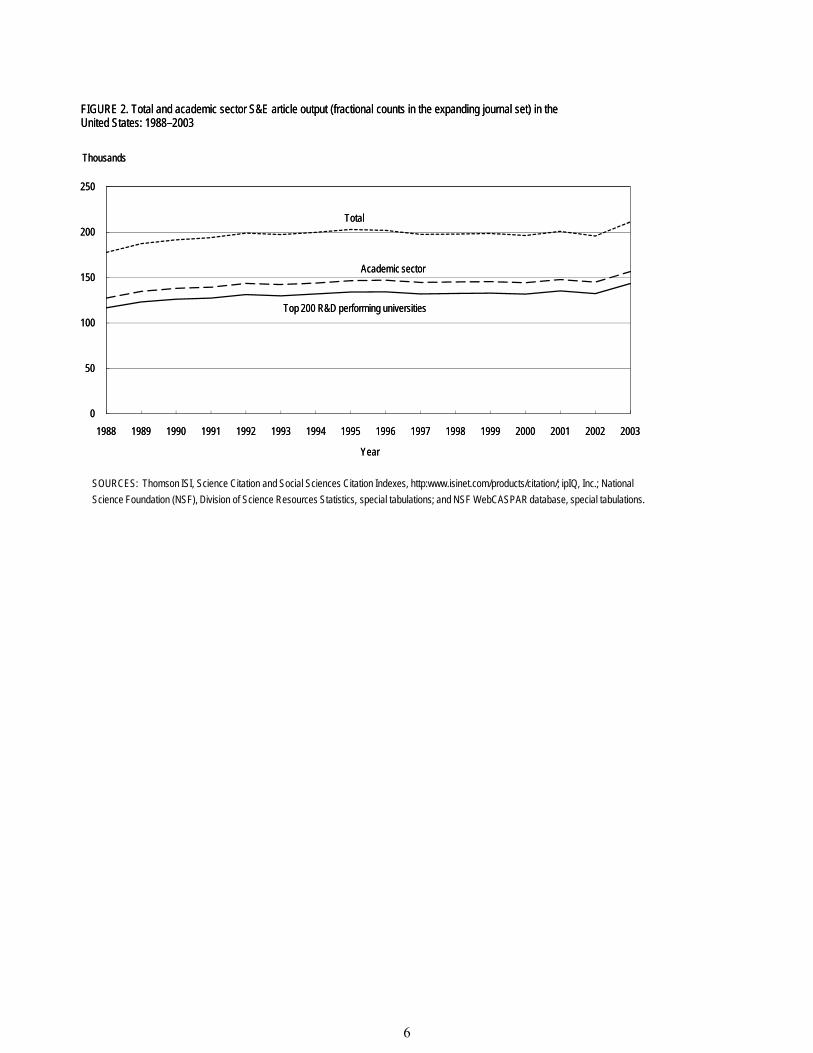
Within the U.S. scientific community, the academic sector is critical to the overall health of the nation’s research system. University-based scientists generate the most publications and, arguably, conduct much of the most important and innovative research (figure 2). In the course of this work, they train generations of new researchers, and they help to attract and retain talented scientists and engineers from around the world.
The implications of trends in article production and citation frequency are open to debate. Although publications and citations are indicators of productivity and influence, they are far from perfect indicators. The trends are worthy of attention because they indicate a marked shift from a historical pattern. Although the data might be taken to suggest that U.S. productivity and influence are declining relative to those of other major research-producing countries and regions, other interpretations are also reasonable.
However, the purpose of the analysis in this report is to examine the patterns and trends in the U.S. university sector in greater depth, not to make a judgment about its interpretation or significance. Specifically, this report addresses scientific publication trends in the top 200 U.S. academic R&D institutions, as measured by their 1988–2001 research expenditures, since these institutions produce most article output from the academic sector (figure 2). Such concentration of publications is not surprising because research is central to the overall mission of the top 200 R&D performing academic institutions. Many of these institutions achieve or aspire to worldwide recognition as research leaders.
1.2 Research Objectives
The present report examines quantifiable relationships among publications, resource inputs and institutional characteristics in the top 200 R&D performing academic institutions. It addresses four principal research questions.
1 During this same period, publication output in the rest of the world increased, but a comparison of U.S. and non-U.S. publication trends is outside the scope of this report.
4
80
100
120
140
160
180
1992=100
FIGURE 1. U.S. academic S&E article output (fractional counts in the expanding journal set), academic R&D expenditures, and academic R&D workforce: 1988–2003
Academic R&D expenditures (1996 $ constant)
Academic R&D workforce (number)
S&E article output (number)
60
80
100
120
140
160
180
1988 1989 1990 1991 1992 1993 1994 1995 1996 1997 1998 1999 2000 2001 2002 2003
1992=100
Year
FIGURE 1. U.S. academic S&E article output (fractional counts in the expanding journal set), academic R&D expenditures, and academic R&D workforce: 1988–2003
Academic R&D expenditures (1996 $ constant)
Academic R&D workforce (number)
S&E article output (number)
NOTES: Data for academic workforce available for odd years; even years calculated by averaging prior and following odd years. 1988 academic workforce data not available.
SOURCES: Thomson ISI, Science Citation and Social Sciences Citation Indexes, http:www.isinet.com/products/citation/; ipIQ, Inc.; National Science Foundation, Division of Science Resources Statistics, special tabulations; Academic Research & Development Expenditures: Fiscal Year 2003, and Science and Engineering Indicators 2006, appendix table 5-32.
5
0
50
100
150
200
250
1988 1989 1990 1991 1992 1993 1994 1995 1996 1997 1998 1999 2000 2001 2002 2003
Thousands
Year
FIGURE 2. Total and academic sector S&E article output (fractional counts in the expanding journal set) in the United States: 1988–2003
Total
Academic sector
Top 200 R&D performing universities
SOURCES: Thomson ISI, Science Citation and Social Sciences Citation Indexes, http:www.isinet.com/products/citation/; ipIQ, Inc.; National Science Foundation (NSF), Division of Science Resources Statistics, special tabulations; and NSF WebCASPAR database, special tabulations.
6
How do various resource inputs (e.g., R&D funding, science and engineering graduate students, Ph.D. recipients, and postdocs) and institutional characteristics (e.g., quality, institutional control, and patenting activity) relate to article production?
How do the relationships among resource inputs, institutional characteristics, and article production vary over time and across different parts of the academic sector?
Within institutions, how do changes over time in these resource inputs and institutional characteristics relate to changes in article production?
How do the variables related to an institution’s article production differ for different fields of science?
In addressing these questions, our fundamental framework is that R&D funds, R&D personnel, and research infrastructure are instrumental in generating publications in S&E fields. In developing this framework, we are limited by the quantified measures that are available in our database. Additional unavailable measures, such as reliable institution-by-institution counts of S&E research faculty,2 would allow for substantially different analyses, especially regarding the association between article production (see Exhibit 1) and particular kinds of resource inputs or individual institutional characteristics.
At the end of this executive summary, we provide a list of limitations that should be borne in mind in interpreting the results of this study.
Exhibit 1. Article Counts
To understand the analyses we report, it is important to know how we count the number of science and engineering (S&E) articles that an institution produces.3
Comparisons over time are best made by examining articles in the population of influential journals.4 The journals in this group change over time as new journals may emerge and attain influence, while a few older journals may decline or cease to exist. The overall direction of change is towards more articles and journals, as the worldwide research community continues to grow. Hence, analyses in this report were primarily conducted using an expanding set of journals covered by the Thomson ISI Science and Social Science Citation Indexes at any given point in time.
However, changes over time in journal coverage can inflate article counts and alter the national or field coverage of the journal set for reasons that have little or nothing to do with scientific influence. To examine whether there were changes that may have occurred for such extraneous reasons, parallel analyses were conducted using a fixed set of those journals that Thomson ISI had indexed throughout the study period.
2 National estimates of S&E academic researchers are based on a sample survey of S&E doctorate holders that cannot reliably be aggregated to produce institutional counts, lacks information about those with non-U.S. degrees, and provides no information about researchers who do not have a Ph.D. A reliable count of total faculty at each institution was available and was used in our analyses, although that measure also had many limitations. 3 S&E fields consist of the life sciences, natural and physical sciences, engineering and technology, mathematics, psychology and social sciences and related fields. 4 All publications and citations data derive from the Science and Social Science Citation Indexes maintained by Thomson ISI, with special tabulations provided to NSF by ipIQ, Inc.
7
Institutional and national patterns of change using data from the fixed and expanding journal sets are very similar.
In this study, credit for publications is assigned to institutions, not to individual authors, using two methods: whole and fractional counting. In whole counting, each institution that appears in the author list receives one credit for an article. In fractional counting, when more than one (institutional) author is involved, credit for the article is divided equally among the listed institutions.
Publications as measured by whole counts are useful indicators of how often an institution is involved in producing articles. Publications as measured by fractional counts are useful in highlighting patterns and trends in the shares of credit attributable to different institutions. While neither method adequately captures the many factors that affect how the research community allocates credit for articles, taken together, they provide different perspectives on recent trends in the production of science and engineering articles in the top 200 R&D performing academic institutions.
1.3 Resource Inputs, Institutional Characteristics, and Article Production
Variations among universities in research resource inputs (for which quantified data are available) largely account for differences in these universities’ publication outputs. The primary measured resource inputs associated with publication counts across institutions are total academic R&D expenditures, the number of S&E postdoctorates, and (to a lesser extent) the number of S&E doctoral recipients (which may serve as a surrogate measure for the number of doctoral candidates available to assist in research). These three resource inputs account for over 90% of the variability in publication outputs, leaving little residual variability to be explained by other potential factors.
Analyses of the four different publication measures, defined by fractional or whole counting and a fixed or expanding journal set, yield very similar results (table 1). Likewise, analyses of the corresponding four different measures of citations yield results that corresponded closely to those of the publication measures. In short, essentially the same explanatory variables turned out to be important for each of these measures.
A difference between institutions of $1M a year in total academic R&D funding is associated with a difference of 4.8 whole count publications in the expanding journal set (table 1). A difference of one postdoctoral student is associated with 1.7 additional publications, and a difference of one S&E doctoral recipient is associated with 1.5 additional publications.5 (Since the number of S&E doctoral recipients is highly correlated with faculty counts, these publications may reflect the efforts of faculty who taught these doctoral recipients).
5 Our model associates an additional $1M in academic R&D expenditures with an additional 2.5 S&E postdoctorates and 1.4 S&E Ph.D. recipients. These additional personnel are associated with 6.2 more whole count publications. Consequently, $1M in additional R&D expenditures results in 11.0 additional whole count publications if combining the direct (+4.8 publications) and indirect effect (+6.2 publications).
8
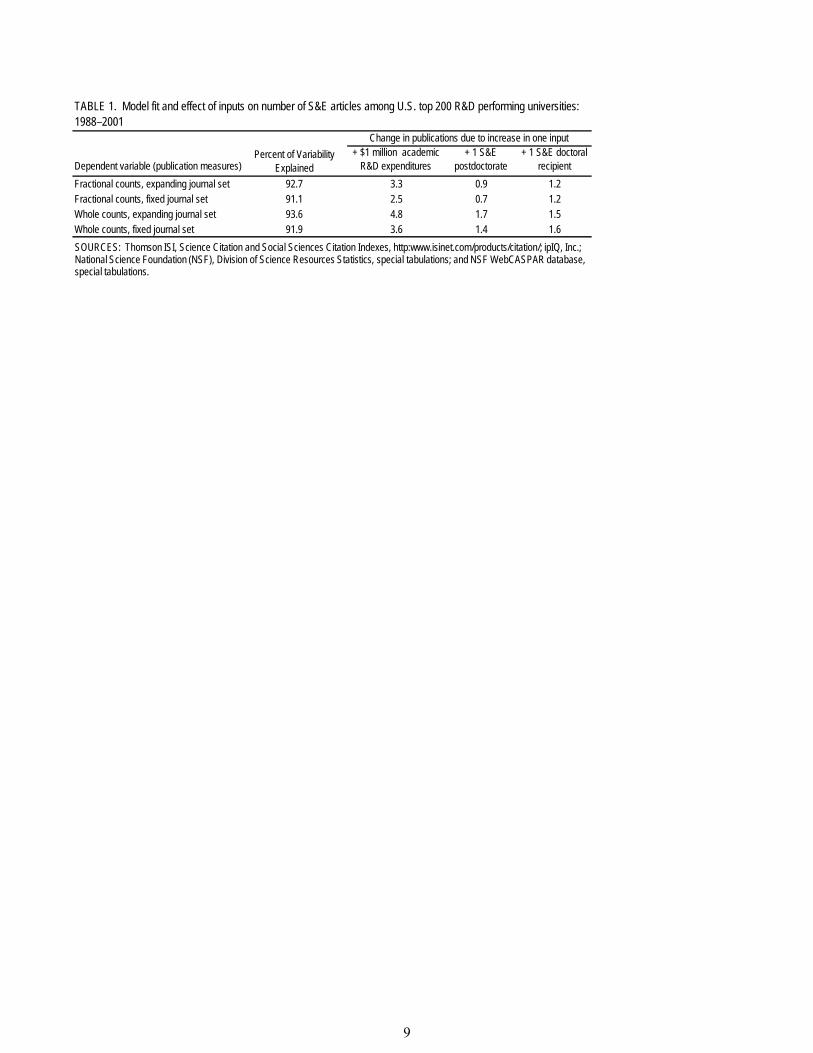
TABLE 1. Model fit and effect of inputs on number of S&E articles among U.S. top 200 R&D performing universities: 1988–2001
Change in publications due to increase in one input
Dependent variable (publication measures)Percent of Variability
Explained+ $1 million academic
R&D expenditures+ 1 S&E
postdoctorate+ 1 S&E doctoral
recipientFractional counts, expanding journal set 92.7 3.3 0.9 1.2Fractional counts, fixed journal set 91.1 2.5 0.7 1.2Whole counts, expanding journal set 93.6 4.8 1.7 1.5Whole counts, fixed journal set 91.9 3.6 1.4 1.6SOURCES: Thomson ISI, Science Citation and Social Sciences Citation Indexes, http:www.isinet.com/products/citation/; ipIQ, Inc.; National Science Foundation (NSF), Division of Science Resources Statistics, special tabulations; and NSF WebCASPAR database,special tabulations.
9
Within the category of total academic R&D expenditures, funds obtained from the federal government and other institutions such as foundations appear to be somewhat more influential than funds from state and local governments or private enterprise.6
Examination of a number of other factors that might influence publication counts failed to markedly improve the results of the analysis:
Faculty counts were not found to be influential in improving the fit of regressions modeling publication or citation outcomes. The reason for this may be the deficiencies in the various measures available.
Accounting for differences in the degree of collaboration among institutions did not substantially affect the results.
Some researchers have suggested that leading private research universities follow research and publication patterns that differ from those found elsewhere in the U.S. university system. However, these institutions behave much like the others with respect to the variables that were examined.
Institutions with relatively more citations to their published articles tend to have slightly more publications than expected on the basis of resource inputs, but the relationship was weak.
Once research funds and personnel are taken into account, higher National Research Council (NRC) quality ratings are not associated with a higher number of publications. This may reflect the presence of many different journals that accept publications at varying quality levels. Higher NRC ratings are strongly correlated with a higher ratio of citations to publications, which may be a measure of the relative influence of publications.
There is no convincing evidence that patents are substituting for publications. In fact, moderate amounts of patenting may be slightly associated with increased publication counts. While the three institutions with the largest amounts of patenting do appear to have reduced publication counts, there are too few institutions to draw a conclusion about the role of patenting in this result.7
These results suggest that once we take into account total academic expenditures, the number of S&E postdoctorates, and the number of S&E doctoral recipients, other factors not captured by these variables do not seem to matter much for article production.8 These intangibles include university prestige, unmeasured infrastructure, and unmeasured student or faculty quality. There are a number of possible explanations for this finding:
Institutional prestige and quality may affect publication output largely by enabling a university to attract S&E postdoctorates and funding necessary to conduct research.
6 Funds from state and local government and industry might support research with a more applied component and a lower expectation of publication. 7 These three include the entire University of California system, which does not report patents for individual campuses, thus further weakening the evidence. 8 But the link between NRC quality ratings and citations relative to publications suggests an additional dimension of quality or influence of publications outputs.
10
Prestige and reputation may enable a university to attract a “better” faculty member (in the sense that a committee of experts in the individual’s area of expertise would conclude that the quality of the individual’s research is superior), without necessarily translating into more publication counts (since there are many different journals that accept publications at varying quality levels).
Finally, university prestige and quality may enable recruitment of “better” faculty who publish more often and are also able to generate more quantified inputs (e.g., successful grant applications that yield R&D funds). Since we have no direct measures of faculty quality, publication counts may instead appear to be linked to things we do measure (e.g., academic R&D, number of S&E doctoral recipients) that may in turn reflect such quality differences.
1.4 Variation Over Time and Among Kinds of Institutions
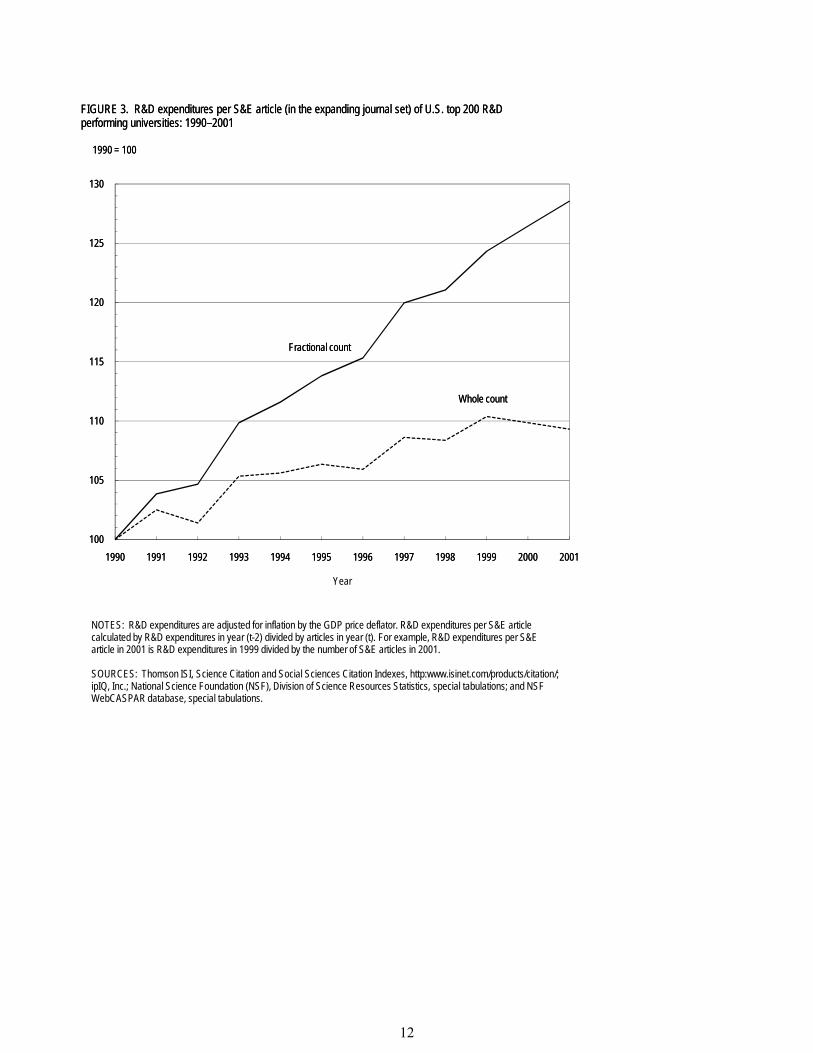
The primary inputs for producing publications, R&D expenditures and personnel, have generally increased faster than the number of publications. For example, the amount of inflation adjusted R&D expenditures per fractional count publication increased by 29% between 1990 and 20019 (figure 3).
This pattern of increasing amounts of inputs required to yield the same publication outputs occurred across the entire U.S. academic system. It did not appear to vary meaningfully across different kinds of institutions, and it cannot be explained by factors specific to certain regions, quality levels, or other segments of the system. Possible reasons for the increasing inputs per article include a rise in complexity of research required for publication; costs for faculty, S&E postdoctorates, S&E doctoral recipients, and research materials and equipment that are increasing faster than the GDP implicit price deflator; increased communication costs for integrative collaborations,10 etc.11
A previous SRS report, “Perceptions of Academic Researchers and Administrators,” considers these and other factors that might bear on changing article output. The report, based on qualitative data from interviews and focus groups, summarizes the views of experienced observers and practitioners in research universities about how the worlds of academic science and engineering research and publication have been changing over the past 15 years.
9 A regression modeling the relationship between the number of fractional count publications (based on inflation adjusted academic R&D funding, number of S&E postdoctorates, and number of S&E doctoral recipients) assuming a constant relationship between resources and publication production will underestimate the observed number of publications produced in 1990 and will overestimate the observed number of publications in 2001. From the amount of under- or overestimation, it can be calculated that the same resources that produced 100 publications in 2001 would have produced 129 publications in 1990. 10 The number of institutional authors per U.S. S&E article increased from 1.78 in 1988 to 2.44 in 2003. During this time period the number of author (person) names per U.S. S&E article increased from 2.98 to 4.42. 11 The increase in resources used per publication does not appear to be related to a change in the proportion of articles appearing in higher quality journals. The NSF study classifies a journal as being among the top 5% in terms of citations in 1992 if the articles that appeared in that journal in 1988 through 1990 had more citations in 1992 than articles published in 95% of other journals that appear in the expanding journal set. For the top 5% cited journals in 1992 NSF has calculated that 61.0% of the articles written in those journals in 1988 through 1990 have U.S. authors. In contrast, the U.S. share of the world's articles in the top 5% cited journals in 2003 decreased to 50.5%. The proportions in 1992 and 2003 are almost identical using the fixed journal set. During these years the U.S. share of all S&E publications decreased from 37.8% to 31.1%. Thus, the U.S. share of both total articles and articles appearing in the most highly cited journals decreased by approximately the same percentage (i.e., 17%–18%).
11
100
105
110
115
120
125
130
1990 1991 1992 1993 1994 1995 1996 1997 1998 1999 2000 2001
1990 = 100
FIGURE 3. R&D expenditures per S&E article (in the expanding journal set) of U.S. top 200 R&D performing universities: 1990–2001
Fractional count
Whole count
Year
100
105
110
115
120
125
130
1990 1991 1992 1993 1994 1995 1996 1997 1998 1999 2000 2001
1990 = 100
FIGURE 3. R&D expenditures per S&E article (in the expanding journal set) of U.S. top 200 R&D performing universities: 1990–2001
Fractional count
Whole count
NOTES: R&D expenditures are adjusted for inflation by the GDP price deflator. R&D expenditures per S&E article calculated by R&D expenditures in year (t-2) divided by articles in year (t). For example, R&D expenditures per S&E article in 2001 is R&D expenditures in 1999 divided by the number of S&E articles in 2001.
SOURCES: Thomson ISI, Science Citation and Social Sciences Citation Indexes, http:www.isinet.com/products/citation/; ipIQ, Inc.; National Science Foundation (NSF), Division of Science Resources Statistics, special tabulations; and NSF WebCASPAR database, special tabulations.
Year
12
1.5 Relationship Between Changes in Institutional Characteristics and Changes in Article Production
Changes over time in resource levels available to a given institution appear to affect publication output by a smaller amount than would have been expected based upon the relationship between publication output and resource inputs across institutions (table 2).
If university A has 10% more academic R&D expenditures, S&E postdoctorates, and S&E doctoral recipients than the average institution, it will have about 9% more whole count and fractional count publications than the average institution.
However, if university A starts with average resources (i.e. average academic R&D expenditures, S&E postdoctorate counts and S&E doctoral recipients) and then these resources are increased by 10%, its publications will increase much less: about 5% (by whole counts) and 2% (by fractional counts).
These smaller than expected increases in publications output may reflect that the three key inputs, academic R&D expenditures, S&E postdoctorates and S&E doctoral recipients, are themselves in part surrogates for other, slower or unchanging university characteristics that in turn are related to publications volume. Alternatively, it may suggest that publications exhibit some degree of inertia to “short term” changes (which may span years).
While the relative level of publications of two or more institutions can be fairly reliably estimated based on the levels of these three inputs, there is considerable uncertainty concerning the change in fractional count publications that results from a change in resources for individual universities. This implies that a substantial portion of year-to-year changes in institutional outputs may be affected by unmeasured variations in inputs.
The analysis was nevertheless able to account for a substantial portion (about two-thirds) of the within-institution variability in publications over time, as measured by whole counts in the expanding journal set. Results suggest that changes in federally financed academic R&D expenditures have almost three times the impact on publications measured in this way as non-federally financed academic R&D expenditures.
In addition, the type of postdoctoral student funded has a differential impact on changes in such publication counts, with S&E postdoctorates without M.D.s increasing publication counts, S&E postdoctorates with M.D.s funded by federal traineeships (which often emphasize clinical training) decreasing publication counts (presumably by redirecting resources from research to non-research oriented activities), and S&E postdoctorates supported by federal research grants having little effect on changes in publication counts.
1.6 Variations in Relationships For Different Fields of Science
The three publication input variables that best explained institutional-level publications output—R&D expenditures, S&E postdoctorates, and Ph.D. recipients—also account for about 90% of the explanatory ability within each of five different fields of science (medical sciences; computer sciences; psychology and social sciences; biology, life and agricultural sciences; and engineering, math and physical sciences, including chemistry, geosciences and astronomy).
13
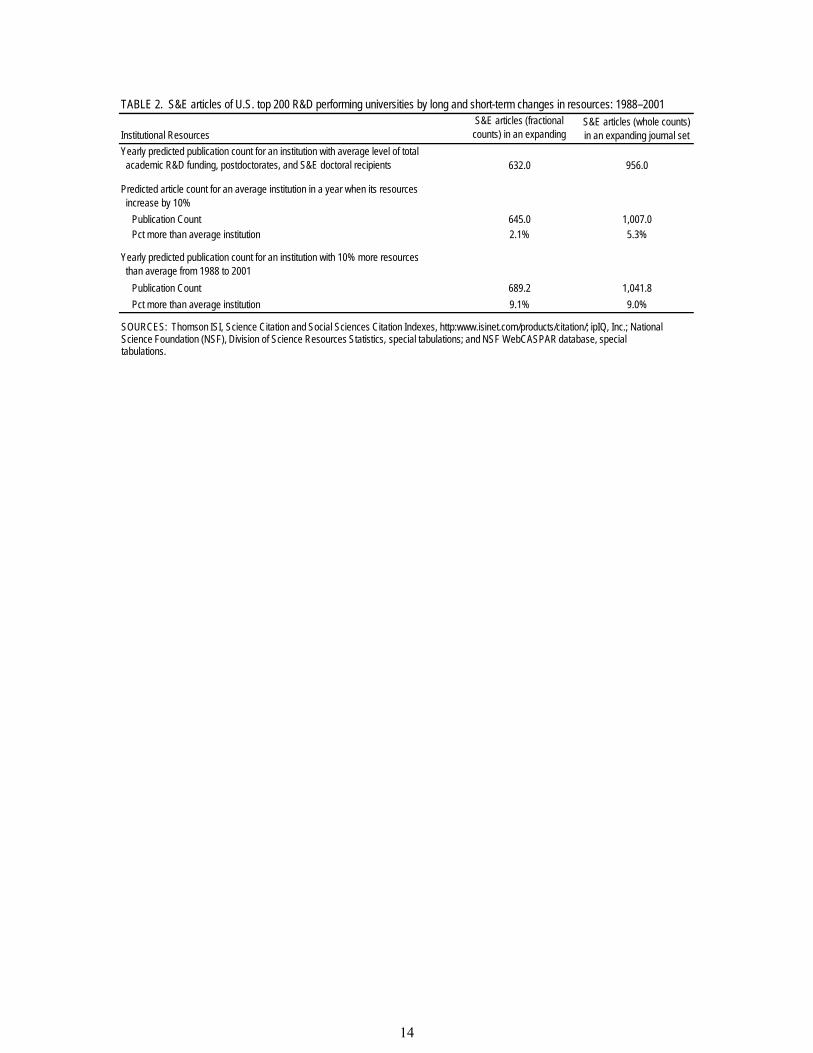
TABLE 2. S&E articles of U.S. top 200 R&D performing universities by long and short-term changes in resources: 1988–2001
Institutional ResourcesS&E articles (fractional
counts) in an expanding S&E articles (whole counts) in an expanding journal set
Yearly predicted publication count for an institution with average level of total academic R&D funding, postdoctorates, and S&E doctoral recipients 632.0 956.0
Predicted article count for an average institution in a year when its resources increase by 10%
Publication Count 645.0 1,007.0Pct more t nstit ionhan average i ut 2.1% 5.3%
Yearly predicted publication count for an institution with 10% more resources than average from 1988 to 2001
Publication Count 689.2 1,041.8Pct more t nstit ionhan average i ut 9.1% 9.0%
SOURCES: Thomson ISI, Science Citation and Social Sciences Citation Indexes, http:www.isinet.com/products/citation/; ipIQ, Inc.; National Science Foundation (NSF), Division of Science Resources Statistics, special tabulations; and NSF WebCASPAR database, special tabulations.
14
A few additional variables slightly improved this model’s fit in the five individual fields of science. Those variables included Carnegie R-1 classification12 (which was associated with increased publication counts), basic research expenditures by institution (which may reflect the orientation of the institution and was associated with increased publication counts), and the number of S&E postdoctorates without M.D. degrees (which may reflect lesser number of publications per S&E postdoctorate with an M.D. degree, with the possible exception of postdoctorates with M.D. degrees who are supported by federal research grants). The precise effects of the explanatory variables differed by field; for example, S&E postdoctorates play a more prominent role in research in some fields than in others and tend to be clustered in some fields.
However, dividing article outputs by field of science, using field-specific input data, and then summing across fields did little to improve this model’s fit. It also does not appear that institutional variations in output are substantially related to gross features of disciplinary concentration.
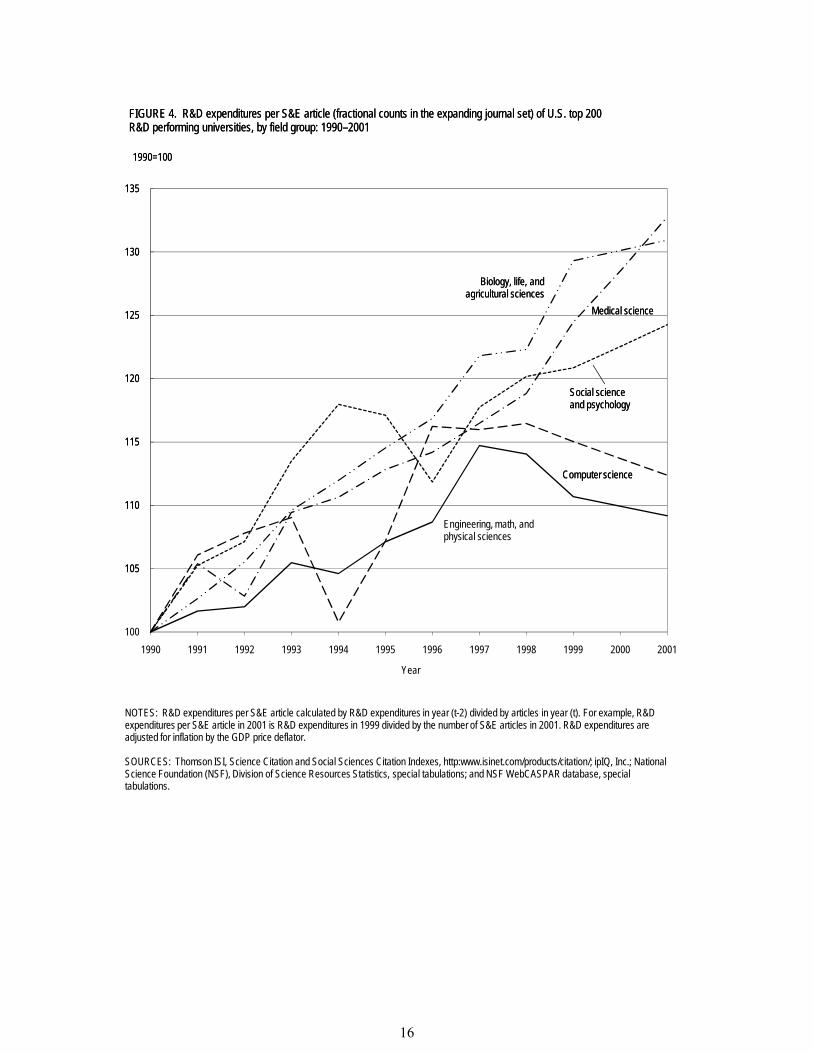
The trends in inflation-adjusted R&D expenditures per publication are not the same across the fields of science (figure 4). Increases in R&D expenditures per publication were greatest for medical sciences and the field consisting of biology, life and agricultural sciences (greater than 30%) and intermediate for the field consisting of psychology and social sciences (24%). R&D expenditures per publication in the field encompassing engineering, math and physical sciences increased 15% from 1990 to 1997 and then reversed itself, resulting in a net increase of 9% from 1990 to 2001. R&D expenditures used per publication in computer sciences followed an erratic pathway, resulting in an increase of 12% over this time period.
1.7 Study Limitations
Results from this study should be interpreted in light of the following limitations:
1. Because the study is observational rather than experimental, any relationships that are observed are associations and do not imply causal links of inputs and observed outputs.13
2. Many of the potential explanatory variables are highly correlated. Therefore, even if one of a collection of potentially explanatory variables were a true cause of publications output, it is difficult to determine which of these variables it is.
3. The classification of resources (personnel and R&D funding) and publications into fields may result in some inconsistencies, since different sources of data classify resources and publications into fields using different schema and criteria. In some instances, the personnel, funding, and publication counts associated with a particular article might be allocated to different fields.
12 Based on the 1994 Carnegie Classification of Institutions, these universities have a full range of baccalaureate programs and a commitment to graduate education through the doctorate, and they award at least 50 doctoral degrees a year and annually receive $40 million or more in Federal research funding. 13 For example, suppose that there is an unmeasured underlying factor that causes a university to be both effective in generating publications and obtaining academic R&D funding. In this case, the academic R&D funding itself does not cause the publications to increase, and an experiment that doubles R&D funding without changing this underlying factor might be relatively unsuccessful in increasing publications.
15
105
110
115
120
125
130
135
1990=100
FIGURE 4. R&D expenditures per S&E article (fractional counts in the expanding journal set) of U.S. top 200 R&D performing universities, by field group: 1990–2001
Computer science
Social science and psychology
Biology, life, and agricultural sciences
Medical science
Engineering, math, and physical sciences
100
105
110
115
120
125
130
135
1990 1991 1992 1993 1994 1995 1996 1997 1998 1999 2000 2001
1990=100
Year
FIGURE 4. R&D expenditures per S&E article (fractional counts in the expanding journal set) of U.S. top 200 R&D performing universities, by field group: 1990–2001
NOTES: R&D expenditures per S&E article calculated by R&D expenditures in year (t-2) divided by articles in year (t). For example, R&D expenditures per S&E article in 2001 is R&D expenditures in 1999 divided by the number of S&E articles in 2001. R&D expenditures are adjusted for inflation by the GDP price deflator.
SOURCES: Thomson ISI, Science Citation and Social Sciences Citation Indexes, http:www.isinet.com/products/citation/; ipIQ, Inc.; National Science Foundation (NSF), Division of Science Resources Statistics, special tabulations; and NSF WebCASPAR database, special tabulations.
Computer science
Social science and psychology
Biology, life, and agricultural sciences
Medical science
Engineering, math, and physical sciences
16
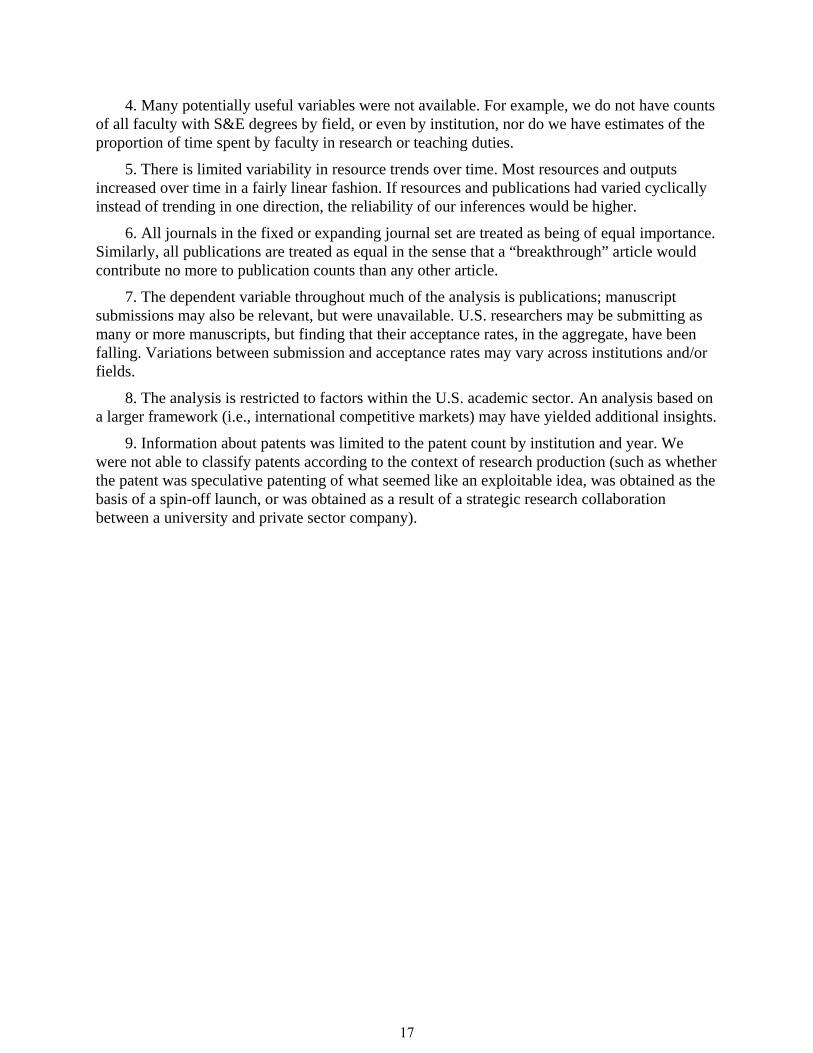
4. Many potentially useful variables were not available. For example, we do not have counts of all faculty with S&E degrees by field, or even by institution, nor do we have estimates of the proportion of time spent by faculty in research or teaching duties.
5. There is limited variability in resource trends over time. Most resources and outputs increased over time in a fairly linear fashion. If resources and publications had varied cyclically instead of trending in one direction, the reliability of our inferences would be higher.
6. All journals in the fixed or expanding journal set are treated as being of equal importance. Similarly, all publications are treated as equal in the sense that a “breakthrough” article would contribute no more to publication counts than any other article.
7. The dependent variable throughout much of the analysis is publications; manuscript submissions may also be relevant, but were unavailable. U.S. researchers may be submitting as many or more manuscripts, but finding that their acceptance rates, in the aggregate, have been falling. Variations between submission and acceptance rates may vary across institutions and/or fields.
8. The analysis is restricted to factors within the U.S. academic sector. An analysis based on a larger framework (i.e., international competitive markets) may have yielded additional insights.
9. Information about patents was limited to the patent count by institution and year. We were not able to classify patents according to the context of research production (such as whether the patent was speculative patenting of what seemed like an exploitable idea, was obtained as the basis of a spin-off launch, or was obtained as a result of a strategic research collaboration between a university and private sector company).
17
2.0 Overview of Report Structure This section provides an overview of the report structure.
The remaining sections of this report, their contents and interrelationships, are described below:
3.0 Introduction: Study Background, Historical Trends in Article Production, Methods for Counting Publications and Citations, and Attributing Counts to Institutions and Fields – presents a brief discussion of the importance and limitations of publication data as a measure of scientific research, and the concern over an apparent change in the growth trend of publications that occurred in the early 1990s. To better quantify and understand possible reasons for this change, this study examines how trends vary in various academic fields and how institutional characteristics may influence article production. The section explains that analyses were conducted using data on the top 200 U.S. academic institutions with the largest R&D expenditures from 1988 to 2001. A listing of those institutions can be found in appendix A. The section contains background information on different methods for counting and attributing publications and citations, and mapping those counts to fields.
4.0 Research Approach: Scope, Data Sources, and Analysis Methods – provides an overview of the scope of work, a brief description of the types of variables that were included in the database, and a general description of analysis methods. Appendices provide important supplemental information to this section. Appendix B contains a more detailed description of the study’s methodology. Appendix C contains detailed information about the variables in the database.
5.0 Trends in Publications, Citations, and Resources – provides graphical displays of trends in publications, citations, and resources of the top 200 R&D performing academic institutions, displayed at both the institution and field levels.
6.0 Variable Transformations: Inflation Adjustment and Lagging – describes transformations of variables used in the regression analyses, including deflation to constant dollars and lagging (to account for the time between funds receipt, conduct of research, publication of research finding, and citations to those publications).
7.0 Decomposition of Variability: Between and Within Institution Components – discusses the finding that almost all of the variability in publication and citation counts and in resources used for research occurs between institutions rather than across years within institutions.
8.0 Key Factors Associated with Institution-Level Publication Counts – presents models developed for fractional and whole publication counts in the expanding journal set at the institution-year level. From among the many variables considered for these models, three independent variables were retained: total academic R&D expenditures, postdoctoral researchers, and Ph.D. recipients. In addition to the regression model coefficients, the relationships of these independent variables to publication counts are presented graphically. A path analytic model is also developed to fit the total effects on publications of varying academic R&D expenditures. The analyses in this section are
18
restricted to publication counts in an expanding data set. Appendix D contains a parallel analysis for citation counts. Appendix F contains a parallel analysis for the relative citation index (i.e., the number of citations per publication) and appendix G for fractional and whole publication counts in the fixed journal set.
9.0 Adequacy of Model Fit: Time Trends in Resource Utilization Per Publication Count and Model Fit by Institutional Characteristics – examines whether the adequacy of the model fit varies as a function of time or institutional characteristics (i.e., Carnegie classification, public/private control, patenting activity, amount of collaboration in publications, and NRC quality ratings). Although no institutional characteristic was found to affect the fit, there was a clear linear trend in the ratio of expected to observed publication counts, indicating that for a given amount of resources the number of fractional and whole publication counts produced diminished steadily over time.
10.0 Observed and Expected Publication Trends Within Institutions – presents a refinement to the models of section 8.0 (which primarily modeled the association of average resources in the period from 1988 to 2001 to differences in publication counts between institutions) to allow examination of the effect of changes in resources on changes in publication counts within institutions. Differences in average resources available to two different institutions (e.g., one institution with academic R&D expenditures of $100M and another with $110M) were associated with larger differences in publications than would be expected if resources within a particular institution varied by the same amount (i.e., $10M). Within-institution effects are sensitive to the type of funding and type of S&E postdoctorates, with changes in federally financed R&D funding having a larger effect within institutions than changes in non-federally financed academic R&D expenditures.
11.0 Key Factors Associated with Publication Counts at the Field Group Level – presents models of fractional and whole count publications in the expanding journal set at the level of five field groups (i.e., biology, life and agricultural sciences; computer sciences; engineering, math, and physical sciences; medical sciences; and social sciences and psychology), paralleling the analyses in section 8.
Appendix A. U.S. Top 200 R&D Performing Academic Institutions – provides information on the top 200 R&D performing academic institutions (as determined by annual average R&D expenditures from 1988 to 2001), including the campuses and branches considered to constitute each institution.
Appendix B. Study Methodology – presents information about the conduct of the study, including critical issues that were addressed early in the study, steps in database construction, and the analysis approach.
Appendix C. Variable Descriptions and Database References – provides detailed definitions of the variables contained in the database and references to the data sources.
Appendix D. Analysis of Citation Counts – presents a model of fractional and whole count citations in the expanding journal set that parallels the analysis in section 8.
Appendix E. Crosswalk of WebCASPAR and ipIQ Classifications – presents a listing of WebCASPAR field definitions and corresponding ipIQ field definitions.
19

Appendix F. Analysis of the Relative Citation Index – presents a model of the relative citation index (i.e., the ratio of citations to publication counts in the expanding journal set) that parallels the analysis in section 8.
Appendix G. Analysis of Publication Counts in the Fixed Journal Set – presents a model of fractional and whole publication counts in the fixed journal set that parallels the analysis in section 8.
Appendix H. Regression Output for Section 9 – presents the output for the regression analyses referenced in section 9.
Appendix I. Regression Output for Section 10 – presents the output for the regression analyses referenced in section 10.
Appendix J. Regression Output for Section 11 – presents the output for the regression analyses referenced in section 11.
20

3.0 Introduction: Study Background, Historical Trends in Article Production, Methods for Counting Publications and Citations, and Attributing Counts to Institutions and Fields
This section presents the background to this study and the different ways for counting and attributing publications and citations.
Section 3.1 discusses the study background. Scientific publications and citations have been used increasingly to measure research output and the academic sector is an important generator of most U.S. publications. However, the long-term growth trend of U.S. academic scientific journal articles stalled in the 1990s. This study was undertaken to prepare a unified database on academic institutions and their publications to examine possible relationships between changes in university resources and characteristics and changes in publication trends.
Section 3.2 discusses technical issues in the analyses of publications and citations. Topics include different methods for counting and attributing publications and citations, similarities and differences between the fixed and expanding journal sets, the meaning of “institutional” authorship, the definitions of whole and fractional counting, how citations are counted and why citations may reflect more than the quality of the cited article, and why analyses on publication counts and citation counts yield very similar results. In addition this section discusses the definition of aggregated groups of scientific fields (called field groups) used in various analyses to examine the uniformity of trends across fields, and the process used for (and possible misalignment that might result from) the mapping of journals into fields to allow for analysis at the field level.
3.1 Background
Scientists and engineers often publish their research results in peer-reviewed journal articles. The number of these articles is an indicator, admittedly imperfect, of research output. Citations to these articles are an indicator, likewise imperfect, of how influential the cited article is. In recent years, international use of these and related indicators has become widespread, as countries seek to assess their relative performance in science and engineering research.
Within the U.S. scientific community, the academic sector is critical to the overall health of the nation’s research system. University-based scientists generate the most publications and, arguably, conduct much of the most important and innovative research. Developments in this sector are especially important to the overall health of a nation’s research system, and they affect the nation’s ability to attract and retain talented researchers from other countries. Specifically, this report addresses scientific publication trends in the top 200 R&D performing U.S. academic institutions, as measured by their 1988–2001 research and development (R&D) expenditures, since these institutions produce most output from the academic sector (figure 2). Such concentration of publications is not surprising because research is central to the overall mission of the top 200 R&D performing academic institutions. Many of these institutions achieve or aspire to worldwide recognition as research leaders.
There is evidence to suggest that the long-term growth trend in the output of scientific and technical journal articles by United States academic researchers may have changed in the early 1990s, both in the academic community as a whole and in the top 200 R&D performing
21
academic institutions. Depending on the indicator of publication output used, the evidence suggests that the growth trend either slowed or stopped altogether at that time.
The present report is part of a series prepared by or on behalf of the Division of Science Resources Statistics (SRS). The first of those reports, “Changing U.S. Output of Scientific Articles: 1988–2003,” presents descriptive data on patterns and trends in article production and citations in the 15 years beginning in 1988. The second of those reports, “Perceptions of Academic Researchers and Administrators,” is based on qualitative data from interviews and focus groups and summarizes the views of experienced observers and practitioners in research universities about how the worlds of academic science and engineering research and publication have been changing over the past 15 years. Building on these earlier publications, the present report analyzes quantitative data on research inputs and outputs during the period from 1988 through 2001 in the U.S. academic sector to explore possible explanations for the various observed patterns and trends.
As part of the present study, SRS contracted with SRI International to examine how trends vary in various parts of the U.S. academic research system and how institutional characteristics may influence article production. To do so, SRI and its subcontractor, the ORC Macro Division of Macro International (ORC Macro), prepared a unified database on academic institutions that perform and publish research and analyzed this database to examine and characterize trends and potential explanatory variables. Data on publications was prepared by ipIQ, Inc. (formerly CHI Research, Inc.), using data from the Thomson ISI Science Citation Index (SCI) and Social Sciences Citation Index (SSCI).
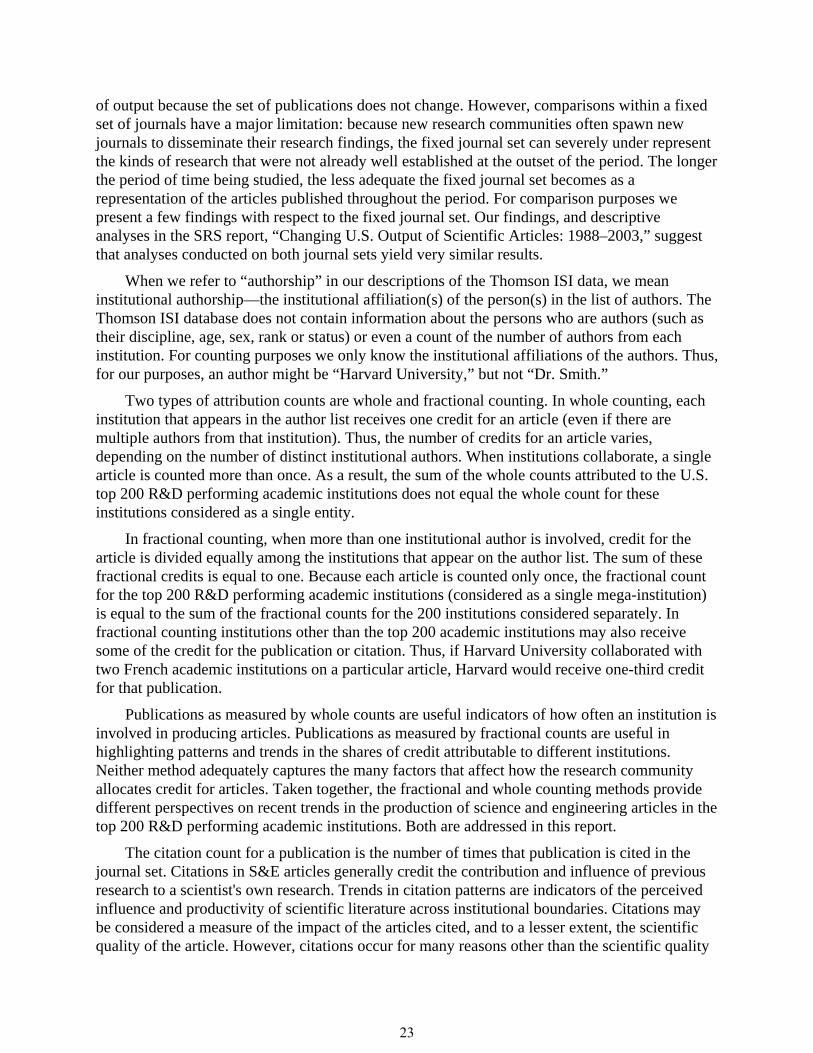
3.2 Counting and Attributing Publications and Citations
In this report, we present counts of scientific and engineering articles, notes, and reviews published in scientific and technical journals tracked and indexed in the Thomson ISI SCI and SSCI. Counts exclude all letters to the editor, news pieces, editorials, conference proceedings and other content whose central purpose is not presentation or discussion of scientific data, theory, methods, apparatus, or experiments.
Arguably, comparisons over time are best made by examining articles in the population of influential journals. The journals in this group change over time. New journals may emerge and attain influence, while a few older journals may decline or cease to exist. As the worldwide research community grows, the net direction of change is towards more articles and journals in the Thomson ISI database (from 4,460 journals in 1988 to 5,653 in 2001). At any given time, the expanding set of journals tracked by Thomson ISI is the most suitable indicator of the mix of journals and articles. Patterns of authorship and citation in this set reflect the fields, nations, and institutions in which high-quality research is being produced. In this report the analyses are primarily conducted using the expanding journal set. However, changes over time in journal coverage can inflate article counts and alter the national or field coverage of the journal set for reasons that have little or nothing to do with influence (for example ISI’s decisions concerning depth of coverage in different fields or languages).
To control for changes in ISI journal coverage that may have occurred for these extraneous reasons, we also performed analyses on a fixed set of journals that ISI indexed throughout the period we studied. Changes over time in publication outputs within that set are likely to reflect real output changes rather than yearly variations in the depth of ISI coverage of different sources
22
of output because the set of publications does not change. However, comparisons within a fixed set of journals have a major limitation: because new research communities often spawn new journals to disseminate their research findings, the fixed journal set can severely under represent the kinds of research that were not already well established at the outset of the period. The longer the period of time being studied, the less adequate the fixed journal set becomes as a representation of the articles published throughout the period. For comparison purposes we present a few findings with respect to the fixed journal set. Our findings, and descriptive analyses in the SRS report, “Changing U.S. Output of Scientific Articles: 1988–2003,” suggest that analyses conducted on both journal sets yield very similar results.
When we refer to “authorship” in our descriptions of the Thomson ISI data, we mean institutional authorship—the institutional affiliation(s) of the person(s) in the list of authors. The Thomson ISI database does not contain information about the persons who are authors (such as their discipline, age, sex, rank or status) or even a count of the number of authors from each institution. For counting purposes we only know the institutional affiliations of the authors. Thus, for our purposes, an author might be “Harvard University,” but not “Dr. Smith.”
Two types of attribution counts are whole and fractional counting. In whole counting, each institution that appears in the author list receives one credit for an article (even if there are multiple authors from that institution). Thus, the number of credits for an article varies, depending on the number of distinct institutional authors. When institutions collaborate, a single article is counted more than once. As a result, the sum of the whole counts attributed to the U.S. top 200 R&D performing academic institutions does not equal the whole count for these institutions considered as a single entity.
In fractional counting, when more than one institutional author is involved, credit for the article is divided equally among the institutions that appear on the author list. The sum of these fractional credits is equal to one. Because each article is counted only once, the fractional count for the top 200 R&D performing academic institutions (considered as a single mega-institution) is equal to the sum of the fractional counts for the 200 institutions considered separately. In fractional counting institutions other than the top 200 academic institutions may also receive some of the credit for the publication or citation. Thus, if Harvard University collaborated with two French academic institutions on a particular article, Harvard would receive one-third credit for that publication.
Publications as measured by whole counts are useful indicators of how often an institution is involved in producing articles. Publications as measured by fractional counts are useful in highlighting patterns and trends in the shares of credit attributable to different institutions. Neither method adequately captures the many factors that affect how the research community allocates credit for articles. Taken together, the fractional and whole counting methods provide different perspectives on recent trends in the production of science and engineering articles in the top 200 R&D performing academic institutions. Both are addressed in this report.
The citation count for a publication is the number of times that publication is cited in the journal set. Citations in S&E articles generally credit the contribution and influence of previous research to a scientist's own research. Trends in citation patterns are indicators of the perceived influence and productivity of scientific literature across institutional boundaries. Citations may be considered a measure of the impact of the articles cited, and to a lesser extent, the scientific quality of the article. However, citations occur for many reasons other than the scientific quality
23
of the article. Authors tend to cite their own work, work produced by their own scientific community, authors who are currently in vogue or generally considered to be eminent in their field, the inventors of a useful (but not necessarily high quality) experimental technique or methodology, research that is being refuted, etc. The increased use of electronic databases may exclude citation of older and/or original sources not covered by the databases. Nevertheless, more frequently cited articles are arguably more influential.
For purposes of comparing inputs and outputs, analyses of citation counts are more problematic than analyses of publication counts. While publication counts are directly related to personnel and financial inputs; citation counts are one further step removed and can only occur after the publication appears in the literature. Partially for this reason, citation counts are highly correlated with publication counts, and analysis of citation counts yields essentially identical results to analysis of publication counts. For these reasons, in the body of this paper we concentrate on analyzing input/output relationships for publications. Some parallel analyses of citation counts are presented in appendix D.
In this report, some of the analyses have been implemented for aggregated groups of scientific fields, which we call field groups. The field groups are biology, life and agricultural sciences; computer sciences; medical sciences; engineering, math, and physical sciences; and psychology and social sciences. Field groups consist of individual or aggregated WebCASPAR fields, the NSF classification system used for the various input variables.14
Publication data are mapped from the original ipIQ field classification to WebCASPAR fields (and therefore to field groups) to allow field analysis of input variables and publication output measures. (For a crosswalk between WebCASPAR and ipIQ fields, see appendix E.) WebCASPAR field classification has the advantage of corresponding closely to how most universities organize their research by scientific field. The ipIQ field classification of publications is based on the journal in which they appear. Journals are classified into 134 fine fields using the patterns of the journal’s citations. Each journal is assigned to one fine field, including general journals like Science and Nature. The latter types of journals are assigned to a “general fine field” such as “general biomedical research.” Citations are attributed to the science field to which the publication being cited was allocated.
The allocation of journals to single scientific fields can result in some misalignment of publications and resources. For example, if a collaboration between a statistician in one university and physician in another is published in a medical journal, the credit for that article will accrue to the medical field in the statistician’s university while the personnel and expenditures associated with that article are accrued in the field containing the statistics department. In addition, some misalignment can occur because the different sources of data on personnel, expenditures, and publication and citation counts did not use the same systems for classifying resources and outputs into fields. Although we believe that our efforts to reclassify resources and outputs into a common set of WebCASPAR fields were generally successful, there may have been occasions when the totals by field would have been slightly different had the original data sources used the WebCASPAR system.
14 WebCASPAR is a NSF database of academic science and engineering resources for individual fields of S&E at individual academic institutions. Information on WebCASPAR is available at http://webcaspar.nsf.gov/.
24
4.0 Research Approach: Scope, Data Sources, and Analysis Methods
This section provides an overview of the scope of work, the variables that were included in the database, and analysis methods.
Section 4.1 discusses the two major research efforts in this study: 1) to construct a database on U.S. academic institutions, and 2) to develop models that address the institutional characteristics related to article production, how changes over time in these characteristics relate to changes in article production, and how variables related to article production differ among fields of science.
Section 4.2 discusses the categories of variables contained in the database that was constructed for this study. Specific information about the variable definitions and the methods used to construct the database is contained in the appendices.
Section 4.3 contains a description of the primary analysis methods used for this study.
4.1 Scope of Work
The scope of work for this effort encompassed two major research tasks. In the first, a database on U.S. academic institutions was constructed. This database, called the Publication Trends database, included available information on numerous variables, including publications, citations, patents, research and development (R&D) funding, research-related personnel, institutional and departmental quality, and, where available, academic fields associated with these various measures; the database variables are described in greater detail later in this chapter and in appendix C. Field breakdowns were specified that are consistent with SRS fine field taxonomies, and that allow analyses either by individual field of science or larger aggregations. To the maximum extent possible, the relevant variables, including field of science and institutional names/boundaries, drawn from different databases were measured consistently in the newly constructed database. A codebook that thoroughly documents the database was developed. The database was delivered to SRS to allow SRS analysts to conduct further examination and analysis.
After the construction of the database, SRI consulted with SRS subject matter experts and statisticians and performed regression and other multivariate analyses to develop models from the newly constructed database to address the following research questions:
How do various institutional characteristics (e.g., NRC quality ratings, R&D funding, institutional control, availability of science and engineering graduate students and Ph.D.s, and patenting activity) relate to article production and changes over time in those characteristics (measured in the range of ways possible in the database)?
How do the variables related to an institution’s article production differ for different fields of science?
This report discusses the database development process and documents the analyses that were performed and the results of those analyses.
25
4.2 Variables in the Database
Brief descriptions of the variables in the Publication Trends database are presented below. For more details about these variables and source references, see appendices A, B, and C.
Federal Interagency Committee on Education (FICE) codes— The FICE code is an institutional identifier used to collect data by the NSF Survey of Research and Development Expenditures at Colleges and Universities. Each institutional group was identified using the FICE code for the parent institution (which was called the PFICE code) and the parent’s institutional name. The database contains information on the top 200 institutional groups. In the remainder of this report we refer to the institutional groups as the top 200 R&D performing academic institutions. FICE codes are used to distinguish one institution from another for analytical purposes.
Field codes—A standardized code for science and engineering academic disciplines as defined in the NSF WebCASPAR system. Appendix E lists the WebCASPAR fields.
Publications and Citation Counts—The two types of outcome (dependent) variables are: 1) annual article counts and 2) annual citation counts (i.e., the number of times that the article has been cited in the given year). Each of these outcome variables can be measured in 4 ways: 1) with whole counts and the fixed journal set, 2) with whole counts and the expanding journal set, 3) with fractional counts and the fixed journal set, and 4) with fractional counts and the expanding journal set. This yields eight different variables represented in the database.
Patents—Number of patents granted by year and associated with an institution (from the U.S. Patent Office database, http://www.uspto.gov/web/offices/cio/cis/prodsvc.htm).
R&D Funding—Amount of annual R&D funding received by an institution, disaggregated by source (from the NSF Survey of Research and Development Expenditures, 1988 to 2001, available in the WebCASPAR system of the SRS web site).
Quality Measures—Departmental quality as measured in the National Research Council’s Assessment of Research-Doctorate Programs (1993).
Graduate Students and Postdoctorates—Annual number of graduate students and postdoctorate appointees in science and engineering (S&E) at an institution, as reported in the NSF-NIH Survey of Graduate Students and Postdoctorates in Science and Engineering (1988–2001).
Doctoral Recipients—Annual number of doctoral recipients in S&E at the institutional and departmental levels, as reported in the Survey of Earned Doctorates (SED) between 1988 and 2001. Departmental affiliation was obtained from the 3 digit SED/Doctorate Records File (DRF) specialty code.
Degree Data—Annual number of degrees granted at the undergraduate, master’s and Ph.D. levels by institution and by department, as reported in the NCES Integrated Postsecondary Educational Data System (IPEDS) Completions Survey (1988–2001).
Institutional Type and Control—The 1994 Carnegie classification and institutional control (public versus private).
26
General Financial—General financial data at the institutional level regarding reliance on Federal, state, and tuition income and spending for education, research, and other functions, as reported in the NCES IPEDS Finance Survey (1988–1996). Significant changes occurred in this data after 1996, rendering the data before and after 1996 incomparable. Since the changes in publication trends that NSF was most interested in started at around 1996, these data were not used in the analysis.
Faculty Counts—Annual number of faculty at the institutional level, including breakdowns by faculty rank, as reported in the NCES IPEDS Salaries, Tenure and Fringe Benefits of Full-time Instructional Faculty Survey (1988–1997, 1999).
Number of S&E Ph.D.s employed—Although information on the annual number of S&E Ph.D.s holding U.S. doctorates employed at each institution was obtained from the NSF Survey of Doctorate Recipients, and was included in the database, due to limitations of the data (see appendix B), these data were not used in the analyses.
Non-Faculty Doctoral Research Staff—Annual number of non-faculty staff with doctorates at the departmental level by presence or absence of M.D. degree, as reported in the NSF-NIH Survey of Graduate Student and Postdoctorates in Science and Engineering (1988–2001).
4.3 Statistical Analysis Methods
Most of the analyses in this study were conducted using linear regression where the dependent (outcome) variable was a publication or citation count, and the independent (explanatory) variables were personnel counts (e.g., faculty by rank, S&E postdoctorates, and S&E Ph.D. recipients), R&D expenditures, or university characteristics (such as Carnegie classification, number of patents approved, etc.). R&D expenditures were deflated using the GDP implicit price deflator. All independent variables were lagged to reflect the average time between research and publication and between publication and subsequent citation (as determined by varying lags and maximizing the correlations between lagged variables). Most analyses were conducted at the institution-year level, or the field group-year level. Because the independent variables were highly correlated, stepwise linear regression analysis was employed. In addition to statistical significance, we typically also imposed the requirement that variables added into the model increase the proportion of explained variance (i.e., r-square) by at least .01.
Because the data on institutions were longitudinal, it was important to examine whether statistical significance levels obtained via linear regression were accurate. We repeated some important analyses using Hierarchical Linear Modeling (HLM), which accommodates the clustering that occurs in longitudinal data, and found that all coefficients that were added to the model with linear regression were also statistically significant with HLM.
Publication counts could be modeled using three primary variables: academic R&D expenditures, the number of S&E postdoctorates, and the number of S&E Ph.D. recipients. However, these three explanatory variables are not independent. We postulated that increases in academic R&D expenditures would affect publication counts both directly and indirectly through the hiring of additional S&E postdoctorates and support for S&E Ph.D. recipients. To estimate the full effect of academic R&D expenditures on publication counts, we used path analytic modeling. Linear regression was used to estimate the number of additional S&E postdoctorates and S&E Ph.D. recipients that would result from an increase in academic R&D expenditures.
27
The total effect of increased academic R&D expenditures on publication counts could then be estimated as the sum of the direct effects and indirect effects (via additional S&E postdoctorates and Ph.D. recipients).
Factor analysis was used to examine the relationships among the various publication and citation counts. We found that these counts were very highly correlated, and a single factor (which was approximately an average of normalized versions of these counts) accounted for almost all of their variability. This factor (the first principal component) was used in many of our preliminary analyses. However, we have chosen not to use the first principal component as the dependent variable in our regressions. Rather, to make the analysis more easily interpretable, the dependent variable in each regression is a specific type of fractional or whole publication count (for example, fractional publication counts in the expanding journal set).
28
5.0 Trends in Publications, Citations, and Resources This section describes trends in publications, citations, and resources (personnel and
funding) of the top 200 R&D performing academic institutions from 1988 to 2001.
Section 5.1 discusses trends in publications and citations at the institution level. Graphs are presented which show the publication counts for the top 200 R&D performing academic institutions by year using both fractional and whole counting in both the fixed and expanding journal set. Depending on which measure of publications is used, the trend in publications since the mid 1990s is either flat or declining. The gap between fractional and whole counts has widened reflecting increased collaboration. Other graphs are presented that show trends in citation counts (which demonstrate similar trends to those in publications) and the ratio of citations to publications (which is generally rising, although this may be due to factors other than increased influence).
Section 5.2 discusses publication trends across years for various field groups. For three of these groups (engineering, math and physical sciences; medical sciences; and biology, life and agricultural sciences) the trends are reasonably consistent; for the social sciences and psychology group the trend is similar in the early and later years, but more erratic in the intermediate years.
Section 5.3 discusses changes from 1988 to 2001 in the primary personnel and monetary resources for publications (i.e., faculty, non-faculty doctoral research staff, postdoctoral researchers, S&E Ph.D. recipients, and total academic R&D expenditures), and compares those trends to those in publication counts. Three of these resources (total academic R&D expenditures, the number of postdoctoral researchers and the number of non-faculty doctoral research staff) increase much more rapidly than publication counts. S&E Ph.D. recipients increase at approximately the same rate, and the total number of faculty (including non-S&E faculty) increase at a much lower rate. However, limitations of the available measures of faculty and other faculty data suggest that the increase in S&E faculty with primary research responsibilities may be close to or only slightly less than the rate of increase of publication counts. Thus, the data suggest that total resources per publication have increased over time, which may be attributable to a variety of factors (including changes in regulatory and administrative burden, need for more extensive or complex collaborations, decreased cross-subsidization, etc.). It also suggests that the ratio of faculty to other resources (i.e., postdoctoral researchers, non-faculty doctoral research staff, etc.) may have declined.
5.1 Publication and Citation Trends Across All Fields
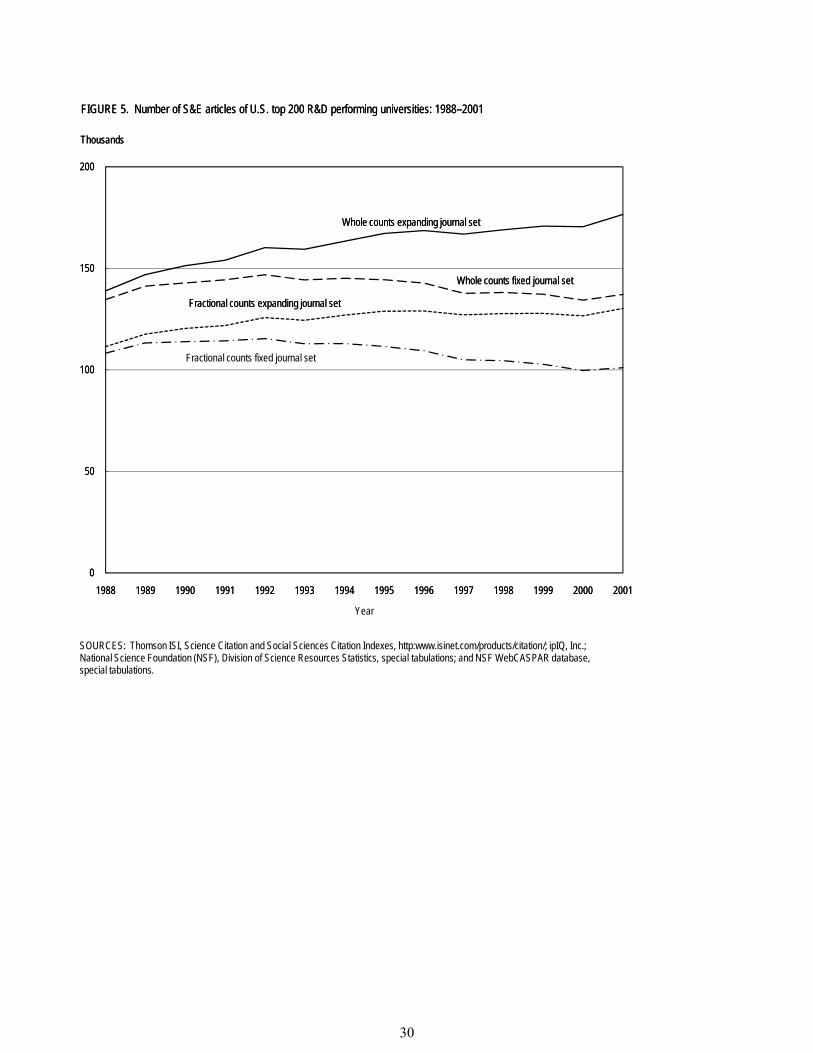
During the period from 1988 to 2001, the annual number of publications as measured by fractional counts in the expanding journal set for the U.S. as a whole (including academic, federal, state and local, private, and other sectors) increased from 177,662 to 200,870. Academic institutions accounted for a rising percentage of this total, from 71.7% in 1988 to 73.6% in 2001. The top 200 R&D performing academic institutions accounted for 87.7% of the academic total from 1988 to 2001 and this percentage has varied little from year to year.
Figure 5 displays publications as measured by fractional counts aggregated over the top 200 R&D performing academic institutions for the period 1988 to 2001 and publications as measured by whole counts for these institutions considered as a single entity (i.e., the observed number of
29
0
50
100
150
200
1988 1989 1990 1991 1992 1993 1994 1995 1996 1997 1998 1999 2000 2001
Thousands
FIGURE 5. Number of S&E articles of U.S. top 200 R&D performing universities: 1988–2001
Fractional counts expanding journal set
Whole counts fixed journal set
Whole counts expanding journal set
Fractional counts fixed journal set
0
50
100
150
200
1988 1989 1990 1991 1992 1993 1994 1995 1996 1997 1998 1999 2000 2001
Thousands
Year
FIGURE 5. Number of S&E articles of U.S. top 200 R&D performing universities: 1988–2001
SOURCES: Thomson ISI, Science Citation and Social Sciences Citation Indexes, http:www.isinet.com/products/citation/; ipIQ, Inc.; National Science Foundation (NSF), Division of Science Resources Statistics, special tabulations; and NSF WebCASPAR database,special tabulations.
Fractional counts expanding journal set
Whole counts fixed journal set
Whole counts expanding journal set
Fractional counts fixed journal set
30
publications in which one or more authors from any of the top 200 R&D performing academic institutions participated).15 Publications as measured by whole counts are larger than publications as measured by fractional counts because non-top 200 R&D performing academic institutions may have participated in authorship. Note that if the sum of the whole counts for individual institutions had been graphed, their values would have been considerably larger than either the sum of the fractional counts or the number of whole count publications for all top 200 R&D performing institutions considered as a single entity.
As seen in figure 5, publications as measured by fractional counts in the expanding journal set increased from 1988 to 1995, and have been approximately constant since that time, although there appears to be a slight increase in 2001. A very similar pattern is evident in publications as measured by whole counts in the expanding journal set, which increased from 1988 to 1996, was almost constant during the period from 1996 to 2000 inclusive and began to rise again in 2001. While the resources (R&D funding, S&E postdoctorates, and S&E graduate students) available to the top 200 R&D performing academic institutions increased during the period from 1996 to 2000, publications as measured by fractional and whole counts in the expanding journal set have remained roughly constant. The increasing gap between fractional and whole count publications in the expanding journal set is due to increasing amount of collaboration between top 200 R&D performing academic institutions and other institutions (both foreign and domestic) over this period of time.
Publications as measured by fractional counts using the fixed journal set increased from 1988 to 1992 and then decreased from 1992 through 1996 at which time it was approximately at the same level as 1988. After that point in time it continued to decline until stabilizing in 2001. Publications as measured by whole counts using the fixed journal set increased from 1988 through 1992, and then started to decrease, and has been approximately constant since 1997, at or slightly above the 1988 level. The widening gap between fractional and whole count publications in the fixed journal set is due to increased collaboration of top 200 R&D performing academic institutions with other institutions. The pattern for counts in the fixed journal set may differ from the pattern of counts in the expanding journal set for a number of reasons, among which may be a shift away from the fixed set to other journals such as in the expanding set.
Figure 6 shows the relative changes in these various publication counts, normalized so that the counts in 1988 equal 100. The similarity in the pattern of change is quite evident. Publications as measured by fractional and whole counts in the expanding journals set exhibited faster growth between 1988 and 1992 than fractional and whole count publications in the fixed journal set. Growth of fractional and whole count publications in the expanding journal set, however, slowed starting in 1992. Publications as measured by fractional and whole counts in the fixed journal set showed a general downward trend after 1992. The gap between whole and fractional count publications in both the expanding and fixed journal set widened during this period due to increased collaboration of top 200 R&D performing academic institutions with other institutions.
15 The sum of the whole counts over the 200 institutions would be larger than the number of publications because publications that have two or more institutional authors among the top 200 R&D performing academic institutions would be counted more than once.
31
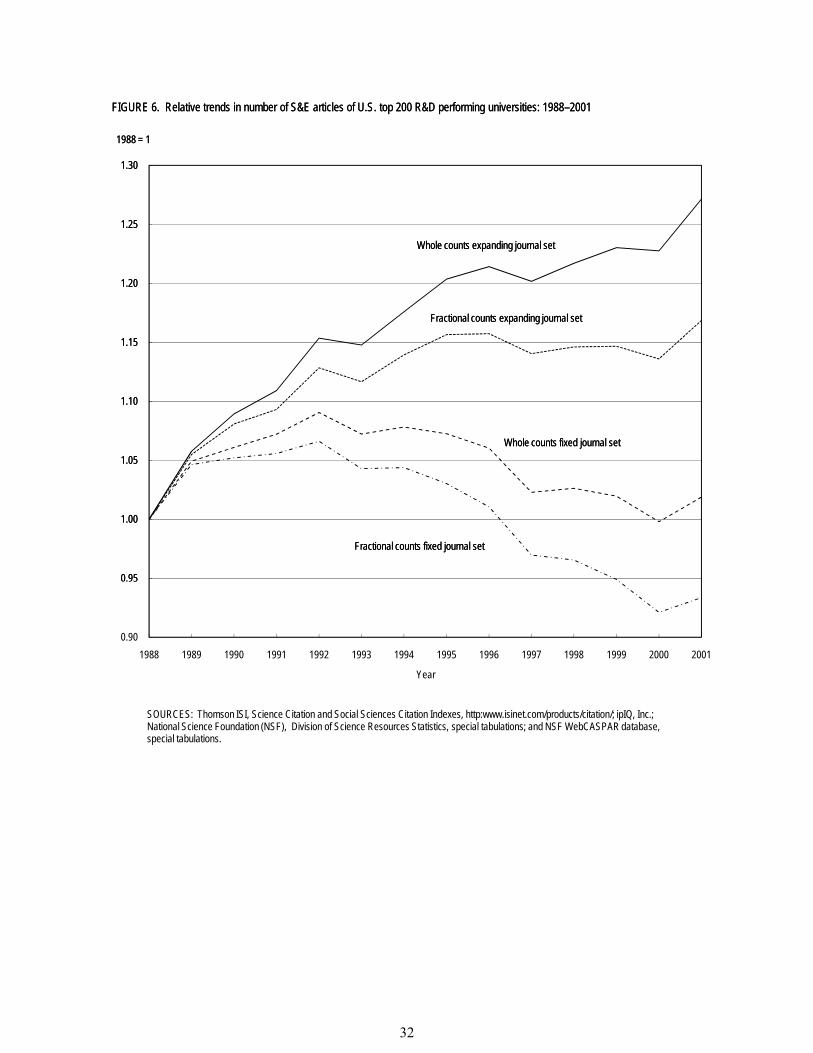
0.95
1.00
1.05
1.10
1.15
1.20
1.25
1.30
1988 = 1
FIGURE 6. Relative trends in number of S&E articles of U.S. top 200 R&D performing universities: 1988–2001
Whole counts expanding journal set
Fractional counts expanding journal set
Whole counts fixed journal set
Fractional counts fixed journal set
0.90
0.95
1.00
1.05
1.10
1.15
1.20
1.25
1.30
1988 1989 1990 1991 1992 1993 1994 1995 1996 1997 1998 1999 2000 2001
1988 = 1
Year
FIGURE 6. Relative trends in number of S&E articles of U.S. top 200 R&D performing universities: 1988–2001
SOURCES: Thomson ISI, Science Citation and Social Sciences Citation Indexes, http:www.isinet.com/products/citation/; ipIQ, Inc.; National Science Foundation (NSF), Division of Science Resources Statistics, special tabulations; and NSF WebCASPAR database, special tabulations.
Whole counts expanding journal set
Fractional counts expanding journal set
Whole counts fixed journal set
Fractional counts fixed journal set
32
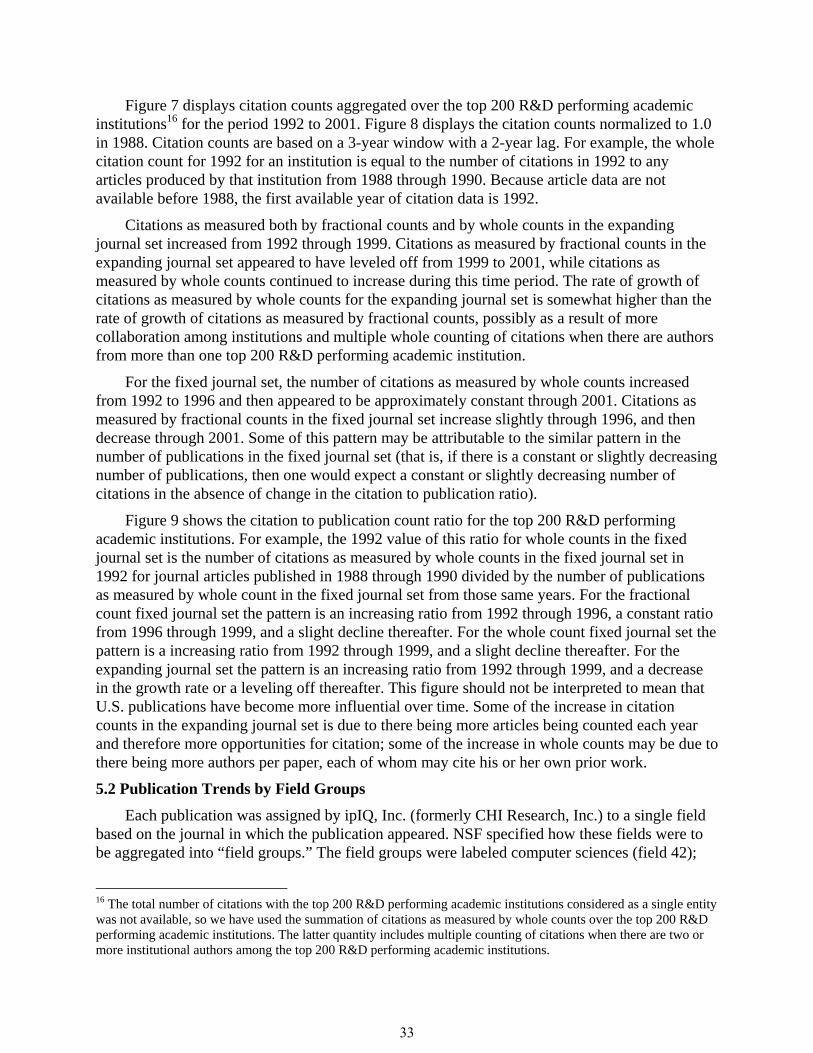
Figure 7 displays citation counts aggregated over the top 200 R&D performing academic institutions16 for the period 1992 to 2001. Figure 8 displays the citation counts normalized to 1.0 in 1988. Citation counts are based on a 3-year window with a 2-year lag. For example, the whole citation count for 1992 for an institution is equal to the number of citations in 1992 to any articles produced by that institution from 1988 through 1990. Because article data are not available before 1988, the first available year of citation data is 1992.
Citations as measured both by fractional counts and by whole counts in the expanding journal set increased from 1992 through 1999. Citations as measured by fractional counts in the expanding journal set appeared to have leveled off from 1999 to 2001, while citations as measured by whole counts continued to increase during this time period. The rate of growth of citations as measured by whole counts for the expanding journal set is somewhat higher than the rate of growth of citations as measured by fractional counts, possibly as a result of more collaboration among institutions and multiple whole counting of citations when there are authors from more than one top 200 R&D performing academic institution.
For the fixed journal set, the number of citations as measured by whole counts increased from 1992 to 1996 and then appeared to be approximately constant through 2001. Citations as measured by fractional counts in the fixed journal set increase slightly through 1996, and then decrease through 2001. Some of this pattern may be attributable to the similar pattern in the number of publications in the fixed journal set (that is, if there is a constant or slightly decreasing number of publications, then one would expect a constant or slightly decreasing number of citations in the absence of change in the citation to publication ratio).
Figure 9 shows the citation to publication count ratio for the top 200 R&D performing academic institutions. For example, the 1992 value of this ratio for whole counts in the fixed journal set is the number of citations as measured by whole counts in the fixed journal set in 1992 for journal articles published in 1988 through 1990 divided by the number of publications as measured by whole count in the fixed journal set from those same years. For the fractional count fixed journal set the pattern is an increasing ratio from 1992 through 1996, a constant ratio from 1996 through 1999, and a slight decline thereafter. For the whole count fixed journal set the pattern is a increasing ratio from 1992 through 1999, and a slight decline thereafter. For the expanding journal set the pattern is an increasing ratio from 1992 through 1999, and a decrease in the growth rate or a leveling off thereafter. This figure should not be interpreted to mean that U.S. publications have become more influential over time. Some of the increase in citation counts in the expanding journal set is due to there being more articles being counted each year and therefore more opportunities for citation; some of the increase in whole counts may be due to there being more authors per paper, each of whom may cite his or her own prior work.
5.2 Publication Trends by Field Groups
Each publication was assigned by ipIQ, Inc. (formerly CHI Research, Inc.) to a single field based on the journal in which the publication appeared. NSF specified how these fields were to be aggregated into “field groups.” The field groups were labeled computer sciences (field 42);
16 The total number of citations with the top 200 R&D performing academic institutions considered as a single entity was not available, so we have used the summation of citations as measured by whole counts over the top 200 R&D performing academic institutions. The latter quantity includes multiple counting of citations when there are two or more institutional authors among the top 200 R&D performing academic institutions.
33
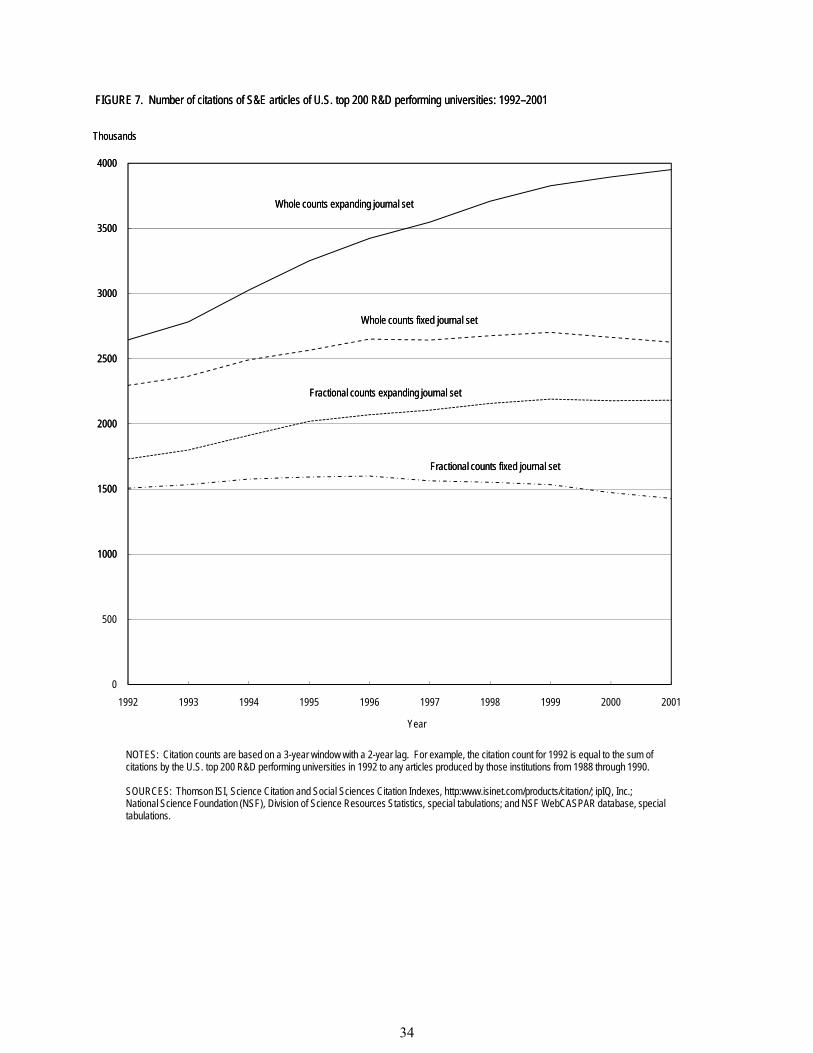
1000
1500
2000
2500
3000
3500
4000
Thousands
FIGURE 7. Number of citations of S&E articles of U.S. top 200 R&D performing universities: 1992–2001
Whole counts expanding journal set
Whole counts fixed journal set
Fractional counts expanding journal set
Fractional counts fixed journal set
0
500
1000
1500
2000
2500
3000
3500
4000
1992 1993 1994 1995 1996 1997 1998 1999 2000 2001
Thousands
Year
FIGURE 7. Number of citations of S&E articles of U.S. top 200 R&D performing universities: 1992–2001
NOTES: Citation counts are based on a 3-year window with a 2-year lag. For example, the citation count for 1992 is equal to the sum of citations by the U.S. top 200 R&D performing universities in 1992 to any articles produced by those institutions from 1988 through 1990.
SOURCES: Thomson ISI, Science Citation and Social Sciences Citation Indexes, http:www.isinet.com/products/citation/; ipIQ, Inc.; National Science Foundation (NSF), Division of Science Resources Statistics, special tabulations; and NSF WebCASPAR database, special tabulations.
Whole counts expanding journal set
Whole counts fixed journal set
Fractional counts expanding journal set
Fractional counts fixed journal set
34
1.05
1.10
1.15
1.20
1.25
1.30
1.35
1.40
1.45
1.50
1988 = 1
FIGURE 8. Relative trends in number of citations of S&E articles of U.S. top 200 R&D performing universities: 1992–2001
Whole counts expanding journal set
Fractional counts expanding journal set
Whole counts fixed journal set
Fractional counts fixed journal set
0.90
0.95
1.00
1.05
1.10
1.15
1.20
1.25
1.30
1.35
1.40
1.45
1.50
1992 1993 1994 1995 1996 1997 1998 1999 2000 2001
1988 = 1
Year
FIGURE 8. Relative trends in number of citations of S&E articles of U.S. top 200 R&D performing universities: 1992–2001
NOTES: Citation counts are based on a 3-year window with a 2-year lag. For example, the citation count for 1992 is equal to the sum of citations by the U.S. top 200 R&D performing universities in 1992 to any articles produced by those institutions from 1988 through 1990.
SOURCES: Thomson ISI, Science Citation and Social Sciences Citation Indexes, http:www.isinet.com/products/citation/; ipIQ, Inc.; National Science Foundation (NSF), Division of Science Resources Statistics, special tabulations; and NSF WebCASPAR database, special tabulations.
Whole counts expanding journal set
Fractional counts expanding journal set
Whole counts fixed journal set
Fractional counts fixed journal set
35
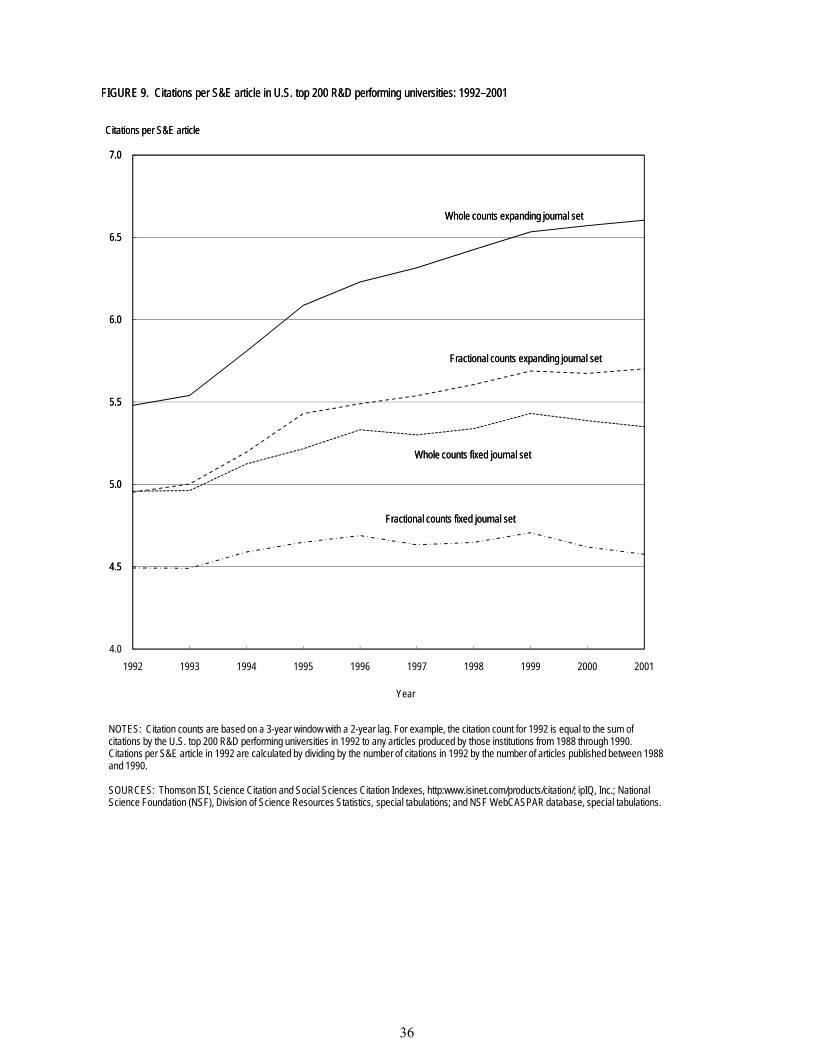
4.5
5.0
5.5
6.0
6.5
7.0
Citations per S&E article
FIGURE 9. Citations per S&E article in U.S. top 200 R&D performing universities: 1992–2001
Whole counts expanding journal set
Fractional counts expanding journal set
Whole counts fixed journal set
Fractional counts fixed journal set
4.0
4.5
5.0
5.5
6.0
6.5
7.0
1992 1993 1994 1995 1996 1997 1998 1999 2000 2001
Citations per S&E article
Year
FIGURE 9. Citations per S&E article in U.S. top 200 R&D performing universities: 1992–2001
NOTES: Citation counts are based on a 3-year window with a 2-year lag. For example, the citation count for 1992 is equal to the sum of citations by the U.S. top 200 R&D performing universities in 1992 to any articles produced by those institutions from 1988 through 1990. Citations per S&E article in 1992 are calculated by dividing by the number of citations in 1992 by the number of articles published between 1988 and 1990.
SOURCES: Thomson ISI, Science Citation and Social Sciences Citation Indexes, http:www.isinet.com/products/citation/; ipIQ, Inc.; National Science Foundation (NSF), Division of Science Resources Statistics, special tabulations; and NSF WebCASPAR database, special tabulations.
Whole counts expanding journal set
Fractional counts expanding journal set
Whole counts fixed journal set
Fractional counts fixed journal set
36
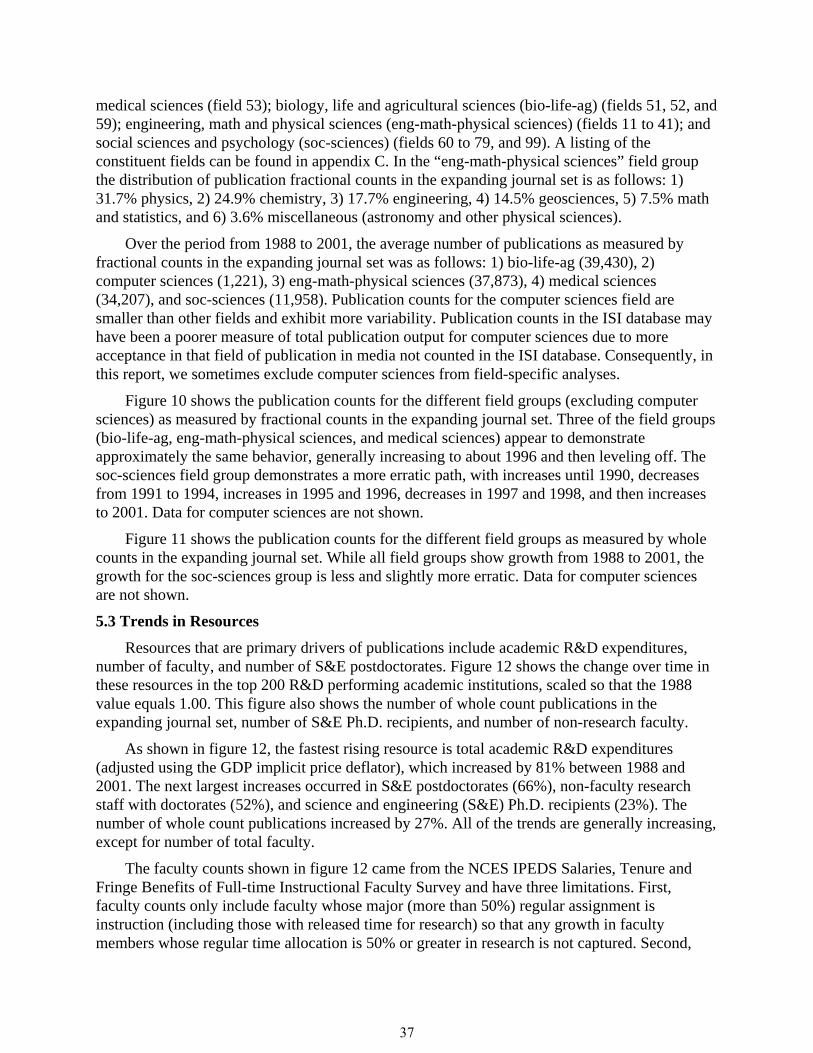
medical sciences (field 53); biology, life and agricultural sciences (bio-life-ag) (fields 51, 52, and 59); engineering, math and physical sciences (eng-math-physical sciences) (fields 11 to 41); and social sciences and psychology (soc-sciences) (fields 60 to 79, and 99). A listing of the constituent fields can be found in appendix C. In the “eng-math-physical sciences” field group the distribution of publication fractional counts in the expanding journal set is as follows: 1) 31.7% physics, 2) 24.9% chemistry, 3) 17.7% engineering, 4) 14.5% geosciences, 5) 7.5% math and statistics, and 6) 3.6% miscellaneous (astronomy and other physical sciences).
Over the period from 1988 to 2001, the average number of publications as measured by fractional counts in the expanding journal set was as follows: 1) bio-life-ag (39,430), 2) computer sciences (1,221), 3) eng-math-physical sciences (37,873), 4) medical sciences (34,207), and soc-sciences (11,958). Publication counts for the computer sciences field are smaller than other fields and exhibit more variability. Publication counts in the ISI database may have been a poorer measure of total publication output for computer sciences due to more acceptance in that field of publication in media not counted in the ISI database. Consequently, in this report, we sometimes exclude computer sciences from field-specific analyses.
Figure 10 shows the publication counts for the different field groups (excluding computer sciences) as measured by fractional counts in the expanding journal set. Three of the field groups (bio-life-ag, eng-math-physical sciences, and medical sciences) appear to demonstrate approximately the same behavior, generally increasing to about 1996 and then leveling off. The soc-sciences field group demonstrates a more erratic path, with increases until 1990, decreases from 1991 to 1994, increases in 1995 and 1996, decreases in 1997 and 1998, and then increases to 2001. Data for computer sciences are not shown.
Figure 11 shows the publication counts for the different field groups as measured by whole counts in the expanding journal set. While all field groups show growth from 1988 to 2001, the growth for the soc-sciences group is less and slightly more erratic. Data for computer sciences are not shown.
5.3 Trends in Resources
Resources that are primary drivers of publications include academic R&D expenditures, number of faculty, and number of S&E postdoctorates. Figure 12 shows the change over time in these resources in the top 200 R&D performing academic institutions, scaled so that the 1988 value equals 1.00. This figure also shows the number of whole count publications in the expanding journal set, number of S&E Ph.D. recipients, and number of non-research faculty.
As shown in figure 12, the fastest rising resource is total academic R&D expenditures (adjusted using the GDP implicit price deflator), which increased by 81% between 1988 and 2001. The next largest increases occurred in S&E postdoctorates (66%), non-faculty research staff with doctorates (52%), and science and engineering (S&E) Ph.D. recipients (23%). The number of whole count publications increased by 27%. All of the trends are generally increasing, except for number of total faculty.
The faculty counts shown in figure 12 came from the NCES IPEDS Salaries, Tenure and Fringe Benefits of Full-time Instructional Faculty Survey and have three limitations. First, faculty counts only include faculty whose major (more than 50%) regular assignment is instruction (including those with released time for research) so that any growth in faculty members whose regular time allocation is 50% or greater in research is not captured. Second,
37
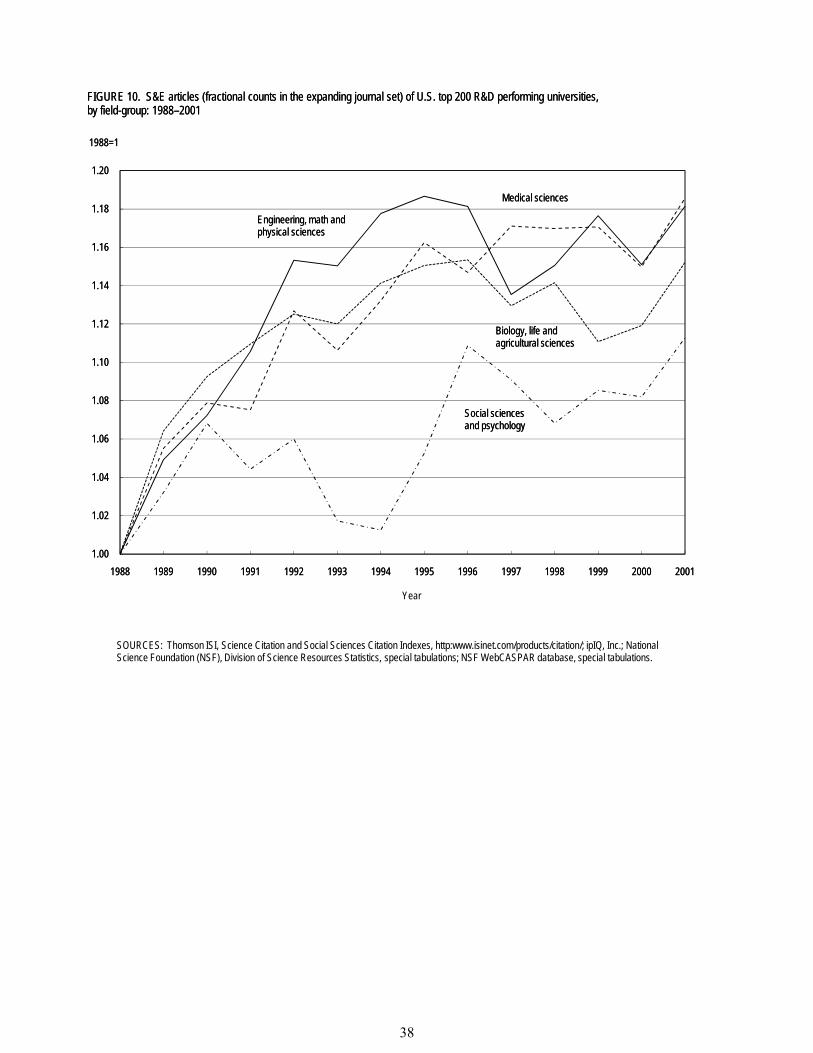
1.00
1.02
1.04
1.06
1.08
1.10
1.12
1.14
1.16
1.18
1.20
1988 1989 1990 1991 1992 1993 1994 1995 1996 1997 1998 1999 2000 2001
1988=1
FIGURE 10. S&E articles (fractional counts in the expanding journal set) of U.S. top 200 R&D performing universities, by field-group: 1988–2001
Social sciences and psychology
Biology, life and agricultural sciences
Engineering, math and physical sciences
Medical sciences
1.00
1.02
1.04
1.06
1.08
1.10
1.12
1.14
1.16
1.18
1.20
1988 1989 1990 1991 1992 1993 1994 1995 1996 1997 1998 1999 2000 2001
1988=1
Year
FIGURE 10. S&E articles (fractional counts in the expanding journal set) of U.S. top 200 R&D performing universities, by field-group: 1988–2001
SOURCES: Thomson ISI, Science Citation and Social Sciences Citation Indexes, http:www.isinet.com/products/citation/; ipIQ, Inc.; National Science Foundation (NSF), Division of Science Resources Statistics, special tabulations; NSF WebCASPAR database, special tabulations.
Social sciences and psychology
Biology, life and agricultural sciences
Engineering, math and physical sciences
Medical sciences
38
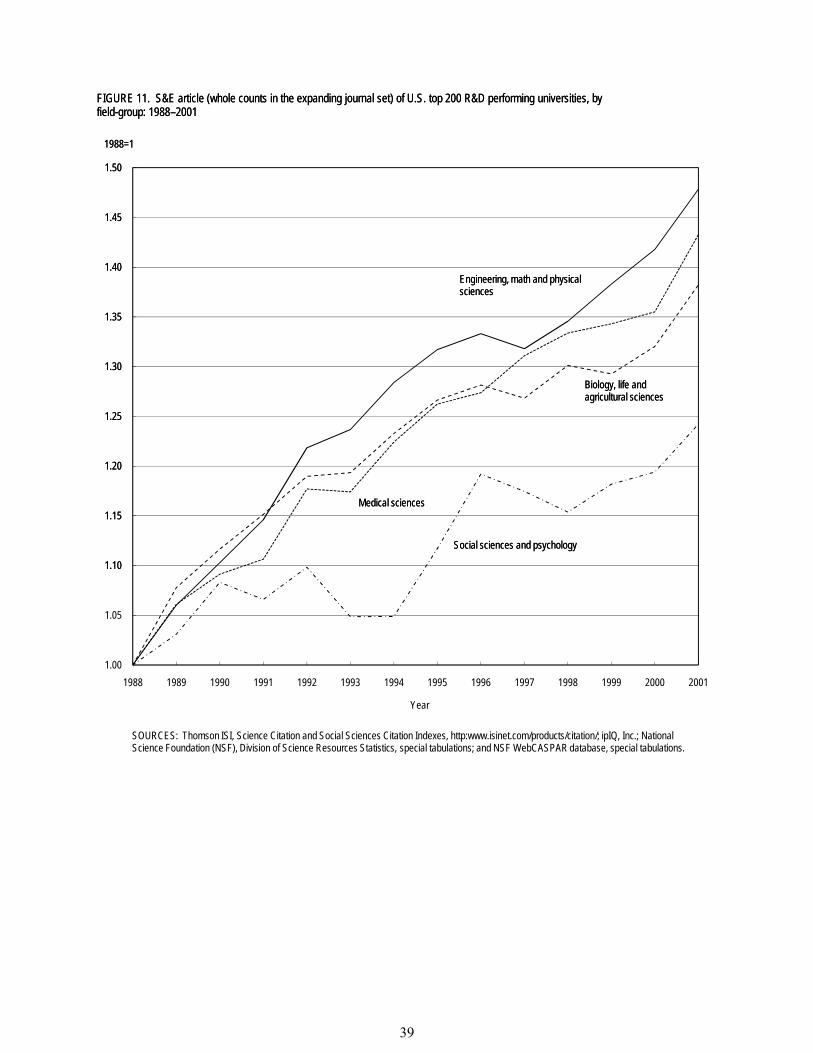
1.10
1.15
1.20
1.25
1.30
1.35
1.40
1.45
1.50
1988=1
FIGURE 11. S&E article (whole counts in the expanding journal set) of U.S. top 200 R&D performing universities, by field-group: 1988–2001
Engineering, math and physical sciences
Medical sciences
Social sciences and psychology
Biology, life and agricultural sciences
1.00
1.05
1.10
1.15
1.20
1.25
1.30
1.35
1.40
1.45
1.50
1988 1989 1990 1991 1992 1993 1994 1995 1996 1997 1998 1999 2000 2001
1988=1
Year
FIGURE 11. S&E article (whole counts in the expanding journal set) of U.S. top 200 R&D performing universities, by field-group: 1988–2001
SOURCES: Thomson ISI, Science Citation and Social Sciences Citation Indexes, http:www.isinet.com/products/citation/; ipIQ, Inc.; National Science Foundation (NSF), Division of Science Resources Statistics, special tabulations; and NSF WebCASPAR database, special tabulations.
Engineering, math and physical sciences
Medical sciences
Social sciences and psychology
Biology, life and agricultural sciences
39
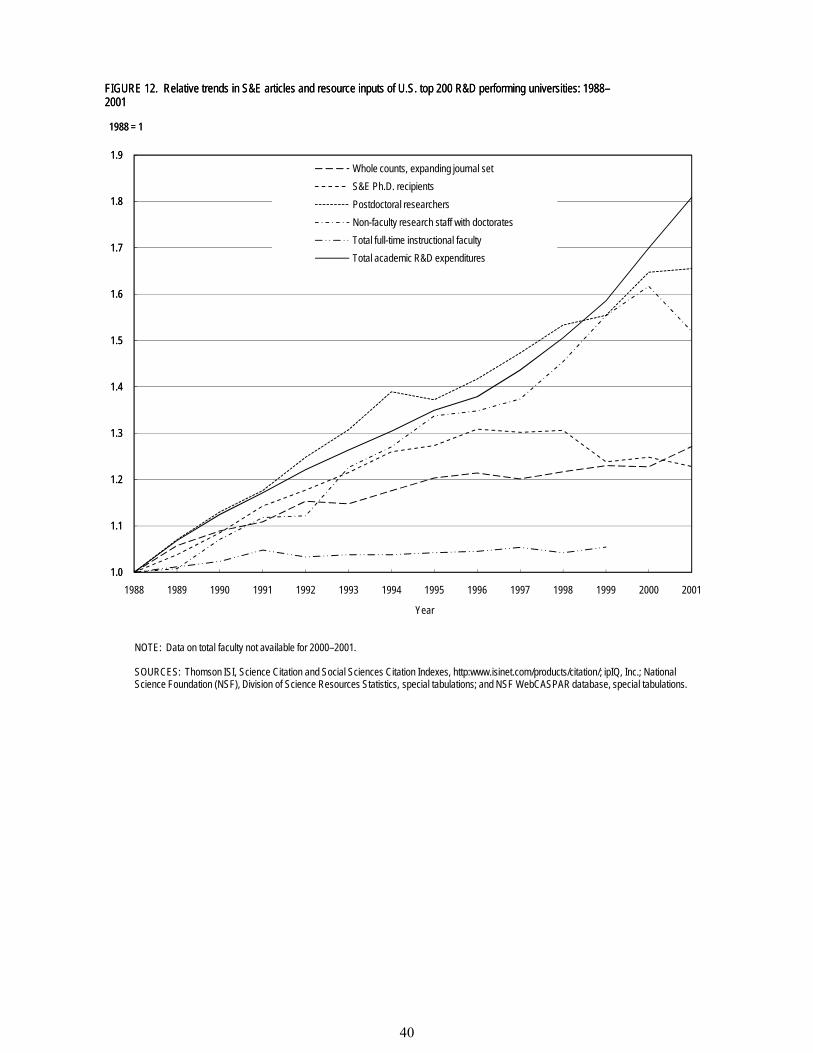
1.0
1.1
1.2
1.3
1.4
1.5
1.6
1.7
1.8
1.9
1988 = 1
FIGURE 12. Relative trends in S&E articles and resource inputs of U.S. top 200 R&D performing universities: 1988–2001
Whole counts, expanding journal setS&E Ph.D. recipientsPostdoctoral researchersNon-faculty research staff with doctorates Total full-time instructional facultyTotal academic R&D expenditures
1.0
1.1
1.2
1.3
1.4
1.5
1.6
1.7
1.8
1.9
1988 1989 1990 1991 1992 1993 1994 1995 1996 1997 1998 1999 2000 2001
1988 = 1
Year
FIGURE 12. Relative trends in S&E articles and resource inputs of U.S. top 200 R&D performing universities: 1988–2001
Whole counts, expanding journal setS&E Ph.D. recipientsPostdoctoral researchersNon-faculty research staff with doctorates Total full-time instructional facultyTotal academic R&D expenditures
NOTE: Data on total faculty not available for 2000–2001.
SOURCES: Thomson ISI, Science Citation and Social Sciences Citation Indexes, http:www.isinet.com/products/citation/; ipIQ, Inc.; National Science Foundation (NSF), Division of Science Resources Statistics, special tabulations; and NSF WebCASPAR database, special tabulations.
40
faculty counts are not available by discipline, so the faculty counts include faculty in non-S&E disciplines. Consequently, the rate of increase of faculty in S&E disciplines may be misestimated. Third, the counts are of the total number of full-time faculty (as defined by the institution), not the number of full-time equivalents. Consequently, if the growth rate of part-time faculty were less than the growth rate of full-time faculty, the growth rate of full-time faculty would overestimate the growth rate of FTE faculty; similarly if the opposite were true, the growth rate of full-time faculty would underestimate the growth rate of FTE faculty. The use of the NCES faculty counts in modeling S&E publications is dependent upon the assumption that the rate of growth of S&E faculty in the top 200 R&D performing academic institutions is the same as the rate of growth for all full-time faculty in those institutions. All full-time faculty increased by 5.4% from 1988 to 1999.
An alternative source of data on faculty counts is the NSF Survey of Doctorate Recipients (SDR), which can be used to estimate the number of faculty members with S&E doctoral degrees granted by U.S. institutions at the national level. This survey does not include S&E faculty who do not have at least one doctoral degree granted by a U.S. institution. It would underestimate the growth in S&E faculty if faculty with only foreign doctorates had increased faster than the growth of S&E faculty with at least one U.S. granted doctoral degree. For the SDR survey, full time faculty consist of those ranked as instructor, assistant, associate, or full professor who are employed at universities, colleges, and 2-year postsecondary institutions and who have full-time status in the labor force. The NSF SDR shows that for all academic institutions the number of full-time faculty with teaching or research positions and doctoral degrees in S&E increased by 10.5% from 1988 to 1999 (using interpolation to obtain the 1988 estimate) and by 11.7% from 1988 to 2001. However, for research universities, the number decreased by 0.05% between 1988 and 1999 and by 0.08% from 1988 and 2000. If one expects the change in S&E faculty for the top 200 R&D performing academic institutions to be somewhat between the change in S&E faculty for research universities and all academic institutions, this suggests that the assumption underlying the use of the NCES faculty counts may be reasonable.
The NSF SDR data also reveal that the change in S&E faculty counts is not uniform across principal work activity. For all academic institutions, the increase from 1988 to 2001 in S&E faculty with primarily teaching responsibilities was 4.3%, while for faculty with primarily research responsibilities the increase was 21.7%. In research universities, faculty with primarily teaching responsibilities decreased by 14.9% from 1988 to 2001, while those with research responsibilities increased by 8.6%. Thus, while the NCES faculty counts may reflect changes in total S&E faculty in the top 200 R&D performing academic institutions, those counts may not reflect the growth rates of faculty with primarily research responsibilities.
Based on the available data it seems likely that the number of S&E faculty with primary or secondary research and teaching responsibilities either increased at about the same rate as publication counts or somewhat more slowly. As noted previously, however, resources other than faculty required per publication (which we shall term the publication “efficiency”) increased from 1988 to 2001 resulting in the ratio of faculty to other resources declining.17 Our database does not address the reasons for increased resources per publication (such as increased regulatory
17 A decrease in efficiency (i.e., an increase in resources being used per publication) should not be interpreted as implying that the use of additional resources is unjustified. The resources required (by an “efficient” research team) to produce a publication may have changed over time.
41
and administrative burden, need for more extensive or complex collaborations with the associated communication overhead, decreased cross-subsidization of medical research from clinical revenues, etc.).
Averaged over the period from 1988 to 1999, based on the NCES IPEDS data, the distribution of full-time instructional faculty was approximately 39% full professor, 28% associate professor, 24% assistant professor, 8% instructors and lecturers, and 1% other ranks. Figure 13 shows relative trends in number of faculty by rank (except for the category of instructors, lecturers, and other ranks, which behaved erratically over the time period and would not be expected to have a major impact on publications). Overall faculty and associate professor counts increased by 5% and full professor by 9%. Assistant professors increased until 1991, remained constant until 1993, decreased until 1998, and then increased in 1999, ending up about 2% lower than 1988. The number of full and associate professors combined increased by 7.2% from 1988 to 1999. This is substantially less than the increase in publication counts. Consequently, if they were the faculty most responsible for publications, their publication output per capita would also have increased substantially during this time period. Of course, these figures are subject to the same limitation as existed for total faculty counts (i.e., the assumption that S&E faculty counts behave the same as total faculty counts), and therefore must be regarded with some degree of skepticism.
42
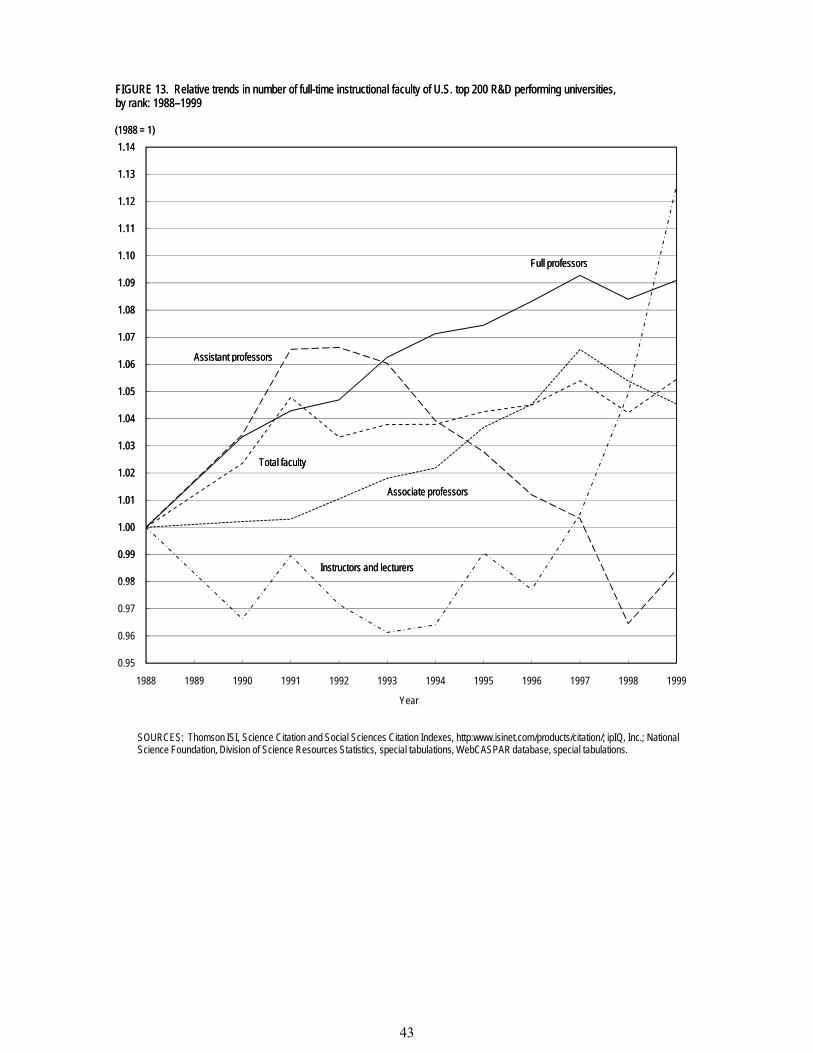
0 98
0.99
1.00
1.01
1.02
1.03
1.04
1.05
1.06
1.07
1.08
1.09
1.10
1.11
1.12
1.13
1.14(1988 = 1)
FIGURE 13. Relative trends in number of full-time instructional faculty of U.S. top 200 R&D performing universities, by rank: 1988–1999
Instructors and lecturers
Full professors
Total faculty
Assistant professors
Associate professors
0.95
0.96
0.97
0.98
0.99
1.00
1.01
1.02
1.03
1.04
1.05
1.06
1.07
1.08
1.09
1.10
1.11
1.12
1.13
1.14
1988 1989 1990 1991 1992 1993 1994 1995 1996 1997 1998 1999
(1988 = 1)
Year
FIGURE 13. Relative trends in number of full-time instructional faculty of U.S. top 200 R&D performing universities, by rank: 1988–1999
SOURCES: Thomson ISI, Science Citation and Social Sciences Citation Indexes, http:www.isinet.com/products/citation/; ipIQ, Inc.; National Science Foundation, Division of Science Resources Statistics, special tabulations, WebCASPAR database, special tabulations.
Instructors and lecturers
Full professors
Total faculty
Assistant professors
Associate professors
43
6.0 Variable Transformations: Inflation Adjustment and Lagging
This section describes variable transformations that were used in the analyses. Monetary measures were deflated using the GDP implicit price deflator. Measures of research resources were lagged relative to publication date to account for the time necessary to conduct research, submit a journal manuscript, and have the manuscript published. Citations were given negative lags relative to publication dates, to account for the time difference between publication and citation in later articles. However, the effect of different choices for lags was modest suggesting that our analyses were robust.
To adjust for the effects of inflation, all monetary variables were deflated using the GDP implicit price deflator. Since academic R&D expenditures are used for a variety of purposes, and inflation rates were not available for salaries of faculty, non-faculty research personnel, and S&E postdoctorates, nor for material costs associated with research, we cannot determine whether this inflation adjustment was successful in equating real purchasing power.
Because there is a delay between receipt of funds for R&D research, the conduct of that research, the publication of results in journals, and the citation of other publications, we examined the correlations among lagged versions of monetary measures, personnel measures, publication measures, and citation measures. In general it appeared that publications in a particular year were most highly correlated with personnel measures from the previous year, monetary measures from two years previously, and citation measurements two years in the future. Consequently in subsequent analyses we modeled publications in a given year as a function of personnel measures from the previous year and monetary measures from two years before. We modeled citation measurements as a function of personnel measurements from three years previous and monetary measurements from four years previous. However, we note that the correlations did not change dramatically with different lags than the ones that we chose, and consequently our choice probably had little effect on the results of subsequent analyses.
The correlations among the publication and forwarded citation measures (i.e., citation counts “lagged” by 2 years18) were quite high. The correlations among the four publication measures ranged from 0.982 to 0.996. The correlations among the four citation measures ranged from 0.993 to 0.996. The correlations between the publication and citation measures ranged from 0.764 to 0.857. The correlations of fractional count publications in the fixed journal set had correlations between 0.764 and 0.798 with the citation measures; the other publication count measures had correlations between 0.804 and 0.857 with the citation measures.
A factor analysis on publication counts and forwarded citation counts (i.e., citation counts “lagged” by 2 years) aggregated to the institution-year level yielded a primary factor accounting for 95.8% of the variance. That is, it is possible to calculate an index using the different publication and citation measures, which is very highly correlated with those measures, and consequently, summarizes the variability in those measures across institutions and years. This index is called the first principal component. The first principal component was essentially the average value of the normalized publication and citation measures, and the correlations of the
18 For example, publication counts in 1990 were correlated with citation measures in 1992.
44

first principal component with the eight publication and forwarded citation measures ranged from 0.931 to 0.970. This analysis was repeated for each of the field groups with essentially identical results.
45
7.0 Decomposition of Variability: Between and Within Institution Components
This section discusses the finding that almost all of the variability in publication and citation counts and in resources used for research occurs between institutions, rather than across years within institutions. As a result, models based on the dataset are more sensitive to differences between institutions (e.g., the relationship of average resources to average publications across years) than to how changes in resources within institutions are related to changes in publication counts for those institutions.
Most of the variability in the citations and publications counts, when aggregated to the institutional-year level, occurs between institutions. Regressing an indicator variable for institution on the first principal component results in an r-square of 0.918. (If institution is entered as a random effect rather than a fixed effect, the r-square is 0.910). Thus, to a substantial extent modeling using the publication trends database will be differentiating publication and citation levels between institutions, rather than modeling changes that occur over time within institutions. Adding a linear year term as an independent variable increases r-square to 0.934. Adding an interaction between year and institution (which allows for different linear publication trends by institution) increases r-square to 0.943.
Most of the variability in the independent variables also occurs between institutions. Institution accounts for the following proportion of variance among prominent independent variables: total academic R&D (97.6%), number of S&E Ph.D. recipients (98.3%), number of postdoctoral researchers (97.5%), number of faculty (97.1%), and number of non-faculty doctoral research staff (92.6%).
46
8.0 Key Variables Associated with Institution-Level Publication Counts
This section discusses model development where the basic unit of analysis is the institution-year (i.e., the number of publications for an institution during a given year).
Section 8.1 describes the analyses of fractional count publications in the expanding journal set. Because various groups of independent (explanatory) variables were highly correlated, a stepwise regression approach was used on each group of such variables to determine the few that accounted for most of the explanatory ability. For example, of eight different measures of research funding, only three were retained after the stepwise analysis. Variables were retained only if they resulted in the explanatory capability of the model increasing by 1%. Variables retained from the first round of stepwise regressions were then entered together into a final stepwise regression. Using similar criteria for retention, the model only contained three variables: 1) total academic R&D expenditures, 2) number of S&E postdoctorates, and 3) number of S&E doctoral degrees granted. The coefficient in this regression was 3.31 fractional-count publications per $1M in academic R&D expenditures, 0.882 per S&E postdoctorate, and 1.18 per S&E Ph.D. recipient. Faculty counts were not found to improve the model’s fit, although we believe the reason for this may be the deficiencies in the various faculty measures that are available.
Section 8.2 describes a repeat of the regression analysis for whole count publications in the expanding journal set. The same three explanatory variables were retained. The coefficients in this regression were 4.78 whole-count publications per $1M in academic R&D expenditures, 1.66 per S&E postdoctorate, and 1.45 per S&E Ph.D. recipient.
Section 8.3 discusses a path analytic model that was developed under the assumption that academic R&D expenditures have both a direct effect on publication counts and an indirect effect (through funding of some S&E postdoctorates and Ph.D. graduate students). We found that each $1M in additional academic R&D funding was associated with an additional 2.53 postdoctoral researchers and 1.39 additional Ph.D. recipients. The combined direct and indirect effect of adding $1M in funding was an additional 7.18 fractional publication counts and 11.0 whole publication counts.
Section 8.4 presents visual plots of the relationship of publication counts, academic R&D expenditures, postdoctoral counts, and S&E doctoral recipient counts. Harvard University shows up as an outlier in some of these graphs and possible reasons for this anomaly are discussed.
8.1 Analyses of Fractional Count Publications in the Expanding Journal Set
The Publications Trends database contains sets of personnel and financial variables that are highly correlated. One of the initial steps in constructing a model was to screen each set of variables to determine which of them appeared to have the most explanatory power. An alternative approach would have been to conduct a factor analysis and extract one or two factors for inclusion in a model. However, NSF and SRI felt that it might be difficult to interpret factors clearly and unambiguously, and it would be better to determine initially if culling of independent variables would yield a parsimonious model with good explanatory ability. Stepwise regression
47
was used for screening purposes for each set of related variables to identify likely candidates for a more comprehensive model. Because of the known problems of stepwise regression in deflating p-values, a criteria of incremental r-square values was used. In addition, all coefficients for variables entered into the model were statistically significant at the p < 0.001 level. The results of each stepwise regression were examined for reasonableness using the authors' experience and knowledge of the field, and for consistency across the various dependent variables and academic fields, before selecting the variables for the final regression models. Parsimony was an important criteria in model building, and out of the many dozens of variables considered, final models typically contained only 3 to 6 variables.
In the first set of analyses the dependent variable was publications as measured by fractional counts in the expanding journal set. The data set was aggregated to the institution-year level. Financial variables were deflated using the GDP implicit price deflator; personnel variables were lagged by one year and financial variables by two years. Analyses were conducted using stepwise linear regression. We typically retained any variable that, when entered into the regression, increased r-square by at least 0.01. All such variables were highly statistically significant when entered.
In the first stepwise regression the only independent variables were faculty counts. The set of faculty count variables (all lagged by 1 year) in their order of entry into the regression and the cumulative r-square values after entry were as follows: 1) full professors (0.363), 2) associate professors (0.452), and 3) total faculty (0.486). We retained these three variables for inclusion in later regressions. Instructors and assistant professors did not meet the 0.01 threshold. When only these three independent variables were included, the coefficients were 1.31 for full professors (i.e., 1.31 additional fractional counts per year per full professor), -3.70 for associate professors, and 0.99 for total faculty. Since addition of an associate professor also increases total faculty, the net effect of adding an associate professor would be -2.71 and the net effect of adding a full professor would be 2.30. Possible explanations for the negative coefficient for associate professors may include associate professors being disproportionately located in campuses which do not have a primary research responsibility or tenured associate professors who do not achieve full professor status due to lack of publications.
In the second stepwise regression the only independent variables were the Carnegie classification indicators. The set of Carnegie classifications in their order of entry into the regression and the cumulative r-square values after entry were as follows: 1) R-1 (0.487) and 2) Medical (0.498). We retained R-1 and Medical. The other Carnegie classifications (including the indicator of whether the institution was publicly or privately financed) did not meet the 0.01 threshold.
In the third stepwise regression the only independent variables were academic R&D expenditure variables. The set of academic R&D expenditures variables in their order of entry into the regression and the cumulative r-square values after entry were as follows: 1) total academic R&D expenditures (0.835), 2) federally financed academic R&D expenditures (0.851), and 3) other funding sources of academic R&D expenditures (0.863). The remaining academic R&D expenditure variables did not meet the 0.01 threshold. The remaining variables included various sources of funding for academic R&D expenditures (industry, the institution, or state/local government), total academic basic research expenditures (total, federally financed,
48
and non-federally financed), research equipment expenditures (total, federally financed, and non-federally financed), institution financed organized research, and unreimbursed indirect costs.
In the fourth stepwise regression the only independent variables were enrollment variables. The set of enrollment variables in their order of entry into the regression and the cumulative r-square values after entry were as follows: 1) number of S&E graduate students (0.459) and 2) fall enrollment of undergraduates (0.519). The enrollment of graduate students and total fall enrollment did not meet the 0.01 threshold. All fall enrollment variables were institution-wide rather than S&E specific. The coefficient for undergraduates was negative.
In the fifth stepwise regression the only independent variables were postdoctoral count variables. The set of postdoctoral count variables in their order of entry into the regression and the cumulative r-square values after entry were as follows: 1) total S&E postdoctorates (0.702), 2) S&E postdoctorates supported by federal research grants (0.782), 3) S&E postdoctorates with M.D.s supported by federal research grants (0.803), and 4) S&E postdoctorates supported by federal traineeships (0.816). The coefficients for these variables were -0.11, 5.21, -8.25 and 4.9 indicating potentially widely varying impacts of different types of S&E postdoctorates. The remaining variables that did not meet a 0.01 threshold included S&E postdoctorates with M.D.s in total and by support type (federal fellowships, federal traineeships, and non-federal sources), S&E postdoctorates without M.D.s in total and by support type (federal fellowships, federal traineeships, and non-federal sources), and S&E postdoctorates by support type (federal fellowships, federal traineeships, and non-federal sources)
In the sixth stepwise regression the only independent variables were non-faculty doctoral research staff count variables. The only non-faculty doctoral research staff count variable in the regression and the cumulative r-square values after entry was non-faculty doctoral research staff (0.498). Non-faculty doctoral research staff with M.D.s did not meet the 0.01 threshold.
In the seventh stepwise regression the only independent variables were degree award count variables. The set of degrees awarded variables in their order of entry into the regression and the cumulative r-square values after entry were as follows: 1) S&E doctorates from the NSF Survey of Earned Doctorates (0.703), and 2) S&E BA/BS degrees (0.715). S&E doctorates from the IPEDS Completions Survey, and S&E Master's degrees awarded did not meet the 0.01 incremental threshold. The coefficient for BA/BS degrees was negative, consistent with the finding for number of undergraduate students. The two doctoral degree variables had a correlation of 0.973.
The complete set of retained variables identified above was entered into the eighth stepwise regression. The variables in their order of entry into the regression and the cumulative r-square values after entry were as follows: 1) total academic R&D expenditures (0.840) and 2) S&E postdoctorates supported by federal research grants (0.922). All of the other variables increased r-square to 0.945. We note that total S&E postdoctorates has a 0.955 correlation with S&E postdoctorates supported by federal research grants, and it appeared reasonable to substitute the former for the latter under the assumption that non-federally supported S&E postdoctorates also made a contribution to publications. When total S&E postdoctorates were substituted for S&E postdoctorates supported by federal research grants the cumulative r-square in the regression was slightly reduced to 0.912. Rerunning the eighth stepwise regression with this substitution, S&E doctorates from the NSF Survey of Earned Doctorates was the only additional variable that
49
satisfied the 0.01 threshold and therefore enters the set of explanatory (independent) variables, increasing the r-square to 0.927.
Finally, we ran a ninth stepwise regression including all independent variables, including a variable not previously included in regressions (number of patents issued in 1988 to 2001 for the institution). No change was found in the variables entering the regression equation. Thus, after screening all of the variables, we conclude that a model including only three variables (total academic R&D expenditures, S&E postdoctorates, and S&E Ph.D. recipients) captures most of the explanatory ability of the entire set of potential explanatory variables. These explanatory variables are also highly correlated with publications as measured by fractional counts, with correlation coefficients of 0.913, 0.840, and 0.838, respectively. The coefficients for this model were 3.31 publications per $1M in academic R&D expenditures, 0.882 per S&E postdoctorate, and 1.18 per S&E Ph.D. recipient, with corresponding standard errors of 0.110, 0.019, and 0.057, respectively.
We also conducted analyses to determine whether there were two-factor interactions between total academic R&D expenditures, S&E postdoctorates, and S&E Ph.D. recipients, by adding these interactions as independent variables into our model. A statistically significant interaction term between academic R&D expenditures and S&E postdoctorates almost managed to reach the 1% threshold for model inclusion. Visual inspection of scatterplots of expected and observed average publications suggested that the improvement in the model’s fit was minimal, and we decided to exclude the interaction term.
8.2 Analyses of Whole Count Publications in the Expanding Journal Set
We repeated this process for publications as measured by whole counts in the expanding journal set. The set of variables in their order of entry into the regression and the cumulative r-square values after entry were as follows: 1) total academic R&D expenditures (0.816), 2) S&E postdoctorates (0.926), and 3) S&E Ph.D. recipients (0.936). These explanatory variables are also highly correlated with publications as measured by whole counts, with correlation coefficients of 0.903, 0.877, and 0.815, respectively. No other variable satisfied the 0.01 threshold. Cumulatively all variables accounted for an r-square of 0.959. The coefficients for this model were 4.78 publications per $1M in academic R&D expenditures, 1.66 per S&E postdoctorate, and 1.45 per S&E Ph.D. recipient, with corresponding standard errors of 0.15, 0.03, and 0.08, respectively.
Since both publications as measured by fractional and whole counts in the expanding journal set could be explained with the same three variables — total academic R&D expenditures, S&E postdoctorates, and S&E Ph.D. recipients — we retained these three variables for further analysis.19
19 For comparison purposes, we also fit a Hierarchical Linear Model (with years nested within institutions) using total academic R&D expenditures, postdoctorates, and S&E Ph.D. recipients as the explanatory variables and both publications as measured by fractional and whole counts in the expanding journal set as dependent variables. These three explanatory variables were statistically significant at the 0.0001 level in the HLM model using fractional and whole counts as dependent variables.
50
8.3 Path Analytic Model for Publication Counts
We developed a path analytic model under the assumption that total academic R&D expenditures have a direct and indirect effect on publications, where the indirect effect is through funding of some S&E postdoctorates and S&E Ph.D. recipients. We also assumed that S&E postdoctorates and S&E Ph.D. recipients have a direct effect on number of publications. A path analytic model allows total academic R&D expenditures to directly influence the number of S&E postdoctorates and S&E Ph.D. recipients, and for total academic R&D expenditures, the number of S&E postdoctorates, and the number of S&E Ph.D. recipients to directly influence the number of publications.
For publications as measured by fractional counts in the expanding journal set, the regression coefficient for total academic R&D expenditures was 3.31 (i.e., 3.31 publications per each $1M in academic R&D expenditures), the coefficient for S&E postdoctorates was 0.882, and the coefficient for S&E Ph.D. recipients was 1.18. We then performed a regression where the dependent variable was the number of S&E postdoctorates and the independent variable was total academic R&D expenditures. We found that each $1M additional funding was associated with an increase of 2.53 additional S&E postdoctorates (with a standard error of estimate of 0.05). A similar regression showed that each $1M in academic R&D funding was associated with an increase of 1.39 S&E Ph.D. recipients (with a standard error of estimate of 0.02). Thus, adding together the direct and indirect effects, we found that each $1M in academic R&D expenditures resulted in 7.18 (i.e., 3.31 + 0.882 x 2.53 + 1.18 x 1.39) publication counts (or expressed slightly differently, R&D expenditure per fractional publication count is about $139K ($1M/7.18)).
For publication counts as measured by whole counts in the expanding journal set, the regression coefficient for total academic R&D expenditures was 4.78 per $1M, the coefficient for S&E postdoctorates was 1.66, and the coefficient for S&E Ph.D. recipients was 1.45. The coefficient for total academic R&D expenditures regressed on the number of S&E postdoctorates was 2.53 per $1M. The coefficient for total academic R&D expenditures regressed on the number of S&E Ph.D. recipients was 1.39 per $1M. Consequently, adding together the direct and indirect effects, we find that each $1M in additional funding is associated with an increase of 11.0 (i.e., 4.78 + 1.66 x 2.53 + 1.45 x 1.39) publications as measured by whole counts (or, expressed slightly differently, R&D expenditure per whole count publication is about $91K ($1M/11.0)).
8.4 Visual Relationship Among Variables in the Path Model
Given that academic R&D expenditures, the number of S&E postdoctorates, the number of S&E Ph.D. recipients and publication counts are related, it is worthwhile to examine scatterplots of those relationships. Scatterplots were developed using variables averaged over the 1988 to 2001 time period at the institution level.
Figure 14 is a scatterplot of academic R&D expenditures versus number of S&E postdoctorates for the top 200 R&D performing R&D academic institutions. The number of S&E postdoctorates on staff decrease to zero as academic R&D expenditures decrease. There are institutions that expend academic R&D funds while employing few, if any, S&E postdoctorates. The outlier in the plot is Harvard University, which reported an average of 2,584 S&E postdoctorates and academic R&D expenditures of $221.2M (i.e., a modest average of $85,600
51
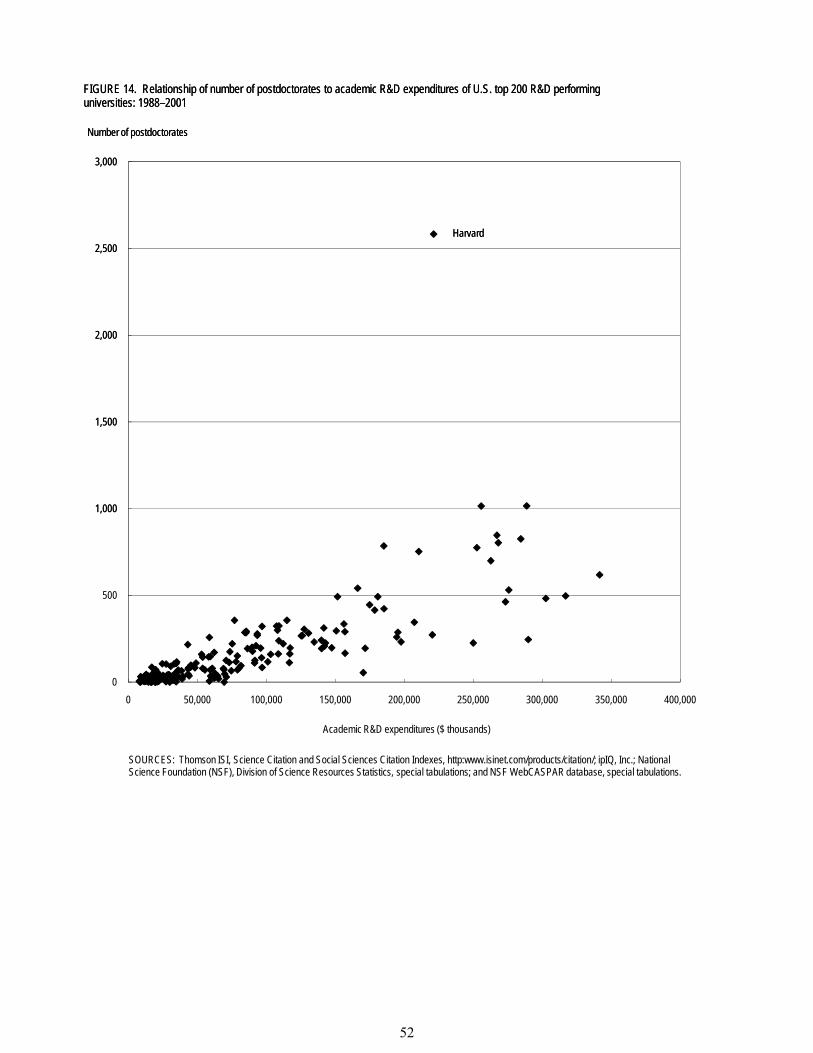
1,000
1,500
2,000
2,500
3,000
Number of postdoctorates
FIGURE 14. Relationship of number of postdoctorates to academic R&D expenditures of U.S. top 200 R&D performing universities: 1988–2001
Harvard
0
500
1,000
1,500
2,000
2,500
3,000
0 50,000 100,000 150,000 200,000 250,000 300,000 350,000 400,000
Number of postdoctorates
Academic R&D expenditures ($ thousands)
FIGURE 14. Relationship of number of postdoctorates to academic R&D expenditures of U.S. top 200 R&D performing universities: 1988–2001
SOURCES: Thomson ISI, Science Citation and Social Sciences Citation Indexes, http:www.isinet.com/products/citation/; ipIQ, Inc.; National Science Foundation (NSF), Division of Science Resources Statistics, special tabulations; and NSF WebCASPAR database, special tabulations.
Harvard
52
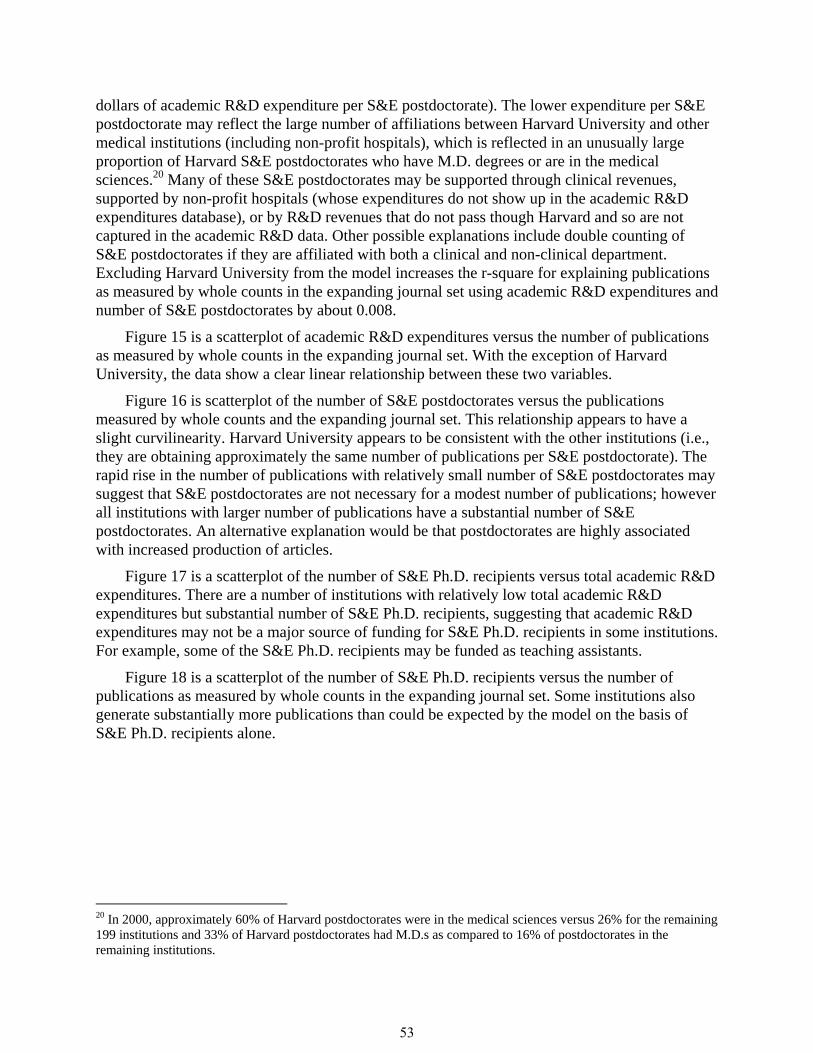
dollars of academic R&D expenditure per S&E postdoctorate). The lower expenditure per S&E postdoctorate may reflect the large number of affiliations between Harvard University and other medical institutions (including non-profit hospitals), which is reflected in an unusually large proportion of Harvard S&E postdoctorates who have M.D. degrees or are in the medical sciences.20 Many of these S&E postdoctorates may be supported through clinical revenues, supported by non-profit hospitals (whose expenditures do not show up in the academic R&D expenditures database), or by R&D revenues that do not pass though Harvard and so are not captured in the academic R&D data. Other possible explanations include double counting of S&E postdoctorates if they are affiliated with both a clinical and non-clinical department. Excluding Harvard University from the model increases the r-square for explaining publications as measured by whole counts in the expanding journal set using academic R&D expenditures and number of S&E postdoctorates by about 0.008.
Figure 15 is a scatterplot of academic R&D expenditures versus the number of publications as measured by whole counts in the expanding journal set. With the exception of Harvard University, the data show a clear linear relationship between these two variables.
Figure 16 is scatterplot of the number of S&E postdoctorates versus the publications measured by whole counts and the expanding journal set. This relationship appears to have a slight curvilinearity. Harvard University appears to be consistent with the other institutions (i.e., they are obtaining approximately the same number of publications per S&E postdoctorate). The rapid rise in the number of publications with relatively small number of S&E postdoctorates may suggest that S&E postdoctorates are not necessary for a modest number of publications; however all institutions with larger number of publications have a substantial number of S&E postdoctorates. An alternative explanation would be that postdoctorates are highly associated with increased production of articles.
Figure 17 is a scatterplot of the number of S&E Ph.D. recipients versus total academic R&D expenditures. There are a number of institutions with relatively low total academic R&D expenditures but substantial number of S&E Ph.D. recipients, suggesting that academic R&D expenditures may not be a major source of funding for S&E Ph.D. recipients in some institutions. For example, some of the S&E Ph.D. recipients may be funded as teaching assistants.
Figure 18 is a scatterplot of the number of S&E Ph.D. recipients versus the number of publications as measured by whole counts in the expanding journal set. Some institutions also generate substantially more publications than could be expected by the model on the basis of S&E Ph.D. recipients alone.
20 In 2000, approximately 60% of Harvard postdoctorates were in the medical sciences versus 26% for the remaining 199 institutions and 33% of Harvard postdoctorates had M.D.s as compared to 16% of postdoctorates in the remaining institutions.
53
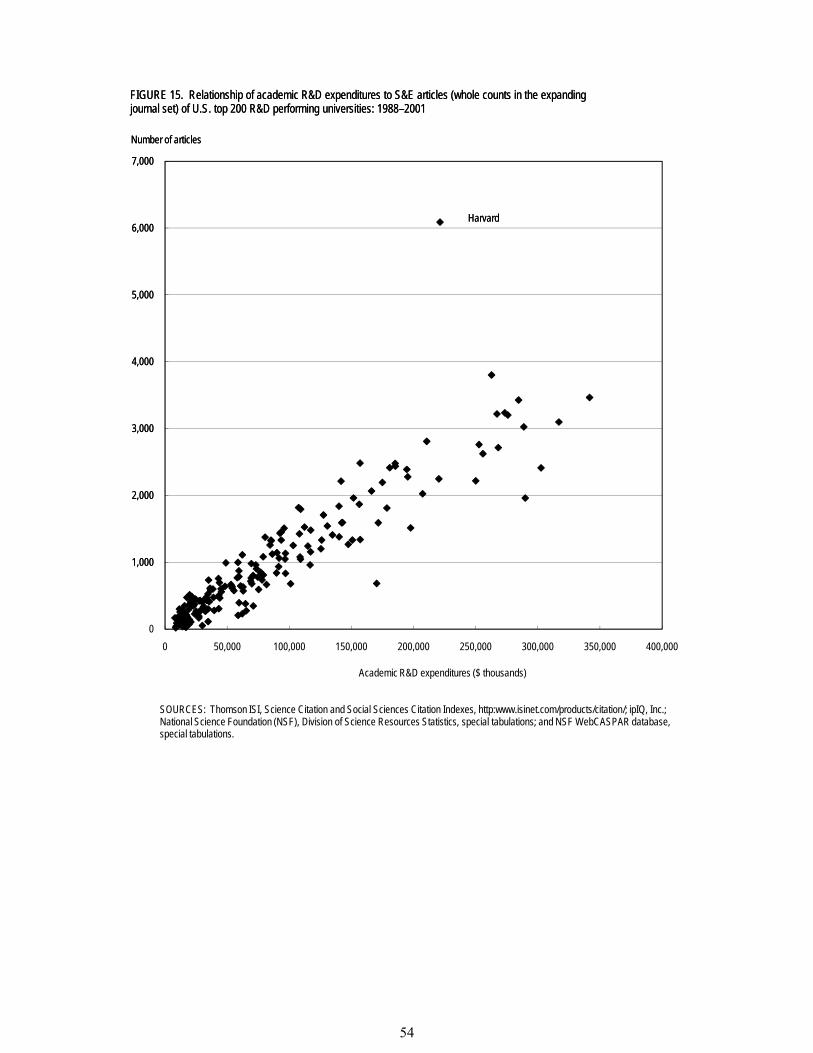
1,000
2,000
3,000
4,000
5,000
6,000
7,000
Number of articles
FIGURE 15. Relationship of academic R&D expenditures to S&E articles (whole counts in the expanding journal set) of U.S. top 200 R&D performing universities: 1988–2001
Harvard
0
1,000
2,000
3,000
4,000
5,000
6,000
7,000
0 50,000 100,000 150,000 200,000 250,000 300,000 350,000 400,000
Number of articles
Academic R&D expenditures ($ thousands)
FIGURE 15. Relationship of academic R&D expenditures to S&E articles (whole counts in the expanding journal set) of U.S. top 200 R&D performing universities: 1988–2001
SOURCES: Thomson ISI, Science Citation and Social Sciences Citation Indexes, http:www.isinet.com/products/citation/; ipIQ, Inc.; National Science Foundation (NSF), Division of Science Resources Statistics, special tabulations; and NSF WebCASPAR database,special tabulations.
Harvard
54
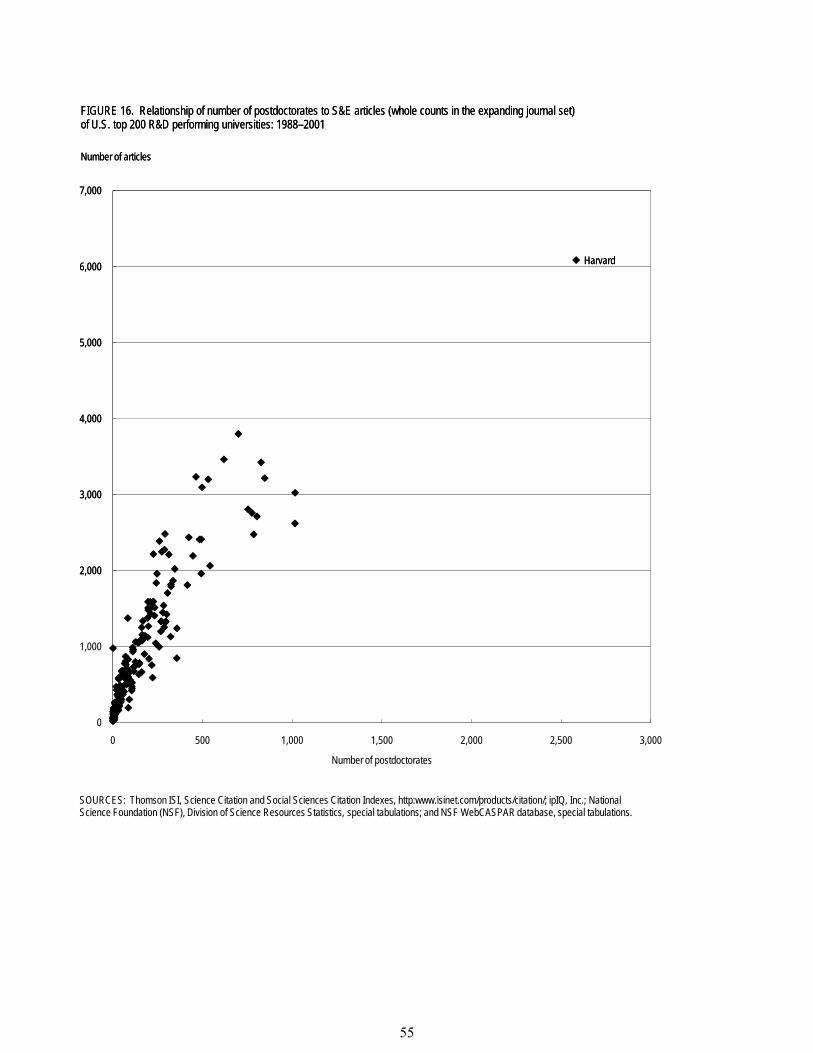
2,000
3,000
4,000
5,000
6,000
7,000
Number of articles
FIGURE 16. Relationship of number of postdoctorates to S&E articles (whole counts in the expanding journal set) of U.S. top 200 R&D performing universities: 1988–2001
Harvard
0
1,000
2,000
3,000
4,000
5,000
6,000
7,000
0 500 1,000 1,500 2,000 2,500 3,000
Number of articles
Number of postdoctorates
FIGURE 16. Relationship of number of postdoctorates to S&E articles (whole counts in the expanding journal set) of U.S. top 200 R&D performing universities: 1988–2001
SOURCES: Thomson ISI, Science Citation and Social Sciences Citation Indexes, http:www.isinet.com/products/citation/; ipIQ, Inc.; National Science Foundation (NSF), Division of Science Resources Statistics, special tabulations; and NSF WebCASPAR database, special tabulations.
Harvard
55
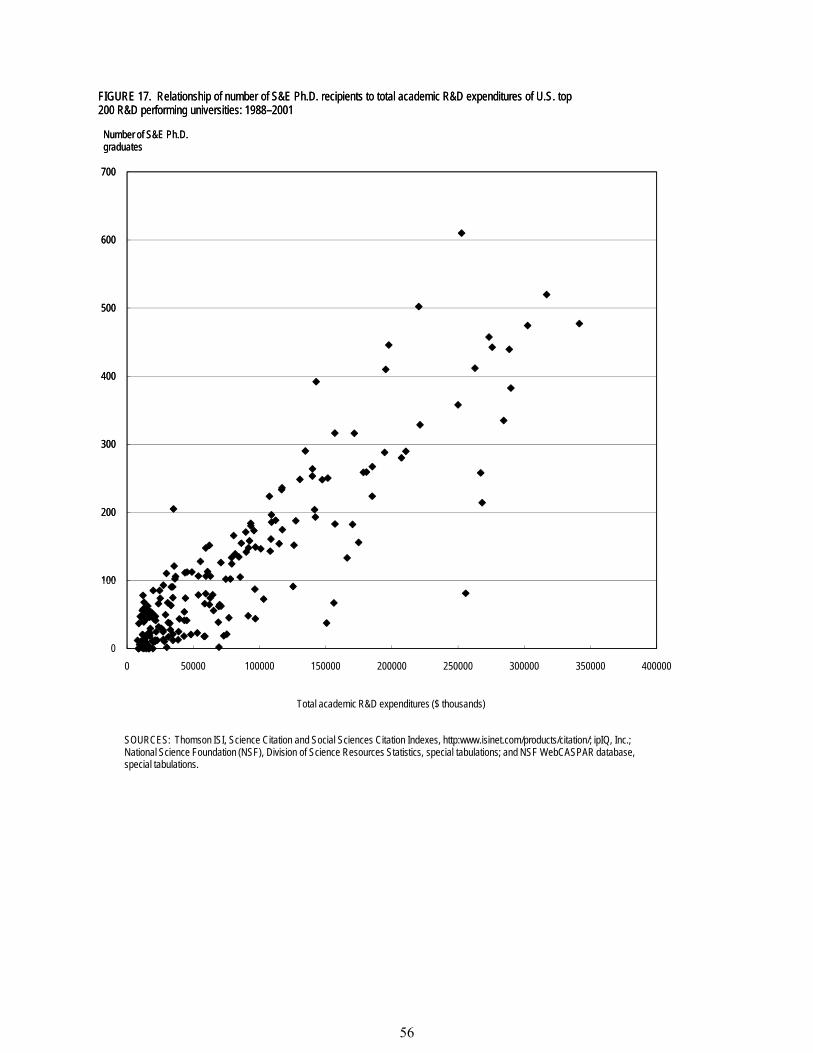
100
200
300
400
500
600
700
Number of S&E Ph.D. graduates
FIGURE 17. Relationship of number of S&E Ph.D. recipients to total academic R&D expenditures of U.S. top 200 R&D performing universities: 1988–2001
0
100
200
300
400
500
600
700
0 50000 100000 150000 200000 250000 300000 350000 400000
Number of S&E Ph.D. graduates
Total academic R&D expenditures ($ thousands)
FIGURE 17. Relationship of number of S&E Ph.D. recipients to total academic R&D expenditures of U.S. top 200 R&D performing universities: 1988–2001
SOURCES: Thomson ISI, Science Citation and Social Sciences Citation Indexes, http:www.isinet.com/products/citation/; ipIQ, Inc.; National Science Foundation (NSF), Division of Science Resources Statistics, special tabulations; and NSF WebCASPAR database,special tabulations.
56
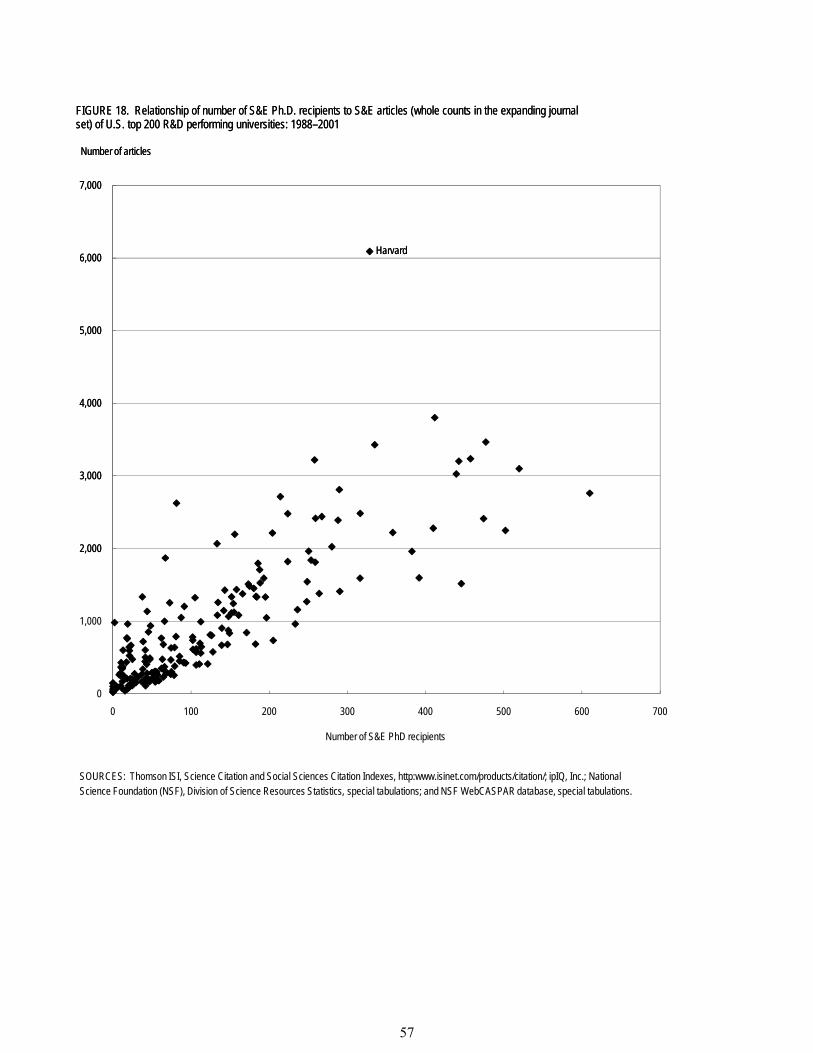
2,000
3,000
4,000
5,000
6,000
7,000
Number of articles
FIGURE 18. Relationship of number of S&E Ph.D. recipients to S&E articles (whole counts in the expanding journal set) of U.S. top 200 R&D performing universities: 1988–2001
Harvard
0
1,000
2,000
3,000
4,000
5,000
6,000
7,000
0 100 200 300 400 500 600 700
Number of articles
Number of S&E PhD recipients
FIGURE 18. Relationship of number of S&E Ph.D. recipients to S&E articles (whole counts in the expanding journal set) of U.S. top 200 R&D performing universities: 1988–2001
SOURCES: Thomson ISI, Science Citation and Social Sciences Citation Indexes, http:www.isinet.com/products/citation/; ipIQ, Inc.; National Science Foundation (NSF), Division of Science Resources Statistics, special tabulations; and NSF WebCASPAR database, special tabulations.
Harvard
57
9.0 Adequacy of Model Fit: Time Trends in Resource Utilization per Publication Count and Model Fit by Institutional Characteristic
This section examines the adequacy of the model fit for fractional and whole counts in an expanding data set. Section 9.1 examines the trend, over time, in the ratio of expected to observed publication counts. A clear linear trend over time is present for these ratios. For a given amount of resources (i.e., the average amount of academic R&D expenditures, S&E postdoctorates, and S&E doctoral recipients), the number of fractional publication counts produced has diminished by 29% from 1990 to 2001 and the number of whole publication counts has diminished by 10%. Possible reasons for these reductions are discussed.
Sections 9.2 to 9.7 examine the fit of expected to observed publications: 1) by institution (to examine whether there were differences in the model’s fit across institutions); 2) for private Research I (R-1) institutions (to determine if the model fit could be improved by separately fitting these institutions); 3) for institutions with substantial patenting activity; 4) for institutions with higher collaboration index values, 5) for institutions with higher relative citation index values, and 6) for institutions with higher National Research Council (NRC) quality ratings. None of these investigations resulted in modifications to the model.
We found that the correlation between the expected and observed publication counts for individual institutions is very high with no obvious outliers. The fit to private R-1 institutions cannot be substantially improved by fitting a separate model. Even though the three institutions with the highest patenting level have smaller publication counts than expected, there is insufficient evidence to conclude that patenting activity has led to reductions in publication counts. Accounting for differences in the degree of collaboration among institutions did not substantially increase the explanatory ability of the model (suggesting that increases in collaboration have been fairly consistent across institutions). Although institutions with higher relative citation indices tended to have slightly more publications than expected, the evidence for including the relative citation index in the model is relatively weak. Finally, NRC quality ratings were only weakly associated with publication counts21 (which may be due to the presence of many different journals at varying quality levels). Cumulatively these findings suggest that once we account for total academic expenditures, the number of S&E postdoctorates, and the number of S&E Ph.D. recipients, other factors not captured by these three variables do not contribute further explanatory power for article production.
9.1 Trends in the Ratio of Expected and Observed Publication Counts
To examine the relationship of expected and observed publications, we modeled the number of publications as measured by fractional counts in the expanding journal set for the top 200 R&D performing academic institutions. We found that 3 variables were strongly associated with publication counts: 1) total academic R&D expenditures, 2) S&E postdoctorates, and 3) S&E Ph.D. recipients. However, to achieve near comparability with results by field groups (described
21 However, as discussed in the appendix on relative citation counts, the NRC rating is highly associated with the ratio of citation counts to publication counts. The latter may be a measure of the influence or quality of the publication.
58
later), we added four more variables to the model: 1) academic R&D expenditures funded by “other” sources (primarily foundations), 2) R&D basic research expenses (a component of total academic R&D expenses), 3) total S&E degrees awarded by field, and 4) 1994 Carnegie R-1 class.22 23 Addition of these variables increased the r-square by slightly less than 0.01, indicating that they did not substantially increase the fit of the model.
We conclude that the relationship between resource inputs and publication outputs has changed over time. Figure 19 shows a plot of the ratio of the average yearly observed to expected publications as measured by fractional and whole counts. (The plot is missing the ratio for 2000 because S&E degrees awarded was not available for 1999; ratios for 1988 and 1989 are missing because the financial variables were lagged by 2 years and were only available starting in 1988). There was a clear linear trend in the ratio of average yearly observed to expected fractional publications over time, decreasing from 1.141 in 1990 to 0.887 in 2001, indicating that there were more observed than expected publications in earlier years and that there were fewer observed publications than expected publications in the later years. This trend suggests that it took a greater amount of resource inputs included in the model to produce a given number of fractional publication counts in 2001 than in 1990. The resources in the model associated with production of a fractional count of 1.0 in 1990 were associated with a fractional count of 0.777 (i.e., 0.887 / 1.141) in 2001, or equivalently that the resources associated with a production of one fractional count in 2001 were associated with a fractional count of 1.29 (i.e., 1.141/0.887) in 1990. This implies that the cost per each fractional count in 2001 was 29% more than in 1990.24
We repeated this analysis for publications as measured by whole counts in the expanding journal set.25 Figure 19 shows a plot of the ratio of the average publication count in the expanding journal set to the average expected publication count by year. Also shown is the least squares line of best fit. Although the ratio of average yearly observed to expected whole count publications exhibited a decline over time, this trend did not fit as well compared to fractional counts. (Whereas the r-square value for the regression of year on the ratio of expected to observed fractional publication counts was 0.980, the r-square value for the regression of year on the ratio of observed to expected whole count publications was 0.862). More importantly, the range of ratios was narrower than for fractional counts. Using the values on the best fit line, observed publications were about 4.7% larger than expected in 1990 and 4.8% smaller in 2001. Equivalently, the resources associated with production of a whole count of 1.0 in 1990 were associated with a whole count of 0.909 (i.e., 0.952/1.047) in 2001. This implies that cost per whole count increased by 10% from 1990 to 2001.
22 These seven variables were those that provided a satisfactory fit for all of the field groups when the dependent variable was the first principal component of publications and citations. Only six of these variables were required when the dependent variable was either publications as measured by fractional or whole counts in the expanding journal set. 23 See Exhibit H-1 for regression output. 24 A simple example using only financial resources will clarify the calculations. Suppose that it costs $100K in resources to produce one fractional count in 1990 and $150K in 2001, and that the model estimates $125K. Then each $125K will produce 1.25 fractional counts in 1990 and 0.833 fractional counts in 2001, yielding ratios of observed to expected counts of 1.25 and 0.833, respectively. The ratio 1.25/0.833 = 1.5 indicates that the cost per fractional count increased by 50% from 1990 to 2001; the ratio 0.833/1.25 = 0.667 indicates that the cost per fractional count in 1990 was 33.3% lower in 1990 than 2001. 25 See Exhibit H-2 for regression output.
59
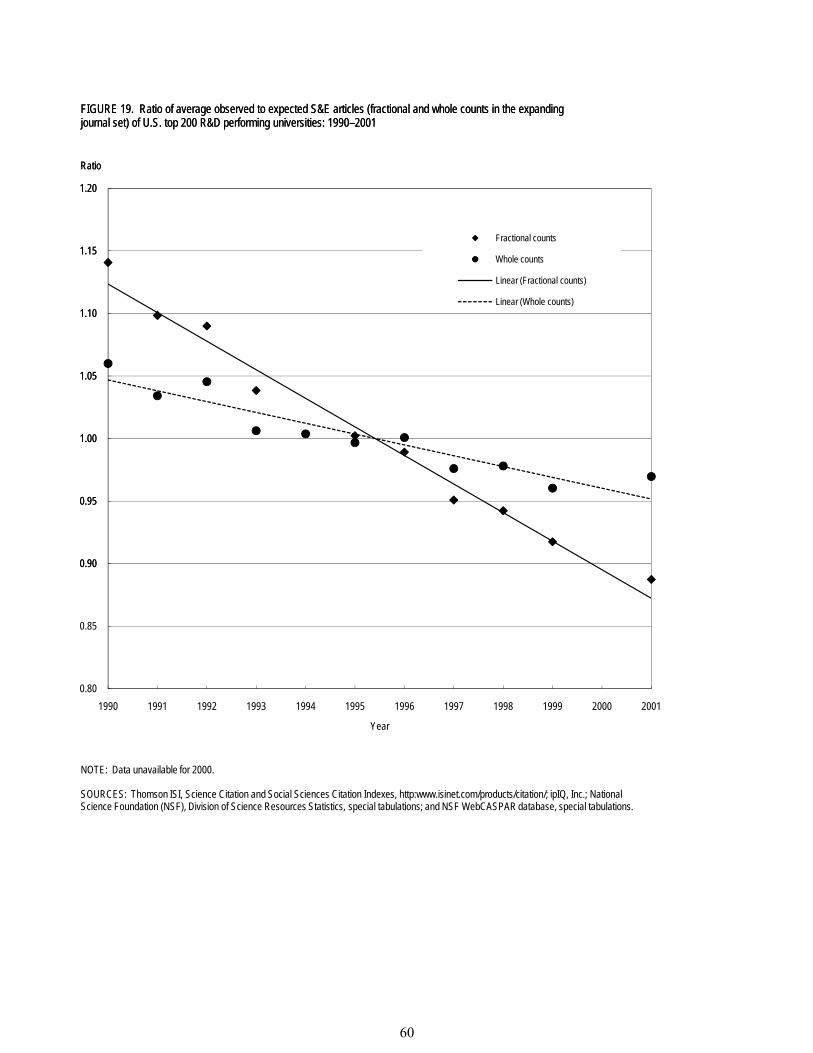
0.90
0.95
1.00
1.05
1.10
1.15
1.20
Ratio
FIGURE 19. Ratio of average observed to expected S&E articles (fractional and whole counts in the expanding journal set) of U.S. top 200 R&D performing universities: 1990–2001
Fractional counts
Whole counts
Linear (Fractional counts)
Linear (Whole counts)
0.80
0.85
0.90
0.95
1.00
1.05
1.10
1.15
1.20
1990 1991 1992 1993 1994 1995 1996 1997 1998 1999 2000 2001
Ratio
Year
FIGURE 19. Ratio of average observed to expected S&E articles (fractional and whole counts in the expanding journal set) of U.S. top 200 R&D performing universities: 1990–2001
Fractional counts
Whole counts
Linear (Fractional counts)
Linear (Whole counts)
NOTE: Data unavailable for 2000.
SOURCES: Thomson ISI, Science Citation and Social Sciences Citation Indexes, http:www.isinet.com/products/citation/; ipIQ, Inc.; National Science Foundation (NSF), Division of Science Resources Statistics, special tabulations; and NSF WebCASPAR database, special tabulations.
60
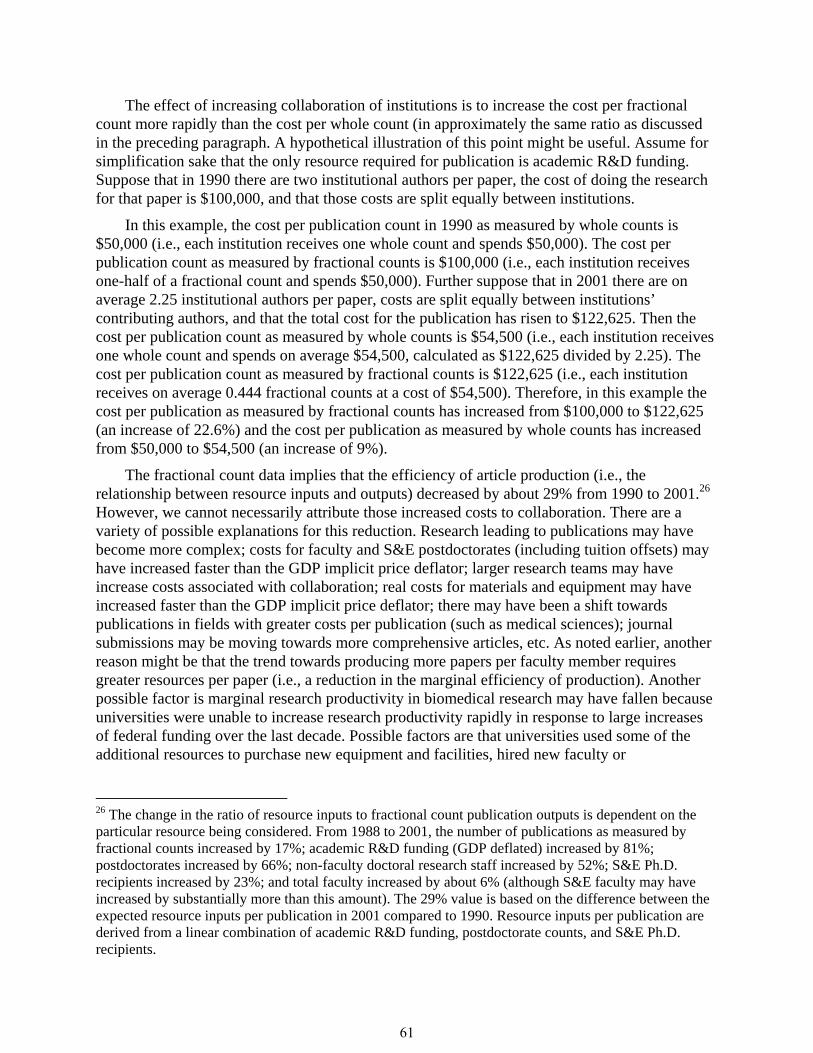
The effect of increasing collaboration of institutions is to increase the cost per fractional count more rapidly than the cost per whole count (in approximately the same ratio as discussed in the preceding paragraph. A hypothetical illustration of this point might be useful. Assume for simplification sake that the only resource required for publication is academic R&D funding. Suppose that in 1990 there are two institutional authors per paper, the cost of doing the research for that paper is $100,000, and that those costs are split equally between institutions.
In this example, the cost per publication count in 1990 as measured by whole counts is $50,000 (i.e., each institution receives one whole count and spends $50,000). The cost per publication count as measured by fractional counts is $100,000 (i.e., each institution receives one-half of a fractional count and spends $50,000). Further suppose that in 2001 there are on average 2.25 institutional authors per paper, costs are split equally between institutions’ contributing authors, and that the total cost for the publication has risen to $122,625. Then the cost per publication count as measured by whole counts is $54,500 (i.e., each institution receives one whole count and spends on average $54,500, calculated as $122,625 divided by 2.25). The cost per publication count as measured by fractional counts is $122,625 (i.e., each institution receives on average 0.444 fractional counts at a cost of $54,500). Therefore, in this example the cost per publication as measured by fractional counts has increased from $100,000 to $122,625 (an increase of 22.6%) and the cost per publication as measured by whole counts has increased from $50,000 to $54,500 (an increase of 9%).
The fractional count data implies that the efficiency of article production (i.e., the relationship between resource inputs and outputs) decreased by about 29% from 1990 to 2001.26 However, we cannot necessarily attribute those increased costs to collaboration. There are a variety of possible explanations for this reduction. Research leading to publications may have become more complex; costs for faculty and S&E postdoctorates (including tuition offsets) may have increased faster than the GDP implicit price deflator; larger research teams may have increase costs associated with collaboration; real costs for materials and equipment may have increased faster than the GDP implicit price deflator; there may have been a shift towards publications in fields with greater costs per publication (such as medical sciences); journal submissions may be moving towards more comprehensive articles, etc. As noted earlier, another reason might be that the trend towards producing more papers per faculty member requires greater resources per paper (i.e., a reduction in the marginal efficiency of production). Another possible factor is marginal research productivity in biomedical research may have fallen because universities were unable to increase research productivity rapidly in response to large increases of federal funding over the last decade. Possible factors are that universities used some of the additional resources to purchase new equipment and facilities, hired new faculty or
26 The change in the ratio of resource inputs to fractional count publication outputs is dependent on the particular resource being considered. From 1988 to 2001, the number of publications as measured by fractional counts increased by 17%; academic R&D funding (GDP deflated) increased by 81%; postdoctorates increased by 66%; non-faculty doctoral research staff increased by 52%; S&E Ph.D. recipients increased by 23%; and total faculty increased by about 6% (although S&E faculty may have increased by substantially more than this amount). The 29% value is based on the difference between the expected resource inputs per publication in 2001 compared to 1990. Resource inputs per publication are derived from a linear combination of academic R&D funding, postdoctorate counts, and S&E Ph.D. recipients.
61
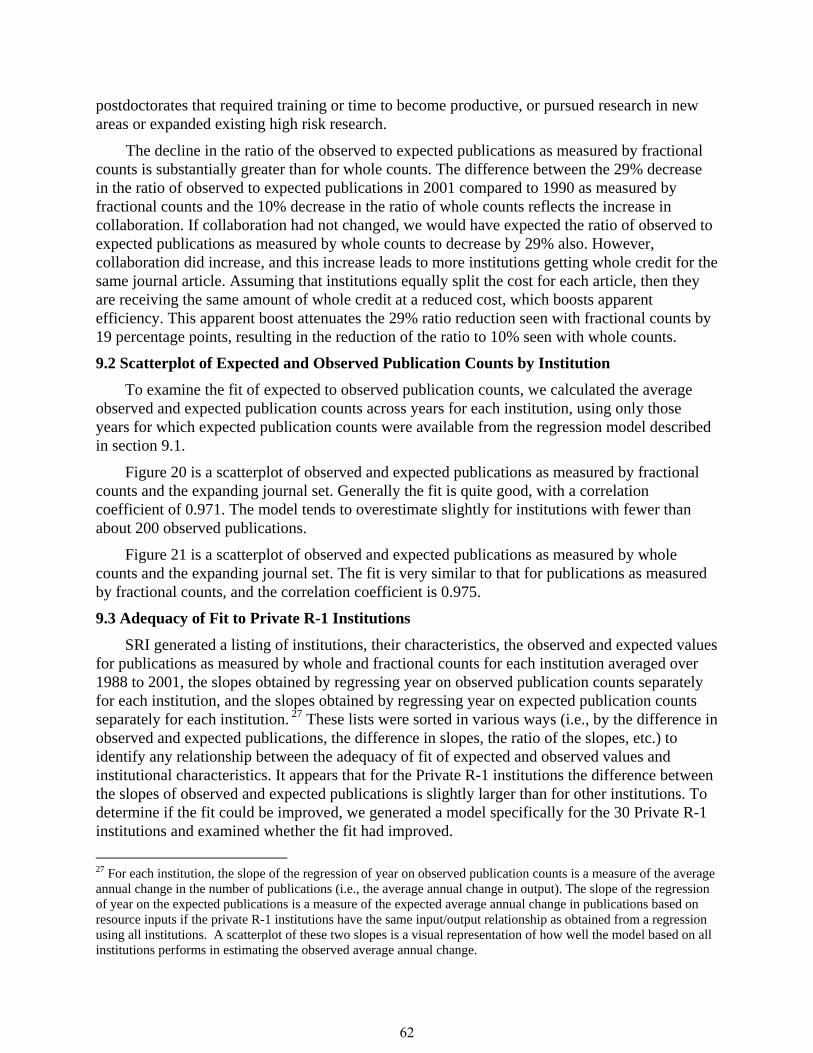
postdoctorates that required training or time to become productive, or pursued research in new areas or expanded existing high risk research.
The decline in the ratio of the observed to expected publications as measured by fractional counts is substantially greater than for whole counts. The difference between the 29% decrease in the ratio of observed to expected publications in 2001 compared to 1990 as measured by fractional counts and the 10% decrease in the ratio of whole counts reflects the increase in collaboration. If collaboration had not changed, we would have expected the ratio of observed to expected publications as measured by whole counts to decrease by 29% also. However, collaboration did increase, and this increase leads to more institutions getting whole credit for the same journal article. Assuming that institutions equally split the cost for each article, then they are receiving the same amount of whole credit at a reduced cost, which boosts apparent efficiency. This apparent boost attenuates the 29% ratio reduction seen with fractional counts by 19 percentage points, resulting in the reduction of the ratio to 10% seen with whole counts.
9.2 Scatterplot of Expected and Observed Publication Counts by Institution
To examine the fit of expected to observed publication counts, we calculated the average observed and expected publication counts across years for each institution, using only those years for which expected publication counts were available from the regression model described in section 9.1.
Figure 20 is a scatterplot of observed and expected publications as measured by fractional counts and the expanding journal set. Generally the fit is quite good, with a correlation coefficient of 0.971. The model tends to overestimate slightly for institutions with fewer than about 200 observed publications.
Figure 21 is a scatterplot of observed and expected publications as measured by whole counts and the expanding journal set. The fit is very similar to that for publications as measured by fractional counts, and the correlation coefficient is 0.975.
9.3 Adequacy of Fit to Private R-1 Institutions
SRI generated a listing of institutions, their characteristics, the observed and expected values for publications as measured by whole and fractional counts for each institution averaged over 1988 to 2001, the slopes obtained by regressing year on observed publication counts separately for each institution, and the slopes obtained by regressing year on expected publication counts separately for each institution. 27 These lists were sorted in various ways (i.e., by the difference in observed and expected publications, the difference in slopes, the ratio of the slopes, etc.) to identify any relationship between the adequacy of fit of expected and observed values and institutional characteristics. It appears that for the Private R-1 institutions the difference between the slopes of observed and expected publications is slightly larger than for other institutions. To determine if the fit could be improved, we generated a model specifically for the 30 Private R-1 institutions and examined whether the fit had improved.
27 For each institution, the slope of the regression of year on observed publication counts is a measure of the average annual change in the number of publications (i.e., the average annual change in output). The slope of the regression of year on the expected publications is a measure of the expected average annual change in publications based on resource inputs if the private R-1 institutions have the same input/output relationship as obtained from a regression using all institutions. A scatterplot of these two slopes is a visual representation of how well the model based on all institutions performs in estimating the observed average annual change.
62

1,000
1,500
2,000
2,500
3,000
3,500
FIGURE 20. Observed and expected S&E articles (fractional counts in the expanding journal set) for U.S. top 200 R&D performing universities: 1988–2001 average
45 degree line Best fit line
Average expected articles
0
500
1,000
1,500
2,000
2,500
3,000
3,500
0 500 1,000 1,500 2,000 2,500 3,000 3,500
Average observed articles
FIGURE 20. Observed and expected S&E articles (fractional counts in the expanding journal set) for U.S. top 200 R&D performing universities: 1988–2001 average
SOURCES: Thomson ISI, Science Citation and Social Sciences Citation Indexes, http:www.isinet.com/products/citation/; ipIQ, Inc.; National Science Foundation (NSF), Division of Science Resources Statistics, special tabulations; and NSF WebCASPAR database, special tabulations.
45 degree line Best fit line
Average expected articles
63
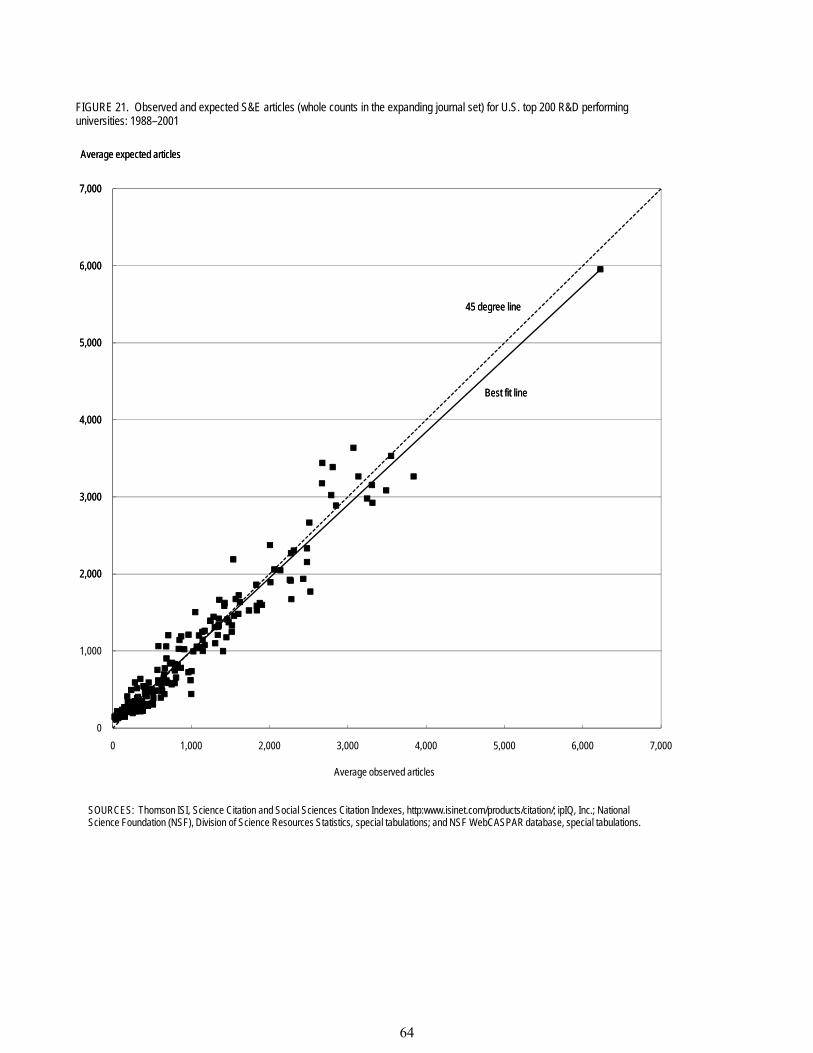
2,000
3,000
4,000
5,000
6,000
7,000
Average expected articles
45 degree line
Best fit line
FIGURE 21. Observed and expected S&E articles (whole counts in the expanding journal set) for U.S. top 200 R&D performing universities: 1988–2001
0
1,000
2,000
3,000
4,000
5,000
6,000
7,000
0 1,000 2,000 3,000 4,000 5,000 6,000 7,000
Average expected articles
Average observed articles
SOURCES: Thomson ISI, Science Citation and Social Sciences Citation Indexes, http:www.isinet.com/products/citation/; ipIQ, Inc.; National Science Foundation (NSF), Division of Science Resources Statistics, special tabulations; and NSF WebCASPAR database, special tabulations.
45 degree line
Best fit line
FIGURE 21. Observed and expected S&E articles (whole counts in the expanding journal set) for U.S. top 200 R&D performing universities: 1988–2001
64
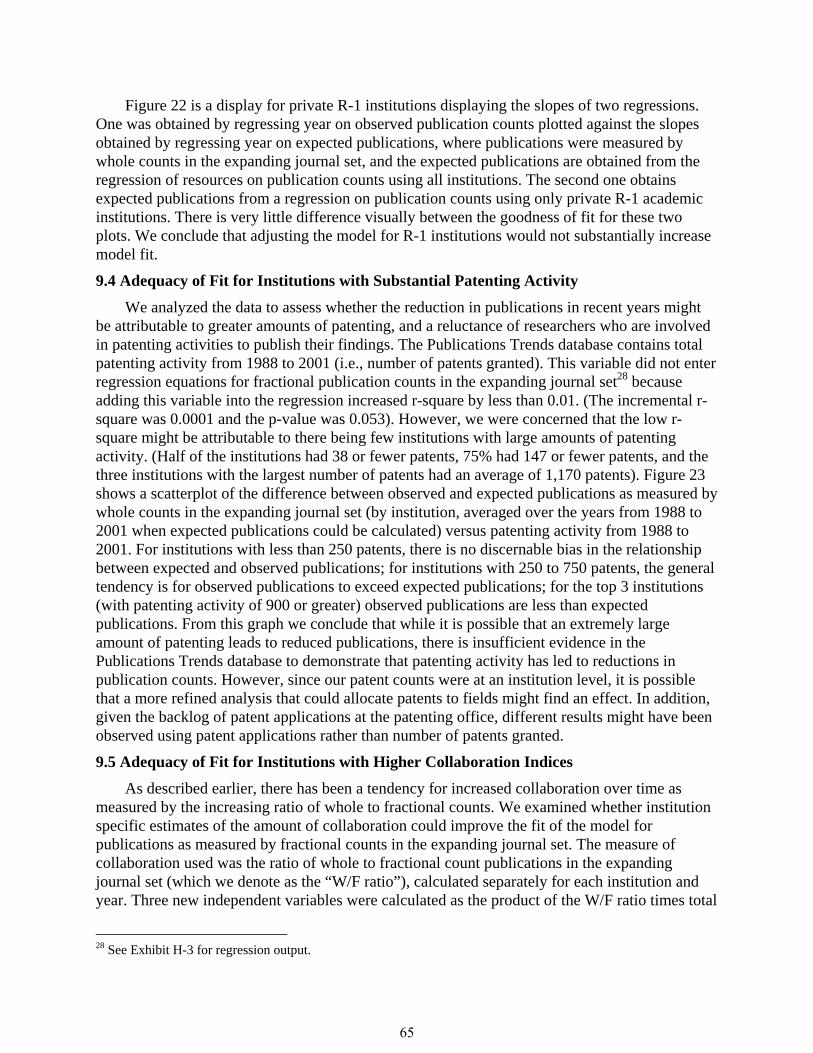
Figure 22 is a display for private R-1 institutions displaying the slopes of two regressions. One was obtained by regressing year on observed publication counts plotted against the slopes obtained by regressing year on expected publications, where publications were measured by whole counts in the expanding journal set, and the expected publications are obtained from the regression of resources on publication counts using all institutions. The second one obtains expected publications from a regression on publication counts using only private R-1 academic institutions. There is very little difference visually between the goodness of fit for these two plots. We conclude that adjusting the model for R-1 institutions would not substantially increase model fit.
9.4 Adequacy of Fit for Institutions with Substantial Patenting Activity
We analyzed the data to assess whether the reduction in publications in recent years might be attributable to greater amounts of patenting, and a reluctance of researchers who are involved in patenting activities to publish their findings. The Publications Trends database contains total patenting activity from 1988 to 2001 (i.e., number of patents granted). This variable did not enter regression equations for fractional publication counts in the expanding journal set28 because adding this variable into the regression increased r-square by less than 0.01. (The incremental r-square was 0.0001 and the p-value was 0.053). However, we were concerned that the low r-square might be attributable to there being few institutions with large amounts of patenting activity. (Half of the institutions had 38 or fewer patents, 75% had 147 or fewer patents, and the three institutions with the largest number of patents had an average of 1,170 patents). Figure 23 shows a scatterplot of the difference between observed and expected publications as measured by whole counts in the expanding journal set (by institution, averaged over the years from 1988 to 2001 when expected publications could be calculated) versus patenting activity from 1988 to 2001. For institutions with less than 250 patents, there is no discernable bias in the relationship between expected and observed publications; for institutions with 250 to 750 patents, the general tendency is for observed publications to exceed expected publications; for the top 3 institutions (with patenting activity of 900 or greater) observed publications are less than expected publications. From this graph we conclude that while it is possible that an extremely large amount of patenting leads to reduced publications, there is insufficient evidence in the Publications Trends database to demonstrate that patenting activity has led to reductions in publication counts. However, since our patent counts were at an institution level, it is possible that a more refined analysis that could allocate patents to fields might find an effect. In addition, given the backlog of patent applications at the patenting office, different results might have been observed using patent applications rather than number of patents granted.
9.5 Adequacy of Fit for Institutions with Higher Collaboration Indices
As described earlier, there has been a tendency for increased collaboration over time as measured by the increasing ratio of whole to fractional counts. We examined whether institution specific estimates of the amount of collaboration could improve the fit of the model for publications as measured by fractional counts in the expanding journal set. The measure of collaboration used was the ratio of whole to fractional count publications in the expanding journal set (which we denote as the “W/F ratio”), calculated separately for each institution and year. Three new independent variables were calculated as the product of the W/F ratio times total
28 See Exhibit H-3 for regression output.
65
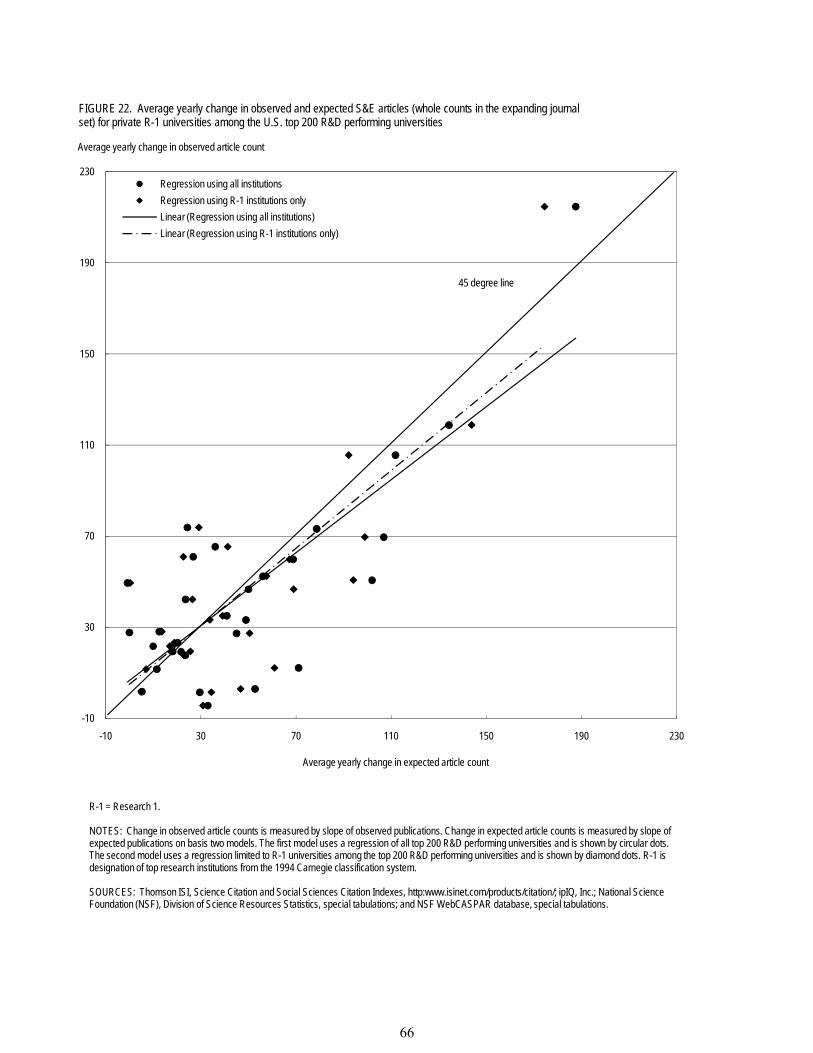
70
110
150
190
230
FIGURE 22. Average yearly change in observed and expected S&E articles (whole counts in the expanding journal set) for private R-1 universities among the U.S. top 200 R&D performing universities
Regression using all institutionsRegression using R-1 institutions onlyLinear (Regression using all institutions)Linear (Regression using R-1 institutions only)
45 degree line
Average yearly change in observed article count
-10
30
70
110
150
190
230
-10 30 70 110 150 190 230
Average yearly change in expected article count
FIGURE 22. Average yearly change in observed and expected S&E articles (whole counts in the expanding journal set) for private R-1 universities among the U.S. top 200 R&D performing universities
Regression using all institutionsRegression using R-1 institutions onlyLinear (Regression using all institutions)Linear (Regression using R-1 institutions only)
R-1 = Research 1.
NOTES: Change in observed article counts is measured by slope of observed publications. Change in expected article counts is measured by slope of expected publications on basis two models. The first model uses a regression of all top 200 R&D performing universities and is shown by circular dots. The second model uses a regression limited to R-1 universities among the top 200 R&D performing universities and is shown by diamond dots. R-1 is designation of top research institutions from the 1994 Carnegie classification system.
SOURCES: Thomson ISI, Science Citation and Social Sciences Citation Indexes, http:www.isinet.com/products/citation/; ipIQ, Inc.; National Science Foundation (NSF), Division of Science Resources Statistics, special tabulations; and NSF WebCASPAR database, special tabulations.
45 degree line
Average yearly change in observed article count
66
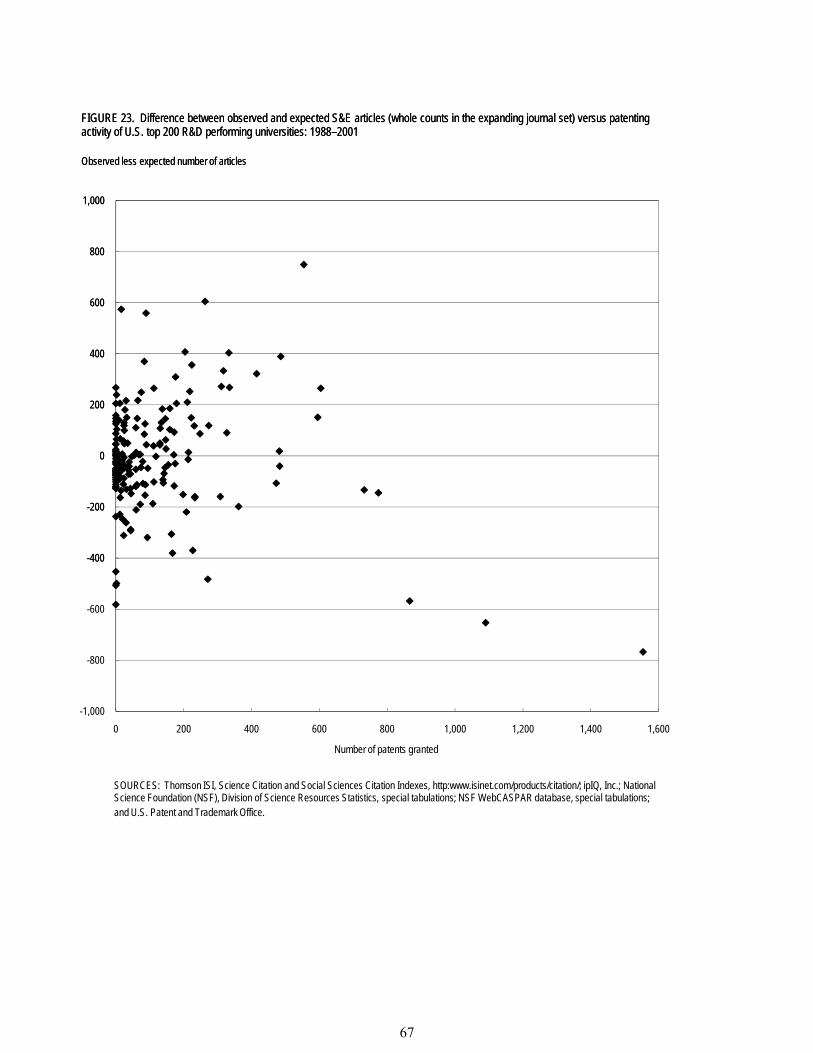
-400
-200
0
200
400
600
800
1,000
FIGURE 23. Difference between observed and expected S&E articles (whole counts in the expanding journal set) versus patenting activity of U.S. top 200 R&D performing universities: 1988–2001
Observed less expected number of articles
-1,000
-800
-600
-400
-200
0
200
400
600
800
1,000
0 200 400 600 800 1,000 1,200 1,400 1,600
Number of patents granted
SOURCES: Thomson ISI, Science Citation and Social Sciences Citation Indexes, http:www.isinet.com/products/citation/; ipIQ, Inc.; National Science Foundation (NSF), Division of Science Resources Statistics, special tabulations; NSF WebCASPAR database, special tabulations; and U.S. Patent and Trademark Office.
FIGURE 23. Difference between observed and expected S&E articles (whole counts in the expanding journal set) versus patenting activity of U.S. top 200 R&D performing universities: 1988–2001
Observed less expected number of articles
67
academic R&D expenditures, S&E postdoctorates, and number of S&E Ph.D. recipients. The original three (unmodified) variables explain 91.9% of the variation in fractional publications counts,29 the three W/F-modified variables explain 93.0%.30 Thus, adjusting for collaboration results in a slight increase in the explanatory ability of the model.
Figure 24 is a scatterplot of difference between observed and expected S&E publications as measured by whole counts in the expanding journal set versus the ratio of whole to fractional publication counts. Each point represents a single institution over the period from 1988 to 2001. Figure 25 shows a scatterplot of the difference between observed and expected S&E publications as measured by fractional counts in the expanding journal set versus the ratio of whole to fractional publication counts. Generally there is no trend indicating over- or under-estimation as a function of the amount of collaboration and the variability in the difference between the observed and expected publications are comparable over the range of collaboration exemplified by the vast majority of the institutions. There may be a small tendency for a better fit for those few institutions with very high levels of collaboration (i.e., an index of 1.7 or greater).
9.6 Adequacy of Fit for Institutions with Higher Relative Citation Indices
We sought to determine whether the number of publications at an institution is related to the quality of its publications. At the institutional level, one possible measure of quality of publications is the citation to publication ratio (i.e., the relative citation index). We calculated the ratio of all citations from 1992 to 2001 to all publications from 1988 to 1999 as a simplified measure of this index. Figure 26 shows a scatterplot of the difference between observed and expected publications (using whole counts in the expanding journal set) by institution on the vertical axis and the relative citation index on the horizontal axis. There is a modest tendency for institutions with higher relative citation indices to produce more publications than could be explained by resource inputs alone. When the relative citation index is less than 10.0, the average number of publications is 400 and the average number of expected publications is 465, for a net overestimation of 65 or 16%. When the relative citation index is 10 or greater, the average number of publications is 1,345 and the average number of expected publications is 1,307, for a net underestimation of 38 or 3%. The correlation between the difference in observed and expected publication counts and the relative citation index is small (0.12); the correlation between the ratio of observed to expected publication counts and the relative citation index is 0.35.
To examine whether the relative citation index could improve the regression equation, we defined the relative citation index for a given year as the ratio of number of citations that occur two years in the future to the count of publications occurring in the three year period ending in the given year. For example, we defined the relative citation index for 1992 to be the number of citations in 1994 using whole counts in the expanding journal set to all publications in 1990, 1991, and 1992. We added the relative citation index to a regression model with total academic R&D expenditures, number of S&E postdoctorates, and number of Ph.D. recipients, along with the interaction of that index with the other three independent variables. The r-square for explaining whole publication counts in the expanding journal set increased from 0.93431 to
29 See Exhibit H-4 for regression output. 30 See Exhibit H-5 for regression output. 31 See Exhibit H-6 for regression output.
68
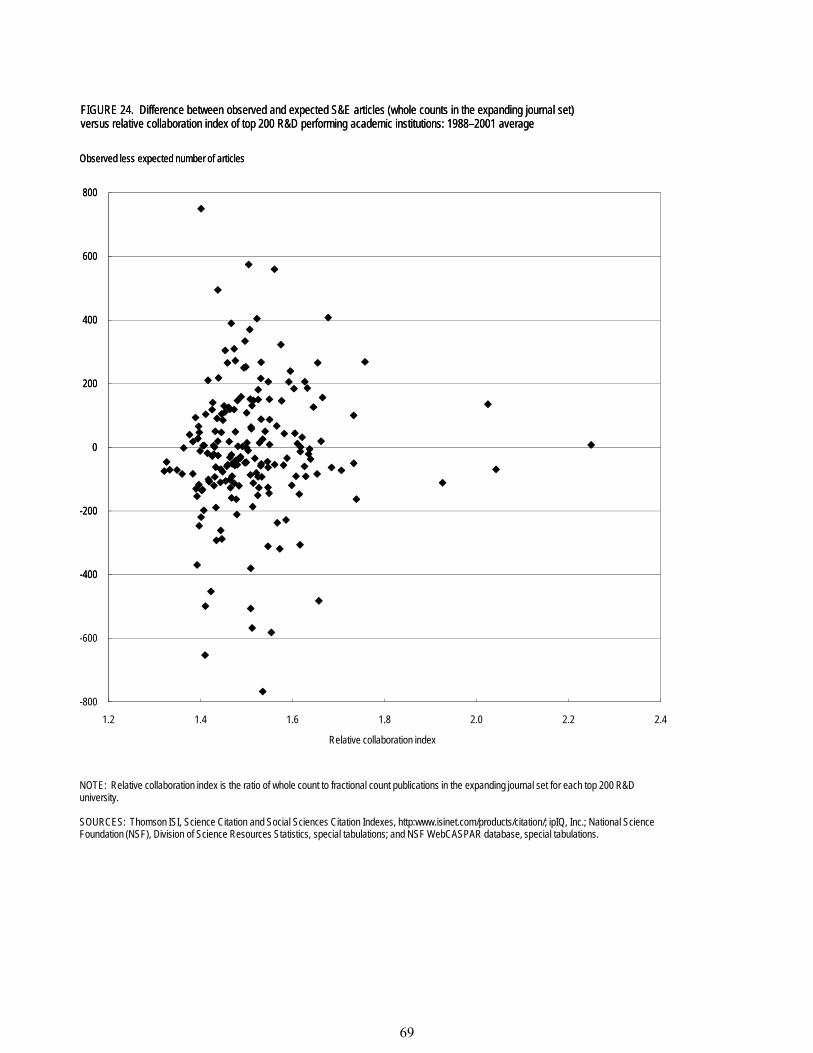
-400
-200
0
200
400
600
800
FIGURE 24. Difference between observed and expected S&E articles (whole counts in the expanding journal set) versus relative collaboration index of top 200 R&D performing academic institutions: 1988–2001 average
Observed less expected number of articles
-800
-600
-400
-200
0
200
400
600
800
1.2 1.4 1.6 1.8 2.0 2.2 2.4
Relative collaboration index
FIGURE 24. Difference between observed and expected S&E articles (whole counts in the expanding journal set) versus relative collaboration index of top 200 R&D performing academic institutions: 1988–2001 average
NOTE: Relative collaboration index is the ratio of whole count to fractional count publications in the expanding journal set for each top 200 R&D university.
SOURCES: Thomson ISI, Science Citation and Social Sciences Citation Indexes, http:www.isinet.com/products/citation/; ipIQ, Inc.; National Science Foundation (NSF), Division of Science Resources Statistics, special tabulations; and NSF WebCASPAR database, special tabulations.
Observed less expected number of articles
69
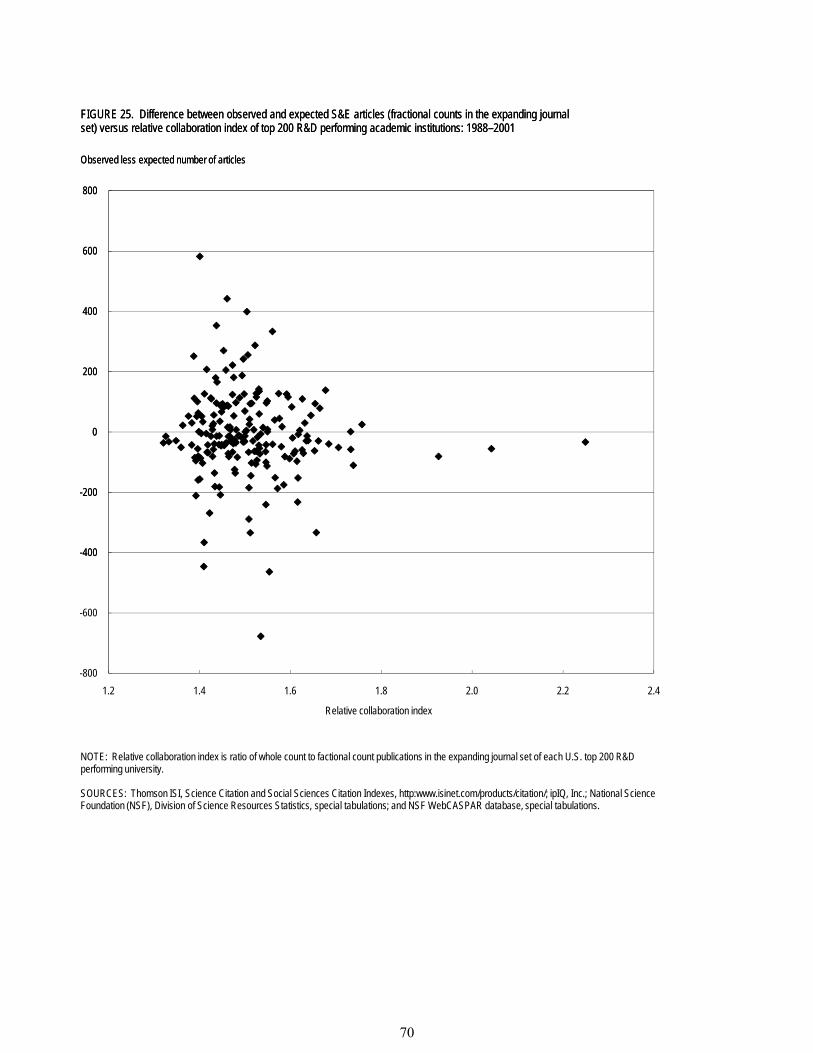
-400
-200
0
200
400
600
800
FIGURE 25. Difference between observed and expected S&E articles (fractional counts in the expanding journal set) versus relative collaboration index of top 200 R&D performing academic institutions: 1988–2001
Observed less expected number of articles
-800
-600
-400
-200
0
200
400
600
800
1.2 1.4 1.6 1.8 2.0 2.2 2.4
Relative collaboration index
FIGURE 25. Difference between observed and expected S&E articles (fractional counts in the expanding journal set) versus relative collaboration index of top 200 R&D performing academic institutions: 1988–2001
NOTE: Relative collaboration index is ratio of whole count to factional count publications in the expanding journal set of each U.S. top 200 R&D performing university.
SOURCES: Thomson ISI, Science Citation and Social Sciences Citation Indexes, http:www.isinet.com/products/citation/; ipIQ, Inc.; National Science Foundation (NSF), Division of Science Resources Statistics, special tabulations; and NSF WebCASPAR database, special tabulations.
Observed less expected number of articles
70
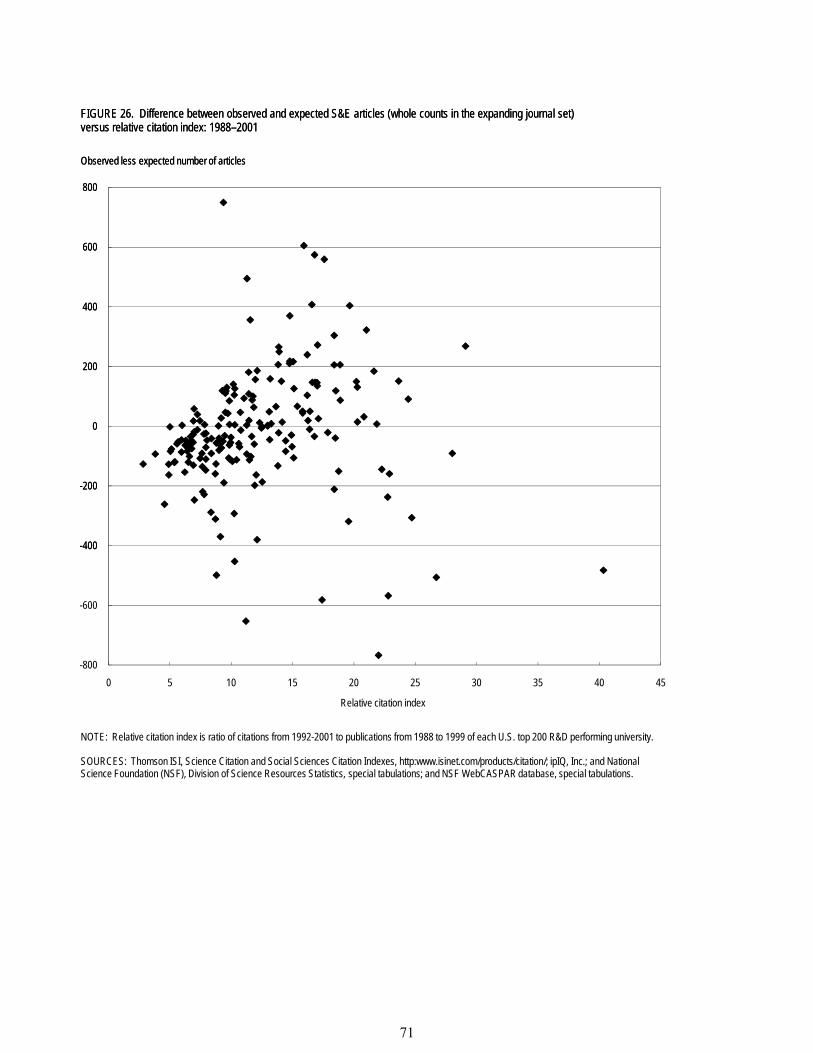
-400
-200
0
200
400
600
800
FIGURE 26. Difference between observed and expected S&E articles (whole counts in the expanding journal set) versus relative citation index: 1988–2001
Observed less expected number of articles
-800
-600
-400
-200
0
200
400
600
800
0 5 10 15 20 25 30 35 40 45
Relative citation index
FIGURE 26. Difference between observed and expected S&E articles (whole counts in the expanding journal set) versus relative citation index: 1988–2001
NOTE: Relative citation index is ratio of citations from 1992-2001 to publications from 1988 to 1999 of each U.S. top 200 R&D performing university.
SOURCES: Thomson ISI, Science Citation and Social Sciences Citation Indexes, http:www.isinet.com/products/citation/; ipIQ, Inc.; and National Science Foundation (NSF), Division of Science Resources Statistics, special tabulations; and NSF WebCASPAR database, special tabulations.
Observed less expected number of articles
71
0.941.32 When we used the average relative citation index across all years (to reduce variability in this variable, thus modeling the longer term average relative citation index for each institution), the r-square increased from 0.934 to 0.942.33 Inclusion of the relative citation index and all interactions reduced the root mean square error from 244 to 226. We conclude that including the relative citation index in the model results in an improvement (which did not meet our customary threshold of a 0.01 increase in r-square).
9.7 Adequacy of Fit for Fields with Higher NRC Quality Ratings
The only variable in the Publication Trends database that directly measures quality is the National Research Council’s (NRC’s) scholarly quality rating (SQR). NRC raters were asked to rate 41 programs at various institutions for “scholarly quality of program faculty” using a 0 to 5 scale with 0 signifying “not sufficient for doctoral education” and 5 signifying “distinguished.” From these responses, the committee calculated a mean rating for each program appearing in the study. For some disciplines the program ratings are provided at a more detailed discipline level than WebCASPAR Academic Disciplines, therefore, it was necessary to compute a weighted average of the program ratings for these disciplines; the institution's number of graduates in the program was used to weight the ranking data. These ratings are available at the field level, rather than an institutional level. Ratings are only available in 1993; these same ratings were applied for every year.
For this analysis, regression was performed at the field-year level for all fields with an NRC rating (yielding a total of over 22,000 observations in the regressions). The dependent variable was whole publication counts in the expanding journal set. Explanatory variables were total academic R&D expenditures, number of postdoctoral researchers, number of S&E Ph.D. recipients, NRC SQR, and the interactions of NRC SQR and the other three explanatory variables. With only the first three explanatory variables, the r-square for expected publications as measured by whole counts in the expanding journal set was 0.83034; addition of NRC SQR and all of the interaction terms only increased the r-square minimally to 0.834.35 When the dependent variable was publications as measured by fractional counts in the expanding journal set, the first three explanatory variables were associated with an r-square of 0.829,36 addition of NRC SQR and all of the interaction terms increased the r-square to 0.838.37 This is a very slight improvement. We originally conjectured that the NRC Quality Rating might not substantially improve the fit because the quality might be highly correlated with total academic R&D expenditures, number of S&E postdoctorates, and number of S&E Ph.D. recipients; however, the correlation of these three variables with the NRC SQR are only 0.33, 0.23, and 0.45, respectively. In addition, the correlations of the NRC SQR with publications as measured by whole and fractional counts are only 0.296 and 0.299, respectively. This leads us to conclude that the NRC SQR ratings are only weakly associated with publication counts, and whatever improvement in the model’s fit is subsumed by the other aforementioned explanatory variables.
32 See Exhibit H-7 for regression output. 33 The r-square value using the same three independent variables differs slightly in these two regressions because of differences in the years for which the relative citation index and average relative citation index were available. 34 See Exhibit H-9 for regression output. 35 See Exhibit H-10 for regression output. 36 See Exhibit H-11 for regression output. 37 See Exhibit H-12 for regression output.
72

10.0 Observed and Expected Publication Trends Within Institutions
In this section we extend the previous model to explicitly examine the effect of changes in resources over time on changes in publication counts within institutions. The models were able to account for a substantial portion (about two-thirds) of the variability over time within institutions in publications as measured by whole counts in the expanding journal set. Corresponding models for changes in fractional publication counts had a worse fit, suggesting that influential factors other than those available in our database were present.
We find that a change in resources within an institution over time results in a smaller change in publication counts than the difference in publication counts of two institutions with resources that differ by the same amount. For fractional counts, changes in resources within institutions results in changes in publication counts that are only 35% of the difference in publication counts that would be expected from two institutions that differed by the same amount of resources; for whole counts the change is 67% of that expected from different institutions. This suggests either that academic R&D expenditures, S&E postdoctorates, and S&E doctoral recipients are partial surrogates for other institutional characteristics that do not change with an increase in academic R&D funding, or that institutions are less efficient at using additional funds to expand publications (and perhaps less sensitive to reductions in funding) than would be expected on the basis of institution-to-institution differences in publications and resources.
The modeling conducted in this section also revealed that the within-institution effects were sensitive to the type of funding and the type of S&E postdoctorates. Increases in federally financed academic R&D expenditures were associated with larger within-institution changes in whole count publications than non-federally financed academic R&D expenditures, changes in S&E postdoctorates without M.D.s were associated with positive increases in publication counts, and changes in S&E postdoctorates with M.D.s were associated with negative changes in publication counts (perhaps by redirecting resources from research to other activities such as clinical activities).
Section 10.1 presents scatterplots of the expected and observed trends within institutions based on the previous model. Section 10.2 develops a hierarchical linear model (HLM) model that incorporates both between- and within-institution variability in the independent variables. Section 10.3 develops a model where the dependent variable is the deviation of each institution's publications from its average publication output. Section 10.4 presents plots comparing the expected and observed annual percentage change in publications. An observed average annual percentage change is defined as the average annual change for observed counts for an institution divided by the average observed count for that institution over time, and the expected average annual percentage change is similarly defined. The average annual percentage changes in expected fractional count publications are about 2.2% larger than the average annual percentage changes in observed fractional count publications, again reflecting increased resources necessary per fractional count publication over time.
73
10.1 Scatterplot of Average Annual Changes of Expected and Observed Trends Within Institutions
Because differences in publications and resource use between institutions are much greater than differences within institutions across time, the coefficients of the regression model essentially quantify long term relationships between resource use and publication output. To examine the extent to which the model captures shorter term relationships between changes in resource use and publications within institutions, we performed two linear regressions for each institution. In the first regression the dependent variable was the observed publication count and the independent variable was year; in the second regression the dependent variable was the expected publication count38 and the independent variable was year. The coefficient of year in the first regression is the average change per year in observed publications; the coefficient of year in the second regression is the average change per year in expected publications. We compared these two average annual changes to ascertain the extent to which the average change per year in expected publications matched the average change per year in observed publications.
Figure 27 is a scatterplot of the the average annual change from 1988 to 2001 in observed and expected publications within institutions as measured using fractional counts in the expanding journal set. There is considerable scatter in this plot; the correlation of the average annual changes of the expected and observed S&E publications is only 0.56. In addition, almost all of the plotted points lie below the 45 degree line, indicating that for most institutions increases in resources are associated with less than expected increases in publication counts. The average annual change in observed publications is 3.7 (i.e., 3.7 additional publication counts per unit of inputs per year) and the average annual change for expected publications is 17.6. The slope of the best fit line is 0.345, so that on average changes in resource use within institutions result in observed changes in fractional count publications that are only 35% of the expected change in fractional count publications.
Figure 28 is a scatterplot of the average annual change of observed and expected publications within institutions as measured by whole counts in the expanding journal set. The fit of a line through the plotted points is substantially improved relative to fractional counts; the correlation of the average annual changes of the expected and observed S&E publication counts is 0.824. However, there is still some bias towards expected increases in publication counts overestimating observed increases. The average annual change for observed publications is 19.8 (i.e., 19.8 additional publication counts per unit of inputs per year) and the average annual change for expected publications is 27.3. The slope of the best fit line is 0.67, so that on average changes in resource use within institutions result in 67% of the expected change in publications as measured by whole count publications. Since, from a previous analysis, we found that the ratio of expected counts to observed counts averaged over all institutions only decreases by about 1% per year, the vast majority of the difference between the slope of 0.67 in this figure and the optimal slope of 1.0 may be attributable to institutions being marginally less efficient in increasing publication counts when their resources increase.
38 The expected publication counts were obtained from a model with three independent variables--academic R&D expenditures, number of S&E postdoctorates, and number of S&E Ph.D. recipients.
74
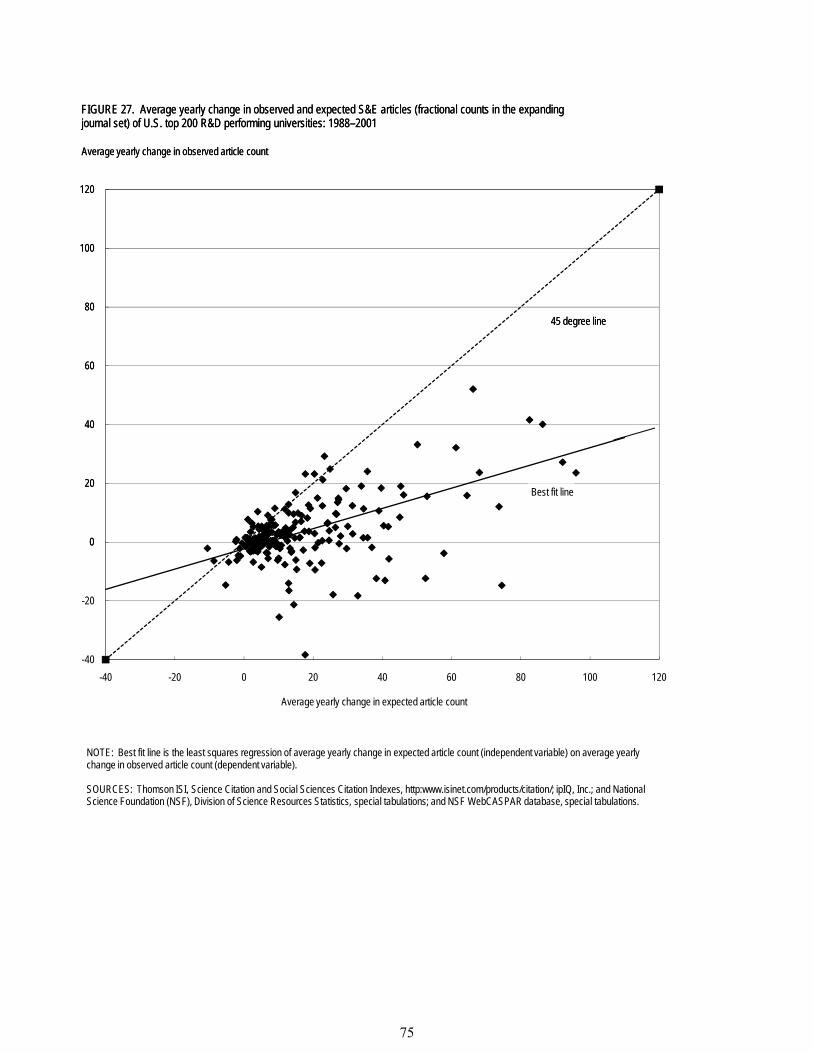
20
0
20
40
60
80
100
120
FIGURE 27. Average yearly change in observed and expected S&E articles (fractional counts in the expanding journal set) of U.S. top 200 R&D performing universities: 1988–2001
45 degree line
Average yearly change in observed article count
Best fit line
-40
-20
0
20
40
60
80
100
120
-40 -20 0 20 40 60 80 100 120
Average yearly change in expected article count
FIGURE 27. Average yearly change in observed and expected S&E articles (fractional counts in the expanding journal set) of U.S. top 200 R&D performing universities: 1988–2001
NOTE: Best fit line is the least squares regression of average yearly change in expected article count (independent variable) on average yearly change in observed article count (dependent variable).
SOURCES: Thomson ISI, Science Citation and Social Sciences Citation Indexes, http:www.isinet.com/products/citation/; ipIQ, Inc.; and National Science Foundation (NSF), Division of Science Resources Statistics, special tabulations; and NSF WebCASPAR database, special tabulations.
45 degree line
Average yearly change in observed article count
Best fit line
75
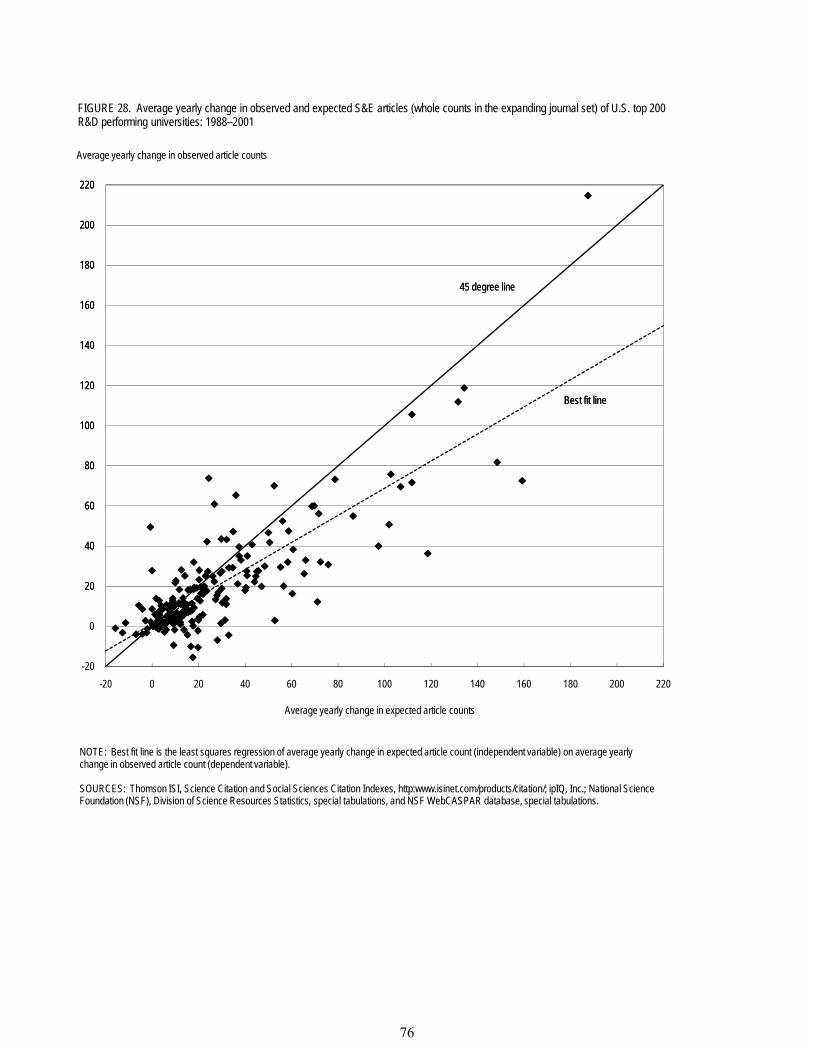
20
40
60
80
100
120
140
160
180
200
220
45 degree line
Best fit line
FIGURE 28. Average yearly change in observed and expected S&E articles (whole counts in the expanding journal set) of U.S. top 200 R&D performing universities: 1988–2001
Average yearly change in observed article counts
-20
0
20
40
60
80
100
120
140
160
180
200
220
-20 0 20 40 60 80 100 120 140 160 180 200 220
Average yearly change in expected article counts
NOTE: Best fit line is the least squares regression of average yearly change in expected article count (independent variable) on average yearly change in observed article count (dependent variable).
SOURCES: Thomson ISI, Science Citation and Social Sciences Citation Indexes, http:www.isinet.com/products/citation/; ipIQ, Inc.; National Science Foundation (NSF), Division of Science Resources Statistics, special tabulations, and NSF WebCASPAR database, special tabulations.
45 degree line
Best fit line
FIGURE 28. Average yearly change in observed and expected S&E articles (whole counts in the expanding journal set) of U.S. top 200 R&D performing universities: 1988–2001
Average yearly change in observed article counts
76
10.2 A Model for Both Between and Within Institution Variability
To further examine the issue of the changes in resources within institutions resulting in less change in observed publications than expected, we fit both a non-hierarchical and hierarchical linear model (HLM) to the data. Each model included an independent variable equal to the average institutional funding across years for each institution and an independent variable equal to the deviation of each year's funding from the average funding for that institution. Similarly, each model included “between” and “within” versions of independent variables for S&E doctoral recipient counts and number of S&E postdoctorates. This parameterization of the model allowed for separate between-institution and within-institution coefficients for resources.
Table 3 compares results obtained using: 1) a non-HLM model on whole counts in the expanding journal set,39 2) an HLM model on whole counts in the expanding journal set,40 3) a non-HLM model for fractional counts in the expanding journal set,41 and 4) an HLM model for fractional counts in the expanding journal set.42 In one of the datasets the outcome variable was the number of publications as measured by fractional counts; in the other dataset the outcome variable was the number of publications as measured by whole counts. The explanatory (independent) variables are the within-institution average across years for total academic R&D expenditures, number of S&E postdoctorates, and number of S&E doctoral recipients, and the difference between the yearly values for total academic R&D expenditures, number of S&E postdoctorates, and number of S&E doctoral recipients and the within-institution average values. In addition, in the HLM model there is a random effects term for each institution (which approximately corresponds to separate intercepts for each institution). As seen in table 3, the coefficients are almost identical whether the HLM or non-HLM models are used. The r-square values for the two non-HLM regressions are 0.941 and 0.938; for the HLM models they are both 0.994. All regression coefficients are statistically significant at the 0.001 level in both models. Standard errors for averaged variables tend to be about three times larger in the HLM than non-HLM models, and standard errors for within-institution variables tend to be about three times smaller.
The model results confirm that changes in funding, the number of S&E postdoctorates or S&E doctoral recipients within institution are likely to result in smaller changes to publications than would be estimated from the association of these variables to the institutional average number of publications across years. Using the results from the HLM model, we find for academic R&D expenditures that differences of $1M in average expenditures between institutions are associated with a difference of 5.01 expected whole counts, but a change of $1M of expenditures within an institution from year to year is associated with an expected change of 3.68 whole counts—so that increases within-institution in funding only yield 74% of the benefit that would have been expected examining between institution associations of funding and publications. Similar ratios for S&E postdoctorates and S&E doctoral recipients are 38% and 64%, respectively. For publications as measured by fractional counts the ratios of between-institution and within-institution changes in these three independent variables are 12%, 29%, and 49%, respectively.
39 See Exhibit I-1 for regression output. 40 See Exhibit I-2 for regression output. 41 See Exhibit I-3 for regression output 42 See Exhibit I-4 for regression output.
77
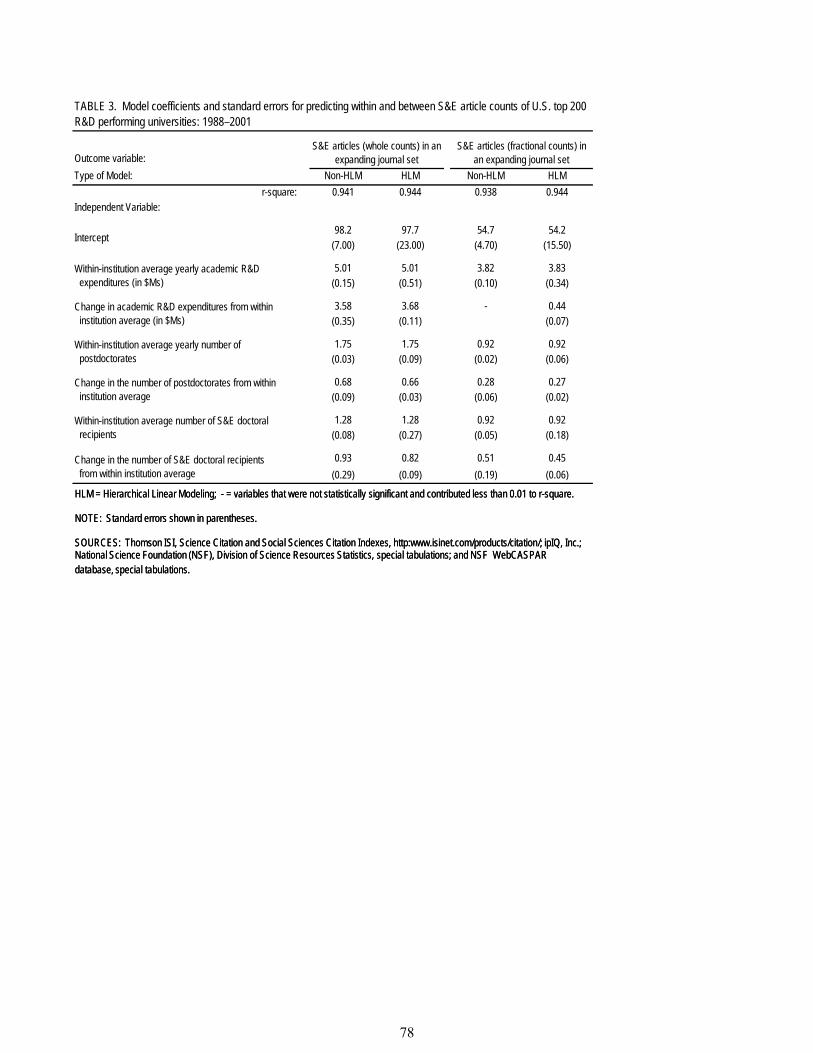
HLM = Hierarchical Linear Modeling; - = variables that were not statistically significant and contributed less than 0.01 to r-square.
NOTE: Standard errors shown in parentheses.
SOURCES: Thomson ISI, Science Citation and Social Sciences Citation Indexes, http:www.isinet.com/products/citation/; ipIQ, Inc.; National Science Foundation (NSF), Division of Science Resources Statistics, special tabulations; and NSF WebCASPAR database, special tabulations.
TABLE 3. Model coefficients and standard errors for predicting within and between S&E article counts of U.S. top 200 R&D performing universities: 1988–2001
Outcome variable:S&E articles (whole counts) in an
expanding journal setS&E articles (fractional counts) in
an expanding journal setType of Model: Non-HLM HLM Non-HLM HLM
r-square: 0.941 0.944 0.938 0.944Independent Variable:
Intercept98.2 97.7 54.7 54.2
(7.00) (23.00) (4.70) (15.50)
Within-institution average yearly academic R&D expenditures (in $Ms)
5.01 5.01 3.82 3.83(0.15) (0.51) (0.10) (0.34)
Change in academic R&D expenditures from within institution average (in $Ms)
3.58 3.68 - 0.44(0.35) (0.11) (0.07)
Within-institution average yearly number of postdoctorates
1.75 1.75 0.92 0.92(0.03) (0.09) (0.02) (0.06)
Change in the number of postdoctorates from within institution average
0.68 0.66 0.28 0.27(0.09) (0.03) (0.06) (0.02)
Within-institution average number of S&E doctoral recipients
1.28 1.28 0.92 0.92(0.08) (0.27) (0.05) (0.18)
Change in the number of S&E doctoral recipients from within institution average
0.93 0.82 0.51 0.45(0.29) (0.09) (0.19) (0.06)
HLM = Hierarchical Linear Modeling; - = variables that were not statistically significant and contributed less than 0.01 to r-square.
NOTE: Standard errors shown in parentheses.
SOURCES: Thomson ISI, Science Citation and Social Sciences Citation Indexes, http:www.isinet.com/products/citation/; ipIQ, Inc.; National Science Foundation (NSF), Division of Science Resources Statistics, special tabulations; and NSF WebCASPAR database, special tabulations.
78
The results in table 3 can be used to calculate the effect of an increase in resources on expected publication output. The mean values across all institutions for average academic R&D funding, number of S&E postdoctorates and number of S&E doctoral recipients are $81.0M, 170.1, and 120.8, respectively. The mean value for the change measures are zero. Suppose that institution A has those resources available to it in a given year. Substituting these values into the HLM regression model, and accounting for the intercepts, we would estimate that institution A will generate 956 publications as measured by whole counts and 632 publications as measured by fractional counts. If institution B has available 10% more resources than institution A, the model estimates that institution B will generate 1,041.8 publications as measured by whole counts and 689.2 publications as measured by fractional counts. This is an increase of 9.0% and 9.1%, respectively. Thus two different institutions, one at the mean value and one 10% above it, are expected to differ by about 9% in publication counts. If institution A’s academic R&D funding, S&E postdoctorates, and S&E doctoral recipients are each increased by 10%, the model estimates that institution A will now generate 1,007 publications as measured by whole counts and 645 publications as measured by fractional counts. These are increases of 5.3% and 2.1%, respectively, which are substantially less than the 9% difference between institutions A and B at their original resource levels. It is not clear why the increases in whole and fractional counts are not equal. We would expect that increases in funding would result in equal increases in the number of whole and fractional counts, unless increased funding is differentially allocated to research that results in publications with fewer or more institutional authors than is typical for that institution, in which case these two publication measures would increase at different rates. Perhaps the reasons for the differential rate of increase in these two publication counts is that increases in resources result in greater amounts of collaborative research resulting in fewer additional fractional counts per publication.
The finding that changes in academic R&D expenditures, number of S&E postdoctorates, and number of S&E doctoral recipients are associated with smaller changes in publications within institution than between institution suggests that these variables may be surrogates for other important differences between the institutions that do not change in response to relatively small changes in these three resource inputs. These might include differences between institutions on their degree of focus on research, the degree to which their staff are publications-oriented, etc.
10.3 A Model for Within Institution Variability
The analyses in table 3 attempt to simultaneously model the association of academic R&D expenditures, number of S&E postdoctorates, and number of S&E Ph.D. recipients along with the changes in these independent variables with between- and within-institution variation in publication counts. However, since 98.9% and 97.5% of the variability of publication counts as measured by fractional and whole counts, respectively, in the expanding journal set are associated with between-institution variability, we felt that unless we modeled the within-institution changes in publications directly, we would not be able to assess the extent to which we were able to explain within-institutional changes in publications. Consequently we conducted regression analyses where the outcome variable was the change in publication counts and the independent variables were the change in explanatory variables, where change was calculated relative to the mean value within institution. Table 4 shows the model coefficients and the associated r-square values for regressions on within-institution change in publication whole
79
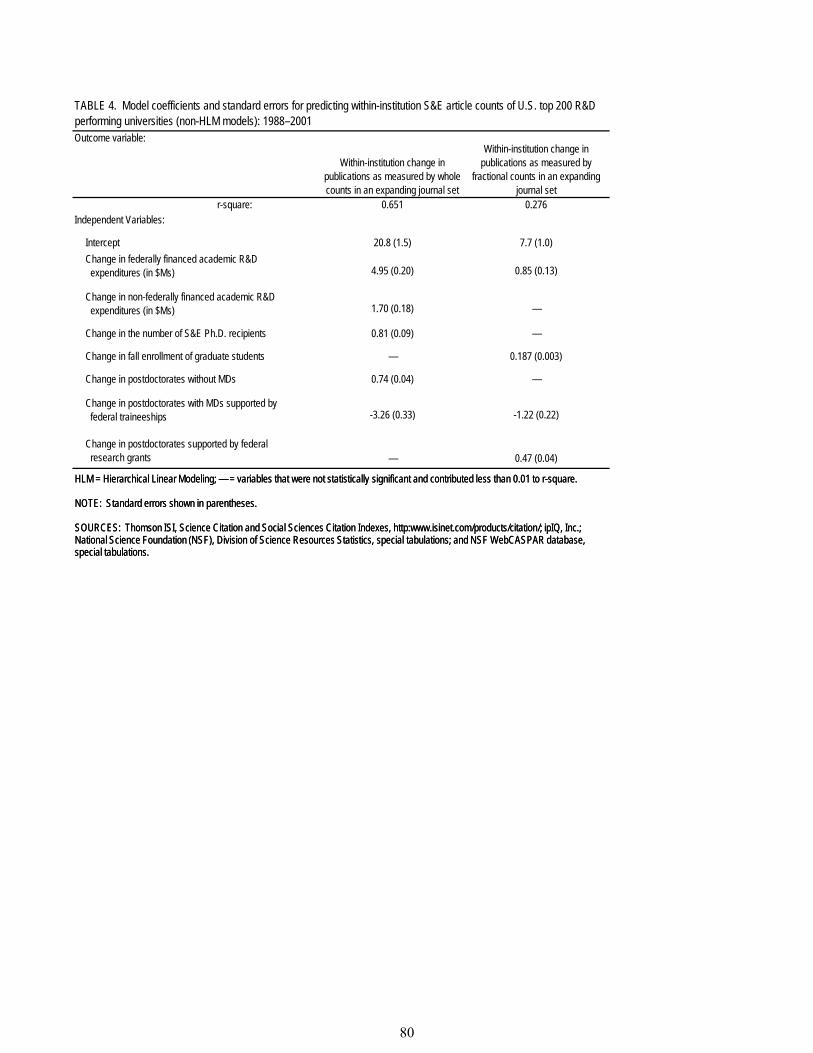
HLM = Hierarchical Linear Modeling; — = variables that were not statistically significant and contributed less than 0.01 to r-square.
NOTE: Standard errors shown in parentheses.
SOURCES: Thomson ISI, Science Citation and Social Sciences Citation Indexes, http:www.isinet.com/products/citation/; ipIQ, Inc.; National Science Foundation (NSF), Division of Science Resources Statistics, special tabulations; and NSF WebCASPAR database,special tabulations.
TABLE 4. Model coefficients and standard errors for predicting within-institution S&E article counts of U.S. top 200 R&D performing universities (non-HLM models): 1988–2001Outcome variable:
Within-institution change in publications as measured by whole counts in an expanding journal set
Within-institution change in publications as measured by
fractional counts in an expanding journal set
r-square: 0.651 0.276Independent Variables:
Intercept 20.8 (1.5) 7.7 (1.0)Change in federally financed academic R&D expenditures (in $Ms) 4.95 (0.20) 0.85 (0.13)
Change in non-federally financed academic R&D expenditures (in $Ms) 1.70 (0.18) —
Change in the number of S&E Ph.D. recipients 0.81 (0.09) —
Change in fall enrollment of graduate students — 0.187 (0.003)
Change in postdoctorates without MDs 0.74 (0.04) —
Change in postdoctorates with MDs supported by federal traineeships -3.26 (0.33) -1.22 (0.22)
Change in postdoctorates supported by federal research grants — 0.47 (0.04)
HLM = Hierarchical Linear Modeling; — = variables that were not statistically significant and contributed less than 0.01 to r-square.
NOTE: Standard errors shown in parentheses.
SOURCES: Thomson ISI, Science Citation and Social Sciences Citation Indexes, http:www.isinet.com/products/citation/; ipIQ, Inc.; National Science Foundation (NSF), Division of Science Resources Statistics, special tabulations; and NSF WebCASPAR database,special tabulations.
80
counts43 and fractional counts.44 Since the HLM and non-HLM results were essentially identical and only 2% of variability existed between institutions, we present only the non-HLM results below. All coefficients are statistically significant at the 0.001 level using both HLM and non-HLM models.
The r-square for publications as measured by whole counts is reasonable high at 0.65, so that approximately two-thirds of the variability within institution is accounted for. The intercept is non-zero as the result of missing values and lagging of the independent variables. Federally-financed R&D has almost three times as large an effect on increasing publications than non-federally-financed academic R&D expenditures (5.0 versus 1.7 per $1M). The number of S&E Ph.D. recipients increases whole count publications 0.81. In addition, not all types of S&E postdoctorates increase publication counts equally. Increasing S&E postdoctorates without M.D.s increases whole count publications by 0.74; increasing S&E postdoctorates with M.D.s supported by federal traineeships (which primarily train physicians for clinical practice) decreases publications by 3.26 (perhaps via funneling of faculty and other resources from research-related activities to clinical activities), and increasing the number of S&E postdoctorates supported by federal research grants does not affect whole count publications. As before, increases in S&E doctoral recipients are associated with increases in whole count publications. The number of graduate students and postdoctorates supported by federal research grants was not statistically significant. The coefficients in this model are reasonably similar to those in table 3 (after adjusting for the fact that 58% of academic R&D expenditures are federally financed).
The r-square for publications as measured by fractional counts is considerably lower at 0.28. In addition, non-federally financed academic R&D expenditures, the number of S&E Ph.D. recipients and postdoctorates without M.D.s did not contribute at least 1% to r-square and so were not included in the regression. The regression shows that increases in the number S&E postdoctorates supported by federal research grants and the number of graduate students increases publication counts, but increases in the number of S&E postdoctorates with M.D.s supported by federal traineeships decreases publication counts. We also examined whether we could substitute the same three explanatory change variables as in table 3 in this regression. These yielded coefficients that were almost identical to those in table 3, but the r-square using those variables is considerably lower, at 0.23.
10.4 Scatterplots of Average Annual Percent Change in Expected and Observed Publication Counts Using the HLM Model
We also calculated the average annual percent change for both observed and expected publication counts using the model in table 3 for the expected publication counts. The annual percent change for the observed publication counts for an institution is defined as the average yearly change in observed publication counts for that institution over time divided by the average observed publication count for that institution over time. That is, the annual percent change for observed counts is the percentage change per year in the observed counts from the least squares regression line where the dependent variable is the observed count and the independent variable is year. The average annual percent change for the expected counts is similarly defined.
43 See Exhibits I-5 and I-6 for regression output. 44 See Exhibits I-7 and I-8 for regression output.
81
Figure 29 is a scatterplot of the difference in the average annual percent change for observed and expected counts (i.e., the average annual percent change for observed publication counts minus the average annual percent change for expected publication counts) versus the average annual observed publications as measured by fractional counts in the expanding journal set. The average difference in the average annual percent observed and expected changes is -2.2% (i.e., expected increases in publication counts are about 2.2% greater per year than observed increases). Institutions with fewer publications show greater variability in the difference between the average annual percent change in expected and observed publications. The standard deviation of differences is 3.0% for institutions with fewer than 500 publications as measured by fractional counts per year and 1.3% for institutions with 500 or more publications.
Figure 30 is a scatterplot of the difference in the average annual percent change for observed and expected counts versus the average annual number of observed publications as measured by whole counts in the expanding journal set. The average difference in the average annual percent change for expected and observed publications is -0.7% (i.e., expected increases in publication counts are about 0.7% greater per year than observed increases). Institutions with fewer publications show greater variability in the difference between the average annual percent change for expected and observed publications. The standard deviation of differences is 3.0% for institutions with fewer than 700 publications as measured by whole counts and 1.5% for institutions with 700 or more publications.
82
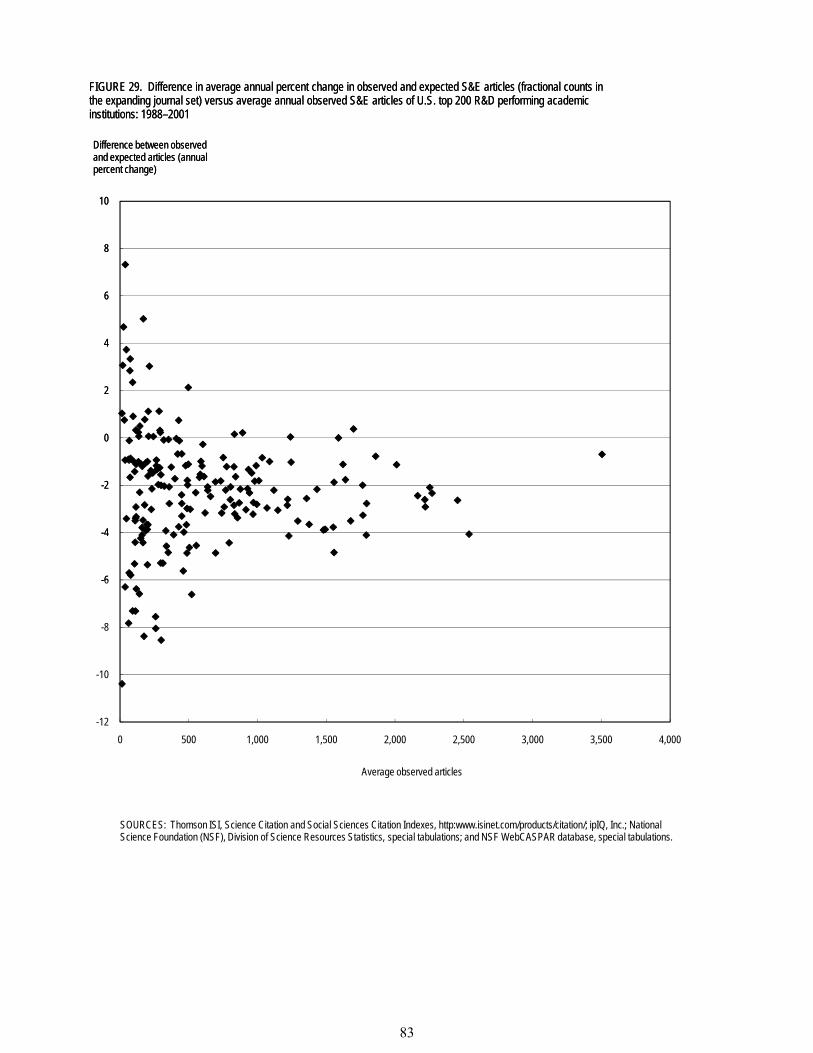
-6
-4
-2
0
2
4
6
8
10
Difference between observed and expected articles (annual percent change)
FIGURE 29. Difference in average annual percent change in observed and expected S&E articles (fractional counts in the expanding journal set) versus average annual observed S&E articles of U.S. top 200 R&D performing academic institutions: 1988–2001
-12
-10
-8
-6
-4
-2
0
2
4
6
8
10
0 500 1,000 1,500 2,000 2,500 3,000 3,500 4,000
Difference between observed and expected articles (annual percent change)
Average observed articles
FIGURE 29. Difference in average annual percent change in observed and expected S&E articles (fractional counts in the expanding journal set) versus average annual observed S&E articles of U.S. top 200 R&D performing academic institutions: 1988–2001
SOURCES: Thomson ISI, Science Citation and Social Sciences Citation Indexes, http:www.isinet.com/products/citation/; ipIQ, Inc.; National Science Foundation (NSF), Division of Science Resources Statistics, special tabulations; and NSF WebCASPAR database, special tabulations.
83
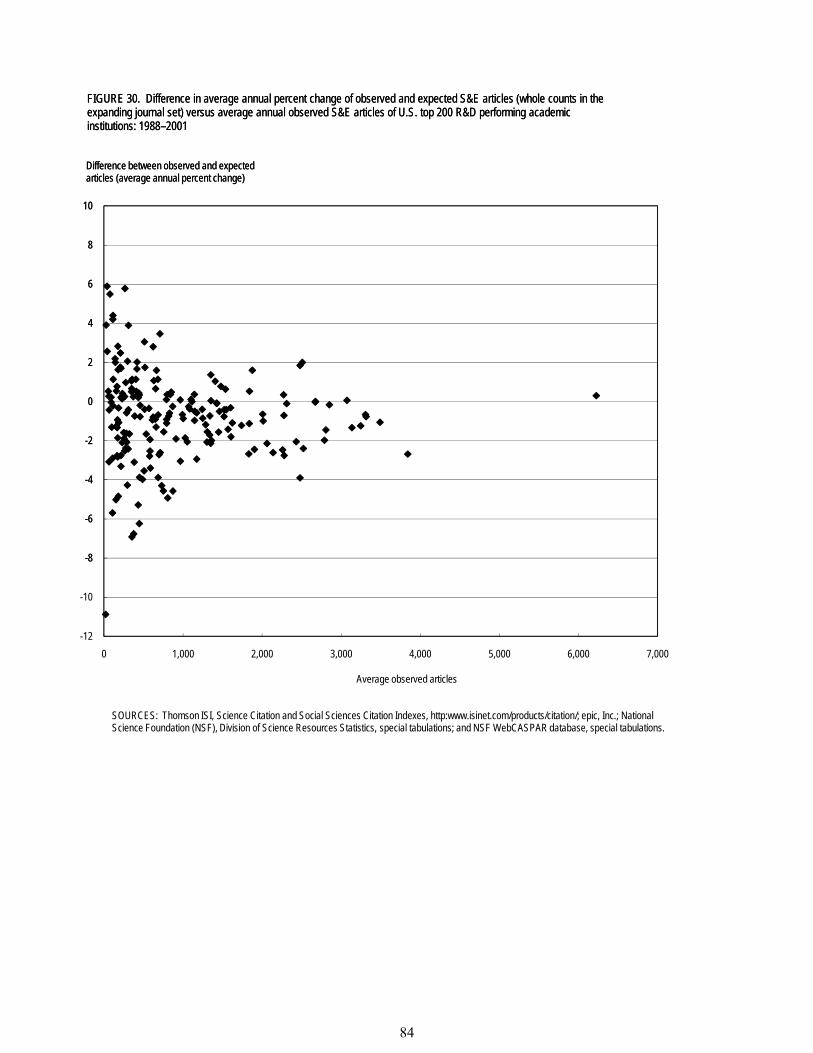
-8
-6
-4
-2
0
2
4
6
8
10
FIGURE 30. Difference in average annual percent change of observed and expected S&E articles (whole counts in the expanding journal set) versus average annual observed S&E articles of U.S. top 200 R&D performing academic institutions: 1988–2001
Difference between observed and expected articles (average annual percent change)
-12
-10
-8
-6
-4
-2
0
2
4
6
8
10
0 1,000 2,000 3,000 4,000 5,000 6,000 7,000
Average observed articles
FIGURE 30. Difference in average annual percent change of observed and expected S&E articles (whole counts in the expanding journal set) versus average annual observed S&E articles of U.S. top 200 R&D performing academic institutions: 1988–2001
SOURCES: Thomson ISI, Science Citation and Social Sciences Citation Indexes, http:www.isinet.com/products/citation/; epic, Inc.; National Science Foundation (NSF), Division of Science Resources Statistics, special tabulations; and NSF WebCASPAR database, special tabulations.
Difference between observed and expected articles (average annual percent change)
84
11.0 Key Factors Associated with Publication Counts at the Field Group Level
In this section we develop models for the five field groups (i.e., biology, life and agricultural sciences (bio-life-ag); computer sciences; engineering, math and physical sciences (eng-math-physical sciences); medical sciences; and social sciences and psychology (soc-sciences).
Sections 11.1 and 11.2 discuss the models to explain fractional count publications and whole count publications in the expanding journal set, respectively. We initially performed separate regressions for each field group. However, finding that the explanatory variables are very similar (both across field groups and across the two publication measures), we found that the same three variables that were used to explain institutional level variability were able to explain most of the variability for individual field groups.
In section 11.3, we model institution-level publications by modeling each field group separately and summing the expected publications to the institution level. The model’s fit at the institution level show only a modest improvement. This suggests that institutional variations in the proportion of publications from various field groups (i.e., disciplinary concentration) does not especially help in explaining institution-level publications variability.
In section 11.4, we examine the ratio of observed to expected publications over time by field group. Increases in resources used per publication were greatest for medical sciences and bio-life-ag (approximately 33%) and intermediate for soc-sciences (approximately 23%), with fairly constant trends during the entire time period from 1990 to 2001. Resources used per publication in the eng-math-physical sciences field group increased about 15% from 1990 to 1997 and then reversed itself, resulting in a net increase of about 9% from 1990 to 2001. Resources used per publication in computer sciences followed an erratic pathway, resulting in an increase of approximately 13% over this time period.
11.1 Analyses of Fractional Count Publications in the Expanding Journal Set
We performed regression modeling for each field group using publications as measured by fractional counts in the expanding journal set as the dependent variable. The results (excluding variables with an incremental r-square smaller than 0.01) and the cumulative r-square values are as follows:
Biology, life and agricultural sciences (bio-life-ag).45 Postdoctorates supported by federal research grants by field (0.766), S&E doctoral recipients by field (0.866), S&E postdoctorates by field (0.900), and other funding sources of academic R&D expenditures by institution (0.914). (Other funding sources of academic R&D expenditures includes R&D funded by foundation grants and excludes R&D funded with federal, industry, state, local or institution funds.) All variables yielded an r-square of 0.937.
Computer sciences.46 S&E doctoral recipients by field (0.634), total academic R&D expenditures by field (0.707), and basic research expenditures by institution (0.738). All variables yielded an r-square of 0.774.
45 Regression output is displayed in Exhibit J-1. 46 Regression output is displayed in Exhibit J-2.
85
Engineering, math and physical sciences (eng-math-physical sciences)47: S&E doctoral recipients by field (0.888) and S&E postdoctorates by field (0.931). All variables yielded an r-square of 0.953.
Medical sciences48: Total academic R&D expenditures by field (0.771), S&E postdoctorates with M.D.s supported by federal research grants (0.858), S&E doctoral recipients by field (0.880), and Carnegie R-1 classification (0.891). Carnegie Medical classification almost qualified, with an incremental r-square of 0.009. All variables yielded an r-square of 0.932.
Social sciences and psychology (soc-sciences)49: S&E doctoral recipients by field (0.790), basic research by institution (0.842), S&E postdoctorates by field (0.863), and full time assistant professors by institution (0.874). All variables yielded an r-square of 0.913.
We compared the explanatory ability of the models listed above with a model including only total academic R&D expenditures, the number of S&E postdoctorates, and the number of S&E Ph.D. recipients in the five field groups. The r-squares for this simplified model50 are as follows: 1) bio-life-ag (0.894), 2) computer sciences (0.686), 3) eng-math-physical sciences (0.937), 4) medical sciences (0.857) and 5) soc-sciences (0.840). This simple 3 variable model was thus able to account for most (i.e., at least 89%) of the explanatory power of the field group specific models described above.
The coefficients for the three variable regression model appear in table 5. S&E Ph.D. recipients appear to be more important in the bio-life-ag and medical sciences fields than in the other fields. Total academic R&D expenditures appear generally to be more important and postdocs less important in the medical sciences field than in the other fields. An interesting aspect of this table is that the coefficient for total academic R&D expenditures is larger in the institution-level regression than in all but one of the field groups, and the coefficient for S&E Ph.D. recipients is smaller in the institution level than for most of the field groups.
11.2 Analyses of Whole Count Publications in the Expanding Journal Set
We performed regression modeling for each field group using publications as measured by whole counts in the expanding journal set as the dependent variable. We obtained similar r-squares using the same explanatory variables in the fractional count models for two field groups, eng-math-physical sciences and medical sciences. We obtained similar r-squares in the other three field groups but the type and number of explanatory variables varied between the fractional and whole count publication models.
Bio-life-ag51: S&E postdoctorates without an M.D. degree by field (0.804), S&E doctoral recipients by field (0.893), and S&E postdoctorates with an M.D. degree by field (0.909). All variables yielded an r-square of 0.938.
47 Regression output is displayed in Exhibit J-3. 48 Regression output is displayed in Exhibit J-4. 49 Regression output is displayed in Exhibit J-5. 50 Regression output is displayed in Exhibit J-6. 51 Regression output is displayed in Exhibit J-7.
86
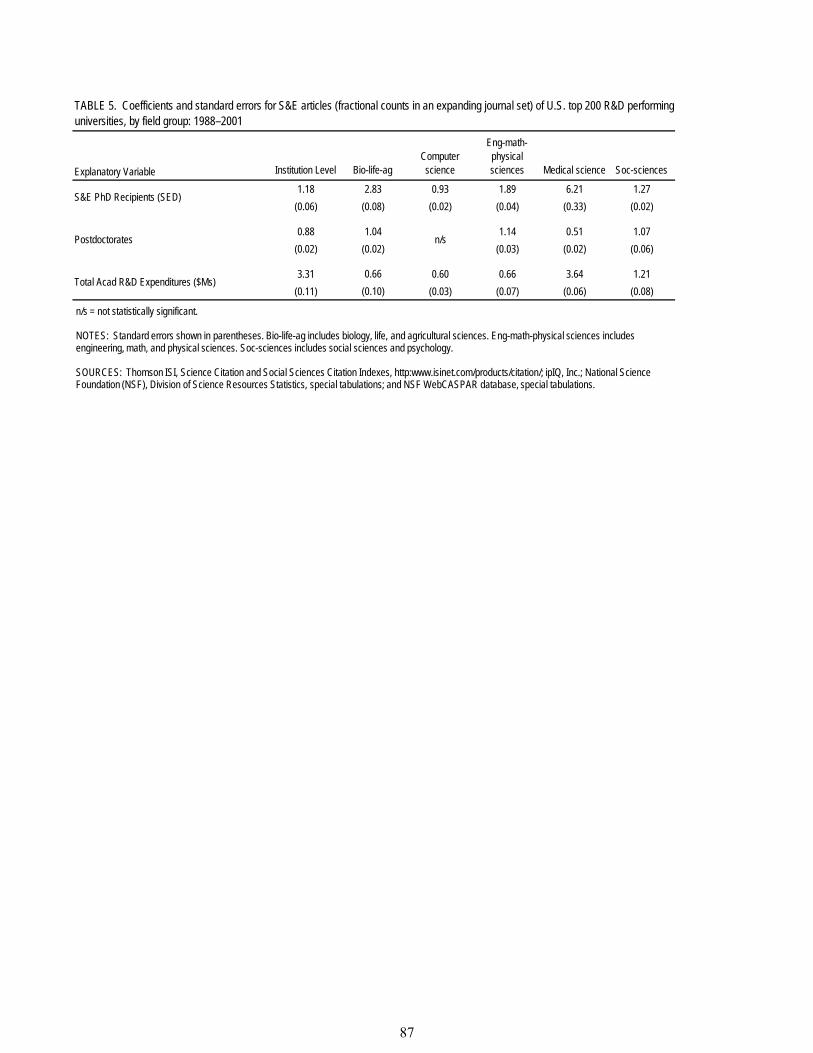
TABLE 5. Coefficients and standard errors for S&E articles (fractional counts in an expanding journal set) of U.S. top 200 R&D performing universities, by field group: 1988–2001
Explanatory Variable Institution Level Bio-life-agComputer science
Eng-math-physical sciences Medical science Soc-sciences
S&E PhD Recipients (SED)1.18 2.83 0.93 1.89 6.21 1.27
(0.06) (0.08) (0.02) (0.04) (0.33) (0.02)
Postdoctorates0.88 1.04
n/s1.14 0.51 1.07
(0.02) (0.02) (0.03) (0.02) (0.06)
Total Acad R&D Expenditures ($Ms)3.31 0.66 0.60 0.66 3.64 1.21
(0.11) (0.10) (0.03) (0.07) (0.06) (0.08)
n/s = not statistically significant.
NOTES: Standard errors shown in parentheses. Bio-life-ag includes biology, life, and agricultural sciences. Eng-math-physical sciences includes engineering, math, and physical sciences. Soc-sciences includes social sciences and psychology.
SOURCES: Thomson ISI, Science Citation and Social Sciences Citation Indexes, http:www.isinet.com/products/citation/; ipIQ, Inc.; National Science Foundation (NSF), Division of Science Resources Statistics, special tabulations; and NSF WebCASPAR database, special tabulations.
87
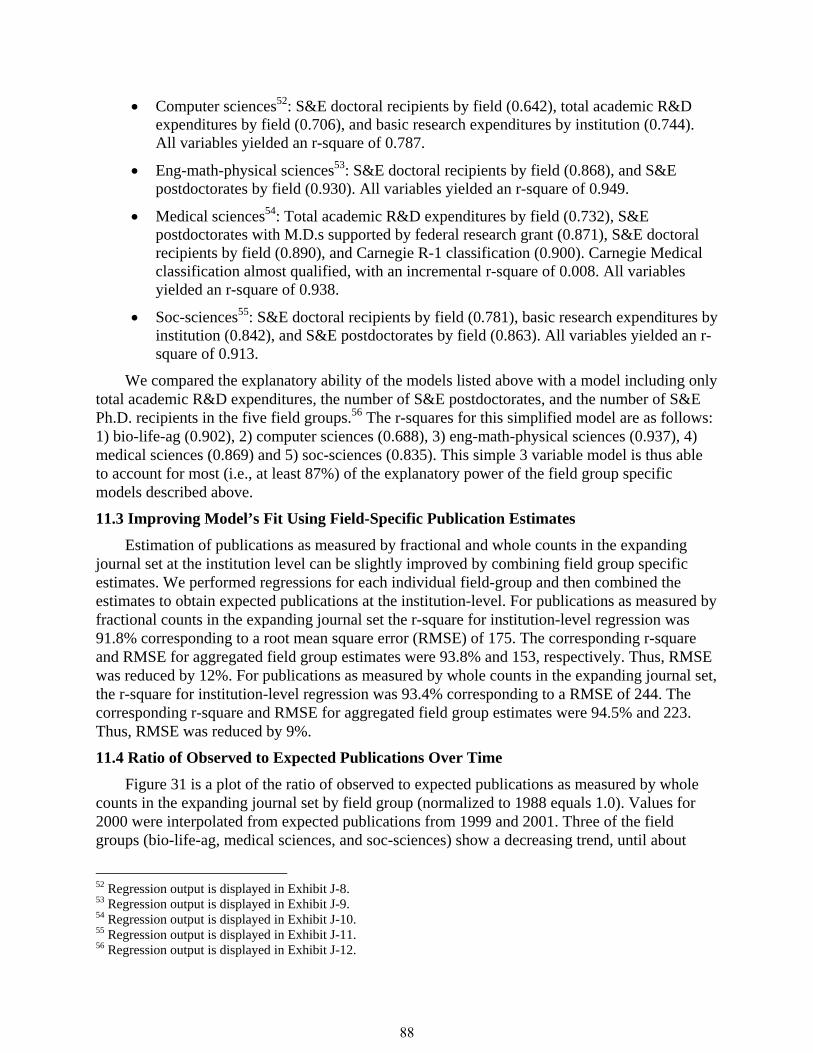
Computer sciences52: S&E doctoral recipients by field (0.642), total academic R&D expenditures by field (0.706), and basic research expenditures by institution (0.744). All variables yielded an r-square of 0.787.
Eng-math-physical sciences53: S&E doctoral recipients by field (0.868), and S&E postdoctorates by field (0.930). All variables yielded an r-square of 0.949.
Medical sciences54: Total academic R&D expenditures by field (0.732), S&E postdoctorates with M.D.s supported by federal research grant (0.871), S&E doctoral recipients by field (0.890), and Carnegie R-1 classification (0.900). Carnegie Medical classification almost qualified, with an incremental r-square of 0.008. All variables yielded an r-square of 0.938.
Soc-sciences55: S&E doctoral recipients by field (0.781), basic research expenditures by institution (0.842), and S&E postdoctorates by field (0.863). All variables yielded an r-square of 0.913.
We compared the explanatory ability of the models listed above with a model including only total academic R&D expenditures, the number of S&E postdoctorates, and the number of S&E Ph.D. recipients in the five field groups.56 The r-squares for this simplified model are as follows: 1) bio-life-ag (0.902), 2) computer sciences (0.688), 3) eng-math-physical sciences (0.937), 4) medical sciences (0.869) and 5) soc-sciences (0.835). This simple 3 variable model is thus able to account for most (i.e., at least 87%) of the explanatory power of the field group specific models described above.
11.3 Improving Model’s Fit Using Field-Specific Publication Estimates
Estimation of publications as measured by fractional and whole counts in the expanding journal set at the institution level can be slightly improved by combining field group specific estimates. We performed regressions for each individual field-group and then combined the estimates to obtain expected publications at the institution-level. For publications as measured by fractional counts in the expanding journal set the r-square for institution-level regression was 91.8% corresponding to a root mean square error (RMSE) of 175. The corresponding r-square and RMSE for aggregated field group estimates were 93.8% and 153, respectively. Thus, RMSE was reduced by 12%. For publications as measured by whole counts in the expanding journal set, the r-square for institution-level regression was 93.4% corresponding to a RMSE of 244. The corresponding r-square and RMSE for aggregated field group estimates were 94.5% and 223. Thus, RMSE was reduced by 9%.
11.4 Ratio of Observed to Expected Publications Over Time
Figure 31 is a plot of the ratio of observed to expected publications as measured by whole counts in the expanding journal set by field group (normalized to 1988 equals 1.0). Values for 2000 were interpolated from expected publications from 1999 and 2001. Three of the field groups (bio-life-ag, medical sciences, and soc-sciences) show a decreasing trend, until about
52 Regression output is displayed in Exhibit J-8. 53 Regression output is displayed in Exhibit J-9. 54 Regression output is displayed in Exhibit J-10. 55 Regression output is displayed in Exhibit J-11. 56 Regression output is displayed in Exhibit J-12.
88
0.90
0.95
1.00
1.05
1.10
1990=1
FIGURE 31. Ratio of observed to expected S&E articles (whole counts in an expanding journal set) of U.S. top 200 R&D performing academic institutions, by field group: 1990–2001
Computer science
Engineering, math, and physical sciences
Medical science
0.85
0.90
0.95
1.00
1.05
1.10
1990 1991 1992 1993 1994 1995 1996 1997 1998 1999 2000 2001
1990=1
Year
FIGURE 31. Ratio of observed to expected S&E articles (whole counts in an expanding journal set) of U.S. top 200 R&D performing academic institutions, by field group: 1990–2001
SOURCES: Thomson ISI, Science Citation and Social Sciences Citation Indexes, http:www.isinet.com/products/citation/; ipIQ, Inc.; National Science Foundation (NSF), Division of Science Resources Statistics, special tabulations; and NSF WebCASPAR database, special tabulations.
Social sciences and psychology
Computer science
Engineering, math, and physical sciences
Medical science
Biology, life, and agricultural sciences
89
1999, after which the curves are essentially flat. That is, these fields had increasing resource needs per whole count article over time, but recently have stabilized resource requirements. The trends for bio-life-ag and medical sciences are particularly similar. The other two field groups (computer sciences and eng-math-physical sciences) do not demonstrate any particular trend until approximately 1998 or 1999, when they begin to increase, with the increase being particularly noteworthy for eng-math-physical sciences. That is, the resources required per whole count article remains essentially flat for computer sciences and eng-math-physical sciences over time, until most recently when they have begun to decrease.
Figure 32 is a plot of the ratio of observed to expected publications as measured by fractional counts in the expanding journal set by field group (normalized to 1988 equals 1.0). Values for 2000 were interpolated from expected publications from 1999 and 2001. All of the field groups show a decreasing trend until about 1997. The trend is fairly steep, and is partially accounted for by increased resource requirements per whole count and partially by greater collaboration with other institutions. After 1997, three field groups (bio-life-ag, medical sciences, and soc-sciences) show a continuing decrease. Since the resource requirements per whole count stabilized during this time period, the continuing decrease in fractional counts must be attributable to continuing increases in collaboration. Two field groups (computer sciences and eng-math-physical sciences) show flattening of the curve in the range of about 1996 to 1998, and increases in the ratio from 1998 to 2001. The most recent years were associated with dramatic decreases in resource needs per whole count publication, and the corresponding increase that we would expect in the ratio of observed to expected count publications as measured by fractional counts appears to be attenuated for these two fields by continuing increases in collaboration.
90
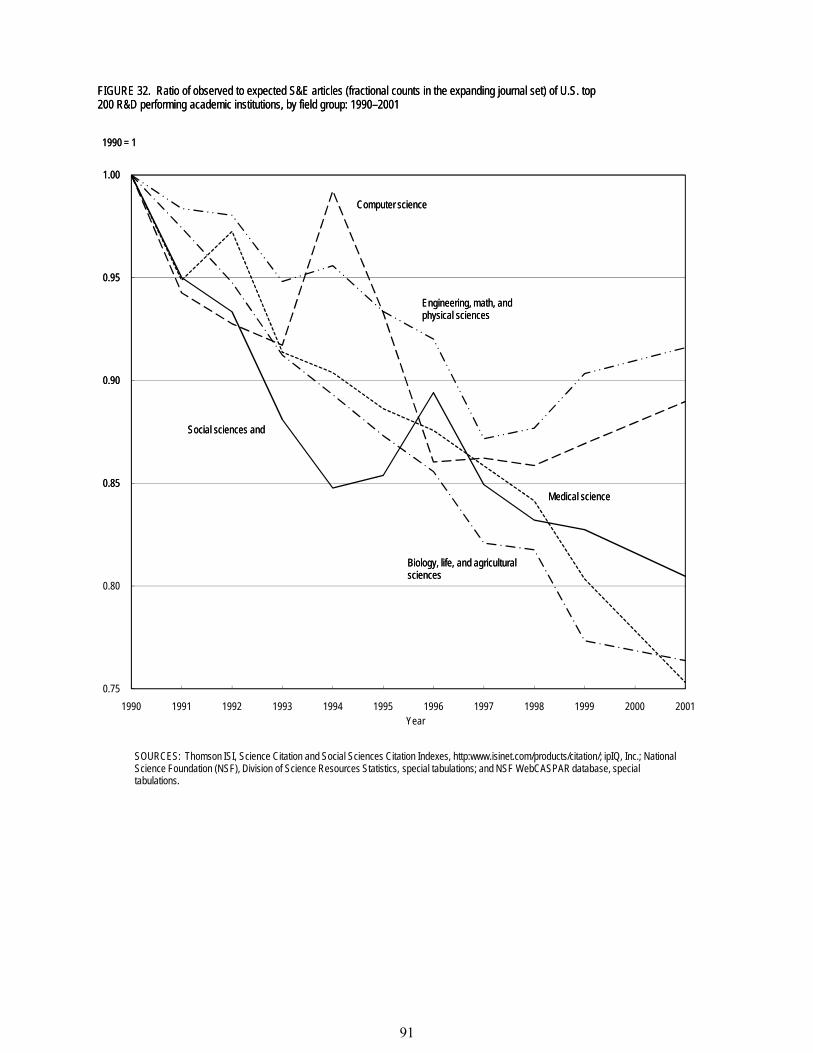
0.85
0.90
0.95
1.00
1990 = 1
FIGURE 32. Ratio of observed to expected S&E articles (fractional counts in the expanding journal set) of U.S. top 200 R&D performing academic institutions, by field group: 1990–2001
Engineering, math, and physical sciences
Computer science
Social sciences and
Medical science
Biology, life, and agricultural sciences
0.75
0.80
0.85
0.90
0.95
1.00
1990 1991 1992 1993 1994 1995 1996 1997 1998 1999 2000 2001
1990 = 1
Year
FIGURE 32. Ratio of observed to expected S&E articles (fractional counts in the expanding journal set) of U.S. top 200 R&D performing academic institutions, by field group: 1990–2001
SOURCES: Thomson ISI, Science Citation and Social Sciences Citation Indexes, http:www.isinet.com/products/citation/; ipIQ, Inc.; National Science Foundation (NSF), Division of Science Resources Statistics, special tabulations; and NSF WebCASPAR database, special tabulations.
Engineering, math, and physical sciences
Computer science
Social sciences and
Medical science
Biology, life, and agricultural sciences
91
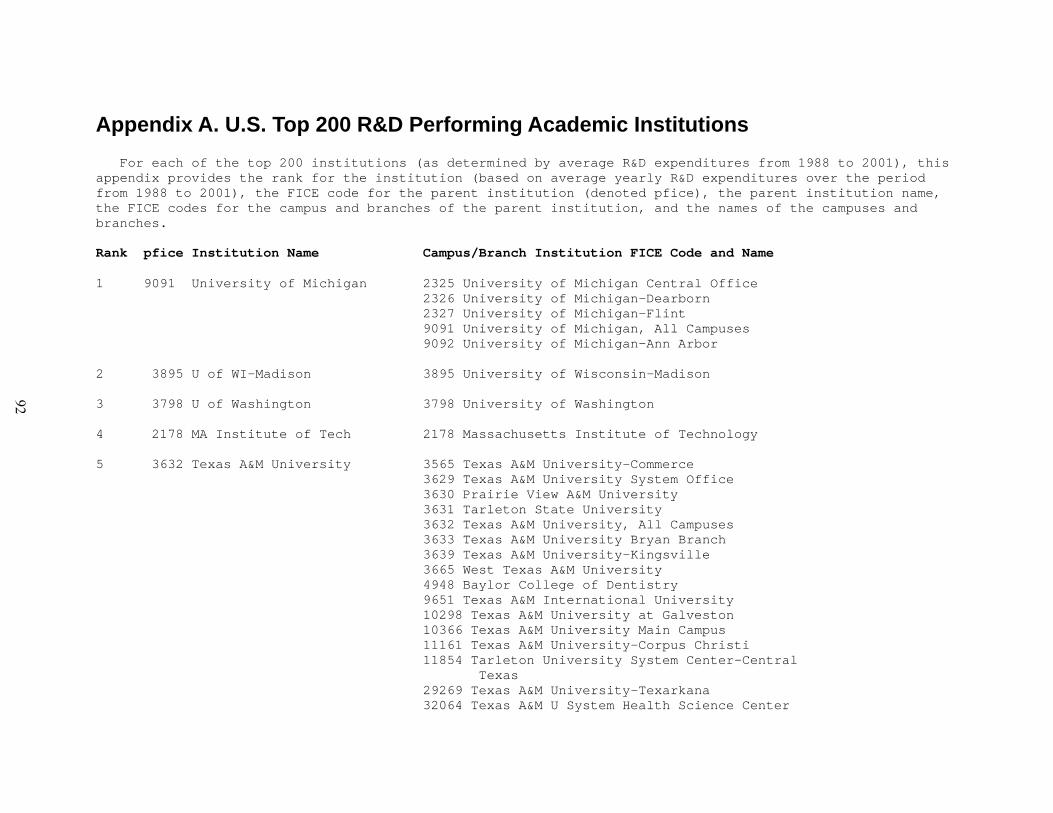
Appendix A. U.S. Top 200 R&D Performing Academic Institutions For each of the top 200 institutions (as determined by average R&D expenditures from 1988 to 2001), this appendix provides the rank for the institution (based on average yearly R&D expenditures over the period from 1988 to 2001), the FICE code for the parent institution (denoted pfice), the parent institution name, the FICE codes for the campus and branches of the parent institution, and the names of the campuses and branches. Rank pfice Institution Name Campus/Branch Institution FICE Code and Name 1 9091 University of Michigan 2325 University of Michigan Central Office 2326 University of Michigan-Dearborn 2327 University of Michigan-Flint 9091 University of Michigan, All Campuses 9092 University of Michigan-Ann Arbor 2 3895 U of WI-Madison 3895 University of Wisconsin-Madison 3 3798 U of Washington 3798 University of Washington 4 2178 MA Institute of Tech 2178 Massachusetts Institute of Technology 5 3632 Texas A&M University 3565 Texas A&M University-Commerce 3629 Texas A&M University System Office 3630 Prairie View A&M University 3631 Tarleton State University 3632 Texas A&M University, All Campuses 3633 Texas A&M University Bryan Branch 3639 Texas A&M University-Kingsville 3665 West Texas A&M University 4948 Baylor College of Dentistry 9651 Texas A&M International University 10298 Texas A&M University at Galveston 10366 Texas A&M University Main Campus 11161 Texas A&M University-Corpus Christi 11854 Tarleton University System Center-Central Texas 29269 Texas A&M University-Texarkana 32064 Texas A&M U System Health Science Center
92
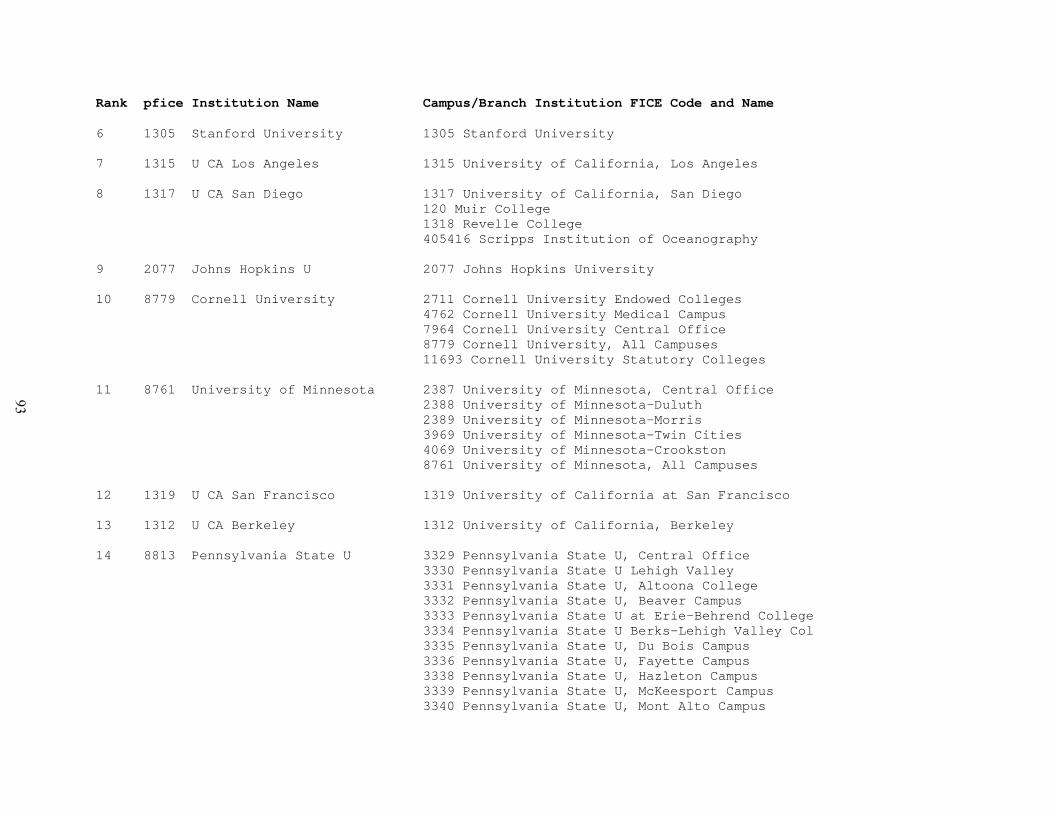
Rank pfice Institution Name Campus/Branch Institution FICE Code and Name 6 1305 Stanford University 1305 Stanford University 7 1315 U CA Los Angeles 1315 University of California, Los Angeles 8 1317 U CA San Diego 1317 University of California, San Diego 120 Muir College 1318 Revelle College 405416 Scripps Institution of Oceanography 9 2077 Johns Hopkins U 2077 Johns Hopkins University 10 8779 Cornell University 2711 Cornell University Endowed Colleges 4762 Cornell University Medical Campus 7964 Cornell University Central Office 8779 Cornell University, All Campuses 11693 Cornell University Statutory Colleges 11 8761 University of Minnesota 2387 University of Minnesota, Central Office 2388 University of Minnesota-Duluth 2389 University of Minnesota-Morris 3969 University of Minnesota-Twin Cities 4069 University of Minnesota-Crookston 8761 University of Minnesota, All Campuses 12 1319 U CA San Francisco 1319 University of California at San Francisco 13 1312 U CA Berkeley 1312 University of California, Berkeley 14 8813 Pennsylvania State U 3329 Pennsylvania State U, Central Office 3330 Pennsylvania State U Lehigh Valley 3331 Pennsylvania State U, Altoona College 3332 Pennsylvania State U, Beaver Campus 3333 Pennsylvania State U at Erie-Behrend College 3334 Pennsylvania State U Berks-Lehigh Valley Col 3335 Pennsylvania State U, Du Bois Campus 3336 Pennsylvania State U, Fayette Campus 3338 Pennsylvania State U, Hazleton Campus 3339 Pennsylvania State U, McKeesport Campus 3340 Pennsylvania State U, Mont Alto Campus
93
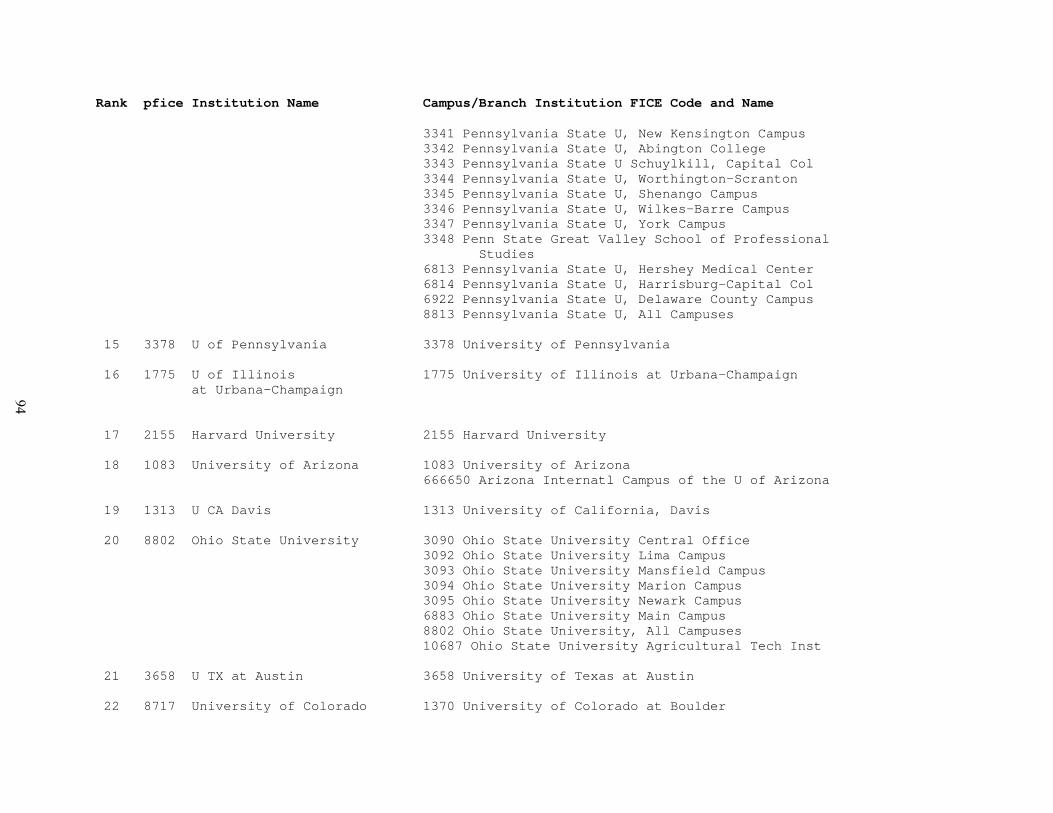
Rank pfice Institution Name Campus/Branch Institution FICE Code and Name 3341 Pennsylvania State U, New Kensington Campus 3342 Pennsylvania State U, Abington College 3343 Pennsylvania State U Schuylkill, Capital Col 3344 Pennsylvania State U, Worthington-Scranton 3345 Pennsylvania State U, Shenango Campus 3346 Pennsylvania State U, Wilkes-Barre Campus 3347 Pennsylvania State U, York Campus 3348 Penn State Great Valley School of Professional Studies 6813 Pennsylvania State U, Hershey Medical Center 6814 Pennsylvania State U, Harrisburg-Capital Col 6922 Pennsylvania State U, Delaware County Campus 8813 Pennsylvania State U, All Campuses 15 3378 U of Pennsylvania 3378 University of Pennsylvania 16 1775 U of Illinois 1775 University of Illinois at Urbana-Champaign at Urbana-Champaign 17 2155 Harvard University 2155 Harvard University 18 1083 University of Arizona 1083 University of Arizona 666650 Arizona Internatl Campus of the U of Arizona 19 1313 U CA Davis 1313 University of California, Davis 20 8802 Ohio State University 3090 Ohio State University Central Office 3092 Ohio State University Lima Campus 3093 Ohio State University Mansfield Campus 3094 Ohio State University Marion Campus 3095 Ohio State University Newark Campus 6883 Ohio State University Main Campus 8802 Ohio State University, All Campuses 10687 Ohio State University Agricultural Tech Inst 21 3658 U TX at Austin 3658 University of Texas at Austin 22 8717 University of Colorado 1370 University of Colorado at Boulder
94
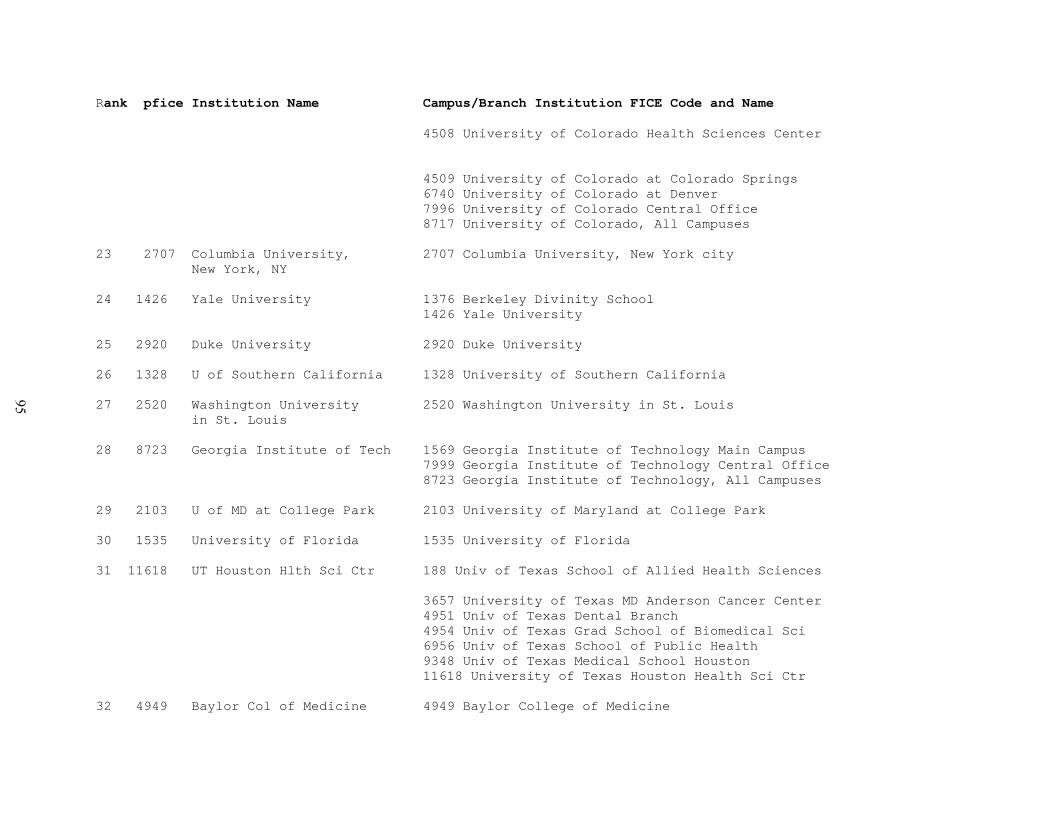
Rank pfice Institution Name Campus/Branch Institution FICE Code and Name 4508 University of Colorado Health Sciences Center 4509 University of Colorado at Colorado Springs 6740 University of Colorado at Denver 7996 University of Colorado Central Office 8717 University of Colorado, All Campuses 23 2707 Columbia University, 2707 Columbia University, New York city New York, NY 24 1426 Yale University 1376 Berkeley Divinity School 1426 Yale University 25 2920 Duke University 2920 Duke University 26 1328 U of Southern California 1328 University of Southern California 27 2520 Washington University 2520 Washington University in St. Louis in St. Louis 28 8723 Georgia Institute of Tech 1569 Georgia Institute of Technology Main Campus 7999 Georgia Institute of Technology Central Office 8723 Georgia Institute of Technology, All Campuses 29 2103 U of MD at College Park 2103 University of Maryland at College Park 30 1535 University of Florida 1535 University of Florida 31 11618 UT Houston Hlth Sci Ctr 188 Univ of Texas School of Allied Health Sciences 3657 University of Texas MD Anderson Cancer Center 4951 Univ of Texas Dental Branch 4954 Univ of Texas Grad School of Biomedical Sci 6956 Univ of Texas School of Public Health 9348 Univ of Texas Medical School Houston 11618 University of Texas Houston Health Sci Ctr 32 4949 Baylor Col of Medicine 4949 Baylor College of Medicine
95
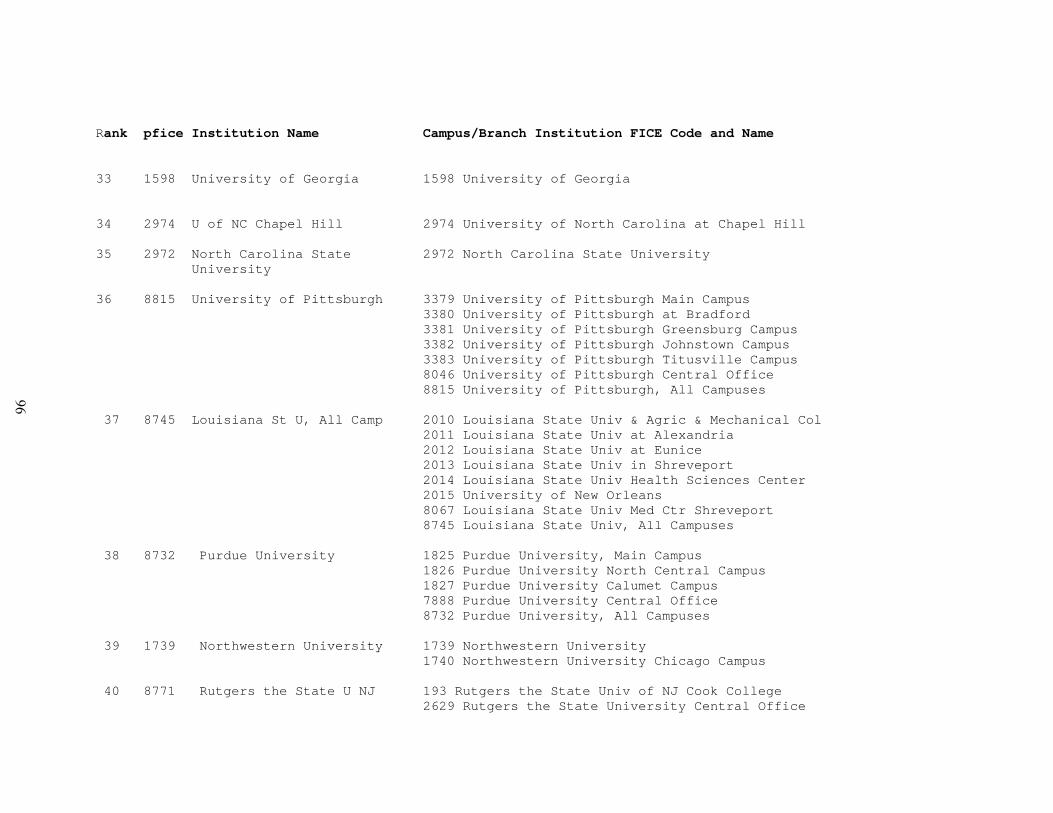
Rank pfice Institution Name Campus/Branch Institution FICE Code and Name 33 1598 University of Georgia 1598 University of Georgia 34 2974 U of NC Chapel Hill 2974 University of North Carolina at Chapel Hill 35 2972 North Carolina State 2972 North Carolina State University University 36 8815 University of Pittsburgh 3379 University of Pittsburgh Main Campus 3380 University of Pittsburgh at Bradford 3381 University of Pittsburgh Greensburg Campus 3382 University of Pittsburgh Johnstown Campus 3383 University of Pittsburgh Titusville Campus 8046 University of Pittsburgh Central Office 8815 University of Pittsburgh, All Campuses 37 8745 Louisiana St U, All Camp 2010 Louisiana State Univ & Agric & Mechanical Col 2011 Louisiana State Univ at Alexandria 2012 Louisiana State Univ at Eunice 2013 Louisiana State Univ in Shreveport 2014 Louisiana State Univ Health Sciences Center 2015 University of New Orleans 8067 Louisiana State Univ Med Ctr Shreveport 8745 Louisiana State Univ, All Campuses 38 8732 Purdue University 1825 Purdue University, Main Campus 1826 Purdue University North Central Campus 1827 Purdue University Calumet Campus 7888 Purdue University Central Office 8732 Purdue University, All Campuses 39 1739 Northwestern University 1739 Northwestern University 1740 Northwestern University Chicago Campus 40 8771 Rutgers the State U NJ 193 Rutgers the State Univ of NJ Cook College 2629 Rutgers the State University Central Office
96
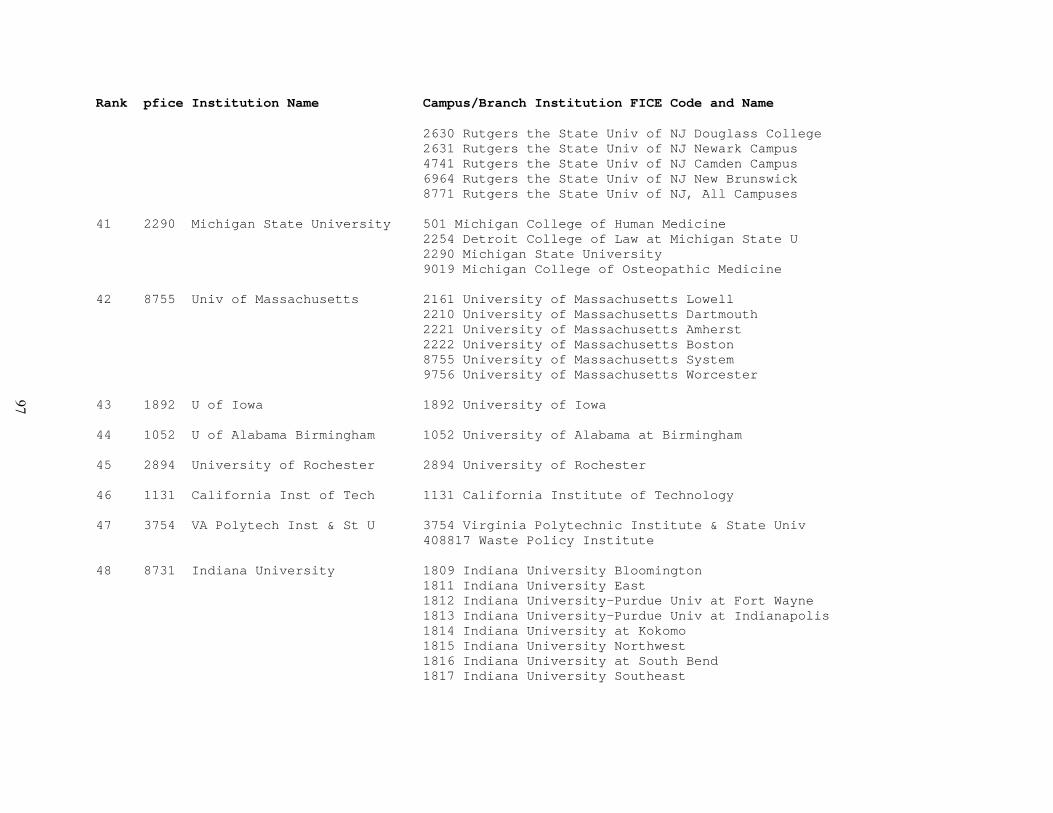
Rank pfice Institution Name Campus/Branch Institution FICE Code and Name 2630 Rutgers the State Univ of NJ Douglass College 2631 Rutgers the State Univ of NJ Newark Campus 4741 Rutgers the State Univ of NJ Camden Campus 6964 Rutgers the State Univ of NJ New Brunswick 8771 Rutgers the State Univ of NJ, All Campuses 41 2290 Michigan State University 501 Michigan College of Human Medicine 2254 Detroit College of Law at Michigan State U 2290 Michigan State University 9019 Michigan College of Osteopathic Medicine 42 8755 Univ of Massachusetts 2161 University of Massachusetts Lowell 2210 University of Massachusetts Dartmouth 2221 University of Massachusetts Amherst 2222 University of Massachusetts Boston 8755 University of Massachusetts System 9756 University of Massachusetts Worcester 43 1892 U of Iowa 1892 University of Iowa 44 1052 U of Alabama Birmingham 1052 University of Alabama at Birmingham 45 2894 University of Rochester 2894 University of Rochester 46 1131 California Inst of Tech 1131 California Institute of Technology 47 3754 VA Polytech Inst & St U 3754 Virginia Polytechnic Institute & State Univ 408817 Waste Policy Institute 48 8731 Indiana University 1809 Indiana University Bloomington 1811 Indiana University East 1812 Indiana University-Purdue Univ at Fort Wayne 1813 Indiana University-Purdue Univ at Indianapolis 1814 Indiana University at Kokomo 1815 Indiana University Northwest 1816 Indiana University at South Bend 1817 Indiana University Southeast
97
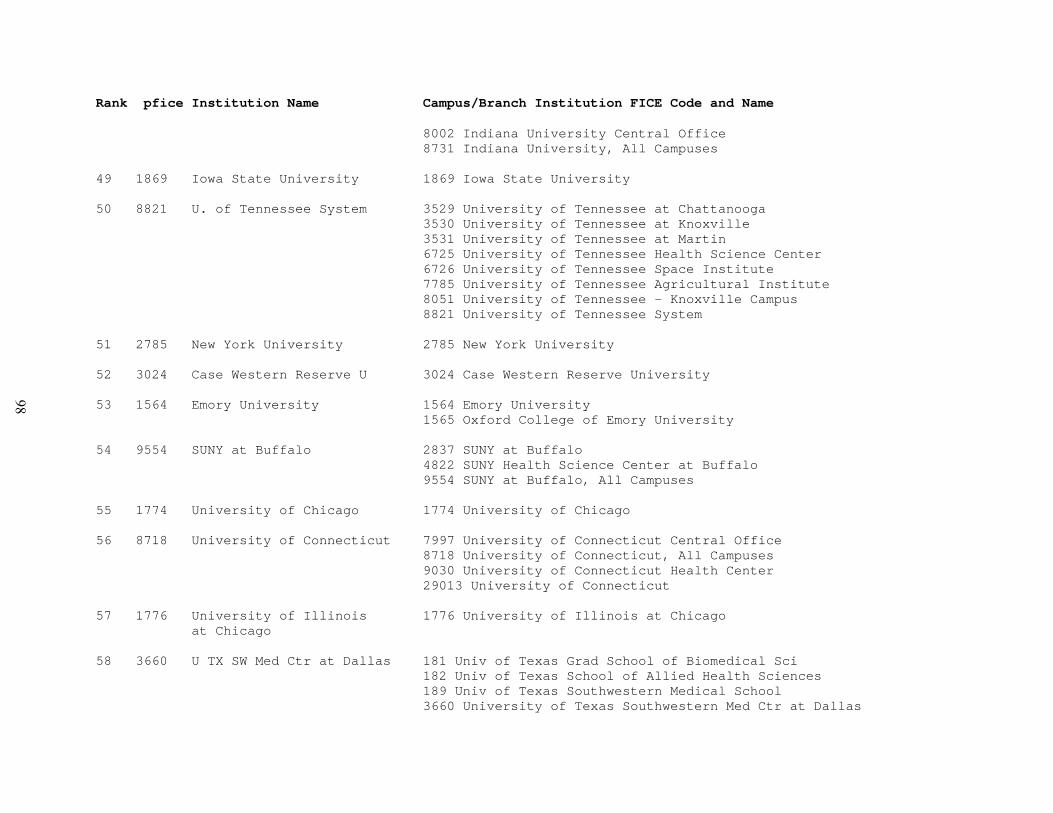
Rank pfice Institution Name Campus/Branch Institution FICE Code and Name 8002 Indiana University Central Office 8731 Indiana University, All Campuses 49 1869 Iowa State University 1869 Iowa State University 50 8821 U. of Tennessee System 3529 University of Tennessee at Chattanooga 3530 University of Tennessee at Knoxville 3531 University of Tennessee at Martin 6725 University of Tennessee Health Science Center 6726 University of Tennessee Space Institute 7785 University of Tennessee Agricultural Institute 8051 University of Tennessee - Knoxville Campus 8821 University of Tennessee System 51 2785 New York University 2785 New York University 52 3024 Case Western Reserve U 3024 Case Western Reserve University 53 1564 Emory University 1564 Emory University 1565 Oxford College of Emory University 54 9554 SUNY at Buffalo 2837 SUNY at Buffalo 4822 SUNY Health Science Center at Buffalo 9554 SUNY at Buffalo, All Campuses 55 1774 University of Chicago 1774 University of Chicago 56 8718 University of Connecticut 7997 University of Connecticut Central Office 8718 University of Connecticut, All Campuses 9030 University of Connecticut Health Center 29013 University of Connecticut 57 1776 University of Illinois 1776 University of Illinois at Chicago at Chicago 58 3660 U TX SW Med Ctr at Dallas 181 Univ of Texas Grad School of Biomedical Sci 182 Univ of Texas School of Allied Health Sciences 189 Univ of Texas Southwestern Medical School 3660 University of Texas Southwestern Med Ctr at Dallas
98
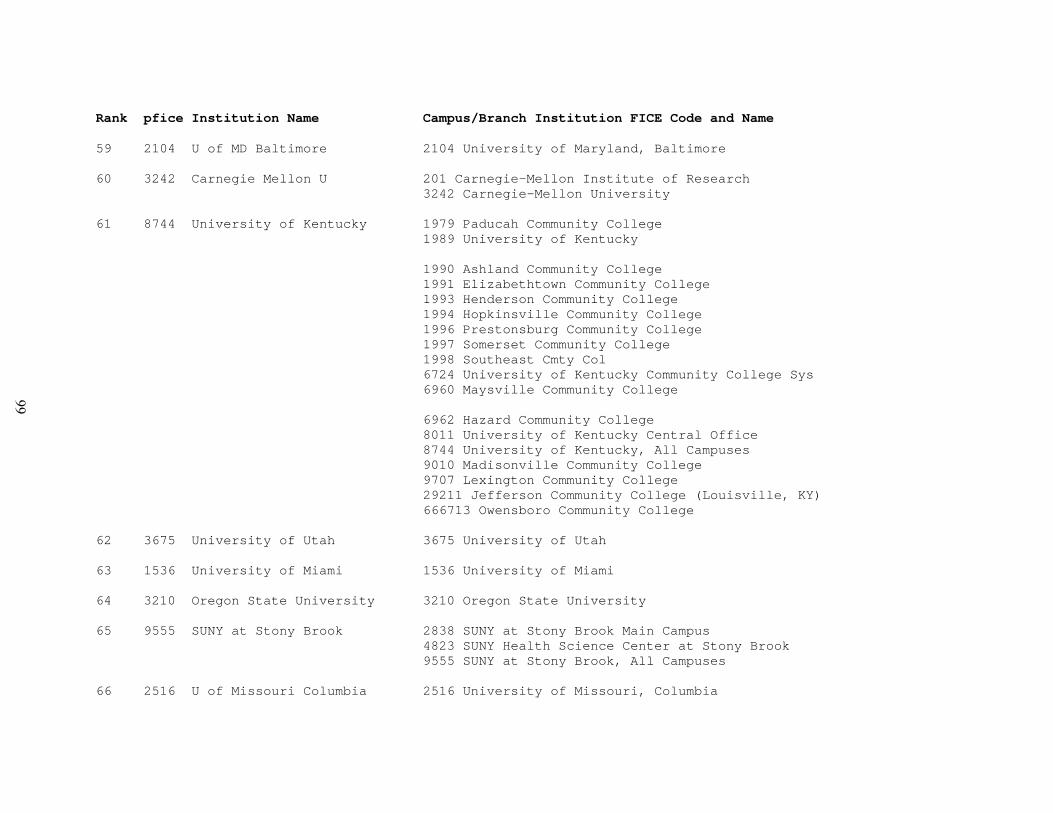
Rank pfice Institution Name Campus/Branch Institution FICE Code and Name 59 2104 U of MD Baltimore 2104 University of Maryland, Baltimore 60 3242 Carnegie Mellon U 201 Carnegie-Mellon Institute of Research 3242 Carnegie-Mellon University 61 8744 University of Kentucky 1979 Paducah Community College 1989 University of Kentucky 1990 Ashland Community College 1991 Elizabethtown Community College 1993 Henderson Community College 1994 Hopkinsville Community College 1996 Prestonsburg Community College 1997 Somerset Community College 1998 Southeast Cmty Col 6724 University of Kentucky Community College Sys 6960 Maysville Community College 6962 Hazard Community College 8011 University of Kentucky Central Office 8744 University of Kentucky, All Campuses 9010 Madisonville Community College 9707 Lexington Community College 29211 Jefferson Community College (Louisville, KY) 666713 Owensboro Community College 62 3675 University of Utah 3675 University of Utah 63 1536 University of Miami 1536 University of Miami 64 3210 Oregon State University 3210 Oregon State University 65 9555 SUNY at Stony Brook 2838 SUNY at Stony Brook Main Campus 4823 SUNY Health Science Center at Stony Brook 9555 SUNY at Stony Brook, All Campuses 66 2516 U of Missouri Columbia 2516 University of Missouri, Columbia
99
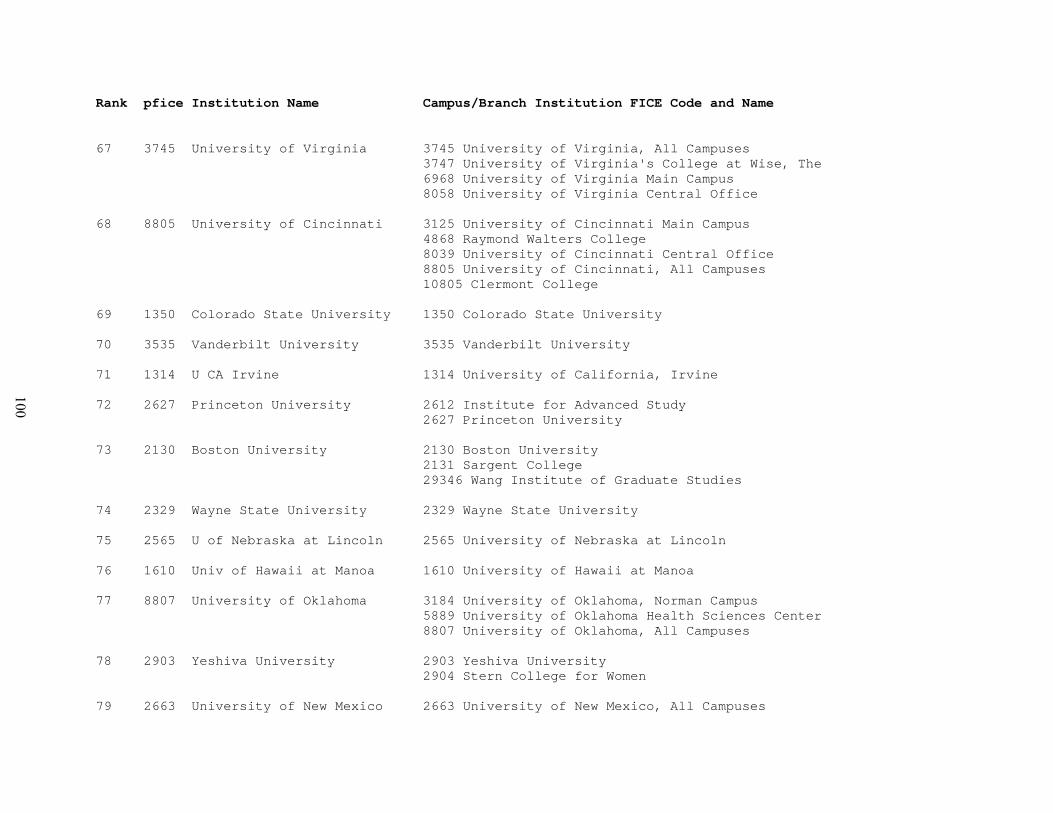
Rank pfice Institution Name Campus/Branch Institution FICE Code and Name 67 3745 University of Virginia 3745 University of Virginia, All Campuses 3747 University of Virginia's College at Wise, The 6968 University of Virginia Main Campus 8058 University of Virginia Central Office 68 8805 University of Cincinnati 3125 University of Cincinnati Main Campus 4868 Raymond Walters College 8039 University of Cincinnati Central Office 8805 University of Cincinnati, All Campuses 10805 Clermont College 69 1350 Colorado State University 1350 Colorado State University 70 3535 Vanderbilt University 3535 Vanderbilt University 71 1314 U CA Irvine 1314 University of California, Irvine 72 2627 Princeton University 2612 Institute for Advanced Study 2627 Princeton University 73 2130 Boston University 2130 Boston University 2131 Sargent College 29346 Wang Institute of Graduate Studies 74 2329 Wayne State University 2329 Wayne State University 75 2565 U of Nebraska at Lincoln 2565 University of Nebraska at Lincoln 76 1610 Univ of Hawaii at Manoa 1610 University of Hawaii at Manoa 77 8807 University of Oklahoma 3184 University of Oklahoma, Norman Campus 5889 University of Oklahoma Health Sciences Center 8807 University of Oklahoma, All Campuses 78 2903 Yeshiva University 2903 Yeshiva University 2904 Stern College for Women 79 2663 University of New Mexico 2663 University of New Mexico, All Campuses
100
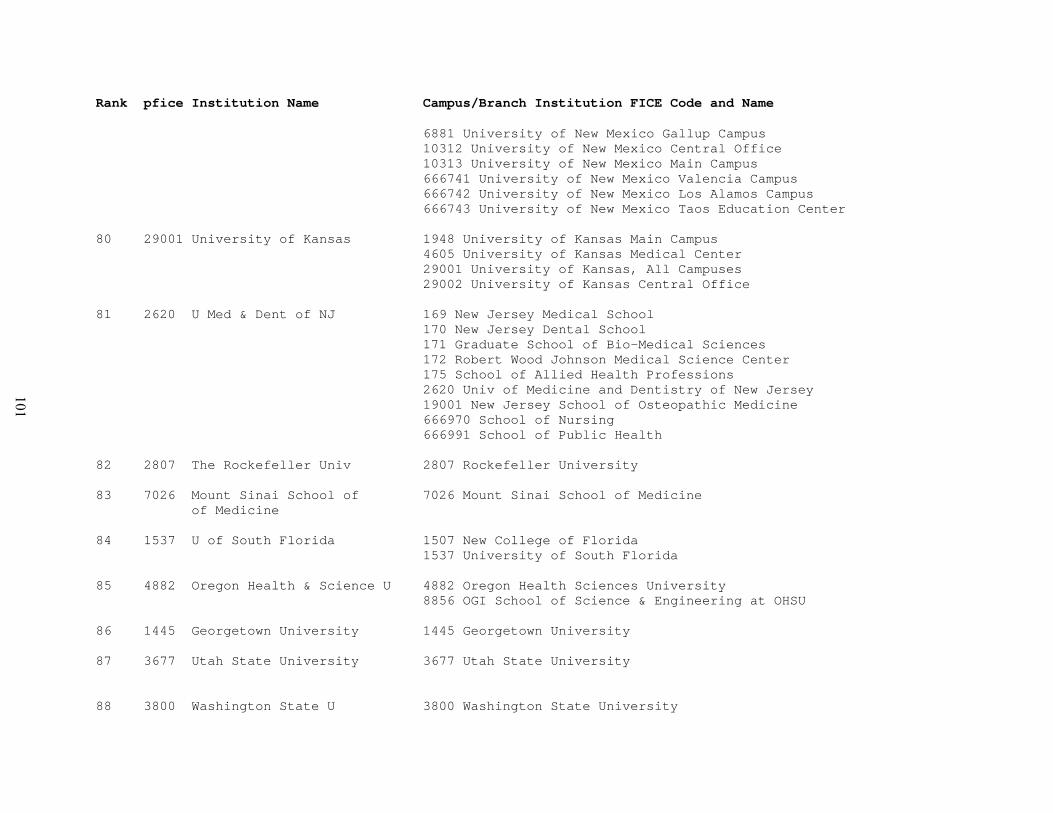
Rank pfice Institution Name Campus/Branch Institution FICE Code and Name
6881 University of New Mexico Gallup Campus 10312 University of New Mexico Central Office 10313 University of New Mexico Main Campus 666741 University of New Mexico Valencia Campus 666742 University of New Mexico Los Alamos Campus 666743 University of New Mexico Taos Education Center 80 29001 University of Kansas 1948 University of Kansas Main Campus 4605 University of Kansas Medical Center 29001 University of Kansas, All Campuses 29002 University of Kansas Central Office 81 2620 U Med & Dent of NJ 169 New Jersey Medical School 170 New Jersey Dental School 171 Graduate School of Bio-Medical Sciences 172 Robert Wood Johnson Medical Science Center 175 School of Allied Health Professions 2620 Univ of Medicine and Dentistry of New Jersey 19001 New Jersey School of Osteopathic Medicine 666970 School of Nursing 666991 School of Public Health 82 2807 The Rockefeller Univ 2807 Rockefeller University 83 7026 Mount Sinai School of 7026 Mount Sinai School of Medicine of Medicine 84 1537 U of South Florida 1507 New College of Florida 1537 University of South Florida 85 4882 Oregon Health & Science U 4882 Oregon Health Sciences University 8856 OGI School of Science & Engineering at OHSU 86 1445 Georgetown University 1445 Georgetown University 87 3677 Utah State University 3677 Utah State University 88 3800 Washington State U 3800 Washington State University
101
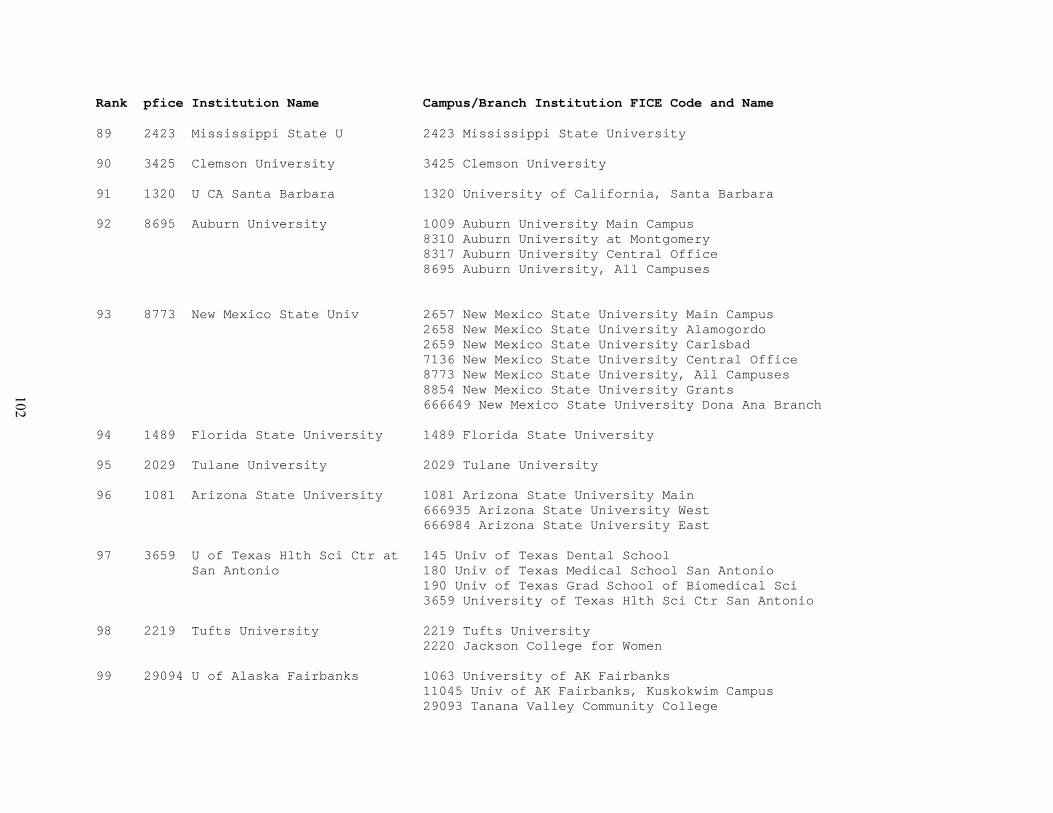
Rank pfice Institution Name Campus/Branch Institution FICE Code and Name 89 2423 Mississippi State U 2423 Mississippi State University 90 3425 Clemson University 3425 Clemson University 91 1320 U CA Santa Barbara 1320 University of California, Santa Barbara 92 8695 Auburn University 1009 Auburn University Main Campus 8310 Auburn University at Montgomery 8317 Auburn University Central Office 8695 Auburn University, All Campuses 93 8773 New Mexico State Univ 2657 New Mexico State University Main Campus 2658 New Mexico State University Alamogordo 2659 New Mexico State University Carlsbad 7136 New Mexico State University Central Office 8773 New Mexico State University, All Campuses 8854 New Mexico State University Grants 666649 New Mexico State University Dona Ana Branch 94 1489 Florida State University 1489 Florida State University 95 2029 Tulane University 2029 Tulane University 96 1081 Arizona State University 1081 Arizona State University Main 666935 Arizona State University West 666984 Arizona State University East 97 3659 U of Texas Hlth Sci Ctr at 145 Univ of Texas Dental School San Antonio 180 Univ of Texas Medical School San Antonio 190 Univ of Texas Grad School of Biomedical Sci 3659 University of Texas Hlth Sci Ctr San Antonio 98 2219 Tufts University 2219 Tufts University 2220 Jackson College for Women 99 29094 U of Alaska Fairbanks 1063 University of AK Fairbanks 11045 Univ of AK Fairbanks, Kuskokwim Campus 29093 Tanana Valley Community College
102
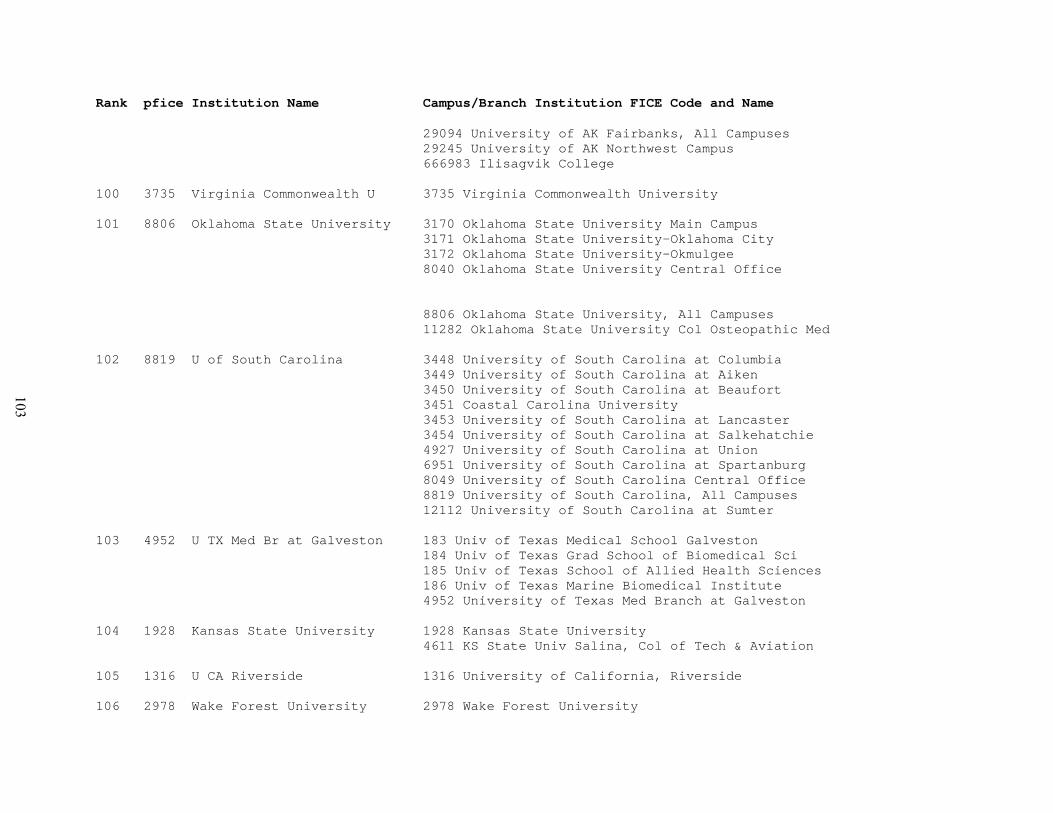
Rank pfice Institution Name Campus/Branch Institution FICE Code and Name 29094 University of AK Fairbanks, All Campuses 29245 University of AK Northwest Campus 666983 Ilisagvik College 100 3735 Virginia Commonwealth U 3735 Virginia Commonwealth University 101 8806 Oklahoma State University 3170 Oklahoma State University Main Campus 3171 Oklahoma State University-Oklahoma City 3172 Oklahoma State University-Okmulgee 8040 Oklahoma State University Central Office 8806 Oklahoma State University, All Campuses 11282 Oklahoma State University Col Osteopathic Med 102 8819 U of South Carolina 3448 University of South Carolina at Columbia 3449 University of South Carolina at Aiken 3450 University of South Carolina at Beaufort 3451 Coastal Carolina University 3453 University of South Carolina at Lancaster 3454 University of South Carolina at Salkehatchie 4927 University of South Carolina at Union 6951 University of South Carolina at Spartanburg 8049 University of South Carolina Central Office 8819 University of South Carolina, All Campuses 12112 University of South Carolina at Sumter 103 4952 U TX Med Br at Galveston 183 Univ of Texas Medical School Galveston 184 Univ of Texas Grad School of Biomedical Sci 185 Univ of Texas School of Allied Health Sciences 186 Univ of Texas Marine Biomedical Institute 4952 University of Texas Med Branch at Galveston 104 1928 Kansas State University 1928 Kansas State University 4611 KS State Univ Salina, Col of Tech & Aviation 105 1316 U CA Riverside 1316 University of California, Riverside 106 2978 Wake Forest University 2978 Wake Forest University
103
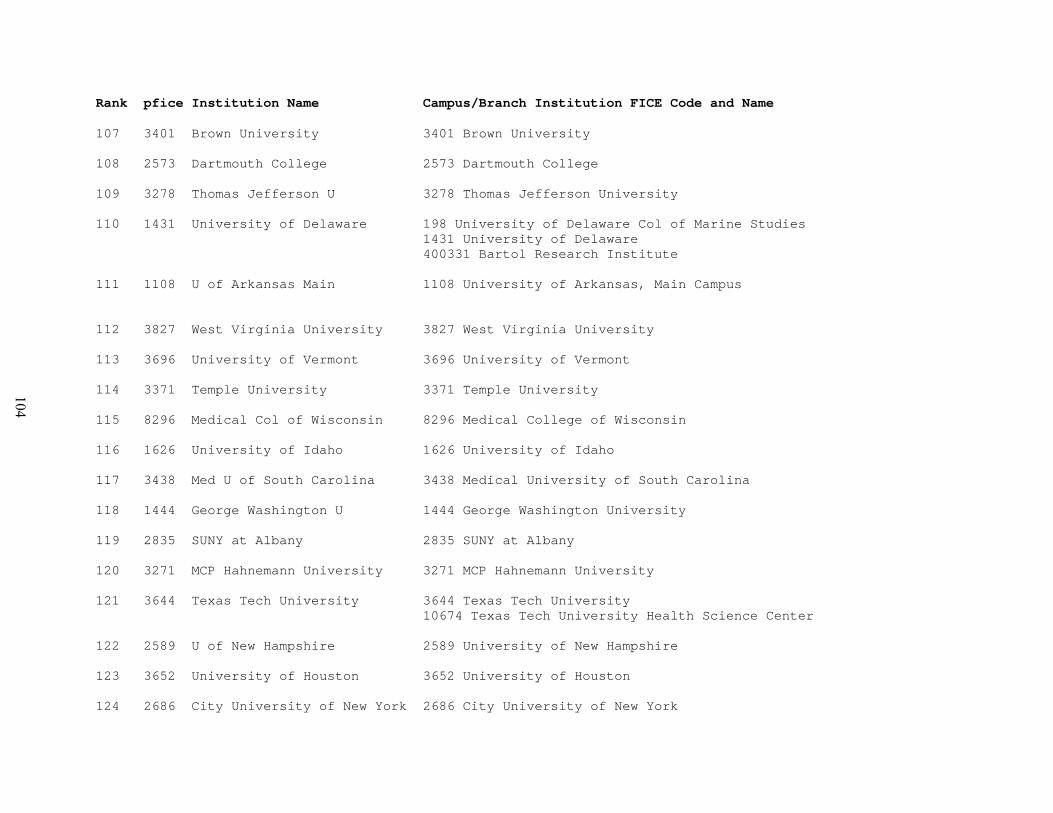
Rank pfice Institution Name Campus/Branch Institution FICE Code and Name 107 3401 Brown University 3401 Brown University 108 2573 Dartmouth College 2573 Dartmouth College 109 3278 Thomas Jefferson U 3278 Thomas Jefferson University 110 1431 University of Delaware 198 University of Delaware Col of Marine Studies 1431 University of Delaware 400331 Bartol Research Institute 111 1108 U of Arkansas Main 1108 University of Arkansas, Main Campus 112 3827 West Virginia University 3827 West Virginia University 113 3696 University of Vermont 3696 University of Vermont 114 3371 Temple University 3371 Temple University 115 8296 Medical Col of Wisconsin 8296 Medical College of Wisconsin 116 1626 University of Idaho 1626 University of Idaho 117 3438 Med U of South Carolina 3438 Medical University of South Carolina 118 1444 George Washington U 1444 George Washington University 119 2835 SUNY at Albany 2835 SUNY at Albany 120 3271 MCP Hahnemann University 3271 MCP Hahnemann University 121 3644 Texas Tech University 3644 Texas Tech University 10674 Texas Tech University Health Science Center 122 2589 U of New Hampshire 2589 University of New Hampshire 123 3652 University of Houston 3652 University of Houston 124 2686 City University of New York 2686 City University of New York
104
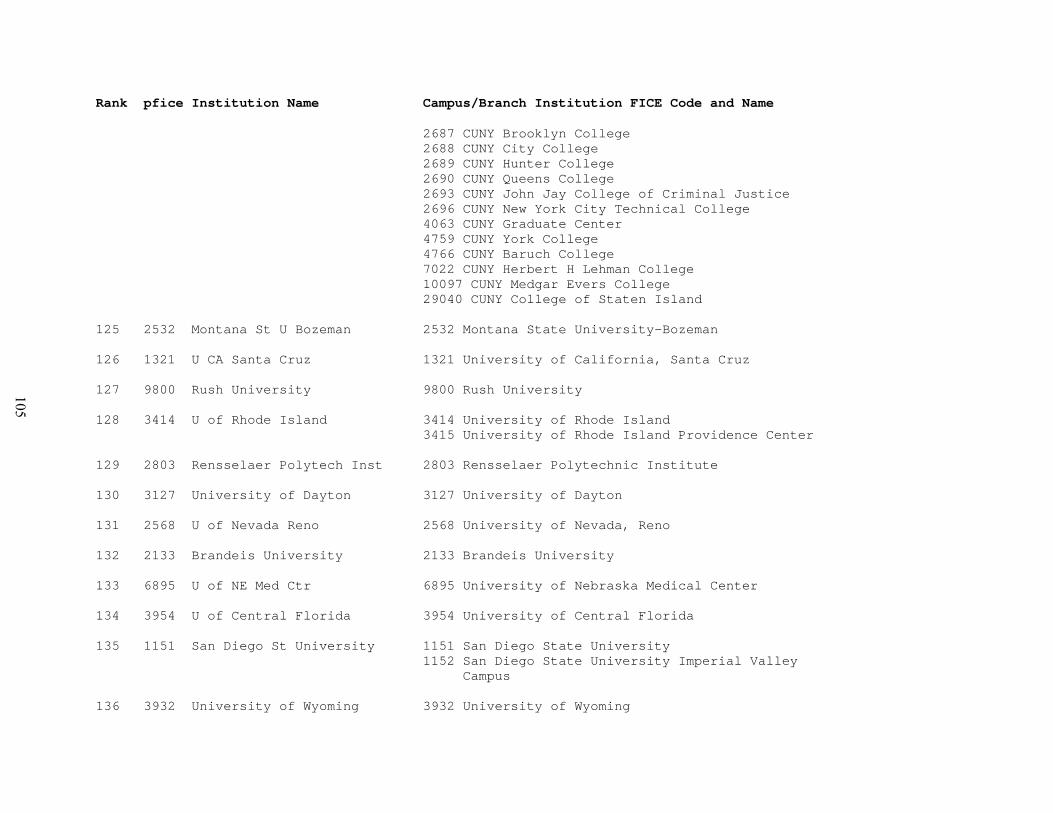
Rank pfice Institution Name Campus/Branch Institution FICE Code and Name 2687 CUNY Brooklyn College
2688 CUNY City College 2689 CUNY Hunter College 2690 CUNY Queens College 2693 CUNY John Jay College of Criminal Justice 2696 CUNY New York City Technical College 4063 CUNY Graduate Center 4759 CUNY York College 4766 CUNY Baruch College 7022 CUNY Herbert H Lehman College 10097 CUNY Medgar Evers College 29040 CUNY College of Staten Island 125 2532 Montana St U Bozeman 2532 Montana State University-Bozeman 126 1321 U CA Santa Cruz 1321 University of California, Santa Cruz 127 9800 Rush University 9800 Rush University 128 3414 U of Rhode Island 3414 University of Rhode Island 3415 University of Rhode Island Providence Center 129 2803 Rensselaer Polytech Inst 2803 Rensselaer Polytechnic Institute 130 3127 University of Dayton 3127 University of Dayton 131 2568 U of Nevada Reno 2568 University of Nevada, Reno 132 2133 Brandeis University 2133 Brandeis University 133 6895 U of NE Med Ctr 6895 University of Nebraska Medical Center 134 3954 U of Central Florida 3954 University of Central Florida 135 1151 San Diego St University 1151 San Diego State University 1152 San Diego State University Imperial Valley Campus 136 3932 University of Wyoming 3932 University of Wyoming
105
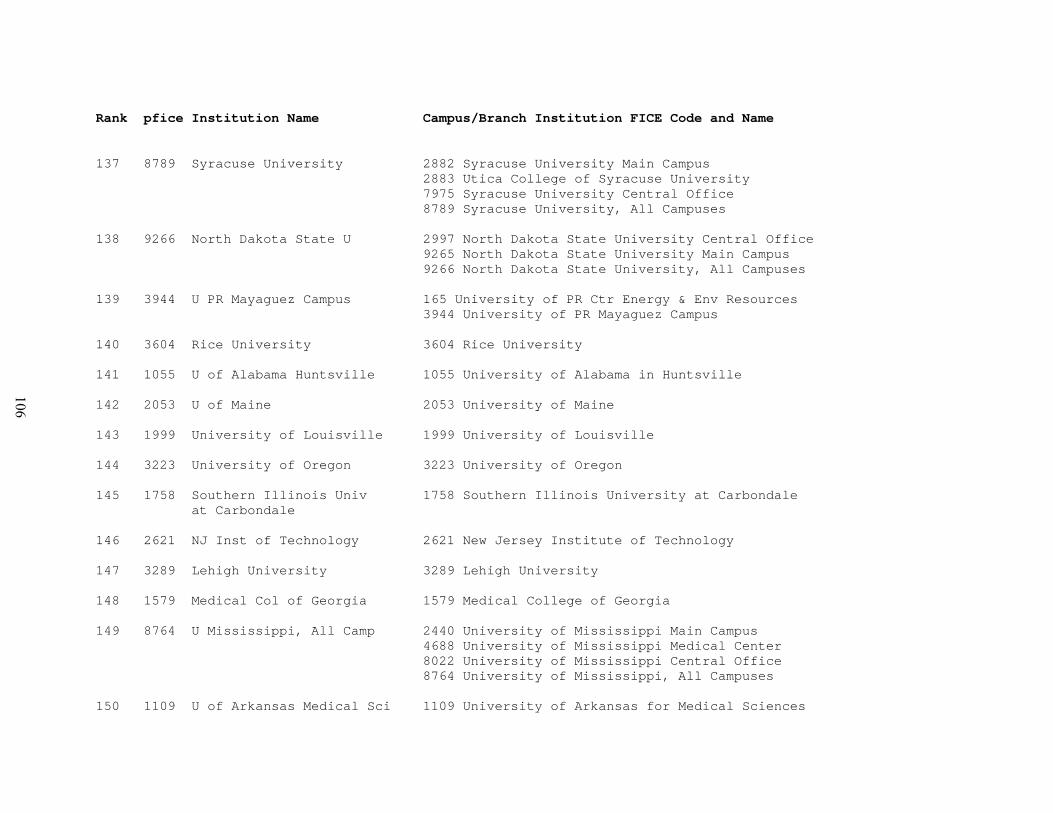
Rank pfice Institution Name Campus/Branch Institution FICE Code and Name 137 8789 Syracuse University 2882 Syracuse University Main Campus 2883 Utica College of Syracuse University 7975 Syracuse University Central Office 8789 Syracuse University, All Campuses 138 9266 North Dakota State U 2997 North Dakota State University Central Office 9265 North Dakota State University Main Campus 9266 North Dakota State University, All Campuses 139 3944 U PR Mayaguez Campus 165 University of PR Ctr Energy & Env Resources 3944 University of PR Mayaguez Campus 140 3604 Rice University 3604 Rice University 141 1055 U of Alabama Huntsville 1055 University of Alabama in Huntsville 142 2053 U of Maine 2053 University of Maine 143 1999 University of Louisville 1999 University of Louisville 144 3223 University of Oregon 3223 University of Oregon 145 1758 Southern Illinois Univ 1758 Southern Illinois University at Carbondale at Carbondale 146 2621 NJ Inst of Technology 2621 New Jersey Institute of Technology 147 3289 Lehigh University 3289 Lehigh University 148 1579 Medical Col of Georgia 1579 Medical College of Georgia 149 8764 U Mississippi, All Camp 2440 University of Mississippi Main Campus 4688 University of Mississippi Medical Center 8022 University of Mississippi Central Office 8764 University of Mississippi, All Campuses 150 1109 U of Arkansas Medical Sci 1109 University of Arkansas for Medical Sciences
106

Rank pfice Institution Name Campus/Branch Institution FICE Code and Name 151 2839 SUNY Hlth Sci Ctr at Brklyn 2839 SUNY Health Science Center at Brooklyn 152 1310 Naval Postgrad School 1310 Naval Postgraduate School 153 1710 Loyola U of Chicago 1710 Loyola University of Chicago 154 31020 U MD Biotechnology Inst 31020 University of Maryland, Biotechnology Inst 155 1840 University of Notre Dame 1840 University of Notre Dame 156 29169 Unif Svcs U of Hlth Sciences 29169 Uniformed Services University of Hlth Sci 157 1051 University of Alabama 1051 University of Alabama, The 158 2654 New Mexico Inst Mining & 2654 New Mexico Institute of Mining and Technology Tech 159 8828 Col of William & Mary 3705 College of William and Mary 3706 Christopher Newport University 3707 Richard Bland College 8055 College of William and Mary Central Office 8828 College of William and Mary, All Campuses 400801 Virginia Institute of Marine Science 160 8766 Saint Louis University 2506 St Louis University Main Campus 8024 St Louis University Central Office 8766 St Louis University, All Campuses 161 1448 Howard University 1448 Howard University 162 9635 Florida International U 9635 Florida International University 163 2292 Michigan Tech University 2292 Michigan Technological University 164 19039 U of MD Center for 19039 U of MD Center for Environmental Science Environmental Science 165 2851 SUNY Col of Env Sci & Frstry 2851 SUNY College of Environmental Sci & Forestry
107
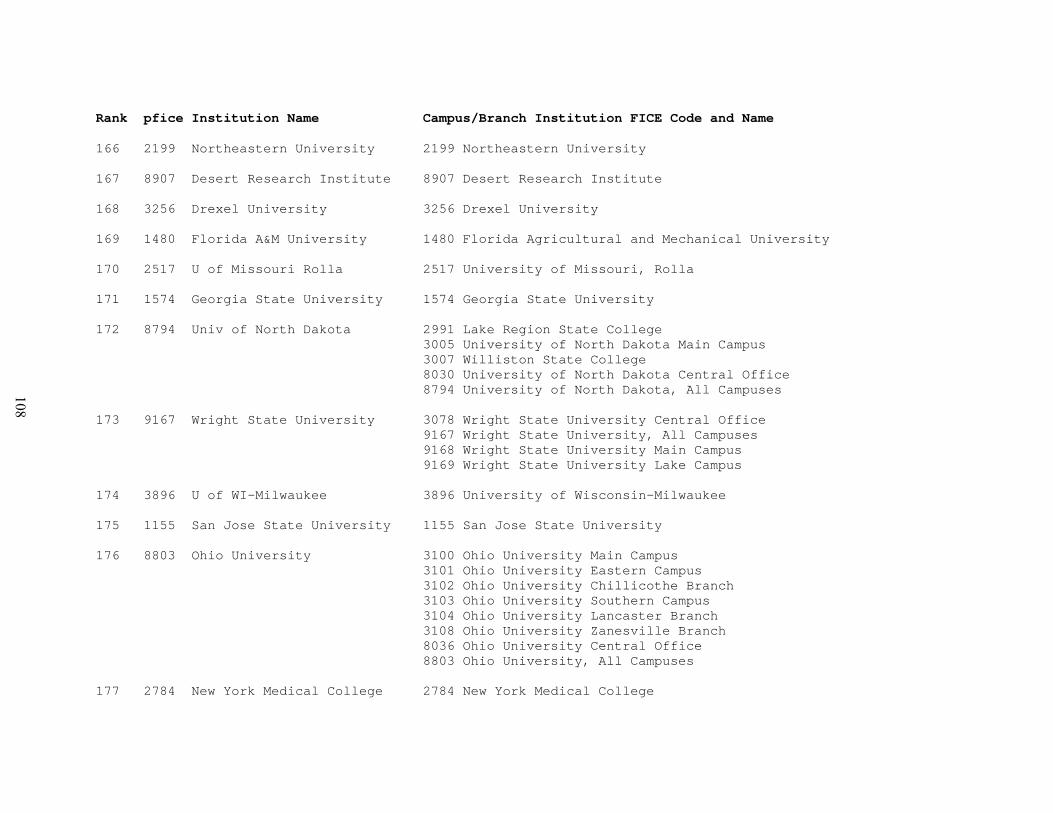
Rank pfice Institution Name Campus/Branch Institution FICE Code and Name 166 2199 Northeastern University 2199 Northeastern University 167 8907 Desert Research Institute 8907 Desert Research Institute 168 3256 Drexel University 3256 Drexel University 169 1480 Florida A&M University 1480 Florida Agricultural and Mechanical University 170 2517 U of Missouri Rolla 2517 University of Missouri, Rolla 171 1574 Georgia State University 1574 Georgia State University 172 8794 Univ of North Dakota 2991 Lake Region State College 3005 University of North Dakota Main Campus 3007 Williston State College 8030 University of North Dakota Central Office 8794 University of North Dakota, All Campuses 173 9167 Wright State University 3078 Wright State University Central Office 9167 Wright State University, All Campuses 9168 Wright State University Main Campus 9169 Wright State University Lake Campus 174 3896 U of WI-Milwaukee 3896 University of Wisconsin-Milwaukee 175 1155 San Jose State University 1155 San Jose State University 176 8803 Ohio University 3100 Ohio University Main Campus 3101 Ohio University Eastern Campus 3102 Ohio University Chillicothe Branch 3103 Ohio University Southern Campus 3104 Ohio University Lancaster Branch 3108 Ohio University Zanesville Branch 8036 Ohio University Central Office 8803 Ohio University, All Campuses 177 2784 New York Medical College 2784 New York Medical College
108
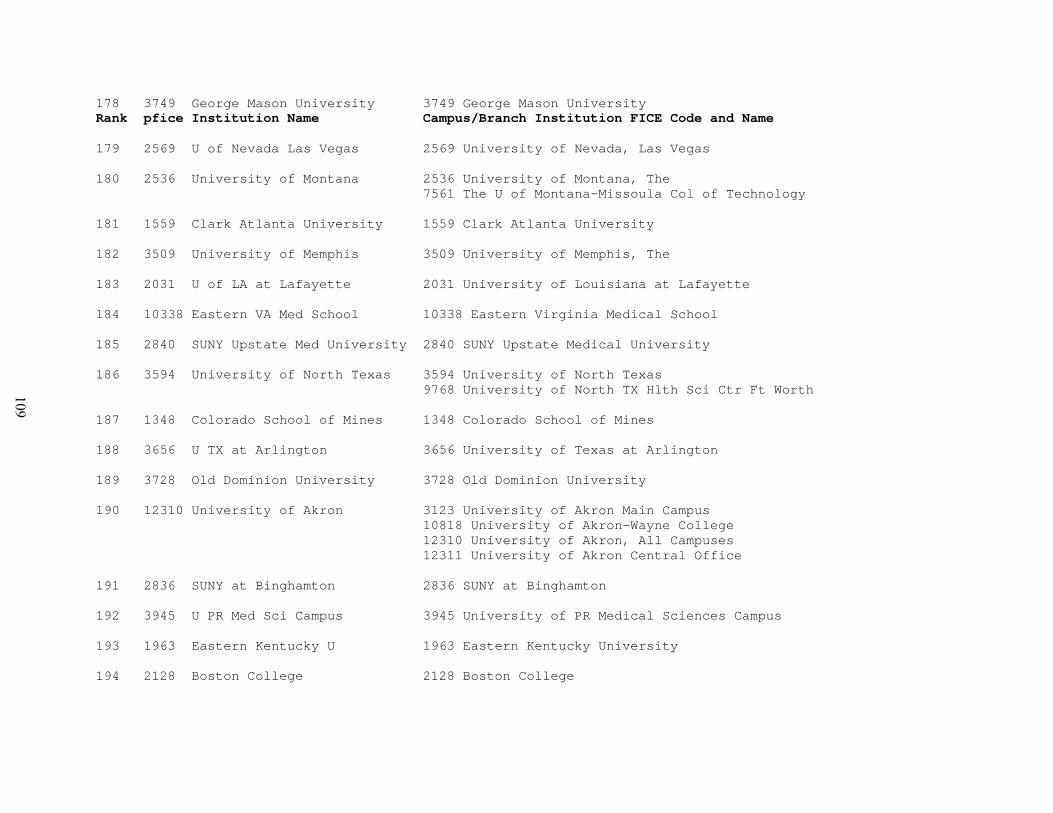
178 3749 George Mason University 3749 George Mason University Rank pfice Institution Name Campus/Branch Institution FICE Code and Name 179 2569 U of Nevada Las Vegas 2569 University of Nevada, Las Vegas 180 2536 University of Montana 2536 University of Montana, The 7561 The U of Montana-Missoula Col of Technology 181 1559 Clark Atlanta University 1559 Clark Atlanta University 182 3509 University of Memphis 3509 University of Memphis, The 183 2031 U of LA at Lafayette 2031 University of Louisiana at Lafayette 184 10338 Eastern VA Med School 10338 Eastern Virginia Medical School 185 2840 SUNY Upstate Med University 2840 SUNY Upstate Medical University 186 3594 University of North Texas 3594 University of North Texas 9768 University of North TX Hlth Sci Ctr Ft Worth 187 1348 Colorado School of Mines 1348 Colorado School of Mines 188 3656 U TX at Arlington 3656 University of Texas at Arlington 189 3728 Old Dominion University 3728 Old Dominion University 190 12310 University of Akron 3123 University of Akron Main Campus 10818 University of Akron-Wayne College 12310 University of Akron, All Campuses 12311 University of Akron Central Office 191 2836 SUNY at Binghamton 2836 SUNY at Binghamton 192 3945 U PR Med Sci Campus 3945 University of PR Medical Sciences Campus 193 1963 Eastern Kentucky U 1963 Eastern Kentucky University 194 2128 Boston College 2128 Boston College
109

195 12305 Brigham Young University 1606 Brigham Young University Hawaii Campus Rank pfice Institution Name Campus/Branch Institution FICE Code and Name 3670 Brigham Young University, Main Campus 12305 Brigham Young University, All Campuses 12306 Brigham Young University Central Office 196 166 C R Drew U of Med & Sci 166 Charles R Drew University of Medicine & Sci 197 3471 South Dakota State U 3471 South Dakota State University 198 9741 U TX at Dallas 9741 University of Texas at Dallas 400902 Callier Center for Communications Disorders 199 2105 U of MD Baltimore County 2105 University of Maryland, Baltimore County 200 3661 U of TX at El Paso 3661 University of Texas at El Paso
FICE=Federal Interagency Commission on Education SOURCES: Thomson ISI, Science Citation and Social Sciences Citation Indexes, http:www.isinet.com/products/citation/; ipIQ, Inc.; National Science Foundation (NSF), Division of Science Resources Statistics, special tabulations; and NSF WebCASPAR database, special tabulations.
110
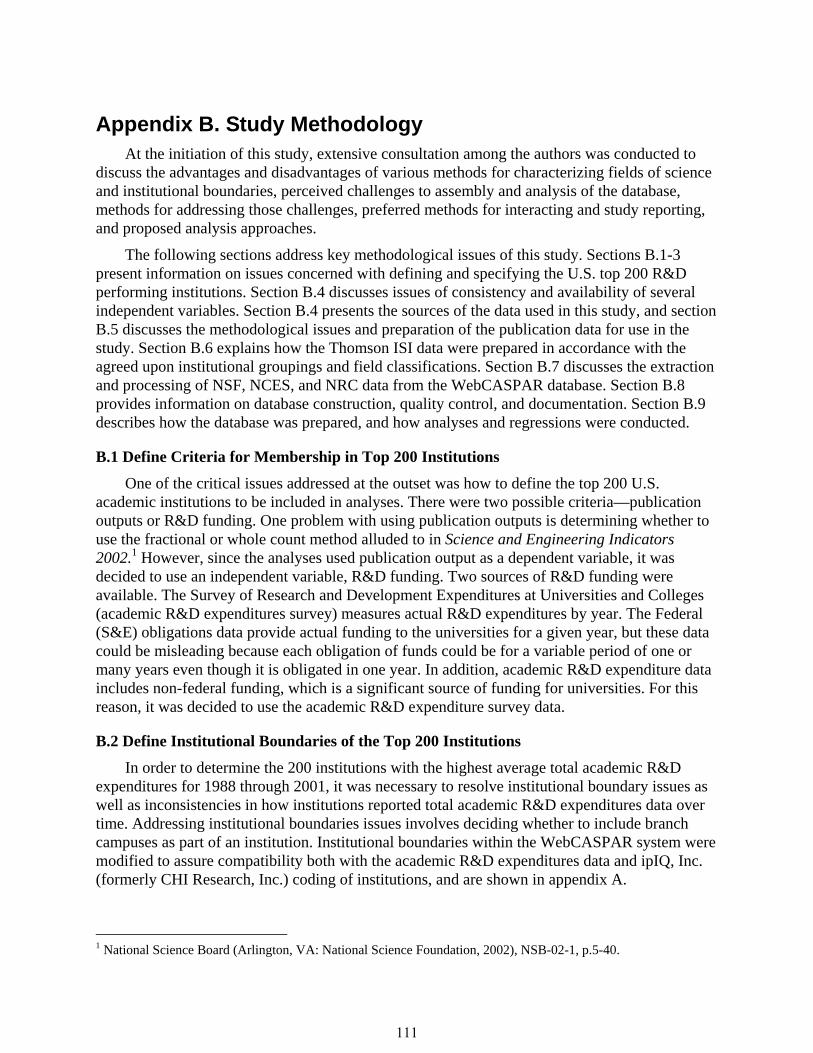
Appendix B. Study Methodology At the initiation of this study, extensive consultation among the authors was conducted to
discuss the advantages and disadvantages of various methods for characterizing fields of science and institutional boundaries, perceived challenges to assembly and analysis of the database, methods for addressing those challenges, preferred methods for interacting and study reporting, and proposed analysis approaches.
The following sections address key methodological issues of this study. Sections B.1-3 present information on issues concerned with defining and specifying the U.S. top 200 R&D performing institutions. Section B.4 discusses issues of consistency and availability of several independent variables. Section B.4 presents the sources of the data used in this study, and section B.5 discusses the methodological issues and preparation of the publication data for use in the study. Section B.6 explains how the Thomson ISI data were prepared in accordance with the agreed upon institutional groupings and field classifications. Section B.7 discusses the extraction and processing of NSF, NCES, and NRC data from the WebCASPAR database. Section B.8 provides information on database construction, quality control, and documentation. Section B.9 describes how the database was prepared, and how analyses and regressions were conducted.
B.1 Define Criteria for Membership in Top 200 Institutions
One of the critical issues addressed at the outset was how to define the top 200 U.S. academic institutions to be included in analyses. There were two possible criteria—publication outputs or R&D funding. One problem with using publication outputs is determining whether to use the fractional or whole count method alluded to in Science and Engineering Indicators 2002.1 However, since the analyses used publication output as a dependent variable, it was decided to use an independent variable, R&D funding. Two sources of R&D funding were available. The Survey of Research and Development Expenditures at Universities and Colleges (academic R&D expenditures survey) measures actual R&D expenditures by year. The Federal (S&E) obligations data provide actual funding to the universities for a given year, but these data could be misleading because each obligation of funds could be for a variable period of one or many years even though it is obligated in one year. In addition, academic R&D expenditure data includes non-federal funding, which is a significant source of funding for universities. For this reason, it was decided to use the academic R&D expenditure survey data.
B.2 Define Institutional Boundaries of the Top 200 Institutions
In order to determine the 200 institutions with the highest average total academic R&D expenditures for 1988 through 2001, it was necessary to resolve institutional boundary issues as well as inconsistencies in how institutions reported total academic R&D expenditures data over time. Addressing institutional boundaries issues involves deciding whether to include branch campuses as part of an institution. Institutional boundaries within the WebCASPAR system were modified to assure compatibility both with the academic R&D expenditures data and ipIQ, Inc. (formerly CHI Research, Inc.) coding of institutions, and are shown in appendix A.
1 National Science Board (Arlington, VA: National Science Foundation, 2002), NSB-02-1, p.5-40.
111
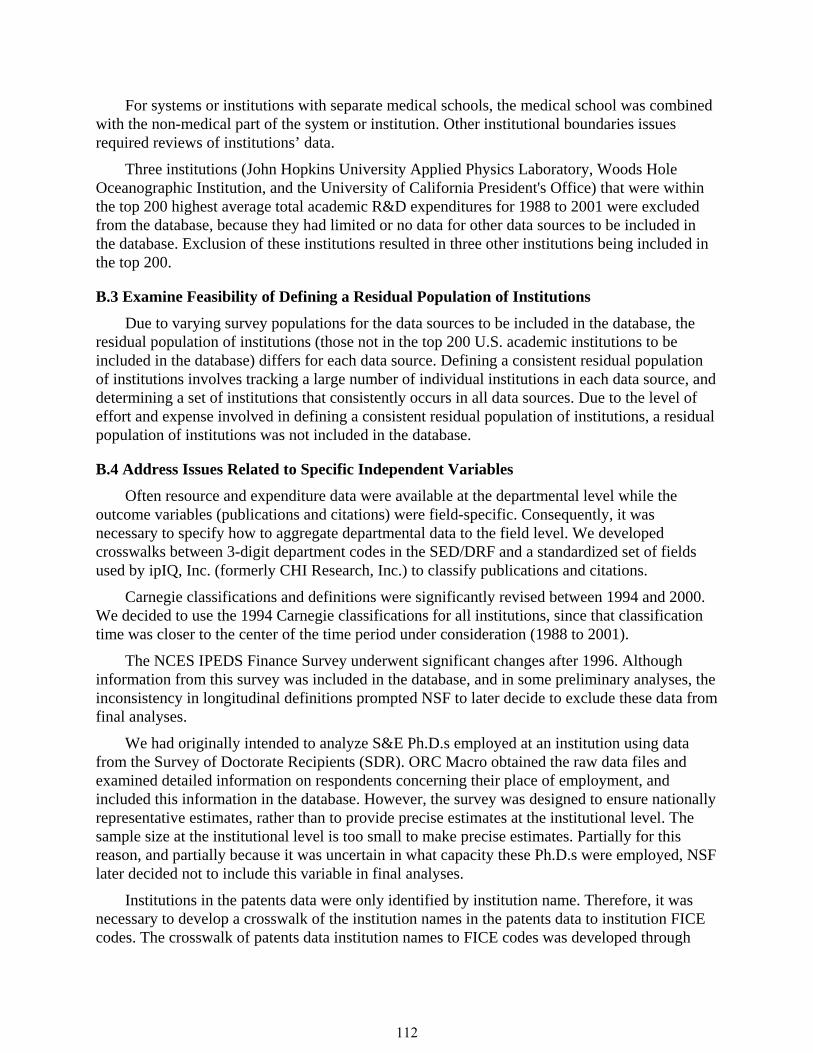
For systems or institutions with separate medical schools, the medical school was combined with the non-medical part of the system or institution. Other institutional boundaries issues required reviews of institutions’ data.
Three institutions (John Hopkins University Applied Physics Laboratory, Woods Hole Oceanographic Institution, and the University of California President's Office) that were within the top 200 highest average total academic R&D expenditures for 1988 to 2001 were excluded from the database, because they had limited or no data for other data sources to be included in the database. Exclusion of these institutions resulted in three other institutions being included in the top 200.
B.3 Examine Feasibility of Defining a Residual Population of Institutions
Due to varying survey populations for the data sources to be included in the database, the residual population of institutions (those not in the top 200 U.S. academic institutions to be included in the database) differs for each data source. Defining a consistent residual population of institutions involves tracking a large number of individual institutions in each data source, and determining a set of institutions that consistently occurs in all data sources. Due to the level of effort and expense involved in defining a consistent residual population of institutions, a residual population of institutions was not included in the database.
B.4 Address Issues Related to Specific Independent Variables
Often resource and expenditure data were available at the departmental level while the outcome variables (publications and citations) were field-specific. Consequently, it was necessary to specify how to aggregate departmental data to the field level. We developed crosswalks between 3-digit department codes in the SED/DRF and a standardized set of fields used by ipIQ, Inc. (formerly CHI Research, Inc.) to classify publications and citations.
Carnegie classifications and definitions were significantly revised between 1994 and 2000. We decided to use the 1994 Carnegie classifications for all institutions, since that classification time was closer to the center of the time period under consideration (1988 to 2001).
The NCES IPEDS Finance Survey underwent significant changes after 1996. Although information from this survey was included in the database, and in some preliminary analyses, the inconsistency in longitudinal definitions prompted NSF to later decide to exclude these data from final analyses.
We had originally intended to analyze S&E Ph.D.s employed at an institution using data from the Survey of Doctorate Recipients (SDR). ORC Macro obtained the raw data files and examined detailed information on respondents concerning their place of employment, and included this information in the database. However, the survey was designed to ensure nationally representative estimates, rather than to provide precise estimates at the institutional level. The sample size at the institutional level is too small to make precise estimates. Partially for this reason, and partially because it was uncertain in what capacity these Ph.D.s were employed, NSF later decided not to include this variable in final analyses.
Institutions in the patents data were only identified by institution name. Therefore, it was necessary to develop a crosswalk of the institution names in the patents data to institution FICE codes. The crosswalk of patents data institution names to FICE codes was developed through
112
automated and manual comparisons of institution names. Although patents data are available by year, due to the sparseness of the data by year, all data for 1988 to 2001 were aggregated.
B.5 Extract Data for the Database's Population of Institutions
To construct the Publication Trends database, data were extracted from the following sources:
Thomson ISI, Science Citation Index (SCI) and Social Sciences Citation Index (SSCI); data provided by ipIQ, Inc. (formerly CHI Research, Inc.).
NCES IPEDS Finance Survey; WebCASPAR database system input SAS data sets.
NCES IPEDS Opening Fall Enrollment Survey; WebCASPAR database system input SAS data sets.
NCES IPEDS Salaries, Tenure, and Fringe Benefits of Full-time Instructional Faculty Survey; WebCASPAR database system input SAS data sets.
NSF Survey of Doctorate Recipients; WebCASPAR database system, ABC-SQL Query Tool input data sets.
NSF Survey of Earned Doctorates (SED)/Doctorate Records File (DRF); WebCASPAR database system input SAS data sets.
NSF Survey of Research and Development Expenditures at Colleges and Universities; WebCASPAR database system input SAS data sets.
NSF-NIH Survey of Graduate Students and Postdoctorates in Science and Engineering; WebCASPAR database system input SAS data sets.
Research Doctorate Programs in the United States: Continuity and Change; National Academy of Sciences, National Research Council; WebCASPAR database system input SAS data sets.
Patents data provided by the United State Patent and Trademark Office, Office of Electronic Information Products.
In addition, the following institution attributes were extracted from WebCASPAR source data sets for inclusion in the database:
1994 Carnegie Classification
Type of Institutional Control (public/private)
B.6 Process SCI and SSCI Data
The Thomson ISI SCI and SSCI data were pre-aggregated by ipIQ, Inc. (formerly CHI Research, Inc.)2 in accordance with the institutional boundaries used in the defining the 200 institutions included in the database. NSF provided ipIQ, Inc. with a detailed listing of institutional groupings by FICE code and institution name. This listing was prepared by ORC
2 Thomson ISI, Science Citation and Social Sciences Citation Indexes, http:www.isinet.com/productis/citation/; ipIQ, Inc.; National Science Foundation (NSF), Division of Science Resources Statistics, special tabulations; and NSF WebCASPAR database, special tabulations.
113
Macro using the WebCASPAR crosswalk of child to parent institutions as well as the Codebook for Compatible Statistical Reporting of Federal Science and Engineering Support to Universities, Colleges, and Nonprofit Institutions that includes some child institutions that are not in WebCASPAR, but may occur in the SCI/SSCI data. Also included for some institutional groupings were notes added by NSF to indicate institutions that have a medical school for which SCI and SSCI data should be included in the institutional grouping as well as to indicate other factors to consider in aggregating the data such as institutions to exclude, alternate institution names, and other institutional components (observatories, research institutes, etc.) to include.
For the Thomson ISI SCI and SSCI data, it was necessary to develop crosswalks of the institution and field identifiers used in those data to institution FICE codes and WebCASPAR field codes. The crosswalk of SCI/SSCI institution names to FICE codes was developed through automated and manual comparisons of institution names. Institution address information was also used to confirm mappings. The SCI/SSCI data contained field codes and names for 135 unique fields as classified by ipIQ, Inc. (formerly CHI Research, Inc.). These fields were mapped to WebCASPAR fields by manually comparing the name of each SCI/SSCI field to the survey-specific field names in the following WebCASPAR data sources for which crosswalks to WebCASPAR fields already existed:
NSF Survey of Earned Doctorates (SED)/Doctorate Records File (DRF)
NSF-NIH Survey of Graduate Students and Postdoctorates in Science and Engineering
Research Doctorate Programs in the United States: Continuity and Change; National Academy of Sciences, National Research Council
Where possible, each SCI/SSCI field was mapped to a survey-specific field name in each of the above data sources. The existing crosswalks of survey-specific field to WebCASPAR field for each of these data sources were used to determine the appropriate WebCASPAR field for each SCI/SSCI field. Using this methodology, all but twelve SCI/SSCI fields were mapped to WebCASPAR fields. The remaining twelve SCI/SSCI fields were mapped to WebCASPAR fields through additional research of field definitions, including the use of a file provided by ipIQ, Inc. (formerly CHI Research, Inc.) that maps fields and subfields to journal titles. (For a crosswalk between WebCASPAR and ipIQ fields, see appendix E).
B.7 Process Data Extracted from WebCASPAR
NSF and NCES IPEDS data as well as doctorate program rating data from the National Research Council’s (NRC) publication, Research Doctorate Programs in the United States: Continuity and Change, were extracted from WebCASPAR database system input SAS data sets prepared by ORC Macro. The NSF SDR data were extracted from the input SAS data set for WebCASPAR’s ABC-SQL Query Tool component prepared by ORC Macro. Because the survey-specific fields in the WebCASPAR and ABC-SQL Query Tool input SAS data sets had already been mapped to WebCASPAR fields, no further processing of the field data was necessary.
The WebCASPAR data were aggregated by ORC Macro in accordance with the institutional boundaries used in the defining the 200 institutions included in the database.
114
The SDR is a sample survey of individuals; sample data for individuals were weighted to obtain institution estimates. In addition, because the SDR is a biennial survey that was conducted in odd-numbered years 1987 through 2001, data for even-numbered years 1988 through 2000 were interpolated. Although estimates of the number of Ph.D.s employed at each institution was entered into the database, partially due to concerns about the appropriateness of institutional estimates derived from this data source and partially because it was uncertain in what capacity these Ph.D.s were employed, these data were never used in the analyses.
For some disciplines, NRC scholarly quality ratings data were collected at a more detailed field level than the WebCASPAR fields. Therefore, for these fields, it was necessary to compute a weighted average of the program ratings, and the institution's number of graduates in the program was used to weight the ranking data. Similarly, the NRC scholarly quality rating distinguished indicators were collected at a more detailed field level than the WebCASPAR fields; therefore, for these fields, it was necessary to derive the NRC scholarly quality rating distinguished indicator as follows:
Institutions rated distinguished in mathematics, are rated distinguished in mathematics/statistics, regardless of the rating in the smaller field,
Institutions rated distinguished in statistics and that also had a weighted average above 4.00 in mathematics/statistics are counted as distinguished,
Institutions rated distinguished in three or more of the seven biology subfields are counted as distinguished, and
Institutions that have a weighted average in biology above 4.00 are counted as distinguished.
B.8 Database Construction, Quality Control, and Documentation
After the data for the 200 U.S. academic institutions to be included in the database were extracted from each data source and processed, the data were stored in a separate, intermediary SAS data set for each data source. These intermediary SAS data sets were then combined into a single SAS data set by merging the records in each intermediary data set by institution FICE, year, and field. After merging the intermediary data sets, rules for converting missing values to zeroes as defined by SRI and NSF were applied to the data. In addition, if an institution did not have data for a particular combination of year and field, a record containing all missing values was generated for that combination of institution, year, and field.
The methods and processes for extracting, transforming, and loading the data included several stages of quality control. First, non-WebCASPAR source data were reviewed for inconsistencies requiring consultation with NSF, SRI, or the data providers. The WebCASPAR source data sets had already been checked extensively against published data and the source data files. The data extracted from WebCASPAR input SAS data sets were spot checked for individual institutions against that institution’s data in WebCASPAR. For the SCI/SSCI data and patents data, totals from the database were compared to totals generated from the source files.
The SAS programs used for extracting, transforming, and loading the data were designed in modules so that if one data source was updated, only the programs and quality control reviews related to that data needed to be repeated. The SAS programs were documented for ease of
115
maintenance and update. In addition, the intermediary SAS data sets for each data source and the final SAS data set included formats and labels to make the data sets as self-documenting as possible.
The complete system documentation is comprised of four elements:
Overall systems design with diagrams, charts and text explaining the purpose of database object (i.e., tables, views, SAS format libraries, etc.) and their relationships.
Technical data model reports (e.g., a code book) with the name, description and columns for each object to include primary and foreign keys, column type and formats, and indexes.
The programs used to create and update the database and information (e.g., location, structure, access method, periodicity) on the source files.
The update schedule and methodology to include the sequence in which the programs must be run.
B.9 Conduct Initial Analyses and Direct Further Analyses
After receiving the Publication Trends database, SRI prepared the database for analysis using SAS, JMP, and Excel. This included reformatting and merging of appropriate data, as well as transformations of appropriate analysis variables. For example, as explained later, financial variables were deflated to constant dollars, and various lags were imposed on input variables and citation counts. During this phase of the analysis, SRI also worked with NSF to define field groups.
Typically analyses were conducted first on institutional-level data and then replicated using field group level data. In general, models developed at the institutional level were also found to be appropriate at the field-group level, although the value of the coefficients changed and in some cases there were slight modifications in the model. A factor analysis on the eight different outcome measures revealed that the first principal component captured almost all of the variability. As a result many initial analyses were conducted using the first principal component. Later analyses verified that results using other outcome measures yielded very similar results. As a result, NSF later specified that most analyses be conducted on fractional publication counts for an expanding journal set rather than the first principal component.
Because many of the explanatory variables were highly correlated (i.e., counts of full professors, associate professors, assistant professors, etc.), the model building process involved stepwise regressions on sets of related variables to identify a few variables from each set that appeared to capture the influence of that set on the outcome variables. This was an iterative process, since there was also a high degree of correlation between variable sets (i.e., Academic R&D expenditures and count of Postdoctorates). Due to the large number of observations, variables whose effects were far too small to be practically important were often identified to be statistically significant. Consequently, the criterion for variable inclusion was primarily that a variable increased the model r-squared by an increment of approximately 0.01. A model consisting of 7 variables was developed for the first principal component and it was found that this model required only slight modification for the various publication and citation outcome measures. When the model building process was repeated for field groups, only minor changes
116
occurred in the model. After the model was developed, SRI and NSF jointly explored the extent to which the model was capable of predicting the change within institutions in publications when resource inputs changed over time. During these analyses residuals were examined to determine if there were explanatory variables that had non-linear effects or subsets of institutions for which the model fit was less satisfactory.
SRI met with NSF to explore the results of the initial modeling at the institutional and field levels. This provided an opportunity to hypothesize explanations for the model regression coefficients and for NSF to direct the analysis by recommending other analyses that they believed would be helpful in interpreting study results or assist them in addressing related issues. SRI conducted follow-up analyses at the institutional and field levels to address recommendations made during the second meeting with NSF or further explore hypotheses generated during that meeting.
117
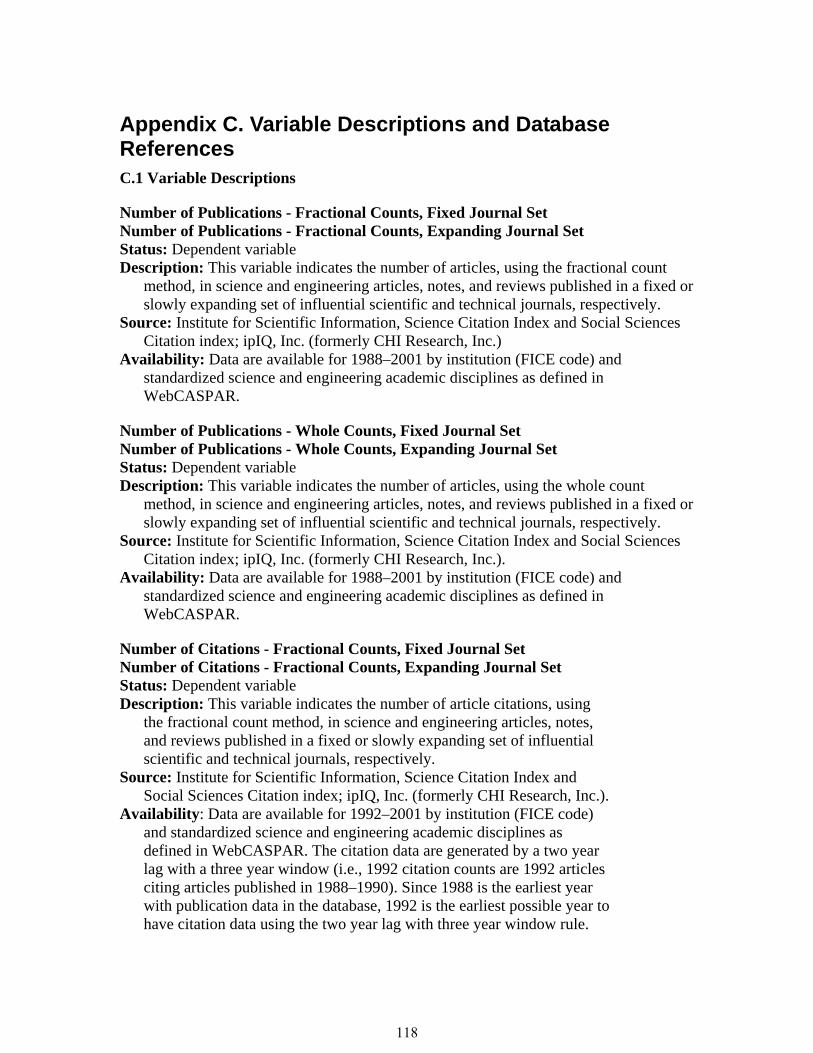
Appendix C. Variable Descriptions and Database References C.1 Variable Descriptions
Number of Publications - Fractional Counts, Fixed Journal Set Number of Publications - Fractional Counts, Expanding Journal Set Status: Dependent variable Description: This variable indicates the number of articles, using the fractional count
method, in science and engineering articles, notes, and reviews published in a fixed or slowly expanding set of influential scientific and technical journals, respectively.
Source: Institute for Scientific Information, Science Citation Index and Social Sciences Citation index; ipIQ, Inc. (formerly CHI Research, Inc.)
Availability: Data are available for 1988–2001 by institution (FICE code) and standardized science and engineering academic disciplines as defined in WebCASPAR.
Number of Publications - Whole Counts, Fixed Journal Set Number of Publications - Whole Counts, Expanding Journal Set Status: Dependent variable Description: This variable indicates the number of articles, using the whole count
method, in science and engineering articles, notes, and reviews published in a fixed or slowly expanding set of influential scientific and technical journals, respectively.
Source: Institute for Scientific Information, Science Citation Index and Social Sciences Citation index; ipIQ, Inc. (formerly CHI Research, Inc.).
Availability: Data are available for 1988–2001 by institution (FICE code) and standardized science and engineering academic disciplines as defined in WebCASPAR.
Number of Citations - Fractional Counts, Fixed Journal Set Number of Citations - Fractional Counts, Expanding Journal Set Status: Dependent variable Description: This variable indicates the number of article citations, using
the fractional count method, in science and engineering articles, notes, and reviews published in a fixed or slowly expanding set of influential scientific and technical journals, respectively.
Source: Institute for Scientific Information, Science Citation Index and Social Sciences Citation index; ipIQ, Inc. (formerly CHI Research, Inc.).
Availability: Data are available for 1992–2001 by institution (FICE code) and standardized science and engineering academic disciplines as defined in WebCASPAR. The citation data are generated by a two year lag with a three year window (i.e., 1992 citation counts are 1992 articles citing articles published in 1988–1990). Since 1988 is the earliest year with publication data in the database, 1992 is the earliest possible year to have citation data using the two year lag with three year window rule.
118
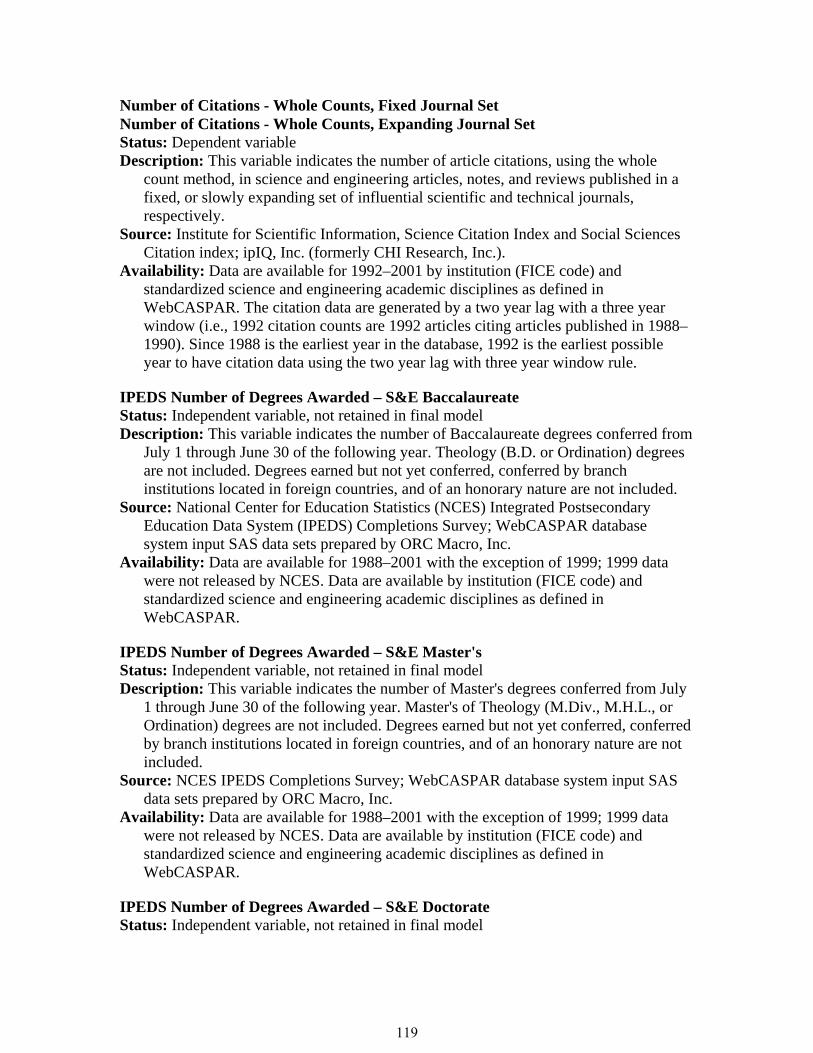
Number of Citations - Whole Counts, Fixed Journal Set Number of Citations - Whole Counts, Expanding Journal Set Status: Dependent variable Description: This variable indicates the number of article citations, using the whole
count method, in science and engineering articles, notes, and reviews published in a fixed, or slowly expanding set of influential scientific and technical journals, respectively.
Source: Institute for Scientific Information, Science Citation Index and Social Sciences Citation index; ipIQ, Inc. (formerly CHI Research, Inc.).
Availability: Data are available for 1992–2001 by institution (FICE code) and standardized science and engineering academic disciplines as defined in WebCASPAR. The citation data are generated by a two year lag with a three year window (i.e., 1992 citation counts are 1992 articles citing articles published in 1988–1990). Since 1988 is the earliest year in the database, 1992 is the earliest possible year to have citation data using the two year lag with three year window rule.
IPEDS Number of Degrees Awarded – S&E Baccalaureate Status: Independent variable, not retained in final model Description: This variable indicates the number of Baccalaureate degrees conferred from
July 1 through June 30 of the following year. Theology (B.D. or Ordination) degrees are not included. Degrees earned but not yet conferred, conferred by branch institutions located in foreign countries, and of an honorary nature are not included.
Source: National Center for Education Statistics (NCES) Integrated Postsecondary Education Data System (IPEDS) Completions Survey; WebCASPAR database system input SAS data sets prepared by ORC Macro, Inc.
Availability: Data are available for 1988–2001 with the exception of 1999; 1999 data were not released by NCES. Data are available by institution (FICE code) and standardized science and engineering academic disciplines as defined in WebCASPAR.
IPEDS Number of Degrees Awarded – S&E Master's Status: Independent variable, not retained in final model Description: This variable indicates the number of Master's degrees conferred from July
1 through June 30 of the following year. Master's of Theology (M.Div., M.H.L., or Ordination) degrees are not included. Degrees earned but not yet conferred, conferred by branch institutions located in foreign countries, and of an honorary nature are not included.
Source: NCES IPEDS Completions Survey; WebCASPAR database system input SAS data sets prepared by ORC Macro, Inc.
Availability: Data are available for 1988–2001 with the exception of 1999; 1999 data were not released by NCES. Data are available by institution (FICE code) and standardized science and engineering academic disciplines as defined in WebCASPAR.
IPEDS Number of Degrees Awarded – S&E Doctorate Status: Independent variable, not retained in final model
119
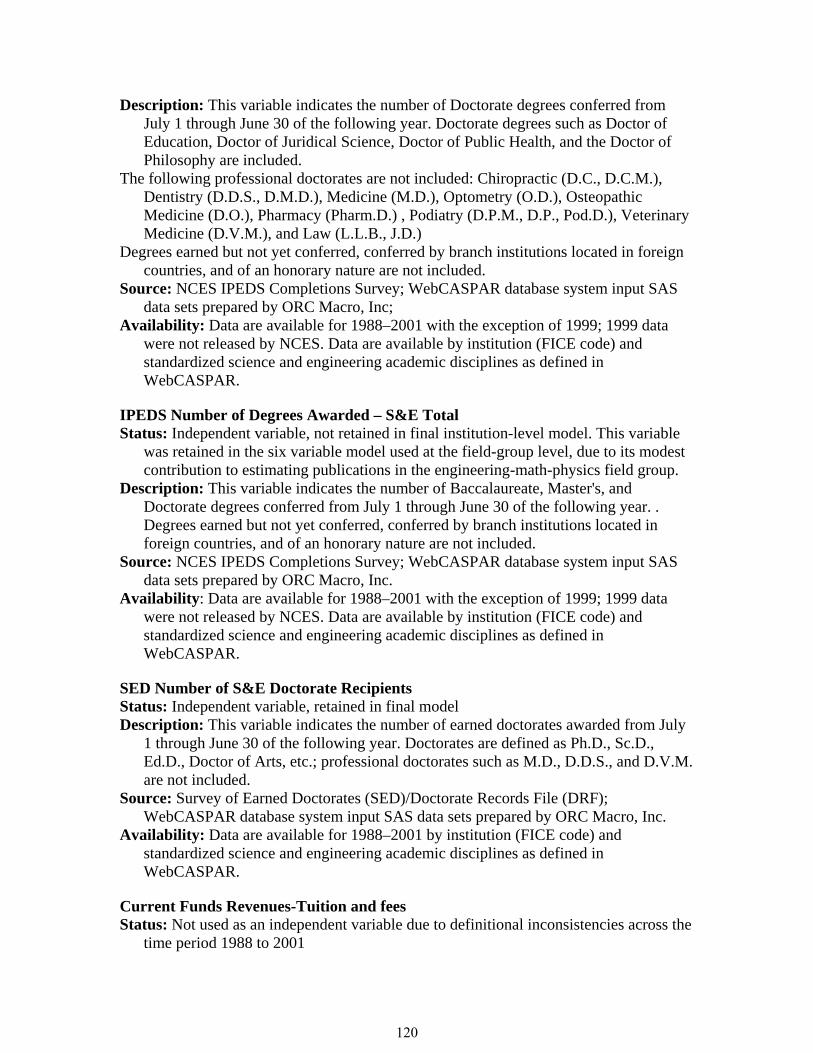
Description: This variable indicates the number of Doctorate degrees conferred from July 1 through June 30 of the following year. Doctorate degrees such as Doctor of Education, Doctor of Juridical Science, Doctor of Public Health, and the Doctor of Philosophy are included.
The following professional doctorates are not included: Chiropractic (D.C., D.C.M.), Dentistry (D.D.S., D.M.D.), Medicine (M.D.), Optometry (O.D.), Osteopathic Medicine (D.O.), Pharmacy (Pharm.D.) , Podiatry (D.P.M., D.P., Pod.D.), Veterinary Medicine (D.V.M.), and Law (L.L.B., J.D.)
Degrees earned but not yet conferred, conferred by branch institutions located in foreign countries, and of an honorary nature are not included.
Source: NCES IPEDS Completions Survey; WebCASPAR database system input SAS data sets prepared by ORC Macro, Inc;
Availability: Data are available for 1988–2001 with the exception of 1999; 1999 data were not released by NCES. Data are available by institution (FICE code) and standardized science and engineering academic disciplines as defined in WebCASPAR.
IPEDS Number of Degrees Awarded – S&E Total Status: Independent variable, not retained in final institution-level model. This variable
was retained in the six variable model used at the field-group level, due to its modest contribution to estimating publications in the engineering-math-physics field group.
Description: This variable indicates the number of Baccalaureate, Master's, and Doctorate degrees conferred from July 1 through June 30 of the following year. . Degrees earned but not yet conferred, conferred by branch institutions located in foreign countries, and of an honorary nature are not included.
Source: NCES IPEDS Completions Survey; WebCASPAR database system input SAS data sets prepared by ORC Macro, Inc.
Availability: Data are available for 1988–2001 with the exception of 1999; 1999 data were not released by NCES. Data are available by institution (FICE code) and standardized science and engineering academic disciplines as defined in WebCASPAR.
SED Number of S&E Doctorate Recipients Status: Independent variable, retained in final model Description: This variable indicates the number of earned doctorates awarded from July
1 through June 30 of the following year. Doctorates are defined as Ph.D., Sc.D., Ed.D., Doctor of Arts, etc.; professional doctorates such as M.D., D.D.S., and D.V.M. are not included.
Source: Survey of Earned Doctorates (SED)/Doctorate Records File (DRF); WebCASPAR database system input SAS data sets prepared by ORC Macro, Inc.
Availability: Data are available for 1988–2001 by institution (FICE code) and standardized science and engineering academic disciplines as defined in WebCASPAR.
Current Funds Revenues-Tuition and fees Status: Not used as an independent variable due to definitional inconsistencies across the
time period 1988 to 2001
120
Description: This variable indicates all tuition and fees (including student activity fees) assessed against students for education purposes. Tuition and fee remissions or exemptions are included even though there is no intention of collecting these amounts from the student. Also included are tuitions and fees that are remitted to the state as an offset to the state appropriation. Charges for room, board, and other services rendered by auxiliary enterprises are not included.
Source: NCES IPEDS Finance Survey; WebCASPAR database system input SAS data sets prepared by ORC Macro, Inc.
Availability: Data are available for 1988–1996; the NCES IPEDS Finance Survey has undergone significant changes since 1996, therefore, 1997 and later data have not been loaded into WebCASPAR. Data are available by institution (FICE code).
Current Funds Revenues-Federal Government Appropriations Status: Not used as an independent variable due to definitional inconsistencies across the
time period 1988 to 2001 Description: This variable indicates all federal government appropriations, including all
amounts received by the institution through acts of a legislative body, except grants and contracts. These funds are for meeting current operating expenses, not for specific projects or programs. An example is federal land-grant appropriations. Pell Grants are not reported here, as they are grants, not appropriations. Federal appropriations received through state channels are included.
Source: NCES IPEDS Finance Survey; WebCASPAR database system input SAS data sets prepared by ORC Macro, Inc.
Availability: Data are available for 1988–1996; the NCES IPEDS Finance Survey has undergone significant changes since 1996, therefore, 1997 and later data have not been loaded into WebCASPAR. Data are available by institution (FICE code).
Current Funds Revenues-State Government Appropriation Status: Not used as an independent variable due to definitional inconsistencies across the
time period 1988 to 2001 Description: This variable indicates all state government appropriations, including all
amounts received by the institution through acts of a legislative body, except grants and contracts. These funds are for meeting current operating expenses, not for specific projects or programs.
Source: NCES IPEDS Finance Survey; WebCASPAR database system input SAS data sets prepared by ORC Macro, Inc.
Availability: Data are available for 1988–1996; the NCES IPEDS Finance Survey has undergone significant changes since 1996, therefore, 1997 and later data have not been loaded into WebCASPAR. Data are available by institution (FICE code).
Current Funds Revenues-Federal Government Grants and Contracts Status: Not used as an independent variable due to definitional inconsistencies across the
time period 1988 to 2001 Description: This variable indicates all federal government grants and contracts,
including revenues from governmental agencies that are for specific research projects or other types of programs. Examples are research projects, training programs, and similar activities for which amounts are received or expenditures are reimbursable
121
under the terms of a government grant or contract. Pell Grants as well as federal grants and contracts received through state channels are included.
Source: NCES IPEDS Finance Survey; WebCASPAR database system input SAS data sets prepared by ORC Macro, Inc.
Availability: Data are available for 1988–1996; the NCES IPEDS Finance Survey has undergone significant changes since 1996, therefore, 1997 and later data have not been loaded into WebCASPAR. Data are available by institution (FICE code).
Current Funds Revenues-State Government Grants and Contracts Status: Not used as an independent variable due to definitional inconsistencies across the
time period 1988 to 2001 Description: This variable indicates all state government grants and contracts, including
revenues from governmental agencies that are for specific research projects or other types of programs. Examples are research projects, training programs, and similar activities for which amounts are received or expenditures are reimbursable under the terms of a government grant or contract.
Source: NCES IPEDS Finance Survey; WebCASPAR database system input SAS data sets prepared by ORC Macro, Inc.
Availability: Data are available for 1988–1996; the NCES IPEDS Finance Survey has undergone significant changes since 1996, therefore, 1997 and later data have not been loaded into WebCASPAR. Data are available by institution (FICE code).
Current Funds Expenditures and Transfers-Instruction Status: Not used as an independent variable due to definitional inconsistencies across the
time period 1988 to 2001 Description: This variable indicates current funds expenditures and transfers for
instruction, including expenditures of the colleges, schools, departments, and other instructional divisions of the institution and expenditures for departmental research and public service that are not separately budgeted. Expenditures for both credit and noncredit activities are included. Expenditures for academic administration where the primary function is administration (e.g., academic deans) are excluded. The instruction category includes general academic instruction, occupational and vocational instruction, special session instruction, community education, preparatory and adult basic education, and remedial and tutorial instruction conducted by the teaching faculty for the institution’s students.
Source: NCES IPEDS Finance Survey; WebCASPAR database system input SAS data sets prepared by ORC Macro, Inc.
Availability: Data are available for 1988–1996; the NCES IPEDS Finance Survey has undergone significant changes since 1996, therefore, 1997 and later data have not been loaded into WebCASPAR. Data are available by institution (FICE code).
Current Funds Expenditures and Transfers-Research Status: Not used as an independent variable due to definitional inconsistencies across the
time period 1988 to 2001 Description: This variable indicates current funds expenditures and transfers for
research, including all funds expended for activities specifically organized to produce research outcomes and commissioned by an agency either external to the institution
122
or separately budgeted by an organizational unit within the institution. Non-research sponsored programs (e.g., training programs) are not included.
Source: NCES IPEDS Finance Survey; WebCASPAR database system input SAS data sets prepared by ORC Macro, Inc.
Availability: Data are available for 1988–1996; the NCES IPEDS Finance Survey has undergone significant changes since 1996, therefore, 1997 and later data have not been loaded into WebCASPAR. Data are available by institution (FICE code).
Current Funds Expenditures and Transfers-Public Service Status: Not used as an independent variable due to definitional inconsistencies across the
time period 1988 to 2001 Description: This variable indicates current funds expenditures and transfers for public
service, including all funds budgeted specifically for public service and expended for activities established primarily to provide non-instructional services beneficial to groups external to the institution. Examples are seminars and projects provided to particular sectors of the community. Expenditures for community services and cooperative extension services are included.
Source: NCES IPEDS Finance Survey; WebCASPAR database system input SAS data sets prepared by ORC Macro, Inc.
Availability: Data are available for 1988–1996; the NCES IPEDS Finance Survey has undergone significant changes since 1996, therefore, 1997 and later data have not been loaded into WebCASPAR. Data are available by institution (FICE code).
Current Funds Expenditures and Transfers-Academic support Status: Not used as an independent variable due to definitional inconsistencies across the
time period 1988 to 2001 Description: This variable indicates current funds expenditures and transfers for
academic support, including all expenditures for the support services that are an integral part of the institution’s primary mission of instruction, research, or public service. Expenditures for libraries, museums, galleries, audio/visual services, academic computing support, ancillary support, academic administration, personnel development, and course and curriculum development are included. Also included are expenditures for veterinary and dental clinics if their primary purpose is to support the institutional program.
Source: NCES IPEDS Finance Survey; WebCASPAR database system input SAS data sets prepared by ORC Macro, Inc.
Availability: Data are available for 1988–1996; the NCES IPEDS Finance Survey has undergone significant changes since 1996, therefore, 1997 and later data have not been loaded into WebCASPAR. Data are available by institution (FICE code).
Current Funds Expenditures and Transfers-Libraries Status: Not used as an independent variable due to definitional inconsistencies across the
time period 1988 to 2001 Description: This variable indicates current funds expenditures and transfers for library
acquisitions including all print material, microfilm, microfiche, audio-visual materials such as records and films, and computer software; expenditures for hardware of any
123
kind (i.e., computer terminals, microfiche readers, record players, or projectors) are not included.
Source: NCES IPEDS Finance Survey; WebCASPAR database system input SAS data sets prepared by ORC Macro, Inc.
Availability: Data are available for 1988–1996; the NCES IPEDS Finance Survey has undergone significant changes since 1996, therefore, 1997 and later data have not been loaded into WebCASPAR. Data are available by institution (FICE code).
Current Funds Expenditures and Transfers-Student Services Status: Not used as an independent variable due to definitional inconsistencies across the
time period 1988 to 2001 Description: This variable indicates current funds expenditures and transfers for student
services, including funds expended for admissions, registrar activities, and activities whose primary purpose is to contribute to students’ emotional and physical well-being and to their intellectual, cultural, and social development outside the context of the formal instructional program. Examples are career guidance, counseling, financial aid administration, and student health services (except when operated as a self-supporting auxiliary enterprise). Also included is the administrative allowance for Pell Grants.
Source: NCES IPEDS Finance Survey; WebCASPAR database system input SAS data sets prepared by ORC Macro, Inc.
Availability: Data are available for 1988–1996; the NCES IPEDS Finance Survey has undergone significant changes since 1996, therefore, 1997 and later data have not been loaded into WebCASPAR. Data are available by institution (FICE code).
Current Funds Expenditures and Transfers-Institutional Support Status: Not used as an independent variable due to definitional inconsistencies across the
time period 1988 to 2001 Description: This variable indicates current funds expenditures and transfers for
institutional support, including expenditures for the day-to-day operational support of the institution, excluding expenditures for physical plant operations. Expenditures for general administrative services, executive direction and planning, legal and fiscal operations, and public relations/development are included.
Source: NCES IPEDS Finance Survey; WebCASPAR database system input SAS data sets prepared by ORC Macro, Inc.
Availability: Data are available for 1988–1996; the NCES IPEDS Finance Survey has undergone significant changes since 1996, therefore, 1997 and later data have not been loaded into WebCASPAR. Data are available by institution (FICE code).
Current Funds Expenditures and Transfers-Operations and Maintenance of Plant Status: Not used as an independent variable due to definitional inconsistencies across the
time period 1988 to 2001 Description: This variable indicates current funds expenditures and transfers for
operation and maintenance of plant, including all expenditures for operations established to provide service and maintenance related to grounds and facilities used for educational and general purposes. Expenditures for utilities, fire protection,
124

property insurance, and similar items are included. Expenditures made from the institutional plant funds account are not included.
Source: NCES IPEDS Finance Survey; WebCASPAR database system input SAS data sets prepared by ORC Macro, Inc.
Availability: Data are available for 1988–1996; the NCES IPEDS Finance Survey has undergone significant changes since 1996, therefore, 1997 and later data have not been loaded into WebCASPAR. Data are available by institution (FICE code).
Current Funds Expenditures and Transfers-Scholarships and Fellowships Status: Not used as an independent variable due to definitional inconsistencies across the
time period 1988 to 2001 Description: This variable indicates current funds expenditures and transfers for
scholarships and fellowships, including all expenditures given in the form of outright grants and trainee stipends to individuals enrolled in formal course work, either for credit or noncredit. Pell Grants and aid to students in the form of tuition or fee remissions are included. Remissions that are granted because of faculty or staff status and College Work Study program expenses are not included.
Source: NCES IPEDS Finance Survey; WebCASPAR database system input SAS data sets prepared by ORC Macro, Inc.
Availability: Data are available for 1988–1996; the NCES IPEDS Finance Survey has undergone significant changes since 1996, therefore, 1997 and later data have not been loaded into WebCASPAR. Data are available by institution (FICE code).
Current Funds Expenditures and Transfers-Mandatory Transfers Status: Not used as an independent variable due to definitional inconsistencies across the
time period 1988 to 2001 Description: This variable indicates mandatory transfers from current funds that must be
made in order to fulfill a binding legal obligation of the institution. Included are mandatory debt-service provisions relating to academic and administrative buildings, including (1) amounts set aside for debt retirement and interest; and (2) required provisions for renewal and replacements to the extent not financed from other sources. Also included are the institutional matching portion for Perkins Loans when the source of funds is current revenue. Transfers into the current fund (i.e., negative numbers) are not included.
Source: NCES IPEDS Finance Survey; WebCASPAR database system input SAS data sets prepared by ORC Macro, Inc.
Availability: Data are available for 1988–1996; the NCES IPEDS Finance Survey has undergone significant changes since 1996, therefore, 1997 and later data have not been loaded into WebCASPAR. Data are available by institution (FICE code).
Current Funds Expenditures and Transfers-Non-Mandatory Transfers Status: Not used as an independent variable due to definitional inconsistencies across the
time period 1988 to 2001 Description: This variable indicates nonmandatory transfers from current funds to other
fund groups made at the discretion of the governing board to serve a variety of objectives, such as additions to loan funds, funds functioning as endowment, general
125

or specific plant additions, voluntary renewals and replacement of additions, voluntary renewals and replacement of plant, and prepayments on debt principal.
Source: NCES IPEDS Finance Survey; WebCASPAR database system input SAS data sets prepared by ORC Macro, Inc.
Availability: Data are available for 1988–1996; the NCES IPEDS Finance Survey has undergone significant changes since 1996, therefore, 1997 and later data have not been loaded into WebCASPAR. Data are available by institution (FICE code).
Academic Discipline Status: Used to define field-groups and aggregate other variables to the field-group level
so that field-group specific regressions could be conducted. Description: This variable contains the standardized science and engineering academic
disciplines as defined in WebCASPAR. The possible values are: 11=Aerospace Engineering 12=Chemical Engineering 13=Civil Engineering 14=Electrical Engineering 15=Mechanical Engineering 16=Materials Engineering 17=Industrial Engineering 19=Other Engineering 21=Astronomy 22=Chemistry 23=Physics 29=Other Physical Sciences 31=Atmospheric Sciences 32=Earth Sciences 33=Oceanography 39=Other Geosciences 41=Mathematics and Statistics 42=Computer Science 49=Operations Research 51=Agricultural Sciences 52=Biological Sciences 53=Medical Sciences 59=Other Life Sciences 60=Psychology 71=Economics 72=Political Science and Public Administration 73=Sociology 74=Anthropology 75=Linguistics 76=History of Science 77=Area and Ethnic Studies 79=Other Social Sciences 81=Science Technologies 82=Engineering Technologies
126

83=Health Technologies 89=Other Science and Engineering Technologies 99=Interdisciplinary or Other Sciences
Source: WebCASPAR database system input SAS data sets prepared by ORC Macro, Inc. Availability: Data are available for 1988–2001; data by Academic Discipline are not
available for all variables; see Availability section for each variable for more information.
Academic Discipline Group Status: This variable defines the field-groups used to aggregate data to the field-group
level for field-group specific regressions. Description: This variable groups the academic disciplines, as follows:
Computer sciences = 42 Medical sciences = 53 Bio-life-ag sciences = 51, 52 and 59 Eng-math-phy-sciences = 11 to 41 (inclusive) and 49 Soc-sciences = 60 to 79 (inclusive)
Source: WebCASPAR database system input SAS data sets prepared by ORC Macro, Inc. and recoded by SRI International
Availability: Data are available for 1988–2001; data by Academic Discipline are not available for all variables; see Availability section for each variable for additional information.
Number of S&E Postdoctorates (Total) Number of S&E Postdoctorates supported by Federal Fellowship Number of S&E Postdoctorates supported by Federal Research Grants Number of S&E Postdoctorates supported by Federal Traineeships Number of S&E Postdoctorates supported by Non-Federal Sources Number of S&E Postdoctorates with Medical Degrees (Total) Number of S&E Postdoctorates with Medical Degrees supported by Federal Fellowships Number of S&E Postdoctorates with Medical Degrees supported by Federal Research Grants Number of S&E Postdoctorates with Medical Degrees supported by Federal Traineeships Number of S&E Postdoctorates with Medical Degrees supported by Non-Federal Sources Number of S&E Postdoctorates without Medical Degrees supported by Federal Fellowships Number of S&E Postdoctorates without Medical Degrees supported by Federal Research Grants Number of S&E Postdoctorates without Medical Degrees supported by Federal Traineeships Number of S&E Postdoctorates without Medical Degrees supported by Non-Federal Sources
127
Status: The total number of S&E postdoctorates was retained. Several sub-totals of S&E postdoctorates at field group levels slightly improved the explanatory power of field-specific models. The number of S&E postdoctorates in computer sciences, engineering, math, and physical sciences, and social sciences was used in models for these three field groups. The number of S&E postdoctorates supported by federal research grants in the biology, life, and agricultural sciences field group was used in a model for this field group for fractional count publications. The number of S&E postdoctorates with an M.D. and without an M.D. in biology, life, and agricultural sciences was used in a model for this field group for whole count publications. The number of S&E postdoctorates with M.D. degrees supported by federal research grants in the medical sciences was used in a model for this field group. Other variations of these independent variables were not retained.
Description: This variable indicates the headcount of individuals with Ph.D., M.D., D.O., D.D.S., or D.V.M. degrees (including equivalent foreign degrees) who devote their primary effort to their own research training in science, engineering, or health fields through research activities or study under temporary appointments carrying no academic rank and who are supported by a federal fellowship, federal research grant, federal traineeship, or non-federal sources, respectively. These individuals may contribute to the academic program through seminars, lectures, or working with graduate students. Postdoctorates may have different titles at different institutions, e.g., “Postdoctoral Scholar,” “Research Associate,” “Postdoctoral Fellow,” or “Postgraduate Researcher.” Clinical fellows and those with appointments in residency training programs in medical and health professions are excluded, unless research training under the supervision of a senior mentor is the primary purpose of the appointment.
Source: NSF-NIH Survey of Graduate Student and Postdoctorates in Science and Engineering; WebCASPAR database system input SAS data sets prepared by ORC Macro, Inc.
Availability: Data are available for 1988–2001 by institution (FICE code) and standardized science and engineering academic disciplines as defined in WebCASPAR.
Number of S&E Graduate Students Status: Independent variable that was not retained. Description: This variable indicates the headcount (not full-time equivalent) of students
enrolled in graduate S&E and health-related fields at U.S. academic institutions. M.D., D.O., D.V.M., or D.D.S. candidates, interns, and residents are counted if they are concurrently working for an S&E master’s or Ph.D. degree or are enrolled in a joint medical/Ph.D. program. Individuals who already hold graduate or medical degrees and are working on another master’s or Ph.D. degree are considered graduate students, not postdoctorates. S&E students performing thesis or dissertation research away from the campus (for example, at Government and contractor-owned facilities) in the United States are included as long as they are enrolled for credit in an advanced-degree program. Students enrolled in a foreign country (at a branch or extension center), and non-matriculated students are not included. Students enrolled in multiple departments/institutions are only included in one department/institution;
128

students enrolled in interdisciplinary/interinstitutional programs are counted only once, in their “home” department and institution.
Source: NSF-NIH Survey of Graduate Student and Postdoctorates in S&E; WebCASPAR database system input SAS data sets prepared by ORC Macro, Inc.
Availability: Data are available for 1988–2001 by institution (FICE code) and standardized science and engineering academic disciplines as defined in WebCASPAR.
Number of Non-Faculty Research Staff with Medical Degrees Status: Independent variable that was not retained. Description: This variable indicates the headcount of doctoral scientists and engineers
with M.D., D.O., D.D.S., or D.V.M. degrees (including foreign degrees equivalent to U.S. doctorates) who are involved principally in research activities but are not considered either postdoctoral appointees or members of the regular faculty.
Source: NSF-NIH Survey of Graduate Student and Postdoctorates in Science and Engineering; WebCASPAR database system input SAS data sets prepared by ORC Macro, Inc.
Availability: Data are available for 1988–2001 by institution (FICE code) and standardized science and engineering academic disciplines as defined in WebCASPAR.
Number of Non-Faculty Research Staff Status: Independent variable that was not retained. Description: This variable indicates the headcount of doctoral scientists and engineers
who are involved principally in research activities but are not considered either postdoctoral appointees or members of the regular faculty.
Source: NSF-NIH Survey of Graduate Student and Postdoctorates in Science and Engineering; WebCASPAR database system input SAS data sets prepared by ORC Macro, Inc.
Availability: Data are available for 1988–2001 by institution (FICE code) and standardized science and engineering academic disciplines as defined in WebCASPAR.
Academic Institution Attribute-1994 Carnegie Classification Status: Independent variable that was not retained in the institution level model. This
variable was retained in the six variable version of the model applicable at the field-group level due to its contribution to estimating publications in the medical sciences field group.
Description: This variable is the institution’s 1994 Carnegie Classification. The possible values are: D-1=Doctoral I D-2=Doctoral II ENG=Engineering and Technology MED=Medical M-1=Master's/Comprehensive I N/A=Not Classified
129

OTH=Other Specialized R-1=Research I R-2=Research II HLT=Health
Source: WebCASPAR database system input SAS data sets prepared by ORC Macro, Inc. Availability: This variable is an institution attribute, and is not available by academic discipline or year.
Academic Institution Attribute-Type of Control Status: Independent variable that was not retained. Description: This variable indicates the form of control or affiliation under which the
institution operates. The possible values are: Pri=Private Pub=Public Unk=Unknown
Source: WebCASPAR database system input SAS data sets prepared by ORC Macro, Inc.
Availability: This variable is an institution attribute, and is not available by academic discipline or year.
IPEDS-Number of Full-time Faculty, Full Professors by Year IPEDS Number of Full-time Faculty, Associate Professors by Year IPEDS Number of Full-time Faculty, Assistant Professors by Year IPEDS-Number of Full-time Faculty, Instructors by Year IPEDS-Number of Full-time Faculty, Lecturers by Year IPEDS-Number of Full-time Faculty, Other Ranks by Year Status: Independent variables that were not retained. Description: These variables indicate the headcount (not full-time equivalent) of those
members of the instructional and research staff with academic rank designation of full professor, associate professor, assistant professor, instructor, lecturer or other rank, respectively, who are employed full-time (as defined by the institution) and whose major (more than 50%) regular assignment is instruction, including those with released time for research. Also included are: full-time instructional faculty on sabbatical leave, full-time replacements for instructional faculty on leave without pay, and Chairs of departments (if they have no other administrative title and hold a full-time faculty rank).
The following staff are not included: Replacements for instructional faculty on sabbatical leave. Instructional faculty on leave without pay. Instructional faculty for preclinical and clinical medicine (instructional faculty in
all other fields, such as dentistry, veterinary medicine, nursing, dental hygiene, etc., are included.)
Instructional faculty who are employed on a part-time basis. Instructional faculty (such as members of religious orders) whose services are
valued by bookkeeping entries rather than by full cash transactions.
130

Instructional faculty who, as members of military organizations, are paid on a different salary scale from civilian employees.
Administrative officers with titles such as dean of instruction, academic dean, dean of faculty, dean of students, librarian, registrar, coach, etc., even though they may devote part of their time to classroom instruction.
Undergraduate or graduate students who assist in the instruction of courses, but have titles such as graduate or teaching assistant, teaching associate, teaching fellow, etc.
Source: NCES IPEDS Salaries, Tenure, and Fringe Benefits of Full-time Instructional Faculty Survey WebCASPAR database system input SAS data sets prepared by ORC Macro, Inc.
Availability: Data are available for 1988–1999, except 1989. Data are available by institution (FICE code).
1993 NRC Scholarly Quality Rating by Field Status: Independent variable that was not retained. Description: This variable is the mean of the Scholarly Quality Rating (SQR) of the
Program Faculty on a scale of 0 to 5, with 5 as the best possible value. Raters were asked to comment on two dimensions of quality for about 50 randomly selected programs in their fields: 1) “scholarly quality of program faculty,” and 2) “effectiveness in educating research scholars/scientists.” Ratings for “scholarly quality of program faculty“ ranged from 0 to 5 with 0 signifying “not sufficient for doctoral education” and 5 signifying “distinguished.” Raters were asked to designate no more than five programs as “distinguished.” From these responses, the committee calculated a mean rating for each program appearing in the study. For some disciplines the program ratings are provided at a more detailed discipline level than WebCASPAR Academic Disciplines. Therefore, it was necessary to compute a weighted average of the program ratings for these disciplines; the institution's number of graduates in the program was used to weight the ranking data.
Source: Research Doctorate Programs in the United States: Continuity and Change; National Academy of Sciences, National Research Council; WebCASPAR database system input SAS data sets prepared by ORC Macro, Inc.
Availability: This variable is an institution attribute that is available by standardized science and engineering academic disciplines as defined in WebCASPAR.
1993 NRC Scholarly Quality Rating Distinguished Indicator by Field Status: Independent variable that was not retained. Description: This variable indicates if the mean of the Scholarly Quality Rating of the
Program Faculty is greater than 4.00 (on a scale of 0 to 5, with 5 as the best possible value). For some disciplines the program ratings are provided at a more detailed discipline level than WebCASPAR Academic Disciplines. Therefore, it was necessary to derive this variable as follows for these disciplines: Institutions rated distinguished in mathematics are rated distinguished in
mathematics/statistics, regardless of the rating in the smaller field; Institutions rated distinguished in statistics and that also have a weighted average
above 4.00 in mathematics/statistics are counted as distinguished;
131
Institutions rated distinguished in 3 or more of the 7 Biology subfields are counted as distinguished; and
Institutions that have a weighted average in Biology above 4.00 are counted as distinguished.
Source: Research Doctorate Programs in the United States: Continuity and Change; National Academy of Sciences, National Research Council; WebCASPAR database system input SAS data sets prepared by ORC Macro, Inc.
Availability: This variable is an institution attribute that is available by standardized science and engineering academic disciplines as defined in WebCASPAR.
Number of Patents in 1988 to 2001 Status: Independent variable that was not retained. Description: This variable indicates the sum of the number of patents granted in 1988 to
2001. Source: US Colleges and Universities- Utility Patent Grants, 1969–2001, produced by
the USPTO, Office of Electronic Information Products, Patent Technology Monitoring Division (PTMD). A more recent version of this report is available at http://www.uspto.gov/web/offices/ac/ido/oeip/taf/univ/univ_toc.htm
Availability: Data are available by institution (FICE code). Although patents data are available by year, due to the sparseness of the data, data for 1988 to 2001 were aggregated for each institution.
IPEDS Opening Fall Enrollment Status: Independent variable that was not retained. IPEDS Opening Fall Enrollment-Total IPEDS Opening Fall Enrollment-Undergraduate Students IPEDS Opening Fall Enrollment-Graduate Students Description: These variables indicate the headcount of all students, undergraduate
students (as defined by the institution), or graduate students (as defined by the institution), respectively, that are enrolled in courses creditable toward a diploma, certificate, degree, or other formal award. Students enrolled in courses that are part of a vocational or occupational program, including those enrolled in off-campus centers are included. Also included are high school students taking regular college courses for credit and students taking remedial courses if the student is considered degree-seeking for the purpose of student financial aid determination.
Source: NCES IPEDS Opening Fall Enrollment Survey; WebCASPAR database system input SAS data sets prepared by ORC Macro, Inc.
Availability: Data are available for 1988–2001 with the exception of 1999; 1999 data were not released by NCES. Data are available by institution (FICE code).
FICE Code Status: Variable used to identify parent institutions Description: This variable is the Federal Interagency Commission on Education (FICE)
code for an institution corresponding to the FICE code under which NSF Survey of Research and Development Expenditures at Colleges and Universities are collected. Appendix A provides a listing of campuses and their FICE codes that are included with each parental FICE (pfice).
132

Source: NSF Survey of Research and Development Expenditures at Colleges and Universities; WebCASPAR database system input SAS data sets prepared by ORC Macro, Inc.
Availability: Data are available for 1988–2001.
Rank among top 200 R&D performing universities for Sum of 1988–2001 Total R&D Expenditures Status: Independent variable that was not retained. Description: This variable is the rank of the institution based on average total R&D
expenditures for 1988–2001. The possible values are 1–200. Appendix A provides a list of institutions with their corresponding ranks.
Source: NSF Survey of Research and Development Expenditures at Colleges and Universities; WebCASPAR database system input SAS data sets prepared by ORC Macro, Inc.
Availability: Data are available for 1988–2001 by institution (FICE code).
Federally Financed Academic Basic Research Expenditures Status: Independent variable that was not retained. Description: This variable indicates awards for basic research in S&E, including direct
and reimbursed indirect costs, by all agencies of the federal government. Basic research is directed toward an increase of knowledge; it is research where the primary aim of the investigator is a fuller knowledge or understanding of the subject under study rather than a specific application thereof.
Source: NSF Survey of Research and Development Expenditures at Colleges and Universities; WebCASPAR database system input SAS data sets prepared by ORC Macro, Inc.
Availability: Data are available for 1988–2001 by institution (FICE code).
Federally Financed Academic Research Equipment Expenditures Status: Independent variable that was not retained. Description: This variable indicates federally financed current fund research equipment
expenditures for separately budgeted R&D in S&E. It includes all research equipment purchased under sponsored research project awards from current fund accounts.
Source: NSF Survey of Research and Development Expenditures at Colleges and Universities; WebCASPAR database system input SAS data sets prepared by ORC Macro, Inc.
Availability: Data are available for 1988–2001 by institution (FICE code).
Federally Financed Academic R&D Expenditures Status: Independent variable that appeared in some initial models, and was replaced with
total academic R&D expenditures to maintain consistency in models across field-groups and dependent variables. Due to the high correlation between total academic R&D expenditures and federally financed academic R&D expenditures, this substitution resulted in minimal loss of explanatory ability.
Description: This variable indicates awards for R&D in S&E, including direct and reimbursed indirect costs, by all agencies of the federal government.
133
Source: NSF Survey of Research and Development Expenditures at Colleges and Universities; WebCASPAR database system input SAS data sets prepared by ORC Macro, Inc.
Availability: Data are available for 1988–2001 by institution (FICE code) and standardized science and engineering academic disciplines as defined in WebCASPAR.
Industry Financed Academic R&D Expenditures Status: Independent variable that was not retained. Description: This variable indicates all grants and contracts funds for R&D in S&E from
profit-making organizations, whether engaged in production, distribution, research, service, or other activities. Grants and contracts from nonprofit foundations financed by industry are not included.
Source: NSF Survey of Research and Development Expenditures at Colleges and Universities; WebCASPAR database system input SAS data sets prepared by ORC Macro, Inc.
Availability: Data are available for 1988–2001 by institution (FICE code).
Other Funding Sources for Academic R&D Expenditures Status: Independent variable that was not retained. Description: This variable indicates awards for R&D in S&E, including direct and
reimbursed indirect costs, from nonprofit foundations and voluntary health agencies. Also included are gifts from individuals that are restricted by the donor to research as well as all other sources not elsewhere classified.
Source: NSF Survey of Research and Development Expenditures at Colleges and Universities; WebCASPAR database system input SAS data sets prepared by ORC Macro, Inc.
Availability: Data are available for 1988–2001 by institution (FICE code).
Institutionally Financed Academic R&D Expenditures Status: Independent variable that was not retained. Description: This variable indicates funds, including related indirect costs, spent by the
institution for R&D activities in S&E from the following unrestricted sources: 1) general-purpose state or local government appropriations; 2) general-purpose awards from industry, foundations, or other outside sources; 3) tuition and fees; 4) endowment income; 5) and other institutional funds. Also included are on-campus and off-campus unreimbursed indirect costs associated with externally funded R&D projects, including mandatory and voluntary cost sharing. Institutions are instructed to estimate unreimbursed indirect costs, preferably on a project-by-project basis, using the appropriate on-campus or off-campus negotiated research indirect cost rate(s) multiplied by the corresponding base(s) minus actual indirect cost recovery.
Source: NSF Survey of Research and Development Expenditures at Colleges and Universities; WebCASPAR database system input SAS data sets prepared by ORC Macro, Inc.
Availability: Data are available for 1988–2001 by institution (FICE code).
134
Institutionally Financed Organized Research Expenditures Status: Independent variable that was not retained. Description: This variable indicates funds, including related indirect costs, spent by the
institution for R&D activities from the following unrestricted sources: general-purpose state or local government appropriations; general-purpose awards from industry, foundations, or other outside sources; tuition and fees; endowment income; gifts; and other institutional funds.
Source: NSF Survey of Research and Development Expenditures at Colleges and Universities; WebCASPAR database system input SAS data sets prepared by ORC Macro, Inc.
Availability: Data are available for 1988–2001 by institution (FICE code).
State/Local Government Financed Academic R&D Expenditures Status: Independent variable that was not retained. Description: This variable indicates funds for R&D in S&E from state, county,
municipal, or other local governments and their agencies. State funds that support R&D at agricultural and other experiment stations are included.
Source: NSF Survey of Research and Development Expenditures at Colleges and Universities; WebCASPAR database system input SAS data sets prepared by ORC Macro, Inc.
Availability: Data are available for 1988–2001 by institution (FICE code).
Total Academic Basic Research Expenditures Status: Independent variable that was retained in the six variable model used for field-
specific estimates. This variable appeared only to be applicable to the computer science field, where it modestly improved the model fit.
Description: This variable indicates separately budgeted R&D expenditures in S&E for basic research. Basic research is directed toward an increase of knowledge; it is research where the primary aim of the investigator is a fuller knowledge or understanding of the subject under study rather than a specific application thereof.
Source: NSF Survey of Research and Development Expenditures at Colleges and Universities; WebCASPAR database system input SAS data sets prepared by ORC Macro, Inc.
Availability: Data are available for 1988–2001 by institution (FICE code).
Total Academic Research Equipment Expenditures Status: Independent variable that was not retained. Description: This variable indicates current fund research equipment expenditures from
all sources for separately budgeted R&D in S&E. It includes all research equipment purchased under sponsored research project awards from current fund accounts.
Source: NSF Survey of Research and Development Expenditures at Colleges and Universities; WebCASPAR database system input SAS data sets prepared by ORC Macro, Inc.
Availability: Data are available for 1988–2001 by institution (FICE code).
Total Academic R&D Expenditures Status: Independent variable that was retained.
135
Description: This variable indicates separately budgeted R&D expenditures in S&E. It includes: 1) all funds expended for activities specifically organized to produce research outcomes and commissioned by an agency either external to the institution or separately budgeted by an organizational unit within the institution; 2) research equipment purchased under research project awards from current fund accounts; and 3) research funds for which an outside organization, educational or other, is a subrecipient. Excluded are: training grants, public service grants, demonstration projects, clinical trials, and departmental research expenditures that are not separately budgeted.
Source: NSF Survey of Research and Development Expenditures at Colleges and Universities; WebCASPAR database system input SAS data sets prepared by ORC Macro, Inc.
Availability: Data are available for 1988–2001 by institution (FICE code) and standardized science and engineering academic disciplines as defined in WebCASPAR.
Unreimbursed Indirect Costs and Related Sponsored Research Status: Independent variable that was not retained. Description: This variable indicates estimated on-campus and off-campus unreimbursed
indirect costs associated with externally funded R&D projects, including mandatory and voluntary cost sharing; survey respondents are instructed to estimate unreimbursed indirect costs, preferably on a project-by-project basis, using the appropriate on-campus or off-campus negotiated research indirect cost rate(s) multiplied by the corresponding base(s) minus actual indirect cost recovery.
Source: NSF Survey of Research and Development Expenditures at Colleges and Universities; WebCASPAR database system input SAS data sets prepared by ORC Macro, Inc.
Availability: Data are available for 1988–2001 by institution (FICE code).
SDR Number of S&E Doctorate Recipients Employed at Institution by Field Status: This variable was not used in the analyses, due to concern about the
appropriateness of institution-level estimates, uncertainty in what capacity these Ph.D.s were employed, and concern that the exclusion of individuals with foreign doctorates from the survey resulted in an undercount.
Description: This variable is the sum of the S&E doctorate recipients employed at an institution by field for 1988 to 2001. The Survey of Doctorate Recipients is a sample survey; sample data were weighted to obtain institution estimates.
Source: NSF Survey of Doctorate Recipients; WebCASPAR database system, ABC-SQL Query Tool input data sets prepared by ORC Macro, Inc.
Availability: Data are available for 1988–2001 by institution (FICE code). The Survey of Doctorate Recipients is a biennial survey; data were collected in odd-numbered years 1987 through 2001. Data for even-numbered years 1988 through 2000 were interpolated.
SDR Average Number of S&E Doctorate Recipients Employed at Institution in 1988–2001 by Field
136

Status: This variable was not used in the analyses, partially due to concern about the appropriateness of institution-level estimates and partially because it was uncertain in what capacity these Ph.D.s were employed.
Description: This variable is the average of the S&E doctorate recipients employed at an institution by field for 1988 to 2001. The Survey of Doctorate Recipients is a sample survey; sample data were weighted to obtain institution estimates. The Survey of Doctorate Recipients is a sample survey; sample data were weighted to obtain institution estimates.
Source: NSF Survey of Doctorate Recipients; WebCASPAR database system, ABC-SQL Query Tool input data sets prepared by ORC Macro, Inc.
Availability: Data are available by institution (FICE code). The Survey of Doctorate Recipients is a biennial survey; data were collected in odd-numbered years 1987 through 2001. Data for even-numbered years 1988 through 2000 were interpolated.
C.2 References For Data Sources
Thomson ISI, Science Citation Index (SCI) and Social Sciences Citation Index (SSCI); data provided by ipIQ, Inc. (formerly CHI Research, Inc.)
Additional information is available from: http://scientific.thomson.com/products/categories/citation/ Kimberly Hamilton The Patent Board 222 Haddon Avenue Third Floor Westmont, NJ 08108 Phone: (856) 671-6800 E-mail: [email protected]
NCES IPEDS Completions, Finance, Opening Fall Enrollment, and Salaries, Tenure, and Fringe Benefits of Full-time Instructional Faculty Surveys
Additional information is available from: http://nces.ed.gov/ipeds/ Elise Miller, Program Director Department of Education National Center for Education Statistics Postsecondary Institutional Studies Program 1990 K Street, NW Room 8113C Washington, DC 20006 Phone: (202) 502-7318 E-mail: [email protected]
137
NSF Survey of Doctorate Recipients
Additional information is available from: http://www.nsf.gov/statistics/srvydoctoratework/
Lynn Milan, Survey Statistician The National Science Foundation Directorate for Social, Behavioral & Economic Sciences Division of Science Resources Statistics Human Resources Statistics Program 4201 Wilson Boulevard, Suite 965 Arlington, VA 22230 Phone: (703) 292-2275 Fax: (703) 292-9092 E-mail: [email protected]
NSF Survey of Earned Doctorates (SED)/Doctorate Records File (DRF) Additional information is available from:
http://www.nsf.gov/statistics/srvydoctorates/ http://www.norc.uchicago.edu/issues/docdata.htm Mark K. Fiegener, Social Science Analyst The National Science Foundation Directorate for Social, Behavioral & Economic Sciences Division of Science Resources Statistics Human Resources Statistics Program 4201 Wilson Boulevard, Suite 965 S Arlington, VA 22230 Phone: (703) 292-4622 Fax: (703) 292-9092 E-mail: [email protected]
NSF Survey of Research and Development Expenditures at Colleges and Universities
Additional information is available from: http://www.nsf.gov/statistics/srvyrdexpenditures/ Ronda Britt, Survey Statistician The National Science Foundation Directorate for Social, Behavioral & Economic Sciences Division of Science Resources Statistics
138
Research and Development Statistics Program 4201 Wilson Boulevard, Suite 965 S Arlington, VA 22230 Phone: (703) 292-7765 Fax: (703) 292-9092 E-mail: [email protected]
NSF-NIH Survey of Graduate Student and Postdoctorates in Science and Engineering
Additional information is available from: http://www.nsf.gov/statistics/srvygradpostdoc/ Kelly H. Kang, Senior Analyst The National Science Foundation Directorate for Social, Behavioral & Economic Sciences Division of Science Resources Statistics Human Resources Statistics Program 4201 Wilson Boulevard, Suite 965 S Arlington, VA 22230 Phone: (703) 292-7796 Fax: (703) 292-9092 E-mail: [email protected]
Research Doctorate Programs in the United States: Continuity and Change; National Academy of Sciences, National Research Council
Additional information is available from: http://www.nap.edu/readingroom/books/researchdoc/ http://books.nap.edu/catalog/4915.html http://books.nap.edu/catalog/5305.html http://www7.nationalacademies.org/resdoc/index.html Charlotte Kuh, Ph.D. Deputy Executive Director, Division on Policy and Global Affairs, and Study Q Director Board on Higher Education and Workforce The National Academies 500 Fifth Street, NW Washington, DC 20001 Phone: (202) 334-2700 Fax: (202) 334.2725 E-mail: [email protected]
139
James Voytuk, Ph.D. Senior Program Officer Board on Higher Education and Workforce The National Academies 500 Fifth Street, NW Washington, DC 20001 Phone: (202) 334-3190 Fax: (202) 334-2725 E-mail: [email protected]
Patents data provided by the United States Patent and Trademark Office, Office of Electronic Information Products
Additional information is available from: http://www.uspto.gov/web/offices/cio/cis/prodsvc.htm Mail Stop11 Director of the U.S. Patent and Trademark Office P.O. Box 1450 Alexandria, VA 22313-1450
140
Appendix D. Analysis of Citation Counts
D.1 Background Statistics on Citation Counts
For citations measured by fractional counts in an expanding journal set, 95% of the observations by institution-year are between 0 and 45,075, the mean number per institution-year is 8,498, the median is 3,238, and the standard deviation is 13,129. Average citation counts vary by field. The average number of citations per institution-year by field group is as follows: biology-life sciences-agricultural sciences (3,958), medical sciences (2,325), engineering-math-physical sciences (1,826), social sciences-psychology (369), and computer science (21).
D.2 Analyses of Fractional Citation Counts in an Expanding Journal Set
A series of regressions were performed to determine, for each set of personnel and financial variables, which were most highly correlated with fractional citation counts in an expanding journal set. The data set was aggregated to the institution-year level. Financial variables were deflated using the GDP deflator; personnel variables were lagged by one year and financial variables by two years. Analyses were conducted using stepwise linear regression. We typically retained any variable that, when entered into the regression, increased r-squared by at least 0.01. All such variables were highly statistically significant when entered.
The set of faculty counts variables (all lagged by one year) in their order of entry into the regression and the cumulative r-squared values after entry were as follows: 1) Full Profs (0.143), 2) Assoc Profs (0.298), and 3) Total Fac (0.325). These are the same set of variables, and order of entry, as for fractional publication counts, although the amount of variance explained is reduced. Instructors and assistant professors did not meet the 0.01 threshold. We retained the count of full professors, associate professors and total faculty for inclusion in later regressions. When only these three independent variables were included, the coefficients were 27.4 for full professors, -95.5 for associate professors, and 21.2 for total faculty. Since addition of an associate professor also increases total faculty, the net effect of adding an associate professor would be -74.3.
The set of Carnegie classifications and type of control variables in their order of entry into the regression and the cumulative r-squared values after entry were as follows: 1) R-1 (0.247), 2) Private control (0.269) and 2) Medical (0.278). Types R-1 and Medical appeared in the fractional publication count analysis; private control did not show up in the publication analysis but makes a small (0.02) positive contribution here to r-squared. The other Carnegie classifications did not enter the regression equation. We retained R-1, private control, and Medical.
The set of academic R&D expenditures variables in their order of entry into the regression and the cumulative r-squared values after entry were as follows: 1) Total academic R&D expenditures (0.640), 2) federally financed academic R&D expenditures (0.755), and 2) other academic R&D expenditures (0.806). These are the same variables as were found in the fractional publication counts analysis. The remaining academic R&D expenditure variables did not meet a 0.01 threshold. The remaining variables included various academic R&D expenditure types (industry, the institution, or state/local government financed), total academic basic research expenditures (total, federally financed, and non-federally financed), research equipment expenditures (total, federally financed, and non-federally financed), institute financed organized research, and unreimbursed indirect costs.
141

The set of enrollment variables in their order of entry into the regression and the cumulative r-squared values after entry were as follows: 1) number of S&E grad students (0.192) and 2) fall enrollment of undergraduates (0.297), and fall enrollment of graduate students (0.328). The first two of these variables were present in the analysis of fractional publication counts; the last one is additional. Total fall enrollment did not enter the model. All fall enrollment variables were institution-wide rather than S&E specific. The coefficient for undergraduates was negative, perhaps reflecting less publication activity in some institutions with more undergraduate students.
Among the set of postdoctoral count variables, only total postdoctorates entered the regression with an incremental r-squared (0.842) in excess of 0.01. This variable was also the most important in the regression for fractional publication counts, and indeed, had a larger r-squared here than the total provided by all four variables that entered into the regression for fractional publication counts. The remaining variables that did not meet a 0.01 threshold included postdoctorates with M.D.s in total and by support type (federal research grants, federal fellowships, federal traineeships, and non-federal sources), postdoctorates without M.D.s in total and by support type, and postdoctorates by support type.
The set of non-faculty research staff count variables in their order of entry into the regression and the cumulative r-squared values after entry were as follows: 1) non-faculty research staff (0.414), and 2) non-faculty research staff without M.D.s (0.441). The first of these, but not the second, appeared in the regression for fractional publication counts.
The set of degrees awarded variables in their order of entry into the regression and the cumulative r-squared values after entry were as follows: 1) S&E doctorates from the NSF Survey of Earned Doctorates (0.401), 2) S&E BA/BS degrees (0.467), and 3) S&E master’s degrees (0.480). The first two of these variables entered into the regression for fractional publication counts. S&E doctorates from the IPEDS Completions Survey did not meet the 0.01 incremental threshold. The coefficient for BA/BS degrees was negative, consistent with the finding for number of undergraduate students. The two doctoral degree variables had a correlation of 0.973.
The complete set of retained variables identified above was entered into a stepwise regression. The variables in their order of entry into the regression and the cumulative r-squared values after entry were as follows: 1) Total academic R&D expenditures (0.639), 2) postdoctorates (0.940), and federally financed academic R&D expenditures (0.951). All of the other variables increased r-squared to 0.961. Finally, we ran a stepwise regression including all independent variables, including a variable not previously included in regressions (number of patents issued in 1988 to 2001 for the institution). No change was found in the variables entering the regression equation. Because total and federally-financed R&D expenditures were highly correlated (0.945), and the incremental r-squared obtained by adding federally-financed R&D expenditures was barely more than 0.01, we further simplified the model by restricting it to total academic R&D expenditures and postdoctorates.
D.3 Analyses of Whole Citation Counts in an Expanding Journal Set
A series of regressions were performed to determine, for each set of personnel and financial variables, which were most highly correlated with whole citation counts in an expanding journal set. The data set was aggregated to the institution-year level. Financial variables were deflated using the GDP deflator; personnel variables were lagged by one year and financial variables by
142
two years. Analyses were conducted using stepwise linear regression. We typically retained any variable that, when entered into the regression, increased r-squared by at least 0.01. All such variables were highly statistically significant when entered.
The set of faculty counts variables (all lagged by 1 year) in their order of entry into the regression and the cumulative r-squared values after entry were as follows: 1) Full Profs (0.136), 2) Assoc Profs (0.285), and 3) Total Fac (0.313). These are the same set of variables, and order of entry, as for fractional citation counts. When only the these three independent variables were included in the regression, the coefficients were 82.4 for full professors, -131.4 for associate professors, and 56.2 for total faculty. Since addition of an associate professor also increases total faculty, the net effect of adding an associate professor would be -74.2.
The set of Carnegie classifications and type of control in their order of entry into the regression and the cumulative r-squared values after entry were as follows: 1) R-1 (0.231), 2) Private control (0.254) and 2) Medical (0.264). These are the same set of variables, and order of entry, as for fractional citation counts. The other Carnegie classifications did not enter the regression equation.
The set of academic R&D expenditures variables in their order of entry into the regression and the cumulative r-squared values after entry were as follows: 1) Total academic R&D expenditures (0.600), 2) federally financed academic R&D expenditures (0.715), and 2) other academic R&D expenditures (0.772). These are the same set of variables, and order of entry, as for fractional citation counts.
The set of enrollment variables in their order of entry into the regression and the cumulative r-squared values after entry were as follows: 1) number of S&E grad students (0.180), 2) fall enrollment of undergraduates (0.284), and fall enrollment of graduate students (0.322). These are the same set of variables, and order of entry, as for fractional citation counts. The coefficient for undergraduates was negative, perhaps reflecting less publication activity in some institutions with more undergraduate students.
Among the set of postdoctoral count variables, only total postdoctorates entered the regression with an incremental r-squared (0.842) in excess of 0.01. This is the same variable found in the regression of fractional citation counts.
The set of non-faculty research staff count variables in their order of entry into the regression and the cumulative r-squared values after entry were as follows: 1) non-faculty research staff (0.387), and 2) non-faculty research staff without M.D.s (0.418). These are the same set of variables, and order of entry, as for fractional citation counts.
The set of degrees awarded variables in their order of entry into the regression and the cumulative r-squared values after entry were as follows: 1) S&E doctorates from the IPEDS Completions Survey (0.379), 2) S&E BA/BS degrees (0.445), and 3) total S&E degrees (0.046). This is slightly different than obtained from the regression on fractional citation counts, where S&E doctorates from the NSF SED survey was entered first. The two doctoral degree variables have a correlation of 0.973.
The complete set of retained variables identified above was entered into a stepwise regression. The variables in their order of entry into the regression and the cumulative r-squared values after entry were as follows: 1) Total academic R&D expenditures (0.600), and 2)
143
postdoctorates (0.940). All of the other variables increased r-squared to 0.958. Finally, we ran a stepwise regression including all independent variables, including a variable not previously included in regressions (number of patents issued in 1988 to 2001 for the institution). No other variables increased r-squared by at least 0.01, and the total r-squared with all variables was 0.965.
D.4 Path Analytic Model for Citation Counts
We developed a path analytic model under the assumption that total R&D expenditures have a direct and indirect effect on citations, where the indirect effect is through funding of some postdoctorates. We also assumed that postdoctorates have a direct effect on number of citations. A path analytic model allows total academic R&D expenditures to directly influence the number of postdoctorates, and for postdoctorates and total academic R&D expenditures to directly influence the number of publications.
For fractional citation counts in an expanding journal set, the regression coefficient for total academic R&D expenditures was 43.6 (i.e., 43.6 citations per each $1M in total academic R&D expenditures), and the coefficient for postdoctorates was 41.1 (i.e., 41.1 citations per additional postdoctorate). However, the intercept for this model was negative (-74.5), which was counterintuitive. Consequently, we found it necessary to set the intercept to zero. In the revised regression, the regression coefficient for total academic R&D expenditures was 43.0 and the coefficient for postdoctorates was 41.1. The corresponding standard errors were 1.2 and 0.42, respectively. We then performed a regression where the dependent variable was the number of postdoctorates and the independent variable was total academic R&D expenditures. We find that each $1M additional funding is associated with an increase of 2.53 additional postdoctorates. Thus, adding together the direct and indirect effects, we find that each $1M in additional academic R&D expenditures is expected to result in 147.0 (i.e., 43.0 + 41.1 x 2.53) citation counts. We note however, that since the citation count is the number of citations to publications in any of 3 prior years, the $1M increase must be maintained for three years. The effect of a $1M increase in a single year would only be an increase of 49 (i.e., 147.0 / 3) fractional count citations.
For whole citation counts in an expanding journal set, the regression coefficient for total academic R&D expenditures was 55.7 per $1M and the coefficient for postdoctorates was 74.8. The corresponding standard errors were 2.6 and 0.73, respectively. The coefficient for total academic R&D expenditures regressed on the number of postdoctorates was 2.53 per $1M. Consequently, adding together the direct and indirect effects, we find that each $1M in additional funding for 3 consecutive years is associated with an increase of 244.9 (i.e., 55.7 + 74.8 x 2.53) whole publication counts. The effect of a $1M increase in a single year would only be an increase of 81.6 (i.e., 244.9.0/3) whole count citations.
We note that the number of citations that the model predicts will be generated is more than we would expect given the additional number of publications that are predicted. For each $1M in additional total academic R&D expenditures, the publications model predicts 7.18 fractional count and 11.0 whole count publications. On average there are 5.44 fractional count citations per fractional count publication and 6.19 whole count citations per whole count publication. Therefore, we would expect per $1 M in additional total academic R&D expenditures to generate 39.0 fractional count and 68.1 whole count citations. However, the path model for citations predicts 49.0 fractional count and 81.6 whole count citations. This appears to be a consequence
144
of the non-constant ratio of citations to publications. For example, whole count publications in 1988 to 1990 each generate approximately 5.48 whole count citations in 1992, whereas whole count publications in 1997 to 1999 each generate approximately 6.60 whole count citations in 2001. Some of this increase may be due to the expansion of the journal set over time; citation counts can increase in an expanding journal set even when publications do not, because the larger database of journals provides more opportunities for citation. Similarly, fractional count publications in 1988 to 1990 each generate approximately 4.95 fractional count citations in 1992, whereas fractional count publications in 1997 to 1999 each generate approximately 5.70 fractional count citations in 2001. The interaction of this change in the citation to publication ratio with the increase in academic R&D expenditures over time (so larger expenditures are associated with higher citation to publication ratios) results in a model that tends to overpredict the slope for the academic R&D expenditures variable, and consequently overpredict the increase in citations per $1M of additional funds.
145

Appendix E. Crosswalk of WebCASPAR and ipIQ Classifications
Table E-1. Relationship of WebCASPAR and ipIQ Field Classifications1
WebCASPAR Broad Field WebCASPAR Fine Field ipIQ Fine Field ipIQ Broad Field ENGINEERING Aerospace Engineering Aerospace Technology Engineering & Technology Chemical Engineering Chemical Engineering Engineering & Technology Civil Engineering Civil Engineering Engineering & Technology Electrical Engineering Electr Eng & Elctron Engineering & Technology Mechanical Engineering Mechanical Engineer Engineering & Technology Materials Engineering Materials Science Engineering & Technology Materials Engineering Metals & Metallurgy Engineering & Technology Industrial Engineering Industrial Engineer Engineering & Technology
Other Engineering Operations Research & Management Engineering & Technology
Other Engineering Biomedical Enginrng Biomedical Research Other Engineering Nuclear Technology Engineering & Technology Other Engineering General Engineering Engineering & Technology Other Engineering Misc Eng & Technol Engineering & Technology ASTRONOMY Astronomy Astronmy & Astrophys Earth & Space Sciences CHEMISTRY Chemistry Analytical Chemistry Chemistry Chemistry Organic Chemistry Chemistry Chemistry Physical Chemistry Chemistry Chemistry Polymers Chemistry Chemistry General Chemistry Chemistry Chemistry Applied Chemistry Chemistry
1 Sources: ipIQ, Inc. and National Science Foundation, Division of Science Resources Statistics, WebCASPAR database, http://webcaspar.nsf.gov.
146
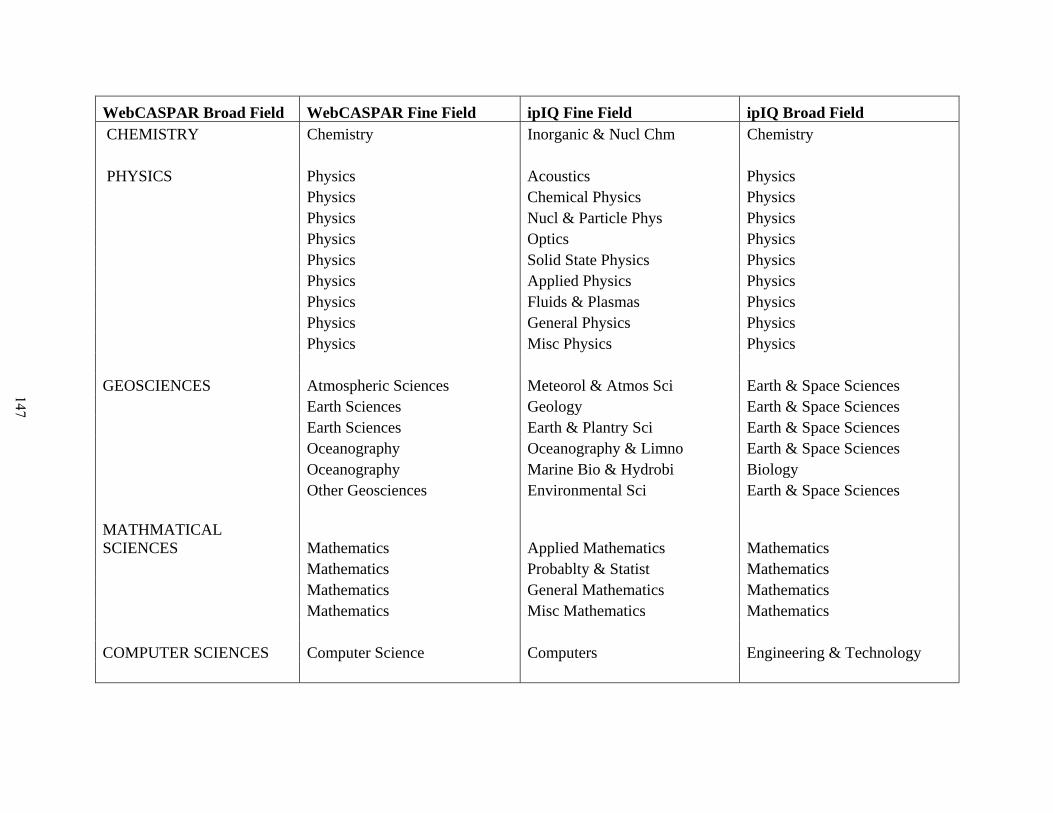
WebCASPAR Broad Field WebCASPAR Fine Field ipIQ Fine Field ipIQ Broad Field CHEMISTRY Chemistry Inorganic & Nucl Chm Chemistry PHYSICS Physics Acoustics Physics Physics Chemical Physics Physics Physics Nucl & Particle Phys Physics Physics Optics Physics Physics Solid State Physics Physics Physics Applied Physics Physics Physics Fluids & Plasmas Physics Physics General Physics Physics Physics Misc Physics Physics GEOSCIENCES Atmospheric Sciences Meteorol & Atmos Sci Earth & Space Sciences Earth Sciences Geology Earth & Space Sciences Earth Sciences Earth & Plantry Sci Earth & Space Sciences Oceanography Oceanography & Limno Earth & Space Sciences Oceanography Marine Bio & Hydrobi Biology Other Geosciences Environmental Sci Earth & Space Sciences MATHMATICAL SCIENCES Mathematics Applied Mathematics Mathematics Mathematics Probablty & Statist Mathematics Mathematics General Mathematics Mathematics Mathematics Misc Mathematics Mathematics COMPUTER SCIENCES Computer Science Computers Engineering & Technology
147
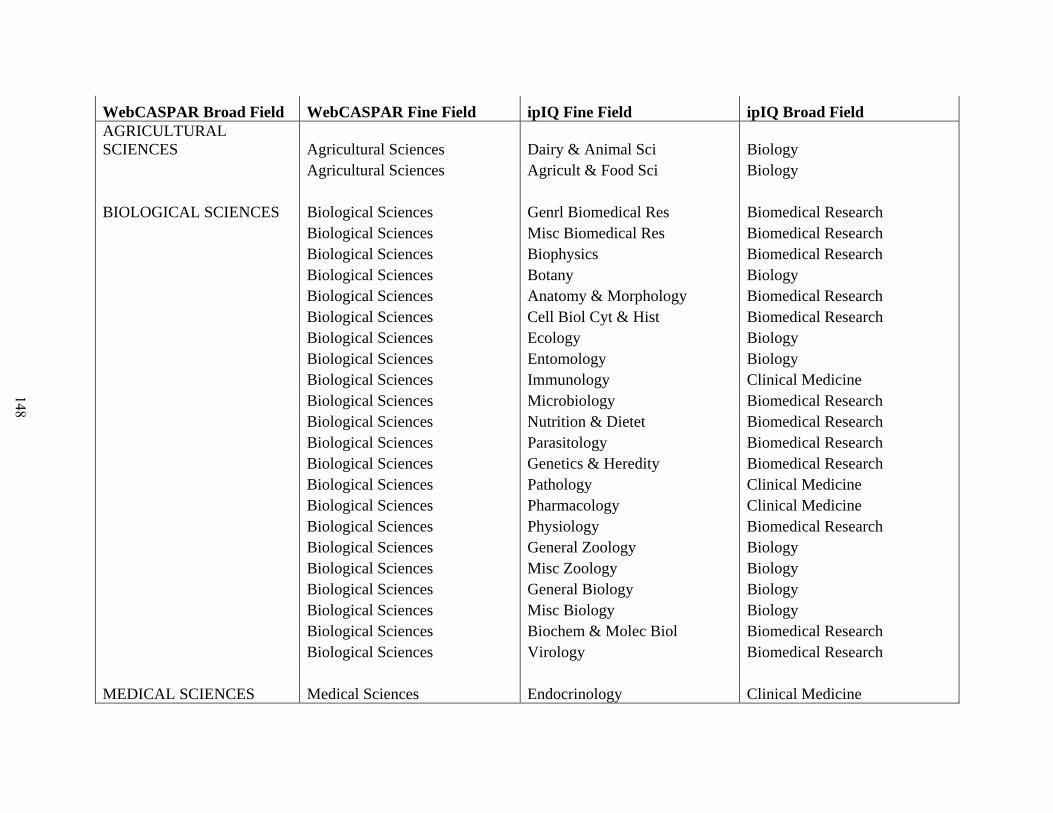
WebCASPAR Broad Field WebCASPAR Fine Field ipIQ Fine Field ipIQ Broad Field AGRICULTURAL SCIENCES Agricultural Sciences Dairy & Animal Sci Biology Agricultural Sciences Agricult & Food Sci Biology BIOLOGICAL SCIENCES Biological Sciences Genrl Biomedical Res Biomedical Research Biological Sciences Misc Biomedical Res Biomedical Research Biological Sciences Biophysics Biomedical Research Biological Sciences Botany Biology Biological Sciences Anatomy & Morphology Biomedical Research Biological Sciences Cell Biol Cyt & Hist Biomedical Research Biological Sciences Ecology Biology Biological Sciences Entomology Biology Biological Sciences Immunology Clinical Medicine Biological Sciences Microbiology Biomedical Research Biological Sciences Nutrition & Dietet Biomedical Research Biological Sciences Parasitology Biomedical Research Biological Sciences Genetics & Heredity Biomedical Research Biological Sciences Pathology Clinical Medicine Biological Sciences Pharmacology Clinical Medicine Biological Sciences Physiology Biomedical Research Biological Sciences General Zoology Biology Biological Sciences Misc Zoology Biology Biological Sciences General Biology Biology Biological Sciences Misc Biology Biology Biological Sciences Biochem & Molec Biol Biomedical Research Biological Sciences Virology Biomedical Research MEDICAL SCIENCES Medical Sciences Endocrinology Clinical Medicine
148
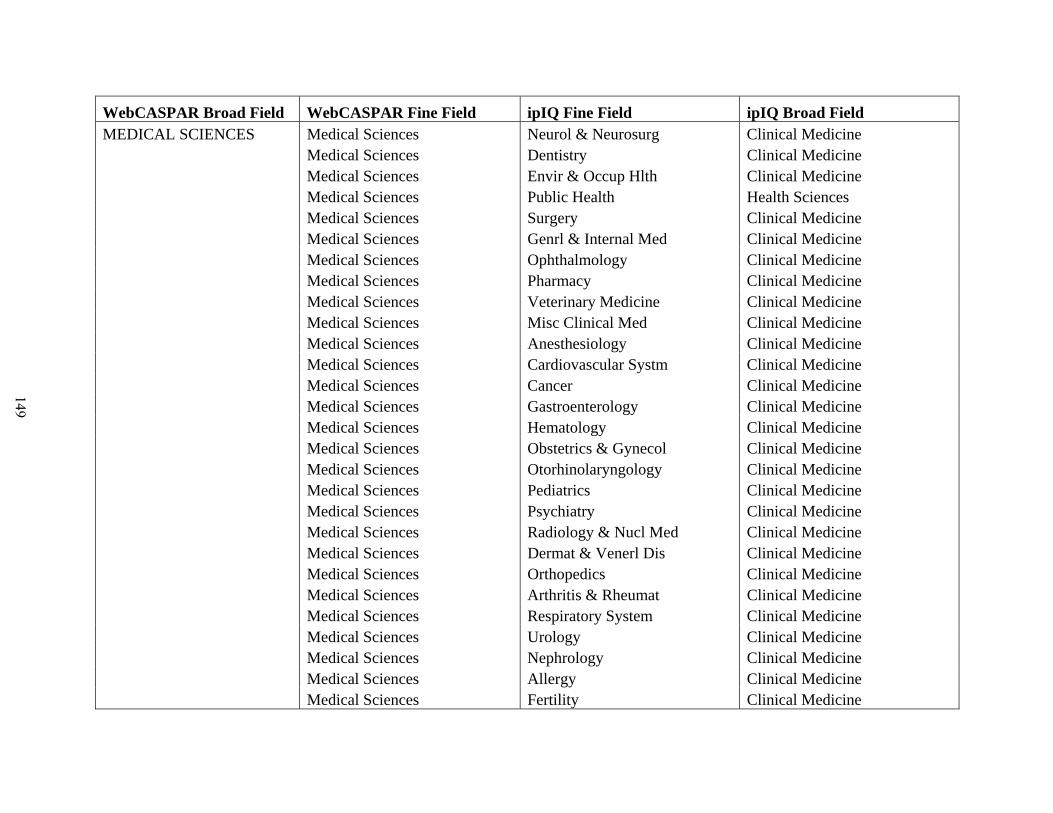
WebCASPAR Broad Field WebCASPAR Fine Field ipIQ Fine Field ipIQ Broad Field MEDICAL SCIENCES Medical Sciences Neurol & Neurosurg Clinical Medicine Medical Sciences Dentistry Clinical Medicine Medical Sciences Envir & Occup Hlth Clinical Medicine Medical Sciences Public Health Health Sciences Medical Sciences Surgery Clinical Medicine Medical Sciences Genrl & Internal Med Clinical Medicine Medical Sciences Ophthalmology Clinical Medicine Medical Sciences Pharmacy Clinical Medicine Medical Sciences Veterinary Medicine Clinical Medicine Medical Sciences Misc Clinical Med Clinical Medicine Medical Sciences Anesthesiology Clinical Medicine Medical Sciences Cardiovascular Systm Clinical Medicine Medical Sciences Cancer Clinical Medicine Medical Sciences Gastroenterology Clinical Medicine Medical Sciences Hematology Clinical Medicine Medical Sciences Obstetrics & Gynecol Clinical Medicine Medical Sciences Otorhinolaryngology Clinical Medicine Medical Sciences Pediatrics Clinical Medicine Medical Sciences Psychiatry Clinical Medicine Medical Sciences Radiology & Nucl Med Clinical Medicine Medical Sciences Dermat & Venerl Dis Clinical Medicine Medical Sciences Orthopedics Clinical Medicine Medical Sciences Arthritis & Rheumat Clinical Medicine Medical Sciences Respiratory System Clinical Medicine Medical Sciences Urology Clinical Medicine Medical Sciences Nephrology Clinical Medicine Medical Sciences Allergy Clinical Medicine Medical Sciences Fertility Clinical Medicine
149
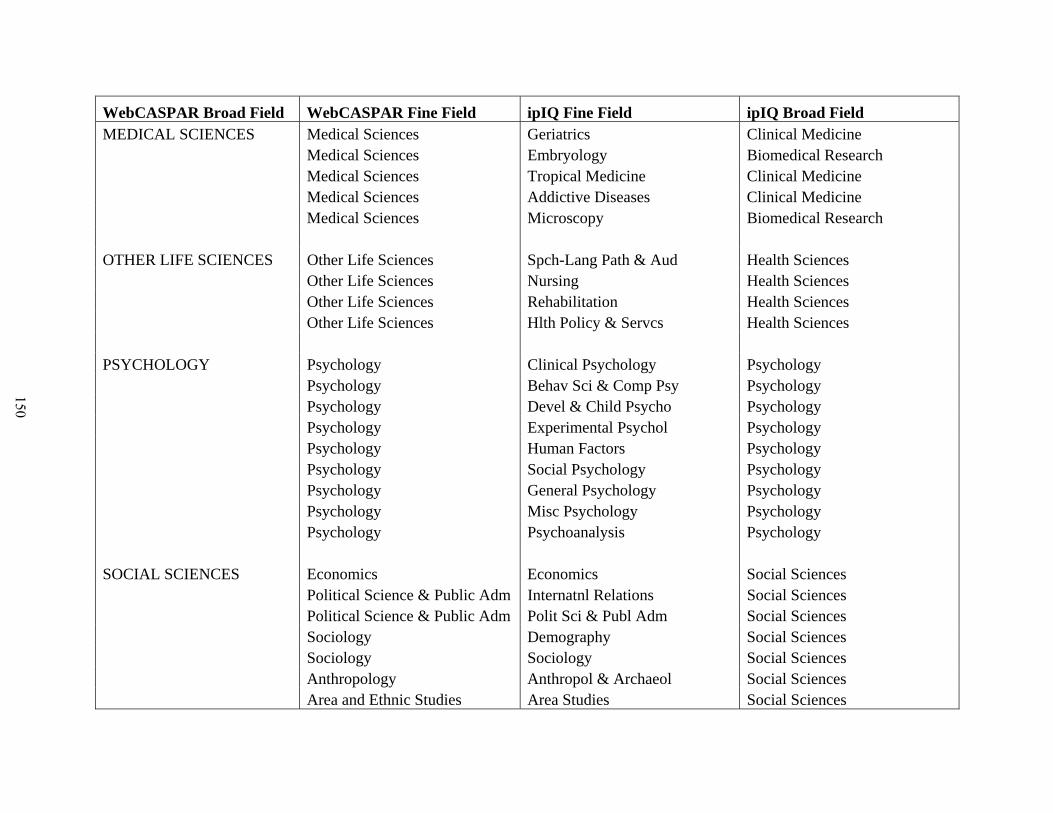
WebCASPAR Broad Field WebCASPAR Fine Field ipIQ Fine Field ipIQ Broad Field MEDICAL SCIENCES Medical Sciences Geriatrics Clinical Medicine Medical Sciences Embryology Biomedical Research Medical Sciences Tropical Medicine Clinical Medicine Medical Sciences Addictive Diseases Clinical Medicine Medical Sciences Microscopy Biomedical Research OTHER LIFE SCIENCES Other Life Sciences Spch-Lang Path & Aud Health Sciences Other Life Sciences Nursing Health Sciences Other Life Sciences Rehabilitation Health Sciences Other Life Sciences Hlth Policy & Servcs Health Sciences PSYCHOLOGY Psychology Clinical Psychology Psychology Psychology Behav Sci & Comp Psy Psychology Psychology Devel & Child Psycho Psychology Psychology Experimental Psychol Psychology Psychology Human Factors Psychology Psychology Social Psychology Psychology Psychology General Psychology Psychology Psychology Misc Psychology Psychology Psychology Psychoanalysis Psychology SOCIAL SCIENCES Economics Economics Social Sciences Political Science & Public Adm Internatnl Relations Social Sciences Political Science & Public Adm Polit Sci & Publ Adm Social Sciences Sociology Demography Social Sciences Sociology Sociology Social Sciences Anthropology Anthropol & Archaeol Social Sciences Area and Ethnic Studies Area Studies Social Sciences
150
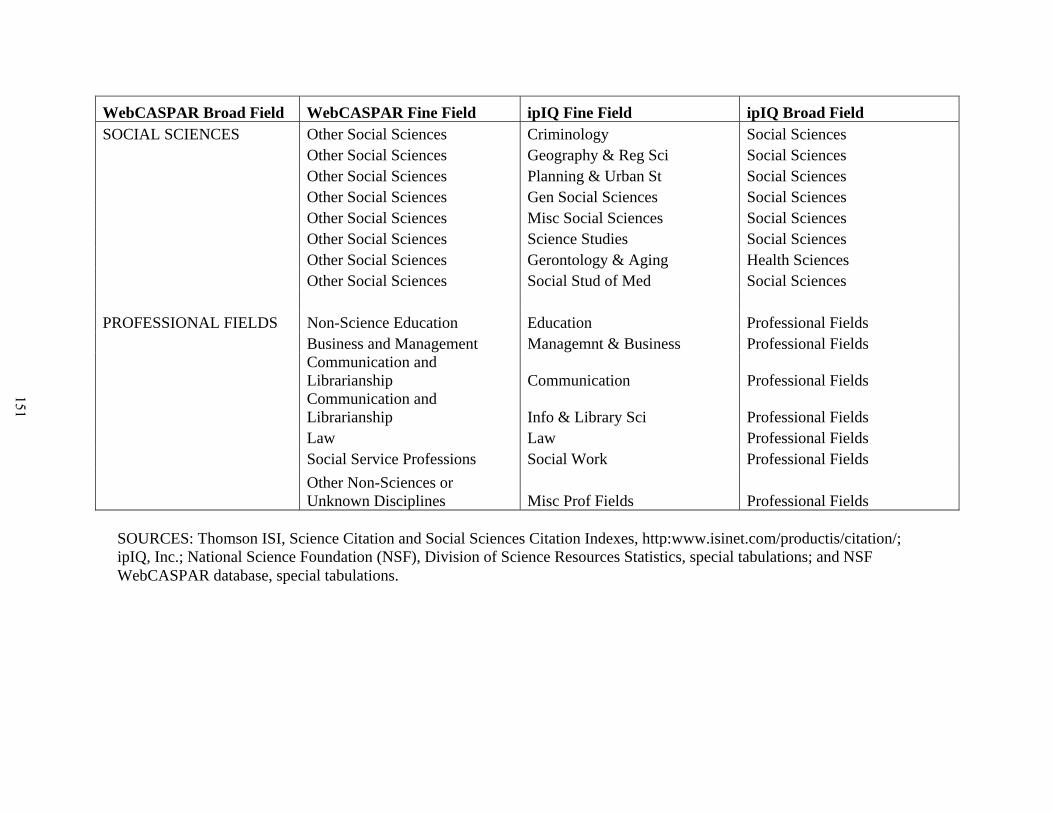
WebCASPAR Broad Field WebCASPAR Fine Field ipIQ Fine Field ipIQ Broad Field SOCIAL SCIENCES Other Social Sciences Criminology Social Sciences Other Social Sciences Geography & Reg Sci Social Sciences Other Social Sciences Planning & Urban St Social Sciences Other Social Sciences Gen Social Sciences Social Sciences Other Social Sciences Misc Social Sciences Social Sciences Other Social Sciences Science Studies Social Sciences Other Social Sciences Gerontology & Aging Health Sciences Other Social Sciences Social Stud of Med Social Sciences PROFESSIONAL FIELDS Non-Science Education Education Professional Fields Business and Management Managemnt & Business Professional Fields
Communication and Librarianship Communication Professional Fields
Communication and Librarianship Info & Library Sci Professional Fields
Law Law Professional Fields Social Service Professions Social Work Professional Fields
Other Non-Sciences or Unknown Disciplines Misc Prof Fields Professional Fields
SOURCES: Thomson ISI, Science Citation and Social Sciences Citation Indexes, http:www.isinet.com/productis/citation/; ipIQ, Inc.; National Science Foundation (NSF), Division of Science Resources Statistics, special tabulations; and NSF WebCASPAR database, special tabulations.
151
Appendix F. Analysis of the Relative Citation Index
We sought to examine whether the number of citations per publication at an institution (i.e., the relative citation index, or RCI) was related to various characteristics of the institution. The relative citation index is a measure of the quality or influence of publications, although there are reasons other than these that can result in more or fewer citations per publication. We defined the relative citation index for a given year as the ratio of number of citations that occur two years in the future to the count of publications occurring in the three year period ending in the given year. For example, we defined the relative citation index for 1992 to be the number of citations in 1994 measured using whole counts in an expanding journal set to all publications in 1990, 1991, and 1992 measured using whole counts.
The range of the relative citation index over institution-years is 0.59 to 19.9; 95% of the values at the institution-year level are between 1.7 and 9.9; the mean value is 4.89; the median is 4.47; and the standard deviation is 2.27. A very large proportion (94.3%) of the variance in the relative citation index is attributable to differences between institutions. The relative citation index varies by field. The average number of citations per publication is largest in the biology-life-agricultural sciences (6.71) and medical sciences (5.11); the average number of citations per publication is intermediate in engineering-math-physical sciences (3.66) and social sciences and psychology (2.37) and is relatively small in computer science (1.17). The correlation of the relative citation index and whole count publications is 0.58; the correlation with whole count citations is 0.69. This suggests that some of the same factors that account for increasing publications and citations may be associated with higher levels of citations per publication.
In regression analyses that we conducted, the dependent variable was the relative citation index. The data set was aggregated to the institution-year level. Financial variables were deflated using the GDP deflator; personnel variables were lagged by one year and financial variables by two years. Analyses were conducted using stepwise linear regression. We typically retained any variable that, when entered into the regression, increased r-squared by at least 0.01. All such variables were highly statistically significant when entered.
The set of academic R&D expenditures variables in their order of entry into the regression and the cumulative r-squared values after entry were as follows: 1) federally financed academic R&D expenditures (0.328), 2) non-federally financed academic R&D expenditures (0.373), 3) other funding sources for academic R&D expenditures (0.469), 4) total basic research expenditures (a component of total academic R&D expenditures, 0.484), and 5) institution financed unreimbursed indirect costs (0.496). The remaining academic R&D expenditure and research equipment variables, total academic R&D expenditures and research equipment expenditures, federally financed basic research and research equipment expenditures, industry, state/local government, and institutionally financed academic R&D expenditures, and institutionally financed organized research expenditures, did not meet a 0.01 threshold. The coefficients for four of these variables were positive. The coefficients per $1M for these variables, in their order of entry, were 0.01, -0.04, 0.14, 0.016, and 0.055. We note that since academic R&D funded by other
152
sources is non-federal, the net coefficient for this type of funding is 0.10. Thus, research funded by foundations and the institution itself appear to increase the number of citations per publication by the most, and research funded by other non-federally funded sources (primarily commercial sources and state/local governments) decreases the number of citations per publication.
The set of enrollment variables in their order of entry into the regression and the cumulative r-squared values after entry were as follows: 1) fall enrollment of undergraduates (0.43), 2) and fall enrollment of graduate students (0.174). These fall enrollment variables were institution-wide rather than S&E specific; the number of S&E graduate students did not enter the model. The coefficient for graduate students was 0.36 per 1,000 students. The coefficient for undergraduates (-0.11 per 1000 students) was negative, possibly a reflection that institutions with more undergraduate students have lower production of publications which is associated with a smaller relative citation index.
The set of postdoctoral count variables in their order of entry into the regression and the cumulative r-squared values after entry were as follows: 1) total postdoctorates (0.366), 2) postdoctorates supported by federal traineeships (0.377), and 3) postdoctorates with M.D.s supported by federal traineeships (0.397). The remaining variables did not meet a 0.01 threshold. The coefficients per 1,000 postdoctorates for these variables were 3.4, -60.0, and 46.2. The net effect is therefore -56.6 for postdoctorates without M.D.s supported by federal traineeships, -10.4 for postdoctorates with M.D.s supported by federal traineeships, and 3.4 for all other postdoctorates. The negative effects may reflect the emphasis of federal traineeships on training or other activities rather than research, which lowers production of articles. Institutions with a lower production of articles are associated with a smaller relative citation index.
The set of non-faculty research staff count variables in their order of entry into the regression and the cumulative r-squared values after entry were as follows: 1) non-faculty research staff with M.D.s (0.253), and 2) non-faculty research staff without M.D.s (0.264). The coefficients per 100 non-faculty research staff were 14.7 and 0.6, respectively, indicating that non-faculty research staff with M.D.s result in higher citations per publication. This is may reflect the larger number of citations per publication in the medical and biological-life-agricultural sciences fields.
The set of faculty count variables in their order of entry into the regression and the cumulative r-squared values after entry were as follows: 1) associate professors (0.014), and 2) full professors (0.148). Instructors, lecturers, assistant professors and other ranks did not meet the 0.01 threshold. The coefficients per 100 faculty for the two ranks entering the regression were -0.91 and 0.59, respectively. We do not know why larger numbers of associate professors are associated with fewer citations per publication. Possible explanations could include associate professors being more concentrated in fields with fewer citations per publication, being funded more often by sources associated with fewer citation per publication (i.e., commercial or state/local governmental sources), having classes with larger numbers of undergraduates, being more intent on publishing to acquire promotion to full professorship even though each publication may not be as influential, being more highly concentrated in institutions with unmeasured
153
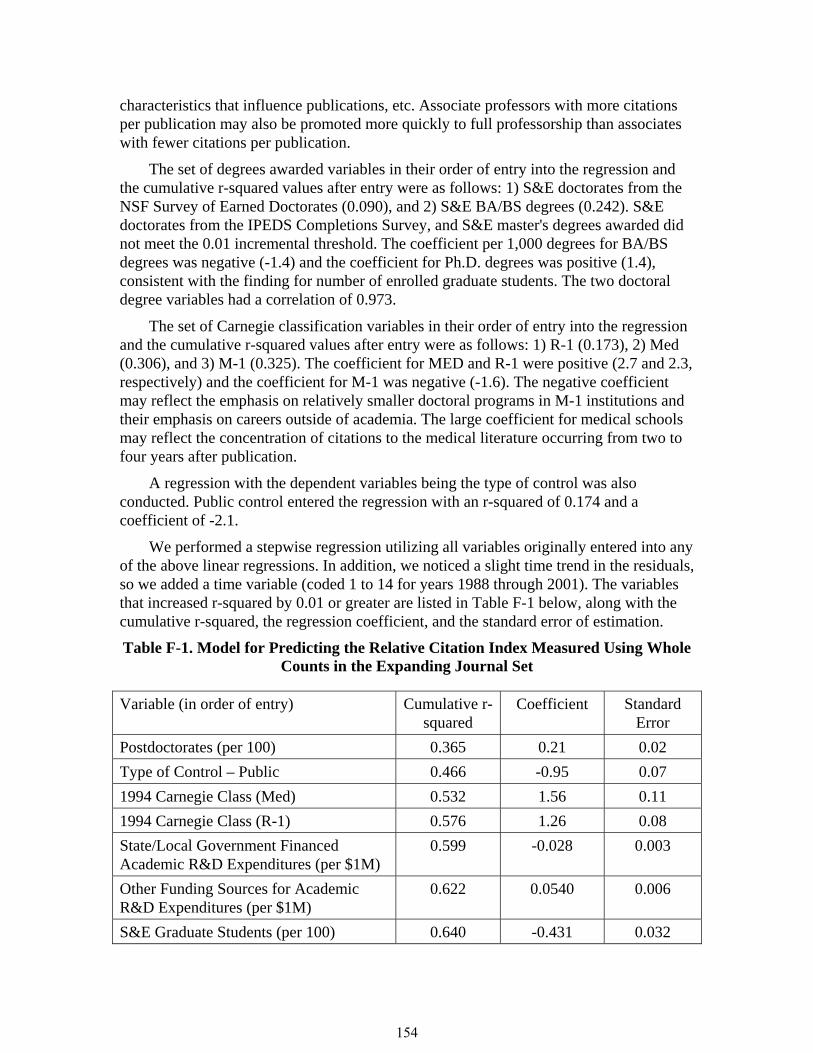
characteristics that influence publications, etc. Associate professors with more citations per publication may also be promoted more quickly to full professorship than associates with fewer citations per publication.
The set of degrees awarded variables in their order of entry into the regression and the cumulative r-squared values after entry were as follows: 1) S&E doctorates from the NSF Survey of Earned Doctorates (0.090), and 2) S&E BA/BS degrees (0.242). S&E doctorates from the IPEDS Completions Survey, and S&E master's degrees awarded did not meet the 0.01 incremental threshold. The coefficient per 1,000 degrees for BA/BS degrees was negative (-1.4) and the coefficient for Ph.D. degrees was positive (1.4), consistent with the finding for number of enrolled graduate students. The two doctoral degree variables had a correlation of 0.973.
The set of Carnegie classification variables in their order of entry into the regression and the cumulative r-squared values after entry were as follows: 1) R-1 (0.173), 2) Med (0.306), and 3) M-1 (0.325). The coefficient for MED and R-1 were positive (2.7 and 2.3, respectively) and the coefficient for M-1 was negative (-1.6). The negative coefficient may reflect the emphasis on relatively smaller doctoral programs in M-1 institutions and their emphasis on careers outside of academia. The large coefficient for medical schools may reflect the concentration of citations to the medical literature occurring from two to four years after publication.
A regression with the dependent variables being the type of control was also conducted. Public control entered the regression with an r-squared of 0.174 and a coefficient of -2.1.
We performed a stepwise regression utilizing all variables originally entered into any of the above linear regressions. In addition, we noticed a slight time trend in the residuals, so we added a time variable (coded 1 to 14 for years 1988 through 2001). The variables that increased r-squared by 0.01 or greater are listed in Table F-1 below, along with the cumulative r-squared, the regression coefficient, and the standard error of estimation.
Table F-1. Model for Predicting the Relative Citation Index Measured Using Whole Counts in the Expanding Journal Set
Variable (in order of entry) Cumulative r-squared
Coefficient Standard Error
Postdoctorates (per 100) 0.365 0.21 0.02
Type of Control – Public 0.466 -0.95 0.07
1994 Carnegie Class (Med) 0.532 1.56 0.11
1994 Carnegie Class (R-1) 0.576 1.26 0.08
State/Local Government Financed Academic R&D Expenditures (per $1M)
0.599 -0.028 0.003
Other Funding Sources for Academic R&D Expenditures (per $1M)
0.622 0.0540 0.006
S&E Graduate Students (per 100) 0.640 -0.431 0.032
154
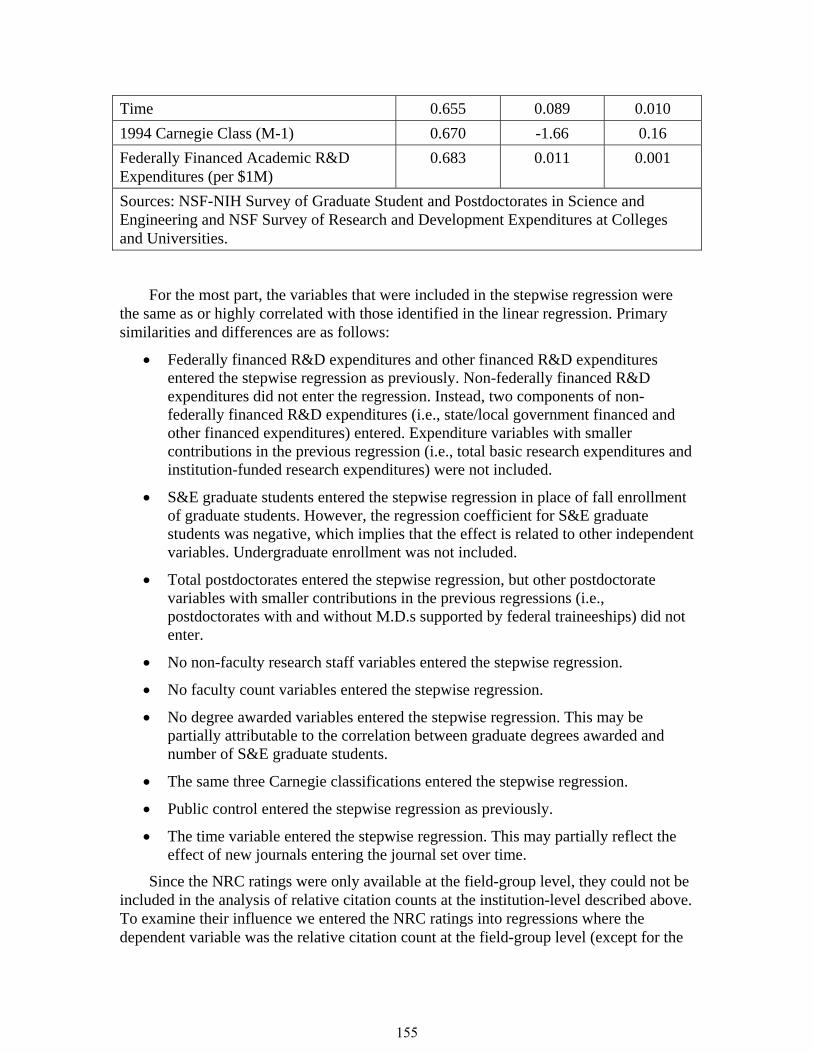
Time 0.655 0.089 0.010
1994 Carnegie Class (M-1) 0.670 -1.66 0.16
Federally Financed Academic R&D Expenditures (per $1M)
0.683 0.011 0.001
Sources: NSF-NIH Survey of Graduate Student and Postdoctorates in Science and Engineering and NSF Survey of Research and Development Expenditures at Colleges and Universities.
For the most part, the variables that were included in the stepwise regression were the same as or highly correlated with those identified in the linear regression. Primary similarities and differences are as follows:
Federally financed R&D expenditures and other financed R&D expenditures entered the stepwise regression as previously. Non-federally financed R&D expenditures did not enter the regression. Instead, two components of non-federally financed R&D expenditures (i.e., state/local government financed and other financed expenditures) entered. Expenditure variables with smaller contributions in the previous regression (i.e., total basic research expenditures and institution-funded research expenditures) were not included.
S&E graduate students entered the stepwise regression in place of fall enrollment of graduate students. However, the regression coefficient for S&E graduate students was negative, which implies that the effect is related to other independent variables. Undergraduate enrollment was not included.
Total postdoctorates entered the stepwise regression, but other postdoctorate variables with smaller contributions in the previous regressions (i.e., postdoctorates with and without M.D.s supported by federal traineeships) did not enter.
No non-faculty research staff variables entered the stepwise regression.
No faculty count variables entered the stepwise regression.
No degree awarded variables entered the stepwise regression. This may be partially attributable to the correlation between graduate degrees awarded and number of S&E graduate students.
The same three Carnegie classifications entered the stepwise regression.
Public control entered the stepwise regression as previously.
The time variable entered the stepwise regression. This may partially reflect the effect of new journals entering the journal set over time.
Since the NRC ratings were only available at the field-group level, they could not be included in the analysis of relative citation counts at the institution-level described above. To examine their influence we entered the NRC ratings into regressions where the dependent variable was the relative citation count at the field-group level (except for the
155
medical sciences group, which was not NRC rated). The independent variables were all of those used in the institution-level regressions plus the NRC ratings. For three of the field groups, the variable that was entered first in the regression was the 1993 NRC SQR ratings. For those field-groups, the proportion of variance accounted for by these ratings was as follows: 1) bio-life-agricultural sciences (57.9%), 2) computer science (17.5%), and 3) social sciences and psychology (24.0%). For the eng-math-physical sciences field-group, NRC ratings entered third in the regression, with an incremental r-squared of 3.8%; when entered by itself, NRC ratings accounted for 9.3% of the variance. This suggests that NRC ratings are strongly associated with and predictive of the number of citations per publication.
156
Appendix G. Analysis of Publication Counts in the Fixed Journal Set
G.1 Background Statistics on Fractional Publications Counts in a Fixed Journal Set
For publications measured by fractional counts in a fixed journal set, 95% of the observations by institution-year are between 27 and 1,942, the mean number per institution-year is 546, the median is 368, and the standard deviation is 529. Average publications counts vary by field. The average number of publications per institution-year by field group is as follows: biology-life sciences-agricultural sciences (2,931), medical sciences (1,723), engineering-math-physical sciences (1,493), social sciences-psychology (256), and computer science (13).
G.2 Analyses of Fractional Citation Counts in a Fixed Journal Set
A series of regressions were performed to determine, for each set of personnel and financial variables, which were most highly correlated with fractional citation counts in a fixed journal set. The data set was aggregated to the institution-year level. Financial variables were deflated using the GDP deflator; personnel variables were lagged by one year and financial variables by two years. Analyses were conducted using stepwise linear regression. We typically retained any variable that, when entered into the regression, increased r-squared by at least 0.01. All such variables were highly statistically significant when entered.
The set of faculty counts variables (all lagged by 1 year) in their order of entry into the regression and the cumulative r-squared values after entry were as follows: 1) Full Profs (0.369), 2) Assoc Profs (0.455), and 3) Total Fac (0.490). These are the same set of variables, and order of entry, as for fractional publication counts in an expanding journal set, and the amount of variance explained is almost identical. We retained these variables for inclusion in later regressions. When only these three independent variables were included, the coefficients were 1.10 for full professors, -3.23 for associate professors, and 0.88 for total faculty. Since addition of an associate professor also increases total faculty, the net effect of adding an associate professor would be -1.25. A negative effect for associate professors was also found in the expanding journal set.
The set of Carnegie classifications and type of control variables in their order of entry into the regression and the cumulative r-squared values after entry were as follows: 1) R-1 (0.489), and 2) Medical (0.500). These are the same set of variables, and order of entry, as for fractional publication counts in an expanding journal set, and the amount of variance explained is almost identical.
The set of academic R&D expenditures variables in their order of entry into the regression and the cumulative r-squared values after entry were as follows: 1) Total academic R&D expenditures (0.804), 2) other funding sources of academic R&D expenditures (0.816), and 3) federally financed academic R&D expenditures (0.825). These are the same variables as were found in the fractional publication counts analysis in an expanding journal set and the amount of variance explained is almost identical.
157
The set of enrollment variables in their order of entry into the regression and the cumulative r-squared values after entry were as follows: 1) number of S&E grad students (0.463) and 2) fall enrollment of undergraduates (0.527). These are the same variables as were found in the fractional publication counts analysis in an expanding journal set and the amount of variance explained is almost identical. All fall enrollment variables were institution-wide rather than S&E specific. The coefficient for undergraduates was negative (as it was in the analysis of the expanding journal set), perhaps reflecting less publication activity in some institutions with more undergraduate students.
The set of postdoctoral count variables in their order of entry into the regression and cumulative r-squared value after entry were as follows: 1) postdocs without M.D.s supported by federal research grants (0.756), 2) postdocs supported by federal traineeships (.770), and 3) postdocs supported by federal fellowship (0.780). These variables are somewhat different from those found in the analysis of fractional counts in an expanding journal set. However, there is very high correlation among the entire set of postdoctoral counts (with a single principal component containing 82% of the variability among the measures). When we substituted the first three postdoctoral count variables found in the analysis of fractional counts in an expanding journal set (i.e., total postdocs, postdocs supported by federal research grant, and postdocs with M.D.s supported by federal research grant) into the regression of fractional counts in a fixed data set, we found that they account for almost the same amount of variance (0.761). In addition, this is approximately the amount (0.803) found in the analysis of the expanding journal set. We retained the latter three variables to allow easier comparison between the analyses of the fixed and expanding journal set.
In the set of non-faculty research staff count variables, only non-faculty research staff (0.479) entered the regression, mirroring the result in the expanding journal set.
The set of degrees-awarded variables in their order of entry into the regression and the cumulative r-squared values after entry were as follows: 1) S&E doctorates from the NSF Survey of Earned Doctorates (0.701), and 2) S&E BA/BS degrees (0.712). These results are essentially the same as that for fractional publication counts in an expanding journal set. The coefficient for BA/BS degrees was negative (as it was in the analysis of the expanding journal set), consistent with the finding for number of undergraduate students.
The complete set of retained variables identified above was entered into a stepwise regression. The variables in their order of entry into the regression and the cumulative r-squared values after entry were as follows: 1) Total academic R&D expenditures (0.825), 2) postdoctorates (0.891), and number of S&E doctoral recipients (0.910). All of the other variables increased r-squared to 0.930. These are the same three variables as found in the analysis of fractional counts in an expanding journal set, and very similar increments to r-squared (i.e., 0.816, 0.926, and 0.936). The coefficients for the number of postdocs and S&E doctoral recipients in these two sets of regressions were similar: postdoctorates (fixed = 0.727, expanding = 0.882), and S&E doctoral recipients (fixed = 1.24, expanding = 1.18). The coefficient for total academic R&D was slightly lower for the fixed journal set (2.49 per $1M) than for the expanding journal set (3.31 per $1M),
158
although some of this difference reflects the fact that there are approximately 15% more publications in the expanding journal set than in the fixed journal set.
G.3 Analyses of Whole Count Publications in an Fixed Journal Set
We repeated this process for publications as measured by whole counts in a fixed journal set. A set of four variables entered into the regression, including total academic R&D expenditures, the number of S&E doctoral recipients, and two postdoctoral counts — the number of postdoctorates without M.D.s supported by federal research grants and the number of postdoctorates with M.D.s. The total r-squared was 0.925. Essentially the same r-squared (0.919) was achieved by substituting the total number of postdoctorates for the two postdoctoral measures mentioned above. The coefficients for this model were 3.60 per $1M in academic R&D expenditures, 1.38 per postdoctorate, and 1.59 per S&E Ph.D. recipient, with corresponding standard errors of 0.14, 0.03, and 0.07, respectively.
Since both publications as measured by fractional and whole counts in an expanding journal set could be explained with the same three variables — total academic R&D expenditures, postdoctorates, and S&E Ph.D. recipients — we retained these three variables for further analysis.
G.4 Path Analytic Model for Publication Counts
We developed a path analytic model under the assumption that total academic R&D expenditures have a direct and indirect effect on publications, where the indirect effect is through funding of some postdoctorates and Ph.D. graduate students. We also assumed that postdoctorates and S&E Ph.D. recipients have a direct effect on number of publications. A path analytic model allows total academic R&D expenditures to directly influence the number of postdoctorates and S&E Ph.D. recipients, and for total academic R&D expenditures, the number of postdoctorates, and the number of S&E Ph.D. recipients to directly influence the number of publications.
For publications as measured by fractional counts in a fixed journal set, the regression coefficient for total academic R&D expenditures was 2.49 (i.e., 2.49 publications per each $1M in academic R&D expenditures), the coefficient for postdoctorates was 0.727, and the coefficient for S&E Ph.D. recipients was 1.24. We then performed a regression where the dependent variable was the number of postdoctorates and the independent variable was total academic R&D expenditures. We find that each $1M additional funding is associated with an increase of 2.53 additional postdoctorates (with a standard error of estimate of 0.05). A similar regression shows that each $1M additional funding is associated with an increase of 1.39 S&E Ph.D. recipients (with a standard error of estimate of 0.02). Thus, adding together the direct and indirect effects, we find that each $1M in academic R&D expenditures results in 6.05 (i.e., 2.49 + 0.727 x 2.53 + 1.24 x 1.39) publication counts (about $165K per fractional publication count). This is higher than the cost per fractional publication count in the expanding journal set because the fixed journal set contains fewer publications and the amount of academic R&D expenditures, postdoctorates, and S&E doctoral recipients has not been proportionately reduced.
159
For publication counts as measured by whole counts in a fixed journal set, the regression coefficient for total academic R&D expenditures was 3.60 per $1M, the coefficient for postdoctorates was 1.38, and the coefficient for S&E Ph.D. recipients was 1.59. The coefficient for total academic R&D expenditures regressed on the number of postdoctorates was 2.53 per $1M. The coefficient for total academic R&D expenditures regressed on the number of S&E Ph.D. recipients was 1.395 per $1M. Consequently, adding together the direct and indirect effects, we find that each $1M in additional funding is associated with an increase of 9.3 (i.e., 3.60 + 1.38 x 2.53 + 1.59 x 1.395) publications as measured by whole counts (about $107K per count).
160
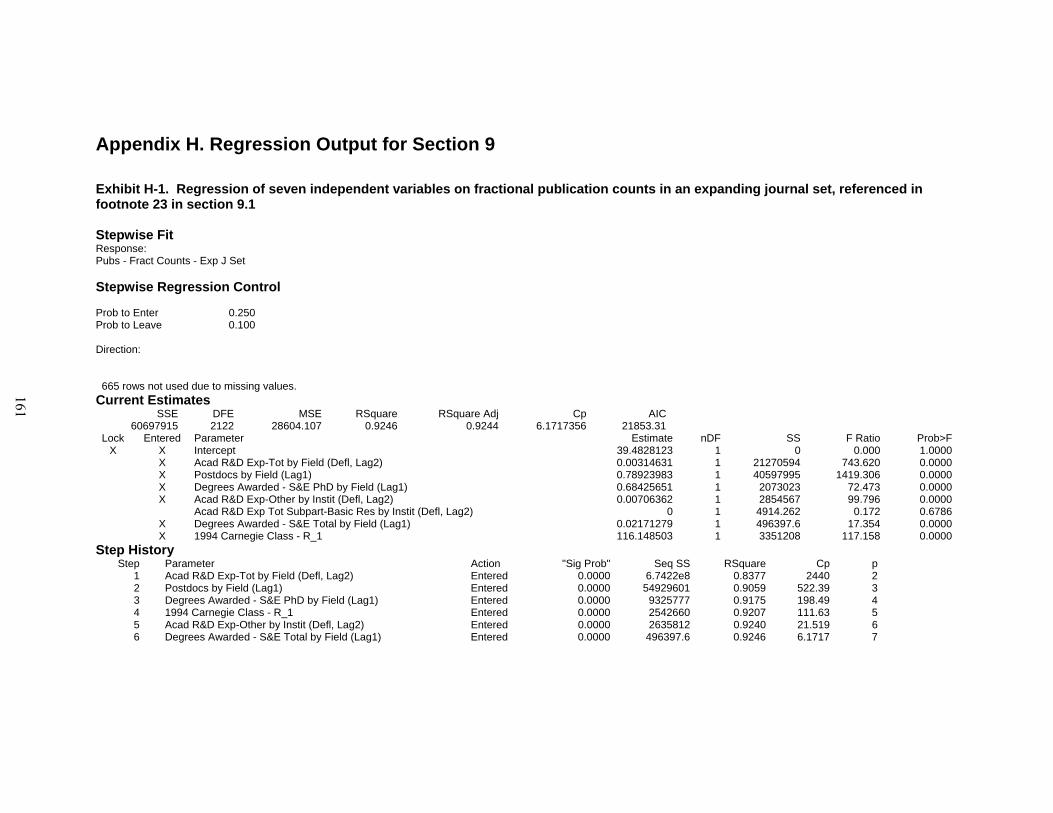
Appendix H. Regression Output for Section 9
Exhibit H-1. Regression of seven independent variables on fractional publication counts in an expanding journal set, referenced in footnote 23 in section 9.1 Stepwise Fit Response: Pubs - Fract Counts - Exp J Set Stepwise Regression Control Prob to Enter 0.250 Prob to Leave 0.100 Direction: 665 rows not used due to missing values. Current Estimates
SSE DFE MSE RSquare RSquare Adj Cp AIC60697915 2122 28604.107 0.9246 0.9244 6.1717356 21853.31
Lock Entered Parameter Estimate nDF SS F Ratio Prob>FX X Intercept 39.4828123 1 0 0.000 1.0000 X Acad R&D Exp-Tot by Field (Defl, Lag2) 0.00314631 1 21270594 743.620 0.0000 X Postdocs by Field (Lag1) 0.78923983 1 40597995 1419.306 0.0000 X Degrees Awarded - S&E PhD by Field (Lag1) 0.68425651 1 2073023 72.473 0.0000 X Acad R&D Exp-Other by Instit (Defl, Lag2) 0.00706362 1 2854567 99.796 0.0000 Acad R&D Exp Tot Subpart-Basic Res by Instit (Defl, Lag2) 0 1 4914.262 0.172 0.6786 X Degrees Awarded - S&E Total by Field (Lag1) 0.02171279 1 496397.6 17.354 0.0000 X 1994 Carnegie Class - R_1 116.148503 1 3351208 117.158 0.0000
Step History Step Parameter Action "Sig Prob" Seq SS RSquare Cp p
1 Acad R&D Exp-Tot by Field (Defl, Lag2) Entered 0.0000 6.7422e8 0.8377 2440 22 Postdocs by Field (Lag1) Entered 0.0000 54929601 0.9059 522.39 33 Degrees Awarded - S&E PhD by Field (Lag1) Entered 0.0000 9325777 0.9175 198.49 44 1994 Carnegie Class - R_1 Entered 0.0000 2542660 0.9207 111.63 55 Acad R&D Exp-Other by Instit (Defl, Lag2) Entered 0.0000 2635812 0.9240 21.519 66 Degrees Awarded - S&E Total by Field (Lag1) Entered 0.0000 496397.6 0.9246 6.1717 7
161
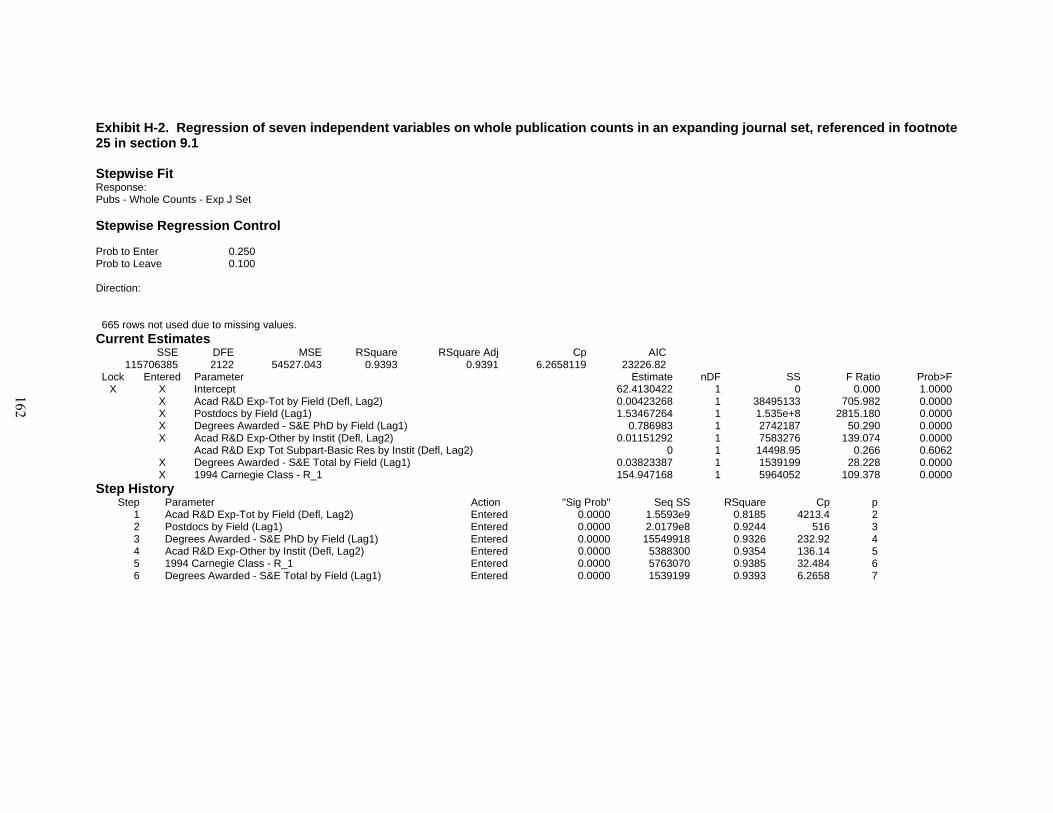
Exhibit H-2. Regression of seven independent variables on whole publication counts in an expanding journal set, referenced in footnote 25 in section 9.1 Stepwise Fit Response: Pubs - Whole Counts - Exp J Set
Stepwise Regression Control Prob to Enter 0.250 Prob to Leave 0.100 Direction: 665 rows not used due to missing values.
Current Estimates SSE DFE MSE RSquare RSquare Adj Cp AIC
115706385 2122 54527.043 0.9393 0.9391 6.2658119 23226.82Lock Entered Parameter Estimate nDF SS F Ratio Prob>F
X X Intercept 62.4130422 1 0 0.000 1.0000 X Acad R&D Exp-Tot by Field (Defl, Lag2) 0.00423268 1 38495133 705.982 0.0000 X Postdocs by Field (Lag1) 1.53467264 1 1.535e+8 2815.180 0.0000 X Degrees Awarded - S&E PhD by Field (Lag1) 0.786983 1 2742187 50.290 0.0000 X Acad R&D Exp-Other by Instit (Defl, Lag2) 0.01151292 1 7583276 139.074 0.0000 Acad R&D Exp Tot Subpart-Basic Res by Instit (Defl, Lag2) 0 1 14498.95 0.266 0.6062 X Degrees Awarded - S&E Total by Field (Lag1) 0.03823387 1 1539199 28.228 0.0000 X 1994 Carnegie Class - R_1 154.947168 1 5964052 109.378 0.0000
Step History Step Parameter Action "Sig Prob" Seq SS RSquare Cp p
1 Acad R&D Exp-Tot by Field (Defl, Lag2) Entered 0.0000 1.5593e9 0.8185 4213.4 22 Postdocs by Field (Lag1) Entered 0.0000 2.0179e8 0.9244 516 33 Degrees Awarded - S&E PhD by Field (Lag1) Entered 0.0000 15549918 0.9326 232.92 44 Acad R&D Exp-Other by Instit (Defl, Lag2) Entered 0.0000 5388300 0.9354 136.14 55 1994 Carnegie Class - R_1 Entered 0.0000 5763070 0.9385 32.484 66 Degrees Awarded - S&E Total by Field (Lag1) Entered 0.0000 1539199 0.9393 6.2658 7
162
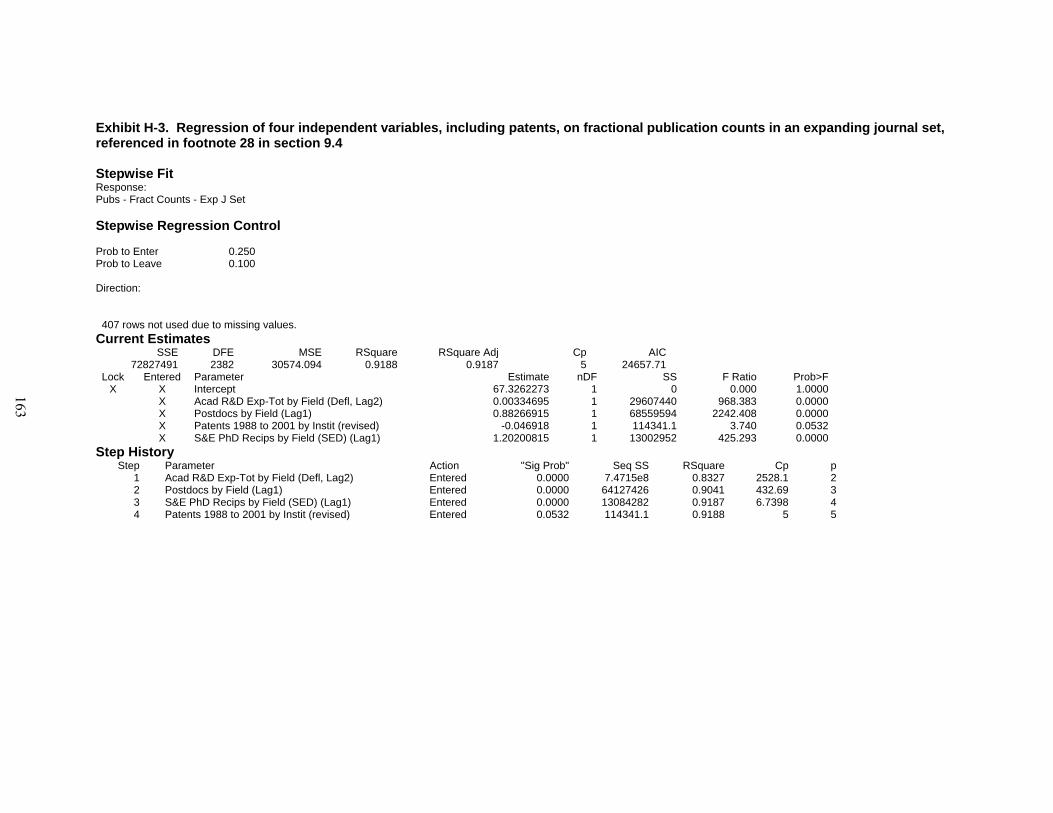
Exhibit H-3. Regression of four independent variables, including patents, on fractional publication counts in an expanding journal set, referenced in footnote 28 in section 9.4 Stepwise Fit Response: Pubs - Fract Counts - Exp J Set
Stepwise Regression Control Prob to Enter 0.250 Prob to Leave 0.100 Direction: 407 rows not used due to missing values.
Current Estimates SSE DFE MSE RSquare RSquare Adj Cp AIC
72827491 2382 30574.094 0.9188 0.9187 5 24657.71Lock Entered Parameter Estimate nDF SS F Ratio Prob>F
X X Intercept 67.3262273 1 0 0.000 1.0000 X Acad R&D Exp-Tot by Field (Defl, Lag2) 0.00334695 1 29607440 968.383 0.0000 X Postdocs by Field (Lag1) 0.88266915 1 68559594 2242.408 0.0000 X Patents 1988 to 2001 by Instit (revised) -0.046918 1 114341.1 3.740 0.0532 X S&E PhD Recips by Field (SED) (Lag1) 1.20200815 1 13002952 425.293 0.0000
Step History Step Parameter Action "Sig Prob" Seq SS RSquare Cp p
1 Acad R&D Exp-Tot by Field (Defl, Lag2) Entered 0.0000 7.4715e8 0.8327 2528.1 22 Postdocs by Field (Lag1) Entered 0.0000 64127426 0.9041 432.69 33 S&E PhD Recips by Field (SED) (Lag1) Entered 0.0000 13084282 0.9187 6.7398 44 Patents 1988 to 2001 by Instit (revised) Entered 0.0532 114341.1 0.9188 5 5
163
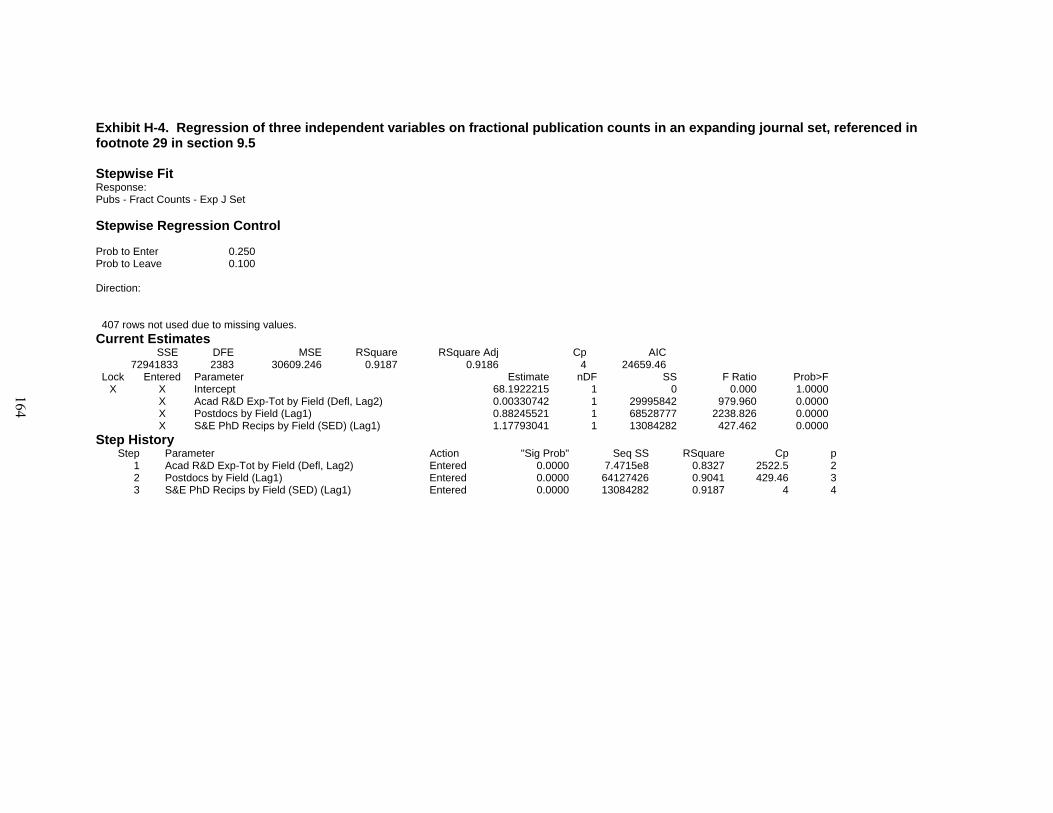
Exhibit H-4. Regression of three independent variables on fractional publication counts in an expanding journal set, referenced in footnote 29 in section 9.5 Stepwise Fit Response: Pubs - Fract Counts - Exp J Set
Stepwise Regression Control Prob to Enter 0.250 Prob to Leave 0.100 Direction: 407 rows not used due to missing values.
Current Estimates SSE DFE MSE RSquare RSquare Adj Cp AIC
72941833 2383 30609.246 0.9187 0.9186 4 24659.46Lock Entered Parameter Estimate nDF SS F Ratio Prob>F
X X Intercept 68.1922215 1 0 0.000 1.0000 X Acad R&D Exp-Tot by Field (Defl, Lag2) 0.00330742 1 29995842 979.960 0.0000 X Postdocs by Field (Lag1) 0.88245521 1 68528777 2238.826 0.0000 X S&E PhD Recips by Field (SED) (Lag1) 1.17793041 1 13084282 427.462 0.0000
Step History Step Parameter Action "Sig Prob" Seq SS RSquare Cp p
1 Acad R&D Exp-Tot by Field (Defl, Lag2) Entered 0.0000 7.4715e8 0.8327 2522.5 22 Postdocs by Field (Lag1) Entered 0.0000 64127426 0.9041 429.46 33 S&E PhD Recips by Field (SED) (Lag1) Entered 0.0000 13084282 0.9187 4 4
164
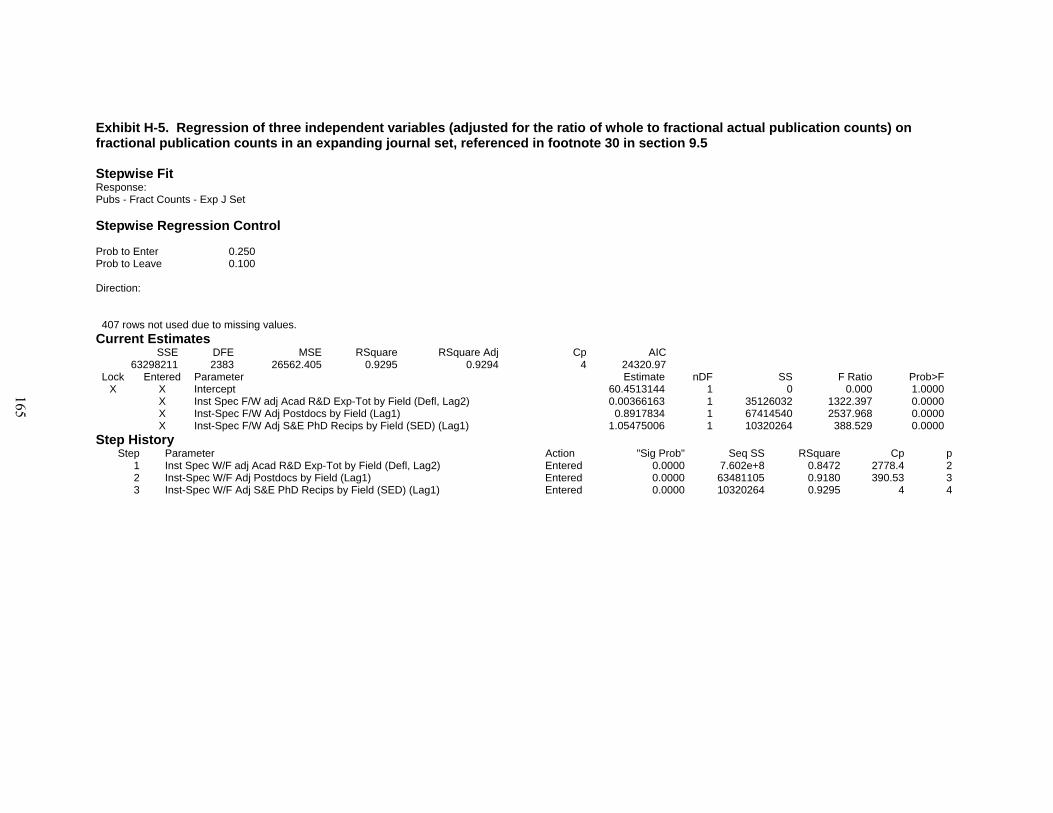
Exhibit H-5. Regression of three independent variables (adjusted for the ratio of whole to fractional actual publication counts) on fractional publication counts in an expanding journal set, referenced in footnote 30 in section 9.5 Stepwise Fit Response: Pubs - Fract Counts - Exp J Set
Stepwise Regression Control Prob to Enter 0.250 Prob to Leave 0.100 Direction: 407 rows not used due to missing values.
Current Estimates SSE DFE MSE RSquare RSquare Adj Cp AIC
63298211 2383 26562.405 0.9295 0.9294 4 24320.97Lock Entered Parameter Estimate nDF SS F Ratio Prob>F
X X Intercept 60.4513144 1 0 0.000 1.0000 X Inst Spec F/W adj Acad R&D Exp-Tot by Field (Defl, Lag2) 0.00366163 1 35126032 1322.397 0.0000 X Inst-Spec F/W Adj Postdocs by Field (Lag1) 0.8917834 1 67414540 2537.968 0.0000 X Inst-Spec F/W Adj S&E PhD Recips by Field (SED) (Lag1) 1.05475006 1 10320264 388.529 0.0000
Step History Step Parameter Action "Sig Prob" Seq SS RSquare Cp p
1 Inst Spec W/F adj Acad R&D Exp-Tot by Field (Defl, Lag2) Entered 0.0000 7.602e+8 0.8472 2778.4 22 Inst-Spec W/F Adj Postdocs by Field (Lag1) Entered 0.0000 63481105 0.9180 390.53 33 Inst-Spec W/F Adj S&E PhD Recips by Field (SED) (Lag1) Entered 0.0000 10320264 0.9295 4 4
165
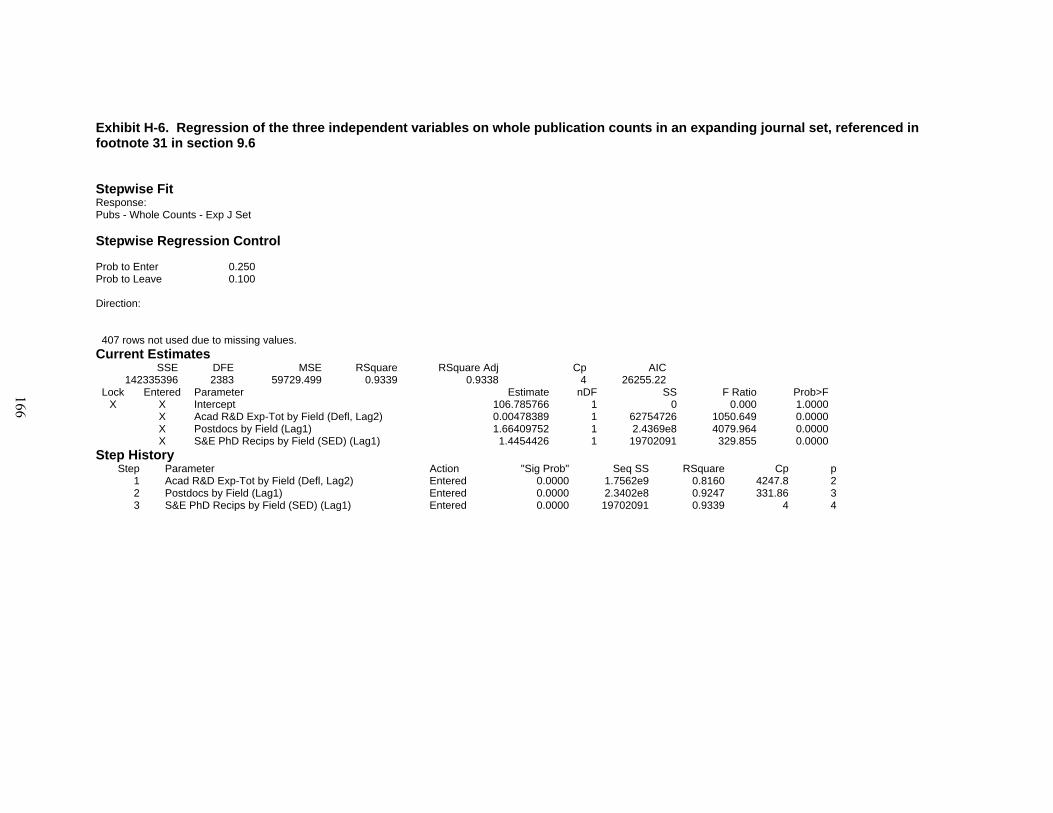
Exhibit H-6. Regression of the three independent variables on whole publication counts in an expanding journal set, referenced in footnote 31 in section 9.6 Stepwise Fit Response: Pubs - Whole Counts - Exp J Set Stepwise Regression Control Prob to Enter 0.250 Prob to Leave 0.100 Direction: 407 rows not used due to missing values. Current Estimates
SSE DFE MSE RSquare RSquare Adj Cp AIC142335396 2383 59729.499 0.9339 0.9338 4 26255.22
Lock Entered Parameter Estimate nDF SS F Ratio Prob>FX X Intercept 106.785766 1 0 0.000 1.0000 X Acad R&D Exp-Tot by Field (Defl, Lag2) 0.00478389 1 62754726 1050.649 0.0000 X Postdocs by Field (Lag1) 1.66409752 1 2.4369e8 4079.964 0.0000 X S&E PhD Recips by Field (SED) (Lag1) 1.4454426 1 19702091 329.855 0.0000
Step History Step Parameter Action "Sig Prob" Seq SS RSquare Cp p
1 Acad R&D Exp-Tot by Field (Defl, Lag2) Entered 0.0000 1.7562e9 0.8160 4247.8 22 Postdocs by Field (Lag1) Entered 0.0000 2.3402e8 0.9247 331.86 33 S&E PhD Recips by Field (SED) (Lag1) Entered 0.0000 19702091 0.9339 4 4
166
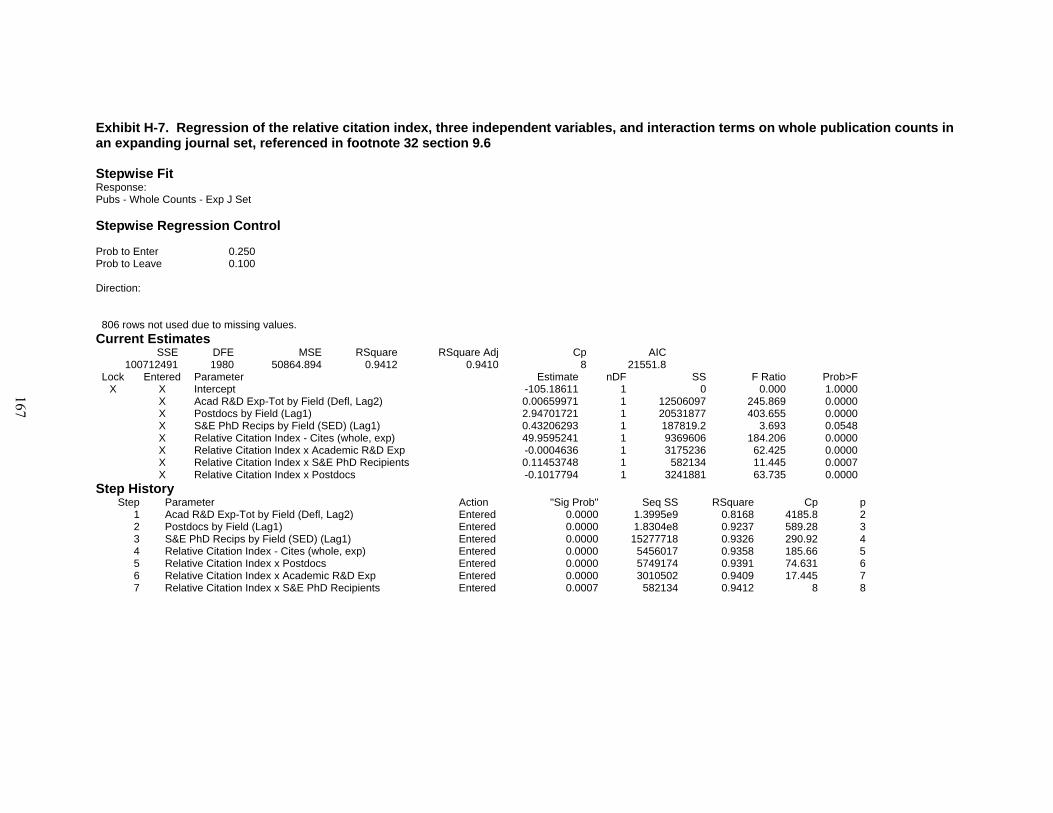
Exhibit H-7. Regression of the relative citation index, three independent variables, and interaction terms on whole publication counts in an expanding journal set, referenced in footnote 32 section 9.6 Stepwise Fit Response: Pubs - Whole Counts - Exp J Set
Stepwise Regression Control Prob to Enter 0.250 Prob to Leave 0.100 Direction: 806 rows not used due to missing values.
Current Estimates SSE DFE MSE RSquare RSquare Adj Cp AIC
100712491 1980 50864.894 0.9412 0.9410 8 21551.8Lock Entered Parameter Estimate nDF SS F Ratio Prob>F
X X Intercept -105.18611 1 0 0.000 1.0000 X Acad R&D Exp-Tot by Field (Defl, Lag2) 0.00659971 1 12506097 245.869 0.0000 X Postdocs by Field (Lag1) 2.94701721 1 20531877 403.655 0.0000 X S&E PhD Recips by Field (SED) (Lag1) 0.43206293 1 187819.2 3.693 0.0548 X Relative Citation Index - Cites (whole, exp) 49.9595241 1 9369606 184.206 0.0000 X Relative Citation Index x Academic R&D Exp -0.0004636 1 3175236 62.425 0.0000 X Relative Citation Index x S&E PhD Recipients 0.11453748 1 582134 11.445 0.0007 X Relative Citation Index x Postdocs -0.1017794 1 3241881 63.735 0.0000
Step History Step Parameter Action "Sig Prob" Seq SS RSquare Cp p
1 Acad R&D Exp-Tot by Field (Defl, Lag2) Entered 0.0000 1.3995e9 0.8168 4185.8 22 Postdocs by Field (Lag1) Entered 0.0000 1.8304e8 0.9237 589.28 33 S&E PhD Recips by Field (SED) (Lag1) Entered 0.0000 15277718 0.9326 290.92 44 Relative Citation Index - Cites (whole, exp) Entered 0.0000 5456017 0.9358 185.66 55 Relative Citation Index x Postdocs Entered 0.0000 5749174 0.9391 74.631 66 Relative Citation Index x Academic R&D Exp Entered 0.0000 3010502 0.9409 17.445 77 Relative Citation Index x S&E PhD Recipients Entered 0.0007 582134 0.9412 8 8
167
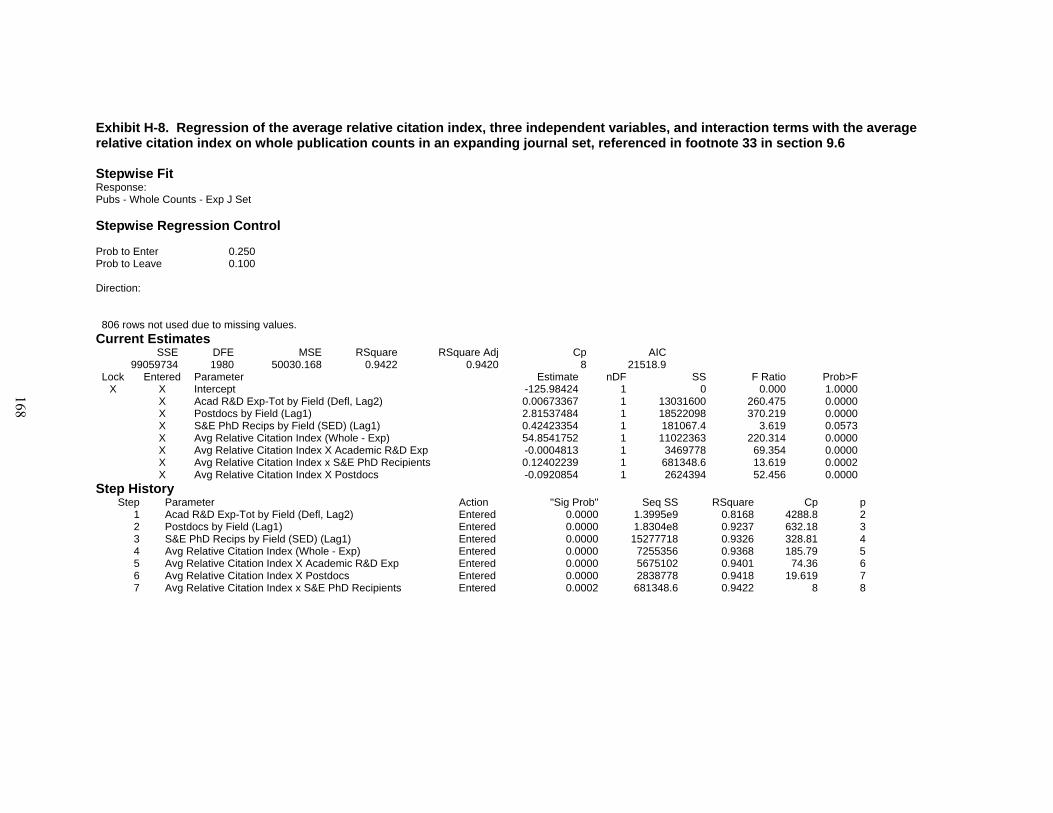
Exhibit H-8. Regression of the average relative citation index, three independent variables, and interaction terms with the average relative citation index on whole publication counts in an expanding journal set, referenced in footnote 33 in section 9.6 Stepwise Fit Response: Pubs - Whole Counts - Exp J Set
Stepwise Regression Control Prob to Enter 0.250 Prob to Leave 0.100 Direction: 806 rows not used due to missing values.
Current Estimates SSE DFE MSE RSquare RSquare Adj Cp AIC
99059734 1980 50030.168 0.9422 0.9420 8 21518.9Lock Entered Parameter Estimate nDF SS F Ratio Prob>F
X X Intercept -125.98424 1 0 0.000 1.0000 X Acad R&D Exp-Tot by Field (Defl, Lag2) 0.00673367 1 13031600 260.475 0.0000 X Postdocs by Field (Lag1) 2.81537484 1 18522098 370.219 0.0000 X S&E PhD Recips by Field (SED) (Lag1) 0.42423354 1 181067.4 3.619 0.0573 X Avg Relative Citation Index (Whole - Exp) 54.8541752 1 11022363 220.314 0.0000 X Avg Relative Citation Index X Academic R&D Exp -0.0004813 1 3469778 69.354 0.0000 X Avg Relative Citation Index x S&E PhD Recipients 0.12402239 1 681348.6 13.619 0.0002 X Avg Relative Citation Index X Postdocs -0.0920854 1 2624394 52.456 0.0000
Step History Step Parameter Action "Sig Prob" Seq SS RSquare Cp p
1 Acad R&D Exp-Tot by Field (Defl, Lag2) Entered 0.0000 1.3995e9 0.8168 4288.8 22 Postdocs by Field (Lag1) Entered 0.0000 1.8304e8 0.9237 632.18 33 S&E PhD Recips by Field (SED) (Lag1) Entered 0.0000 15277718 0.9326 328.81 44 Avg Relative Citation Index (Whole - Exp) Entered 0.0000 7255356 0.9368 185.79 55 Avg Relative Citation Index X Academic R&D Exp Entered 0.0000 5675102 0.9401 74.36 66 Avg Relative Citation Index X Postdocs Entered 0.0000 2838778 0.9418 19.619 77 Avg Relative Citation Index x S&E PhD Recipients Entered 0.0002 681348.6 0.9422 8 8
168

Exhibit H-9. Regression of the three independent variables on whole publication counts in an expanding journal set, referenced in footnote 34 in section 9.7 Stepwise Fit Response: Pubs - Whole Counts - Exp J Set
Stepwise Regression Control Prob to Enter 0.250 Prob to Leave 0.100 Direction: 3789 rows not used due to missing values.
Current Estimates SSE DFE MSE RSquare RSquare Adj Cp AIC
69425593 22695 3059.07 0.8299 0.8299 4 182183.1Lock Entered Parameter Estimate nDF SS F Ratio Prob>F
X X Intercept -1.8959674 1 0 0.000 1.0000 X Acad R&D Exp-Tot by Field (Defl, Lag2) 0.00241673 1 4092781 1337.917 0.0000 X PhD Recips by Field (SED) (Lag1) 2.62363322 1 12563444 4106.949 0.0000 X Postdocs by Field (Lag1) 2.06080778 1 79048916 25840.83 0.0000
Step History Step Parameter Action "Sig Prob" Seq SS RSquare Cp p
1 Postdocs by Field (Lag1) Entered 0.0000 3.1139e8 0.7627 8971.9 22 PhD Recips by Field (SED) (Lag1) Entered 0.0000 23352914 0.8199 1339.9 33 Acad R&D Exp-Tot by Field (Defl, Lag2) Entered 0.0000 4092781 0.8299 4 4
169
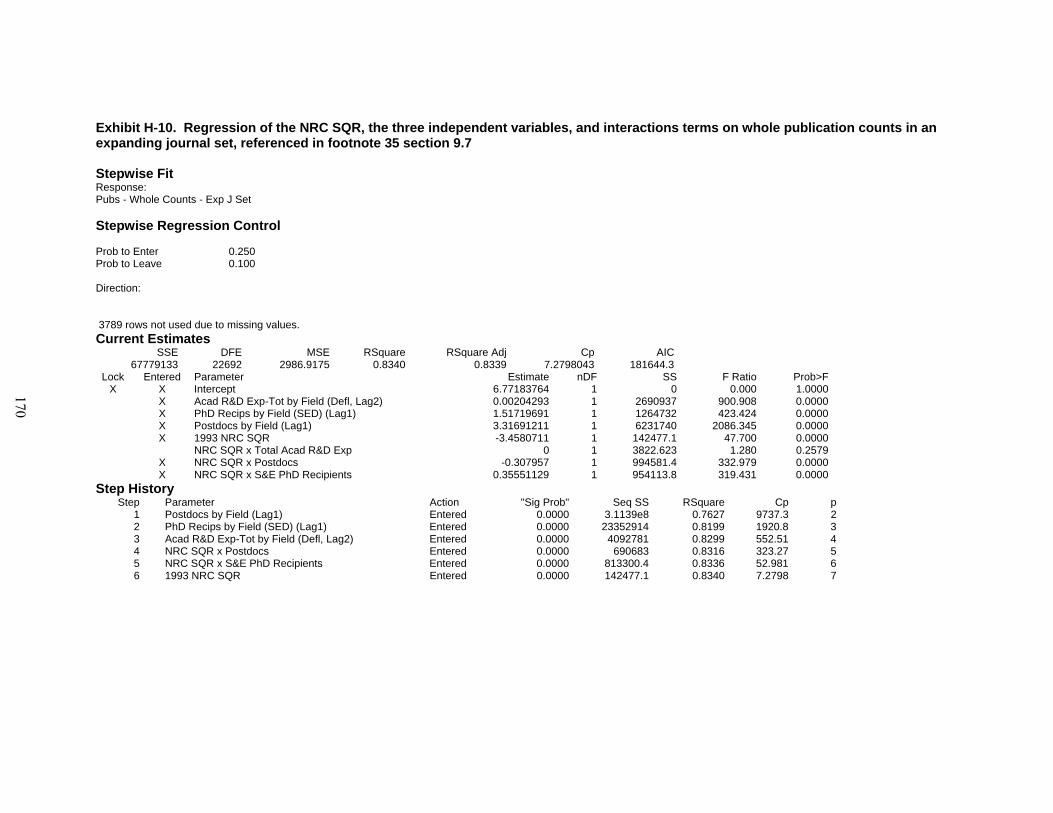
Exhibit H-10. Regression of the NRC SQR, the three independent variables, and interactions terms on whole publication counts in an expanding journal set, referenced in footnote 35 section 9.7 Stepwise Fit Response: Pubs - Whole Counts - Exp J Set
Stepwise Regression Control Prob to Enter 0.250 Prob to Leave 0.100 Direction: 3789 rows not used due to missing values.
Current Estimates SSE DFE MSE RSquare RSquare Adj Cp AIC
67779133 22692 2986.9175 0.8340 0.8339 7.2798043 181644.3Lock Entered Parameter Estimate nDF SS F Ratio Prob>F
X X Intercept 6.77183764 1 0 0.000 1.0000 X Acad R&D Exp-Tot by Field (Defl, Lag2) 0.00204293 1 2690937 900.908 0.0000 X PhD Recips by Field (SED) (Lag1) 1.51719691 1 1264732 423.424 0.0000 X Postdocs by Field (Lag1) 3.31691211 1 6231740 2086.345 0.0000 X 1993 NRC SQR -3.4580711 1 142477.1 47.700 0.0000 NRC SQR x Total Acad R&D Exp 0 1 3822.623 1.280 0.2579 X NRC SQR x Postdocs -0.307957 1 994581.4 332.979 0.0000 X NRC SQR x S&E PhD Recipients 0.35551129 1 954113.8 319.431 0.0000
Step History Step Parameter Action "Sig Prob" Seq SS RSquare Cp p
1 Postdocs by Field (Lag1) Entered 0.0000 3.1139e8 0.7627 9737.3 22 PhD Recips by Field (SED) (Lag1) Entered 0.0000 23352914 0.8199 1920.8 33 Acad R&D Exp-Tot by Field (Defl, Lag2) Entered 0.0000 4092781 0.8299 552.51 44 NRC SQR x Postdocs Entered 0.0000 690683 0.8316 323.27 55 NRC SQR x S&E PhD Recipients Entered 0.0000 813300.4 0.8336 52.981 66 1993 NRC SQR Entered 0.0000 142477.1 0.8340 7.2798 7
170
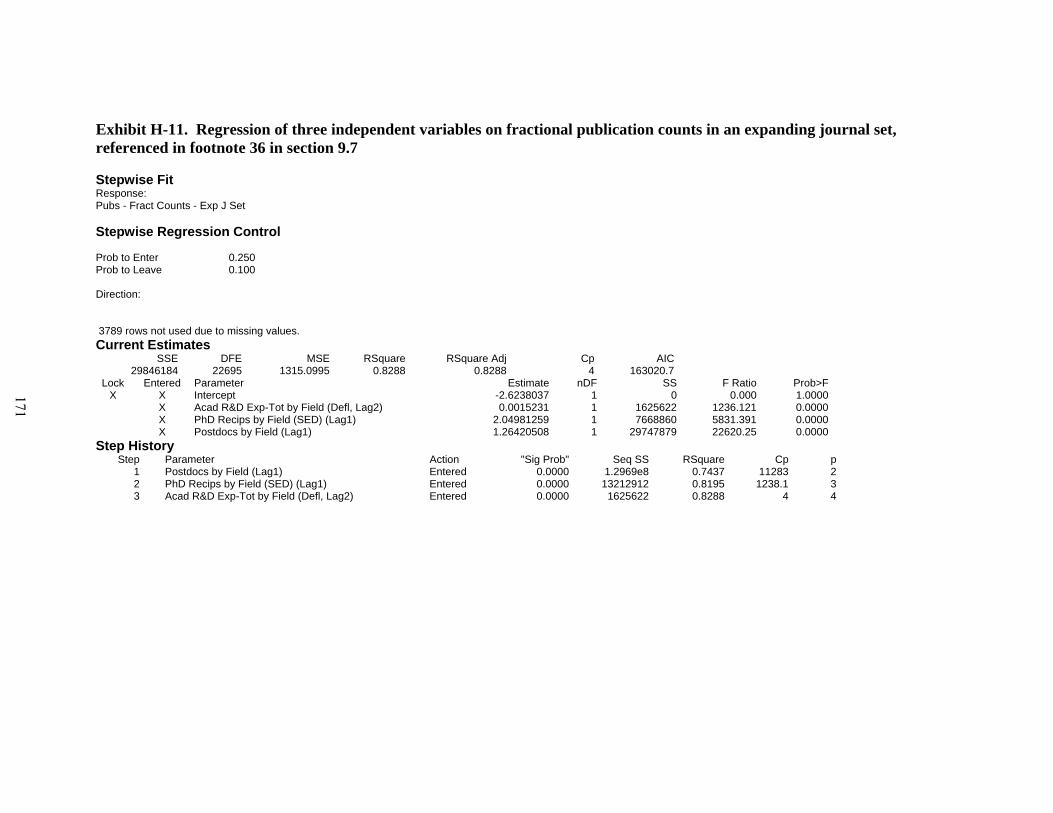
Exhibit H-11. Regression of three independent variables on fractional publication counts in an expanding journal set, referenced in footnote 36 in section 9.7 Stepwise Fit Response: Pubs - Fract Counts - Exp J Set Stepwise Regression Control Prob to Enter 0.250 Prob to Leave 0.100 Direction: 3789 rows not used due to missing values. Current Estimates
SSE DFE MSE RSquare RSquare Adj Cp AIC29846184 22695 1315.0995 0.8288 0.8288 4 163020.7
Lock Entered Parameter Estimate nDF SS F Ratio Prob>FX X Intercept -2.6238037 1 0 0.000 1.0000 X Acad R&D Exp-Tot by Field (Defl, Lag2) 0.0015231 1 1625622 1236.121 0.0000 X PhD Recips by Field (SED) (Lag1) 2.04981259 1 7668860 5831.391 0.0000 X Postdocs by Field (Lag1) 1.26420508 1 29747879 22620.25 0.0000
Step History Step Parameter Action "Sig Prob" Seq SS RSquare Cp p
1 Postdocs by Field (Lag1) Entered 0.0000 1.2969e8 0.7437 11283 22 PhD Recips by Field (SED) (Lag1) Entered 0.0000 13212912 0.8195 1238.1 33 Acad R&D Exp-Tot by Field (Defl, Lag2) Entered 0.0000 1625622 0.8288 4 4
171
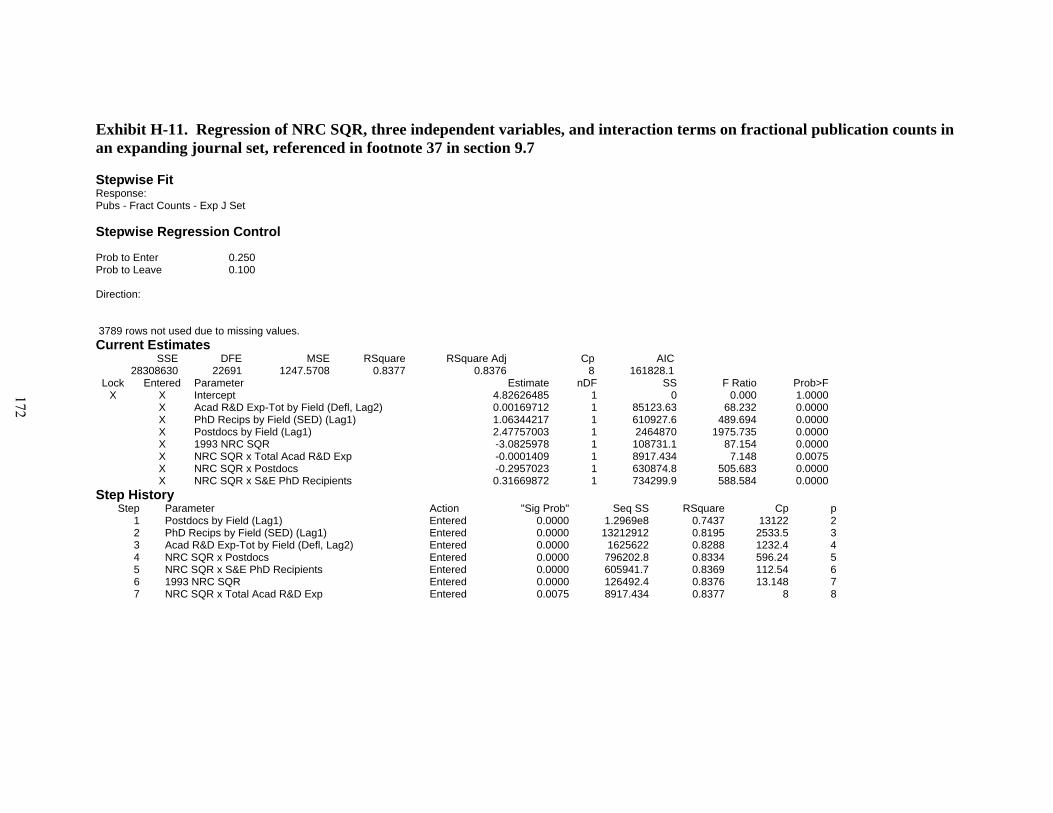
Exhibit H-11. Regression of NRC SQR, three independent variables, and interaction terms on fractional publication counts in an expanding journal set, referenced in footnote 37 in section 9.7 Stepwise Fit Response: Pubs - Fract Counts - Exp J Set Stepwise Regression Control Prob to Enter 0.250 Prob to Leave 0.100 Direction: 3789 rows not used due to missing values. Current Estimates
SSE DFE MSE RSquare RSquare Adj Cp AIC28308630 22691 1247.5708 0.8377 0.8376 8 161828.1
Lock Entered Parameter Estimate nDF SS F Ratio Prob>FX X Intercept 4.82626485 1 0 0.000 1.0000 X Acad R&D Exp-Tot by Field (Defl, Lag2) 0.00169712 1 85123.63 68.232 0.0000 X PhD Recips by Field (SED) (Lag1) 1.06344217 1 610927.6 489.694 0.0000 X Postdocs by Field (Lag1) 2.47757003 1 2464870 1975.735 0.0000 X 1993 NRC SQR -3.0825978 1 108731.1 87.154 0.0000 X NRC SQR x Total Acad R&D Exp -0.0001409 1 8917.434 7.148 0.0075 X NRC SQR x Postdocs -0.2957023 1 630874.8 505.683 0.0000 X NRC SQR x S&E PhD Recipients 0.31669872 1 734299.9 588.584 0.0000
Step History Step Parameter Action "Sig Prob" Seq SS RSquare Cp p
1 Postdocs by Field (Lag1) Entered 0.0000 1.2969e8 0.7437 13122 22 PhD Recips by Field (SED) (Lag1) Entered 0.0000 13212912 0.8195 2533.5 33 Acad R&D Exp-Tot by Field (Defl, Lag2) Entered 0.0000 1625622 0.8288 1232.4 44 NRC SQR x Postdocs Entered 0.0000 796202.8 0.8334 596.24 55 NRC SQR x S&E PhD Recipients Entered 0.0000 605941.7 0.8369 112.54 66 1993 NRC SQR Entered 0.0000 126492.4 0.8376 13.148 77 NRC SQR x Total Acad R&D Exp Entered 0.0075 8917.434 0.8377 8 8
172
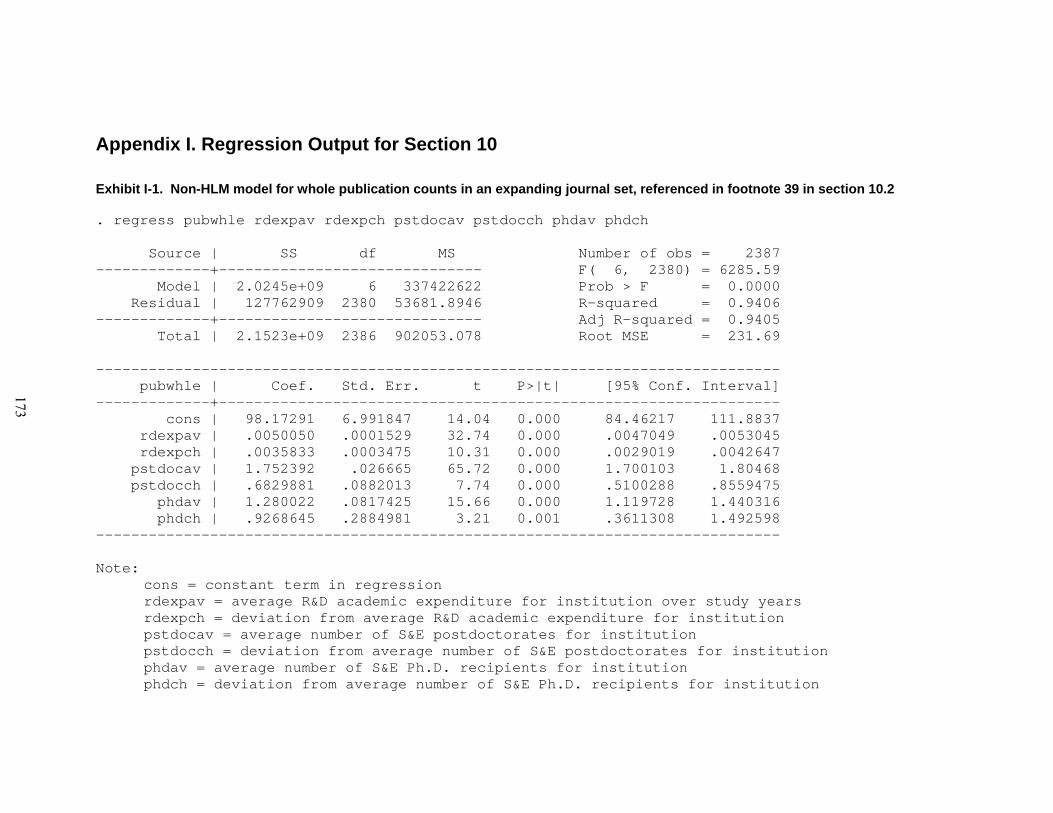
Appendix I. Regression Output for Section 10
Exhibit I-1. Non-HLM model for whole publication counts in an expanding journal set, referenced in footnote 39 in section 10.2 . regress pubwhle rdexpav rdexpch pstdocav pstdocch phdav phdch Source | SS df MS Number of obs = 2387 -------------+------------------------------ F( 6, 2380) = 6285.59 Model | 2.0245e+09 6 337422622 Prob > F = 0.0000 Residual | 127762909 2380 53681.8946 R-squared = 0.9406 -------------+------------------------------ Adj R-squared = 0.9405 Total | 2.1523e+09 2386 902053.078 Root MSE = 231.69 ------------------------------------------------------------------------------ pubwhle | Coef. Std. Err. t P>|t| [95% Conf. Interval] -------------+---------------------------------------------------------------- cons | 98.17291 6.991847 14.04 0.000 84.46217 111.8837 rdexpav | .0050050 .0001529 32.74 0.000 .0047049 .0053045 rdexpch | .0035833 .0003475 10.31 0.000 .0029019 .0042647 pstdocav | 1.752392 .026665 65.72 0.000 1.700103 1.80468 pstdocch | .6829881 .0882013 7.74 0.000 .5100288 .8559475 phdav | 1.280022 .0817425 15.66 0.000 1.119728 1.440316 phdch | .9268645 .2884981 3.21 0.001 .3611308 1.492598 ------------------------------------------------------------------------------ Note: cons = constant term in regression rdexpav = average R&D academic expenditure for institution over study years rdexpch = deviation from average R&D academic expenditure for institution pstdocav = average number of S&E postdoctorates for institution pstdocch = deviation from average number of S&E postdoctorates for institution phdav = average number of S&E Ph.D. recipients for institution phdch = deviation from average number of S&E Ph.D. recipients for institution
173
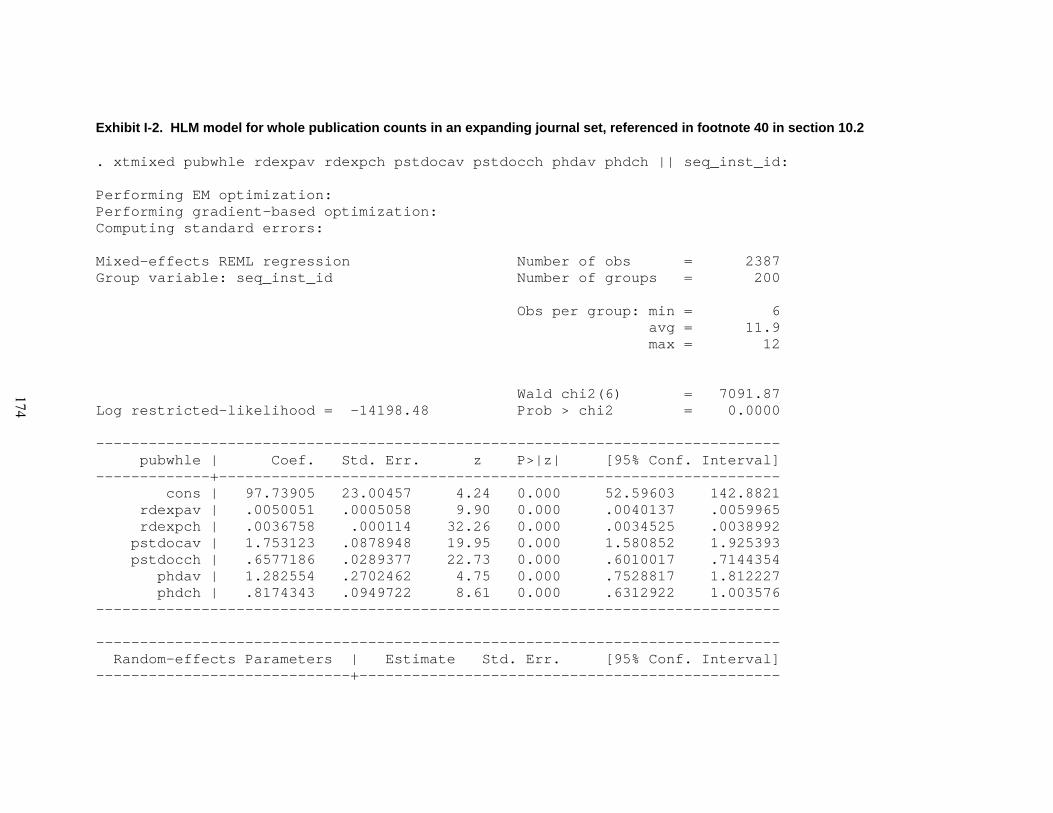
Exhibit I-2. HLM model for whole publication counts in an expanding journal set, referenced in footnote 40 in section 10.2 . xtmixed pubwhle rdexpav rdexpch pstdocav pstdocch phdav phdch || seq_inst_id: Performing EM optimization: Performing gradient-based optimization: Computing standard errors: Mixed-effects REML regression Number of obs = 2387 Group variable: seq_inst_id Number of groups = 200 Obs per group: min = 6 avg = 11.9 max = 12 Wald chi2(6) = 7091.87 Log restricted-likelihood = -14198.48 Prob > chi2 = 0.0000 ------------------------------------------------------------------------------ pubwhle | Coef. Std. Err. z P>|z| [95% Conf. Interval] -------------+---------------------------------------------------------------- cons | 97.73905 23.00457 4.24 0.000 52.59603 142.8821 rdexpav | .0050051 .0005058 9.90 0.000 .0040137 .0059965 rdexpch | .0036758 .000114 32.26 0.000 .0034525 .0038992 pstdocav | 1.753123 .0878948 19.95 0.000 1.580852 1.925393 pstdocch | .6577186 .0289377 22.73 0.000 .6010017 .7144354 phdav | 1.282554 .2702462 4.75 0.000 .7528817 1.812227 phdch | .8174343 .0949722 8.61 0.000 .6312922 1.003576 ------------------------------------------------------------------------------ ------------------------------------------------------------------------------ Random-effects Parameters | Estimate Std. Err. [95% Conf. Interval] -----------------------------+------------------------------------------------
174
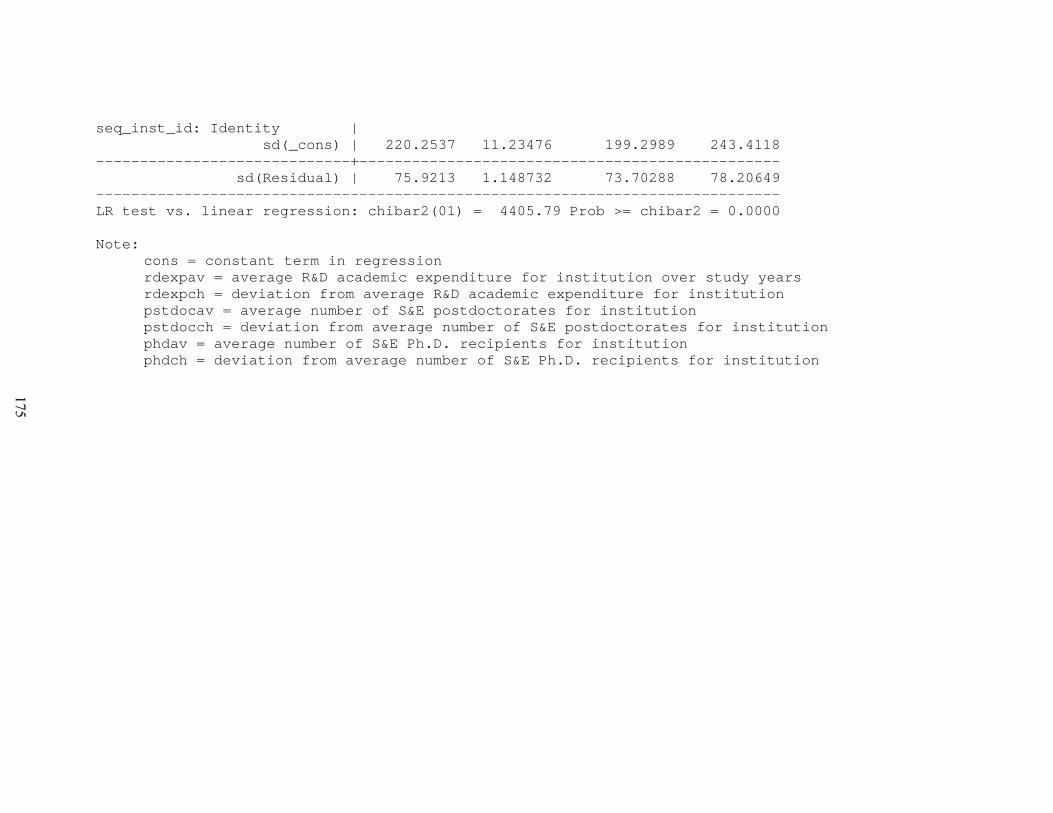
seq_inst_id: Identity | sd(_cons) | 220.2537 11.23476 199.2989 243.4118 -----------------------------+------------------------------------------------ sd(Residual) | 75.9213 1.148732 73.70288 78.20649 ------------------------------------------------------------------------------ LR test vs. linear regression: chibar2(01) = 4405.79 Prob >= chibar2 = 0.0000 Note: cons = constant term in regression rdexpav = average R&D academic expenditure for institution over study years rdexpch = deviation from average R&D academic expenditure for institution pstdocav = average number of S&E postdoctorates for institution pstdocch = deviation from average number of S&E postdoctorates for institution phdav = average number of S&E Ph.D. recipients for institution phdch = deviation from average number of S&E Ph.D. recipients for institution
175
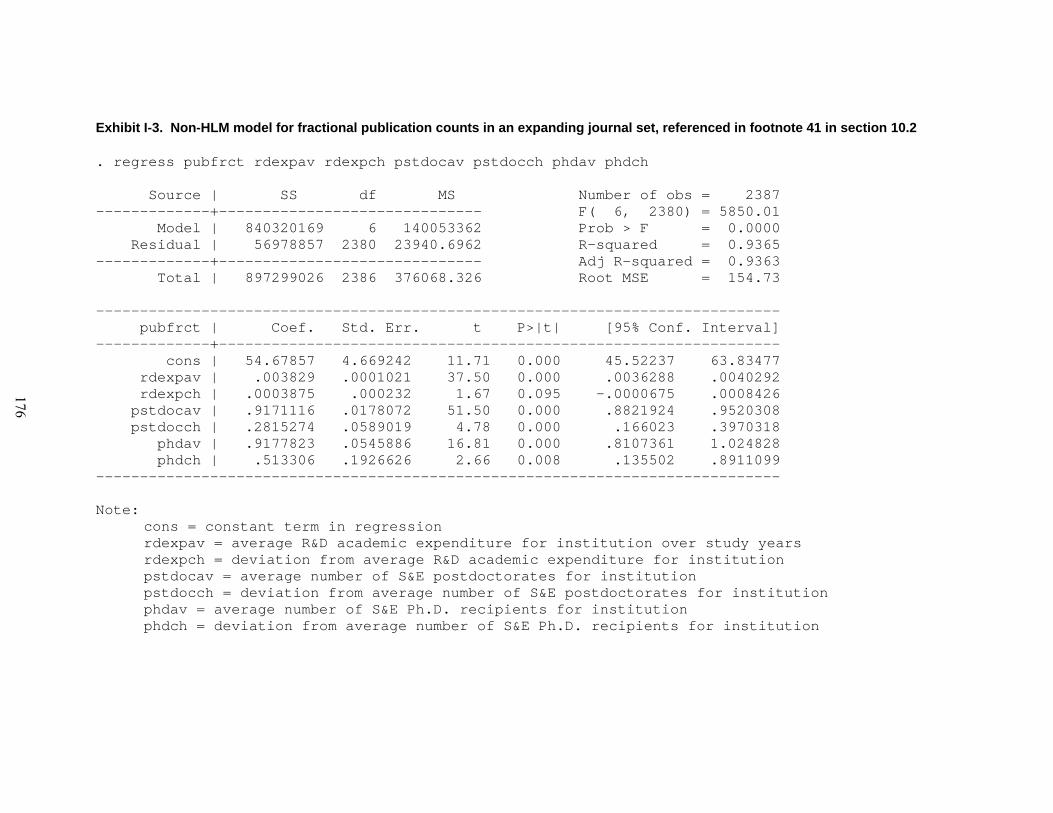
Exhibit I-3. Non-HLM model for fractional publication counts in an expanding journal set, referenced in footnote 41 in section 10.2 . regress pubfrct rdexpav rdexpch pstdocav pstdocch phdav phdch Source | SS df MS Number of obs = 2387 -------------+------------------------------ F( 6, 2380) = 5850.01 Model | 840320169 6 140053362 Prob > F = 0.0000 Residual | 56978857 2380 23940.6962 R-squared = 0.9365 -------------+------------------------------ Adj R-squared = 0.9363 Total | 897299026 2386 376068.326 Root MSE = 154.73 ------------------------------------------------------------------------------ pubfrct | Coef. Std. Err. t P>|t| [95% Conf. Interval] -------------+---------------------------------------------------------------- cons | 54.67857 4.669242 11.71 0.000 45.52237 63.83477 rdexpav | .003829 .0001021 37.50 0.000 .0036288 .0040292 rdexpch | .0003875 .000232 1.67 0.095 -.0000675 .0008426 pstdocav | .9171116 .0178072 51.50 0.000 .8821924 .9520308 pstdocch | .2815274 .0589019 4.78 0.000 .166023 .3970318 phdav | .9177823 .0545886 16.81 0.000 .8107361 1.024828 phdch | .513306 .1926626 2.66 0.008 .135502 .8911099 ------------------------------------------------------------------------------ Note: cons = constant term in regression rdexpav = average R&D academic expenditure for institution over study years rdexpch = deviation from average R&D academic expenditure for institution pstdocav = average number of S&E postdoctorates for institution pstdocch = deviation from average number of S&E postdoctorates for institution phdav = average number of S&E Ph.D. recipients for institution phdch = deviation from average number of S&E Ph.D. recipients for institution
176
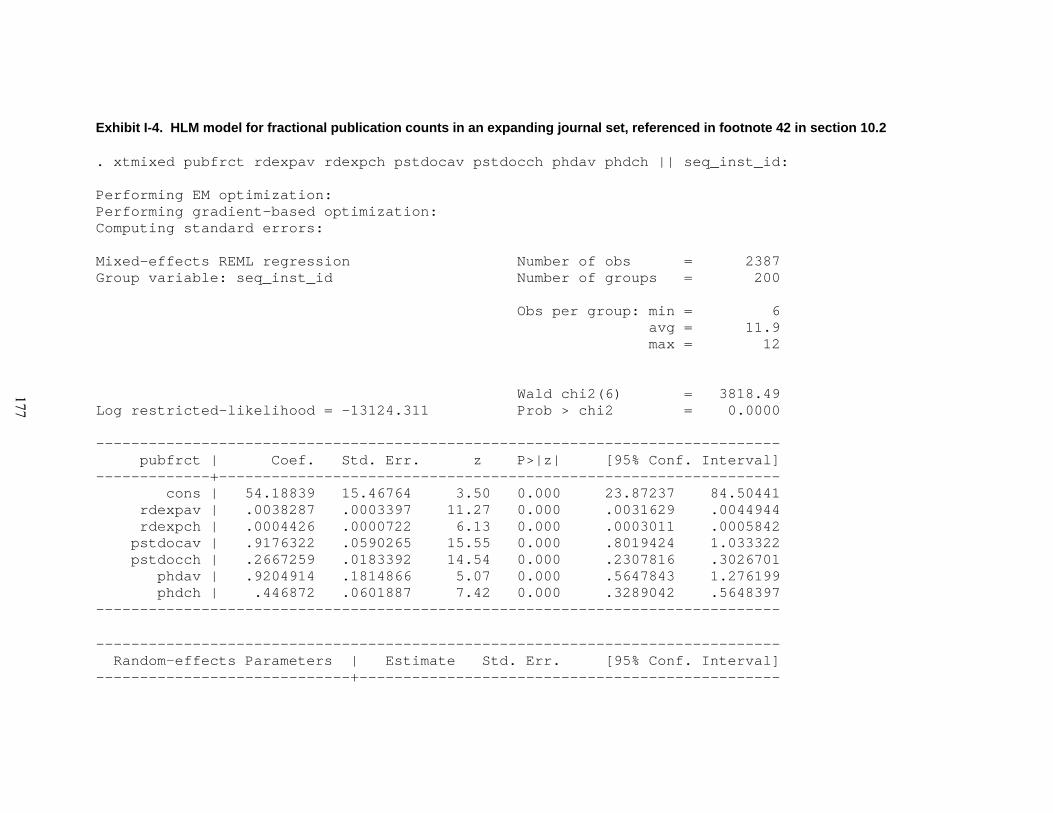
Exhibit I-4. HLM model for fractional publication counts in an expanding journal set, referenced in footnote 42 in section 10.2 . xtmixed pubfrct rdexpav rdexpch pstdocav pstdocch phdav phdch || seq_inst_id: Performing EM optimization: Performing gradient-based optimization: Computing standard errors: Mixed-effects REML regression Number of obs = 2387 Group variable: seq_inst_id Number of groups = 200 Obs per group: min = 6 avg = 11.9 max = 12 Wald chi2(6) = 3818.49 Log restricted-likelihood = -13124.311 Prob > chi2 = 0.0000 ------------------------------------------------------------------------------ pubfrct | Coef. Std. Err. z P>|z| [95% Conf. Interval] -------------+---------------------------------------------------------------- cons | 54.18839 15.46764 3.50 0.000 23.87237 84.50441 rdexpav | .0038287 .0003397 11.27 0.000 .0031629 .0044944 rdexpch | .0004426 .0000722 6.13 0.000 .0003011 .0005842 pstdocav | .9176322 .0590265 15.55 0.000 .8019424 1.033322 pstdocch | .2667259 .0183392 14.54 0.000 .2307816 .3026701 phdav | .9204914 .1814866 5.07 0.000 .5647843 1.276199 phdch | .446872 .0601887 7.42 0.000 .3289042 .5648397 ------------------------------------------------------------------------------ ------------------------------------------------------------------------------ Random-effects Parameters | Estimate Std. Err. [95% Conf. Interval] -----------------------------+------------------------------------------------
177

seq_inst_id: Identity | sd(_cons) | 147.994 7.54079 133.9284 163.5369 -----------------------------+------------------------------------------------ sd(Residual) | 48.11498 .7280076 46.70906 49.56322 ------------------------------------------------------------------------------ LR test vs. linear regression: chibar2(01) = 4632.29 Prob >= chibar2 = 0.0000 Note: cons = constant term in regression rdexpav = average R&D academic expenditure for institution over study years rdexpch = deviation from average R&D academic expenditure for institution pstdocav = average number of S&E postdoctorates for institution pstdocch = deviation from average number of S&E postdoctorates for institution phdav = average number of S&E Ph.D. recipients for institution phdch = deviation from average number of S&E Ph.D. recipients for institution
178
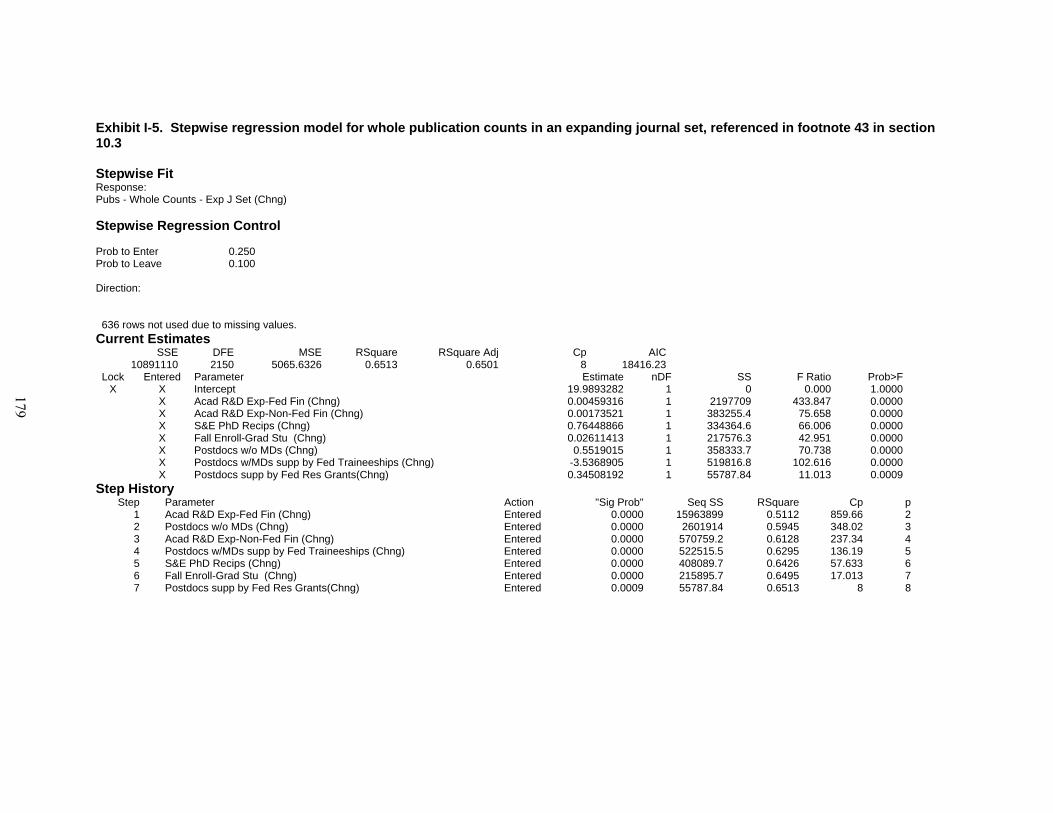
Exhibit I-5. Stepwise regression model for whole publication counts in an expanding journal set, referenced in footnote 43 in section 10.3 Stepwise Fit Response: Pubs - Whole Counts - Exp J Set (Chng)
Stepwise Regression Control Prob to Enter 0.250 Prob to Leave 0.100 Direction: 636 rows not used due to missing values.
Current Estimates SSE DFE MSE RSquare RSquare Adj Cp AIC
10891110 2150 5065.6326 0.6513 0.6501 8 18416.23Lock Entered Parameter Estimate nDF SS F Ratio Prob>F
X X Intercept 19.9893282 1 0 0.000 1.0000 X Acad R&D Exp-Fed Fin (Chng) 0.00459316 1 2197709 433.847 0.0000 X Acad R&D Exp-Non-Fed Fin (Chng) 0.00173521 1 383255.4 75.658 0.0000 X S&E PhD Recips (Chng) 0.76448866 1 334364.6 66.006 0.0000 X Fall Enroll-Grad Stu (Chng) 0.02611413 1 217576.3 42.951 0.0000 X Postdocs w/o MDs (Chng) 0.5519015 1 358333.7 70.738 0.0000 X Postdocs w/MDs supp by Fed Traineeships (Chng) -3.5368905 1 519816.8 102.616 0.0000 X Postdocs supp by Fed Res Grants(Chng) 0.34508192 1 55787.84 11.013 0.0009
Step History Step Parameter Action "Sig Prob" Seq SS RSquare Cp p
1 Acad R&D Exp-Fed Fin (Chng) Entered 0.0000 15963899 0.5112 859.66 22 Postdocs w/o MDs (Chng) Entered 0.0000 2601914 0.5945 348.02 33 Acad R&D Exp-Non-Fed Fin (Chng) Entered 0.0000 570759.2 0.6128 237.34 44 Postdocs w/MDs supp by Fed Traineeships (Chng) Entered 0.0000 522515.5 0.6295 136.19 55 S&E PhD Recips (Chng) Entered 0.0000 408089.7 0.6426 57.633 66 Fall Enroll-Grad Stu (Chng) Entered 0.0000 215895.7 0.6495 17.013 77 Postdocs supp by Fed Res Grants(Chng) Entered 0.0009 55787.84 0.6513 8 8
179
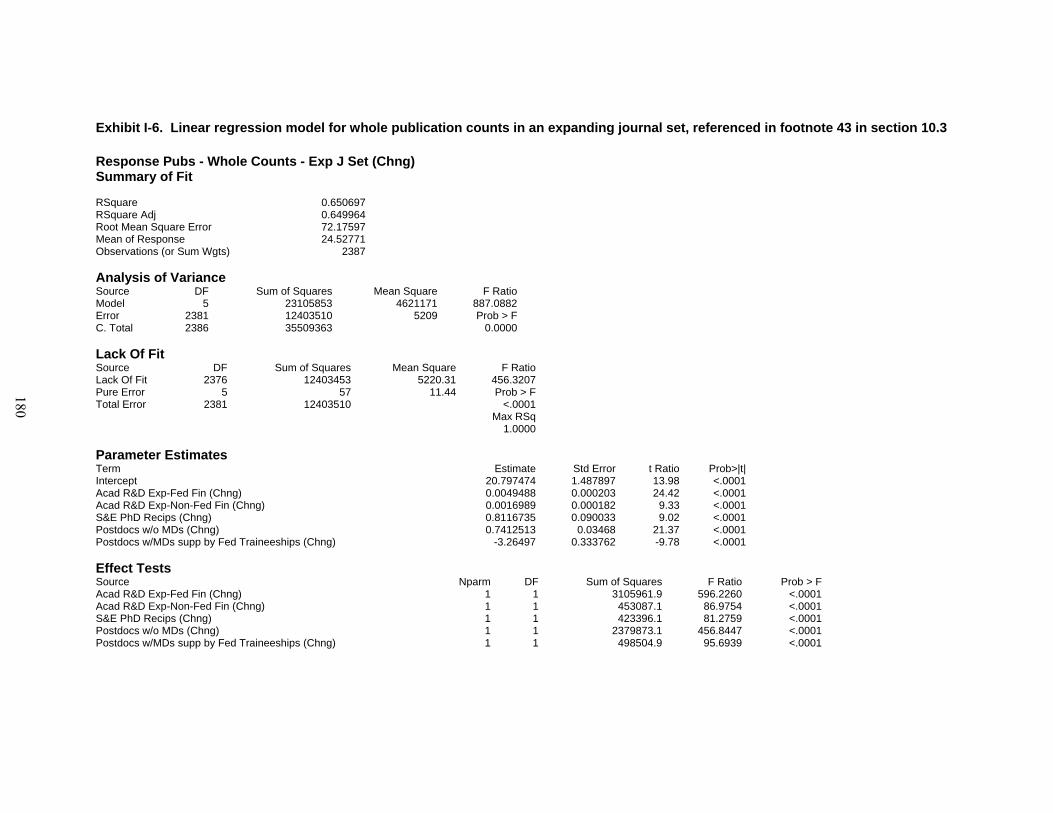
Exhibit I-6. Linear regression model for whole publication counts in an expanding journal set, referenced in footnote 43 in section 10.3 Response Pubs - Whole Counts - Exp J Set (Chng) Summary of Fit RSquare 0.650697RSquare Adj 0.649964Root Mean Square Error 72.17597Mean of Response 24.52771Observations (or Sum Wgts) 2387 Analysis of Variance Source DF Sum of Squares Mean Square F RatioModel 5 23105853 4621171 887.0882Error 2381 12403510 5209 Prob > FC. Total 2386 35509363 0.0000 Lack Of Fit Source DF Sum of Squares Mean Square F RatioLack Of Fit 2376 12403453 5220.31 456.3207Pure Error 5 57 11.44 Prob > FTotal Error 2381 12403510 <.0001 Max RSq 1.0000 Parameter Estimates Term Estimate Std Error t Ratio Prob>|t|Intercept 20.797474 1.487897 13.98 <.0001Acad R&D Exp-Fed Fin (Chng) 0.0049488 0.000203 24.42 <.0001Acad R&D Exp-Non-Fed Fin (Chng) 0.0016989 0.000182 9.33 <.0001S&E PhD Recips (Chng) 0.8116735 0.090033 9.02 <.0001Postdocs w/o MDs (Chng) 0.7412513 0.03468 21.37 <.0001Postdocs w/MDs supp by Fed Traineeships (Chng) -3.26497 0.333762 -9.78 <.0001
Effect Tests Source Nparm DF Sum of Squares F Ratio Prob > F Acad R&D Exp-Fed Fin (Chng) 1 1 3105961.9 596.2260 <.0001 Acad R&D Exp-Non-Fed Fin (Chng) 1 1 453087.1 86.9754 <.0001 S&E PhD Recips (Chng) 1 1 423396.1 81.2759 <.0001 Postdocs w/o MDs (Chng) 1 1 2379873.1 456.8447 <.0001 Postdocs w/MDs supp by Fed Traineeships (Chng) 1 1 498504.9 95.6939 <.0001
180
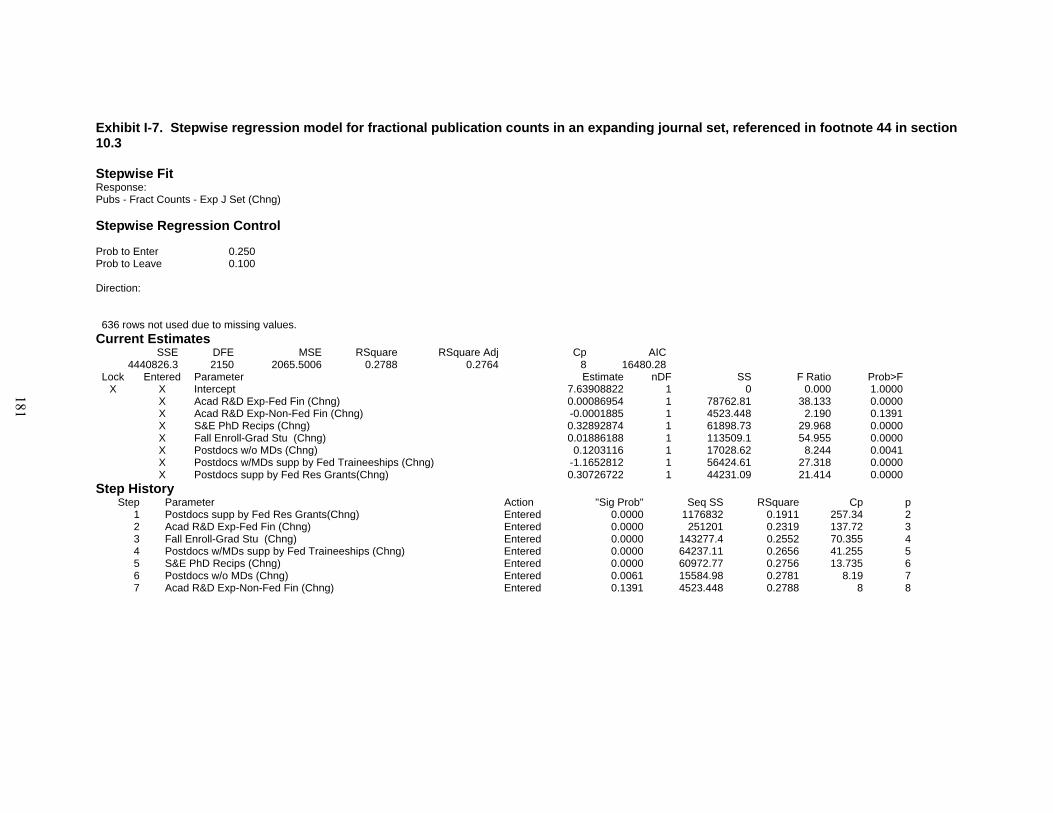
Exhibit I-7. Stepwise regression model for fractional publication counts in an expanding journal set, referenced in footnote 44 in section 10.3 Stepwise Fit Response: Pubs - Fract Counts - Exp J Set (Chng)
Stepwise Regression Control Prob to Enter 0.250 Prob to Leave 0.100 Direction: 636 rows not used due to missing values.
Current Estimates SSE DFE MSE RSquare RSquare Adj Cp AIC
4440826.3 2150 2065.5006 0.2788 0.2764 8 16480.28Lock Entered Parameter Estimate nDF SS F Ratio Prob>F
X X Intercept 7.63908822 1 0 0.000 1.0000 X Acad R&D Exp-Fed Fin (Chng) 0.00086954 1 78762.81 38.133 0.0000 X Acad R&D Exp-Non-Fed Fin (Chng) -0.0001885 1 4523.448 2.190 0.1391 X S&E PhD Recips (Chng) 0.32892874 1 61898.73 29.968 0.0000 X Fall Enroll-Grad Stu (Chng) 0.01886188 1 113509.1 54.955 0.0000 X Postdocs w/o MDs (Chng) 0.1203116 1 17028.62 8.244 0.0041 X Postdocs w/MDs supp by Fed Traineeships (Chng) -1.1652812 1 56424.61 27.318 0.0000 X Postdocs supp by Fed Res Grants(Chng) 0.30726722 1 44231.09 21.414 0.0000
Step History Step Parameter Action "Sig Prob" Seq SS RSquare Cp p
1 Postdocs supp by Fed Res Grants(Chng) Entered 0.0000 1176832 0.1911 257.34 22 Acad R&D Exp-Fed Fin (Chng) Entered 0.0000 251201 0.2319 137.72 33 Fall Enroll-Grad Stu (Chng) Entered 0.0000 143277.4 0.2552 70.355 44 Postdocs w/MDs supp by Fed Traineeships (Chng) Entered 0.0000 64237.11 0.2656 41.255 55 S&E PhD Recips (Chng) Entered 0.0000 60972.77 0.2756 13.735 66 Postdocs w/o MDs (Chng) Entered 0.0061 15584.98 0.2781 8.19 77 Acad R&D Exp-Non-Fed Fin (Chng) Entered 0.1391 4523.448 0.2788 8 8
181
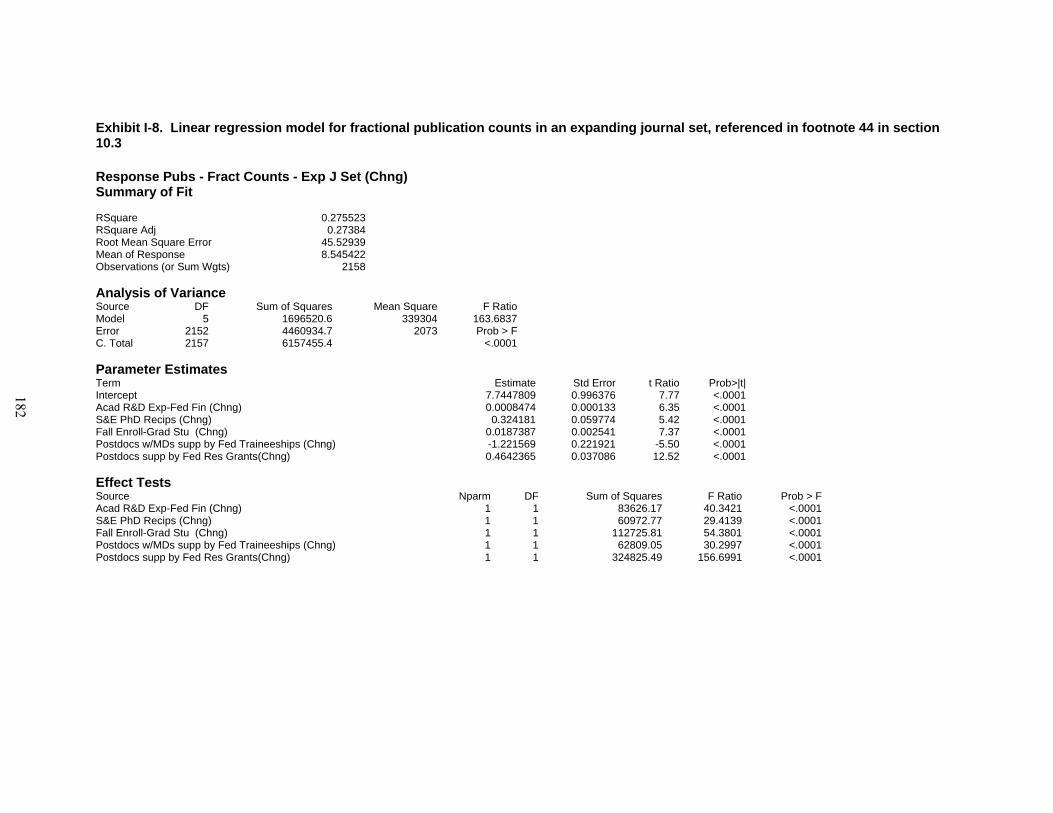
Exhibit I-8. Linear regression model for fractional publication counts in an expanding journal set, referenced in footnote 44 in section 10.3 Response Pubs - Fract Counts - Exp J Set (Chng) Summary of Fit RSquare 0.275523RSquare Adj 0.27384Root Mean Square Error 45.52939Mean of Response 8.545422Observations (or Sum Wgts) 2158 Analysis of Variance Source DF Sum of Squares Mean Square F RatioModel 5 1696520.6 339304 163.6837Error 2152 4460934.7 2073 Prob > FC. Total 2157 6157455.4 <.0001 Parameter Estimates Term Estimate Std Error t Ratio Prob>|t|Intercept 7.7447809 0.996376 7.77 <.0001Acad R&D Exp-Fed Fin (Chng) 0.0008474 0.000133 6.35 <.0001S&E PhD Recips (Chng) 0.324181 0.059774 5.42 <.0001Fall Enroll-Grad Stu (Chng) 0.0187387 0.002541 7.37 <.0001Postdocs w/MDs supp by Fed Traineeships (Chng) -1.221569 0.221921 -5.50 <.0001Postdocs supp by Fed Res Grants(Chng) 0.4642365 0.037086 12.52 <.0001 Effect Tests Source Nparm DF Sum of Squares F Ratio Prob > F Acad R&D Exp-Fed Fin (Chng) 1 1 83626.17 40.3421 <.0001 S&E PhD Recips (Chng) 1 1 60972.77 29.4139 <.0001 Fall Enroll-Grad Stu (Chng) 1 1 112725.81 54.3801 <.0001 Postdocs w/MDs supp by Fed Traineeships (Chng) 1 1 62809.05 30.2997 <.0001 Postdocs supp by Fed Res Grants(Chng) 1 1 324825.49 156.6991 <.0001
182
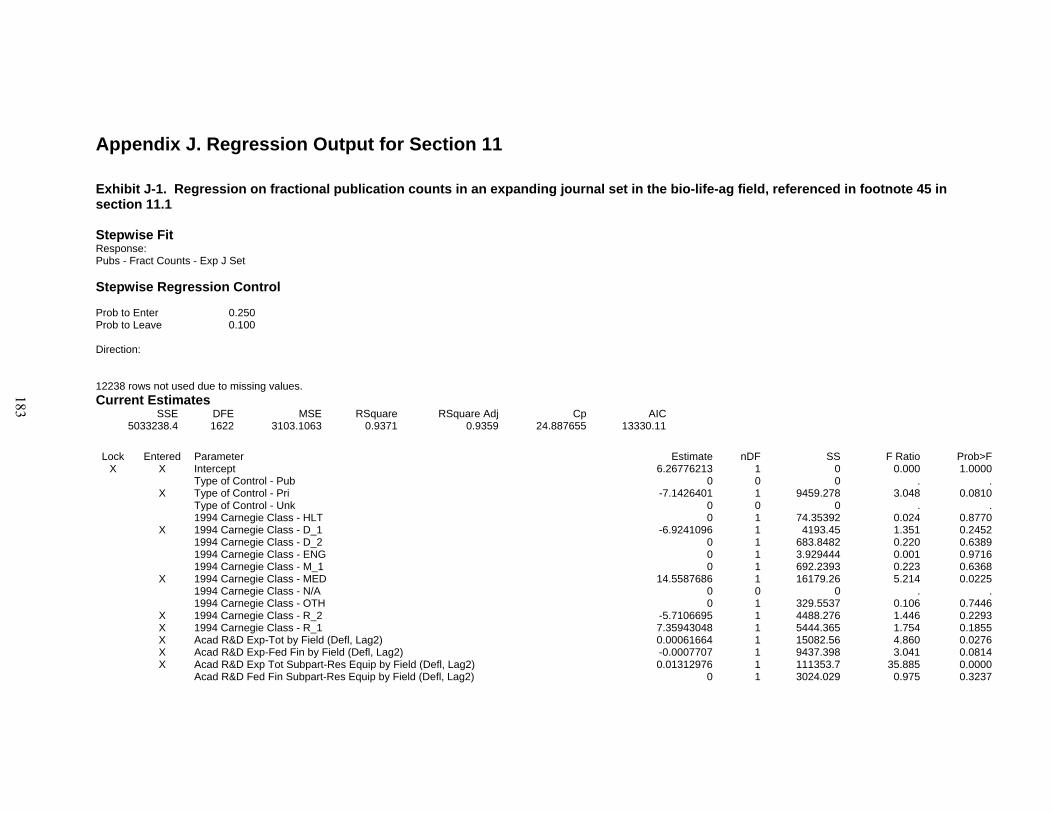
Appendix J. Regression Output for Section 11
Exhibit J-1. Regression on fractional publication counts in an expanding journal set in the bio-life-ag field, referenced in footnote 45 in section 11.1 Stepwise Fit Response: Pubs - Fract Counts - Exp J Set Stepwise Regression Control Prob to Enter 0.250 Prob to Leave 0.100 Direction: 12238 rows not used due to missing values. Current Estimates
SSE DFE MSE RSquare RSquare Adj Cp AIC5033238.4 1622 3103.1063 0.9371 0.9359 24.887655 13330.11
Lock Entered Parameter Estimate nDF SS F Ratio Prob>F
X X Intercept 6.26776213 1 0 0.000 1.0000 Type of Control - Pub 0 0 0 . . X Type of Control - Pri -7.1426401 1 9459.278 3.048 0.0810 Type of Control - Unk 0 0 0 . . 1994 Carnegie Class - HLT 0 1 74.35392 0.024 0.8770 X 1994 Carnegie Class - D_1 -6.9241096 1 4193.45 1.351 0.2452 1994 Carnegie Class - D_2 0 1 683.8482 0.220 0.6389 1994 Carnegie Class - ENG 0 1 3.929444 0.001 0.9716 1994 Carnegie Class - M_1 0 1 692.2393 0.223 0.6368 X 1994 Carnegie Class - MED 14.5587686 1 16179.26 5.214 0.0225 1994 Carnegie Class - N/A 0 0 0 . . 1994 Carnegie Class - OTH 0 1 329.5537 0.106 0.7446 X 1994 Carnegie Class - R_2 -5.7106695 1 4488.276 1.446 0.2293 X 1994 Carnegie Class - R_1 7.35943048 1 5444.365 1.754 0.1855 X Acad R&D Exp-Tot by Field (Defl, Lag2) 0.00061664 1 15082.56 4.860 0.0276 X Acad R&D Exp-Fed Fin by Field (Defl, Lag2) -0.0007707 1 9437.398 3.041 0.0814 X Acad R&D Exp Tot Subpart-Res Equip by Field (Defl, Lag2) 0.01312976 1 111353.7 35.885 0.0000 Acad R&D Fed Fin Subpart-Res Equip by Field (Defl, Lag2) 0 1 3024.029 0.975 0.3237
183
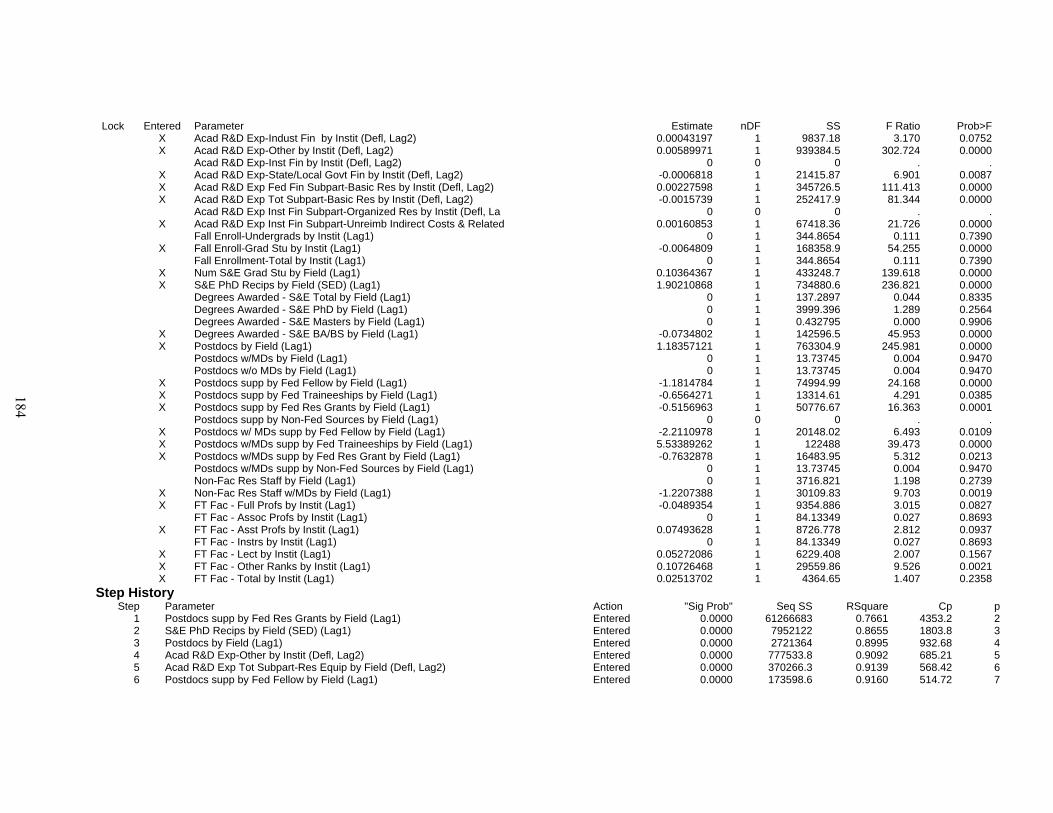
Lock Entered Parameter Estimate nDF SS F Ratio Prob>F X Acad R&D Exp-Indust Fin by Instit (Defl, Lag2) 0.00043197 1 9837.18 3.170 0.0752 X Acad R&D Exp-Other by Instit (Defl, Lag2) 0.00589971 1 939384.5 302.724 0.0000 Acad R&D Exp-Inst Fin by Instit (Defl, Lag2) 0 0 0 . . X Acad R&D Exp-State/Local Govt Fin by Instit (Defl, Lag2) -0.0006818 1 21415.87 6.901 0.0087 X Acad R&D Exp Fed Fin Subpart-Basic Res by Instit (Defl, Lag2) 0.00227598 1 345726.5 111.413 0.0000 X Acad R&D Exp Tot Subpart-Basic Res by Instit (Defl, Lag2) -0.0015739 1 252417.9 81.344 0.0000 Acad R&D Exp Inst Fin Subpart-Organized Res by Instit (Defl, La 0 0 0 . . X Acad R&D Exp Inst Fin Subpart-Unreimb Indirect Costs & Related 0.00160853 1 67418.36 21.726 0.0000 Fall Enroll-Undergrads by Instit (Lag1) 0 1 344.8654 0.111 0.7390 X Fall Enroll-Grad Stu by Instit (Lag1) -0.0064809 1 168358.9 54.255 0.0000 Fall Enrollment-Total by Instit (Lag1) 0 1 344.8654 0.111 0.7390 X Num S&E Grad Stu by Field (Lag1) 0.10364367 1 433248.7 139.618 0.0000 X S&E PhD Recips by Field (SED) (Lag1) 1.90210868 1 734880.6 236.821 0.0000 Degrees Awarded - S&E Total by Field (Lag1) 0 1 137.2897 0.044 0.8335 Degrees Awarded - S&E PhD by Field (Lag1) 0 1 3999.396 1.289 0.2564 Degrees Awarded - S&E Masters by Field (Lag1) 0 1 0.432795 0.000 0.9906 X Degrees Awarded - S&E BA/BS by Field (Lag1) -0.0734802 1 142596.5 45.953 0.0000 X Postdocs by Field (Lag1) 1.18357121 1 763304.9 245.981 0.0000 Postdocs w/MDs by Field (Lag1) 0 1 13.73745 0.004 0.9470 Postdocs w/o MDs by Field (Lag1) 0 1 13.73745 0.004 0.9470 X Postdocs supp by Fed Fellow by Field (Lag1) -1.1814784 1 74994.99 24.168 0.0000 X Postdocs supp by Fed Traineeships by Field (Lag1) -0.6564271 1 13314.61 4.291 0.0385 X Postdocs supp by Fed Res Grants by Field (Lag1) -0.5156963 1 50776.67 16.363 0.0001 Postdocs supp by Non-Fed Sources by Field (Lag1) 0 0 0 . . X Postdocs w/ MDs supp by Fed Fellow by Field (Lag1) -2.2110978 1 20148.02 6.493 0.0109 X Postdocs w/MDs supp by Fed Traineeships by Field (Lag1) 5.53389262 1 122488 39.473 0.0000 X Postdocs w/MDs supp by Fed Res Grant by Field (Lag1) -0.7632878 1 16483.95 5.312 0.0213 Postdocs w/MDs supp by Non-Fed Sources by Field (Lag1) 0 1 13.73745 0.004 0.9470 Non-Fac Res Staff by Field (Lag1) 0 1 3716.821 1.198 0.2739 X Non-Fac Res Staff w/MDs by Field (Lag1) -1.2207388 1 30109.83 9.703 0.0019 X FT Fac - Full Profs by Instit (Lag1) -0.0489354 1 9354.886 3.015 0.0827 FT Fac - Assoc Profs by Instit (Lag1) 0 1 84.13349 0.027 0.8693 X FT Fac - Asst Profs by Instit (Lag1) 0.07493628 1 8726.778 2.812 0.0937 FT Fac - Instrs by Instit (Lag1) 0 1 84.13349 0.027 0.8693 X FT Fac - Lect by Instit (Lag1) 0.05272086 1 6229.408 2.007 0.1567 X FT Fac - Other Ranks by Instit (Lag1) 0.10726468 1 29559.86 9.526 0.0021 X FT Fac - Total by Instit (Lag1) 0.02513702 1 4364.65 1.407 0.2358
Step History Step Parameter Action "Sig Prob" Seq SS RSquare Cp p
1 Postdocs supp by Fed Res Grants by Field (Lag1) Entered 0.0000 61266683 0.7661 4353.2 2 2 S&E PhD Recips by Field (SED) (Lag1) Entered 0.0000 7952122 0.8655 1803.8 3 3 Postdocs by Field (Lag1) Entered 0.0000 2721364 0.8995 932.68 4 4 Acad R&D Exp-Other by Instit (Defl, Lag2) Entered 0.0000 777533.8 0.9092 685.21 5 5 Acad R&D Exp Tot Subpart-Res Equip by Field (Defl, Lag2) Entered 0.0000 370266.3 0.9139 568.42 6 6 Postdocs supp by Fed Fellow by Field (Lag1) Entered 0.0000 173598.6 0.9160 514.72 7
184
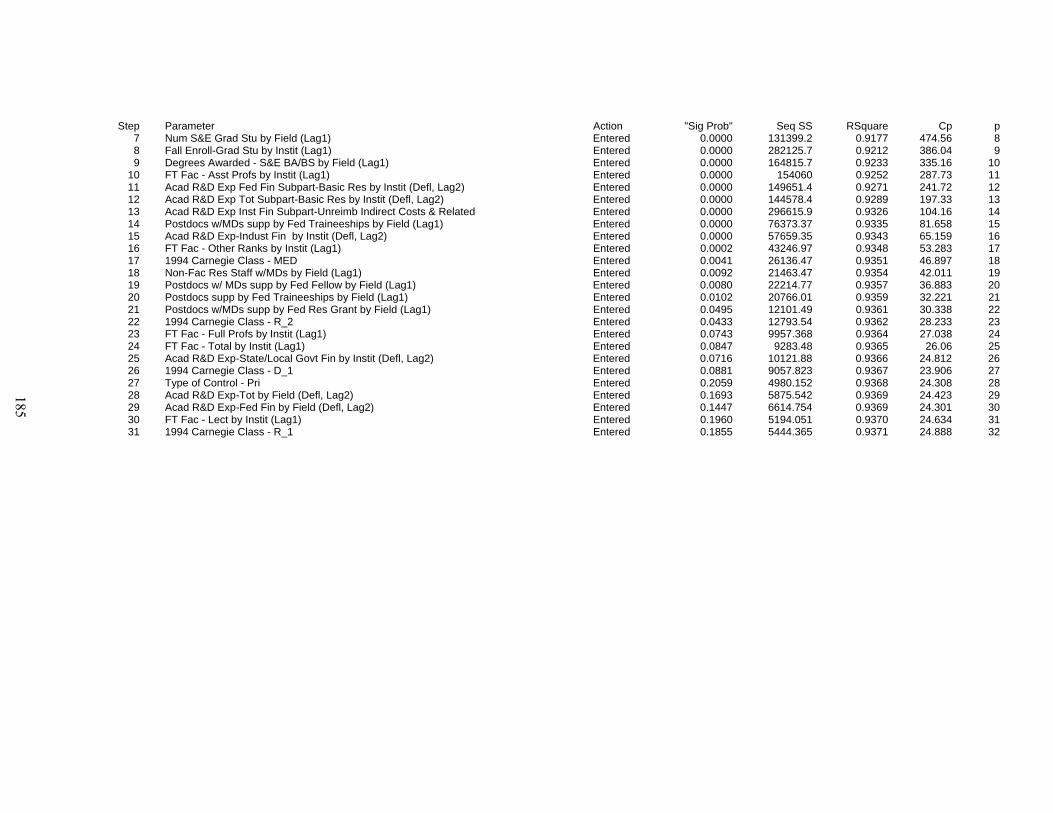
Step Parameter Action "Sig Prob" Seq SS RSquare Cp p 7 Num S&E Grad Stu by Field (Lag1) Entered 0.0000 131399.2 0.9177 474.56 8 8 Fall Enroll-Grad Stu by Instit (Lag1) Entered 0.0000 282125.7 0.9212 386.04 9 9 Degrees Awarded - S&E BA/BS by Field (Lag1) Entered 0.0000 164815.7 0.9233 335.16 10
10 FT Fac - Asst Profs by Instit (Lag1) Entered 0.0000 154060 0.9252 287.73 11 11 Acad R&D Exp Fed Fin Subpart-Basic Res by Instit (Defl, Lag2) Entered 0.0000 149651.4 0.9271 241.72 12 12 Acad R&D Exp Tot Subpart-Basic Res by Instit (Defl, Lag2) Entered 0.0000 144578.4 0.9289 197.33 13 13 Acad R&D Exp Inst Fin Subpart-Unreimb Indirect Costs & Related Entered 0.0000 296615.9 0.9326 104.16 14 14 Postdocs w/MDs supp by Fed Traineeships by Field (Lag1) Entered 0.0000 76373.37 0.9335 81.658 15 15 Acad R&D Exp-Indust Fin by Instit (Defl, Lag2) Entered 0.0000 57659.35 0.9343 65.159 16 16 FT Fac - Other Ranks by Instit (Lag1) Entered 0.0002 43246.97 0.9348 53.283 17 17 1994 Carnegie Class - MED Entered 0.0041 26136.47 0.9351 46.897 18 18 Non-Fac Res Staff w/MDs by Field (Lag1) Entered 0.0092 21463.47 0.9354 42.011 19 19 Postdocs w/ MDs supp by Fed Fellow by Field (Lag1) Entered 0.0080 22214.77 0.9357 36.883 20 20 Postdocs supp by Fed Traineeships by Field (Lag1) Entered 0.0102 20766.01 0.9359 32.221 21 21 Postdocs w/MDs supp by Fed Res Grant by Field (Lag1) Entered 0.0495 12101.49 0.9361 30.338 22 22 1994 Carnegie Class - R_2 Entered 0.0433 12793.54 0.9362 28.233 23 23 FT Fac - Full Profs by Instit (Lag1) Entered 0.0743 9957.368 0.9364 27.038 24 24 FT Fac - Total by Instit (Lag1) Entered 0.0847 9283.48 0.9365 26.06 25 25 Acad R&D Exp-State/Local Govt Fin by Instit (Defl, Lag2) Entered 0.0716 10121.88 0.9366 24.812 26 26 1994 Carnegie Class - D_1 Entered 0.0881 9057.823 0.9367 23.906 27 27 Type of Control - Pri Entered 0.2059 4980.152 0.9368 24.308 28 28 Acad R&D Exp-Tot by Field (Defl, Lag2) Entered 0.1693 5875.542 0.9369 24.423 29 29 Acad R&D Exp-Fed Fin by Field (Defl, Lag2) Entered 0.1447 6614.754 0.9369 24.301 30 30 FT Fac - Lect by Instit (Lag1) Entered 0.1960 5194.051 0.9370 24.634 31 31 1994 Carnegie Class - R_1 Entered 0.1855 5444.365 0.9371 24.888 32
185
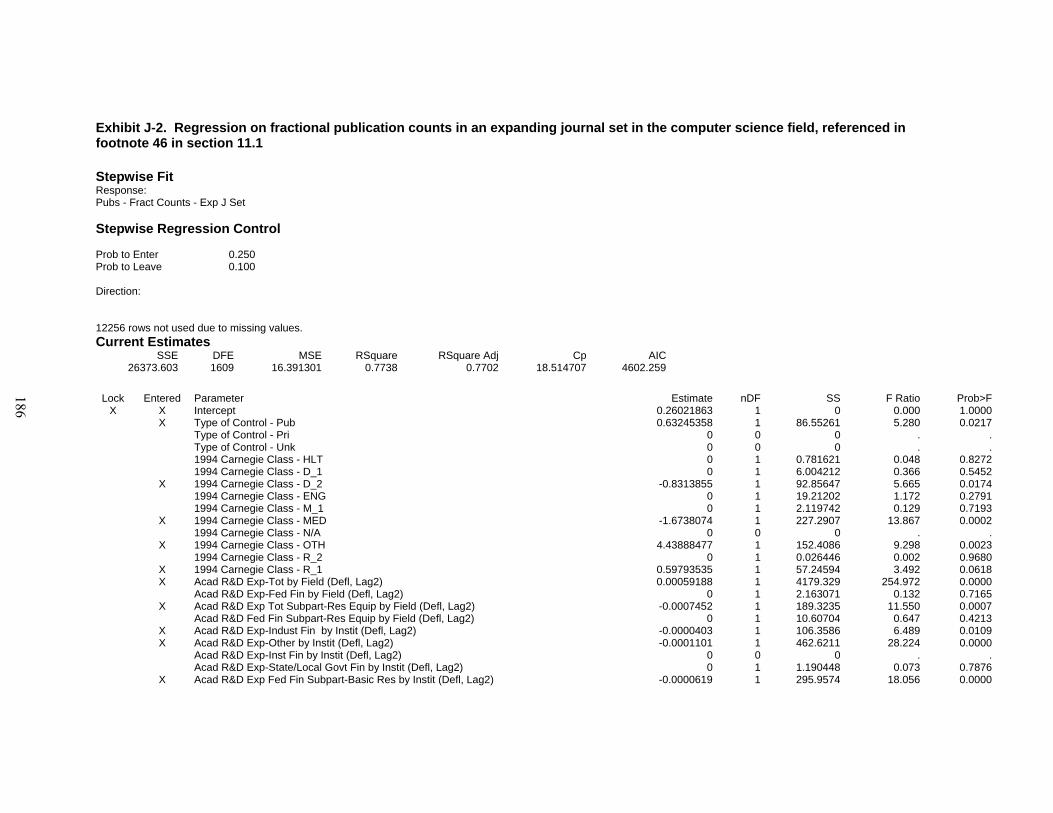
Exhibit J-2. Regression on fractional publication counts in an expanding journal set in the computer science field, referenced in footnote 46 in section 11.1 Stepwise Fit Response: Pubs - Fract Counts - Exp J Set Stepwise Regression Control Prob to Enter 0.250 Prob to Leave 0.100 Direction: 12256 rows not used due to missing values. Current Estimates
SSE DFE MSE RSquare RSquare Adj Cp AIC26373.603 1609 16.391301 0.7738 0.7702 18.514707 4602.259
Lock Entered Parameter Estimate nDF SS F Ratio Prob>F
X X Intercept 0.26021863 1 0 0.000 1.0000 X Type of Control - Pub 0.63245358 1 86.55261 5.280 0.0217 Type of Control - Pri 0 0 0 . . Type of Control - Unk 0 0 0 . . 1994 Carnegie Class - HLT 0 1 0.781621 0.048 0.8272 1994 Carnegie Class - D_1 0 1 6.004212 0.366 0.5452 X 1994 Carnegie Class - D_2 -0.8313855 1 92.85647 5.665 0.0174 1994 Carnegie Class - ENG 0 1 19.21202 1.172 0.2791 1994 Carnegie Class - M_1 0 1 2.119742 0.129 0.7193 X 1994 Carnegie Class - MED -1.6738074 1 227.2907 13.867 0.0002 1994 Carnegie Class - N/A 0 0 0 . . X 1994 Carnegie Class - OTH 4.43888477 1 152.4086 9.298 0.0023 1994 Carnegie Class - R_2 0 1 0.026446 0.002 0.9680 X 1994 Carnegie Class - R_1 0.59793535 1 57.24594 3.492 0.0618 X Acad R&D Exp-Tot by Field (Defl, Lag2) 0.00059188 1 4179.329 254.972 0.0000 Acad R&D Exp-Fed Fin by Field (Defl, Lag2) 0 1 2.163071 0.132 0.7165 X Acad R&D Exp Tot Subpart-Res Equip by Field (Defl, Lag2) -0.0007452 1 189.3235 11.550 0.0007 Acad R&D Fed Fin Subpart-Res Equip by Field (Defl, Lag2) 0 1 10.60704 0.647 0.4213 X Acad R&D Exp-Indust Fin by Instit (Defl, Lag2) -0.0000403 1 106.3586 6.489 0.0109 X Acad R&D Exp-Other by Instit (Defl, Lag2) -0.0001101 1 462.6211 28.224 0.0000 Acad R&D Exp-Inst Fin by Instit (Defl, Lag2) 0 0 0 . . Acad R&D Exp-State/Local Govt Fin by Instit (Defl, Lag2) 0 1 1.190448 0.073 0.7876 X Acad R&D Exp Fed Fin Subpart-Basic Res by Instit (Defl, Lag2) -0.0000619 1 295.9574 18.056 0.0000
186
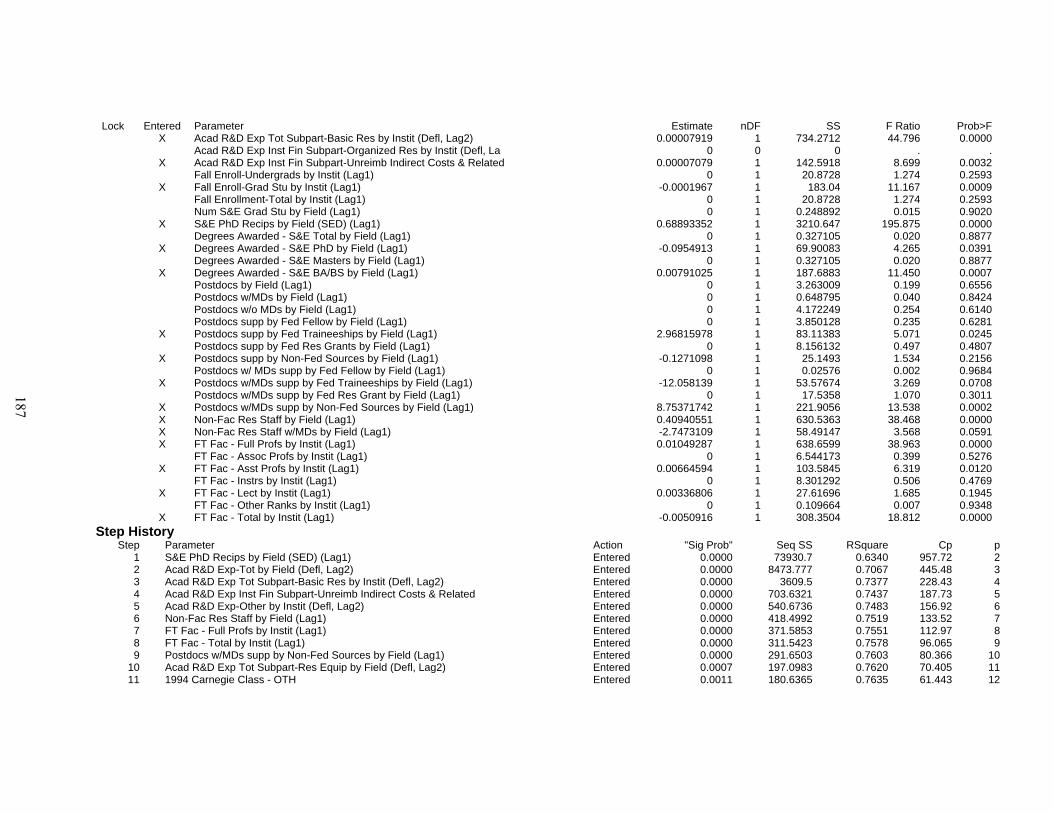
Lock Entered Parameter Estimate nDF SS F Ratio Prob>F X Acad R&D Exp Tot Subpart-Basic Res by Instit (Defl, Lag2) 0.00007919 1 734.2712 44.796 0.0000 Acad R&D Exp Inst Fin Subpart-Organized Res by Instit (Defl, La 0 0 0 . . X Acad R&D Exp Inst Fin Subpart-Unreimb Indirect Costs & Related 0.00007079 1 142.5918 8.699 0.0032 Fall Enroll-Undergrads by Instit (Lag1) 0 1 20.8728 1.274 0.2593 X Fall Enroll-Grad Stu by Instit (Lag1) -0.0001967 1 183.04 11.167 0.0009 Fall Enrollment-Total by Instit (Lag1) 0 1 20.8728 1.274 0.2593 Num S&E Grad Stu by Field (Lag1) 0 1 0.248892 0.015 0.9020 X S&E PhD Recips by Field (SED) (Lag1) 0.68893352 1 3210.647 195.875 0.0000 Degrees Awarded - S&E Total by Field (Lag1) 0 1 0.327105 0.020 0.8877 X Degrees Awarded - S&E PhD by Field (Lag1) -0.0954913 1 69.90083 4.265 0.0391 Degrees Awarded - S&E Masters by Field (Lag1) 0 1 0.327105 0.020 0.8877 X Degrees Awarded - S&E BA/BS by Field (Lag1) 0.00791025 1 187.6883 11.450 0.0007 Postdocs by Field (Lag1) 0 1 3.263009 0.199 0.6556 Postdocs w/MDs by Field (Lag1) 0 1 0.648795 0.040 0.8424 Postdocs w/o MDs by Field (Lag1) 0 1 4.172249 0.254 0.6140 Postdocs supp by Fed Fellow by Field (Lag1) 0 1 3.850128 0.235 0.6281 X Postdocs supp by Fed Traineeships by Field (Lag1) 2.96815978 1 83.11383 5.071 0.0245 Postdocs supp by Fed Res Grants by Field (Lag1) 0 1 8.156132 0.497 0.4807 X Postdocs supp by Non-Fed Sources by Field (Lag1) -0.1271098 1 25.1493 1.534 0.2156 Postdocs w/ MDs supp by Fed Fellow by Field (Lag1) 0 1 0.02576 0.002 0.9684 X Postdocs w/MDs supp by Fed Traineeships by Field (Lag1) -12.058139 1 53.57674 3.269 0.0708 Postdocs w/MDs supp by Fed Res Grant by Field (Lag1) 0 1 17.5358 1.070 0.3011 X Postdocs w/MDs supp by Non-Fed Sources by Field (Lag1) 8.75371742 1 221.9056 13.538 0.0002 X Non-Fac Res Staff by Field (Lag1) 0.40940551 1 630.5363 38.468 0.0000 X Non-Fac Res Staff w/MDs by Field (Lag1) -2.7473109 1 58.49147 3.568 0.0591 X FT Fac - Full Profs by Instit (Lag1) 0.01049287 1 638.6599 38.963 0.0000 FT Fac - Assoc Profs by Instit (Lag1) 0 1 6.544173 0.399 0.5276 X FT Fac - Asst Profs by Instit (Lag1) 0.00664594 1 103.5845 6.319 0.0120 FT Fac - Instrs by Instit (Lag1) 0 1 8.301292 0.506 0.4769 X FT Fac - Lect by Instit (Lag1) 0.00336806 1 27.61696 1.685 0.1945 FT Fac - Other Ranks by Instit (Lag1) 0 1 0.109664 0.007 0.9348 X FT Fac - Total by Instit (Lag1) -0.0050916 1 308.3504 18.812 0.0000
Step History Step Parameter Action "Sig Prob" Seq SS RSquare Cp p
1 S&E PhD Recips by Field (SED) (Lag1) Entered 0.0000 73930.7 0.6340 957.72 2 2 Acad R&D Exp-Tot by Field (Defl, Lag2) Entered 0.0000 8473.777 0.7067 445.48 3 3 Acad R&D Exp Tot Subpart-Basic Res by Instit (Defl, Lag2) Entered 0.0000 3609.5 0.7377 228.43 4 4 Acad R&D Exp Inst Fin Subpart-Unreimb Indirect Costs & Related Entered 0.0000 703.6321 0.7437 187.73 5 5 Acad R&D Exp-Other by Instit (Defl, Lag2) Entered 0.0000 540.6736 0.7483 156.92 6 6 Non-Fac Res Staff by Field (Lag1) Entered 0.0000 418.4992 0.7519 133.52 7 7 FT Fac - Full Profs by Instit (Lag1) Entered 0.0000 371.5853 0.7551 112.97 8 8 FT Fac - Total by Instit (Lag1) Entered 0.0000 311.5423 0.7578 96.065 9 9 Postdocs w/MDs supp by Non-Fed Sources by Field (Lag1) Entered 0.0000 291.6503 0.7603 80.366 10
10 Acad R&D Exp Tot Subpart-Res Equip by Field (Defl, Lag2) Entered 0.0007 197.0983 0.7620 70.405 11 11 1994 Carnegie Class - OTH Entered 0.0011 180.6365 0.7635 61.443 12
187
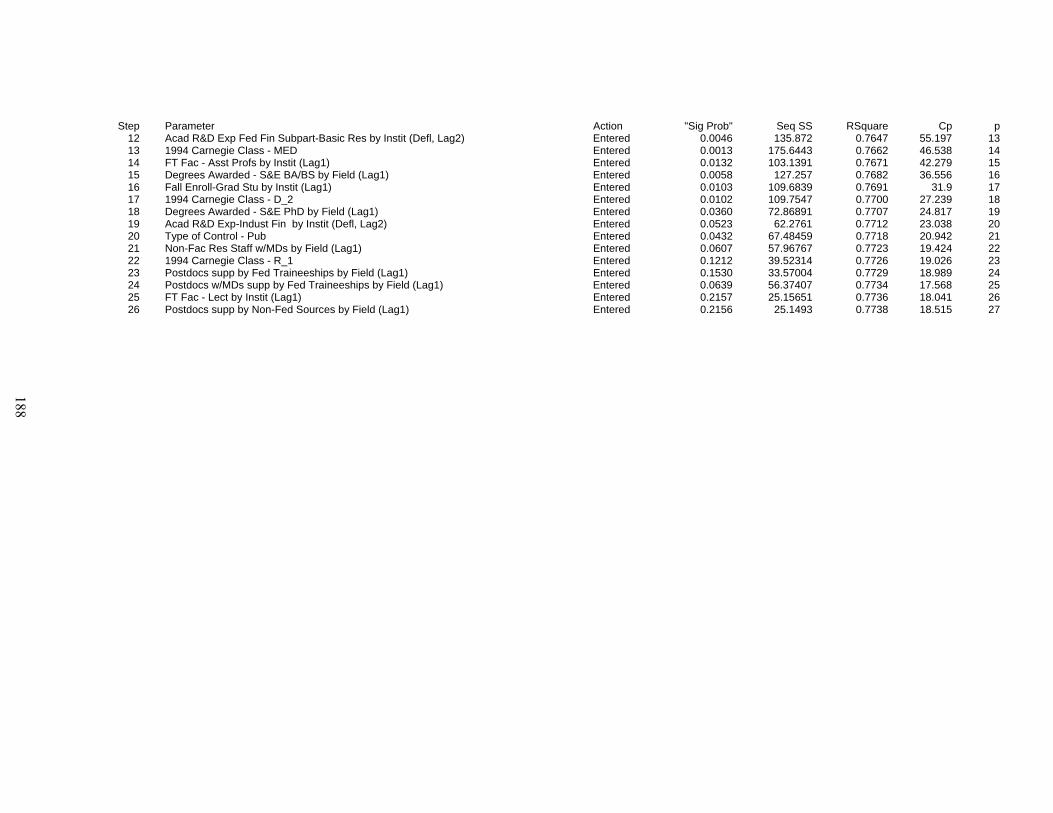
Step Parameter Action "Sig Prob" Seq SS RSquare Cp p 12 Acad R&D Exp Fed Fin Subpart-Basic Res by Instit (Defl, Lag2) Entered 0.0046 135.872 0.7647 55.197 13 13 1994 Carnegie Class - MED Entered 0.0013 175.6443 0.7662 46.538 14 14 FT Fac - Asst Profs by Instit (Lag1) Entered 0.0132 103.1391 0.7671 42.279 15 15 Degrees Awarded - S&E BA/BS by Field (Lag1) Entered 0.0058 127.257 0.7682 36.556 16 16 Fall Enroll-Grad Stu by Instit (Lag1) Entered 0.0103 109.6839 0.7691 31.9 17 17 1994 Carnegie Class - D_2 Entered 0.0102 109.7547 0.7700 27.239 18 18 Degrees Awarded - S&E PhD by Field (Lag1) Entered 0.0360 72.86891 0.7707 24.817 19 19 Acad R&D Exp-Indust Fin by Instit (Defl, Lag2) Entered 0.0523 62.2761 0.7712 23.038 20 20 Type of Control - Pub Entered 0.0432 67.48459 0.7718 20.942 21 21 Non-Fac Res Staff w/MDs by Field (Lag1) Entered 0.0607 57.96767 0.7723 19.424 22 22 1994 Carnegie Class - R_1 Entered 0.1212 39.52314 0.7726 19.026 23 23 Postdocs supp by Fed Traineeships by Field (Lag1) Entered 0.1530 33.57004 0.7729 18.989 24 24 Postdocs w/MDs supp by Fed Traineeships by Field (Lag1) Entered 0.0639 56.37407 0.7734 17.568 25 25 FT Fac - Lect by Instit (Lag1) Entered 0.2157 25.15651 0.7736 18.041 26 26 Postdocs supp by Non-Fed Sources by Field (Lag1) Entered 0.2156 25.1493 0.7738 18.515 27
188
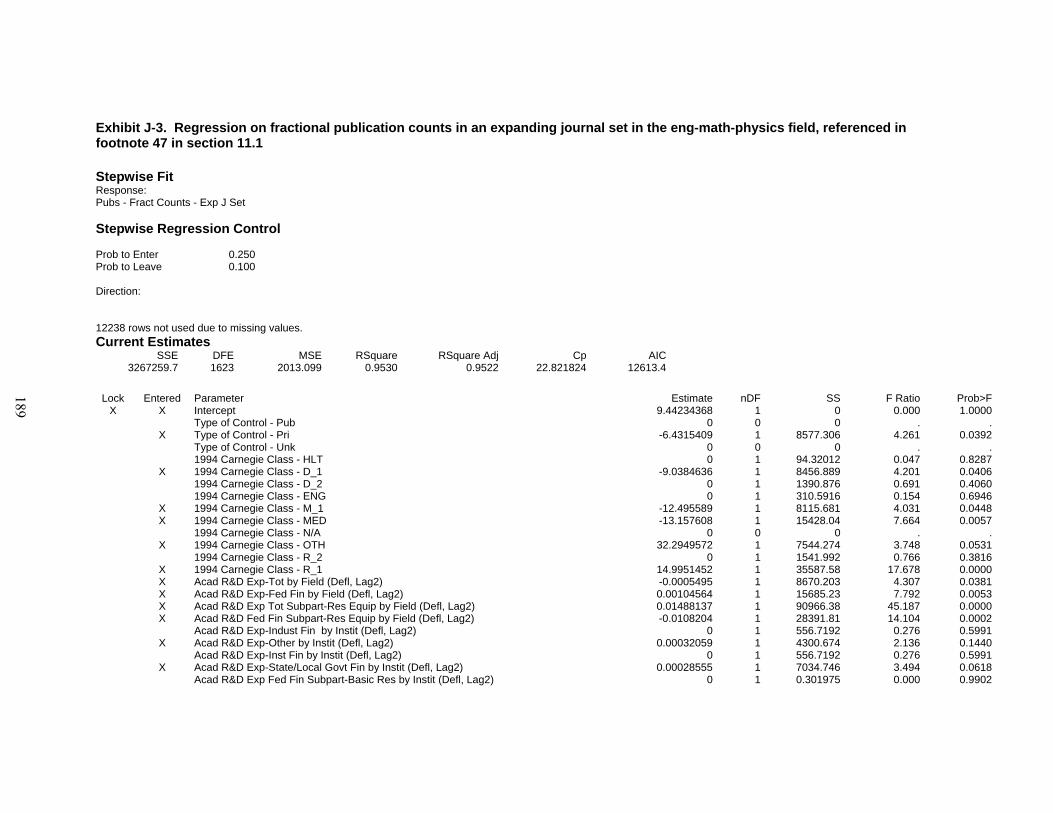
Exhibit J-3. Regression on fractional publication counts in an expanding journal set in the eng-math-physics field, referenced in footnote 47 in section 11.1 Stepwise Fit Response: Pubs - Fract Counts - Exp J Set Stepwise Regression Control Prob to Enter 0.250 Prob to Leave 0.100 Direction: 12238 rows not used due to missing values. Current Estimates
SSE DFE MSE RSquare RSquare Adj Cp AIC3267259.7 1623 2013.099 0.9530 0.9522 22.821824 12613.4
Lock Entered Parameter Estimate nDF SS F Ratio Prob>F
X X Intercept 9.44234368 1 0 0.000 1.0000 Type of Control - Pub 0 0 0 . . X Type of Control - Pri -6.4315409 1 8577.306 4.261 0.0392 Type of Control - Unk 0 0 0 . . 1994 Carnegie Class - HLT 0 1 94.32012 0.047 0.8287 X 1994 Carnegie Class - D_1 -9.0384636 1 8456.889 4.201 0.0406 1994 Carnegie Class - D_2 0 1 1390.876 0.691 0.4060 1994 Carnegie Class - ENG 0 1 310.5916 0.154 0.6946 X 1994 Carnegie Class - M_1 -12.495589 1 8115.681 4.031 0.0448 X 1994 Carnegie Class - MED -13.157608 1 15428.04 7.664 0.0057 1994 Carnegie Class - N/A 0 0 0 . . X 1994 Carnegie Class - OTH 32.2949572 1 7544.274 3.748 0.0531 1994 Carnegie Class - R_2 0 1 1541.992 0.766 0.3816 X 1994 Carnegie Class - R_1 14.9951452 1 35587.58 17.678 0.0000 X Acad R&D Exp-Tot by Field (Defl, Lag2) -0.0005495 1 8670.203 4.307 0.0381 X Acad R&D Exp-Fed Fin by Field (Defl, Lag2) 0.00104564 1 15685.23 7.792 0.0053 X Acad R&D Exp Tot Subpart-Res Equip by Field (Defl, Lag2) 0.01488137 1 90966.38 45.187 0.0000 X Acad R&D Fed Fin Subpart-Res Equip by Field (Defl, Lag2) -0.0108204 1 28391.81 14.104 0.0002 Acad R&D Exp-Indust Fin by Instit (Defl, Lag2) 0 1 556.7192 0.276 0.5991 X Acad R&D Exp-Other by Instit (Defl, Lag2) 0.00032059 1 4300.674 2.136 0.1440 Acad R&D Exp-Inst Fin by Instit (Defl, Lag2) 0 1 556.7192 0.276 0.5991 X Acad R&D Exp-State/Local Govt Fin by Instit (Defl, Lag2) 0.00028555 1 7034.746 3.494 0.0618 Acad R&D Exp Fed Fin Subpart-Basic Res by Instit (Defl, Lag2) 0 1 0.301975 0.000 0.9902
189
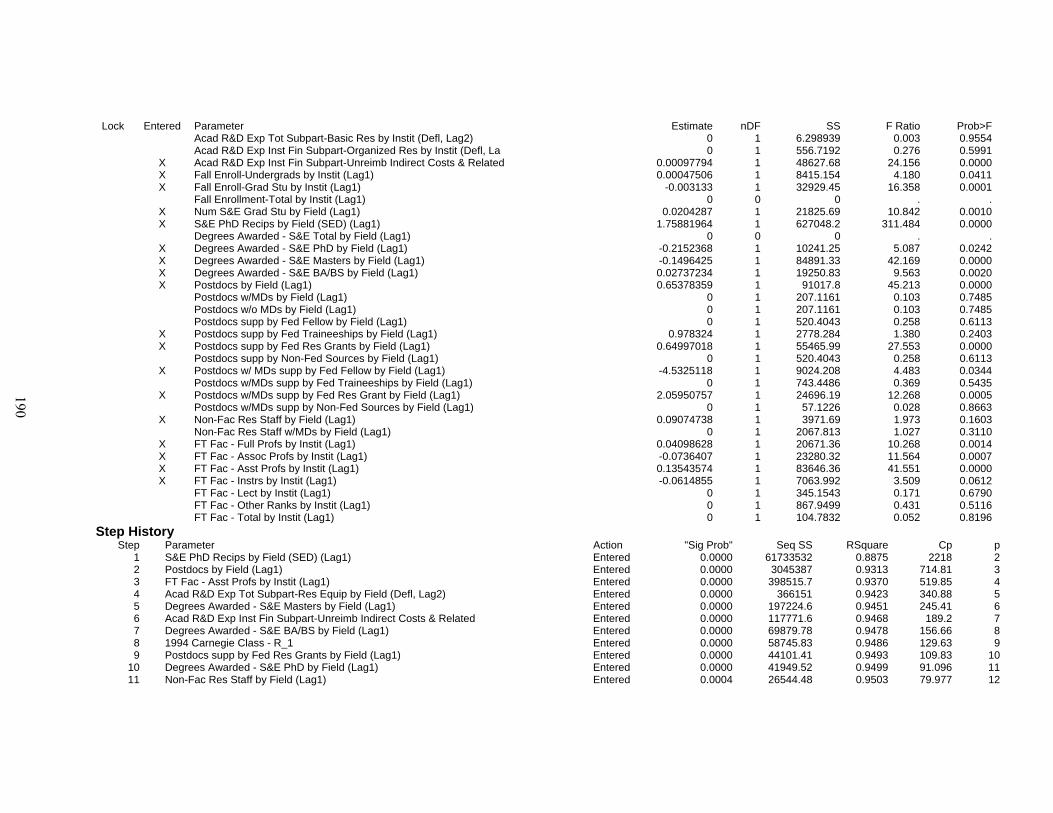
Lock Entered Parameter Estimate nDF SS F Ratio Prob>F Acad R&D Exp Tot Subpart-Basic Res by Instit (Defl, Lag2) 0 1 6.298939 0.003 0.9554 Acad R&D Exp Inst Fin Subpart-Organized Res by Instit (Defl, La 0 1 556.7192 0.276 0.5991 X Acad R&D Exp Inst Fin Subpart-Unreimb Indirect Costs & Related 0.00097794 1 48627.68 24.156 0.0000 X Fall Enroll-Undergrads by Instit (Lag1) 0.00047506 1 8415.154 4.180 0.0411 X Fall Enroll-Grad Stu by Instit (Lag1) -0.003133 1 32929.45 16.358 0.0001 Fall Enrollment-Total by Instit (Lag1) 0 0 0 . . X Num S&E Grad Stu by Field (Lag1) 0.0204287 1 21825.69 10.842 0.0010 X S&E PhD Recips by Field (SED) (Lag1) 1.75881964 1 627048.2 311.484 0.0000 Degrees Awarded - S&E Total by Field (Lag1) 0 0 0 . . X Degrees Awarded - S&E PhD by Field (Lag1) -0.2152368 1 10241.25 5.087 0.0242 X Degrees Awarded - S&E Masters by Field (Lag1) -0.1496425 1 84891.33 42.169 0.0000 X Degrees Awarded - S&E BA/BS by Field (Lag1) 0.02737234 1 19250.83 9.563 0.0020 X Postdocs by Field (Lag1) 0.65378359 1 91017.8 45.213 0.0000 Postdocs w/MDs by Field (Lag1) 0 1 207.1161 0.103 0.7485 Postdocs w/o MDs by Field (Lag1) 0 1 207.1161 0.103 0.7485 Postdocs supp by Fed Fellow by Field (Lag1) 0 1 520.4043 0.258 0.6113 X Postdocs supp by Fed Traineeships by Field (Lag1) 0.978324 1 2778.284 1.380 0.2403 X Postdocs supp by Fed Res Grants by Field (Lag1) 0.64997018 1 55465.99 27.553 0.0000 Postdocs supp by Non-Fed Sources by Field (Lag1) 0 1 520.4043 0.258 0.6113 X Postdocs w/ MDs supp by Fed Fellow by Field (Lag1) -4.5325118 1 9024.208 4.483 0.0344 Postdocs w/MDs supp by Fed Traineeships by Field (Lag1) 0 1 743.4486 0.369 0.5435 X Postdocs w/MDs supp by Fed Res Grant by Field (Lag1) 2.05950757 1 24696.19 12.268 0.0005 Postdocs w/MDs supp by Non-Fed Sources by Field (Lag1) 0 1 57.1226 0.028 0.8663 X Non-Fac Res Staff by Field (Lag1) 0.09074738 1 3971.69 1.973 0.1603 Non-Fac Res Staff w/MDs by Field (Lag1) 0 1 2067.813 1.027 0.3110 X FT Fac - Full Profs by Instit (Lag1) 0.04098628 1 20671.36 10.268 0.0014 X FT Fac - Assoc Profs by Instit (Lag1) -0.0736407 1 23280.32 11.564 0.0007 X FT Fac - Asst Profs by Instit (Lag1) 0.13543574 1 83646.36 41.551 0.0000 X FT Fac - Instrs by Instit (Lag1) -0.0614855 1 7063.992 3.509 0.0612 FT Fac - Lect by Instit (Lag1) 0 1 345.1543 0.171 0.6790 FT Fac - Other Ranks by Instit (Lag1) 0 1 867.9499 0.431 0.5116 FT Fac - Total by Instit (Lag1) 0 1 104.7832 0.052 0.8196
Step History Step Parameter Action "Sig Prob" Seq SS RSquare Cp p
1 S&E PhD Recips by Field (SED) (Lag1) Entered 0.0000 61733532 0.8875 2218 2 2 Postdocs by Field (Lag1) Entered 0.0000 3045387 0.9313 714.81 3 3 FT Fac - Asst Profs by Instit (Lag1) Entered 0.0000 398515.7 0.9370 519.85 4 4 Acad R&D Exp Tot Subpart-Res Equip by Field (Defl, Lag2) Entered 0.0000 366151 0.9423 340.88 5 5 Degrees Awarded - S&E Masters by Field (Lag1) Entered 0.0000 197224.6 0.9451 245.41 6 6 Acad R&D Exp Inst Fin Subpart-Unreimb Indirect Costs & Related Entered 0.0000 117771.6 0.9468 189.2 7 7 Degrees Awarded - S&E BA/BS by Field (Lag1) Entered 0.0000 69879.78 0.9478 156.66 8 8 1994 Carnegie Class - R_1 Entered 0.0000 58745.83 0.9486 129.63 9 9 Postdocs supp by Fed Res Grants by Field (Lag1) Entered 0.0000 44101.41 0.9493 109.83 10
10 Degrees Awarded - S&E PhD by Field (Lag1) Entered 0.0000 41949.52 0.9499 91.096 11 11 Non-Fac Res Staff by Field (Lag1) Entered 0.0004 26544.48 0.9503 79.977 12
190
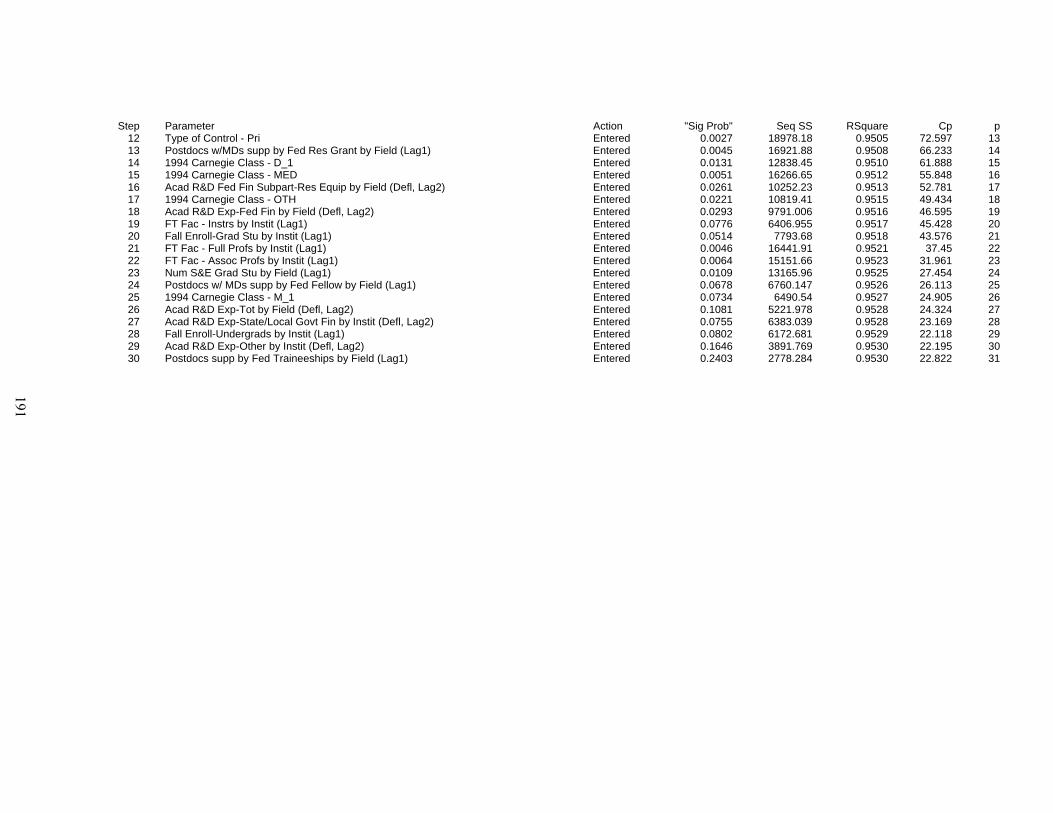
Step Parameter Action "Sig Prob" Seq SS RSquare Cp p 12 Type of Control - Pri Entered 0.0027 18978.18 0.9505 72.597 13 13 Postdocs w/MDs supp by Fed Res Grant by Field (Lag1) Entered 0.0045 16921.88 0.9508 66.233 14 14 1994 Carnegie Class - D_1 Entered 0.0131 12838.45 0.9510 61.888 15 15 1994 Carnegie Class - MED Entered 0.0051 16266.65 0.9512 55.848 16 16 Acad R&D Fed Fin Subpart-Res Equip by Field (Defl, Lag2) Entered 0.0261 10252.23 0.9513 52.781 17 17 1994 Carnegie Class - OTH Entered 0.0221 10819.41 0.9515 49.434 18 18 Acad R&D Exp-Fed Fin by Field (Defl, Lag2) Entered 0.0293 9791.006 0.9516 46.595 19 19 FT Fac - Instrs by Instit (Lag1) Entered 0.0776 6406.955 0.9517 45.428 20 20 Fall Enroll-Grad Stu by Instit (Lag1) Entered 0.0514 7793.68 0.9518 43.576 21 21 FT Fac - Full Profs by Instit (Lag1) Entered 0.0046 16441.91 0.9521 37.45 22 22 FT Fac - Assoc Profs by Instit (Lag1) Entered 0.0064 15151.66 0.9523 31.961 23 23 Num S&E Grad Stu by Field (Lag1) Entered 0.0109 13165.96 0.9525 27.454 24 24 Postdocs w/ MDs supp by Fed Fellow by Field (Lag1) Entered 0.0678 6760.147 0.9526 26.113 25 25 1994 Carnegie Class - M_1 Entered 0.0734 6490.54 0.9527 24.905 26 26 Acad R&D Exp-Tot by Field (Defl, Lag2) Entered 0.1081 5221.978 0.9528 24.324 27 27 Acad R&D Exp-State/Local Govt Fin by Instit (Defl, Lag2) Entered 0.0755 6383.039 0.9528 23.169 28 28 Fall Enroll-Undergrads by Instit (Lag1) Entered 0.0802 6172.681 0.9529 22.118 29 29 Acad R&D Exp-Other by Instit (Defl, Lag2) Entered 0.1646 3891.769 0.9530 22.195 30 30 Postdocs supp by Fed Traineeships by Field (Lag1) Entered 0.2403 2778.284 0.9530 22.822 31
191
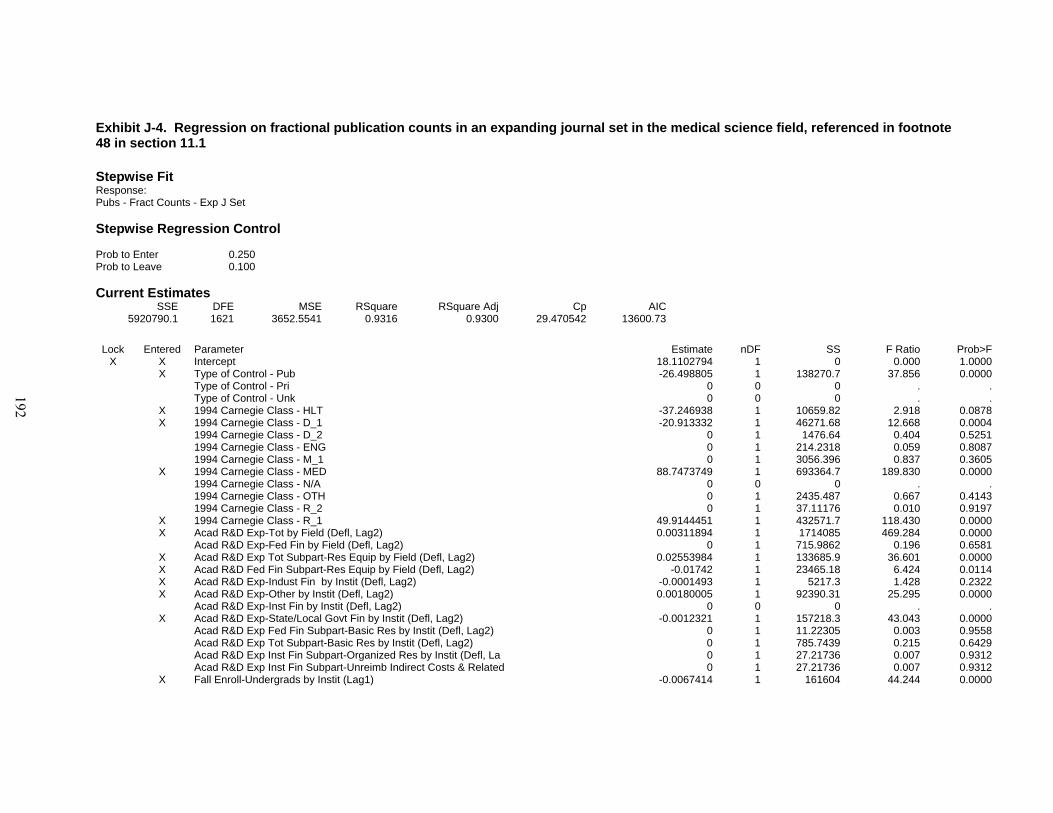
Exhibit J-4. Regression on fractional publication counts in an expanding journal set in the medical science field, referenced in footnote 48 in section 11.1 Stepwise Fit Response: Pubs - Fract Counts - Exp J Set Stepwise Regression Control Prob to Enter 0.250 Prob to Leave 0.100 Current Estimates
SSE DFE MSE RSquare RSquare Adj Cp AIC5920790.1 1621 3652.5541 0.9316 0.9300 29.470542 13600.73
Lock Entered Parameter Estimate nDF SS F Ratio Prob>F
X X Intercept 18.1102794 1 0 0.000 1.0000 X Type of Control - Pub -26.498805 1 138270.7 37.856 0.0000 Type of Control - Pri 0 0 0 . . Type of Control - Unk 0 0 0 . . X 1994 Carnegie Class - HLT -37.246938 1 10659.82 2.918 0.0878 X 1994 Carnegie Class - D_1 -20.913332 1 46271.68 12.668 0.0004 1994 Carnegie Class - D_2 0 1 1476.64 0.404 0.5251 1994 Carnegie Class - ENG 0 1 214.2318 0.059 0.8087 1994 Carnegie Class - M_1 0 1 3056.396 0.837 0.3605 X 1994 Carnegie Class - MED 88.7473749 1 693364.7 189.830 0.0000 1994 Carnegie Class - N/A 0 0 0 . . 1994 Carnegie Class - OTH 0 1 2435.487 0.667 0.4143 1994 Carnegie Class - R_2 0 1 37.11176 0.010 0.9197 X 1994 Carnegie Class - R_1 49.9144451 1 432571.7 118.430 0.0000 X Acad R&D Exp-Tot by Field (Defl, Lag2) 0.00311894 1 1714085 469.284 0.0000 Acad R&D Exp-Fed Fin by Field (Defl, Lag2) 0 1 715.9862 0.196 0.6581 X Acad R&D Exp Tot Subpart-Res Equip by Field (Defl, Lag2) 0.02553984 1 133685.9 36.601 0.0000 X Acad R&D Fed Fin Subpart-Res Equip by Field (Defl, Lag2) -0.01742 1 23465.18 6.424 0.0114 X Acad R&D Exp-Indust Fin by Instit (Defl, Lag2) -0.0001493 1 5217.3 1.428 0.2322 X Acad R&D Exp-Other by Instit (Defl, Lag2) 0.00180005 1 92390.31 25.295 0.0000 Acad R&D Exp-Inst Fin by Instit (Defl, Lag2) 0 0 0 . . X Acad R&D Exp-State/Local Govt Fin by Instit (Defl, Lag2) -0.0012321 1 157218.3 43.043 0.0000 Acad R&D Exp Fed Fin Subpart-Basic Res by Instit (Defl, Lag2) 0 1 11.22305 0.003 0.9558 Acad R&D Exp Tot Subpart-Basic Res by Instit (Defl, Lag2) 0 1 785.7439 0.215 0.6429 Acad R&D Exp Inst Fin Subpart-Organized Res by Instit (Defl, La 0 1 27.21736 0.007 0.9312 Acad R&D Exp Inst Fin Subpart-Unreimb Indirect Costs & Related 0 1 27.21736 0.007 0.9312 X Fall Enroll-Undergrads by Instit (Lag1) -0.0067414 1 161604 44.244 0.0000
192
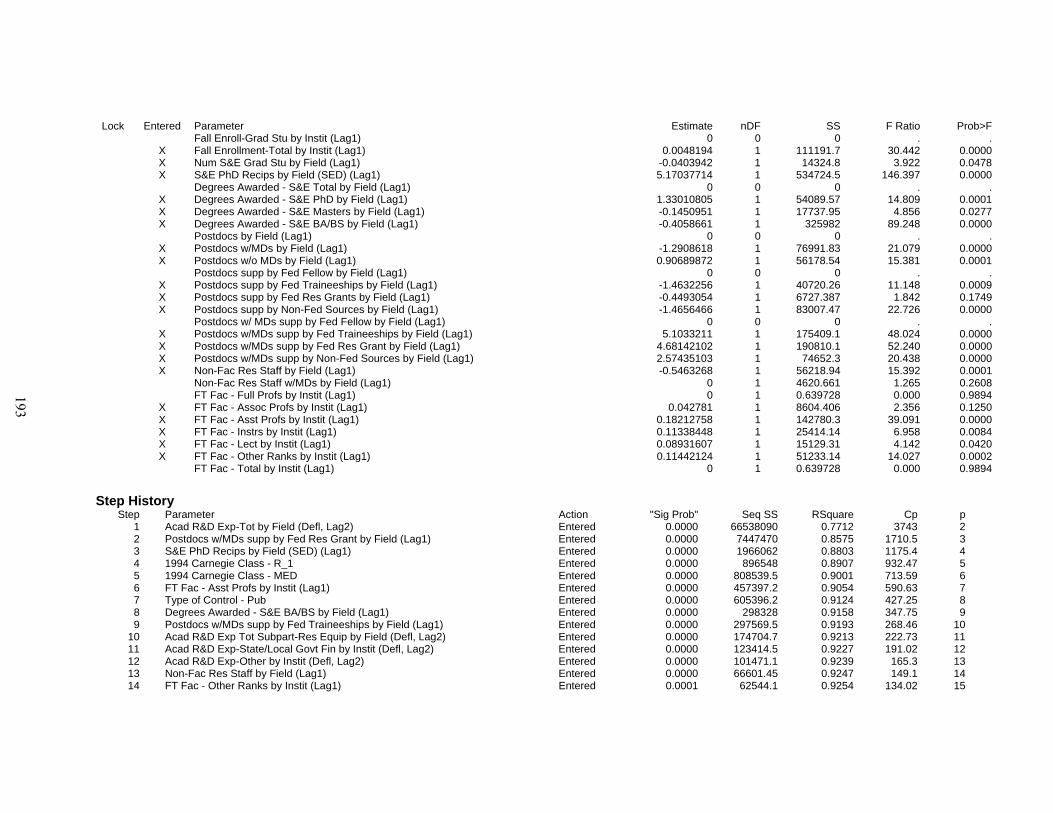
Lock Entered Parameter Estimate nDF SS F Ratio Prob>F Fall Enroll-Grad Stu by Instit (Lag1) 0 0 0 . . X Fall Enrollment-Total by Instit (Lag1) 0.0048194 1 111191.7 30.442 0.0000 X Num S&E Grad Stu by Field (Lag1) -0.0403942 1 14324.8 3.922 0.0478 X S&E PhD Recips by Field (SED) (Lag1) 5.17037714 1 534724.5 146.397 0.0000 Degrees Awarded - S&E Total by Field (Lag1) 0 0 0 . . X Degrees Awarded - S&E PhD by Field (Lag1) 1.33010805 1 54089.57 14.809 0.0001 X Degrees Awarded - S&E Masters by Field (Lag1) -0.1450951 1 17737.95 4.856 0.0277 X Degrees Awarded - S&E BA/BS by Field (Lag1) -0.4058661 1 325982 89.248 0.0000 Postdocs by Field (Lag1) 0 0 0 . . X Postdocs w/MDs by Field (Lag1) -1.2908618 1 76991.83 21.079 0.0000 X Postdocs w/o MDs by Field (Lag1) 0.90689872 1 56178.54 15.381 0.0001 Postdocs supp by Fed Fellow by Field (Lag1) 0 0 0 . . X Postdocs supp by Fed Traineeships by Field (Lag1) -1.4632256 1 40720.26 11.148 0.0009 X Postdocs supp by Fed Res Grants by Field (Lag1) -0.4493054 1 6727.387 1.842 0.1749 X Postdocs supp by Non-Fed Sources by Field (Lag1) -1.4656466 1 83007.47 22.726 0.0000 Postdocs w/ MDs supp by Fed Fellow by Field (Lag1) 0 0 0 . . X Postdocs w/MDs supp by Fed Traineeships by Field (Lag1) 5.1033211 1 175409.1 48.024 0.0000 X Postdocs w/MDs supp by Fed Res Grant by Field (Lag1) 4.68142102 1 190810.1 52.240 0.0000 X Postdocs w/MDs supp by Non-Fed Sources by Field (Lag1) 2.57435103 1 74652.3 20.438 0.0000 X Non-Fac Res Staff by Field (Lag1) -0.5463268 1 56218.94 15.392 0.0001 Non-Fac Res Staff w/MDs by Field (Lag1) 0 1 4620.661 1.265 0.2608 FT Fac - Full Profs by Instit (Lag1) 0 1 0.639728 0.000 0.9894 X FT Fac - Assoc Profs by Instit (Lag1) 0.042781 1 8604.406 2.356 0.1250 X FT Fac - Asst Profs by Instit (Lag1) 0.18212758 1 142780.3 39.091 0.0000 X FT Fac - Instrs by Instit (Lag1) 0.11338448 1 25414.14 6.958 0.0084 X FT Fac - Lect by Instit (Lag1) 0.08931607 1 15129.31 4.142 0.0420 X FT Fac - Other Ranks by Instit (Lag1) 0.11442124 1 51233.14 14.027 0.0002 FT Fac - Total by Instit (Lag1) 0 1 0.639728 0.000 0.9894
Step History
Step Parameter Action "Sig Prob" Seq SS RSquare Cp p1 Acad R&D Exp-Tot by Field (Defl, Lag2) Entered 0.0000 66538090 0.7712 3743 22 Postdocs w/MDs supp by Fed Res Grant by Field (Lag1) Entered 0.0000 7447470 0.8575 1710.5 33 S&E PhD Recips by Field (SED) (Lag1) Entered 0.0000 1966062 0.8803 1175.4 44 1994 Carnegie Class - R_1 Entered 0.0000 896548 0.8907 932.47 55 1994 Carnegie Class - MED Entered 0.0000 808539.5 0.9001 713.59 66 FT Fac - Asst Profs by Instit (Lag1) Entered 0.0000 457397.2 0.9054 590.63 77 Type of Control - Pub Entered 0.0000 605396.2 0.9124 427.25 88 Degrees Awarded - S&E BA/BS by Field (Lag1) Entered 0.0000 298328 0.9158 347.75 99 Postdocs w/MDs supp by Fed Traineeships by Field (Lag1) Entered 0.0000 297569.5 0.9193 268.46 10
10 Acad R&D Exp Tot Subpart-Res Equip by Field (Defl, Lag2) Entered 0.0000 174704.7 0.9213 222.73 1111 Acad R&D Exp-State/Local Govt Fin by Instit (Defl, Lag2) Entered 0.0000 123414.5 0.9227 191.02 1212 Acad R&D Exp-Other by Instit (Defl, Lag2) Entered 0.0000 101471.1 0.9239 165.3 1313 Non-Fac Res Staff by Field (Lag1) Entered 0.0000 66601.45 0.9247 149.1 1414 FT Fac - Other Ranks by Instit (Lag1) Entered 0.0001 62544.1 0.9254 134.02 15
193
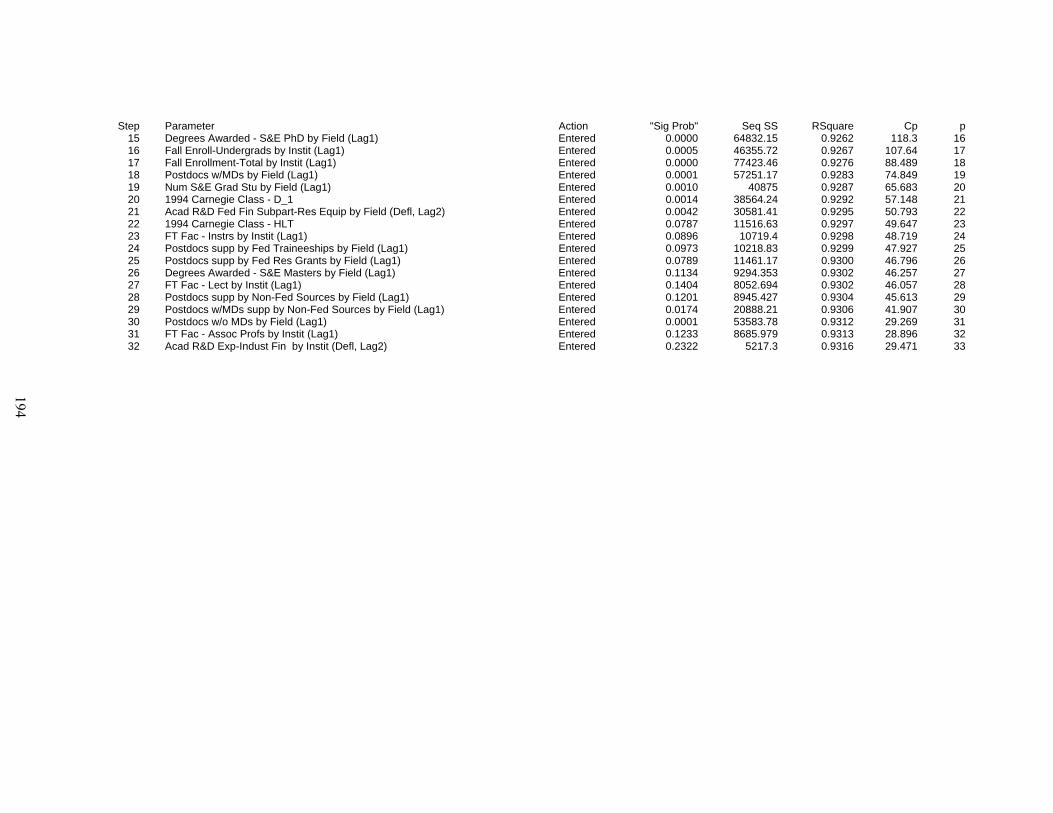
Step Parameter Action "Sig Prob" Seq SS RSquare Cp p15 Degrees Awarded - S&E PhD by Field (Lag1) Entered 0.0000 64832.15 0.9262 118.3 1616 Fall Enroll-Undergrads by Instit (Lag1) Entered 0.0005 46355.72 0.9267 107.64 1717 Fall Enrollment-Total by Instit (Lag1) Entered 0.0000 77423.46 0.9276 88.489 1818 Postdocs w/MDs by Field (Lag1) Entered 0.0001 57251.17 0.9283 74.849 1919 Num S&E Grad Stu by Field (Lag1) Entered 0.0010 40875 0.9287 65.683 2020 1994 Carnegie Class - D_1 Entered 0.0014 38564.24 0.9292 57.148 2121 Acad R&D Fed Fin Subpart-Res Equip by Field (Defl, Lag2) Entered 0.0042 30581.41 0.9295 50.793 2222 1994 Carnegie Class - HLT Entered 0.0787 11516.63 0.9297 49.647 2323 FT Fac - Instrs by Instit (Lag1) Entered 0.0896 10719.4 0.9298 48.719 2424 Postdocs supp by Fed Traineeships by Field (Lag1) Entered 0.0973 10218.83 0.9299 47.927 2525 Postdocs supp by Fed Res Grants by Field (Lag1) Entered 0.0789 11461.17 0.9300 46.796 2626 Degrees Awarded - S&E Masters by Field (Lag1) Entered 0.1134 9294.353 0.9302 46.257 2727 FT Fac - Lect by Instit (Lag1) Entered 0.1404 8052.694 0.9302 46.057 2828 Postdocs supp by Non-Fed Sources by Field (Lag1) Entered 0.1201 8945.427 0.9304 45.613 2929 Postdocs w/MDs supp by Non-Fed Sources by Field (Lag1) Entered 0.0174 20888.21 0.9306 41.907 3030 Postdocs w/o MDs by Field (Lag1) Entered 0.0001 53583.78 0.9312 29.269 3131 FT Fac - Assoc Profs by Instit (Lag1) Entered 0.1233 8685.979 0.9313 28.896 3232 Acad R&D Exp-Indust Fin by Instit (Defl, Lag2) Entered 0.2322 5217.3 0.9316 29.471 33
194
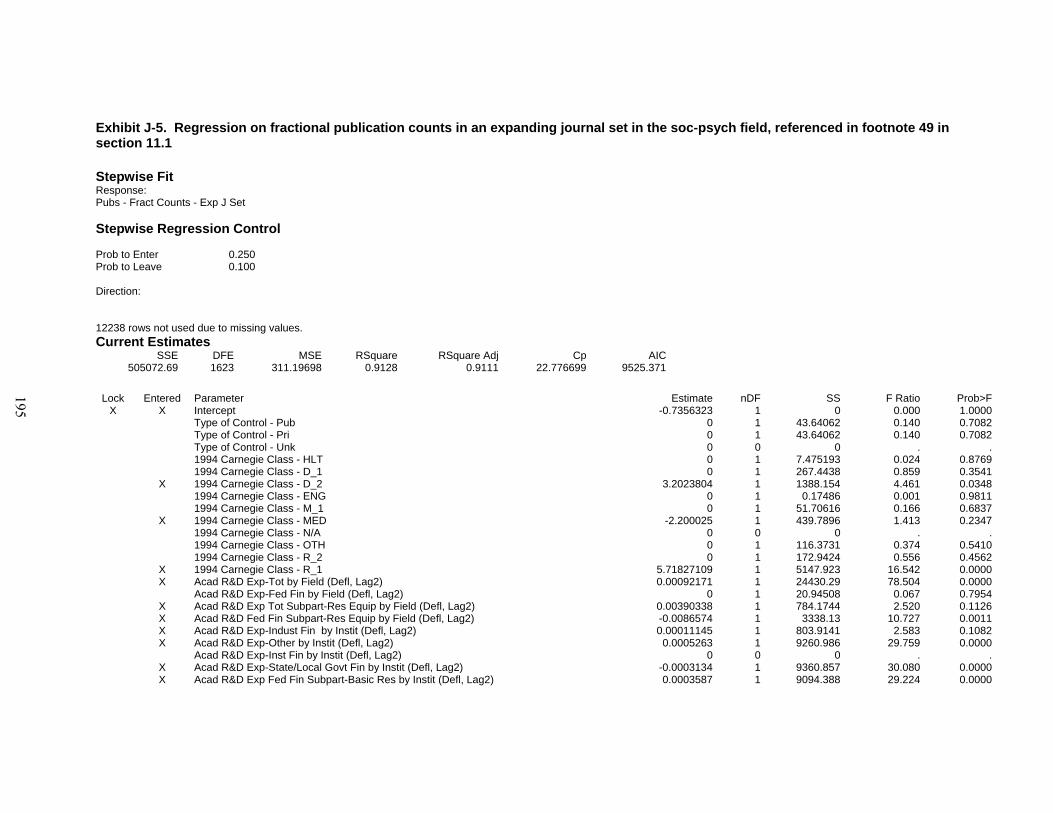
Exhibit J-5. Regression on fractional publication counts in an expanding journal set in the soc-psych field, referenced in footnote 49 in section 11.1 Stepwise Fit Response: Pubs - Fract Counts - Exp J Set Stepwise Regression Control Prob to Enter 0.250 Prob to Leave 0.100 Direction: 12238 rows not used due to missing values. Current Estimates
SSE DFE MSE RSquare RSquare Adj Cp AIC505072.69 1623 311.19698 0.9128 0.9111 22.776699 9525.371
Lock Entered Parameter Estimate nDF SS F Ratio Prob>F
X X Intercept -0.7356323 1 0 0.000 1.0000 Type of Control - Pub 0 1 43.64062 0.140 0.7082 Type of Control - Pri 0 1 43.64062 0.140 0.7082 Type of Control - Unk 0 0 0 . . 1994 Carnegie Class - HLT 0 1 7.475193 0.024 0.8769 1994 Carnegie Class - D_1 0 1 267.4438 0.859 0.3541 X 1994 Carnegie Class - D_2 3.2023804 1 1388.154 4.461 0.0348 1994 Carnegie Class - ENG 0 1 0.17486 0.001 0.9811 1994 Carnegie Class - M_1 0 1 51.70616 0.166 0.6837 X 1994 Carnegie Class - MED -2.200025 1 439.7896 1.413 0.2347 1994 Carnegie Class - N/A 0 0 0 . . 1994 Carnegie Class - OTH 0 1 116.3731 0.374 0.5410 1994 Carnegie Class - R_2 0 1 172.9424 0.556 0.4562 X 1994 Carnegie Class - R_1 5.71827109 1 5147.923 16.542 0.0000 X Acad R&D Exp-Tot by Field (Defl, Lag2) 0.00092171 1 24430.29 78.504 0.0000 Acad R&D Exp-Fed Fin by Field (Defl, Lag2) 0 1 20.94508 0.067 0.7954 X Acad R&D Exp Tot Subpart-Res Equip by Field (Defl, Lag2) 0.00390338 1 784.1744 2.520 0.1126 X Acad R&D Fed Fin Subpart-Res Equip by Field (Defl, Lag2) -0.0086574 1 3338.13 10.727 0.0011 X Acad R&D Exp-Indust Fin by Instit (Defl, Lag2) 0.00011145 1 803.9141 2.583 0.1082 X Acad R&D Exp-Other by Instit (Defl, Lag2) 0.0005263 1 9260.986 29.759 0.0000 Acad R&D Exp-Inst Fin by Instit (Defl, Lag2) 0 0 0 . . X Acad R&D Exp-State/Local Govt Fin by Instit (Defl, Lag2) -0.0003134 1 9360.857 30.080 0.0000 X Acad R&D Exp Fed Fin Subpart-Basic Res by Instit (Defl, Lag2) 0.0003587 1 9094.388 29.224 0.0000
195

Lock Entered Parameter Estimate nDF SS F Ratio Prob>F X Acad R&D Exp Tot Subpart-Basic Res by Instit (Defl, Lag2) -0.0001197 1 1492.883 4.797 0.0286 Acad R&D Exp Inst Fin Subpart-Organized Res by Instit (Defl, La 0 0 0 . . X Acad R&D Exp Inst Fin Subpart-Unreimb Indirect Costs & Related 0.00036735 1 3633.452 11.676 0.0006 X Fall Enroll-Undergrads by Instit (Lag1) -0.0008107 1 24820.93 79.760 0.0000 Fall Enroll-Grad Stu by Instit (Lag1) 0 1 229.3446 0.737 0.3908 Fall Enrollment-Total by Instit (Lag1) 0 1 229.3446 0.737 0.3908 X Num S&E Grad Stu by Field (Lag1) 0.01480142 1 12425.62 39.928 0.0000 X S&E PhD Recips by Field (SED) (Lag1) 0.69591099 1 62459.05 200.706 0.0000 X Degrees Awarded - S&E Total by Field (Lag1) 0.00597436 1 289.4347 0.930 0.3350 X Degrees Awarded - S&E PhD by Field (Lag1) -0.1436732 1 2367.046 7.606 0.0059 Degrees Awarded - S&E Masters by Field (Lag1) 0 0 0 . . X Degrees Awarded - S&E BA/BS by Field (Lag1) 0.01033508 1 799.3989 2.569 0.1092 X Postdocs by Field (Lag1) -0.4717249 1 44.5952 0.143 0.7051 Postdocs w/MDs by Field (Lag1) 0 0 0 . . X Postdocs w/o MDs by Field (Lag1) 1.83459547 1 671.0056 2.156 0.1422 Postdocs supp by Fed Fellow by Field (Lag1) 0 1 5.987585 0.019 0.8897 X Postdocs supp by Fed Traineeships by Field (Lag1) -2.0419083 1 17311.96 55.630 0.0000 X Postdocs supp by Fed Res Grants by Field (Lag1) -0.7751971 1 4105.585 13.193 0.0003 Postdocs supp by Non-Fed Sources by Field (Lag1) 0 1 5.987585 0.019 0.8897 X Postdocs w/ MDs supp by Fed Fellow by Field (Lag1) 14.1548183 1 4920.192 15.811 0.0001 Postdocs w/MDs supp by Fed Traineeships by Field (Lag1) 0 1 69.24565 0.222 0.6373 Postdocs w/MDs supp by Fed Res Grant by Field (Lag1) 0 1 0.986158 0.003 0.9551 Postdocs w/MDs supp by Non-Fed Sources by Field (Lag1) 0 1 20.14144 0.065 0.7993 X Non-Fac Res Staff by Field (Lag1) 0.72537376 1 12098.29 38.877 0.0000 X Non-Fac Res Staff w/MDs by Field (Lag1) -3.1649238 1 984.3349 3.163 0.0755 X FT Fac - Full Profs by Instit (Lag1) 0.005779 1 470.0158 1.510 0.2193 FT Fac - Assoc Profs by Instit (Lag1) 0 1 308.7208 0.992 0.3194 X FT Fac - Asst Profs by Instit (Lag1) 0.05415903 1 15271.57 49.074 0.0000 X FT Fac - Instrs by Instit (Lag1) 0.04934381 1 4668.919 15.003 0.0001 X FT Fac - Lect by Instit (Lag1) 0.06320333 1 8615.259 27.684 0.0000 X FT Fac - Other Ranks by Instit (Lag1) 0.03273456 1 4154.947 13.352 0.0003 FT Fac - Total by Instit (Lag1) 0 1 308.7208 0.992 0.3194
Step History Step Parameter Action "Sig Prob" Seq SS RSquare Cp p
1 S&E PhD Recips by Field (SED) (Lag1) Entered 0.0000 4571115 0.7896 2243.8 2 2 Acad R&D Exp Tot Subpart-Basic Res by Instit (Defl, Lag2) Entered 0.0000 305671.8 0.8424 1268.5 3 3 Postdocs by Field (Lag1) Entered 0.0000 116222.8 0.8625 898.94 4 4 FT Fac - Asst Profs by Instit (Lag1) Entered 0.0000 67795.17 0.8742 684.19 5 5 Acad R&D Exp-Tot by Field (Defl, Lag2) Entered 0.0000 42294.02 0.8815 550.97 6 6 Acad R&D Exp-State/Local Govt Fin by Instit (Defl, Lag2) Entered 0.0000 22845.84 0.8855 479.93 7 7 Acad R&D Exp Tot Subpart-Res Equip by Field (Defl, Lag2) Entered 0.0000 16844.14 0.8884 428.07 8 8 Degrees Awarded - S&E Total by Field (Lag1) Entered 0.0000 14932.68 0.8909 382.33 9 9 Fall Enroll-Undergrads by Instit (Lag1) Entered 0.0000 19065.1 0.8942 323.38 10
10 Non-Fac Res Staff by Field (Lag1) Entered 0.0000 14530.12 0.8968 278.92 11 11 Postdocs supp by Fed Traineeships by Field (Lag1) Entered 0.0000 13172.69 0.8990 238.81 12
196
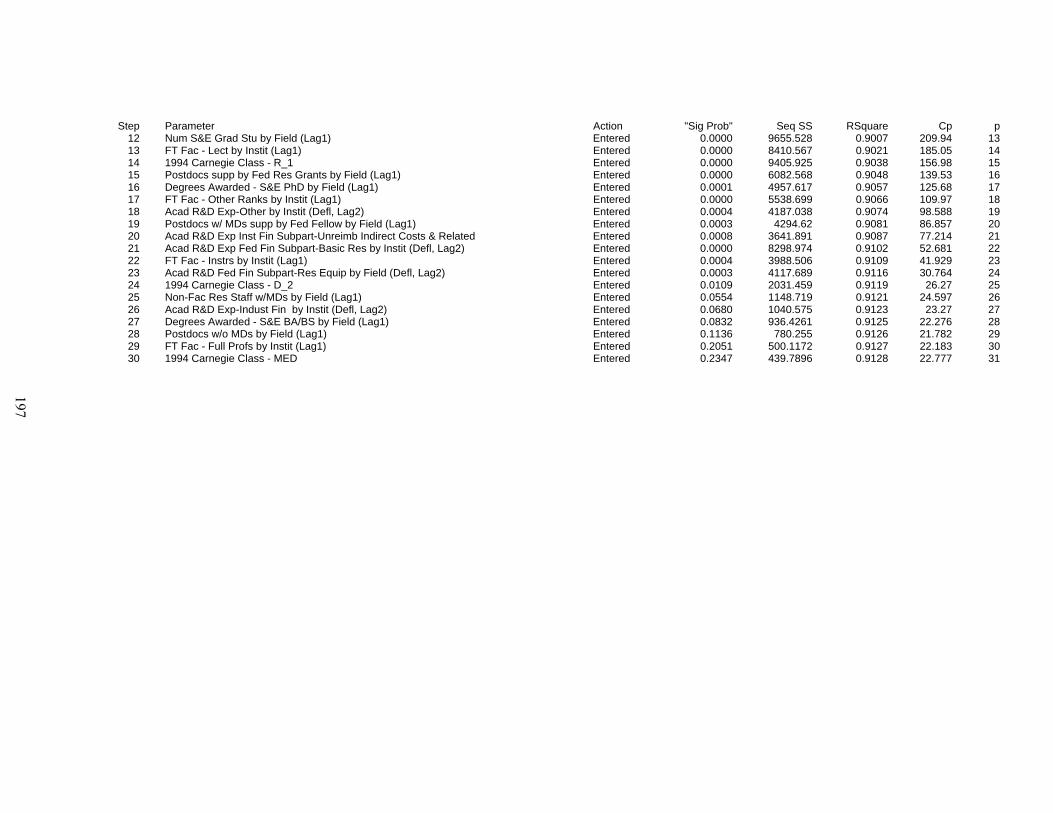
Step Parameter Action "Sig Prob" Seq SS RSquare Cp p 12 Num S&E Grad Stu by Field (Lag1) Entered 0.0000 9655.528 0.9007 209.94 13 13 FT Fac - Lect by Instit (Lag1) Entered 0.0000 8410.567 0.9021 185.05 14 14 1994 Carnegie Class - R_1 Entered 0.0000 9405.925 0.9038 156.98 15 15 Postdocs supp by Fed Res Grants by Field (Lag1) Entered 0.0000 6082.568 0.9048 139.53 16 16 Degrees Awarded - S&E PhD by Field (Lag1) Entered 0.0001 4957.617 0.9057 125.68 17 17 FT Fac - Other Ranks by Instit (Lag1) Entered 0.0000 5538.699 0.9066 109.97 18 18 Acad R&D Exp-Other by Instit (Defl, Lag2) Entered 0.0004 4187.038 0.9074 98.588 19 19 Postdocs w/ MDs supp by Fed Fellow by Field (Lag1) Entered 0.0003 4294.62 0.9081 86.857 20 20 Acad R&D Exp Inst Fin Subpart-Unreimb Indirect Costs & Related Entered 0.0008 3641.891 0.9087 77.214 21 21 Acad R&D Exp Fed Fin Subpart-Basic Res by Instit (Defl, Lag2) Entered 0.0000 8298.974 0.9102 52.681 22 22 FT Fac - Instrs by Instit (Lag1) Entered 0.0004 3988.506 0.9109 41.929 23 23 Acad R&D Fed Fin Subpart-Res Equip by Field (Defl, Lag2) Entered 0.0003 4117.689 0.9116 30.764 24 24 1994 Carnegie Class - D_2 Entered 0.0109 2031.459 0.9119 26.27 25 25 Non-Fac Res Staff w/MDs by Field (Lag1) Entered 0.0554 1148.719 0.9121 24.597 26 26 Acad R&D Exp-Indust Fin by Instit (Defl, Lag2) Entered 0.0680 1040.575 0.9123 23.27 27 27 Degrees Awarded - S&E BA/BS by Field (Lag1) Entered 0.0832 936.4261 0.9125 22.276 28 28 Postdocs w/o MDs by Field (Lag1) Entered 0.1136 780.255 0.9126 21.782 29 29 FT Fac - Full Profs by Instit (Lag1) Entered 0.2051 500.1172 0.9127 22.183 30 30 1994 Carnegie Class - MED Entered 0.2347 439.7896 0.9128 22.777 31
197
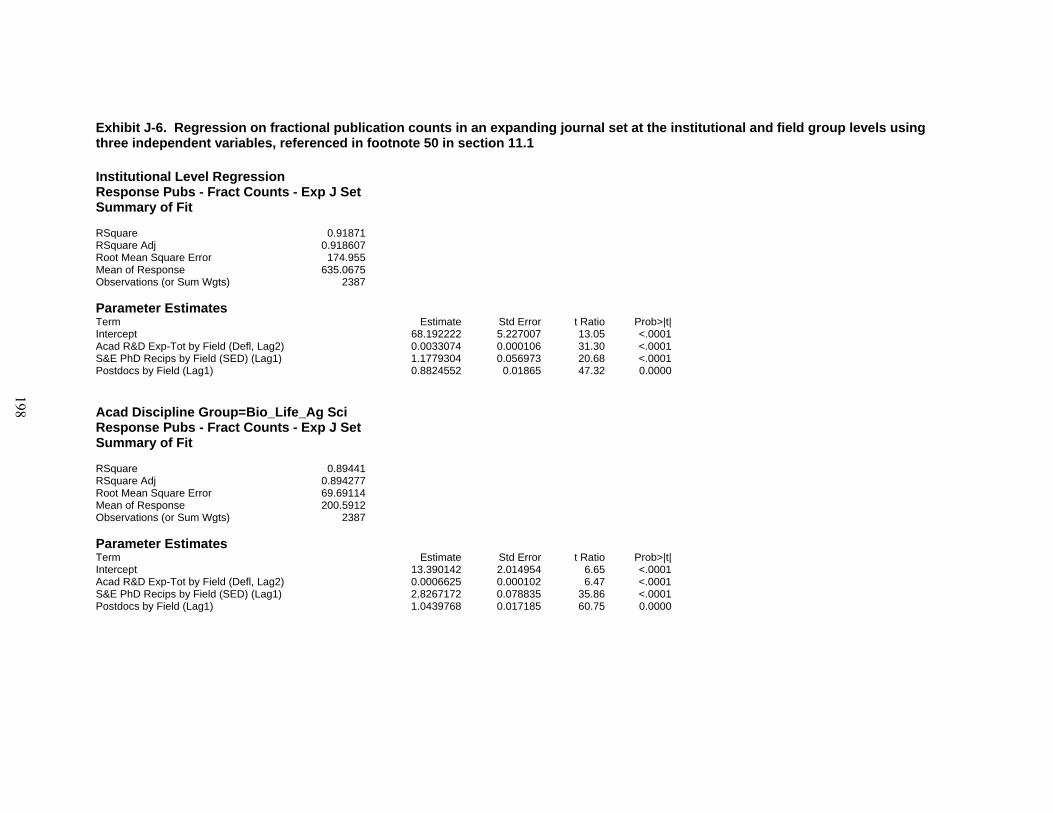
Exhibit J-6. Regression on fractional publication counts in an expanding journal set at the institutional and field group levels using three independent variables, referenced in footnote 50 in section 11.1 Institutional Level Regression Response Pubs - Fract Counts - Exp J Set Summary of Fit RSquare 0.91871RSquare Adj 0.918607Root Mean Square Error 174.955Mean of Response 635.0675Observations (or Sum Wgts) 2387 Parameter Estimates Term Estimate Std Error t Ratio Prob>|t|Intercept 68.192222 5.227007 13.05 <.0001Acad R&D Exp-Tot by Field (Defl, Lag2) 0.0033074 0.000106 31.30 <.0001S&E PhD Recips by Field (SED) (Lag1) 1.1779304 0.056973 20.68 <.0001Postdocs by Field (Lag1) 0.8824552 0.01865 47.32 0.0000 Acad Discipline Group=Bio_Life_Ag Sci Response Pubs - Fract Counts - Exp J Set Summary of Fit RSquare 0.89441RSquare Adj 0.894277Root Mean Square Error 69.69114Mean of Response 200.5912Observations (or Sum Wgts) 2387 Parameter Estimates Term Estimate Std Error t Ratio Prob>|t|Intercept 13.390142 2.014954 6.65 <.0001Acad R&D Exp-Tot by Field (Defl, Lag2) 0.0006625 0.000102 6.47 <.0001S&E PhD Recips by Field (SED) (Lag1) 2.8267172 0.078835 35.86 <.0001Postdocs by Field (Lag1) 1.0439768 0.017185 60.75 0.0000
198
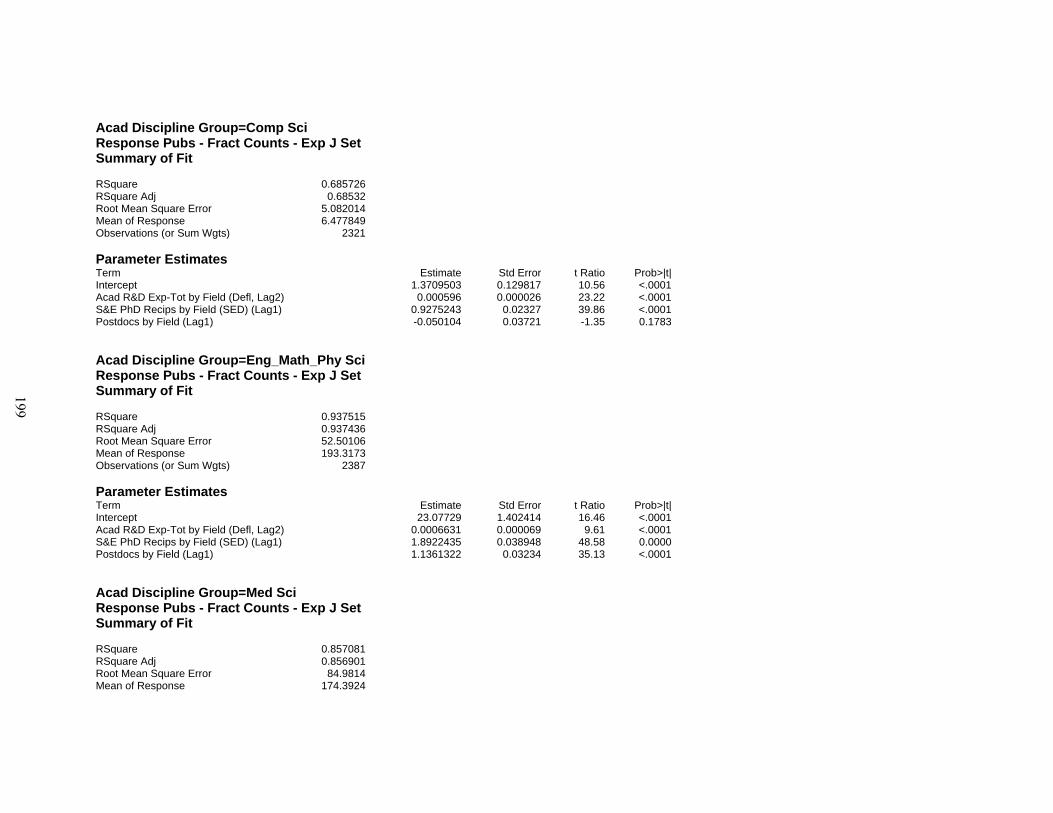
Acad Discipline Group=Comp Sci Response Pubs - Fract Counts - Exp J Set Summary of Fit RSquare 0.685726RSquare Adj 0.68532Root Mean Square Error 5.082014Mean of Response 6.477849Observations (or Sum Wgts) 2321 Parameter Estimates Term Estimate Std Error t Ratio Prob>|t|Intercept 1.3709503 0.129817 10.56 <.0001Acad R&D Exp-Tot by Field (Defl, Lag2) 0.000596 0.000026 23.22 <.0001S&E PhD Recips by Field (SED) (Lag1) 0.9275243 0.02327 39.86 <.0001Postdocs by Field (Lag1) -0.050104 0.03721 -1.35 0.1783 Acad Discipline Group=Eng_Math_Phy Sci Response Pubs - Fract Counts - Exp J Set Summary of Fit RSquare 0.937515RSquare Adj 0.937436Root Mean Square Error 52.50106Mean of Response 193.3173Observations (or Sum Wgts) 2387 Parameter Estimates Term Estimate Std Error t Ratio Prob>|t|Intercept 23.07729 1.402414 16.46 <.0001Acad R&D Exp-Tot by Field (Defl, Lag2) 0.0006631 0.000069 9.61 <.0001S&E PhD Recips by Field (SED) (Lag1) 1.8922435 0.038948 48.58 0.0000Postdocs by Field (Lag1) 1.1361322 0.03234 35.13 <.0001 Acad Discipline Group=Med Sci Response Pubs - Fract Counts - Exp J Set Summary of Fit RSquare 0.857081RSquare Adj 0.856901Root Mean Square Error 84.9814Mean of Response 174.3924
199
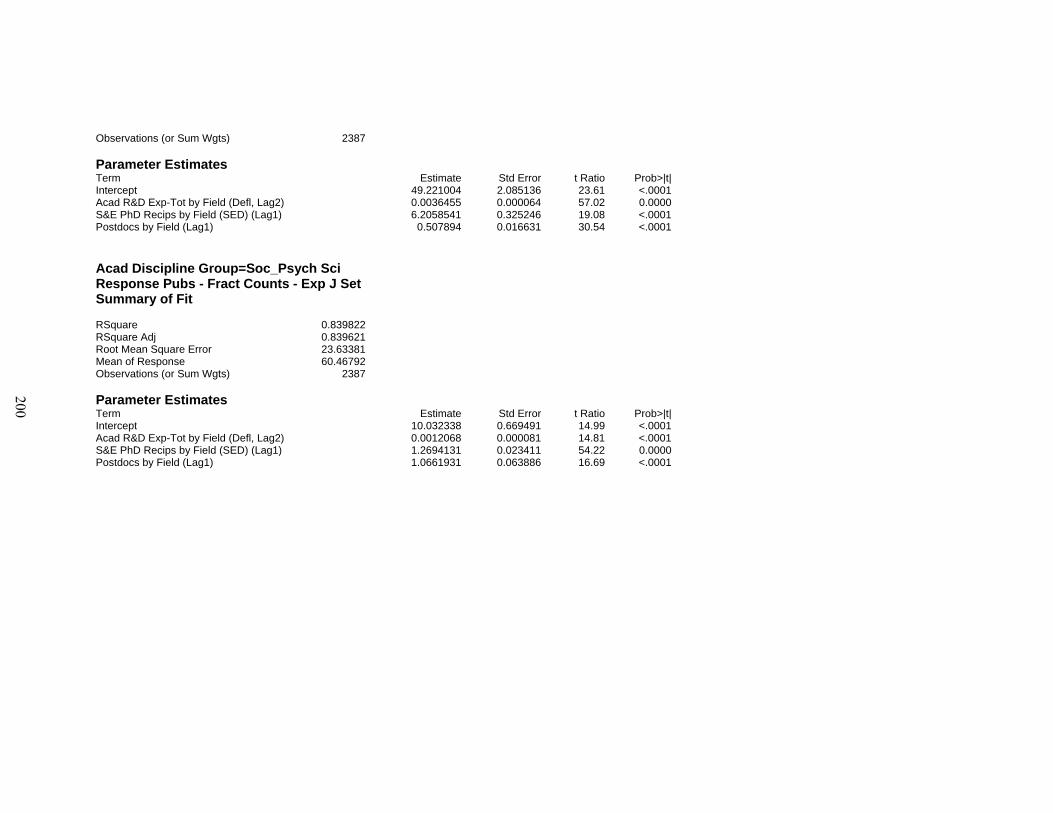
Observations (or Sum Wgts) 2387 Parameter Estimates Term Estimate Std Error t Ratio Prob>|t|Intercept 49.221004 2.085136 23.61 <.0001Acad R&D Exp-Tot by Field (Defl, Lag2) 0.0036455 0.000064 57.02 0.0000S&E PhD Recips by Field (SED) (Lag1) 6.2058541 0.325246 19.08 <.0001Postdocs by Field (Lag1) 0.507894 0.016631 30.54 <.0001
Acad Discipline Group=Soc_Psych Sci Response Pubs - Fract Counts - Exp J Set Summary of Fit RSquare 0.839822RSquare Adj 0.839621Root Mean Square Error 23.63381Mean of Response 60.46792Observations (or Sum Wgts) 2387 Parameter Estimates Term Estimate Std Error t Ratio Prob>|t|Intercept 10.032338 0.669491 14.99 <.0001Acad R&D Exp-Tot by Field (Defl, Lag2) 0.0012068 0.000081 14.81 <.0001S&E PhD Recips by Field (SED) (Lag1) 1.2694131 0.023411 54.22 0.0000Postdocs by Field (Lag1) 1.0661931 0.063886 16.69 <.0001
200
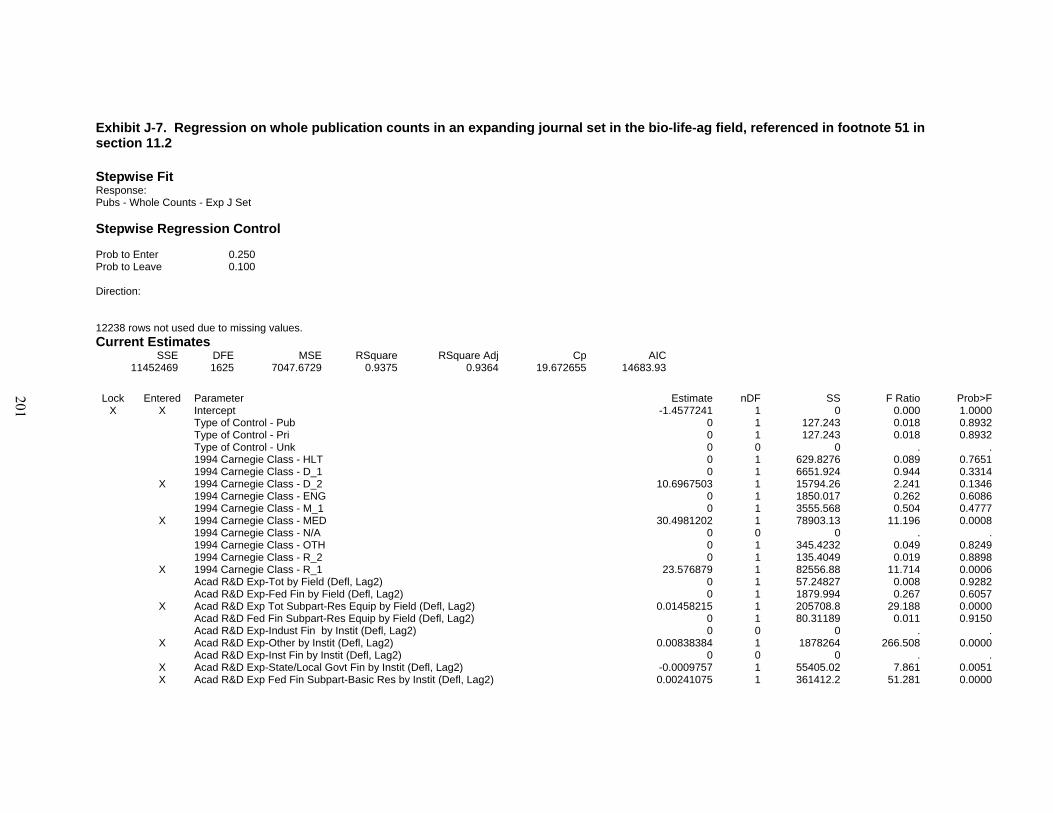
Exhibit J-7. Regression on whole publication counts in an expanding journal set in the bio-life-ag field, referenced in footnote 51 in section 11.2 Stepwise Fit Response: Pubs - Whole Counts - Exp J Set Stepwise Regression Control Prob to Enter 0.250 Prob to Leave 0.100 Direction: 12238 rows not used due to missing values. Current Estimates
SSE DFE MSE RSquare RSquare Adj Cp AIC11452469 1625 7047.6729 0.9375 0.9364 19.672655 14683.93
Lock Entered Parameter Estimate nDF SS F Ratio Prob>F
X X Intercept -1.4577241 1 0 0.000 1.0000 Type of Control - Pub 0 1 127.243 0.018 0.8932 Type of Control - Pri 0 1 127.243 0.018 0.8932 Type of Control - Unk 0 0 0 . . 1994 Carnegie Class - HLT 0 1 629.8276 0.089 0.7651 1994 Carnegie Class - D_1 0 1 6651.924 0.944 0.3314 X 1994 Carnegie Class - D_2 10.6967503 1 15794.26 2.241 0.1346 1994 Carnegie Class - ENG 0 1 1850.017 0.262 0.6086 1994 Carnegie Class - M_1 0 1 3555.568 0.504 0.4777 X 1994 Carnegie Class - MED 30.4981202 1 78903.13 11.196 0.0008 1994 Carnegie Class - N/A 0 0 0 . . 1994 Carnegie Class - OTH 0 1 345.4232 0.049 0.8249 1994 Carnegie Class - R_2 0 1 135.4049 0.019 0.8898 X 1994 Carnegie Class - R_1 23.576879 1 82556.88 11.714 0.0006 Acad R&D Exp-Tot by Field (Defl, Lag2) 0 1 57.24827 0.008 0.9282 Acad R&D Exp-Fed Fin by Field (Defl, Lag2) 0 1 1879.994 0.267 0.6057 X Acad R&D Exp Tot Subpart-Res Equip by Field (Defl, Lag2) 0.01458215 1 205708.8 29.188 0.0000 Acad R&D Fed Fin Subpart-Res Equip by Field (Defl, Lag2) 0 1 80.31189 0.011 0.9150 Acad R&D Exp-Indust Fin by Instit (Defl, Lag2) 0 0 0 . . X Acad R&D Exp-Other by Instit (Defl, Lag2) 0.00838384 1 1878264 266.508 0.0000 Acad R&D Exp-Inst Fin by Instit (Defl, Lag2) 0 0 0 . . X Acad R&D Exp-State/Local Govt Fin by Instit (Defl, Lag2) -0.0009757 1 55405.02 7.861 0.0051 X Acad R&D Exp Fed Fin Subpart-Basic Res by Instit (Defl, Lag2) 0.00241075 1 361412.2 51.281 0.0000
201
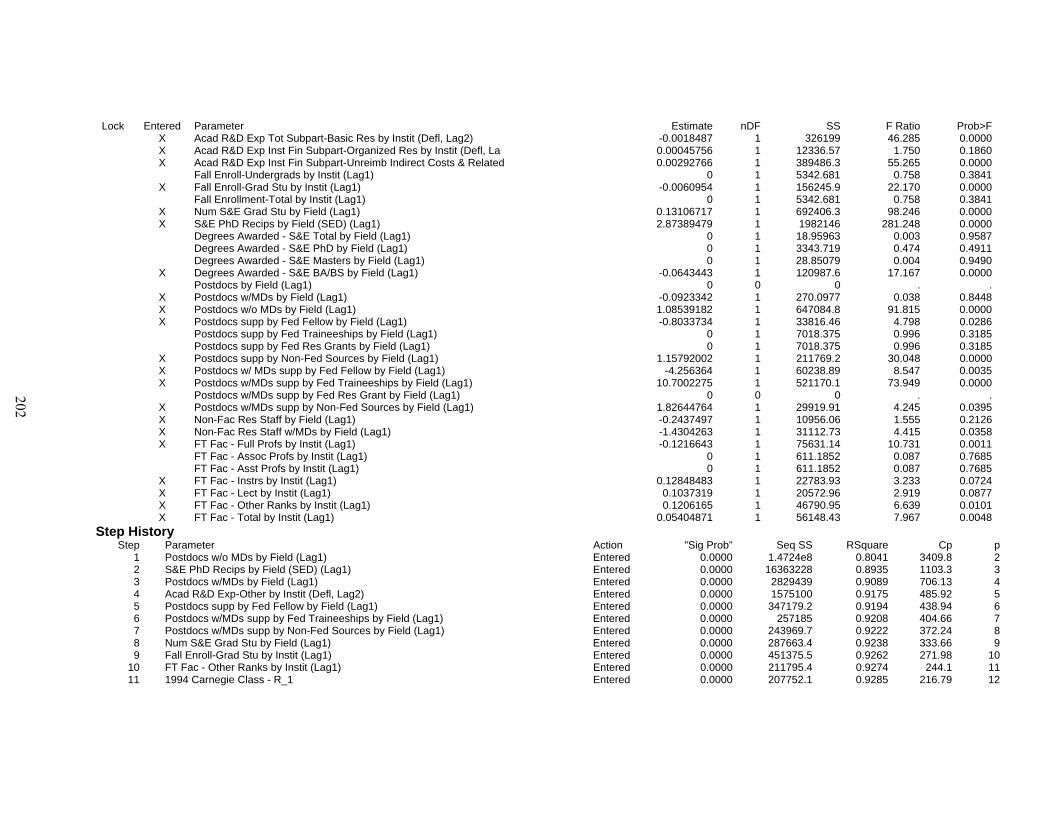
Lock Entered Parameter Estimate nDF SS F Ratio Prob>F X Acad R&D Exp Tot Subpart-Basic Res by Instit (Defl, Lag2) -0.0018487 1 326199 46.285 0.0000 X Acad R&D Exp Inst Fin Subpart-Organized Res by Instit (Defl, La 0.00045756 1 12336.57 1.750 0.1860 X Acad R&D Exp Inst Fin Subpart-Unreimb Indirect Costs & Related 0.00292766 1 389486.3 55.265 0.0000 Fall Enroll-Undergrads by Instit (Lag1) 0 1 5342.681 0.758 0.3841 X Fall Enroll-Grad Stu by Instit (Lag1) -0.0060954 1 156245.9 22.170 0.0000 Fall Enrollment-Total by Instit (Lag1) 0 1 5342.681 0.758 0.3841 X Num S&E Grad Stu by Field (Lag1) 0.13106717 1 692406.3 98.246 0.0000 X S&E PhD Recips by Field (SED) (Lag1) 2.87389479 1 1982146 281.248 0.0000 Degrees Awarded - S&E Total by Field (Lag1) 0 1 18.95963 0.003 0.9587 Degrees Awarded - S&E PhD by Field (Lag1) 0 1 3343.719 0.474 0.4911 Degrees Awarded - S&E Masters by Field (Lag1) 0 1 28.85079 0.004 0.9490 X Degrees Awarded - S&E BA/BS by Field (Lag1) -0.0643443 1 120987.6 17.167 0.0000 Postdocs by Field (Lag1) 0 0 0 . . X Postdocs w/MDs by Field (Lag1) -0.0923342 1 270.0977 0.038 0.8448 X Postdocs w/o MDs by Field (Lag1) 1.08539182 1 647084.8 91.815 0.0000 X Postdocs supp by Fed Fellow by Field (Lag1) -0.8033734 1 33816.46 4.798 0.0286 Postdocs supp by Fed Traineeships by Field (Lag1) 0 1 7018.375 0.996 0.3185 Postdocs supp by Fed Res Grants by Field (Lag1) 0 1 7018.375 0.996 0.3185 X Postdocs supp by Non-Fed Sources by Field (Lag1) 1.15792002 1 211769.2 30.048 0.0000 X Postdocs w/ MDs supp by Fed Fellow by Field (Lag1) -4.256364 1 60238.89 8.547 0.0035 X Postdocs w/MDs supp by Fed Traineeships by Field (Lag1) 10.7002275 1 521170.1 73.949 0.0000 Postdocs w/MDs supp by Fed Res Grant by Field (Lag1) 0 0 0 . . X Postdocs w/MDs supp by Non-Fed Sources by Field (Lag1) 1.82644764 1 29919.91 4.245 0.0395 X Non-Fac Res Staff by Field (Lag1) -0.2437497 1 10956.06 1.555 0.2126 X Non-Fac Res Staff w/MDs by Field (Lag1) -1.4304263 1 31112.73 4.415 0.0358 X FT Fac - Full Profs by Instit (Lag1) -0.1216643 1 75631.14 10.731 0.0011 FT Fac - Assoc Profs by Instit (Lag1) 0 1 611.1852 0.087 0.7685 FT Fac - Asst Profs by Instit (Lag1) 0 1 611.1852 0.087 0.7685 X FT Fac - Instrs by Instit (Lag1) 0.12848483 1 22783.93 3.233 0.0724 X FT Fac - Lect by Instit (Lag1) 0.1037319 1 20572.96 2.919 0.0877 X FT Fac - Other Ranks by Instit (Lag1) 0.1206165 1 46790.95 6.639 0.0101 X FT Fac - Total by Instit (Lag1) 0.05404871 1 56148.43 7.967 0.0048
Step History Step Parameter Action "Sig Prob" Seq SS RSquare Cp p
1 Postdocs w/o MDs by Field (Lag1) Entered 0.0000 1.4724e8 0.8041 3409.8 2 2 S&E PhD Recips by Field (SED) (Lag1) Entered 0.0000 16363228 0.8935 1103.3 3 3 Postdocs w/MDs by Field (Lag1) Entered 0.0000 2829439 0.9089 706.13 4 4 Acad R&D Exp-Other by Instit (Defl, Lag2) Entered 0.0000 1575100 0.9175 485.92 5 5 Postdocs supp by Fed Fellow by Field (Lag1) Entered 0.0000 347179.2 0.9194 438.94 6 6 Postdocs w/MDs supp by Fed Traineeships by Field (Lag1) Entered 0.0000 257185 0.9208 404.66 7 7 Postdocs w/MDs supp by Non-Fed Sources by Field (Lag1) Entered 0.0000 243969.7 0.9222 372.24 8 8 Num S&E Grad Stu by Field (Lag1) Entered 0.0000 287663.4 0.9238 333.66 9 9 Fall Enroll-Grad Stu by Instit (Lag1) Entered 0.0000 451375.5 0.9262 271.98 10
10 FT Fac - Other Ranks by Instit (Lag1) Entered 0.0000 211795.4 0.9274 244.1 11 11 1994 Carnegie Class - R_1 Entered 0.0000 207752.1 0.9285 216.79 12
202
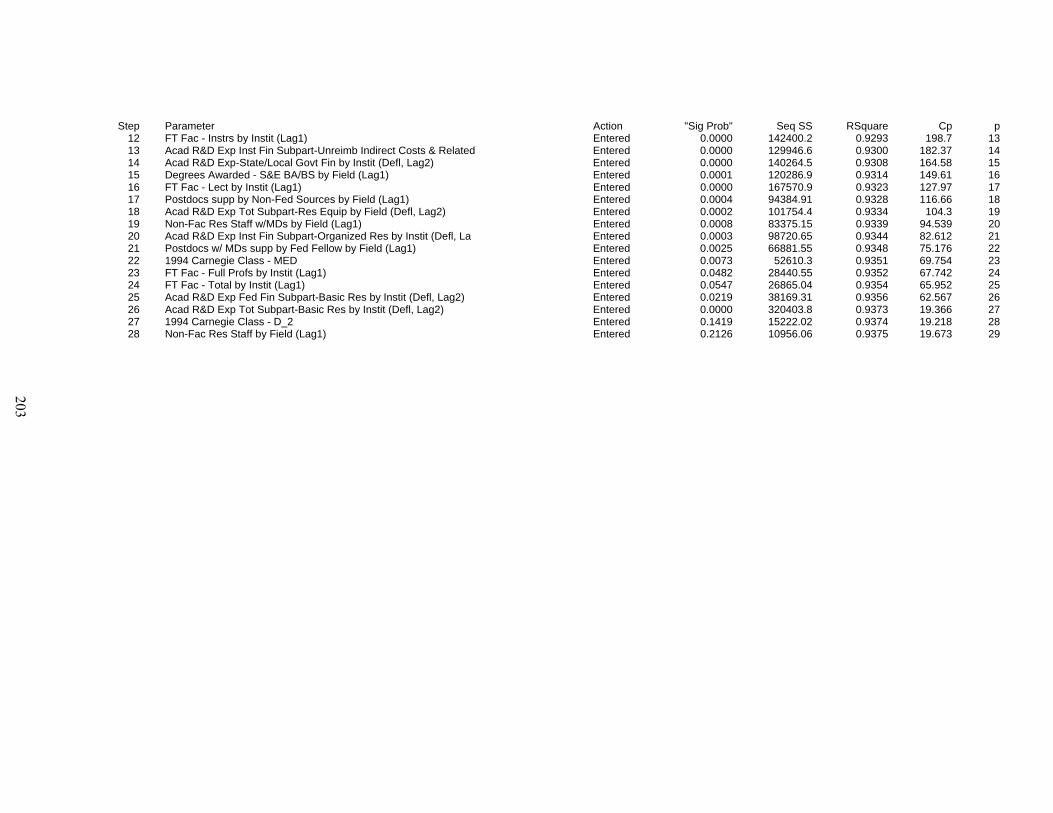
Step Parameter Action "Sig Prob" Seq SS RSquare Cp p 12 FT Fac - Instrs by Instit (Lag1) Entered 0.0000 142400.2 0.9293 198.7 13 13 Acad R&D Exp Inst Fin Subpart-Unreimb Indirect Costs & Related Entered 0.0000 129946.6 0.9300 182.37 14 14 Acad R&D Exp-State/Local Govt Fin by Instit (Defl, Lag2) Entered 0.0000 140264.5 0.9308 164.58 15 15 Degrees Awarded - S&E BA/BS by Field (Lag1) Entered 0.0001 120286.9 0.9314 149.61 16 16 FT Fac - Lect by Instit (Lag1) Entered 0.0000 167570.9 0.9323 127.97 17 17 Postdocs supp by Non-Fed Sources by Field (Lag1) Entered 0.0004 94384.91 0.9328 116.66 18 18 Acad R&D Exp Tot Subpart-Res Equip by Field (Defl, Lag2) Entered 0.0002 101754.4 0.9334 104.3 19 19 Non-Fac Res Staff w/MDs by Field (Lag1) Entered 0.0008 83375.15 0.9339 94.539 20 20 Acad R&D Exp Inst Fin Subpart-Organized Res by Instit (Defl, La Entered 0.0003 98720.65 0.9344 82.612 21 21 Postdocs w/ MDs supp by Fed Fellow by Field (Lag1) Entered 0.0025 66881.55 0.9348 75.176 22 22 1994 Carnegie Class - MED Entered 0.0073 52610.3 0.9351 69.754 23 23 FT Fac - Full Profs by Instit (Lag1) Entered 0.0482 28440.55 0.9352 67.742 24 24 FT Fac - Total by Instit (Lag1) Entered 0.0547 26865.04 0.9354 65.952 25 25 Acad R&D Exp Fed Fin Subpart-Basic Res by Instit (Defl, Lag2) Entered 0.0219 38169.31 0.9356 62.567 26 26 Acad R&D Exp Tot Subpart-Basic Res by Instit (Defl, Lag2) Entered 0.0000 320403.8 0.9373 19.366 27 27 1994 Carnegie Class - D_2 Entered 0.1419 15222.02 0.9374 19.218 28 28 Non-Fac Res Staff by Field (Lag1) Entered 0.2126 10956.06 0.9375 19.673 29
203

Exhibit J-8. Regression on whole publication counts in an expanding journal set in the computer science field, referenced in footnote 52 in section 11.2 Stepwise Fit Response: Pubs - Whole Counts - Exp J Set Stepwise Regression Control Prob to Enter 0.250 Prob to Leave 0.100 Current Estimates
SSE DFE MSE RSquare RSquare Adj Cp AIC59715.971 1611 37.067642 0.7868 0.7836 18.279977 5935.257
Lock Entered Parameter Estimate nDF SS F Ratio Prob>F
X X Intercept 1.29152621 1 0 0.000 1.0000 Type of Control - Pub 0 1 46.57881 1.257 0.2624 Type of Control - Pri 0 1 46.57881 1.257 0.2624 Type of Control - Unk 0 0 0 . . 1994 Carnegie Class - HLT 0 1 15.71599 0.424 0.5151 1994 Carnegie Class - D_1 0 1 0.654696 0.018 0.8943 X 1994 Carnegie Class - D_2 -1.3185308 1 237.6326 6.411 0.0114 1994 Carnegie Class - ENG 0 1 38.58017 1.041 0.3078 1994 Carnegie Class - M_1 0 1 0.076962 0.002 0.9637 X 1994 Carnegie Class - MED -2.6245342 1 577.3591 15.576 0.0001 1994 Carnegie Class - N/A 0 0 0 . . X 1994 Carnegie Class - OTH 5.74203398 1 256.8731 6.930 0.0086 1994 Carnegie Class - R_2 0 1 4.551771 0.123 0.7261 X 1994 Carnegie Class - R_1 0.69685262 1 80.50057 2.172 0.1408 X Acad R&D Exp-Tot by Field (Defl, Lag2) 0.00078307 1 7345.194 198.156 0.0000 Acad R&D Exp-Fed Fin by Field (Defl, Lag2) 0 1 1.297511 0.035 0.8517 X Acad R&D Exp Tot Subpart-Res Equip by Field (Defl, Lag2) -0.000891 1 273.5033 7.378 0.0067 Acad R&D Fed Fin Subpart-Res Equip by Field (Defl, Lag2) 0 1 8.133261 0.219 0.6396 X Acad R&D Exp-Indust Fin by Instit (Defl, Lag2) -0.0000581 1 249.0253 6.718 0.0096 X Acad R&D Exp-Other by Instit (Defl, Lag2) -0.0001814 1 1278.032 34.478 0.0000 Acad R&D Exp-Inst Fin by Instit (Defl, Lag2) 0 0 0 . . Acad R&D Exp-State/Local Govt Fin by Instit (Defl, Lag2) 0 1 8.901763 0.240 0.6242 X Acad R&D Exp Fed Fin Subpart-Basic Res by Instit (Defl, Lag2) -0.0000884 1 610.3231 16.465 0.0001 X Acad R&D Exp Tot Subpart-Basic Res by Instit (Defl, Lag2) 0.00012118 1 1740.507 46.955 0.0000 Acad R&D Exp Inst Fin Subpart-Organized Res by Instit (Defl, La 0 0 0 . . X Acad R&D Exp Inst Fin Subpart-Unreimb Indirect Costs & Related 0.00012253 1 433.3395 11.691 0.0006 Fall Enroll-Undergrads by Instit (Lag1) 0 1 37.41479 1.009 0.3152
204
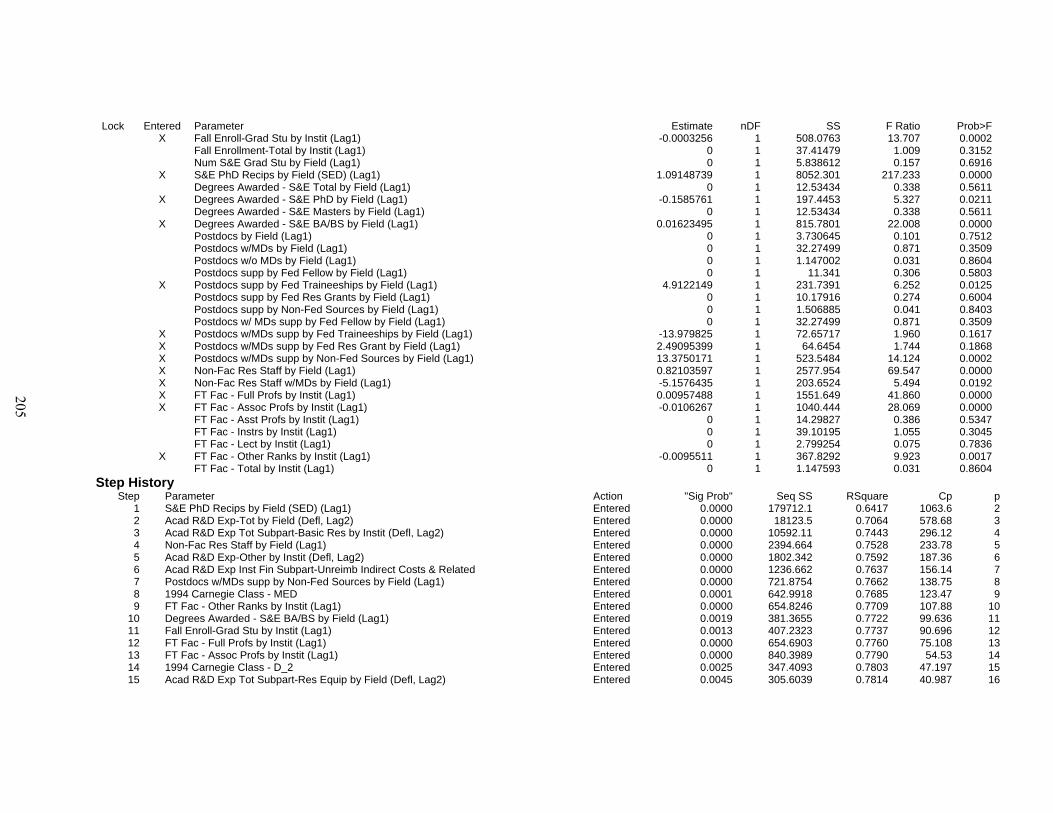
Lock Entered Parameter Estimate nDF SS F Ratio Prob>F X Fall Enroll-Grad Stu by Instit (Lag1) -0.0003256 1 508.0763 13.707 0.0002 Fall Enrollment-Total by Instit (Lag1) 0 1 37.41479 1.009 0.3152 Num S&E Grad Stu by Field (Lag1) 0 1 5.838612 0.157 0.6916 X S&E PhD Recips by Field (SED) (Lag1) 1.09148739 1 8052.301 217.233 0.0000 Degrees Awarded - S&E Total by Field (Lag1) 0 1 12.53434 0.338 0.5611 X Degrees Awarded - S&E PhD by Field (Lag1) -0.1585761 1 197.4453 5.327 0.0211 Degrees Awarded - S&E Masters by Field (Lag1) 0 1 12.53434 0.338 0.5611 X Degrees Awarded - S&E BA/BS by Field (Lag1) 0.01623495 1 815.7801 22.008 0.0000 Postdocs by Field (Lag1) 0 1 3.730645 0.101 0.7512 Postdocs w/MDs by Field (Lag1) 0 1 32.27499 0.871 0.3509 Postdocs w/o MDs by Field (Lag1) 0 1 1.147002 0.031 0.8604 Postdocs supp by Fed Fellow by Field (Lag1) 0 1 11.341 0.306 0.5803 X Postdocs supp by Fed Traineeships by Field (Lag1) 4.9122149 1 231.7391 6.252 0.0125 Postdocs supp by Fed Res Grants by Field (Lag1) 0 1 10.17916 0.274 0.6004 Postdocs supp by Non-Fed Sources by Field (Lag1) 0 1 1.506885 0.041 0.8403 Postdocs w/ MDs supp by Fed Fellow by Field (Lag1) 0 1 32.27499 0.871 0.3509 X Postdocs w/MDs supp by Fed Traineeships by Field (Lag1) -13.979825 1 72.65717 1.960 0.1617 X Postdocs w/MDs supp by Fed Res Grant by Field (Lag1) 2.49095399 1 64.6454 1.744 0.1868 X Postdocs w/MDs supp by Non-Fed Sources by Field (Lag1) 13.3750171 1 523.5484 14.124 0.0002 X Non-Fac Res Staff by Field (Lag1) 0.82103597 1 2577.954 69.547 0.0000 X Non-Fac Res Staff w/MDs by Field (Lag1) -5.1576435 1 203.6524 5.494 0.0192 X FT Fac - Full Profs by Instit (Lag1) 0.00957488 1 1551.649 41.860 0.0000 X FT Fac - Assoc Profs by Instit (Lag1) -0.0106267 1 1040.444 28.069 0.0000 FT Fac - Asst Profs by Instit (Lag1) 0 1 14.29827 0.386 0.5347 FT Fac - Instrs by Instit (Lag1) 0 1 39.10195 1.055 0.3045 FT Fac - Lect by Instit (Lag1) 0 1 2.799254 0.075 0.7836 X FT Fac - Other Ranks by Instit (Lag1) -0.0095511 1 367.8292 9.923 0.0017 FT Fac - Total by Instit (Lag1) 0 1 1.147593 0.031 0.8604
Step History Step Parameter Action "Sig Prob" Seq SS RSquare Cp p
1 S&E PhD Recips by Field (SED) (Lag1) Entered 0.0000 179712.1 0.6417 1063.6 2 2 Acad R&D Exp-Tot by Field (Defl, Lag2) Entered 0.0000 18123.5 0.7064 578.68 3 3 Acad R&D Exp Tot Subpart-Basic Res by Instit (Defl, Lag2) Entered 0.0000 10592.11 0.7443 296.12 4 4 Non-Fac Res Staff by Field (Lag1) Entered 0.0000 2394.664 0.7528 233.78 5 5 Acad R&D Exp-Other by Instit (Defl, Lag2) Entered 0.0000 1802.342 0.7592 187.36 6 6 Acad R&D Exp Inst Fin Subpart-Unreimb Indirect Costs & Related Entered 0.0000 1236.662 0.7637 156.14 7 7 Postdocs w/MDs supp by Non-Fed Sources by Field (Lag1) Entered 0.0000 721.8754 0.7662 138.75 8 8 1994 Carnegie Class - MED Entered 0.0001 642.9918 0.7685 123.47 9 9 FT Fac - Other Ranks by Instit (Lag1) Entered 0.0000 654.8246 0.7709 107.88 10
10 Degrees Awarded - S&E BA/BS by Field (Lag1) Entered 0.0019 381.3655 0.7722 99.636 11 11 Fall Enroll-Grad Stu by Instit (Lag1) Entered 0.0013 407.2323 0.7737 90.696 12 12 FT Fac - Full Profs by Instit (Lag1) Entered 0.0000 654.6903 0.7760 75.108 13 13 FT Fac - Assoc Profs by Instit (Lag1) Entered 0.0000 840.3989 0.7790 54.53 14 14 1994 Carnegie Class - D_2 Entered 0.0025 347.4093 0.7803 47.197 15 15 Acad R&D Exp Tot Subpart-Res Equip by Field (Defl, Lag2) Entered 0.0045 305.6039 0.7814 40.987 16
205
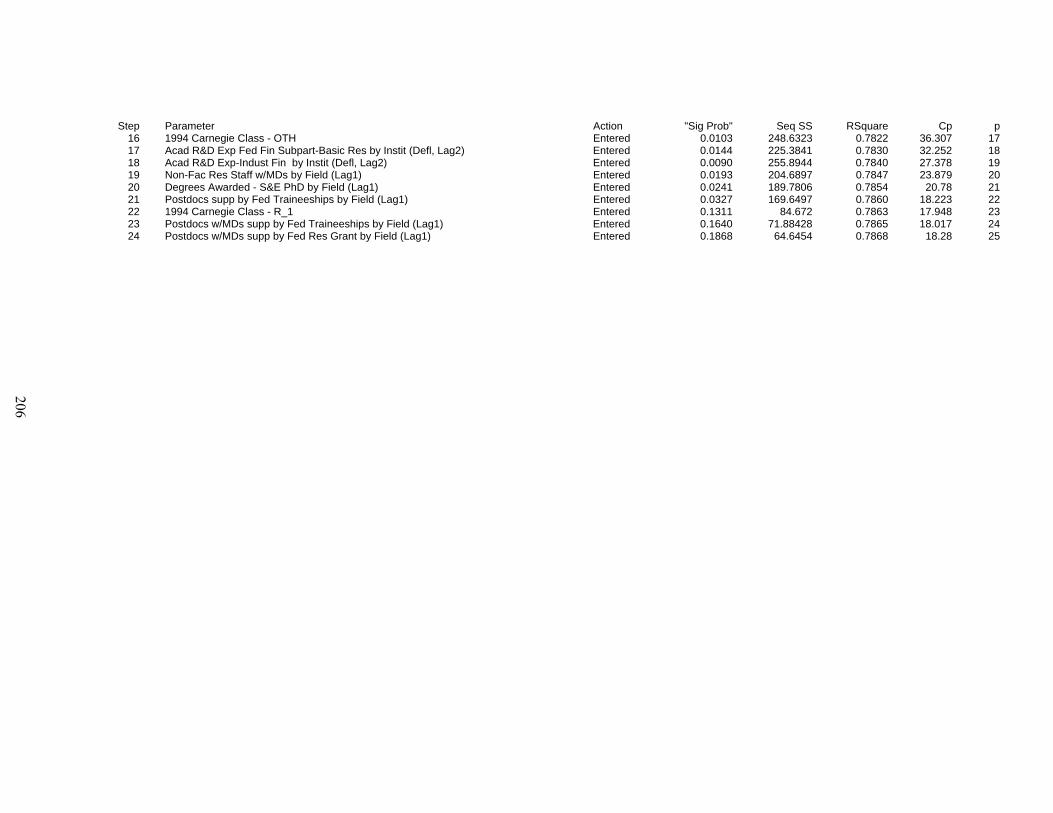
Step Parameter Action "Sig Prob" Seq SS RSquare Cp p 16 1994 Carnegie Class - OTH Entered 0.0103 248.6323 0.7822 36.307 17 17 Acad R&D Exp Fed Fin Subpart-Basic Res by Instit (Defl, Lag2) Entered 0.0144 225.3841 0.7830 32.252 18 18 Acad R&D Exp-Indust Fin by Instit (Defl, Lag2) Entered 0.0090 255.8944 0.7840 27.378 19 19 Non-Fac Res Staff w/MDs by Field (Lag1) Entered 0.0193 204.6897 0.7847 23.879 20 20 Degrees Awarded - S&E PhD by Field (Lag1) Entered 0.0241 189.7806 0.7854 20.78 21 21 Postdocs supp by Fed Traineeships by Field (Lag1) Entered 0.0327 169.6497 0.7860 18.223 22 22 1994 Carnegie Class - R_1 Entered 0.1311 84.672 0.7863 17.948 23 23 Postdocs w/MDs supp by Fed Traineeships by Field (Lag1) Entered 0.1640 71.88428 0.7865 18.017 24 24 Postdocs w/MDs supp by Fed Res Grant by Field (Lag1) Entered 0.1868 64.6454 0.7868 18.28 25
206
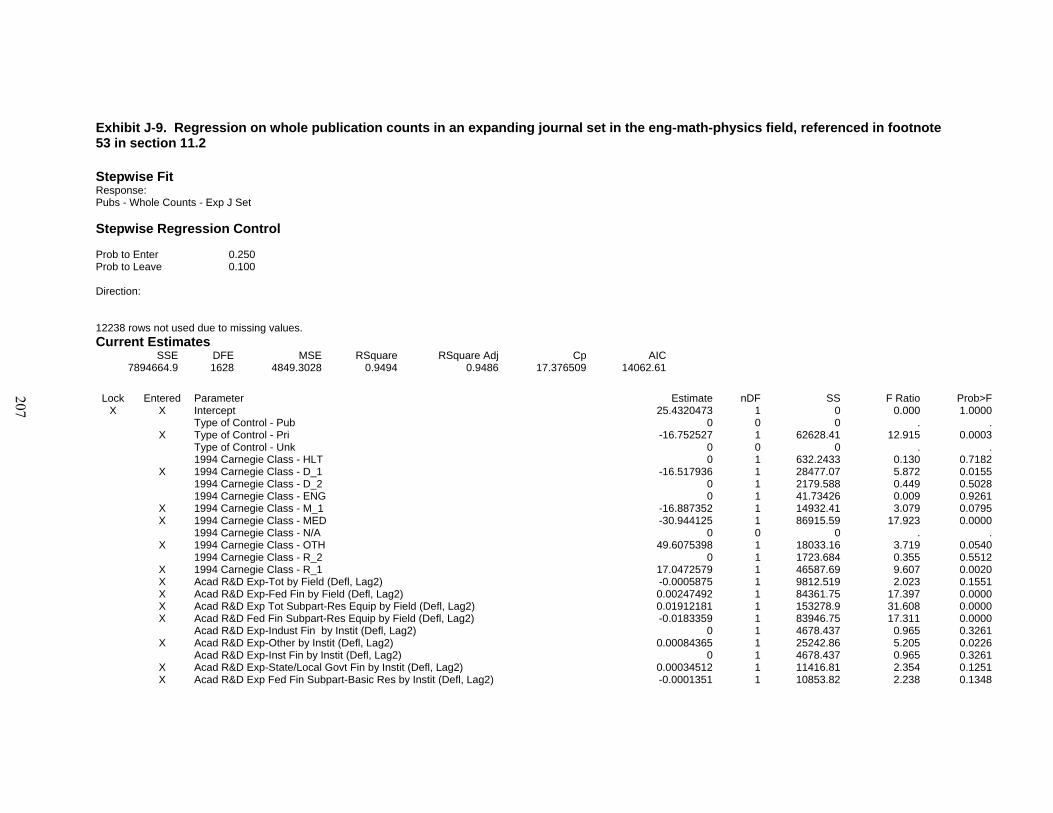
Exhibit J-9. Regression on whole publication counts in an expanding journal set in the eng-math-physics field, referenced in footnote 53 in section 11.2 Stepwise Fit Response: Pubs - Whole Counts - Exp J Set Stepwise Regression Control Prob to Enter 0.250 Prob to Leave 0.100 Direction: 12238 rows not used due to missing values. Current Estimates
SSE DFE MSE RSquare RSquare Adj Cp AIC7894664.9 1628 4849.3028 0.9494 0.9486 17.376509 14062.61
Lock Entered Parameter Estimate nDF SS F Ratio Prob>F
X X Intercept 25.4320473 1 0 0.000 1.0000 Type of Control - Pub 0 0 0 . . X Type of Control - Pri -16.752527 1 62628.41 12.915 0.0003 Type of Control - Unk 0 0 0 . . 1994 Carnegie Class - HLT 0 1 632.2433 0.130 0.7182 X 1994 Carnegie Class - D_1 -16.517936 1 28477.07 5.872 0.0155 1994 Carnegie Class - D_2 0 1 2179.588 0.449 0.5028 1994 Carnegie Class - ENG 0 1 41.73426 0.009 0.9261 X 1994 Carnegie Class - M_1 -16.887352 1 14932.41 3.079 0.0795 X 1994 Carnegie Class - MED -30.944125 1 86915.59 17.923 0.0000 1994 Carnegie Class - N/A 0 0 0 . . X 1994 Carnegie Class - OTH 49.6075398 1 18033.16 3.719 0.0540 1994 Carnegie Class - R_2 0 1 1723.684 0.355 0.5512 X 1994 Carnegie Class - R_1 17.0472579 1 46587.69 9.607 0.0020 X Acad R&D Exp-Tot by Field (Defl, Lag2) -0.0005875 1 9812.519 2.023 0.1551 X Acad R&D Exp-Fed Fin by Field (Defl, Lag2) 0.00247492 1 84361.75 17.397 0.0000 X Acad R&D Exp Tot Subpart-Res Equip by Field (Defl, Lag2) 0.01912181 1 153278.9 31.608 0.0000 X Acad R&D Fed Fin Subpart-Res Equip by Field (Defl, Lag2) -0.0183359 1 83946.75 17.311 0.0000 Acad R&D Exp-Indust Fin by Instit (Defl, Lag2) 0 1 4678.437 0.965 0.3261 X Acad R&D Exp-Other by Instit (Defl, Lag2) 0.00084365 1 25242.86 5.205 0.0226 Acad R&D Exp-Inst Fin by Instit (Defl, Lag2) 0 1 4678.437 0.965 0.3261 X Acad R&D Exp-State/Local Govt Fin by Instit (Defl, Lag2) 0.00034512 1 11416.81 2.354 0.1251 X Acad R&D Exp Fed Fin Subpart-Basic Res by Instit (Defl, Lag2) -0.0001351 1 10853.82 2.238 0.1348
207
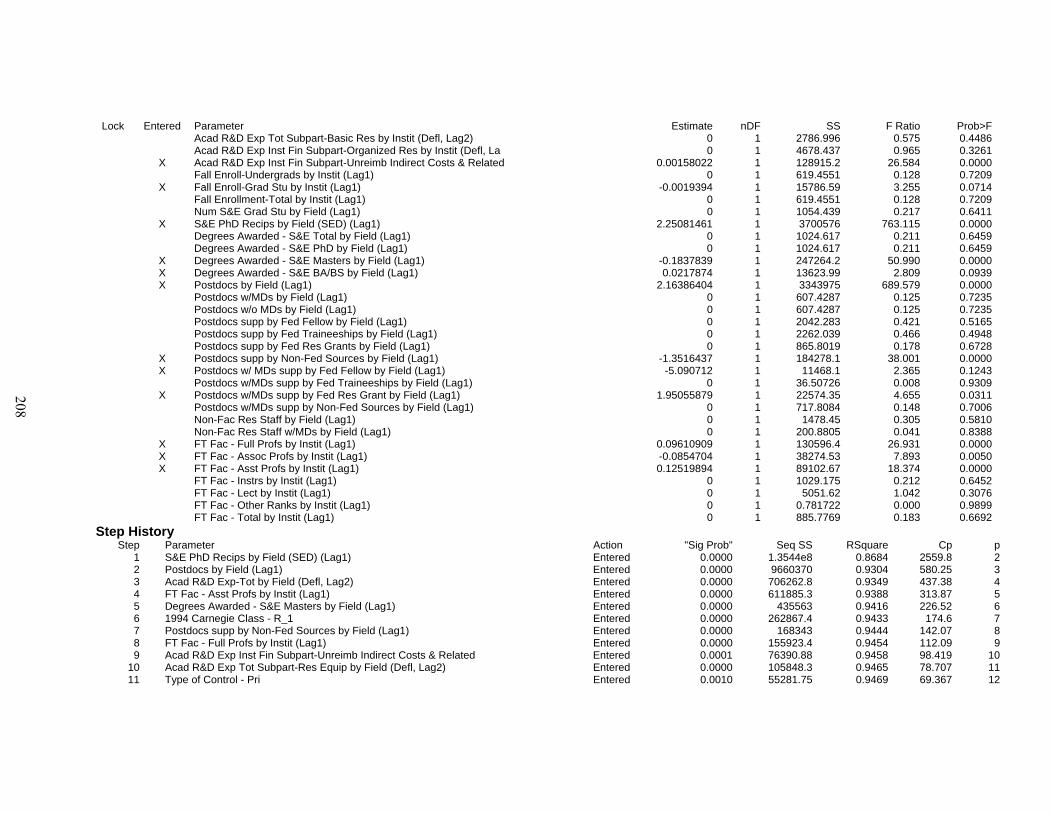
Lock Entered Parameter Estimate nDF SS F Ratio Prob>F Acad R&D Exp Tot Subpart-Basic Res by Instit (Defl, Lag2) 0 1 2786.996 0.575 0.4486 Acad R&D Exp Inst Fin Subpart-Organized Res by Instit (Defl, La 0 1 4678.437 0.965 0.3261 X Acad R&D Exp Inst Fin Subpart-Unreimb Indirect Costs & Related 0.00158022 1 128915.2 26.584 0.0000 Fall Enroll-Undergrads by Instit (Lag1) 0 1 619.4551 0.128 0.7209 X Fall Enroll-Grad Stu by Instit (Lag1) -0.0019394 1 15786.59 3.255 0.0714 Fall Enrollment-Total by Instit (Lag1) 0 1 619.4551 0.128 0.7209 Num S&E Grad Stu by Field (Lag1) 0 1 1054.439 0.217 0.6411 X S&E PhD Recips by Field (SED) (Lag1) 2.25081461 1 3700576 763.115 0.0000 Degrees Awarded - S&E Total by Field (Lag1) 0 1 1024.617 0.211 0.6459 Degrees Awarded - S&E PhD by Field (Lag1) 0 1 1024.617 0.211 0.6459 X Degrees Awarded - S&E Masters by Field (Lag1) -0.1837839 1 247264.2 50.990 0.0000 X Degrees Awarded - S&E BA/BS by Field (Lag1) 0.0217874 1 13623.99 2.809 0.0939 X Postdocs by Field (Lag1) 2.16386404 1 3343975 689.579 0.0000 Postdocs w/MDs by Field (Lag1) 0 1 607.4287 0.125 0.7235 Postdocs w/o MDs by Field (Lag1) 0 1 607.4287 0.125 0.7235 Postdocs supp by Fed Fellow by Field (Lag1) 0 1 2042.283 0.421 0.5165 Postdocs supp by Fed Traineeships by Field (Lag1) 0 1 2262.039 0.466 0.4948 Postdocs supp by Fed Res Grants by Field (Lag1) 0 1 865.8019 0.178 0.6728 X Postdocs supp by Non-Fed Sources by Field (Lag1) -1.3516437 1 184278.1 38.001 0.0000 X Postdocs w/ MDs supp by Fed Fellow by Field (Lag1) -5.090712 1 11468.1 2.365 0.1243 Postdocs w/MDs supp by Fed Traineeships by Field (Lag1) 0 1 36.50726 0.008 0.9309 X Postdocs w/MDs supp by Fed Res Grant by Field (Lag1) 1.95055879 1 22574.35 4.655 0.0311 Postdocs w/MDs supp by Non-Fed Sources by Field (Lag1) 0 1 717.8084 0.148 0.7006 Non-Fac Res Staff by Field (Lag1) 0 1 1478.45 0.305 0.5810 Non-Fac Res Staff w/MDs by Field (Lag1) 0 1 200.8805 0.041 0.8388 X FT Fac - Full Profs by Instit (Lag1) 0.09610909 1 130596.4 26.931 0.0000 X FT Fac - Assoc Profs by Instit (Lag1) -0.0854704 1 38274.53 7.893 0.0050 X FT Fac - Asst Profs by Instit (Lag1) 0.12519894 1 89102.67 18.374 0.0000 FT Fac - Instrs by Instit (Lag1) 0 1 1029.175 0.212 0.6452 FT Fac - Lect by Instit (Lag1) 0 1 5051.62 1.042 0.3076 FT Fac - Other Ranks by Instit (Lag1) 0 1 0.781722 0.000 0.9899 FT Fac - Total by Instit (Lag1) 0 1 885.7769 0.183 0.6692
Step History Step Parameter Action "Sig Prob" Seq SS RSquare Cp p
1 S&E PhD Recips by Field (SED) (Lag1) Entered 0.0000 1.3544e8 0.8684 2559.8 2 2 Postdocs by Field (Lag1) Entered 0.0000 9660370 0.9304 580.25 3 3 Acad R&D Exp-Tot by Field (Defl, Lag2) Entered 0.0000 706262.8 0.9349 437.38 4 4 FT Fac - Asst Profs by Instit (Lag1) Entered 0.0000 611885.3 0.9388 313.87 5 5 Degrees Awarded - S&E Masters by Field (Lag1) Entered 0.0000 435563 0.9416 226.52 6 6 1994 Carnegie Class - R_1 Entered 0.0000 262867.4 0.9433 174.6 7 7 Postdocs supp by Non-Fed Sources by Field (Lag1) Entered 0.0000 168343 0.9444 142.07 8 8 FT Fac - Full Profs by Instit (Lag1) Entered 0.0000 155923.4 0.9454 112.09 9 9 Acad R&D Exp Inst Fin Subpart-Unreimb Indirect Costs & Related Entered 0.0001 76390.88 0.9458 98.419 10
10 Acad R&D Exp Tot Subpart-Res Equip by Field (Defl, Lag2) Entered 0.0000 105848.3 0.9465 78.707 11 11 Type of Control - Pri Entered 0.0010 55281.75 0.9469 69.367 12
208
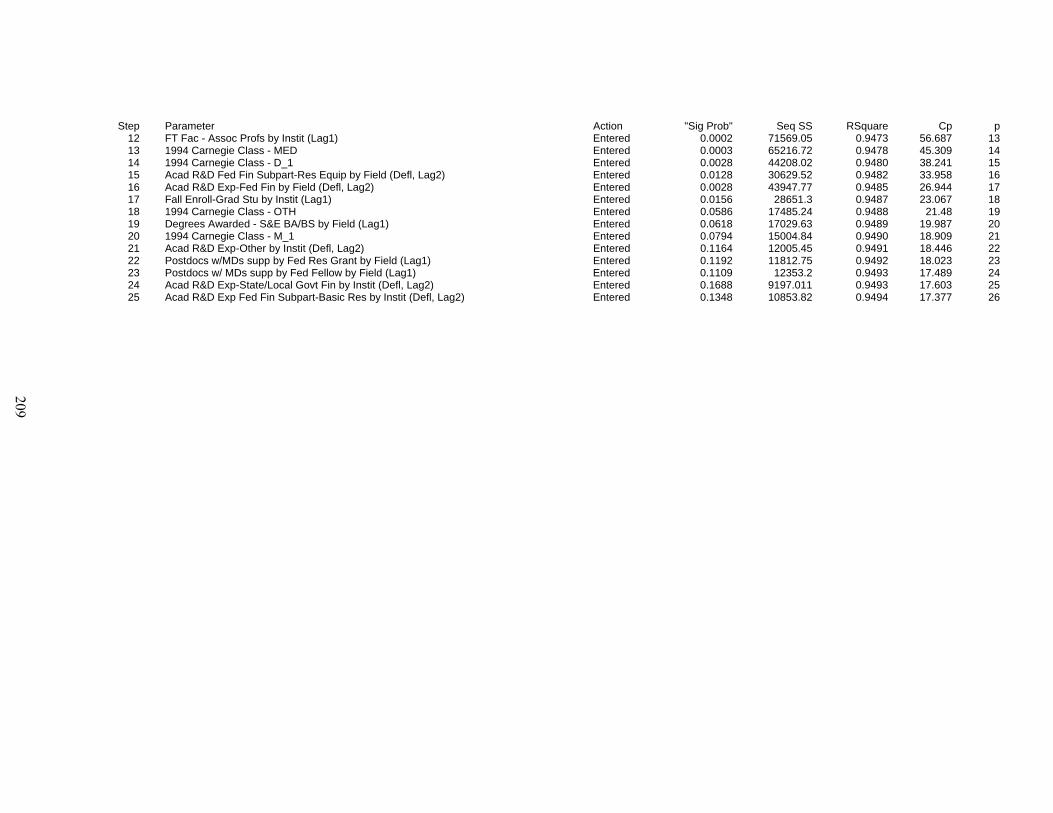
Step Parameter Action "Sig Prob" Seq SS RSquare Cp p 12 FT Fac - Assoc Profs by Instit (Lag1) Entered 0.0002 71569.05 0.9473 56.687 13 13 1994 Carnegie Class - MED Entered 0.0003 65216.72 0.9478 45.309 14 14 1994 Carnegie Class - D_1 Entered 0.0028 44208.02 0.9480 38.241 15 15 Acad R&D Fed Fin Subpart-Res Equip by Field (Defl, Lag2) Entered 0.0128 30629.52 0.9482 33.958 16 16 Acad R&D Exp-Fed Fin by Field (Defl, Lag2) Entered 0.0028 43947.77 0.9485 26.944 17 17 Fall Enroll-Grad Stu by Instit (Lag1) Entered 0.0156 28651.3 0.9487 23.067 18 18 1994 Carnegie Class - OTH Entered 0.0586 17485.24 0.9488 21.48 19 19 Degrees Awarded - S&E BA/BS by Field (Lag1) Entered 0.0618 17029.63 0.9489 19.987 20 20 1994 Carnegie Class - M_1 Entered 0.0794 15004.84 0.9490 18.909 21 21 Acad R&D Exp-Other by Instit (Defl, Lag2) Entered 0.1164 12005.45 0.9491 18.446 22 22 Postdocs w/MDs supp by Fed Res Grant by Field (Lag1) Entered 0.1192 11812.75 0.9492 18.023 23 23 Postdocs w/ MDs supp by Fed Fellow by Field (Lag1) Entered 0.1109 12353.2 0.9493 17.489 24 24 Acad R&D Exp-State/Local Govt Fin by Instit (Defl, Lag2) Entered 0.1688 9197.011 0.9493 17.603 25 25 Acad R&D Exp Fed Fin Subpart-Basic Res by Instit (Defl, Lag2) Entered 0.1348 10853.82 0.9494 17.377 26
209
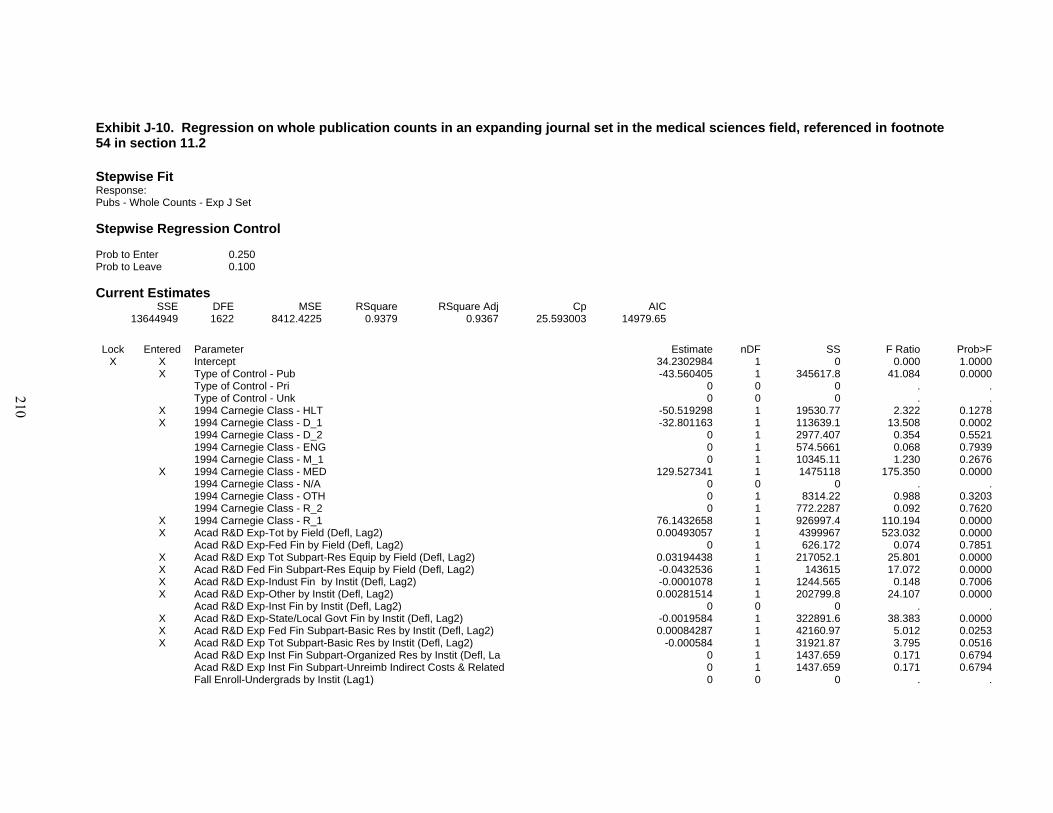
Exhibit J-10. Regression on whole publication counts in an expanding journal set in the medical sciences field, referenced in footnote 54 in section 11.2 Stepwise Fit Response: Pubs - Whole Counts - Exp J Set Stepwise Regression Control Prob to Enter 0.250 Prob to Leave 0.100 Current Estimates
SSE DFE MSE RSquare RSquare Adj Cp AIC13644949 1622 8412.4225 0.9379 0.9367 25.593003 14979.65
Lock Entered Parameter Estimate nDF SS F Ratio Prob>F
X X Intercept 34.2302984 1 0 0.000 1.0000 X Type of Control - Pub -43.560405 1 345617.8 41.084 0.0000 Type of Control - Pri 0 0 0 . . Type of Control - Unk 0 0 0 . . X 1994 Carnegie Class - HLT -50.519298 1 19530.77 2.322 0.1278 X 1994 Carnegie Class - D_1 -32.801163 1 113639.1 13.508 0.0002 1994 Carnegie Class - D_2 0 1 2977.407 0.354 0.5521 1994 Carnegie Class - ENG 0 1 574.5661 0.068 0.7939 1994 Carnegie Class - M_1 0 1 10345.11 1.230 0.2676 X 1994 Carnegie Class - MED 129.527341 1 1475118 175.350 0.0000 1994 Carnegie Class - N/A 0 0 0 . . 1994 Carnegie Class - OTH 0 1 8314.22 0.988 0.3203 1994 Carnegie Class - R_2 0 1 772.2287 0.092 0.7620 X 1994 Carnegie Class - R_1 76.1432658 1 926997.4 110.194 0.0000 X Acad R&D Exp-Tot by Field (Defl, Lag2) 0.00493057 1 4399967 523.032 0.0000 Acad R&D Exp-Fed Fin by Field (Defl, Lag2) 0 1 626.172 0.074 0.7851 X Acad R&D Exp Tot Subpart-Res Equip by Field (Defl, Lag2) 0.03194438 1 217052.1 25.801 0.0000 X Acad R&D Fed Fin Subpart-Res Equip by Field (Defl, Lag2) -0.0432536 1 143615 17.072 0.0000 X Acad R&D Exp-Indust Fin by Instit (Defl, Lag2) -0.0001078 1 1244.565 0.148 0.7006 X Acad R&D Exp-Other by Instit (Defl, Lag2) 0.00281514 1 202799.8 24.107 0.0000 Acad R&D Exp-Inst Fin by Instit (Defl, Lag2) 0 0 0 . . X Acad R&D Exp-State/Local Govt Fin by Instit (Defl, Lag2) -0.0019584 1 322891.6 38.383 0.0000 X Acad R&D Exp Fed Fin Subpart-Basic Res by Instit (Defl, Lag2) 0.00084287 1 42160.97 5.012 0.0253 X Acad R&D Exp Tot Subpart-Basic Res by Instit (Defl, Lag2) -0.000584 1 31921.87 3.795 0.0516 Acad R&D Exp Inst Fin Subpart-Organized Res by Instit (Defl, La 0 1 1437.659 0.171 0.6794 Acad R&D Exp Inst Fin Subpart-Unreimb Indirect Costs & Related 0 1 1437.659 0.171 0.6794 Fall Enroll-Undergrads by Instit (Lag1) 0 0 0 . .
210
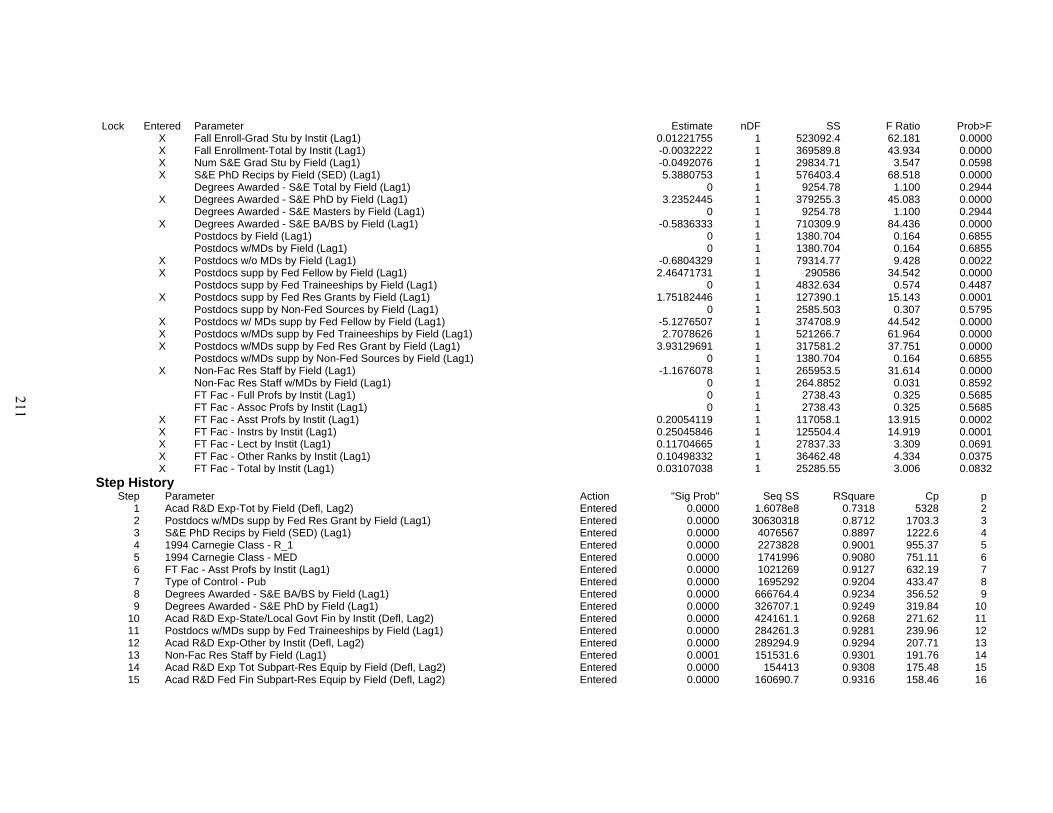
Lock Entered Parameter Estimate nDF SS F Ratio Prob>F X Fall Enroll-Grad Stu by Instit (Lag1) 0.01221755 1 523092.4 62.181 0.0000 X Fall Enrollment-Total by Instit (Lag1) -0.0032222 1 369589.8 43.934 0.0000 X Num S&E Grad Stu by Field (Lag1) -0.0492076 1 29834.71 3.547 0.0598 X S&E PhD Recips by Field (SED) (Lag1) 5.3880753 1 576403.4 68.518 0.0000 Degrees Awarded - S&E Total by Field (Lag1) 0 1 9254.78 1.100 0.2944 X Degrees Awarded - S&E PhD by Field (Lag1) 3.2352445 1 379255.3 45.083 0.0000 Degrees Awarded - S&E Masters by Field (Lag1) 0 1 9254.78 1.100 0.2944 X Degrees Awarded - S&E BA/BS by Field (Lag1) -0.5836333 1 710309.9 84.436 0.0000 Postdocs by Field (Lag1) 0 1 1380.704 0.164 0.6855 Postdocs w/MDs by Field (Lag1) 0 1 1380.704 0.164 0.6855 X Postdocs w/o MDs by Field (Lag1) -0.6804329 1 79314.77 9.428 0.0022 X Postdocs supp by Fed Fellow by Field (Lag1) 2.46471731 1 290586 34.542 0.0000 Postdocs supp by Fed Traineeships by Field (Lag1) 0 1 4832.634 0.574 0.4487 X Postdocs supp by Fed Res Grants by Field (Lag1) 1.75182446 1 127390.1 15.143 0.0001 Postdocs supp by Non-Fed Sources by Field (Lag1) 0 1 2585.503 0.307 0.5795 X Postdocs w/ MDs supp by Fed Fellow by Field (Lag1) -5.1276507 1 374708.9 44.542 0.0000 X Postdocs w/MDs supp by Fed Traineeships by Field (Lag1) 2.7078626 1 521266.7 61.964 0.0000 X Postdocs w/MDs supp by Fed Res Grant by Field (Lag1) 3.93129691 1 317581.2 37.751 0.0000 Postdocs w/MDs supp by Non-Fed Sources by Field (Lag1) 0 1 1380.704 0.164 0.6855 X Non-Fac Res Staff by Field (Lag1) -1.1676078 1 265953.5 31.614 0.0000 Non-Fac Res Staff w/MDs by Field (Lag1) 0 1 264.8852 0.031 0.8592 FT Fac - Full Profs by Instit (Lag1) 0 1 2738.43 0.325 0.5685 FT Fac - Assoc Profs by Instit (Lag1) 0 1 2738.43 0.325 0.5685 X FT Fac - Asst Profs by Instit (Lag1) 0.20054119 1 117058.1 13.915 0.0002 X FT Fac - Instrs by Instit (Lag1) 0.25045846 1 125504.4 14.919 0.0001 X FT Fac - Lect by Instit (Lag1) 0.11704665 1 27837.33 3.309 0.0691 X FT Fac - Other Ranks by Instit (Lag1) 0.10498332 1 36462.48 4.334 0.0375 X FT Fac - Total by Instit (Lag1) 0.03107038 1 25285.55 3.006 0.0832
Step History Step Parameter Action "Sig Prob" Seq SS RSquare Cp p
1 Acad R&D Exp-Tot by Field (Defl, Lag2) Entered 0.0000 1.6078e8 0.7318 5328 2 2 Postdocs w/MDs supp by Fed Res Grant by Field (Lag1) Entered 0.0000 30630318 0.8712 1703.3 3 3 S&E PhD Recips by Field (SED) (Lag1) Entered 0.0000 4076567 0.8897 1222.6 4 4 1994 Carnegie Class - R_1 Entered 0.0000 2273828 0.9001 955.37 5 5 1994 Carnegie Class - MED Entered 0.0000 1741996 0.9080 751.11 6 6 FT Fac - Asst Profs by Instit (Lag1) Entered 0.0000 1021269 0.9127 632.19 7 7 Type of Control - Pub Entered 0.0000 1695292 0.9204 433.47 8 8 Degrees Awarded - S&E BA/BS by Field (Lag1) Entered 0.0000 666764.4 0.9234 356.52 9 9 Degrees Awarded - S&E PhD by Field (Lag1) Entered 0.0000 326707.1 0.9249 319.84 10
10 Acad R&D Exp-State/Local Govt Fin by Instit (Defl, Lag2) Entered 0.0000 424161.1 0.9268 271.62 11 11 Postdocs w/MDs supp by Fed Traineeships by Field (Lag1) Entered 0.0000 284261.3 0.9281 239.96 12 12 Acad R&D Exp-Other by Instit (Defl, Lag2) Entered 0.0000 289294.9 0.9294 207.71 13 13 Non-Fac Res Staff by Field (Lag1) Entered 0.0001 151531.6 0.9301 191.76 14 14 Acad R&D Exp Tot Subpart-Res Equip by Field (Defl, Lag2) Entered 0.0000 154413 0.9308 175.48 15 15 Acad R&D Fed Fin Subpart-Res Equip by Field (Defl, Lag2) Entered 0.0000 160690.7 0.9316 158.46 16
211
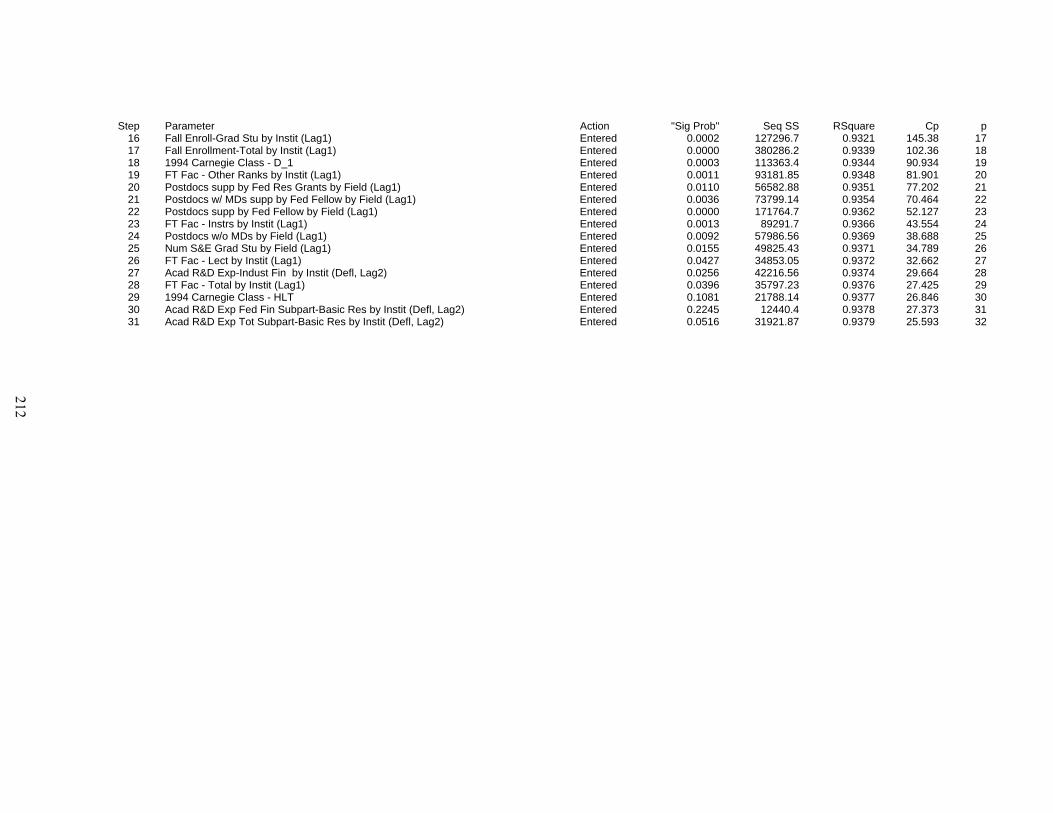
Step Parameter Action "Sig Prob" Seq SS RSquare Cp p 16 Fall Enroll-Grad Stu by Instit (Lag1) Entered 0.0002 127296.7 0.9321 145.38 17 17 Fall Enrollment-Total by Instit (Lag1) Entered 0.0000 380286.2 0.9339 102.36 18 18 1994 Carnegie Class - D_1 Entered 0.0003 113363.4 0.9344 90.934 19 19 FT Fac - Other Ranks by Instit (Lag1) Entered 0.0011 93181.85 0.9348 81.901 20 20 Postdocs supp by Fed Res Grants by Field (Lag1) Entered 0.0110 56582.88 0.9351 77.202 21 21 Postdocs w/ MDs supp by Fed Fellow by Field (Lag1) Entered 0.0036 73799.14 0.9354 70.464 22 22 Postdocs supp by Fed Fellow by Field (Lag1) Entered 0.0000 171764.7 0.9362 52.127 23 23 FT Fac - Instrs by Instit (Lag1) Entered 0.0013 89291.7 0.9366 43.554 24 24 Postdocs w/o MDs by Field (Lag1) Entered 0.0092 57986.56 0.9369 38.688 25 25 Num S&E Grad Stu by Field (Lag1) Entered 0.0155 49825.43 0.9371 34.789 26 26 FT Fac - Lect by Instit (Lag1) Entered 0.0427 34853.05 0.9372 32.662 27 27 Acad R&D Exp-Indust Fin by Instit (Defl, Lag2) Entered 0.0256 42216.56 0.9374 29.664 28 28 FT Fac - Total by Instit (Lag1) Entered 0.0396 35797.23 0.9376 27.425 29 29 1994 Carnegie Class - HLT Entered 0.1081 21788.14 0.9377 26.846 30 30 Acad R&D Exp Fed Fin Subpart-Basic Res by Instit (Defl, Lag2) Entered 0.2245 12440.4 0.9378 27.373 31 31 Acad R&D Exp Tot Subpart-Basic Res by Instit (Defl, Lag2) Entered 0.0516 31921.87 0.9379 25.593 32
212
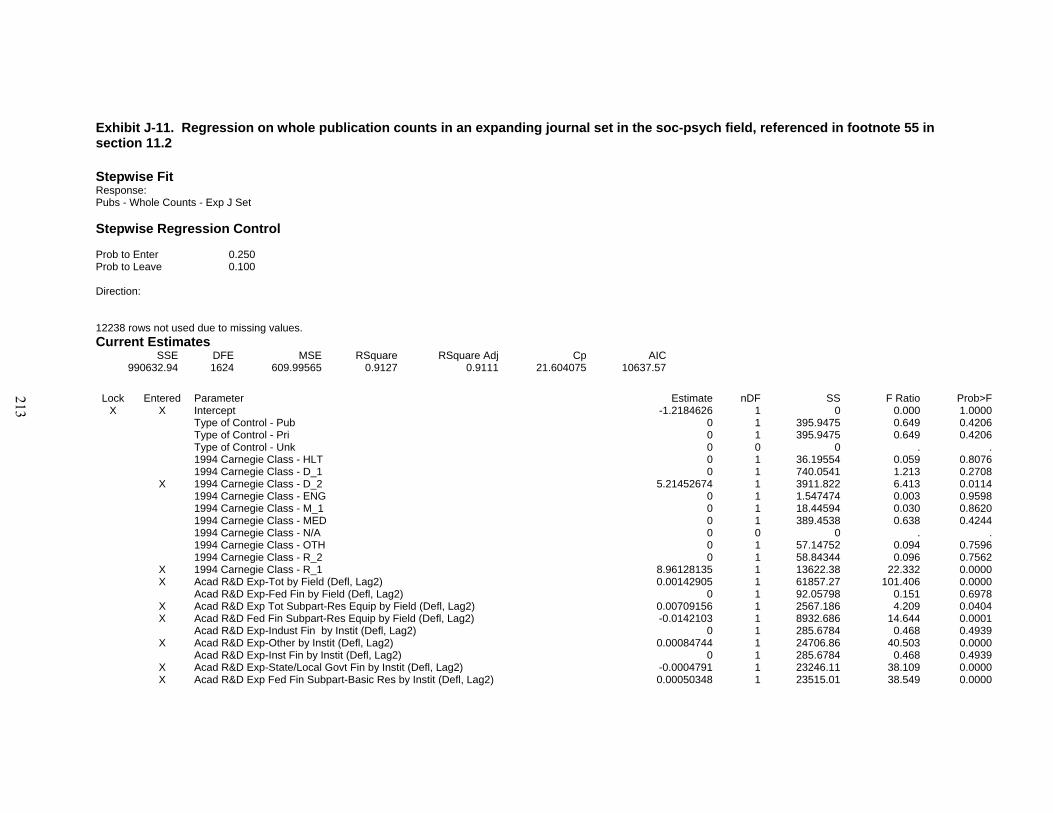
Exhibit J-11. Regression on whole publication counts in an expanding journal set in the soc-psych field, referenced in footnote 55 in section 11.2 Stepwise Fit Response: Pubs - Whole Counts - Exp J Set Stepwise Regression Control Prob to Enter 0.250 Prob to Leave 0.100 Direction: 12238 rows not used due to missing values. Current Estimates
SSE DFE MSE RSquare RSquare Adj Cp AIC990632.94 1624 609.99565 0.9127 0.9111 21.604075 10637.57
Lock Entered Parameter Estimate nDF SS F Ratio Prob>F
X X Intercept -1.2184626 1 0 0.000 1.0000 Type of Control - Pub 0 1 395.9475 0.649 0.4206 Type of Control - Pri 0 1 395.9475 0.649 0.4206 Type of Control - Unk 0 0 0 . . 1994 Carnegie Class - HLT 0 1 36.19554 0.059 0.8076 1994 Carnegie Class - D_1 0 1 740.0541 1.213 0.2708 X 1994 Carnegie Class - D_2 5.21452674 1 3911.822 6.413 0.0114 1994 Carnegie Class - ENG 0 1 1.547474 0.003 0.9598 1994 Carnegie Class - M_1 0 1 18.44594 0.030 0.8620 1994 Carnegie Class - MED 0 1 389.4538 0.638 0.4244 1994 Carnegie Class - N/A 0 0 0 . . 1994 Carnegie Class - OTH 0 1 57.14752 0.094 0.7596 1994 Carnegie Class - R_2 0 1 58.84344 0.096 0.7562 X 1994 Carnegie Class - R_1 8.96128135 1 13622.38 22.332 0.0000 X Acad R&D Exp-Tot by Field (Defl, Lag2) 0.00142905 1 61857.27 101.406 0.0000 Acad R&D Exp-Fed Fin by Field (Defl, Lag2) 0 1 92.05798 0.151 0.6978 X Acad R&D Exp Tot Subpart-Res Equip by Field (Defl, Lag2) 0.00709156 1 2567.186 4.209 0.0404 X Acad R&D Fed Fin Subpart-Res Equip by Field (Defl, Lag2) -0.0142103 1 8932.686 14.644 0.0001 Acad R&D Exp-Indust Fin by Instit (Defl, Lag2) 0 1 285.6784 0.468 0.4939 X Acad R&D Exp-Other by Instit (Defl, Lag2) 0.00084744 1 24706.86 40.503 0.0000 Acad R&D Exp-Inst Fin by Instit (Defl, Lag2) 0 1 285.6784 0.468 0.4939 X Acad R&D Exp-State/Local Govt Fin by Instit (Defl, Lag2) -0.0004791 1 23246.11 38.109 0.0000 X Acad R&D Exp Fed Fin Subpart-Basic Res by Instit (Defl, Lag2) 0.00050348 1 23515.01 38.549 0.0000
213
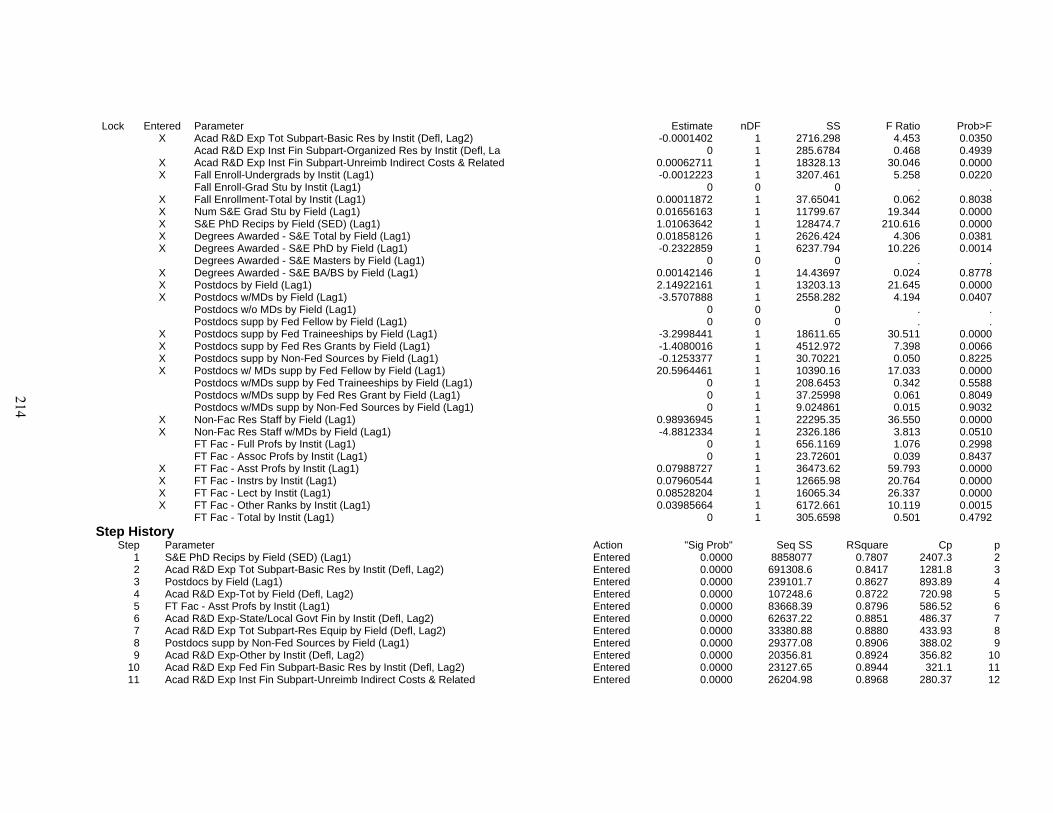
Lock Entered Parameter Estimate nDF SS F Ratio Prob>F X Acad R&D Exp Tot Subpart-Basic Res by Instit (Defl, Lag2) -0.0001402 1 2716.298 4.453 0.0350 Acad R&D Exp Inst Fin Subpart-Organized Res by Instit (Defl, La 0 1 285.6784 0.468 0.4939 X Acad R&D Exp Inst Fin Subpart-Unreimb Indirect Costs & Related 0.00062711 1 18328.13 30.046 0.0000 X Fall Enroll-Undergrads by Instit (Lag1) -0.0012223 1 3207.461 5.258 0.0220 Fall Enroll-Grad Stu by Instit (Lag1) 0 0 0 . . X Fall Enrollment-Total by Instit (Lag1) 0.00011872 1 37.65041 0.062 0.8038 X Num S&E Grad Stu by Field (Lag1) 0.01656163 1 11799.67 19.344 0.0000 X S&E PhD Recips by Field (SED) (Lag1) 1.01063642 1 128474.7 210.616 0.0000 X Degrees Awarded - S&E Total by Field (Lag1) 0.01858126 1 2626.424 4.306 0.0381 X Degrees Awarded - S&E PhD by Field (Lag1) -0.2322859 1 6237.794 10.226 0.0014 Degrees Awarded - S&E Masters by Field (Lag1) 0 0 0 . . X Degrees Awarded - S&E BA/BS by Field (Lag1) 0.00142146 1 14.43697 0.024 0.8778 X Postdocs by Field (Lag1) 2.14922161 1 13203.13 21.645 0.0000 X Postdocs w/MDs by Field (Lag1) -3.5707888 1 2558.282 4.194 0.0407 Postdocs w/o MDs by Field (Lag1) 0 0 0 . . Postdocs supp by Fed Fellow by Field (Lag1) 0 0 0 . . X Postdocs supp by Fed Traineeships by Field (Lag1) -3.2998441 1 18611.65 30.511 0.0000 X Postdocs supp by Fed Res Grants by Field (Lag1) -1.4080016 1 4512.972 7.398 0.0066 X Postdocs supp by Non-Fed Sources by Field (Lag1) -0.1253377 1 30.70221 0.050 0.8225 X Postdocs w/ MDs supp by Fed Fellow by Field (Lag1) 20.5964461 1 10390.16 17.033 0.0000 Postdocs w/MDs supp by Fed Traineeships by Field (Lag1) 0 1 208.6453 0.342 0.5588 Postdocs w/MDs supp by Fed Res Grant by Field (Lag1) 0 1 37.25998 0.061 0.8049 Postdocs w/MDs supp by Non-Fed Sources by Field (Lag1) 0 1 9.024861 0.015 0.9032 X Non-Fac Res Staff by Field (Lag1) 0.98936945 1 22295.35 36.550 0.0000 X Non-Fac Res Staff w/MDs by Field (Lag1) -4.8812334 1 2326.186 3.813 0.0510 FT Fac - Full Profs by Instit (Lag1) 0 1 656.1169 1.076 0.2998 FT Fac - Assoc Profs by Instit (Lag1) 0 1 23.72601 0.039 0.8437 X FT Fac - Asst Profs by Instit (Lag1) 0.07988727 1 36473.62 59.793 0.0000 X FT Fac - Instrs by Instit (Lag1) 0.07960544 1 12665.98 20.764 0.0000 X FT Fac - Lect by Instit (Lag1) 0.08528204 1 16065.34 26.337 0.0000 X FT Fac - Other Ranks by Instit (Lag1) 0.03985664 1 6172.661 10.119 0.0015 FT Fac - Total by Instit (Lag1) 0 1 305.6598 0.501 0.4792
Step History Step Parameter Action "Sig Prob" Seq SS RSquare Cp p
1 S&E PhD Recips by Field (SED) (Lag1) Entered 0.0000 8858077 0.7807 2407.3 2 2 Acad R&D Exp Tot Subpart-Basic Res by Instit (Defl, Lag2) Entered 0.0000 691308.6 0.8417 1281.8 3 3 Postdocs by Field (Lag1) Entered 0.0000 239101.7 0.8627 893.89 4 4 Acad R&D Exp-Tot by Field (Defl, Lag2) Entered 0.0000 107248.6 0.8722 720.98 5 5 FT Fac - Asst Profs by Instit (Lag1) Entered 0.0000 83668.39 0.8796 586.52 6 6 Acad R&D Exp-State/Local Govt Fin by Instit (Defl, Lag2) Entered 0.0000 62637.22 0.8851 486.37 7 7 Acad R&D Exp Tot Subpart-Res Equip by Field (Defl, Lag2) Entered 0.0000 33380.88 0.8880 433.93 8 8 Postdocs supp by Non-Fed Sources by Field (Lag1) Entered 0.0000 29377.08 0.8906 388.02 9 9 Acad R&D Exp-Other by Instit (Defl, Lag2) Entered 0.0000 20356.81 0.8924 356.82 10
10 Acad R&D Exp Fed Fin Subpart-Basic Res by Instit (Defl, Lag2) Entered 0.0000 23127.65 0.8944 321.1 11 11 Acad R&D Exp Inst Fin Subpart-Unreimb Indirect Costs & Related Entered 0.0000 26204.98 0.8968 280.37 12
214
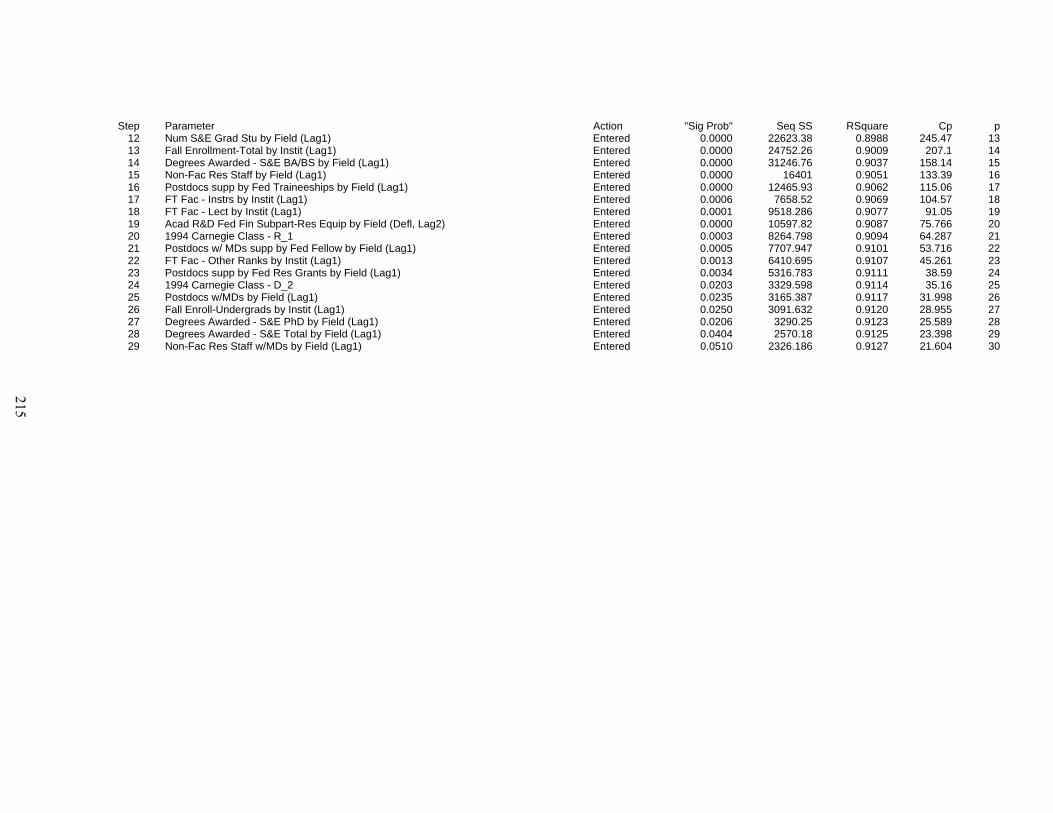
Step Parameter Action "Sig Prob" Seq SS RSquare Cp p 12 Num S&E Grad Stu by Field (Lag1) Entered 0.0000 22623.38 0.8988 245.47 13 13 Fall Enrollment-Total by Instit (Lag1) Entered 0.0000 24752.26 0.9009 207.1 14 14 Degrees Awarded - S&E BA/BS by Field (Lag1) Entered 0.0000 31246.76 0.9037 158.14 15 15 Non-Fac Res Staff by Field (Lag1) Entered 0.0000 16401 0.9051 133.39 16 16 Postdocs supp by Fed Traineeships by Field (Lag1) Entered 0.0000 12465.93 0.9062 115.06 17 17 FT Fac - Instrs by Instit (Lag1) Entered 0.0006 7658.52 0.9069 104.57 18 18 FT Fac - Lect by Instit (Lag1) Entered 0.0001 9518.286 0.9077 91.05 19 19 Acad R&D Fed Fin Subpart-Res Equip by Field (Defl, Lag2) Entered 0.0000 10597.82 0.9087 75.766 20 20 1994 Carnegie Class - R_1 Entered 0.0003 8264.798 0.9094 64.287 21 21 Postdocs w/ MDs supp by Fed Fellow by Field (Lag1) Entered 0.0005 7707.947 0.9101 53.716 22 22 FT Fac - Other Ranks by Instit (Lag1) Entered 0.0013 6410.695 0.9107 45.261 23 23 Postdocs supp by Fed Res Grants by Field (Lag1) Entered 0.0034 5316.783 0.9111 38.59 24 24 1994 Carnegie Class - D_2 Entered 0.0203 3329.598 0.9114 35.16 25 25 Postdocs w/MDs by Field (Lag1) Entered 0.0235 3165.387 0.9117 31.998 26 26 Fall Enroll-Undergrads by Instit (Lag1) Entered 0.0250 3091.632 0.9120 28.955 27 27 Degrees Awarded - S&E PhD by Field (Lag1) Entered 0.0206 3290.25 0.9123 25.589 28 28 Degrees Awarded - S&E Total by Field (Lag1) Entered 0.0404 2570.18 0.9125 23.398 29 29 Non-Fac Res Staff w/MDs by Field (Lag1) Entered 0.0510 2326.186 0.9127 21.604 30
215
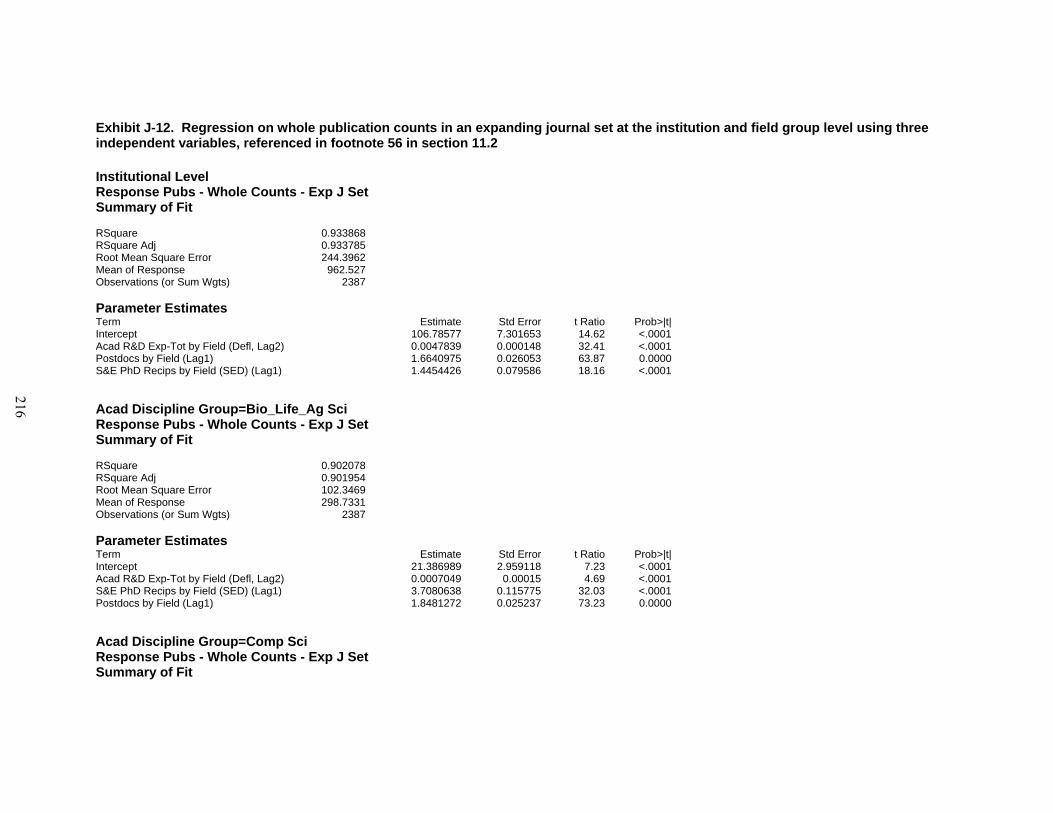
Exhibit J-12. Regression on whole publication counts in an expanding journal set at the institution and field group level using three independent variables, referenced in footnote 56 in section 11.2 Institutional Level Response Pubs - Whole Counts - Exp J Set Summary of Fit RSquare 0.933868RSquare Adj 0.933785Root Mean Square Error 244.3962Mean of Response 962.527Observations (or Sum Wgts) 2387 Parameter Estimates Term Estimate Std Error t Ratio Prob>|t|Intercept 106.78577 7.301653 14.62 <.0001Acad R&D Exp-Tot by Field (Defl, Lag2) 0.0047839 0.000148 32.41 <.0001Postdocs by Field (Lag1) 1.6640975 0.026053 63.87 0.0000S&E PhD Recips by Field (SED) (Lag1) 1.4454426 0.079586 18.16 <.0001 Acad Discipline Group=Bio_Life_Ag Sci Response Pubs - Whole Counts - Exp J Set Summary of Fit RSquare 0.902078RSquare Adj 0.901954Root Mean Square Error 102.3469Mean of Response 298.7331Observations (or Sum Wgts) 2387
Parameter Estimates Term Estimate Std Error t Ratio Prob>|t|Intercept 21.386989 2.959118 7.23 <.0001Acad R&D Exp-Tot by Field (Defl, Lag2) 0.0007049 0.00015 4.69 <.0001S&E PhD Recips by Field (SED) (Lag1) 3.7080638 0.115775 32.03 <.0001Postdocs by Field (Lag1) 1.8481272 0.025237 73.23 0.0000 Acad Discipline Group=Comp Sci Response Pubs - Whole Counts - Exp J Set Summary of Fit
216
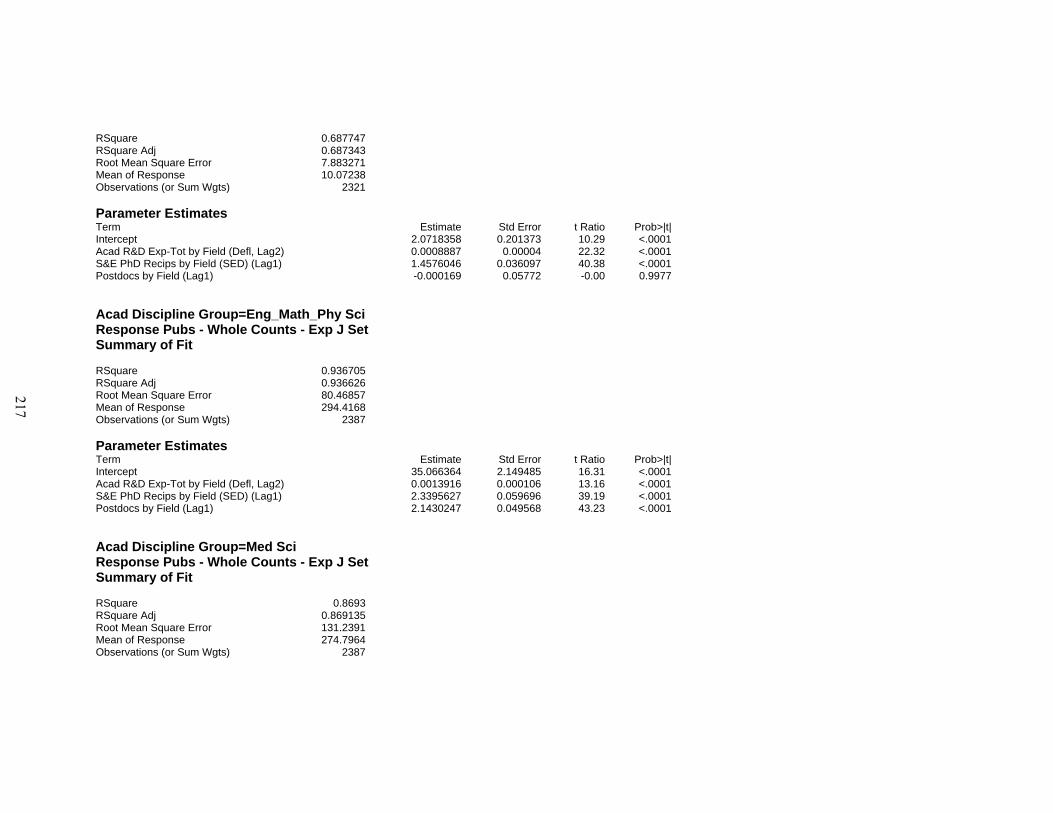
RSquare 0.687747RSquare Adj 0.687343Root Mean Square Error 7.883271Mean of Response 10.07238Observations (or Sum Wgts) 2321 Parameter Estimates Term Estimate Std Error t Ratio Prob>|t|Intercept 2.0718358 0.201373 10.29 <.0001Acad R&D Exp-Tot by Field (Defl, Lag2) 0.0008887 0.00004 22.32 <.0001S&E PhD Recips by Field (SED) (Lag1) 1.4576046 0.036097 40.38 <.0001Postdocs by Field (Lag1) -0.000169 0.05772 -0.00 0.9977 Acad Discipline Group=Eng_Math_Phy Sci Response Pubs - Whole Counts - Exp J Set Summary of Fit RSquare 0.936705RSquare Adj 0.936626Root Mean Square Error 80.46857Mean of Response 294.4168Observations (or Sum Wgts) 2387 Parameter Estimates Term Estimate Std Error t Ratio Prob>|t|Intercept 35.066364 2.149485 16.31 <.0001Acad R&D Exp-Tot by Field (Defl, Lag2) 0.0013916 0.000106 13.16 <.0001S&E PhD Recips by Field (SED) (Lag1) 2.3395627 0.059696 39.19 <.0001Postdocs by Field (Lag1) 2.1430247 0.049568 43.23 <.0001 Acad Discipline Group=Med Sci Response Pubs - Whole Counts - Exp J Set Summary of Fit RSquare 0.8693RSquare Adj 0.869135Root Mean Square Error 131.2391Mean of Response 274.7964Observations (or Sum Wgts) 2387
217
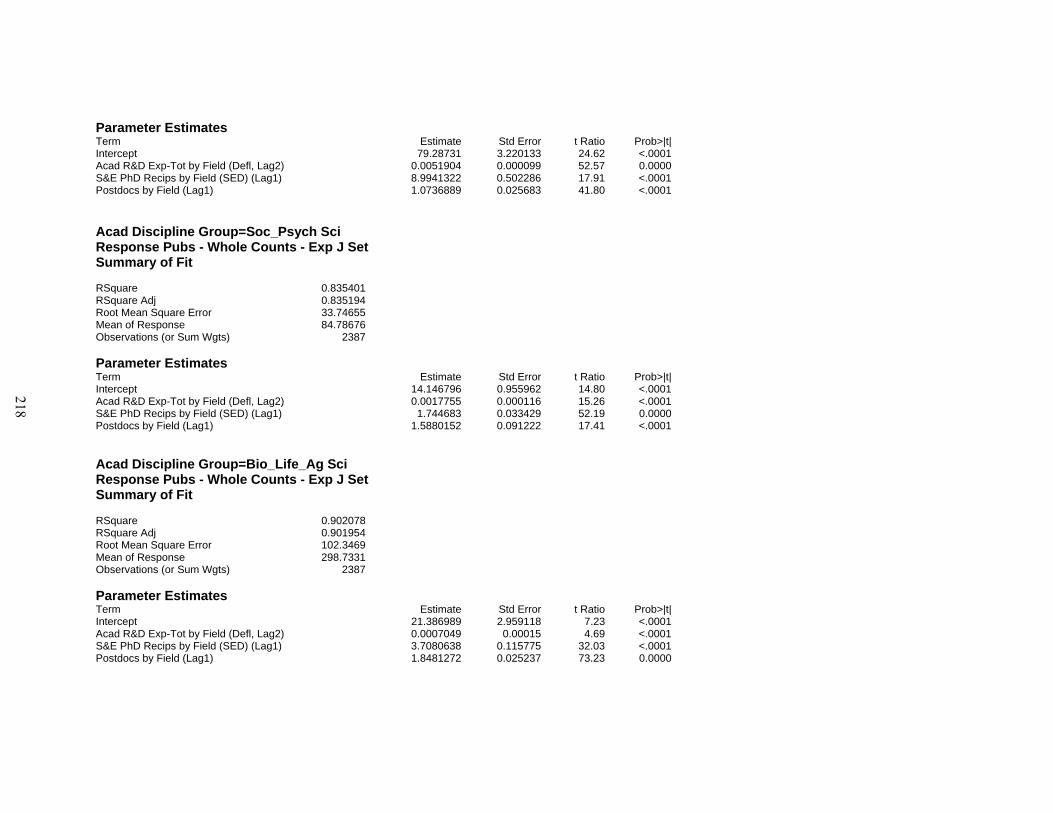
Parameter Estimates Term Estimate Std Error t Ratio Prob>|t|Intercept 79.28731 3.220133 24.62 <.0001Acad R&D Exp-Tot by Field (Defl, Lag2) 0.0051904 0.000099 52.57 0.0000S&E PhD Recips by Field (SED) (Lag1) 8.9941322 0.502286 17.91 <.0001Postdocs by Field (Lag1) 1.0736889 0.025683 41.80 <.0001
Acad Discipline Group=Soc_Psych Sci Response Pubs - Whole Counts - Exp J Set Summary of Fit RSquare 0.835401RSquare Adj 0.835194Root Mean Square Error 33.74655Mean of Response 84.78676Observations (or Sum Wgts) 2387 Parameter Estimates Term Estimate Std Error t Ratio Prob>|t|Intercept 14.146796 0.955962 14.80 <.0001Acad R&D Exp-Tot by Field (Defl, Lag2) 0.0017755 0.000116 15.26 <.0001S&E PhD Recips by Field (SED) (Lag1) 1.744683 0.033429 52.19 0.0000Postdocs by Field (Lag1) 1.5880152 0.091222 17.41 <.0001 Acad Discipline Group=Bio_Life_Ag Sci Response Pubs - Whole Counts - Exp J Set Summary of Fit RSquare 0.902078RSquare Adj 0.901954Root Mean Square Error 102.3469Mean of Response 298.7331Observations (or Sum Wgts) 2387
Parameter Estimates Term Estimate Std Error t Ratio Prob>|t|Intercept 21.386989 2.959118 7.23 <.0001Acad R&D Exp-Tot by Field (Defl, Lag2) 0.0007049 0.00015 4.69 <.0001S&E PhD Recips by Field (SED) (Lag1) 3.7080638 0.115775 32.03 <.0001Postdocs by Field (Lag1) 1.8481272 0.025237 73.23 0.0000
218
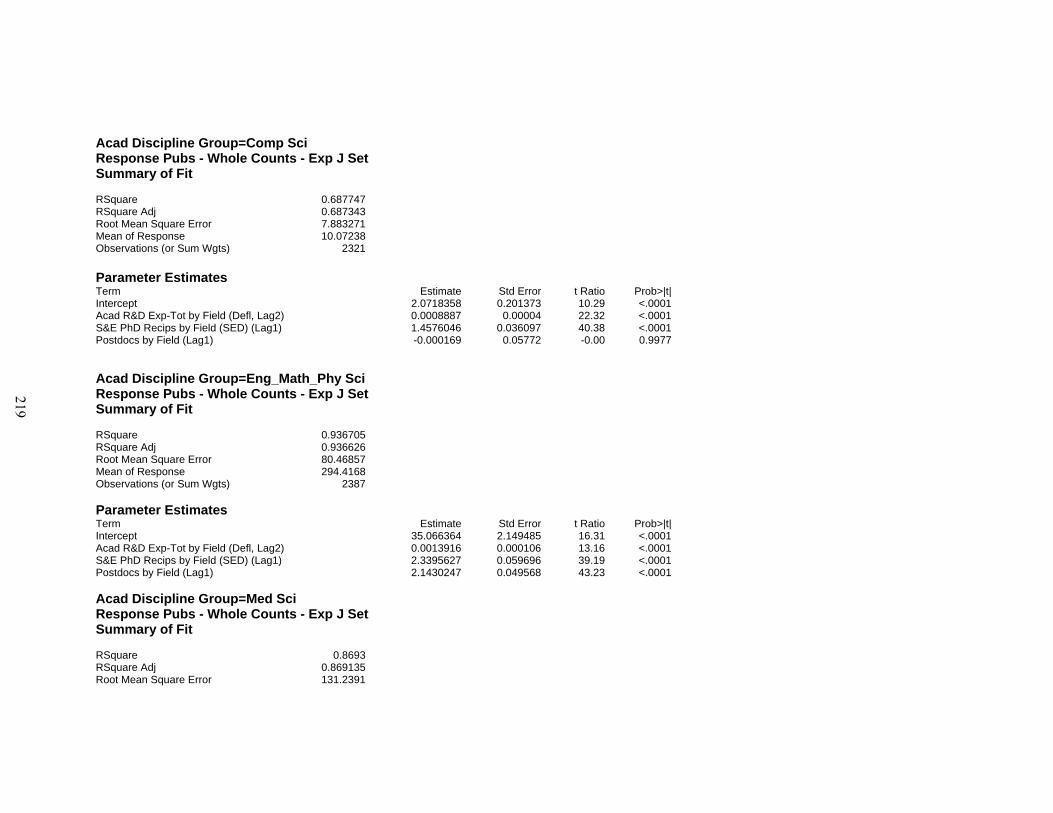
Acad Discipline Group=Comp Sci Response Pubs - Whole Counts - Exp J Set Summary of Fit RSquare 0.687747RSquare Adj 0.687343Root Mean Square Error 7.883271Mean of Response 10.07238Observations (or Sum Wgts) 2321
Parameter Estimates Term Estimate Std Error t Ratio Prob>|t|Intercept 2.0718358 0.201373 10.29 <.0001Acad R&D Exp-Tot by Field (Defl, Lag2) 0.0008887 0.00004 22.32 <.0001S&E PhD Recips by Field (SED) (Lag1) 1.4576046 0.036097 40.38 <.0001Postdocs by Field (Lag1) -0.000169 0.05772 -0.00 0.9977 Acad Discipline Group=Eng_Math_Phy Sci Response Pubs - Whole Counts - Exp J Set Summary of Fit RSquare 0.936705RSquare Adj 0.936626Root Mean Square Error 80.46857Mean of Response 294.4168Observations (or Sum Wgts) 2387 Parameter Estimates Term Estimate Std Error t Ratio Prob>|t|Intercept 35.066364 2.149485 16.31 <.0001Acad R&D Exp-Tot by Field (Defl, Lag2) 0.0013916 0.000106 13.16 <.0001S&E PhD Recips by Field (SED) (Lag1) 2.3395627 0.059696 39.19 <.0001Postdocs by Field (Lag1) 2.1430247 0.049568 43.23 <.0001 Acad Discipline Group=Med Sci Response Pubs - Whole Counts - Exp J Set Summary of Fit RSquare 0.8693RSquare Adj 0.869135Root Mean Square Error 131.2391
219

Mean of Response 274.7964Observations (or Sum Wgts) 2387 Parameter Estimates Term Estimate Std Error t Ratio Prob>|t|Intercept 79.28731 3.220133 24.62 <.0001Acad R&D Exp-Tot by Field (Defl, Lag2) 0.0051904 0.000099 52.57 0.0000S&E PhD Recips by Field (SED) (Lag1) 8.9941322 0.502286 17.91 <.0001Postdocs by Field (Lag1) 1.0736889 0.025683 41.80 <.0001 Acad Discipline Group=Soc_Psych Sci Response Pubs - Whole Counts - Exp J Set Summary of Fit RSquare 0.835401RSquare Adj 0.835194Root Mean Square Error 33.74655Mean of Response 84.78676Observations (or Sum Wgts) 2387 Parameter Estimates Term Estimate Std Error t Ratio Prob>|t|Intercept 14.146796 0.955962 14.80 <.0001Acad R&D Exp-Tot by Field (Defl, Lag2) 0.0017755 0.000116 15.26 <.0001S&E PhD Recips by Field (SED) (Lag1) 1.744683 0.033429 52.19 0.0000Postdocs by Field (Lag1) 1.5880152 0.091222 17.41 <.0001
220