us army corps of engineers building strong ® large scale high fidelity remote soil property...
TRANSCRIPT

US Army Corps of Engineers
BUILDING STRONG®
Large Scale High Fidelity Remote Soil Property Variability
Principal Investigators:
Mike Tischler, TEC
Terry Sobecki, CRREL

BUILDING STRONG®
Large Scale High Fidelity Remote Soil Property Variability
Purpose: Better model land-human interactions in COIN/ Stability Ops by characterizing spatial variability of soil properties influencing agricultural operations, water resource allocation, and soil loss through desertification and erosion.
Results:► Relate multi-source remote geophysical signatures to
landscape processes and soil properties• Filter complex sensor signatures to accentuate and
discriminate for soil inferencing• Capture wide-area low frequency changes in soil
morphology► Create continuous surface of soil physical properties► Fusion of geophysical sensor measurements with
DEM-based landscape characterizationPayoff:
► Methods to characterize wide-area soil property variability without requiring direct sampling
► More informed COIN/Stability Ops decisions regarding land surface use and hydrology
► More accurate battlefield analysis from TDAs driven by soil properties
► Increased ability to effectively evaluate landscapes for tactical decisions (LZ’s, CCM, Sensor placement/performance, trafficability)
Schedule and Cost
WP #
Status: Cont/Rev/New
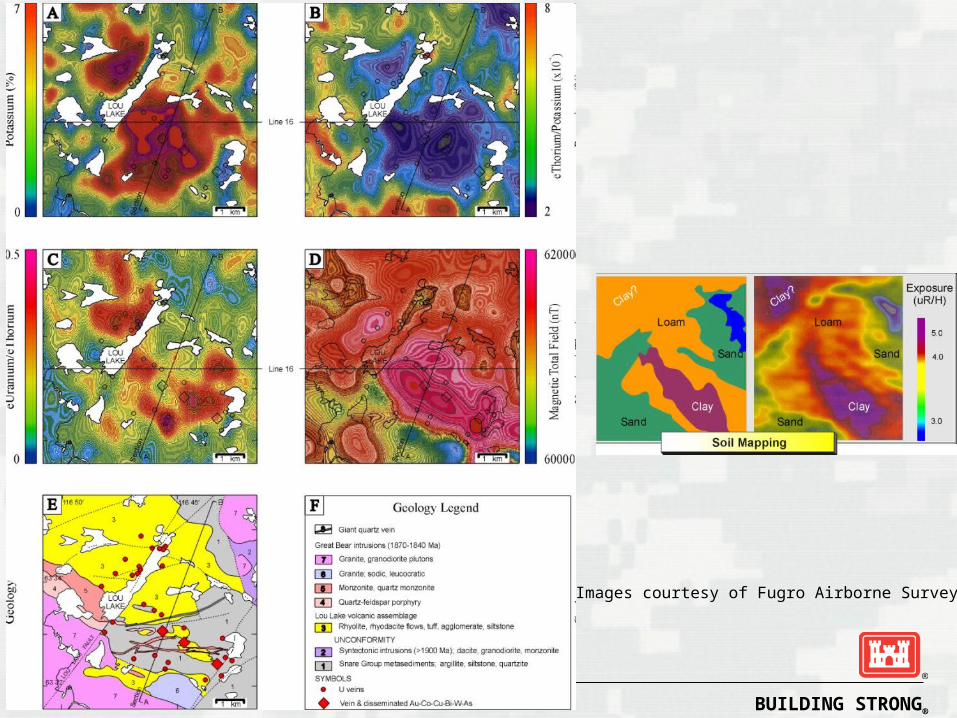
Image courtesy Fugro Airborne Surveys
Milestones FY11 FY12 FY13 FY14
Discriminate clay species/texture via γ-Ray
Isolate UHF subsurface backscatter component
Decouple soil water/texture contributions to UFH signal
Map soil group extents using terrain landform characterization
Army
53
3 5
TotalTotal
3 5
3 6
BUILDING STRONG®
Large Scale High Fidelity Remote Soil Property Variability
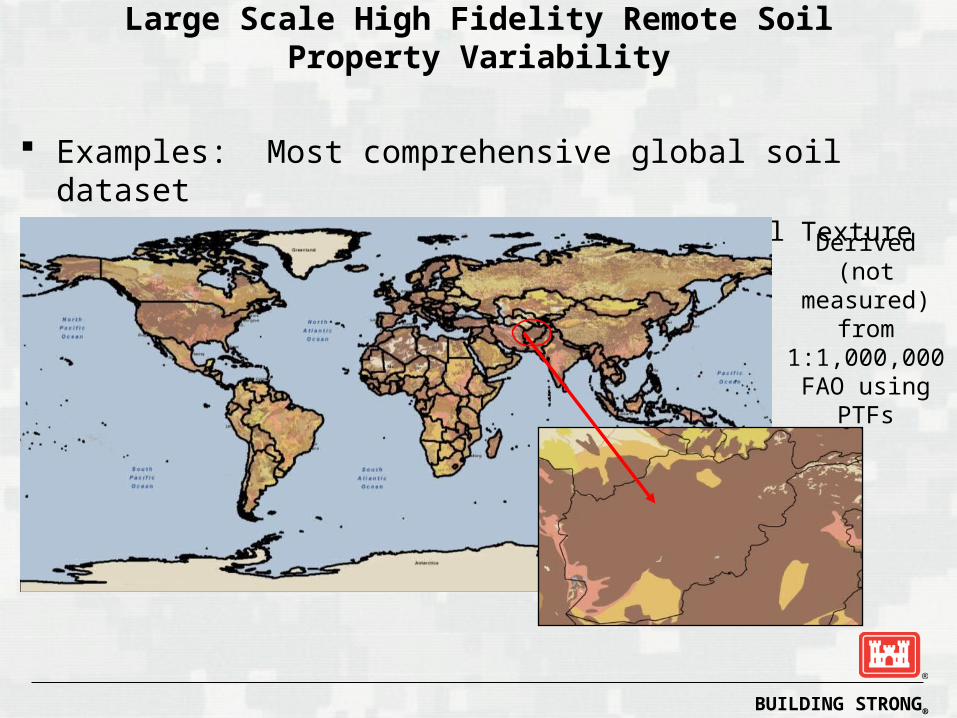
Examples: Most comprehensive global soil dataset ► Harmonized Soil World Database (2009), Soil Texture attribute
Derived (not measured)
from 1:1,000,000 FAO using
PTFs

BUILDING STRONG®
Large Scale High Fidelity Remote Soil Property Variability
Overall goal is to derive soil texture from available remotely sensed data, mostly DEM driven
Initial effort will be to use supervised classification to create heuristic model of soil texture family (coarse, medium, fine – FAO/Zobler)
Secondary effort will be to classify into 13 USDA Soil Texture Classes Two AOI’s
► SW Arizona► SW Afghanistan
Soil Texture Source Data► STATSGO (Miller and White, 1998)► 1981 French-made soil map of SW Afghanistan
• Excellent quality (spatially accurate, rich data source)
• In need of translation► GSLs Afghanistan Soil Database (?)
Miller, D.A. and R.A. White, 1998: A Conterminous United States Multi-Layer Soil Characteristics Data Set for Regional Climate and Hydrology Modeling. Earth Interactions, 2. [Available on-line at http://EarthInteractions.org]
Zobler, L. 1986. A World Soil File for Global Climate Modelling. NASA Technical Memorandum 87802. NASA Goddard Institute for Space Studies, New York, New York, U.S.A.

BUILDING STRONG®
Landform Characterization/Segmentation
Relief is a fundamental soil forming property which includes slope position & landform element
Slope controls water movement, which controls morphology Research will determine degree of statistical correlation between
slope position, landform element, and soil texture classes at sites 4TB of terrain data; 30m Globally (courtesy of DIA)
DEM (SRTM) Slope Aspect TPI (Topographic Position Index) TRI (Terrain Ruggedness Index)
DEM and DEM derivatives can be used to segment the landscape into areas of homogeneity, which can be correlated to soil texture
BUILDING STRONG®
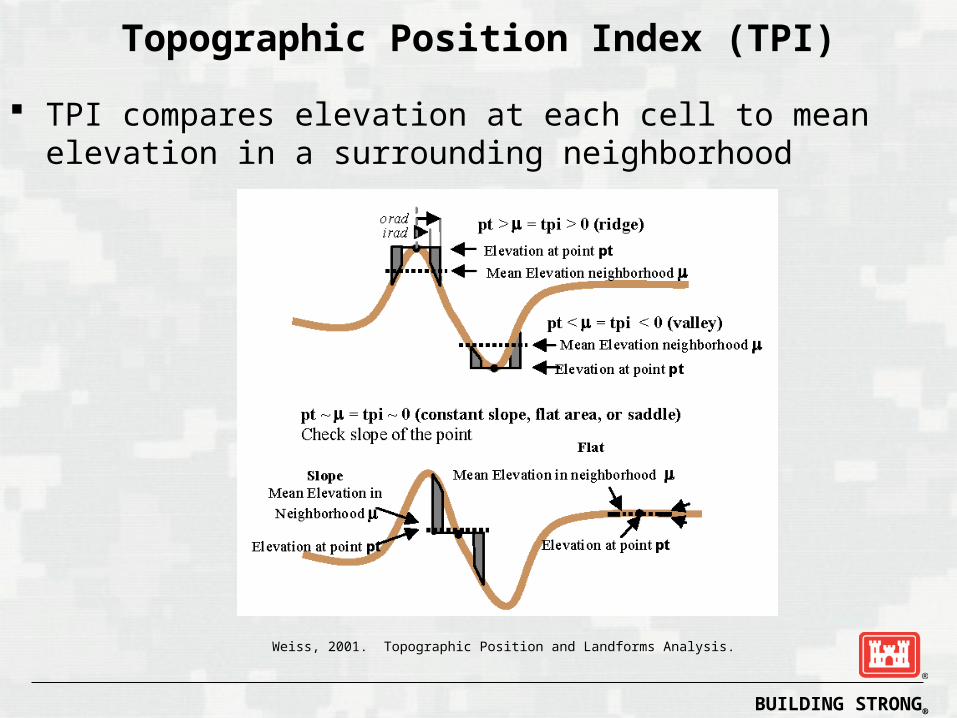
TPI compares elevation at each cell to mean elevation in a surrounding neighborhood
Topographic Position Index (TPI)
Weiss, 2001. Topographic Position and Landforms Analysis.
BUILDING STRONG®
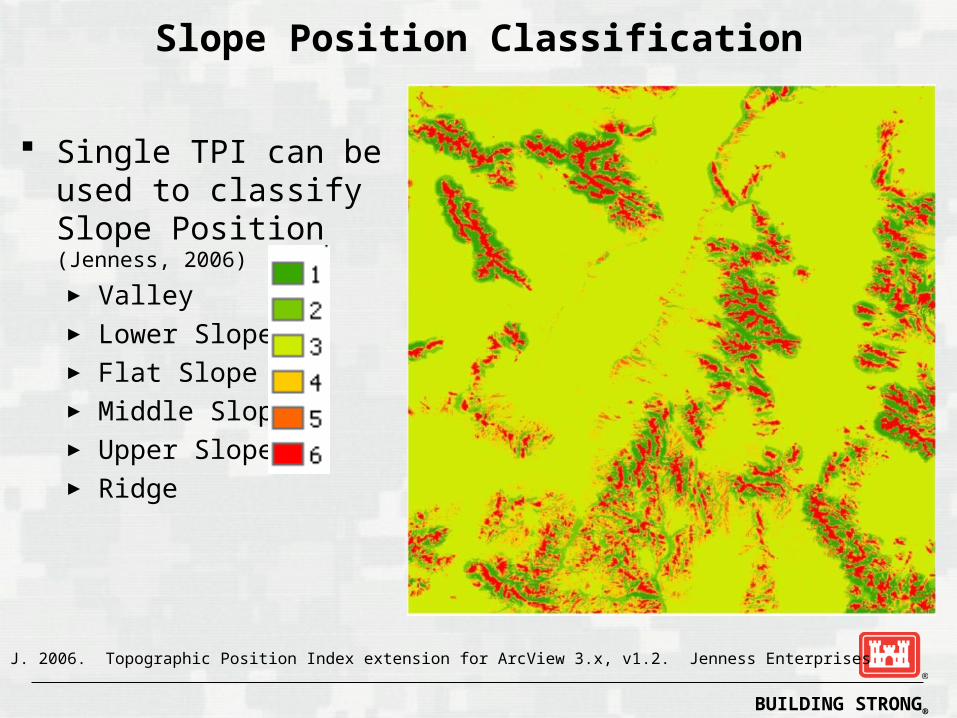
Slope Position Classification
Single TPI can be used to classify Slope Position (Jenness, 2006)
► Valley► Lower Slope► Flat Slope► Middle Slope► Upper Slope► Ridge
Jenness, J. 2006. Topographic Position Index extension for ArcView 3.x, v1.2. Jenness Enterprises

BUILDING STRONG®
TPI When two scales of neighborhood are used to create two
TPIs, landscape can be classified into landforms
Weiss, 2001. Topographic Position and Landforms Analysis.

BUILDING STRONG®
Topographic Wetness Index
TWI – Topographic (Compound) Wetness Index► Developed for TOPMODEL in ‘79 (Beven and Kirkby)► Relationship of upslope contributing drainage area to slope
a = upslope area draining through cell
tan(b) = slope
► Studies show that TWI is correlated with depth to groundwater, soil pH, veg. species richness, and Soil Organic Matter
► Calculated using D-Inf flow direction (Tarboton, 1997), which is shown to have significantly higher correlation than D8 to Soil Organic Matter (Pei, Qin, Zhu, et. al., 2010).
)tan(
lnb
a
Tao Pei, Cheng-Zhi Qin, A-Xing Zhu, Lin Yang, Ming Luo, Baolin Li, Chenghu Zhou, Mapping soil organic matter using the topographic wetness index: A comparative study based on different flow-direction algorithms and kriging methods, Ecological Indicators, Volume 10, Issue 3, May 2010, Pages 610-619.
Tarboton, D. A New Method for the determination of flow directions and upslope areas in grid digital elevation models. WRR v.33 No. 2, 1997. Pages 309-319
BUILDING STRONG®
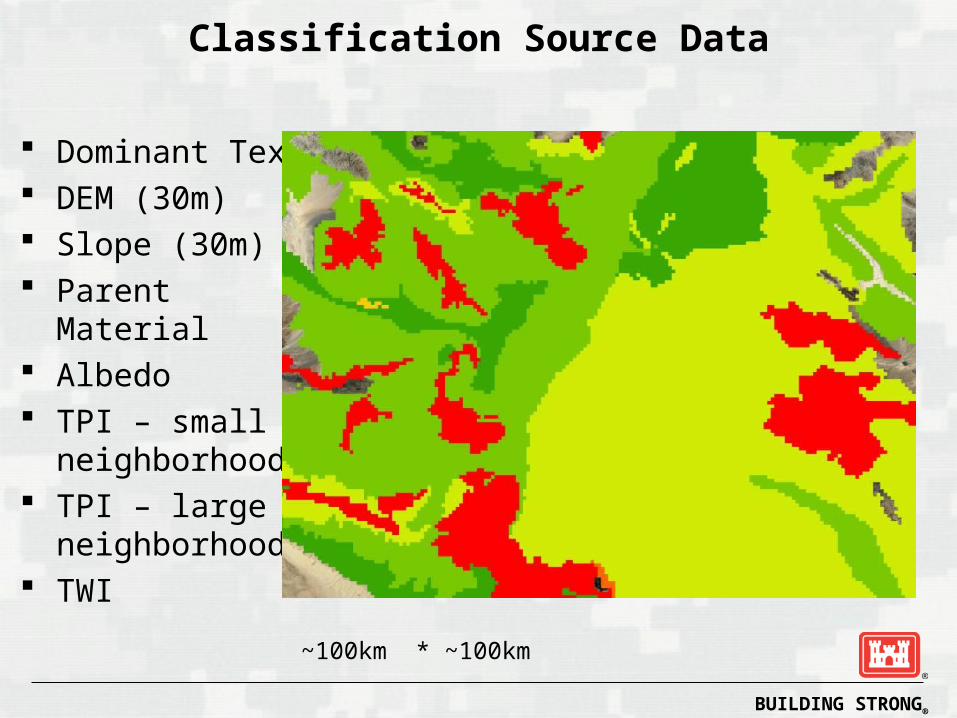
Classification Source Data
Dominant Tex DEM (30m) Slope (30m) Parent Material Albedo TPI – small
neighborhood TPI – large
neighborhood TWI
~100km * ~100km

BUILDING STRONG®
1981 French-made Soil Map

BUILDING STRONG®
Additional Research ASTER soil moisture (Mira, Valor, Caselles, et al., 2010)
► In lab at SM < field capacity, emissivity exhibits variations at 8-9 microns► Greatest variation in sandy soil
ASTER soil texture - build on Apan et al. (2002) and include TIR bands of ASTER
Spatial Similarity applied to soil typical location► N-dimensional data analysis of site characteristics► Possible to extrapolate from known areas into unknown areas
Strength of correlation between TPI (slope position, landform element) and Soil Texture
► How closely are slope position and soil texture linked► TPI computed at several scales, compare with soil texture classes► Look for separability between soil texture classes► TPI is scale dependant, must be matched with texture of similar scale
Mira, M.; Valor, E.; Caselles, V.; Rubio, E.; Coll, C.; Galve, J.M.; Niclos, R.; Sanchez, J.M.; Boluda, R. 2010. Soil Moisture Effect on Thermal Infrared (8–13um) Emissivity," Geoscience and Remote Sensing, IEEE Transactions on , vol.48, no.5, pp.2251-2260.
Apan, A., Kelly, R., Jensen, T., Butler, D., Strong, W., and Basnet, B. 2002. Spectral Discrimination and Separability Analysis of Agricultural Crops and Soil Attributes using ASTER imagery. 11th ARSPC. Brisbane, Australia.

BUILDING STRONG®
Spatial Similarity
Approach asks “is unknown location most like sandy soil sites, loamy soil sites, or fine soil sites?”
At each cell in source area, value is measured for each n-dimensions (slope, aspect, ASTER band, TPI, etc.) for a particular soil texture category
Outside source area, value distance is measured for each n-dimension and compared with source distribution for each soil texture category to determine spatial similarity
Works well with ancillary datasets that are continuous (e.g., elevation), but not categorical (e.g., landcover classes)
Result is a similarity surface for each input class; If source classification is (sandy, loamy, fine), then 3 surfaces will be created visualizing the spatial similarity to each class.
BUILDING STRONG®
Large Scale High Fidelity Remote Soil Property Variability
γ-Ray spectroscopy is a popular geophysical method in many fields, particularly mining.
γ-Ray surveys measure percentages of Potassium, Thorium, and Uranium – the 3 most abundant radioactive elements in the earths surface
Canadian and Australian governments have leveraged γ-Ray surveys for near surface mapping extensively, to the point of operational survey programs (Canada)
Many private companies offer airborne γ-Ray surveys indicating that this is a mature technology
Applications of γ-Ray survey to military challenges or soil property mapping are very few, though the potential certainly exists
Gamma (γ) Ray Spectroscopy
BUILDING STRONG®
Images courtesy of Fugro Airborne Surveys

BUILDING STRONG®
Large Scale High Fidelity Remote Soil Property Variability
Radar propagation velocity depends on soil moisture Radar Attenuation depends on both soil moisture and soil texture Measuring both of these properties over similar soil will yield
conclusions about the soil texture Koh and Wakeley presented related work at Army Science
Conference - 2010
(Steve Arcone and Gary Koh will be the radar experts investigating this)

BUILDING STRONG®
Effect of SM and texture of attenuation rates
Koh, G. and Wakeley, L. 2010. Effect of Moisture on Radar Attenuation in Desert Soilshttp://www.armyscienceconference.com/manuscripts/O/OO-002.pdf

BUILDING STRONG®
Large Scale High Fidelity Remote Soil Property Variability
Testable hypotheses► UHF radar will have primarily subsurface backscatter over areas where
surface roughness is less than wavelength of the radar► Influence of soil moisture and soil texture on UHF signal can be
decoupled► UHF radar subsurface backscatter component varies spatially with soil
texture► Spatial variability in clay species (Illite, Kaolinite, Montmorillonite) are
manifested through K-geochemistry, and can be detected by gamma ray spectroscopy
► Terrain based landform characterization & classification are correlated with soil texture groupings and spatial extents
► Soil texture spatial variability can be determined by investigating spatial soil water energy characteristics (e.g., 15-bar water content is directly proportional to clay content)