us army corps of engineers building strong ® weather, runoff, and water quality summary water year...
TRANSCRIPT

US Army Corps of Engineers
BUILDING STRONG®
Weather, Runoff, and Water Quality SummaryWater Year 2010
Steven B. Barton, P.E.
Chief, Reservoir Control Center
Northwestern Division
08 December 2010

BUILDING STRONG®
WY 2010 Precipitation• Overall precipitation was near normal for much
of the basin.• Early fall precipitation was well above normal,
deteriorating rapidly through the snow accumulation season.
• Normal precipitation returned in late spring with much above precipitation in June.

BUILDING STRONG®
WY 2010 Precipitation

BUILDING STRONG®
WY 2010 Precipitation

BUILDING STRONG®
WY 2010 Temperature• Aside from an outbreak of arctic air in early December,
winter temperatures were generally above normal.• Spring temperatures began near normal, trending to
below normal with accompanying precipitation in May and June.
• Summer temperatures were above normal in the Canadian upper Columbia southern portions of Idaho and Oregon, below normal in central Idaho, and near normal elsewhere.

BUILDING STRONG®
WY 2010 Temperature

BUILDING STRONG®
WY 2010 Temperature
BUILDING STRONG®
WY 2010 Water Supply and Runoff• Rapid changes in weather relative to normal
conditions were a challenge for forecasting water supply.
• Late spring precipitation increased late-season water supply forecasts by 4.0 MAF at Lower Granite, and 8.5 MAF at The Dalles.
• Seasonal runoff was generally below normal basin-wide.

BUILDING STRONG®
WY 2010 Water Supply and Runoff

BUILDING STRONG®
WY 2010 Water Supply and Runoff

BUILDING STRONG®
WY 2010 Water Supply and Runoff
BUILDING STRONG®
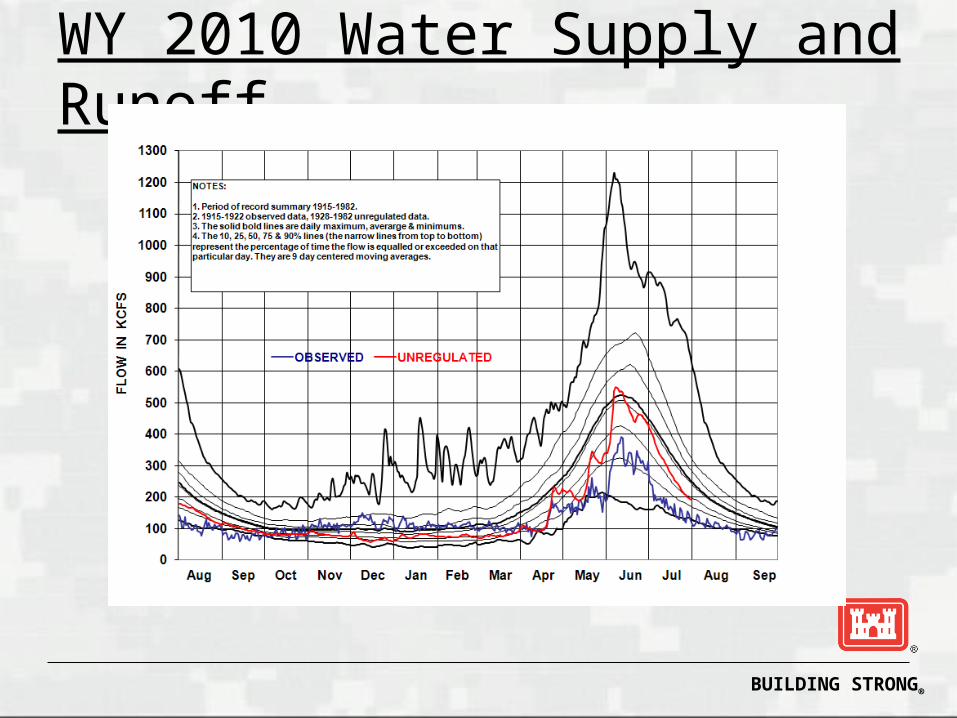
WY 2010 Water Supply and Runoff• Peak unregulated discharge at The Dalles was
550 kcfs on June 7, 2010.
• Observed peak discharge at The Dalles was 393 kcfs on June 11, 2010.
BUILDING STRONG®
WY 2010 Water Supply and Runoff
BUILDING STRONG®
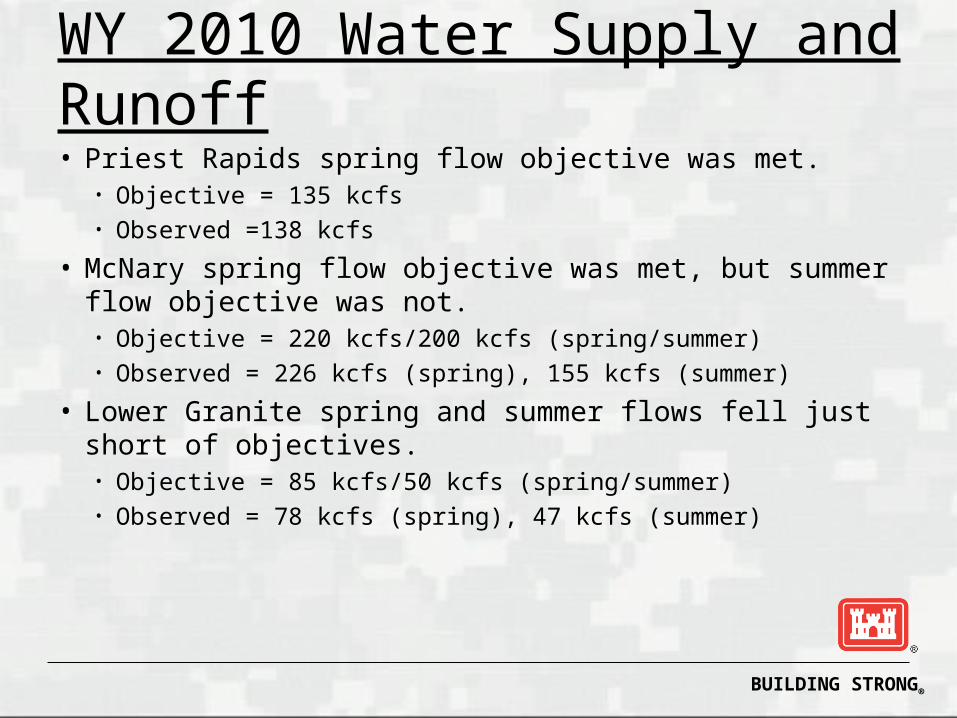
WY 2010 Water Supply and Runoff• Priest Rapids spring flow objective was met.
• Objective = 135 kcfs • Observed =138 kcfs
• McNary spring flow objective was met, but summer flow objective was not.• Objective = 220 kcfs/200 kcfs (spring/summer)• Observed = 226 kcfs (spring), 155 kcfs (summer)
• Lower Granite spring and summer flows fell just short of objectives.• Objective = 85 kcfs/50 kcfs (spring/summer)• Observed = 78 kcfs (spring), 47 kcfs (summer)

BUILDING STRONG®
WY 2010 Water Supply and Runoff

BUILDING STRONG®
WY 2010 Water Supply and Runoff

BUILDING STRONG®
WY 2010 Water Supply and Runoff

BUILDING STRONG®
Summary Comparison of TDG Instances Exceeding WQS - System Wide
2010 2504 234 9.3 90.7 78.92009 2504 308 12.3 87.7 84.12008 2504 515 20.6 79.4 92.52007 2504 99 4.0 96.0 89.22006 2504 575 23.0 77.0 131.42005 2754 69 2.5 97.5 93.52004 2754 71 2.6 97.4 95.32003 2754 243 8.8 91.2 100.82002 2754 427 15.5 84.5 119.32001 2754 13 0.5 99.5 66.92000 2754 249 9.0 91.0 112.71999 2754 406 14.7 85.3 142.7
Average 2640 267 10.2 89.8 100.6
Note: 2006-2009: Number of spill days based on 8 gages x 151 days plus 9 gages x 144 days.
1 The Dalles Jan-Jul Avg (1971-2000) =107.3 MAF
% of Normal runoff at TDA
1
Percent of Days Consistent With
TDG Standard (%)YearDays In
Spill Season
Number of Days of
Instances
Percent of Days Exceeding TDG
Standard (%)
The 2010 TDG instances were slightly less than the 11-year average
Water Quality - TDG

BUILDING STRONG®
Summary Comparison of TDG Instances Exceeding WQS - By FMS
2010 2009 2008 2007 2006 2005 2004 2003 2002 2001 2000 1999Qty. Qty. Qty. Qty. Qty. Qty. Qty. Qty. Qty. Qty. Qty. Qty.
Lower Granite Forebay 0 0 0 0 0 0 0 0 0 5 2 0 1Lower Granite Tailwater 15 15 35 0 28 0 0 15 17 0 4 15 12Little Goose Forebay 14 19 34 0 24 0 3 10 17 0 2 39 14Little Goose Tailwater 7 0 23 0 19 0 0 6 6 0 9 6 6Lower Monumental FB 14 26 54 11 56 6 1 19 49 0 28 44 26Lower Monumental TW 14 21 32 7 29 7 1 10 6 0 12 26 14Ice Harbor Forebay 31 44 55 31 51 3 4 35 24 0 34 44 30Ice Harbor Tailwater 11 25 31 0 22 3 2 4 6 0 4 12 10McNary Forebay - WA 11 4 21 6 31 8 10 24 43 1 14 22 16McNary Forebay - OR -- -- -- -- -- 11 23 32 45 5 22 19 22McNary Tailwater 23 5 28 1 32 1 7 12 31 0 17 50 17John Day Forebay 1 9 14 0 20 2 0 10 11 0 1 8 6John Day Tailwater 0 7 17 3 38 3 0 0 29 0 12 43 13The Dalles Forebay 0 11 17 8 40 6 5 11 18 0 5 1 10The Dalles Tailwater 0 0 2 0 10 0 0 4 11 0 5 5 3Bonneville Forebay 14 32 27 3 51 3 1 17 30 0 14 19 18Cascade Island * 27 24 57 0 61 0 --- --- --- --- --- --- 28Warrendale -- -- -- -- -- --- 0 1 19 0 6 2 5Camas/Washougal 52 66 68 29 63 16 14 33 65 2 58 51 43
Total Number of Exceedances
234 308 515 99 575 69 71 243 427 13 249 406 267
Water Quality Gages Average
Water Quality - TDG

BUILDING STRONG®
TDG Instance Types
TDG levels exceed the TDG standard due to exceeding powerhouse capacity at run-of-river projects resulting in spill above the BiOp fish spill levels. This condition type includes:
Planned and unplanned outages of hydro power equipment including generation unit, intertie line, or powerhouse outages.
TDG exceedances due to the operation or mechanical failure of non-generating equipment. This exceedance type includes:
Malfunctioning FMS gauge, resulting in fewer TDG or temperature measurements when setting TDG spill caps.
TDG exceedances due to uncertainties when using best professional judgment, SYSTDG model and forecasts. This exceedance type includes:
Communication errors, such as teletype were transmitted but change was not timely made or misinterpretation of intent of teletype by Project operator.
Types of Instance
High runoff flows and flood control efforts. BPA load requirements are lower than actual powerhouse capacity.
Type 1 Condition
Involuntary spill at Mid Columbia River dams resulting in high TDG levels entering the lower Columbia River.Involuntary spill at Snake River dams resulting in high TDG levels entering the lower Columbia River.
Flow deflectors unable to function for TDG abatement with tailwater elevations above 19 - 26 feet at Bonneville Dam.
Type 2 Exceedance
Type 1a Condition
Spill gates stuck in open position or inadvertently left open. Increased spill in a bulk spill operation to pass debris.
Bulk spill pattern being used which generated more TDG than expected.
Uncertainties when using best professional judgment to apply the spill guidance criteria, e.g., travel time, degassing, and spill patterns.
Type 3 Exceedance
Type 2a Exceedance
Uncertainties when using the SYSTDG model to predict the effects of various hydro system operations, temperature, degassing, and travel time. Uncertainties when using forecasts for flows, temperature and wind. Unanticipated sharp rise in water temperature (a 1.5 degree F. or greater change in a day).
Water Quality - TDG

BUILDING STRONG®
Summary Comparison of TDG Instances Exceeding WQS - By Type
8 Year Average
2010 2009 2008 2007 2006 2005 2004 2003TYPE
#DEFINITION
174 166 191 422 6 486 29 7 86 1TDG levels exceed the TDG standard due to exceeding powerhouse capacity at run-of-river projects resulting in spill above the BiOp fish spill levels.
6 1 1 1 1 45 0 0 0 1aPlanned and unplanned outages of hydro power equipment including generation unit, intertie line, or powerhouse outages.
6 0 1 11 0 14 1 6 17 2TDG exceedances due to the operation or mechanical failure of non-generating equipment.
6 7 17 10 0 1 1 6 7 2aMalfunctioning FMS gauge, resulting in fewer TDG or temperature measurements for setting TDG spill caps.
82 60 98 81 93 75 39 48 159 3TDG exceedances due to uncertainties when using best professional judgment, SYSTDG model and forecasts.
274 234 308 525 100 621 70 67 269 Totals
2003-2010 SPILL SEASONS
TYPES AND NUMBERS OF TDG INSTANCES
Water Quality - TDG

BUILDING STRONG®
Summary Comparison of Water TemperatureNumber of Days with 24-hour Average Over 68oF
Location 2010 2009 2008 2007 2006 2005Number of
days Number of
days Number of
days Number of
days Number of
days Number of
days LBQM 0 0 0 0 0 0ALFI 40 54 42 29 70 50ALQI 40 54 38 64 70 ---CHJ 0 0 0 0 0 0
CHQW 0 0 0 0 0 0ANQW 45 76 49 78 76 65DWQI 0 0 0 0 0 0PEKI 0 0 0 0 0 0LEWI 0 0 0 0 0 0LWG 0 3 0 1 5 53
LGNW 0 0 0 1 8 0LGSA 12 25 7 35 51 20LGSW 11 18 6 34 48 20LMNA 31 36 13 58 59 40LMNW 33 31 14 59 59 44IHRA 41 61 32 66 68 56IDSW 39 62 36 68 69 60PAQW 20 38 12 28 38 27MCNA 35 60 27 63 59 49MCPW 37 65 29 65 61 50
JDY 43 60 39 72 68 55JHAW 42 70 41 72 68 55TDA 40 63 34 69 67 56
TDDO 41 70 38 69 67 56BON 37 62 27 65 64 56CCIW 38 65 27 65 65 55
CWMW 38 65 34 66 65 58Total 663 1,038 545 1,127 1,205 925
Water Quality - Temperature