u.s. census bureau america: people, places, and our economy . ... 1920. 1930. 1940. 1950. 1960....
TRANSCRIPT

Armando Mendoza Partnership and Data Services
U.S. Census Bureau | Los Angeles Region
February 26, 2015
U.S. Census Bureau
The U.S. Census Bureau is “Open for Business” Measuring America: People, Places, and Our Economy

Agenda Importance of Census Bureau Data Censuses, Surveys and Estimates Decennial Census and the American Community
Survey (ACS) Statistics Selected ACS characteristics: US, CA, SD County, SD City,
and ZCTA 92127
Accessing Census Bureau Data

Decennial Census
Constitutional Mandate
Article 1, Section 2
23 Censuses since 1790
Congressional Reapportionment
Redistricting
Data is used to distribute federal funds
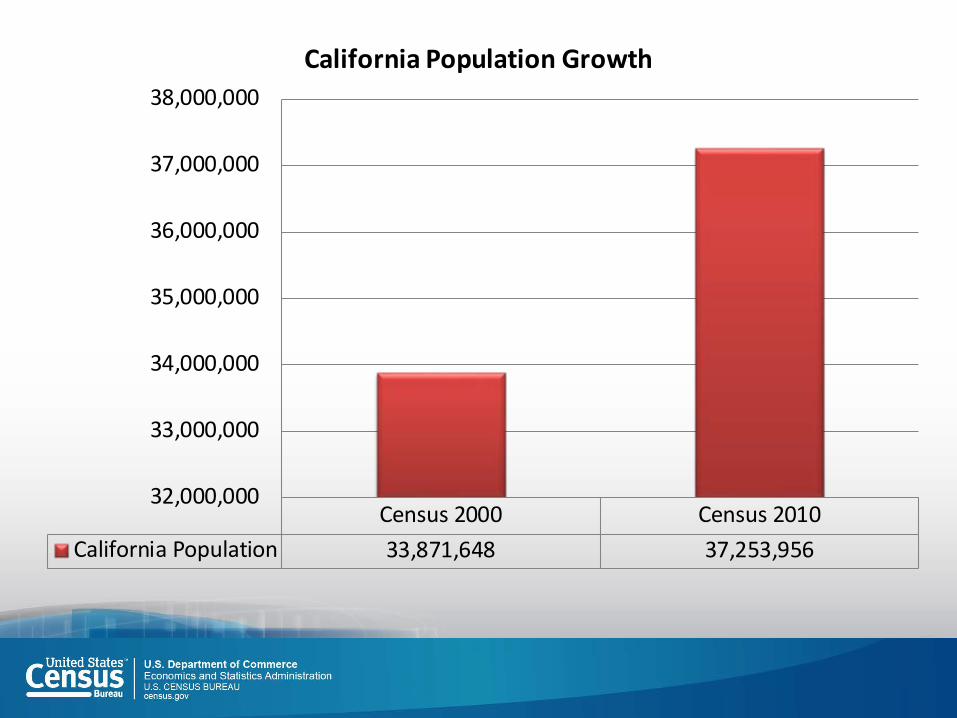
Census 2000 Census 2010California Population 33,871,648 37,253,956
32,000,000
33,000,000
34,000,000
35,000,000
36,000,000
37,000,000
38,000,000California Population Growth

1910 1920 1930 1940 1950 1960 1970 1980 1990 2000 2010% Change 60.10 44.10 65.70 21.70 53.30 48.50 27.00 18.60 25.70 13.80 10.00
0.00%
10.00%
20.00%
30.00%
40.00%
50.00%
60.00%
70.00%California Resident Population Percent Change

1910(Existing) 1920 1930 1940 1950 1960 1970 1980 1990 2000 2010
California (53) 11 0 9 3 7 8 5 2 7 1 0
0
2
4
6
8
10
12
California Congressional Apportionment

Massachusetts Illinois Ohio Texas California Florida Louisiana New York Pennsylvania
2000 10 19 18 32 53 25 7 29 192010 9 18 16 36 53 27 6 27 18
0
10
20
30
40
50
60
Congressional Seats Apportionment


Importance of Census Bureau Data Censuses, Surveys and Estimates Decennial Census and the American Community
Survey (ACS) Statistics Selected ACS characteristics: US, CA, SD County, SD City,
and ZCTA 92127
Accessing Census Bureau Data
Overview
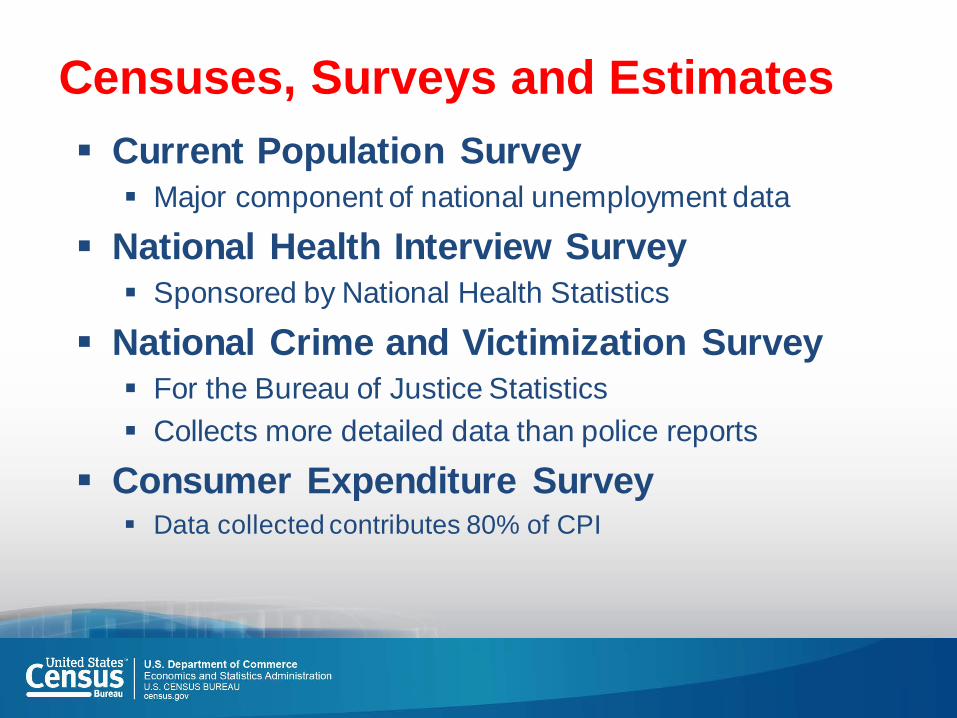
Current Population Survey Major component of national unemployment data
National Health Interview Survey Sponsored by National Health Statistics
National Crime and Victimization Survey For the Bureau of Justice Statistics Collects more detailed data than police reports
Consumer Expenditure Survey Data collected contributes 80% of CPI
Censuses, Surveys and Estimates

Population Estimates Population totals
available for the United States, states, counties, places and Puerto Rico
Components of change available for nation, states and counties
Based on births, deaths and migration

Population Estimates Current Estimates Data
Population counts Nation - - age, sex, race, and Hispanic origin States - - age, sex, race, and Hispanic origin Counties - - age, sex, race, and Hispanic origin Incorporated places - - total population only
Housing unit counts States Counties

Source: Census 2010 and 2013 Population Estimates
0
2,000,000
4,000,000
6,000,000
8,000,000
10,000,000
12,000,000
Census2010
2010 2011 2012 2013
Riverside County 4.7%ChangeOrange County 3.5%ChangeSan Diego County 3.7%ChangeLos Angeles County 2.0%Change

321,363
333,896
346,407
358,471
369,662
380,016 389,934
399,803
409,873
420,268
300000
320000
340000
360000
380000
400000
420000
440000
2015 2020 2025 2030 2035 2040 2045 2050 2055 2060
US Population Projections

2015 2020 2025 2030 2035 2040 2045 2050 2055 2060.65 years and over 47,695 55,969 65,052 72,774 77,315 79,719 81,288 83,739 87,309 92,033.85 years and over 6,306 6,693 7,389 8,946 11,579 14,115 16,512 17,978 18,201 18,187
0
10,000
20,000
30,000
40,000
50,000
60,000
70,000
80,000
90,000
100,000
Older Population (in thousands)

Economic Census Conducted every
five years (years ending in 2 and 7)
Provides information economic information down to the zip code level

Importance of Census Bureau Data Census, Surveys and Estimates Decennial Census and the American Community
Survey (ACS) Statistics Selected ACS characteristics: US, CA, SD County, SD City,
and ZCTA 92127
Accessing Census Bureau Data
Overview

ACS History
• Decennial Census: Short Form & Long Form 1940-2000
• American Community Survey Replaces Decennial Long Form 2005
• Decennial Census: Short Form Only 2010
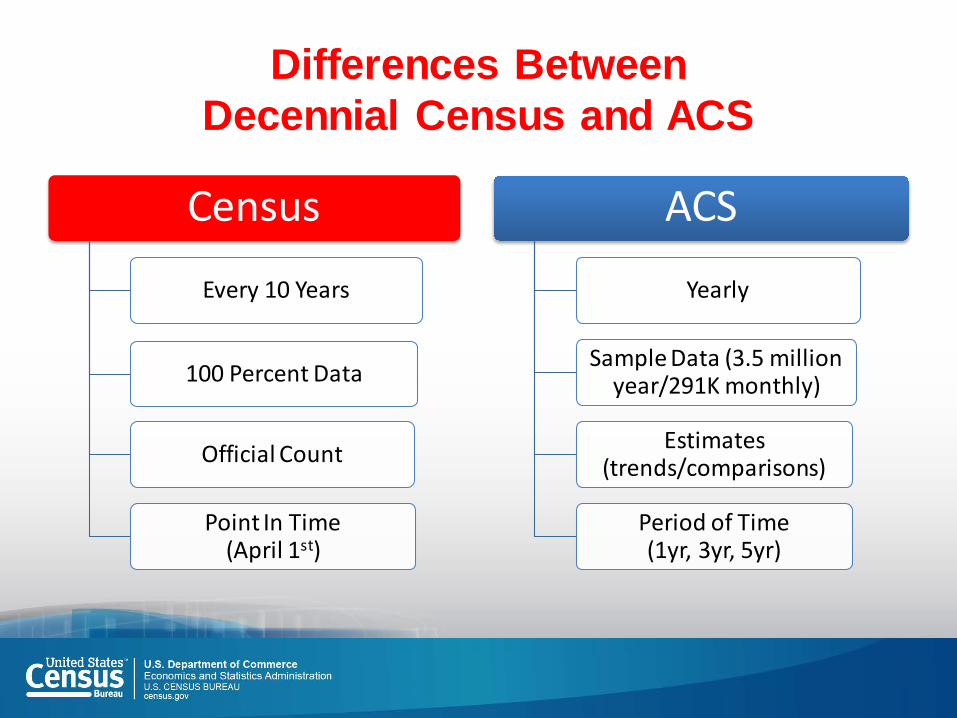
Census
Every 10 Years
100 Percent Data
Official Count
Point In Time (April 1st)
ACS
Yearly
Sample Data (3.5 million year/291K monthly)
Estimates (trends/comparisons)
Period of Time (1yr, 3yr, 5yr)
Differences Between Decennial Census and ACS

• Geographies of 65,000 or more
1-Year Estimates
• Geographies of 20,000 or more
3-Year Estimates
• All geographies 5-Year
Estimates
ACS Period Estimates

American Community Survey Demographic Characteristics
Age Race Sex Hispanic Origin
22

23
23
American Community Survey Social Characteristics
• Education • Marital Status • Fertility • Grandparent/ Caregivers • Veterans • Disability Status
• Place of Birth • Citizenship • Year of Entry • Language Spoken at Home • Ancestry / Tribal
Affiliation

24
24
American Community Survey Economic Characteristics
• Income o Social Security
Income o Retirement Income
• Employment Status • Occupation • Industry • Commuting to Work • Place of Work • Health Insurance
o Medicare o Medicaid

25
25
American Community Survey Housing Characteristics
• Tenure • Occupancy & Structure • Housing Value • Taxes & Insurance • Utilities • Mortgage/Monthly Rent

ACS Data Products Annual Releases with Population Thresholds
Data
Product (next
release)
Population Threshold
of Statistical
Area
Year of Data Release
2006 2007 2008 2009 2010 2011 2012 2013 2014 2015
Year(s) of Data Collection
1-Year Estimates (September)
65,000 + 2005 2006 2007 2008 2009 2010 2011 2012 2013 2014
3-Year Estimates
(October) 20,000 + 2005 -
2007 2006 - 2008
2007 - 2009
2008 - 2010
2009 - 2011
2010 - 2012
2011 - 2013
2012 - 2014
5-Year Estimates (December)
All Areas *
2005 - 2009
2006-2010
2007 - 2011
2008 - 2012
2009 - 2013
2010 - 2014
* All Areas = All legal, administrative, and statistical geographic areas down to the block group level. Zip Code Tabulation Area (ZCTA) estimates first became available in 2012, with the 2007 – 2011 estimates.

Importance of Census Bureau Data Census, Surveys and Estimates Decennial Census and the American Community
Survey (ACS) Statistics Selected ACS characteristics: US, CA, SD County, SD City,
and ZCTA 92127
Accessing Census Bureau Data
Overview

Source: American Community Survey 5-Year Estimates 2009-2013
115.6
12.5 1.1 0.48 0.0013
United States California San Diego County San Diego City ZCTA 92127
Households (in millions)

Source: American Community Survey 5-Year Estimates 2009-2013
2.6
2.9
2.8
2.7
3.0
United States California San Diego County San Diego City ZCTA 92127
Average Household Size

Source: American Community Survey 5-Year Estimates 2009-2013
48.7% 49.2% 49.4%
43.0%
61.7%
United States California San Diego County San Diego City ZCTA 92127
Married Couples

Source: American Community Survey 5-Year Estimates 2009-2013
33.0% 37.0%
34.0% 31.0%
51.0%
United States California San Diego County San Diego City ZCTA 92127
Households with Children <18 yrs. Old

Source: American Community Survey 5-Year Estimates 2009-2013
37.3 37.3
34.8
33.7
36.2
United States California San Diego County San Diego City ZCTA 92127
Median Age

Source: American Community Survey 5-Year Estimates 2009-2013
87.0%
73.0% 77.0% 74.0% 73.0%
13.0%
27.0% 23.0% 26.0% 27.0%
United States California San Diego County San Diego City ZCTA 92127
Place of Birth US Native Population Foreign Born

Source: American Community Survey 5-Year Estimates 2009-2013
45.0% 47.0% 48.0% 51.0%
65.0%
55.0% 53.0% 52.0% 49.0%
35.0%
United States California San Diego County San Diego City ZCTA 92127
Citizenship Naturalized Citizens Not a US Citizen

Source: American Community Survey 5-Year Estimates 2009-2013
21.0%
44.0%
37.0% 40.0%
36.0%
United States California San Diego County San Diego City ZCTA 92127
Language Spoken at Home Speak other than English at Home

Source: American Community Survey 5-Year Estimates 2009-2013
62% 66% 66%
57%
15%
38% 34% 34%
43%
85%
United States California San Diego County San Diego City ZCTA 92127
Language Spoken At Home Spanish Another Language

Source: American Community Survey 5-Year Estimates 2009-2013
14.0%
18.8%
14.5% 13.0%
3.1%
United States California San Diego County San Diego City ZCTA 92127
Less Than High School Diploma

Source: American Community Survey 5-Year Estimates 2009-2013
28.1%
20.7% 19.1%
16.4%
11.2%
United States California San Diego County San Diego City ZCTA 92127
High School Diploma or Equivalent

Source: American Community Survey 5-Year Estimates 2009-2013
21.2% 22.1% 22.7%
21.3%
15.4%
United States California San Diego County San Diego City ZCTA 92127
Some College - No Degree

Source: American Community Survey 5-Year Estimates 2009-2013
7.8% 7.8%
9.1%
7.6%
4.6%
United States California San Diego County San Diego City ZCTA 92127
Associate's Degree

Source: American Community Survey 5-Year Estimates 2009-2013
18.0% 19.4%
21.5%
25.0%
37.5%
United States California San Diego County San Diego City ZCTA 92127
Bachelor's Degree

Source: American Community Survey 5-Year Estimates 2009-2013
10.8% 11.2% 13.1%
16.7%
28.1%
United States California San Diego County San Diego City ZCTA 92127
Graduate or Professional Degree

Source: American Community Survey 5-Year Estimates 2009-2013
85.9%
81.2%
85.5% 87.0%
96.8%
United States California San Diego County San Diego City ZCTA 92127
High School and higher

Source: American Community Survey 5-Year Estimates 2009-2013
58.0% 56.0% 56.0% 58.0%
65.0%
36.0% 36.0% 35.0% 33.0% 30.0%
United States California San Diego County San Diego City ZCTA 92127
Employment Population Employed (16 Yrs. and Older)
Not currently in the Labor Force (16 Yrs. And Older)

Source: American Community Survey 5-Year Estimates 2009-2013
78.8% 77.0% 76.9% 77.1% 81.7%
14.9% 14.4% 15.2% 15.3% 11.9%
6.2% 8.4% 7.7% 7.5% 6.3%
United States California San Diego County San Diego City ZCTA 92127
Employer Type
Private Wage & Salary workers Federal, state, or local government
Self-employed (not incorporated business)

Source: American Community Survey 5-Year Estimates 2009-2013
26.0 27.0
24.0 22.0
26.0
United States California San Diego County San Diego City ZCTA 92127
Commuting to Work (Mean Travel Time)

Source: American Community Survey 5-Year Estimates 2009-2013
$53,046 $61,094 $62,962 $64,058
$120,106
United States California San Diego County San Diego City ZCTA 92127
Median Household Income

Source: American Community Survey 5-Year Estimates 2009-2013
11% 12%
10% 11%
2%
United States California San Diego County San Diego City ZCTA 92127
Families below Proverty Level

Source: American Community Survey 5-Year Estimates 2009-2013
31%
27% 25%
27%
7%
United States California San Diego County San Diego City ZCTA 92127
Female Householder (no husband) below Poverty Level

Source: American Community Survey 5-Year Estimates 2009-2013
85% 82% 83% 83%
95%
15% 18% 17% 17%
5%
United States California San Diego County San Diego City ZCTA 92127
Insurance Coverage With Health Insurance No Health Insurance

Source: American Community Survey 5-Year Estimates 2009-2013
65.0%
55.0% 54.0% 48.0%
72.0%
35.0%
45.0% 46.0% 52.0%
28.0%
United States California San Diego County San Diego City ZCTA 92127
Tenure Owner Occupied Renters

Margin of Error (MOE) Margin of Error Definition: A measure of the precision of an estimate at a given level of confidence (90%, 95%, 99%) -- MOEs at the 90% confidence level for all published ACS estimates Confidence Interval Definition: A range that is expected to contain the population value of the characteristic with a known probability Note: The previous slides’ data are not tested for statistical significance

Importance of Census Bureau Data Censuses, Surveys and Estimates Decennial Census and the American Community
Survey (ACS) Statistics Selected ACS Characteristics Population Projections
Accessing Census Bureau Data
Overview

Mobile Apps census.gov/mobile

55
America’s Economy • Provides the latest data for the
principal federal economic indicators, including BEA and BLS; 20 indicators
• Allows businesses to have this information at their finger tips when making important decisions everyday.
• Added BLS’s Consumer Price Index (CPI), Producer Price Index (PPI) and Non-farm Payroll; Rental Vacancy Rates

dwellr Uses your preferences to create
a list of top 25 places and gives you information about each one.
Uses the GPS feature in your phone to provide you with statistics for your current location.
Uses statistics that are powered by the American Community Survey,
56

POP QUIZ
This new mobile app from the Census
Bureau challenges a user's knowledge of the 50 states and the District of Columbia.
Census PoP Quiz is available for download to Android and Apple products.
57

Census Data Products Population Finder Quick Facts Easy Stats Census Explorer Community Facts in AFF Narrative Profiles Address Search & Census Tract Data

Contact Information: Armando Mendoza
Los Angeles Regional Office Partnership and Data Services
888.806.6389 Email: [email protected]
Telephone: 818.554.3606