u.s. census bureau u.s. bureau of economic analysis news
TRANSCRIPT
U.S. Census Bureau U.S. Bureau of Economic Analysis
NEWS U.S. Department of Commerce • Washington, D.C. 20230
FOR IMMEDIATE RELEASE 8:30 A.M. EDT TUESDAY, JUNE 10, 2008
U.S. INTERNATIONAL TRADE IN GOODS AND SERVICES
Annual Revision for 2007
For information on goods contact: U.S. Census Bureau: Nick Orsini 301-763-6959 Maria Iseman 301-763-2311
For information on services contact: U.S. Bureau of Economic Analysis: Technical: Christopher Bach 202-606-9545 Media: Ralph Stewart 202-606-2649 CB08-89 BEA08-26, FT-900 (08-04)

-BLANK PAGE-
NOTICE In this release and the accompanying “U.S. International Trade in Goods and Services: April 2008,” the U.S. Census Bureau and the U.S. Bureau of Economic Analysis (BEA) are jointly publishing revised data on U.S. trade in goods for 2005-2007 and the first three months of 2008 and revised data on services for 2004-2007 and the first three months of 2008. Goods The 2007 not seasonally adjusted Census-basis goods data were revised to redistribute monthly data that arrived too late for inclusion in the month of transaction but that were included, initially, in the month in which the data were received. In addition, corrections were made to previously published data. Once the redistributions of data to the proper month of transaction and corrections were completed, factors for seasonal adjustment and trading day adjustments were recomputed and the seasonally adjusted current-dollar series were revised for 2005-2007 and the first three months of 2008. Similar changes were made to the chain-weighted dollar series. Also, the balance of payments adjustments to the Census-basis data have been revised to incorporate updated source data. Services The services estimates were revised for 2004-2007 and the first three months of 2008. The revisions resulted largely from incorporation of results from BEA’s benchmark survey of U.S. direct investment abroad for 2004 and its quarterly surveys of direct investment abroad for 2005, as well as from its quarterly surveys of foreign direct investment in the United States for 2005, from BEA’s benchmark survey of selected international services for 2006, and from BEA’s quarterly surveys of selected international services beginning in the first quarter of 2007. Revisions from these sources have an impact mostly on receipts and payments for 2006-2007. The revisions to services receipts are larger than the revisions to services payments. Most of the revisions are to royalties and license fees and to “other private services.” The revisions result from recent BEA initiatives to better capture movements of large and volatile categories of transactions, as well as to improve the coverage of transactions.
Exhibit 18 U.S. International Trade in Goods and Services. . . . . . . . . . . . . . . . . . . . . . . . . . . . . . . . . . . . . 62 Exhibit 19 U.S. Services by Major Category – Exports. . . . . . . . . . . . . . . . . . . . . . . . . . . . . . . . . . . . . . 63 Exhibit 20 U.S. Services by Major Category – Imports. . . . . . . . . . . . . . . . . . . . . . . . . . . . . . . . . . . . . . 64
TABLE OF CONTENTS Seasonally Adjusted Exhibit 1 U.S. International Trade in Goods and Services. . . . . . . . . . . . . . . . . . . . . . . . . . . . . . . . . .
1
Exhibit 2 U.S. Services by Major Category --Exports . . . . . . . . . . . . . . . . . . . . . . . . . . . . . . . . . . . .
2
Exhibit 3 U.S. Services by Major Category --Imports . . . . . . . . . . . . . . . . . . . . . . . . . . . . . . . . . . . .
3
Exhibit 4 U.S. Trade in Goods . . . . . . . . . . . . . . . . . . . . . . . . . . . . . . . . . . . . . . . . . . . . . . . . . . . . .
4
Exhibit 5 Exports of Goods by Principal End-Use Category . . . . . . . . . . . . . . . . . . . . . . . . . . . . . . . .
5
Exhibit 5a Imports of Goods by Principal End-Use Category . . . . . . . . . . . . . . . . . . . . . . . . . . . . . . . .
6
Exhibit 6 Exports of Goods by End-Use Category and Commodity . . . . . . . . . . . . . . . . . . . . . . . . . .
7
Exhibit 7 Imports of Goods by End-Use Category and Commodity . . . . . . . . . . . . . . . . . . . . . . . . . .
9
Exhibit 8 Exports, Imports, and Balance of Goods, Petroleum and Non-Petroleum End-Use Category Totals
11
Exhibit 9 Exhibit 9a
Real Exports of Goods by Principal End-Use Category (2000 Chain-weighted dollars) . . . . . Real Imports of Goods by Principal End-Use Category (2000 Chain-weighted dollars) . . . . .
12 13
Exhibit 10 Real Exports, Imports, and Balance of Goods, Petroleum and Non-Petroleum End-Use Commodity Category Totals (2000 Chain-weighted dollars). . . . . . . . . . . . . . . . . . . . . . . . . . .
14
Not Seasonally Adjusted Exhibit 11 U.S. Trade in Goods . . . . . . . . . . . . . . . . . . . . . . . . . . . . . . . . . . . . . . . . . . . . . . . . . . . . .
15
Exhibit 12 Exhibit 12a
Exports of Goods by Principal End-Use Category . . . . . . . . . . . . . . . . . . . . . . . . . . . . . . . . Imports of Good by Principal End-Use Category . . . . . . . . . . . . . . . . . . . . . . . . . . . . . . . . .
16 17
Exhibit 13 Exports, Imports, and Trade Balance by Country and Area: 2007 . . . . . . . . . . . . . . . . . . . . . . .
18
Exhibit 14 Exports and Imports of Goods by Principal SITC Commodity Groupings: 2007 . . . . . . . . . . .
43
Exhibit 15 Exports, Imports, and Balance of Advanced Technology Products. . . . . . . . . . . . . . . . . . . . . . .
51
Exhibit 15a Exports, Imports, and Balance of Advanced Technology Products by Technology Group and Selected Countries and Areas: 2007 . . . . . . . . . . . . . . . . . . . . . . . . . . . . . . . . . .
52
Exhibit 16 Imports of Energy-Related Petroleum Products, Including Crude Oil . . . . . . . . . . . . . . . . . . . .
56
Exhibit 17 Exports and Imports of Motor Vehicles and Parts by Selected Countries: 2007 .. . . . . . . . . . . .
57
2002-2004 Data
1
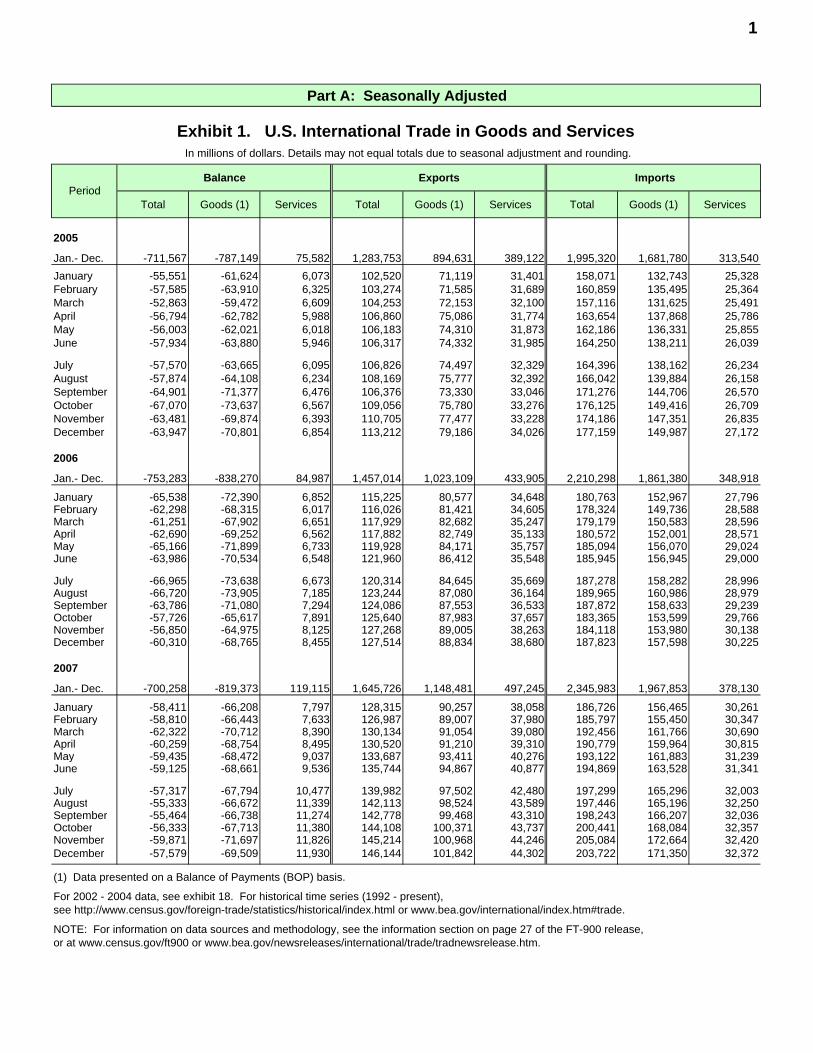
Part A: Seasonally Adjusted
Exhibit 1. U.S. International Trade in Goods and ServicesIn millions of dollars. Details may not equal totals due to seasonal adjustment and rounding.
Balance Exports Imports
Total Goods (1) Services Total Goods (1) Services Total Goods (1) Services
2005
Jan.- Dec. -711,567 -787,149 75,582 1,283,753 894,631 389,122 1,995,320 1,681,780 313,540January -55,551 -61,624 6,073 102,520 71,119 31,401 158,071 132,743 25,328February -57,585 -63,910 6,325 103,274 71,585 31,689 160,859 135,495 25,364March -52,863 -59,472 6,609 104,253 72,153 32,100 157,116 131,625 25,491April -56,794 -62,782 5,988 106,860 75,086 31,774 163,654 137,868 25,786May -56,003 -62,021 6,018 106,183 74,310 31,873 162,186 136,331 25,855June -57,934 -63,880 5,946 106,317 74,332 31,985 164,250 138,211 26,039
July -57,570 -63,665 6,095 106,826 74,497 32,329 164,396 138,162 26,234August -57,874 -64,108 6,234 108,169 75,777 32,392 166,042 139,884 26,158September -64,901 -71,377 6,476 106,376 73,330 33,046 171,276 144,706 26,570October -67,070 -73,637 6,567 109,056 75,780 33,276 176,125 149,416 26,709November -63,481 -69,874 6,393 110,705 77,477 33,228 174,186 147,351 26,835December -63,947 -70,801 6,854 113,212 79,186 34,026 177,159 149,987 27,172
2006
Jan.- Dec. -753,283 -838,270 84,987 1,457,014 1,023,109 433,905 2,210,298 1,861,380 348,918
January -65,538 -72,390 6,852 115,225 80,577 34,648 180,763 152,967 27,796February -62,298 -68,315 6,017 116,026 81,421 34,605 178,324 149,736 28,588March -61,251 -67,902 6,651 117,929 82,682 35,247 179,179 150,583 28,596April -62,690 -69,252 6,562 117,882 82,749 35,133 180,572 152,001 28,571May -65,166 -71,899 6,733 119,928 84,171 35,757 185,094 156,070 29,024June -63,986 -70,534 6,548 121,960 86,412 35,548 185,945 156,945 29,000
July -66,965 -73,638 6,673 120,314 84,645 35,669 187,278 158,282 28,996August -66,720 -73,905 7,185 123,244 87,080 36,164 189,965 160,986 28,979September -63,786 -71,080 7,294 124,086 87,553 36,533 187,872 158,633 29,239October -57,726 -65,617 7,891 125,640 87,983 37,657 183,365 153,599 29,766November -56,850 -64,975 8,125 127,268 89,005 38,263 184,118 153,980 30,138December -60,310 -68,765 8,455 127,514 88,834 38,680 187,823 157,598 30,225
2007
Jan.- Dec. -700,258 -819,373 119,115 1,645,726 1,148,481 497,245 2,345,983 1,967,853 378,130
January -58,411 -66,208 7,797 128,315 90,257 38,058 186,726 156,465 30,261February -58,810 -66,443 7,633 126,987 89,007 37,980 185,797 155,450 30,347March -62,322 -70,712 8,390 130,134 91,054 39,080 192,456 161,766 30,690April -60,259 -68,754 8,495 130,520 91,210 39,310 190,779 159,964 30,815May -59,435 -68,472 9,037 133,687 93,411 40,276 193,122 161,883 31,239June -59,125 -68,661 9,536 135,744 94,867 40,877 194,869 163,528 31,341
July -57,317 -67,794 10,477 139,982 97,502 42,480 197,299 165,296 32,003August -55,333 -66,672 11,339 142,113 98,524 43,589 197,446 165,196 32,250September -55,464 -66,738 11,274 142,778 99,468 43,310 198,243 166,207 32,036October -56,333 -67,713 11,380 144,108 100,371 43,737 200,441 168,084 32,357November -59,871 -71,697 11,826 145,214 100,968 44,246 205,084 172,664 32,420December -57,579 -69,509 11,930 146,144 101,842 44,302 203,722 171,350 32,372
(1) Data presented on a Balance of Payments (BOP) basis.
For 2002 - 2004 data, see exhibit 18. For historical time series (1992 - present), see http://www.census.gov/foreign-trade/statistics/historical/index.html or www.bea.gov/international/index.htm#trade.
NOTE: For information on data sources and methodology, see the information section on page 27 of the FT-900 release,or at www.census.gov/ft900 or www.bea.gov/newsreleases/international/trade/tradnewsrelease.htm.
Period
2
Part A: Seasonally Adjusted
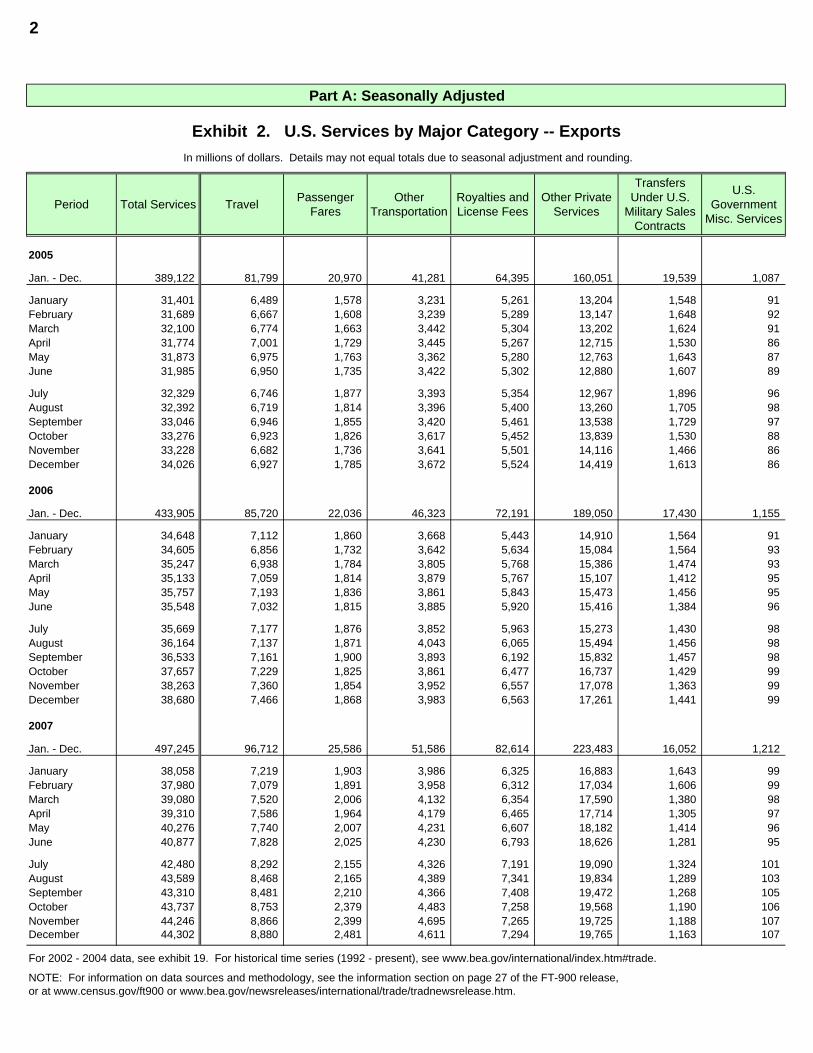
Exhibit 2. U.S. Services by Major Category -- ExportsIn millions of dollars. Details may not equal totals due to seasonal adjustment and rounding.
Period Total Services Travel Passenger Fares
Other Transportation
Royalties and License Fees
Other Private Services
Transfers Under U.S.
Military Sales Contracts
U.S. Government
Misc. Services
2005
Jan. - Dec. 389,122 81,799 20,970 41,281 64,395 160,051 19,539 1,087
January 31,401 6,489 1,578 3,231 5,261 13,204 1,548 91February 31,689 6,667 1,608 3,239 5,289 13,147 1,648 92March 32,100 6,774 1,663 3,442 5,304 13,202 1,624 91April 31,774 7,001 1,729 3,445 5,267 12,715 1,530 86May 31,873 6,975 1,763 3,362 5,280 12,763 1,643 87June 31,985 6,950 1,735 3,422 5,302 12,880 1,607 89
July 32,329 6,746 1,877 3,393 5,354 12,967 1,896 96August 32,392 6,719 1,814 3,396 5,400 13,260 1,705 98September 33,046 6,946 1,855 3,420 5,461 13,538 1,729 97October 33,276 6,923 1,826 3,617 5,452 13,839 1,530 88November 33,228 6,682 1,736 3,641 5,501 14,116 1,466 86December 34,026 6,927 1,785 3,672 5,524 14,419 1,613 86
2006
Jan. - Dec. 433,905 85,720 22,036 46,323 72,191 189,050 17,430 1,155
January 34,648 7,112 1,860 3,668 5,443 14,910 1,564 91February 34,605 6,856 1,732 3,642 5,634 15,084 1,564 93March 35,247 6,938 1,784 3,805 5,768 15,386 1,474 93April 35,133 7,059 1,814 3,879 5,767 15,107 1,412 95May 35,757 7,193 1,836 3,861 5,843 15,473 1,456 95June 35,548 7,032 1,815 3,885 5,920 15,416 1,384 96
July 35,669 7,177 1,876 3,852 5,963 15,273 1,430 98August 36,164 7,137 1,871 4,043 6,065 15,494 1,456 98September 36,533 7,161 1,900 3,893 6,192 15,832 1,457 98October 37,657 7,229 1,825 3,861 6,477 16,737 1,429 99November 38,263 7,360 1,854 3,952 6,557 17,078 1,363 99December 38,680 7,466 1,868 3,983 6,563 17,261 1,441 99
2007
Jan. - Dec. 497,245 96,712 25,586 51,586 82,614 223,483 16,052 1,212
January 38,058 7,219 1,903 3,986 6,325 16,883 1,643 99February 37,980 7,079 1,891 3,958 6,312 17,034 1,606 99March 39,080 7,520 2,006 4,132 6,354 17,590 1,380 98April 39,310 7,586 1,964 4,179 6,465 17,714 1,305 97May 40,276 7,740 2,007 4,231 6,607 18,182 1,414 96June 40,877 7,828 2,025 4,230 6,793 18,626 1,281 95
July 42,480 8,292 2,155 4,326 7,191 19,090 1,324 101August 43,589 8,468 2,165 4,389 7,341 19,834 1,289 103September 43,310 8,481 2,210 4,366 7,408 19,472 1,268 105October 43,737 8,753 2,379 4,483 7,258 19,568 1,190 106November 44,246 8,866 2,399 4,695 7,265 19,725 1,188 107December 44,302 8,880 2,481 4,611 7,294 19,765 1,163 107
For 2002 - 2004 data, see exhibit 19. For historical time series (1992 - present), see www.bea.gov/international/index.htm#trade.
NOTE: For information on data sources and methodology, see the information section on page 27 of the FT-900 release,or at www.census.gov/ft900 or www.bea.gov/newsreleases/international/trade/tradnewsrelease.htm.
3
Part A: Seasonally Adjusted
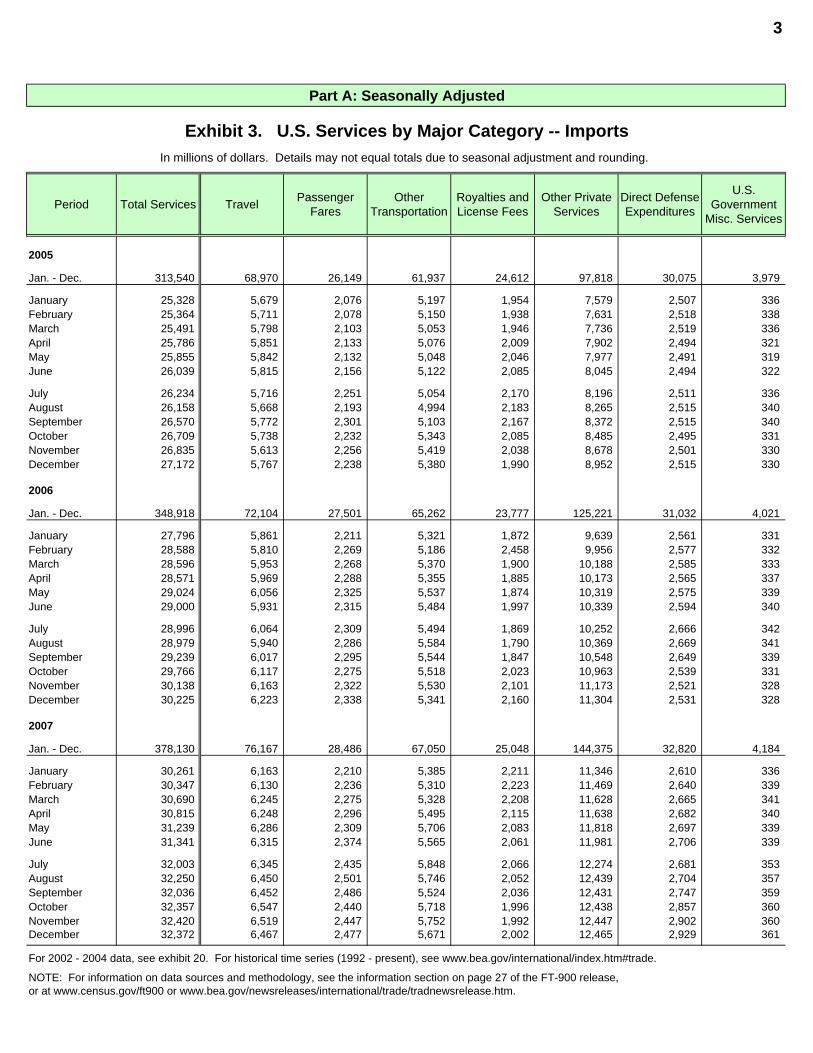
Exhibit 3. U.S. Services by Major Category -- ImportsIn millions of dollars. Details may not equal totals due to seasonal adjustment and rounding.
Period Total Services Travel Passenger Fares
Other Transportation
Royalties and License Fees
Other Private Services
Direct Defense Expenditures
U.S. Government
Misc. Services
2005
Jan. - Dec. 313,540 68,970 26,149 61,937 24,612 97,818 30,075 3,979
January 25,328 5,679 2,076 5,197 1,954 7,579 2,507 336February 25,364 5,711 2,078 5,150 1,938 7,631 2,518 338March 25,491 5,798 2,103 5,053 1,946 7,736 2,519 336April 25,786 5,851 2,133 5,076 2,009 7,902 2,494 321May 25,855 5,842 2,132 5,048 2,046 7,977 2,491 319June 26,039 5,815 2,156 5,122 2,085 8,045 2,494 322
July 26,234 5,716 2,251 5,054 2,170 8,196 2,511 336August 26,158 5,668 2,193 4,994 2,183 8,265 2,515 340September 26,570 5,772 2,301 5,103 2,167 8,372 2,515 340October 26,709 5,738 2,232 5,343 2,085 8,485 2,495 331November 26,835 5,613 2,256 5,419 2,038 8,678 2,501 330December 27,172 5,767 2,238 5,380 1,990 8,952 2,515 330
2006
Jan. - Dec. 348,918 72,104 27,501 65,262 23,777 125,221 31,032 4,021
January 27,796 5,861 2,211 5,321 1,872 9,639 2,561 331February 28,588 5,810 2,269 5,186 2,458 9,956 2,577 332March 28,596 5,953 2,268 5,370 1,900 10,188 2,585 333April 28,571 5,969 2,288 5,355 1,885 10,173 2,565 337May 29,024 6,056 2,325 5,537 1,874 10,319 2,575 339June 29,000 5,931 2,315 5,484 1,997 10,339 2,594 340
July 28,996 6,064 2,309 5,494 1,869 10,252 2,666 342August 28,979 5,940 2,286 5,584 1,790 10,369 2,669 341September 29,239 6,017 2,295 5,544 1,847 10,548 2,649 339October 29,766 6,117 2,275 5,518 2,023 10,963 2,539 331November 30,138 6,163 2,322 5,530 2,101 11,173 2,521 328December 30,225 6,223 2,338 5,341 2,160 11,304 2,531 328
2007
Jan. - Dec. 378,130 76,167 28,486 67,050 25,048 144,375 32,820 4,184
January 30,261 6,163 2,210 5,385 2,211 11,346 2,610 336February 30,347 6,130 2,236 5,310 2,223 11,469 2,640 339March 30,690 6,245 2,275 5,328 2,208 11,628 2,665 341April 30,815 6,248 2,296 5,495 2,115 11,638 2,682 340May 31,239 6,286 2,309 5,706 2,083 11,818 2,697 339June 31,341 6,315 2,374 5,565 2,061 11,981 2,706 339
July 32,003 6,345 2,435 5,848 2,066 12,274 2,681 353August 32,250 6,450 2,501 5,746 2,052 12,439 2,704 357September 32,036 6,452 2,486 5,524 2,036 12,431 2,747 359October 32,357 6,547 2,440 5,718 1,996 12,438 2,857 360November 32,420 6,519 2,447 5,752 1,992 12,447 2,902 360December 32,372 6,467 2,477 5,671 2,002 12,465 2,929 361
For 2002 - 2004 data, see exhibit 20. For historical time series (1992 - present), see www.bea.gov/international/index.htm#trade.
NOTE: For information on data sources and methodology, see the information section on page 27 of the FT-900 release,or at www.census.gov/ft900 or www.bea.gov/newsreleases/international/trade/tradnewsrelease.htm.
4
Part A: Seasonally Adjusted
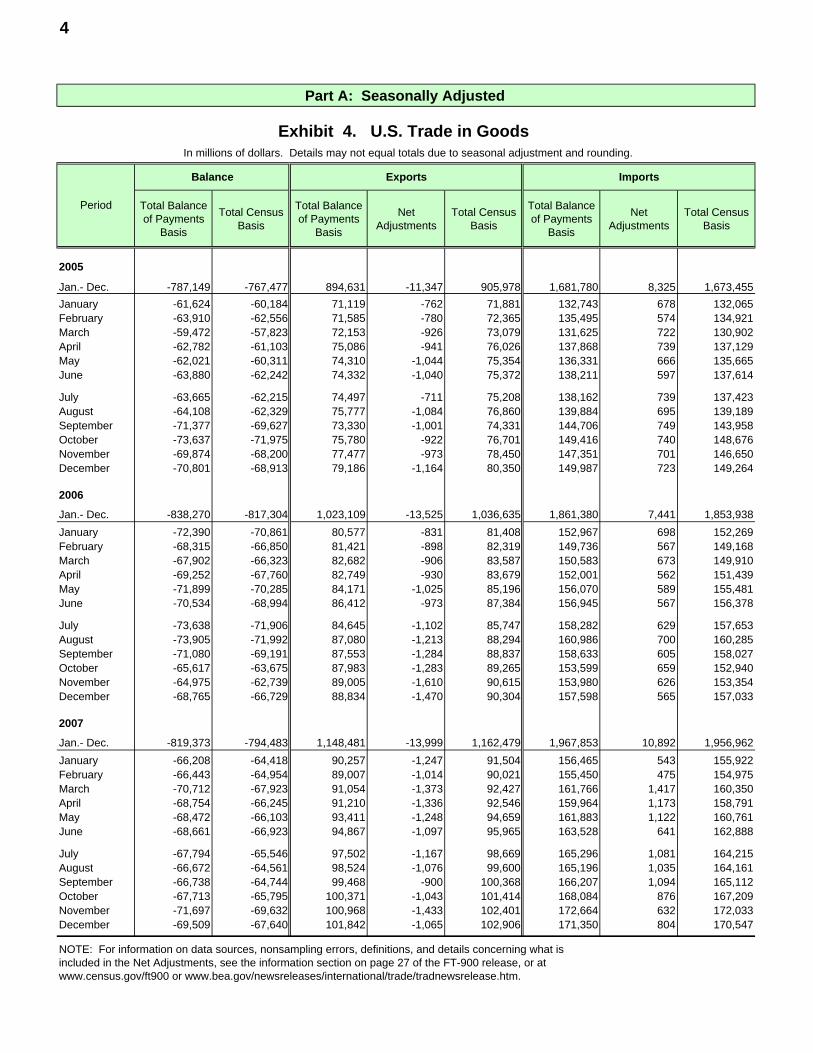
Exhibit 4. U.S. Trade in Goods In millions of dollars. Details may not equal totals due to seasonal adjustment and rounding.
Balance Exports Imports
Total Balance of Payments
Basis
Total Census Basis
Total Balance of Payments
Basis
Net Adjustments
Total Census Basis
Total Balance of Payments
Basis
Net Adjustments
Total Census Basis
2005
Jan.- Dec. -787,149 -767,477 894,631 -11,347 905,978 1,681,780 8,325 1,673,455January -61,624 -60,184 71,119 -762 71,881 132,743 678 132,065February -63,910 -62,556 71,585 -780 72,365 135,495 574 134,921March -59,472 -57,823 72,153 -926 73,079 131,625 722 130,902April -62,782 -61,103 75,086 -941 76,026 137,868 739 137,129May -62,021 -60,311 74,310 -1,044 75,354 136,331 666 135,665June -63,880 -62,242 74,332 -1,040 75,372 138,211 597 137,614
July -63,665 -62,215 74,497 -711 75,208 138,162 739 137,423August -64,108 -62,329 75,777 -1,084 76,860 139,884 695 139,189September -71,377 -69,627 73,330 -1,001 74,331 144,706 749 143,958October -73,637 -71,975 75,780 -922 76,701 149,416 740 148,676November -69,874 -68,200 77,477 -973 78,450 147,351 701 146,650December -70,801 -68,913 79,186 -1,164 80,350 149,987 723 149,264
2006
Jan.- Dec. -838,270 -817,304 1,023,109 -13,525 1,036,635 1,861,380 7,441 1,853,938January -72,390 -70,861 80,577 -831 81,408 152,967 698 152,269February -68,315 -66,850 81,421 -898 82,319 149,736 567 149,168March -67,902 -66,323 82,682 -906 83,587 150,583 673 149,910April -69,252 -67,760 82,749 -930 83,679 152,001 562 151,439May -71,899 -70,285 84,171 -1,025 85,196 156,070 589 155,481June -70,534 -68,994 86,412 -973 87,384 156,945 567 156,378
July -73,638 -71,906 84,645 -1,102 85,747 158,282 629 157,653August -73,905 -71,992 87,080 -1,213 88,294 160,986 700 160,285September -71,080 -69,191 87,553 -1,284 88,837 158,633 605 158,027October -65,617 -63,675 87,983 -1,283 89,265 153,599 659 152,940November -64,975 -62,739 89,005 -1,610 90,615 153,980 626 153,354December -68,765 -66,729 88,834 -1,470 90,304 157,598 565 157,033
2007
Jan.- Dec. -819,373 -794,483 1,148,481 -13,999 1,162,479 1,967,853 10,892 1,956,962January -66,208 -64,418 90,257 -1,247 91,504 156,465 543 155,922February -66,443 -64,954 89,007 -1,014 90,021 155,450 475 154,975March -70,712 -67,923 91,054 -1,373 92,427 161,766 1,417 160,350April -68,754 -66,245 91,210 -1,336 92,546 159,964 1,173 158,791May -68,472 -66,103 93,411 -1,248 94,659 161,883 1,122 160,761June -68,661 -66,923 94,867 -1,097 95,965 163,528 641 162,888
July -67,794 -65,546 97,502 -1,167 98,669 165,296 1,081 164,215August -66,672 -64,561 98,524 -1,076 99,600 165,196 1,035 164,161September -66,738 -64,744 99,468 -900 100,368 166,207 1,094 165,112October -67,713 -65,795 100,371 -1,043 101,414 168,084 876 167,209November -71,697 -69,632 100,968 -1,433 102,401 172,664 632 172,033December -69,509 -67,640 101,842 -1,065 102,906 171,350 804 170,547
NOTE: For information on data sources, nonsampling errors, definitions, and details concerning what is included in the Net Adjustments, see the information section on page 27 of the FT-900 release, or at www.census.gov/ft900 or www.bea.gov/newsreleases/international/trade/tradnewsrelease.htm.
Period
5
Part A: Seasonally Adjusted
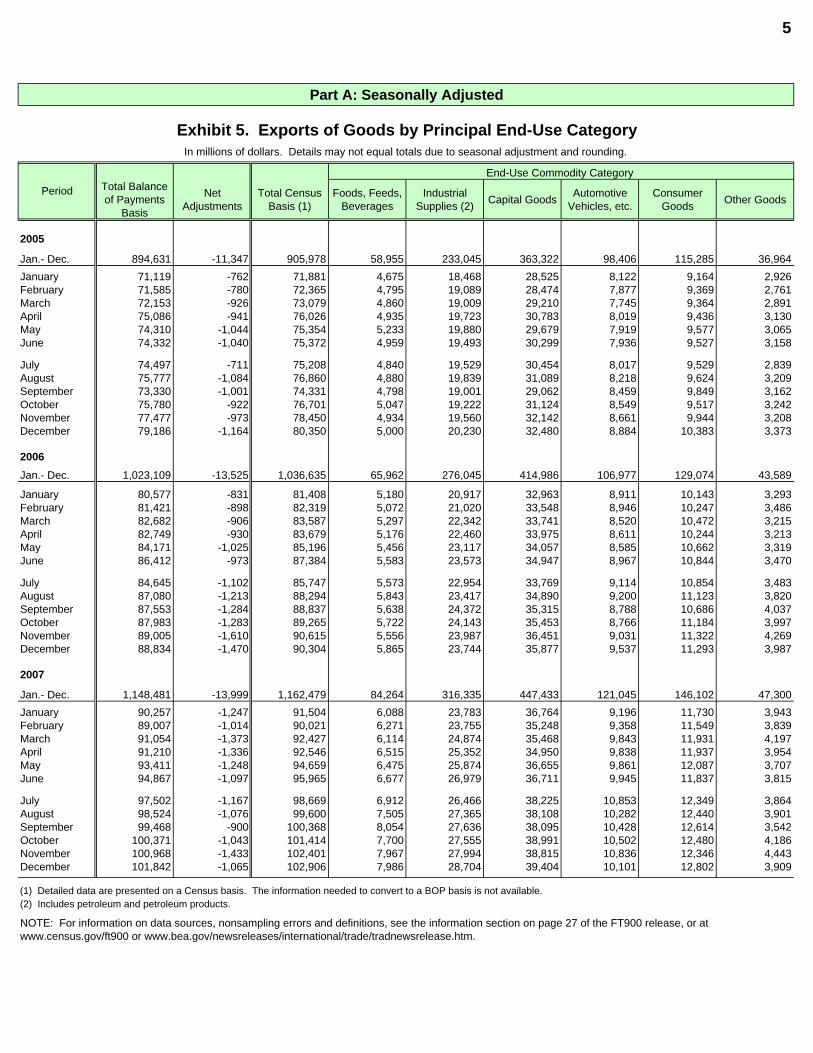
Exhibit 5. Exports of Goods by Principal End-Use CategoryIn millions of dollars. Details may not equal totals due to seasonal adjustment and rounding.
End-Use Commodity Category Total Balance of Payments
Basis
Net Adjustments
Total Census Basis (1)
Foods, Feeds, Beverages
Industrial Supplies (2) Capital Goods Automotive
Vehicles, etc.Consumer
Goods Other Goods
2005
Jan.- Dec. 894,631 -11,347 905,978 58,955 233,045 363,322 98,406 115,285 36,964January 71,119 -762 71,881 4,675 18,468 28,525 8,122 9,164 2,926February 71,585 -780 72,365 4,795 19,089 28,474 7,877 9,369 2,761March 72,153 -926 73,079 4,860 19,009 29,210 7,745 9,364 2,891April 75,086 -941 76,026 4,935 19,723 30,783 8,019 9,436 3,130May 74,310 -1,044 75,354 5,233 19,880 29,679 7,919 9,577 3,065June 74,332 -1,040 75,372 4,959 19,493 30,299 7,936 9,527 3,158
July 74,497 -711 75,208 4,840 19,529 30,454 8,017 9,529 2,839August 75,777 -1,084 76,860 4,880 19,839 31,089 8,218 9,624 3,209September 73,330 -1,001 74,331 4,798 19,001 29,062 8,459 9,849 3,162October 75,780 -922 76,701 5,047 19,222 31,124 8,549 9,517 3,242November 77,477 -973 78,450 4,934 19,560 32,142 8,661 9,944 3,208December 79,186 -1,164 80,350 5,000 20,230 32,480 8,884 10,383 3,373
2006Jan.- Dec. 1,023,109 -13,525 1,036,635 65,962 276,045 414,986 106,977 129,074 43,589
January 80,577 -831 81,408 5,180 20,917 32,963 8,911 10,143 3,293February 81,421 -898 82,319 5,072 21,020 33,548 8,946 10,247 3,486March 82,682 -906 83,587 5,297 22,342 33,741 8,520 10,472 3,215April 82,749 -930 83,679 5,176 22,460 33,975 8,611 10,244 3,213May 84,171 -1,025 85,196 5,456 23,117 34,057 8,585 10,662 3,319June 86,412 -973 87,384 5,583 23,573 34,947 8,967 10,844 3,470
July 84,645 -1,102 85,747 5,573 22,954 33,769 9,114 10,854 3,483August 87,080 -1,213 88,294 5,843 23,417 34,890 9,200 11,123 3,820September 87,553 -1,284 88,837 5,638 24,372 35,315 8,788 10,686 4,037October 87,983 -1,283 89,265 5,722 24,143 35,453 8,766 11,184 3,997November 89,005 -1,610 90,615 5,556 23,987 36,451 9,031 11,322 4,269December 88,834 -1,470 90,304 5,865 23,744 35,877 9,537 11,293 3,987
2007
Jan.- Dec. 1,148,481 -13,999 1,162,479 84,264 316,335 447,433 121,045 146,102 47,300January 90,257 -1,247 91,504 6,088 23,783 36,764 9,196 11,730 3,943February 89,007 -1,014 90,021 6,271 23,755 35,248 9,358 11,549 3,839March 91,054 -1,373 92,427 6,114 24,874 35,468 9,843 11,931 4,197April 91,210 -1,336 92,546 6,515 25,352 34,950 9,838 11,937 3,954May 93,411 -1,248 94,659 6,475 25,874 36,655 9,861 12,087 3,707June 94,867 -1,097 95,965 6,677 26,979 36,711 9,945 11,837 3,815
July 97,502 -1,167 98,669 6,912 26,466 38,225 10,853 12,349 3,864August 98,524 -1,076 99,600 7,505 27,365 38,108 10,282 12,440 3,901September 99,468 -900 100,368 8,054 27,636 38,095 10,428 12,614 3,542October 100,371 -1,043 101,414 7,700 27,555 38,991 10,502 12,480 4,186November 100,968 -1,433 102,401 7,967 27,994 38,815 10,836 12,346 4,443December 101,842 -1,065 102,906 7,986 28,704 39,404 10,101 12,802 3,909
(1) Detailed data are presented on a Census basis. The information needed to convert to a BOP basis is not available.(2) Includes petroleum and petroleum products.
NOTE: For information on data sources, nonsampling errors and definitions, see the information section on page 27 of the FT900 release, or atwww.census.gov/ft900 or www.bea.gov/newsreleases/international/trade/tradnewsrelease.htm.
Period
6
Part A: Seasonally Adjusted
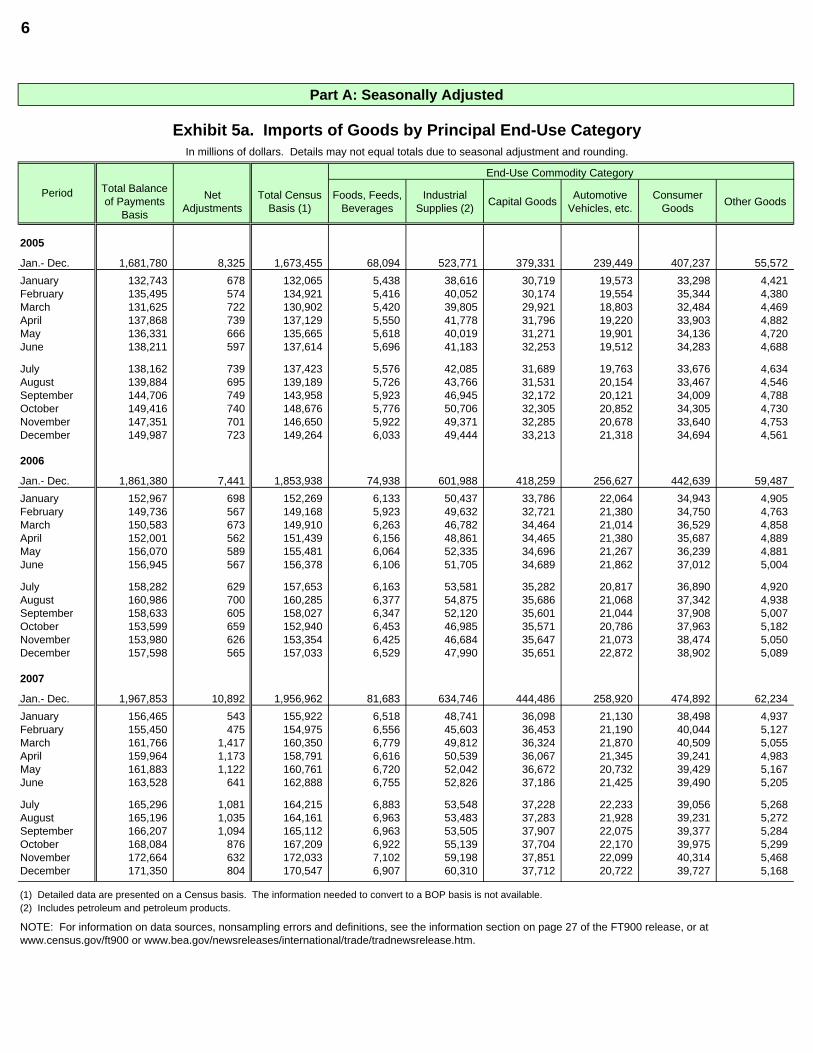
Exhibit 5a. Imports of Goods by Principal End-Use Category In millions of dollars. Details may not equal totals due to seasonal adjustment and rounding.
End-Use Commodity Category Total Balance of Payments
Basis
Net Adjustments
Total Census Basis (1)
Foods, Feeds, Beverages
Industrial Supplies (2) Capital Goods Automotive
Vehicles, etc.Consumer
Goods Other Goods
2005
Jan.- Dec. 1,681,780 8,325 1,673,455 68,094 523,771 379,331 239,449 407,237 55,572January 132,743 678 132,065 5,438 38,616 30,719 19,573 33,298 4,421February 135,495 574 134,921 5,416 40,052 30,174 19,554 35,344 4,380March 131,625 722 130,902 5,420 39,805 29,921 18,803 32,484 4,469April 137,868 739 137,129 5,550 41,778 31,796 19,220 33,903 4,882May 136,331 666 135,665 5,618 40,019 31,271 19,901 34,136 4,720June 138,211 597 137,614 5,696 41,183 32,253 19,512 34,283 4,688
July 138,162 739 137,423 5,576 42,085 31,689 19,763 33,676 4,634August 139,884 695 139,189 5,726 43,766 31,531 20,154 33,467 4,546September 144,706 749 143,958 5,923 46,945 32,172 20,121 34,009 4,788October 149,416 740 148,676 5,776 50,706 32,305 20,852 34,305 4,730November 147,351 701 146,650 5,922 49,371 32,285 20,678 33,640 4,753December 149,987 723 149,264 6,033 49,444 33,213 21,318 34,694 4,561
2006
Jan.- Dec. 1,861,380 7,441 1,853,938 74,938 601,988 418,259 256,627 442,639 59,487January 152,967 698 152,269 6,133 50,437 33,786 22,064 34,943 4,905February 149,736 567 149,168 5,923 49,632 32,721 21,380 34,750 4,763March 150,583 673 149,910 6,263 46,782 34,464 21,014 36,529 4,858April 152,001 562 151,439 6,156 48,861 34,465 21,380 35,687 4,889May 156,070 589 155,481 6,064 52,335 34,696 21,267 36,239 4,881June 156,945 567 156,378 6,106 51,705 34,689 21,862 37,012 5,004
July 158,282 629 157,653 6,163 53,581 35,282 20,817 36,890 4,920August 160,986 700 160,285 6,377 54,875 35,686 21,068 37,342 4,938September 158,633 605 158,027 6,347 52,120 35,601 21,044 37,908 5,007October 153,599 659 152,940 6,453 46,985 35,571 20,786 37,963 5,182November 153,980 626 153,354 6,425 46,684 35,647 21,073 38,474 5,050December 157,598 565 157,033 6,529 47,990 35,651 22,872 38,902 5,089
2007
Jan.- Dec. 1,967,853 10,892 1,956,962 81,683 634,746 444,486 258,920 474,892 62,234January 156,465 543 155,922 6,518 48,741 36,098 21,130 38,498 4,937February 155,450 475 154,975 6,556 45,603 36,453 21,190 40,044 5,127March 161,766 1,417 160,350 6,779 49,812 36,324 21,870 40,509 5,055April 159,964 1,173 158,791 6,616 50,539 36,067 21,345 39,241 4,983May 161,883 1,122 160,761 6,720 52,042 36,672 20,732 39,429 5,167June 163,528 641 162,888 6,755 52,826 37,186 21,425 39,490 5,205
July 165,296 1,081 164,215 6,883 53,548 37,228 22,233 39,056 5,268August 165,196 1,035 164,161 6,963 53,483 37,283 21,928 39,231 5,272September 166,207 1,094 165,112 6,963 53,505 37,907 22,075 39,377 5,284October 168,084 876 167,209 6,922 55,139 37,704 22,170 39,975 5,299November 172,664 632 172,033 7,102 59,198 37,851 22,099 40,314 5,468December 171,350 804 170,547 6,907 60,310 37,712 20,722 39,727 5,168
(1) Detailed data are presented on a Census basis. The information needed to convert to a BOP basis is not available.(2) Includes petroleum and petroleum products.
NOTE: For information on data sources, nonsampling errors and definitions, see the information section on page 27 of the FT900 release, or atwww.census.gov/ft900 or www.bea.gov/newsreleases/international/trade/tradnewsrelease.htm.
Period

7
Part A: Seasonally Adjusted
Exhibit 6. Exports of Goods by End-Use Category and Commodity In millions of dollars. Details may not equal totals due to rounding. The commodities in this exhibit are ranked on the year-to-year
change within each major commodity grouping. (-) Represents zero or less than one-half unit of measurement shown.
Item (1) Annual 2007 Annual 2006 Year-to-year Change
Total, Balance of Payments Basis 1,148,481 1,023,109 125,371Net Adjustments -13,999 -13,525 -473Total, Census Basis 1,162,479 1,036,635 125,845
Foods, feeds, and beverages 84,264 65,962 18,302Wheat 8,450 4,257 4,194Soybeans 10,443 7,288 3,155Corn 11,209 8,226 2,983Meat, poultry, etc. 9,804 7,831 1,973Dairy products and eggs 2,453 1,492 961Animal feeds, n.e.c. 4,568 3,814 754Oilseeds, food oils 2,034 1,330 705Other foods 7,282 6,586 697Fruits, frozen juices 6,205 5,565 639Sorghum, barley, oats 1,227 707 519Vegetables 4,321 3,853 468Bakery products 3,458 2,997 461Nuts 3,449 3,227 223Alcoholic beverages, excluding wine 1,177 959 218Rice 1,471 1,337 134Wine, beer, and related products 1,218 1,099 119Nonagricultural foods, etc. 1,120 1,045 76Fish and shellfish 4,375 4,351 24
Industrial supplies and materials 316,335 276,045 40,290Nonmonetary gold 13,307 8,783 4,524Chemicals-organic 31,623 27,117 4,505Plastic materials 29,118 25,125 3,994Fuel oil 15,574 12,061 3,513Steelmaking materials 9,882 6,802 3,081Petroleum products, other 19,325 17,317 2,008Chemicals-other 20,421 18,653 1,768Iron and steel mill products 8,858 7,281 1,577Nonferrous metals, other 8,060 6,601 1,459Precious metals, other 8,438 7,042 1,397Finished metal shapes 15,289 13,941 1,347Pulpwood and woodpulp 7,113 5,908 1,205Newsprint 11,544 10,567 976Other industrial supplies 19,855 18,929 926Gas-natural 3,164 2,241 922Chemicals-fertilizers 6,292 5,421 871Aluminum and alumina 8,029 7,293 736Copper 5,379 4,701 677Iron and steel products, other 5,780 5,162 618Nuclear fuel materials 2,430 1,827 603Agric. industry-unmanufactured 2,126 1,579 548Natural gas liquids 2,108 1,623 484Synthetic rubber-primary 3,610 3,188 421Mineral supplies-manufactured 4,933 4,527 405Shingles, molding, wallboard 3,414 3,022 392Metallurgical grade coal 2,938 2,564 374Chemicals-inorganic 7,015 6,660 354Coal and fuels, other 1,676 1,337 339Industrial rubber products 3,249 2,930 319Agric. farming-unmanufactured 2,082 1,849 234Glass-plate, sheet, etc. 1,475 1,279 196Crude oil 751 567 184Agriculture-manufactured, other 1,917 1,739 179Hides and skins 2,183 2,056 127Logs and lumber 4,731 4,604 126Manmade cloth 5,873 5,757 116Leather and furs 1,151 1,052 99Cotton, raw 4,591 4,517 74Tobacco, unmanufactured 1,201 1,134 67Hair, waste materials 607 543 64Wood supplies, manufactured 1,280 1,222 58Nontextile floor tiles 463 416 47Nonmetallic minerals 582 596 -14Electric energy 992 1,036 -44Finished textile supplies 2,468 2,539 -72Cotton fiber cloth 2,858 3,141 -283Tapes, audio and visual 584 1,796 -1,212
8
Part A: Seasonally Adjusted
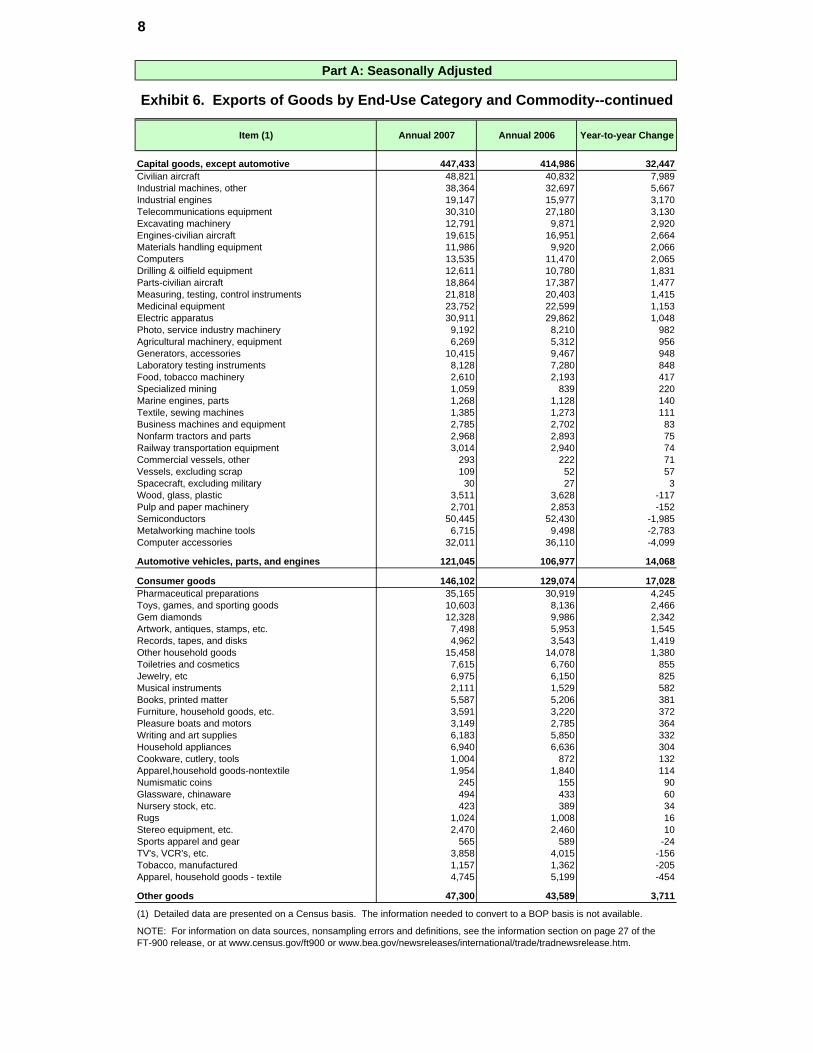
Exhibit 6. Exports of Goods by End-Use Category and Commodity--continued
Item (1) Annual 2007 Annual 2006 Year-to-year Change
Capital goods, except automotive 447,433 414,986 32,447Civilian aircraft 48,821 40,832 7,989Industrial machines, other 38,364 32,697 5,667Industrial engines 19,147 15,977 3,170Telecommunications equipment 30,310 27,180 3,130Excavating machinery 12,791 9,871 2,920Engines-civilian aircraft 19,615 16,951 2,664Materials handling equipment 11,986 9,920 2,066Computers 13,535 11,470 2,065Drilling & oilfield equipment 12,611 10,780 1,831Parts-civilian aircraft 18,864 17,387 1,477Measuring, testing, control instruments 21,818 20,403 1,415Medicinal equipment 23,752 22,599 1,153Electric apparatus 30,911 29,862 1,048Photo, service industry machinery 9,192 8,210 982Agricultural machinery, equipment 6,269 5,312 956Generators, accessories 10,415 9,467 948Laboratory testing instruments 8,128 7,280 848Food, tobacco machinery 2,610 2,193 417Specialized mining 1,059 839 220Marine engines, parts 1,268 1,128 140Textile, sewing machines 1,385 1,273 111Business machines and equipment 2,785 2,702 83Nonfarm tractors and parts 2,968 2,893 75Railway transportation equipment 3,014 2,940 74Commercial vessels, other 293 222 71Vessels, excluding scrap 109 52 57Spacecraft, excluding military 30 27 3Wood, glass, plastic 3,511 3,628 -117Pulp and paper machinery 2,701 2,853 -152Semiconductors 50,445 52,430 -1,985Metalworking machine tools 6,715 9,498 -2,783Computer accessories 32,011 36,110 -4,099
Automotive vehicles, parts, and engines 121,045 106,977 14,068
Consumer goods 146,102 129,074 17,028Pharmaceutical preparations 35,165 30,919 4,245Toys, games, and sporting goods 10,603 8,136 2,466Gem diamonds 12,328 9,986 2,342Artwork, antiques, stamps, etc. 7,498 5,953 1,545Records, tapes, and disks 4,962 3,543 1,419Other household goods 15,458 14,078 1,380Toiletries and cosmetics 7,615 6,760 855Jewelry, etc 6,975 6,150 825Musical instruments 2,111 1,529 582Books, printed matter 5,587 5,206 381Furniture, household goods, etc. 3,591 3,220 372Pleasure boats and motors 3,149 2,785 364Writing and art supplies 6,183 5,850 332Household appliances 6,940 6,636 304Cookware, cutlery, tools 1,004 872 132Apparel,household goods-nontextile 1,954 1,840 114Numismatic coins 245 155 90Glassware, chinaware 494 433 60Nursery stock, etc. 423 389 34Rugs 1,024 1,008 16Stereo equipment, etc. 2,470 2,460 10Sports apparel and gear 565 589 -24TV's, VCR's, etc. 3,858 4,015 -156Tobacco, manufactured 1,157 1,362 -205Apparel, household goods - textile 4,745 5,199 -454
Other goods 47,300 43,589 3,711
(1) Detailed data are presented on a Census basis. The information needed to convert to a BOP basis is not available.
NOTE: For information on data sources, nonsampling errors and definitions, see the information section on page 27 of theFT-900 release, or at www.census.gov/ft900 or www.bea.gov/newsreleases/international/trade/tradnewsrelease.htm.
9
Part A: Seasonally Adjusted
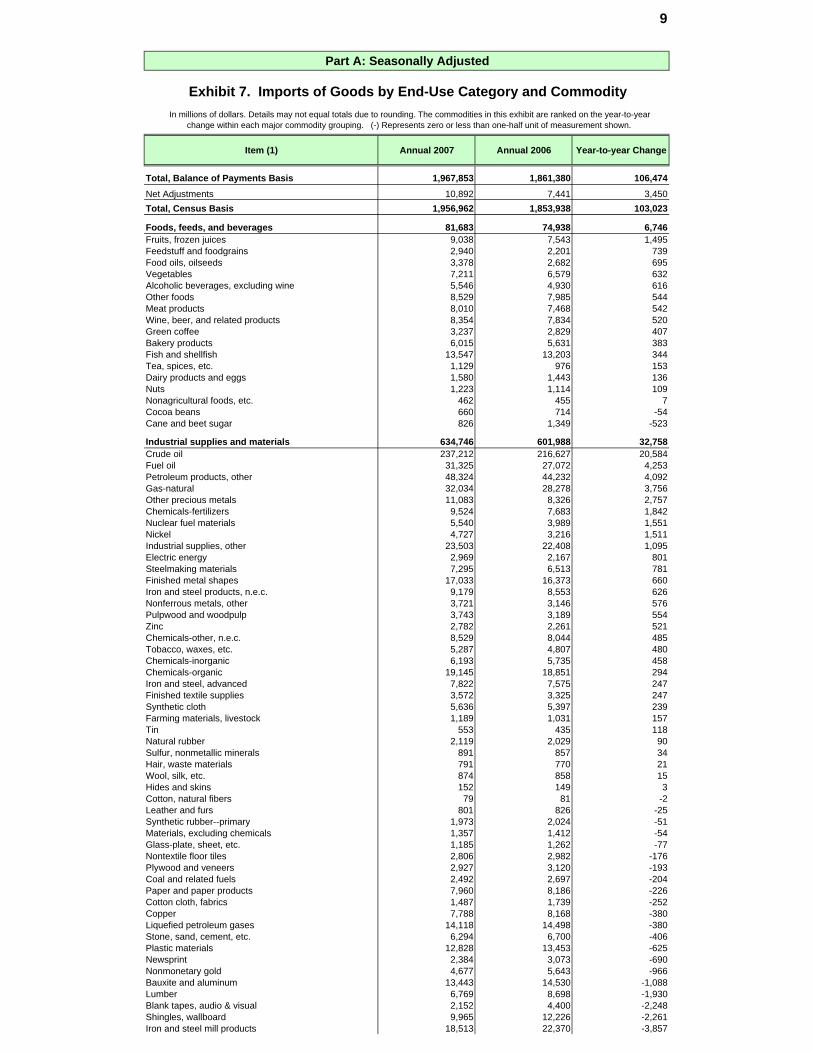
Exhibit 7. Imports of Goods by End-Use Category and CommodityIn millions of dollars. Details may not equal totals due to rounding. The commodities in this exhibit are ranked on the year-to-year
change within each major commodity grouping. (-) Represents zero or less than one-half unit of measurement shown.
Item (1) Annual 2007 Annual 2006 Year-to-year Change
Total, Balance of Payments Basis 1,967,853 1,861,380 106,474Net Adjustments 10,892 7,441 3,450Total, Census Basis 1,956,962 1,853,938 103,023
Foods, feeds, and beverages 81,683 74,938 6,746Fruits, frozen juices 9,038 7,543 1,495Feedstuff and foodgrains 2,940 2,201 739Food oils, oilseeds 3,378 2,682 695Vegetables 7,211 6,579 632Alcoholic beverages, excluding wine 5,546 4,930 616Other foods 8,529 7,985 544Meat products 8,010 7,468 542Wine, beer, and related products 8,354 7,834 520Green coffee 3,237 2,829 407Bakery products 6,015 5,631 383Fish and shellfish 13,547 13,203 344Tea, spices, etc. 1,129 976 153Dairy products and eggs 1,580 1,443 136Nuts 1,223 1,114 109Nonagricultural foods, etc. 462 455 7Cocoa beans 660 714 -54Cane and beet sugar 826 1,349 -523
Industrial supplies and materials 634,746 601,988 32,758Crude oil 237,212 216,627 20,584Fuel oil 31,325 27,072 4,253Petroleum products, other 48,324 44,232 4,092Gas-natural 32,034 28,278 3,756Other precious metals 11,083 8,326 2,757Chemicals-fertilizers 9,524 7,683 1,842Nuclear fuel materials 5,540 3,989 1,551Nickel 4,727 3,216 1,511Industrial supplies, other 23,503 22,408 1,095Electric energy 2,969 2,167 801Steelmaking materials 7,295 6,513 781Finished metal shapes 17,033 16,373 660Iron and steel products, n.e.c. 9,179 8,553 626Nonferrous metals, other 3,721 3,146 576Pulpwood and woodpulp 3,743 3,189 554Zinc 2,782 2,261 521Chemicals-other, n.e.c. 8,529 8,044 485Tobacco, waxes, etc. 5,287 4,807 480Chemicals-inorganic 6,193 5,735 458Chemicals-organic 19,145 18,851 294Iron and steel, advanced 7,822 7,575 247Finished textile supplies 3,572 3,325 247Synthetic cloth 5,636 5,397 239Farming materials, livestock 1,189 1,031 157Tin 553 435 118Natural rubber 2,119 2,029 90Sulfur, nonmetallic minerals 891 857 34Hair, waste materials 791 770 21Wool, silk, etc. 874 858 15Hides and skins 152 149 3Cotton, natural fibers 79 81 -2Leather and furs 801 826 -25Synthetic rubber--primary 1,973 2,024 -51Materials, excluding chemicals 1,357 1,412 -54Glass-plate, sheet, etc. 1,185 1,262 -77Nontextile floor tiles 2,806 2,982 -176Plywood and veneers 2,927 3,120 -193Coal and related fuels 2,492 2,697 -204Paper and paper products 7,960 8,186 -226Cotton cloth, fabrics 1,487 1,739 -252Copper 7,788 8,168 -380Liquefied petroleum gases 14,118 14,498 -380Stone, sand, cement, etc. 6,294 6,700 -406Plastic materials 12,828 13,453 -625Newsprint 2,384 3,073 -690Nonmonetary gold 4,677 5,643 -966Bauxite and aluminum 13,443 14,530 -1,088Lumber 6,769 8,698 -1,930Blank tapes, audio & visual 2,152 4,400 -2,248Shingles, wallboard 9,965 12,226 -2,261Iron and steel mill products 18,513 22,370 -3,857
10
Part A: Seasonally Adjusted
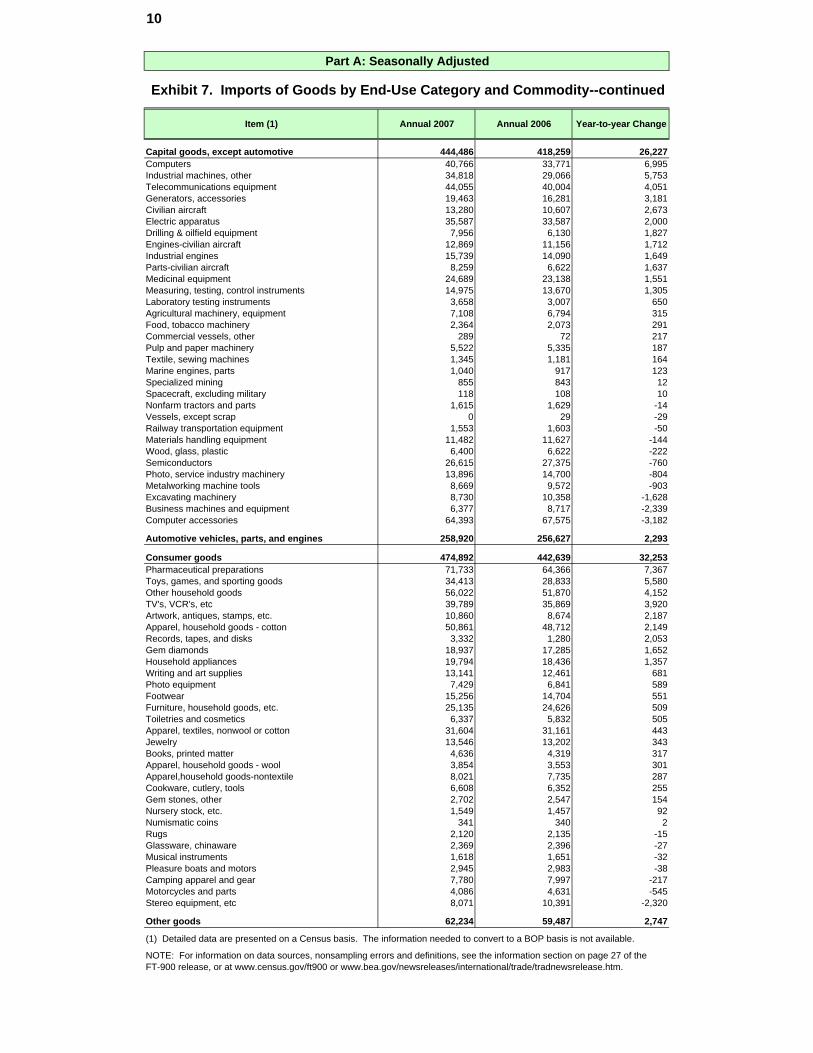
Exhibit 7. Imports of Goods by End-Use Category and Commodity--continued
Item (1) Annual 2007 Annual 2006 Year-to-year Change
Capital goods, except automotive 444,486 418,259 26,227Computers 40,766 33,771 6,995Industrial machines, other 34,818 29,066 5,753Telecommunications equipment 44,055 40,004 4,051Generators, accessories 19,463 16,281 3,181Civilian aircraft 13,280 10,607 2,673Electric apparatus 35,587 33,587 2,000Drilling & oilfield equipment 7,956 6,130 1,827Engines-civilian aircraft 12,869 11,156 1,712Industrial engines 15,739 14,090 1,649Parts-civilian aircraft 8,259 6,622 1,637Medicinal equipment 24,689 23,138 1,551Measuring, testing, control instruments 14,975 13,670 1,305Laboratory testing instruments 3,658 3,007 650Agricultural machinery, equipment 7,108 6,794 315Food, tobacco machinery 2,364 2,073 291Commercial vessels, other 289 72 217Pulp and paper machinery 5,522 5,335 187Textile, sewing machines 1,345 1,181 164Marine engines, parts 1,040 917 123Specialized mining 855 843 12Spacecraft, excluding military 118 108 10Nonfarm tractors and parts 1,615 1,629 -14Vessels, except scrap 0 29 -29Railway transportation equipment 1,553 1,603 -50Materials handling equipment 11,482 11,627 -144Wood, glass, plastic 6,400 6,622 -222Semiconductors 26,615 27,375 -760Photo, service industry machinery 13,896 14,700 -804Metalworking machine tools 8,669 9,572 -903Excavating machinery 8,730 10,358 -1,628Business machines and equipment 6,377 8,717 -2,339Computer accessories 64,393 67,575 -3,182
Automotive vehicles, parts, and engines 258,920 256,627 2,293
Consumer goods 474,892 442,639 32,253Pharmaceutical preparations 71,733 64,366 7,367Toys, games, and sporting goods 34,413 28,833 5,580Other household goods 56,022 51,870 4,152TV's, VCR's, etc 39,789 35,869 3,920Artwork, antiques, stamps, etc. 10,860 8,674 2,187Apparel, household goods - cotton 50,861 48,712 2,149Records, tapes, and disks 3,332 1,280 2,053Gem diamonds 18,937 17,285 1,652Household appliances 19,794 18,436 1,357Writing and art supplies 13,141 12,461 681Photo equipment 7,429 6,841 589Footwear 15,256 14,704 551Furniture, household goods, etc. 25,135 24,626 509Toiletries and cosmetics 6,337 5,832 505Apparel, textiles, nonwool or cotton 31,604 31,161 443Jewelry 13,546 13,202 343Books, printed matter 4,636 4,319 317Apparel, household goods - wool 3,854 3,553 301Apparel,household goods-nontextile 8,021 7,735 287Cookware, cutlery, tools 6,608 6,352 255Gem stones, other 2,702 2,547 154Nursery stock, etc. 1,549 1,457 92Numismatic coins 341 340 2Rugs 2,120 2,135 -15Glassware, chinaware 2,369 2,396 -27Musical instruments 1,618 1,651 -32Pleasure boats and motors 2,945 2,983 -38Camping apparel and gear 7,780 7,997 -217Motorcycles and parts 4,086 4,631 -545Stereo equipment, etc 8,071 10,391 -2,320
Other goods 62,234 59,487 2,747
(1) Detailed data are presented on a Census basis. The information needed to convert to a BOP basis is not available.
NOTE: For information on data sources, nonsampling errors and definitions, see the information section on page 27 of theFT-900 release, or at www.census.gov/ft900 or www.bea.gov/newsreleases/international/trade/tradnewsrelease.htm.
11
Part A: Seasonally Adjusted
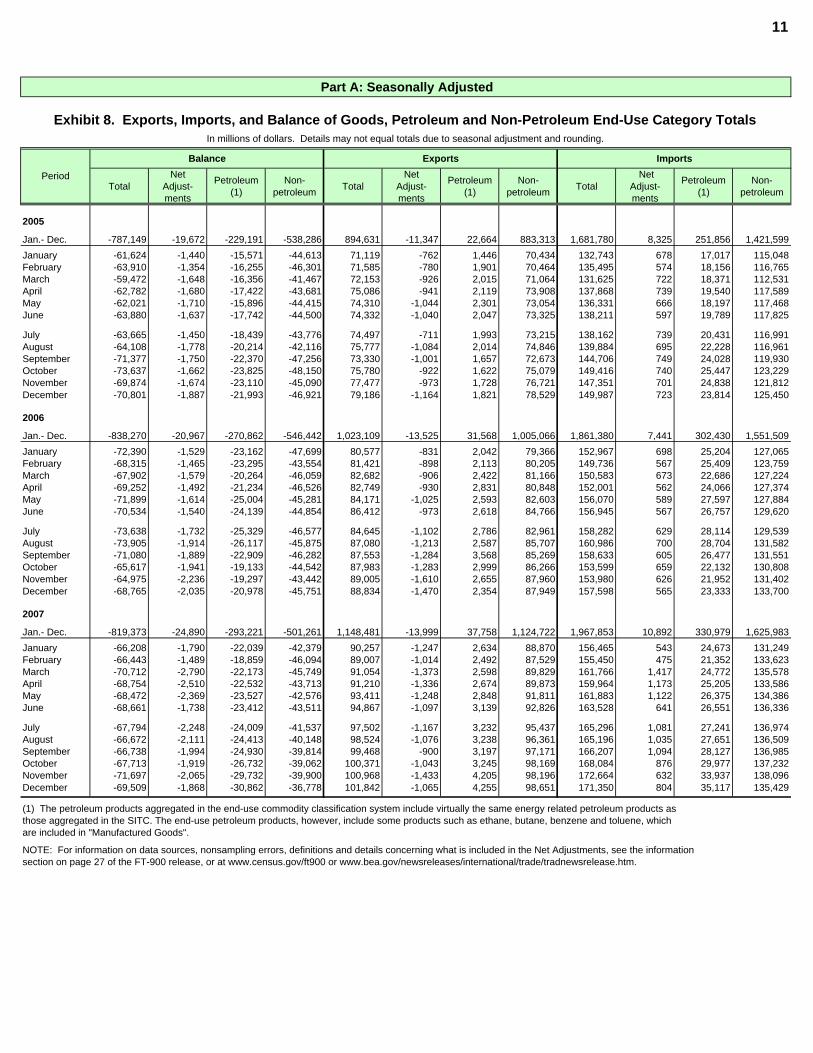
Exhibit 8. Exports, Imports, and Balance of Goods, Petroleum and Non-Petroleum End-Use Category TotalsIn millions of dollars. Details may not equal totals due to seasonal adjustment and rounding.
Balance Exports Imports
TotalNet
Adjust-ments
Petroleum (1)
Non-petroleum Total
Net Adjust-ments
Petroleum (1)
Non-petroleum Total
Net Adjust-ments
Petroleum (1)
Non-petroleum
2005
Jan.- Dec. -787,149 -19,672 -229,191 -538,286 894,631 -11,347 22,664 883,313 1,681,780 8,325 251,856 1,421,599January -61,624 -1,440 -15,571 -44,613 71,119 -762 1,446 70,434 132,743 678 17,017 115,048February -63,910 -1,354 -16,255 -46,301 71,585 -780 1,901 70,464 135,495 574 18,156 116,765March -59,472 -1,648 -16,356 -41,467 72,153 -926 2,015 71,064 131,625 722 18,371 112,531April -62,782 -1,680 -17,422 -43,681 75,086 -941 2,119 73,908 137,868 739 19,540 117,589May -62,021 -1,710 -15,896 -44,415 74,310 -1,044 2,301 73,054 136,331 666 18,197 117,468June -63,880 -1,637 -17,742 -44,500 74,332 -1,040 2,047 73,325 138,211 597 19,789 117,825
July -63,665 -1,450 -18,439 -43,776 74,497 -711 1,993 73,215 138,162 739 20,431 116,991August -64,108 -1,778 -20,214 -42,116 75,777 -1,084 2,014 74,846 139,884 695 22,228 116,961September -71,377 -1,750 -22,370 -47,256 73,330 -1,001 1,657 72,673 144,706 749 24,028 119,930October -73,637 -1,662 -23,825 -48,150 75,780 -922 1,622 75,079 149,416 740 25,447 123,229November -69,874 -1,674 -23,110 -45,090 77,477 -973 1,728 76,721 147,351 701 24,838 121,812December -70,801 -1,887 -21,993 -46,921 79,186 -1,164 1,821 78,529 149,987 723 23,814 125,450
2006
Jan.- Dec. -838,270 -20,967 -270,862 -546,442 1,023,109 -13,525 31,568 1,005,066 1,861,380 7,441 302,430 1,551,509January -72,390 -1,529 -23,162 -47,699 80,577 -831 2,042 79,366 152,967 698 25,204 127,065February -68,315 -1,465 -23,295 -43,554 81,421 -898 2,113 80,205 149,736 567 25,409 123,759March -67,902 -1,579 -20,264 -46,059 82,682 -906 2,422 81,166 150,583 673 22,686 127,224April -69,252 -1,492 -21,234 -46,526 82,749 -930 2,831 80,848 152,001 562 24,066 127,374May -71,899 -1,614 -25,004 -45,281 84,171 -1,025 2,593 82,603 156,070 589 27,597 127,884June -70,534 -1,540 -24,139 -44,854 86,412 -973 2,618 84,766 156,945 567 26,757 129,620
July -73,638 -1,732 -25,329 -46,577 84,645 -1,102 2,786 82,961 158,282 629 28,114 129,539August -73,905 -1,914 -26,117 -45,875 87,080 -1,213 2,587 85,707 160,986 700 28,704 131,582September -71,080 -1,889 -22,909 -46,282 87,553 -1,284 3,568 85,269 158,633 605 26,477 131,551October -65,617 -1,941 -19,133 -44,542 87,983 -1,283 2,999 86,266 153,599 659 22,132 130,808November -64,975 -2,236 -19,297 -43,442 89,005 -1,610 2,655 87,960 153,980 626 21,952 131,402December -68,765 -2,035 -20,978 -45,751 88,834 -1,470 2,354 87,949 157,598 565 23,333 133,700
2007
Jan.- Dec. -819,373 -24,890 -293,221 -501,261 1,148,481 -13,999 37,758 1,124,722 1,967,853 10,892 330,979 1,625,983January -66,208 -1,790 -22,039 -42,379 90,257 -1,247 2,634 88,870 156,465 543 24,673 131,249February -66,443 -1,489 -18,859 -46,094 89,007 -1,014 2,492 87,529 155,450 475 21,352 133,623March -70,712 -2,790 -22,173 -45,749 91,054 -1,373 2,598 89,829 161,766 1,417 24,772 135,578April -68,754 -2,510 -22,532 -43,713 91,210 -1,336 2,674 89,873 159,964 1,173 25,205 133,586May -68,472 -2,369 -23,527 -42,576 93,411 -1,248 2,848 91,811 161,883 1,122 26,375 134,386June -68,661 -1,738 -23,412 -43,511 94,867 -1,097 3,139 92,826 163,528 641 26,551 136,336
July -67,794 -2,248 -24,009 -41,537 97,502 -1,167 3,232 95,437 165,296 1,081 27,241 136,974August -66,672 -2,111 -24,413 -40,148 98,524 -1,076 3,238 96,361 165,196 1,035 27,651 136,509September -66,738 -1,994 -24,930 -39,814 99,468 -900 3,197 97,171 166,207 1,094 28,127 136,985October -67,713 -1,919 -26,732 -39,062 100,371 -1,043 3,245 98,169 168,084 876 29,977 137,232November -71,697 -2,065 -29,732 -39,900 100,968 -1,433 4,205 98,196 172,664 632 33,937 138,096December -69,509 -1,868 -30,862 -36,778 101,842 -1,065 4,255 98,651 171,350 804 35,117 135,429
(1) The petroleum products aggregated in the end-use commodity classification system include virtually the same energy related petroleum products asthose aggregated in the SITC. The end-use petroleum products, however, include some products such as ethane, butane, benzene and toluene, whichare included in "Manufactured Goods".
NOTE: For information on data sources, nonsampling errors, definitions and details concerning what is included in the Net Adjustments, see the information section on page 27 of the FT-900 release, or at www.census.gov/ft900 or www.bea.gov/newsreleases/international/trade/tradnewsrelease.htm.
Period
12
Part A: Seasonally Adjusted
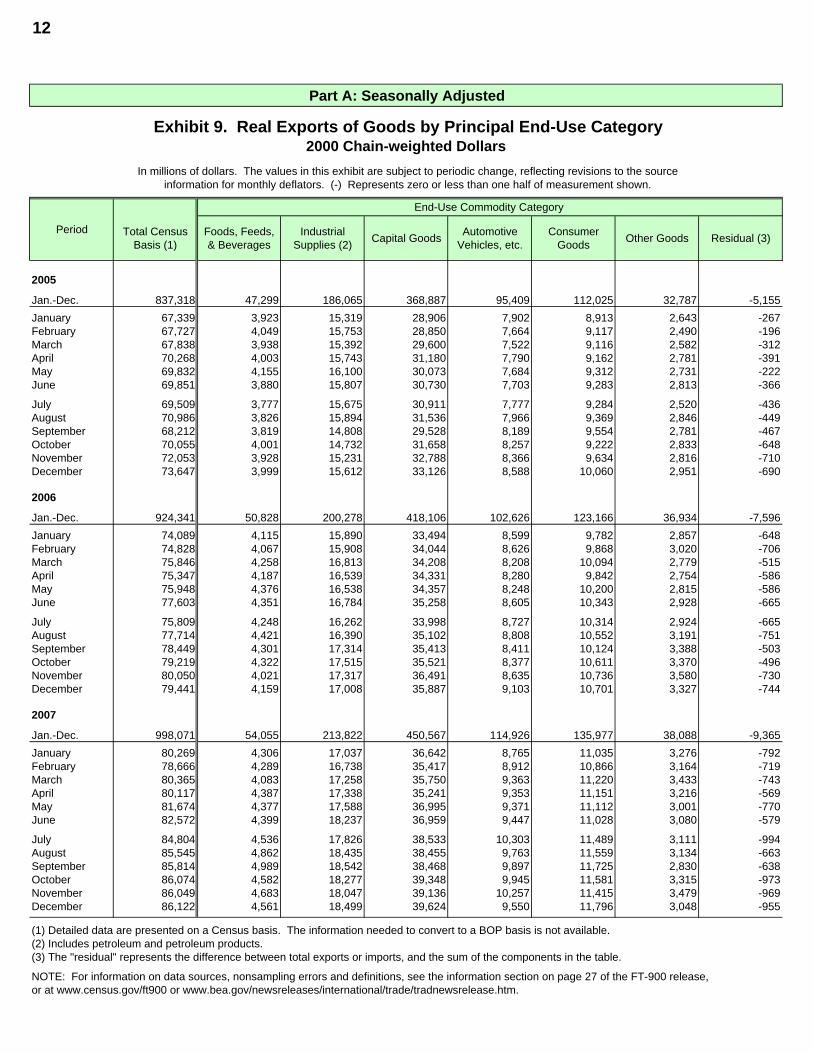
Exhibit 9. Real Exports of Goods by Principal End-Use Category2000 Chain-weighted Dollars
In millions of dollars. The values in this exhibit are subject to periodic change, reflecting revisions to the sourceinformation for monthly deflators. (-) Represents zero or less than one half of measurement shown.
End-Use Commodity Category
Total Census Basis (1)
Foods, Feeds, & Beverages
Industrial Supplies (2) Capital Goods Automotive
Vehicles, etc.Consumer
Goods Other Goods Residual (3)
2005
Jan.-Dec. 837,318 47,299 186,065 368,887 95,409 112,025 32,787 -5,155January 67,339 3,923 15,319 28,906 7,902 8,913 2,643 -267February 67,727 4,049 15,753 28,850 7,664 9,117 2,490 -196March 67,838 3,938 15,392 29,600 7,522 9,116 2,582 -312April 70,268 4,003 15,743 31,180 7,790 9,162 2,781 -391May 69,832 4,155 16,100 30,073 7,684 9,312 2,731 -222June 69,851 3,880 15,807 30,730 7,703 9,283 2,813 -366
July 69,509 3,777 15,675 30,911 7,777 9,284 2,520 -436August 70,986 3,826 15,894 31,536 7,966 9,369 2,846 -449September 68,212 3,819 14,808 29,528 8,189 9,554 2,781 -467October 70,055 4,001 14,732 31,658 8,257 9,222 2,833 -648November 72,053 3,928 15,231 32,788 8,366 9,634 2,816 -710December 73,647 3,999 15,612 33,126 8,588 10,060 2,951 -690
2006
Jan.-Dec. 924,341 50,828 200,278 418,106 102,626 123,166 36,934 -7,596January 74,089 4,115 15,890 33,494 8,599 9,782 2,857 -648February 74,828 4,067 15,908 34,044 8,626 9,868 3,020 -706March 75,846 4,258 16,813 34,208 8,208 10,094 2,779 -515April 75,347 4,187 16,539 34,331 8,280 9,842 2,754 -586May 75,948 4,376 16,538 34,357 8,248 10,200 2,815 -586June 77,603 4,351 16,784 35,258 8,605 10,343 2,928 -665
July 75,809 4,248 16,262 33,998 8,727 10,314 2,924 -665August 77,714 4,421 16,390 35,102 8,808 10,552 3,191 -751September 78,449 4,301 17,314 35,413 8,411 10,124 3,388 -503October 79,219 4,322 17,515 35,521 8,377 10,611 3,370 -496November 80,050 4,021 17,317 36,491 8,635 10,736 3,580 -730December 79,441 4,159 17,008 35,887 9,103 10,701 3,327 -744
2007
Jan.-Dec. 998,071 54,055 213,822 450,567 114,926 135,977 38,088 -9,365January 80,269 4,306 17,037 36,642 8,765 11,035 3,276 -792February 78,666 4,289 16,738 35,417 8,912 10,866 3,164 -719March 80,365 4,083 17,258 35,750 9,363 11,220 3,433 -743April 80,117 4,387 17,338 35,241 9,353 11,151 3,216 -569May 81,674 4,377 17,588 36,995 9,371 11,112 3,001 -770June 82,572 4,399 18,237 36,959 9,447 11,028 3,080 -579
July 84,804 4,536 17,826 38,533 10,303 11,489 3,111 -994August 85,545 4,862 18,435 38,455 9,763 11,559 3,134 -663September 85,814 4,989 18,542 38,468 9,897 11,725 2,830 -638October 86,074 4,582 18,277 39,348 9,945 11,581 3,315 -973November 86,049 4,683 18,047 39,136 10,257 11,415 3,479 -969December 86,122 4,561 18,499 39,624 9,550 11,796 3,048 -955
(1) Detailed data are presented on a Census basis. The information needed to convert to a BOP basis is not available.(2) Includes petroleum and petroleum products.(3) The "residual" represents the difference between total exports or imports, and the sum of the components in the table.
NOTE: For information on data sources, nonsampling errors and definitions, see the information section on page 27 of the FT-900 release,or at www.census.gov/ft900 or www.bea.gov/newsreleases/international/trade/tradnewsrelease.htm.
Period
13
Part A: Seasonally Adjusted
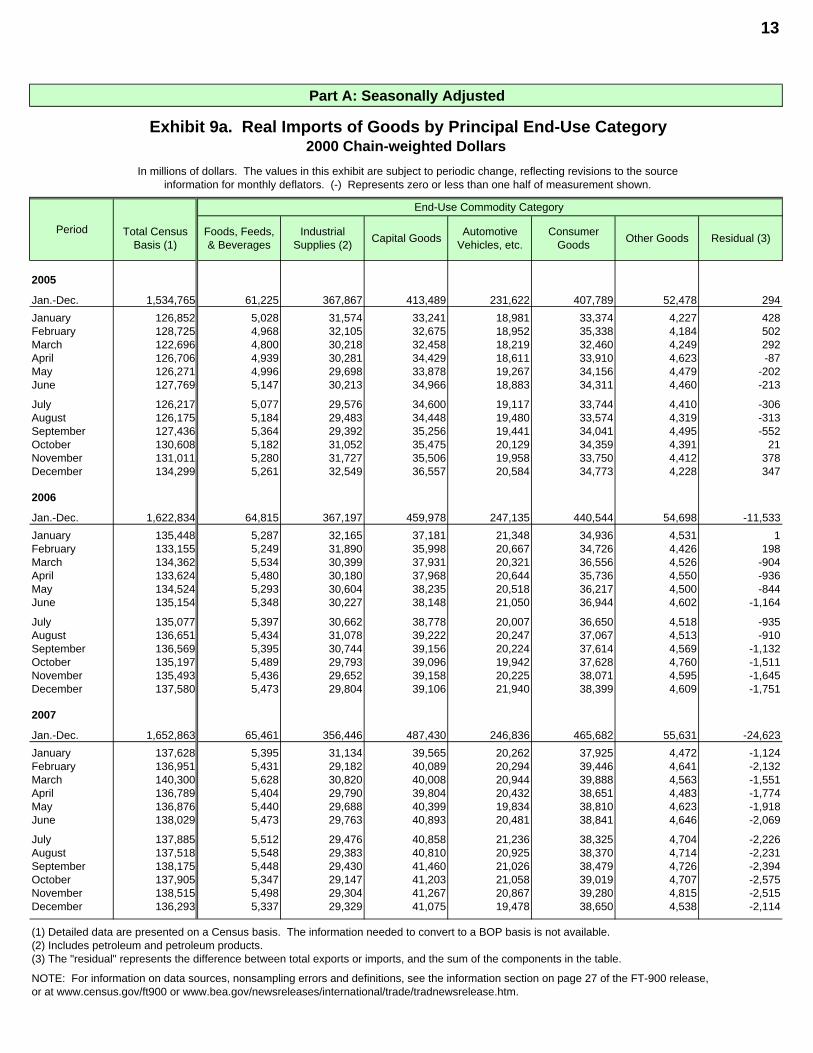
Exhibit 9a. Real Imports of Goods by Principal End-Use Category2000 Chain-weighted Dollars
In millions of dollars. The values in this exhibit are subject to periodic change, reflecting revisions to the sourceinformation for monthly deflators. (-) Represents zero or less than one half of measurement shown.
End-Use Commodity Category
Total Census Basis (1)
Foods, Feeds, & Beverages
Industrial Supplies (2) Capital Goods Automotive
Vehicles, etc.Consumer
Goods Other Goods Residual (3)
2005
Jan.-Dec. 1,534,765 61,225 367,867 413,489 231,622 407,789 52,478 294January 126,852 5,028 31,574 33,241 18,981 33,374 4,227 428February 128,725 4,968 32,105 32,675 18,952 35,338 4,184 502March 122,696 4,800 30,218 32,458 18,219 32,460 4,249 292April 126,706 4,939 30,281 34,429 18,611 33,910 4,623 -87May 126,271 4,996 29,698 33,878 19,267 34,156 4,479 -202June 127,769 5,147 30,213 34,966 18,883 34,311 4,460 -213
July 126,217 5,077 29,576 34,600 19,117 33,744 4,410 -306August 126,175 5,184 29,483 34,448 19,480 33,574 4,319 -313September 127,436 5,364 29,392 35,256 19,441 34,041 4,495 -552October 130,608 5,182 31,052 35,475 20,129 34,359 4,391 21November 131,011 5,280 31,727 35,506 19,958 33,750 4,412 378December 134,299 5,261 32,549 36,557 20,584 34,773 4,228 347
2006
Jan.-Dec. 1,622,834 64,815 367,197 459,978 247,135 440,544 54,698 -11,533January 135,448 5,287 32,165 37,181 21,348 34,936 4,531 1February 133,155 5,249 31,890 35,998 20,667 34,726 4,426 198March 134,362 5,534 30,399 37,931 20,321 36,556 4,526 -904April 133,624 5,480 30,180 37,968 20,644 35,736 4,550 -936May 134,524 5,293 30,604 38,235 20,518 36,217 4,500 -844June 135,154 5,348 30,227 38,148 21,050 36,944 4,602 -1,164
July 135,077 5,397 30,662 38,778 20,007 36,650 4,518 -935August 136,651 5,434 31,078 39,222 20,247 37,067 4,513 -910September 136,569 5,395 30,744 39,156 20,224 37,614 4,569 -1,132October 135,197 5,489 29,793 39,096 19,942 37,628 4,760 -1,511November 135,493 5,436 29,652 39,158 20,225 38,071 4,595 -1,645December 137,580 5,473 29,804 39,106 21,940 38,399 4,609 -1,751
2007
Jan.-Dec. 1,652,863 65,461 356,446 487,430 246,836 465,682 55,631 -24,623January 137,628 5,395 31,134 39,565 20,262 37,925 4,472 -1,124February 136,951 5,431 29,182 40,089 20,294 39,446 4,641 -2,132March 140,300 5,628 30,820 40,008 20,944 39,888 4,563 -1,551April 136,789 5,404 29,790 39,804 20,432 38,651 4,483 -1,774May 136,876 5,440 29,688 40,399 19,834 38,810 4,623 -1,918June 138,029 5,473 29,763 40,893 20,481 38,841 4,646 -2,069
July 137,885 5,512 29,476 40,858 21,236 38,325 4,704 -2,226August 137,518 5,548 29,383 40,810 20,925 38,370 4,714 -2,231September 138,175 5,448 29,430 41,460 21,026 38,479 4,726 -2,394October 137,905 5,347 29,147 41,203 21,058 39,019 4,707 -2,575November 138,515 5,498 29,304 41,267 20,867 39,280 4,815 -2,515December 136,293 5,337 29,329 41,075 19,478 38,650 4,538 -2,114
(1) Detailed data are presented on a Census basis. The information needed to convert to a BOP basis is not available.(2) Includes petroleum and petroleum products.(3) The "residual" represents the difference between total exports or imports, and the sum of the components in the table.
NOTE: For information on data sources, nonsampling errors and definitions, see the information section on page 27 of the FT-900 release,or at www.census.gov/ft900 or www.bea.gov/newsreleases/international/trade/tradnewsrelease.htm.
Period
14
Part A: Seasonally Adjusted
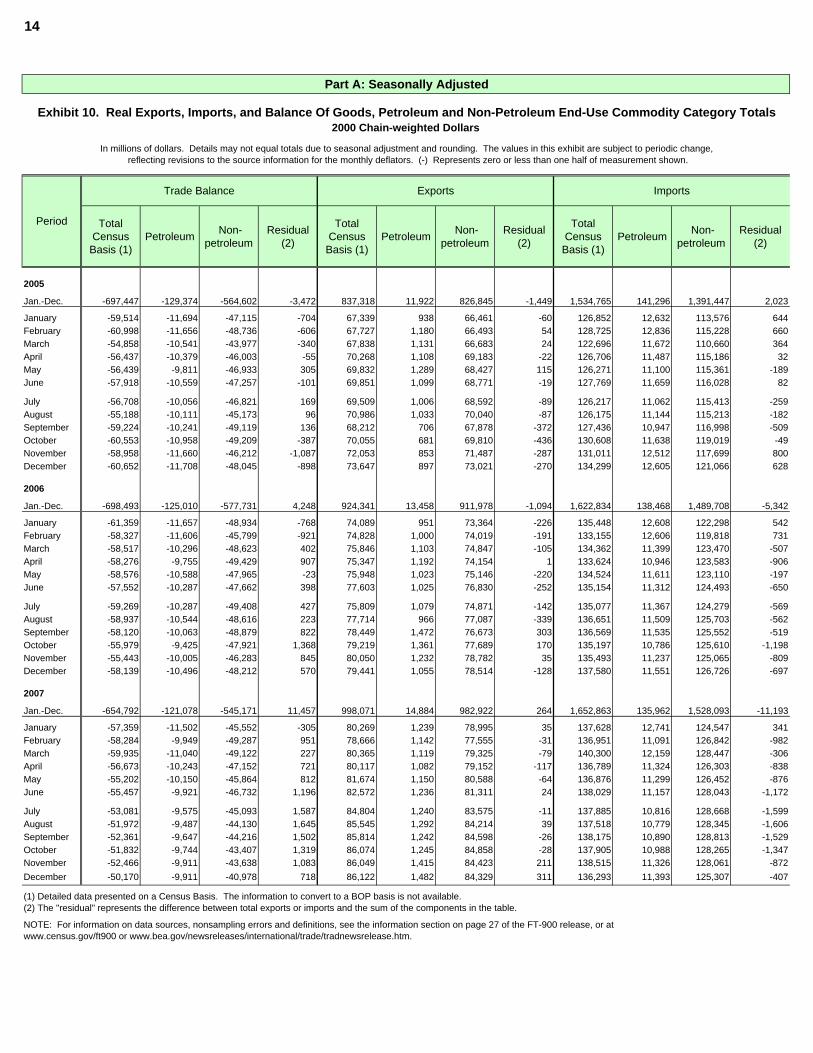
Exhibit 10. Real Exports, Imports, and Balance Of Goods, Petroleum and Non-Petroleum End-Use Commodity Category Totals2000 Chain-weighted Dollars
In millions of dollars. Details may not equal totals due to seasonal adjustment and rounding. The values in this exhibit are subject to periodic change, reflecting revisions to the source information for the monthly deflators. (-) Represents zero or less than one half of measurement shown.
Trade Balance Exports Imports
Total Census
Basis (1)Petroleum Non-
petroleumResidual
(2)
Total Census
Basis (1)Petroleum Non-
petroleumResidual
(2)
Total Census
Basis (1)Petroleum Non-
petroleumResidual
(2)
2005
Jan.-Dec. -697,447 -129,374 -564,602 -3,472 837,318 11,922 826,845 -1,449 1,534,765 141,296 1,391,447 2,023
January -59,514 -11,694 -47,115 -704 67,339 938 66,461 -60 126,852 12,632 113,576 644February -60,998 -11,656 -48,736 -606 67,727 1,180 66,493 54 128,725 12,836 115,228 660March -54,858 -10,541 -43,977 -340 67,838 1,131 66,683 24 122,696 11,672 110,660 364April -56,437 -10,379 -46,003 -55 70,268 1,108 69,183 -22 126,706 11,487 115,186 32May -56,439 -9,811 -46,933 305 69,832 1,289 68,427 115 126,271 11,100 115,361 -189June -57,918 -10,559 -47,257 -101 69,851 1,099 68,771 -19 127,769 11,659 116,028 82
July -56,708 -10,056 -46,821 169 69,509 1,006 68,592 -89 126,217 11,062 115,413 -259August -55,188 -10,111 -45,173 96 70,986 1,033 70,040 -87 126,175 11,144 115,213 -182September -59,224 -10,241 -49,119 136 68,212 706 67,878 -372 127,436 10,947 116,998 -509October -60,553 -10,958 -49,209 -387 70,055 681 69,810 -436 130,608 11,638 119,019 -49November -58,958 -11,660 -46,212 -1,087 72,053 853 71,487 -287 131,011 12,512 117,699 800December -60,652 -11,708 -48,045 -898 73,647 897 73,021 -270 134,299 12,605 121,066 628
2006
Jan.-Dec. -698,493 -125,010 -577,731 4,248 924,341 13,458 911,978 -1,094 1,622,834 138,468 1,489,708 -5,342
January -61,359 -11,657 -48,934 -768 74,089 951 73,364 -226 135,448 12,608 122,298 542February -58,327 -11,606 -45,799 -921 74,828 1,000 74,019 -191 133,155 12,606 119,818 731March -58,517 -10,296 -48,623 402 75,846 1,103 74,847 -105 134,362 11,399 123,470 -507April -58,276 -9,755 -49,429 907 75,347 1,192 74,154 1 133,624 10,946 123,583 -906May -58,576 -10,588 -47,965 -23 75,948 1,023 75,146 -220 134,524 11,611 123,110 -197June -57,552 -10,287 -47,662 398 77,603 1,025 76,830 -252 135,154 11,312 124,493 -650
July -59,269 -10,287 -49,408 427 75,809 1,079 74,871 -142 135,077 11,367 124,279 -569August -58,937 -10,544 -48,616 223 77,714 966 77,087 -339 136,651 11,509 125,703 -562September -58,120 -10,063 -48,879 822 78,449 1,472 76,673 303 136,569 11,535 125,552 -519October -55,979 -9,425 -47,921 1,368 79,219 1,361 77,689 170 135,197 10,786 125,610 -1,198November -55,443 -10,005 -46,283 845 80,050 1,232 78,782 35 135,493 11,237 125,065 -809December -58,139 -10,496 -48,212 570 79,441 1,055 78,514 -128 137,580 11,551 126,726 -697
2007
Jan.-Dec. -654,792 -121,078 -545,171 11,457 998,071 14,884 982,922 264 1,652,863 135,962 1,528,093 -11,193
January -57,359 -11,502 -45,552 -305 80,269 1,239 78,995 35 137,628 12,741 124,547 341February -58,284 -9,949 -49,287 951 78,666 1,142 77,555 -31 136,951 11,091 126,842 -982March -59,935 -11,040 -49,122 227 80,365 1,119 79,325 -79 140,300 12,159 128,447 -306April -56,673 -10,243 -47,152 721 80,117 1,082 79,152 -117 136,789 11,324 126,303 -838May -55,202 -10,150 -45,864 812 81,674 1,150 80,588 -64 136,876 11,299 126,452 -876June -55,457 -9,921 -46,732 1,196 82,572 1,236 81,311 24 138,029 11,157 128,043 -1,172
July -53,081 -9,575 -45,093 1,587 84,804 1,240 83,575 -11 137,885 10,816 128,668 -1,599August -51,972 -9,487 -44,130 1,645 85,545 1,292 84,214 39 137,518 10,779 128,345 -1,606September -52,361 -9,647 -44,216 1,502 85,814 1,242 84,598 -26 138,175 10,890 128,813 -1,529October -51,832 -9,744 -43,407 1,319 86,074 1,245 84,858 -28 137,905 10,988 128,265 -1,347November -52,466 -9,911 -43,638 1,083 86,049 1,415 84,423 211 138,515 11,326 128,061 -872December -50,170 -9,911 -40,978 718 86,122 1,482 84,329 311 136,293 11,393 125,307 -407
(1) Detailed data presented on a Census Basis. The information to convert to a BOP basis is not available.(2) The "residual" represents the difference between total exports or imports and the sum of the components in the table.
NOTE: For information on data sources, nonsampling errors and definitions, see the information section on page 27 of the FT-900 release, or atwww.census.gov/ft900 or www.bea.gov/newsreleases/international/trade/tradnewsrelease.htm.
Period
15
Part B: NOT Seasonally Adjusted
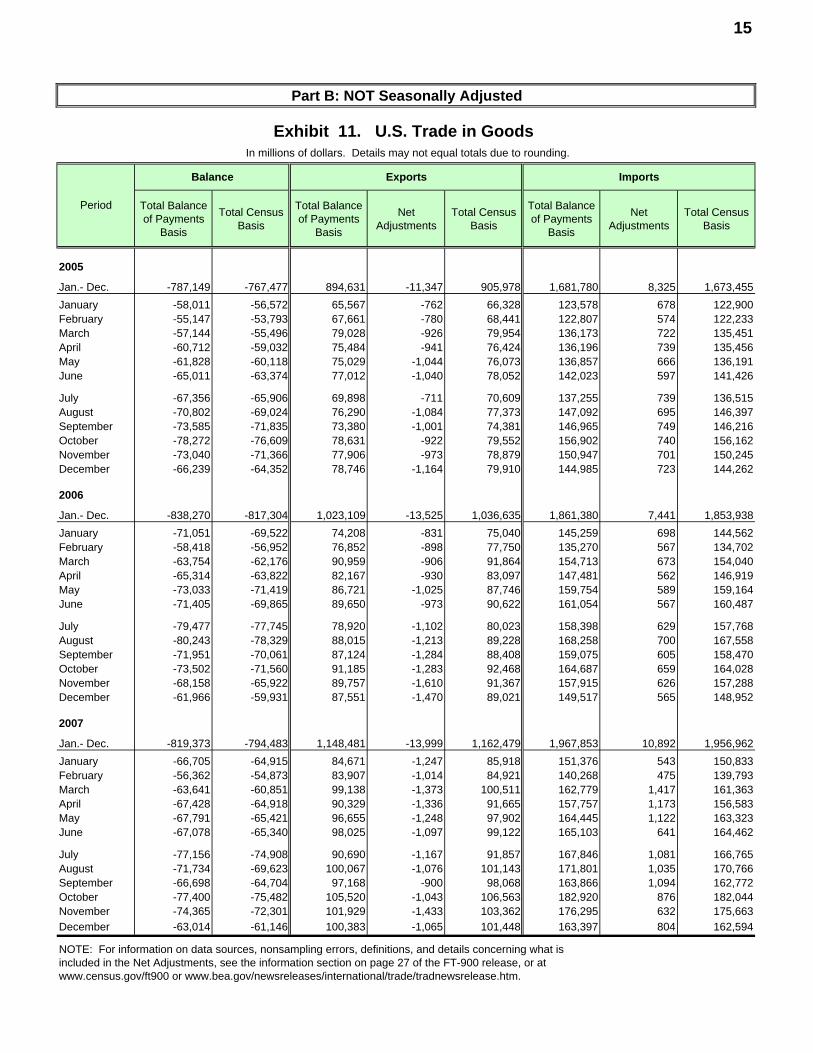
Exhibit 11. U.S. Trade in Goods In millions of dollars. Details may not equal totals due to rounding.
Balance Exports Imports
Total Balance of Payments
Basis
Total Census Basis
Total Balance of Payments
Basis
Net Adjustments
Total Census Basis
Total Balance of Payments
Basis
Net Adjustments
Total Census Basis
2005
Jan.- Dec. -787,149 -767,477 894,631 -11,347 905,978 1,681,780 8,325 1,673,455January -58,011 -56,572 65,567 -762 66,328 123,578 678 122,900February -55,147 -53,793 67,661 -780 68,441 122,807 574 122,233March -57,144 -55,496 79,028 -926 79,954 136,173 722 135,451April -60,712 -59,032 75,484 -941 76,424 136,196 739 135,456May -61,828 -60,118 75,029 -1,044 76,073 136,857 666 136,191June -65,011 -63,374 77,012 -1,040 78,052 142,023 597 141,426
July -67,356 -65,906 69,898 -711 70,609 137,255 739 136,515August -70,802 -69,024 76,290 -1,084 77,373 147,092 695 146,397September -73,585 -71,835 73,380 -1,001 74,381 146,965 749 146,216October -78,272 -76,609 78,631 -922 79,552 156,902 740 156,162November -73,040 -71,366 77,906 -973 78,879 150,947 701 150,245December -66,239 -64,352 78,746 -1,164 79,910 144,985 723 144,262
2006
Jan.- Dec. -838,270 -817,304 1,023,109 -13,525 1,036,635 1,861,380 7,441 1,853,938January -71,051 -69,522 74,208 -831 75,040 145,259 698 144,562February -58,418 -56,952 76,852 -898 77,750 135,270 567 134,702March -63,754 -62,176 90,959 -906 91,864 154,713 673 154,040April -65,314 -63,822 82,167 -930 83,097 147,481 562 146,919May -73,033 -71,419 86,721 -1,025 87,746 159,754 589 159,164June -71,405 -69,865 89,650 -973 90,622 161,054 567 160,487
July -79,477 -77,745 78,920 -1,102 80,023 158,398 629 157,768August -80,243 -78,329 88,015 -1,213 89,228 168,258 700 167,558September -71,951 -70,061 87,124 -1,284 88,408 159,075 605 158,470October -73,502 -71,560 91,185 -1,283 92,468 164,687 659 164,028November -68,158 -65,922 89,757 -1,610 91,367 157,915 626 157,288December -61,966 -59,931 87,551 -1,470 89,021 149,517 565 148,952
2007
Jan.- Dec. -819,373 -794,483 1,148,481 -13,999 1,162,479 1,967,853 10,892 1,956,962January -66,705 -64,915 84,671 -1,247 85,918 151,376 543 150,833February -56,362 -54,873 83,907 -1,014 84,921 140,268 475 139,793March -63,641 -60,851 99,138 -1,373 100,511 162,779 1,417 161,363April -67,428 -64,918 90,329 -1,336 91,665 157,757 1,173 156,583May -67,791 -65,421 96,655 -1,248 97,902 164,445 1,122 163,323June -67,078 -65,340 98,025 -1,097 99,122 165,103 641 164,462
July -77,156 -74,908 90,690 -1,167 91,857 167,846 1,081 166,765August -71,734 -69,623 100,067 -1,076 101,143 171,801 1,035 170,766September -66,698 -64,704 97,168 -900 98,068 163,866 1,094 162,772October -77,400 -75,482 105,520 -1,043 106,563 182,920 876 182,044November -74,365 -72,301 101,929 -1,433 103,362 176,295 632 175,663December -63,014 -61,146 100,383 -1,065 101,448 163,397 804 162,594
NOTE: For information on data sources, nonsampling errors, definitions, and details concerning what is included in the Net Adjustments, see the information section on page 27 of the FT-900 release, or at www.census.gov/ft900 or www.bea.gov/newsreleases/international/trade/tradnewsrelease.htm.
Period
16
Part B: NOT Seasonally Adjusted
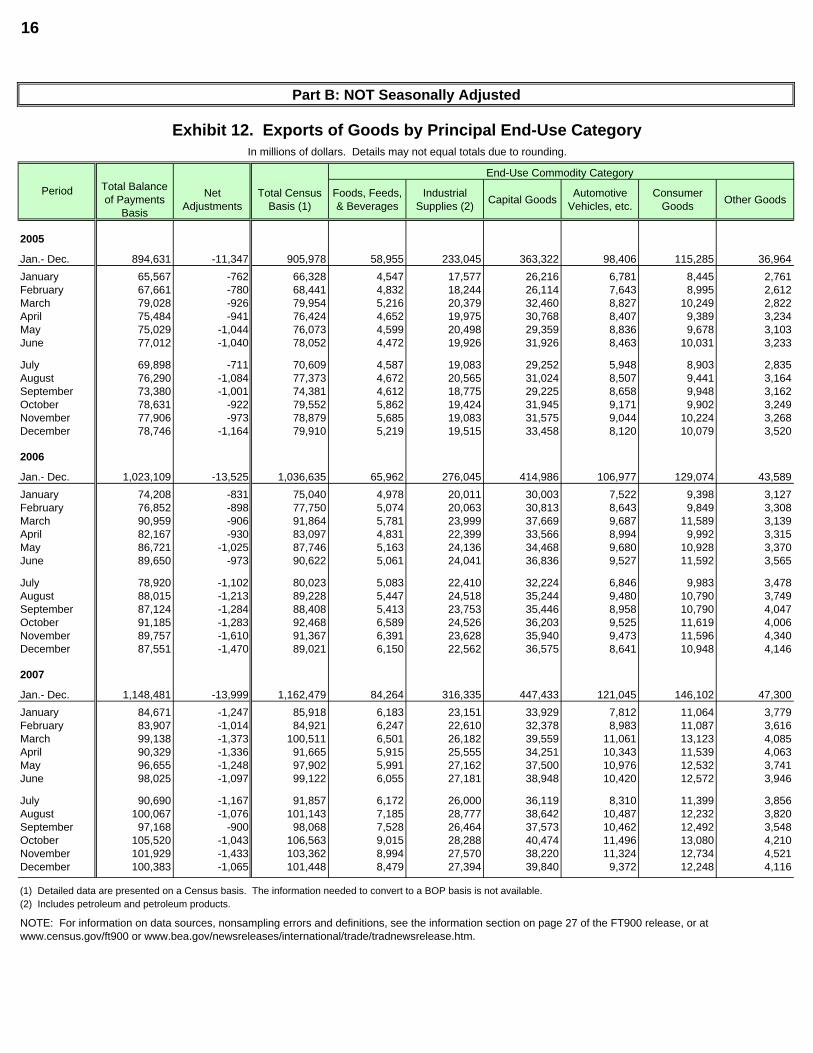
Exhibit 12. Exports of Goods by Principal End-Use Category In millions of dollars. Details may not equal totals due to rounding.
End-Use Commodity Category Total Balance of Payments
Basis
Net Adjustments
Total Census Basis (1)
Foods, Feeds, & Beverages
Industrial Supplies (2) Capital Goods Automotive
Vehicles, etc.Consumer
Goods Other Goods
2005
Jan.- Dec. 894,631 -11,347 905,978 58,955 233,045 363,322 98,406 115,285 36,964January 65,567 -762 66,328 4,547 17,577 26,216 6,781 8,445 2,761February 67,661 -780 68,441 4,832 18,244 26,114 7,643 8,995 2,612March 79,028 -926 79,954 5,216 20,379 32,460 8,827 10,249 2,822April 75,484 -941 76,424 4,652 19,975 30,768 8,407 9,389 3,234May 75,029 -1,044 76,073 4,599 20,498 29,359 8,836 9,678 3,103June 77,012 -1,040 78,052 4,472 19,926 31,926 8,463 10,031 3,233
July 69,898 -711 70,609 4,587 19,083 29,252 5,948 8,903 2,835August 76,290 -1,084 77,373 4,672 20,565 31,024 8,507 9,441 3,164September 73,380 -1,001 74,381 4,612 18,775 29,225 8,658 9,948 3,162October 78,631 -922 79,552 5,862 19,424 31,945 9,171 9,902 3,249November 77,906 -973 78,879 5,685 19,083 31,575 9,044 10,224 3,268December 78,746 -1,164 79,910 5,219 19,515 33,458 8,120 10,079 3,520
2006
Jan.- Dec. 1,023,109 -13,525 1,036,635 65,962 276,045 414,986 106,977 129,074 43,589January 74,208 -831 75,040 4,978 20,011 30,003 7,522 9,398 3,127February 76,852 -898 77,750 5,074 20,063 30,813 8,643 9,849 3,308March 90,959 -906 91,864 5,781 23,999 37,669 9,687 11,589 3,139April 82,167 -930 83,097 4,831 22,399 33,566 8,994 9,992 3,315May 86,721 -1,025 87,746 5,163 24,136 34,468 9,680 10,928 3,370June 89,650 -973 90,622 5,061 24,041 36,836 9,527 11,592 3,565
July 78,920 -1,102 80,023 5,083 22,410 32,224 6,846 9,983 3,478August 88,015 -1,213 89,228 5,447 24,518 35,244 9,480 10,790 3,749September 87,124 -1,284 88,408 5,413 23,753 35,446 8,958 10,790 4,047October 91,185 -1,283 92,468 6,589 24,526 36,203 9,525 11,619 4,006November 89,757 -1,610 91,367 6,391 23,628 35,940 9,473 11,596 4,340December 87,551 -1,470 89,021 6,150 22,562 36,575 8,641 10,948 4,146
2007
Jan.- Dec. 1,148,481 -13,999 1,162,479 84,264 316,335 447,433 121,045 146,102 47,300January 84,671 -1,247 85,918 6,183 23,151 33,929 7,812 11,064 3,779February 83,907 -1,014 84,921 6,247 22,610 32,378 8,983 11,087 3,616March 99,138 -1,373 100,511 6,501 26,182 39,559 11,061 13,123 4,085April 90,329 -1,336 91,665 5,915 25,555 34,251 10,343 11,539 4,063May 96,655 -1,248 97,902 5,991 27,162 37,500 10,976 12,532 3,741June 98,025 -1,097 99,122 6,055 27,181 38,948 10,420 12,572 3,946
July 90,690 -1,167 91,857 6,172 26,000 36,119 8,310 11,399 3,856August 100,067 -1,076 101,143 7,185 28,777 38,642 10,487 12,232 3,820September 97,168 -900 98,068 7,528 26,464 37,573 10,462 12,492 3,548October 105,520 -1,043 106,563 9,015 28,288 40,474 11,496 13,080 4,210November 101,929 -1,433 103,362 8,994 27,570 38,220 11,324 12,734 4,521December 100,383 -1,065 101,448 8,479 27,394 39,840 9,372 12,248 4,116
(1) Detailed data are presented on a Census basis. The information needed to convert to a BOP basis is not available.(2) Includes petroleum and petroleum products.
NOTE: For information on data sources, nonsampling errors and definitions, see the information section on page 27 of the FT900 release, or atwww.census.gov/ft900 or www.bea.gov/newsreleases/international/trade/tradnewsrelease.htm.
Period
17
Part B: NOT Seasonally Adjusted
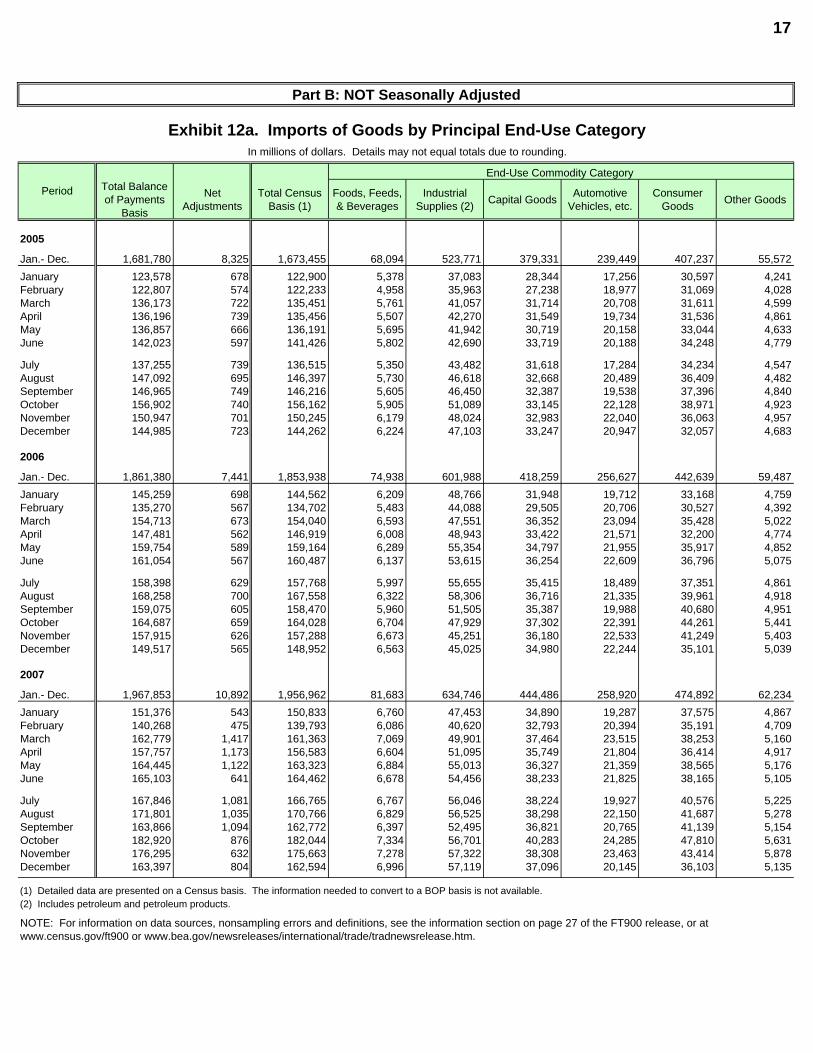
Exhibit 12a. Imports of Goods by Principal End-Use Category In millions of dollars. Details may not equal totals due to rounding.
End-Use Commodity Category Total Balance of Payments
Basis
Net Adjustments
Total Census Basis (1)
Foods, Feeds, & Beverages
Industrial Supplies (2) Capital Goods Automotive
Vehicles, etc.Consumer
Goods Other Goods
2005
Jan.- Dec. 1,681,780 8,325 1,673,455 68,094 523,771 379,331 239,449 407,237 55,572January 123,578 678 122,900 5,378 37,083 28,344 17,256 30,597 4,241February 122,807 574 122,233 4,958 35,963 27,238 18,977 31,069 4,028March 136,173 722 135,451 5,761 41,057 31,714 20,708 31,611 4,599April 136,196 739 135,456 5,507 42,270 31,549 19,734 31,536 4,861May 136,857 666 136,191 5,695 41,942 30,719 20,158 33,044 4,633June 142,023 597 141,426 5,802 42,690 33,719 20,188 34,248 4,779
July 137,255 739 136,515 5,350 43,482 31,618 17,284 34,234 4,547August 147,092 695 146,397 5,730 46,618 32,668 20,489 36,409 4,482September 146,965 749 146,216 5,605 46,450 32,387 19,538 37,396 4,840October 156,902 740 156,162 5,905 51,089 33,145 22,128 38,971 4,923November 150,947 701 150,245 6,179 48,024 32,983 22,040 36,063 4,957December 144,985 723 144,262 6,224 47,103 33,247 20,947 32,057 4,683
2006
Jan.- Dec. 1,861,380 7,441 1,853,938 74,938 601,988 418,259 256,627 442,639 59,487January 145,259 698 144,562 6,209 48,766 31,948 19,712 33,168 4,759February 135,270 567 134,702 5,483 44,088 29,505 20,706 30,527 4,392March 154,713 673 154,040 6,593 47,551 36,352 23,094 35,428 5,022April 147,481 562 146,919 6,008 48,943 33,422 21,571 32,200 4,774May 159,754 589 159,164 6,289 55,354 34,797 21,955 35,917 4,852June 161,054 567 160,487 6,137 53,615 36,254 22,609 36,796 5,075
July 158,398 629 157,768 5,997 55,655 35,415 18,489 37,351 4,861August 168,258 700 167,558 6,322 58,306 36,716 21,335 39,961 4,918September 159,075 605 158,470 5,960 51,505 35,387 19,988 40,680 4,951October 164,687 659 164,028 6,704 47,929 37,302 22,391 44,261 5,441November 157,915 626 157,288 6,673 45,251 36,180 22,533 41,249 5,403December 149,517 565 148,952 6,563 45,025 34,980 22,244 35,101 5,039
2007
Jan.- Dec. 1,967,853 10,892 1,956,962 81,683 634,746 444,486 258,920 474,892 62,234January 151,376 543 150,833 6,760 47,453 34,890 19,287 37,575 4,867February 140,268 475 139,793 6,086 40,620 32,793 20,394 35,191 4,709March 162,779 1,417 161,363 7,069 49,901 37,464 23,515 38,253 5,160April 157,757 1,173 156,583 6,604 51,095 35,749 21,804 36,414 4,917May 164,445 1,122 163,323 6,884 55,013 36,327 21,359 38,565 5,176June 165,103 641 164,462 6,678 54,456 38,233 21,825 38,165 5,105
July 167,846 1,081 166,765 6,767 56,046 38,224 19,927 40,576 5,225August 171,801 1,035 170,766 6,829 56,525 38,298 22,150 41,687 5,278September 163,866 1,094 162,772 6,397 52,495 36,821 20,765 41,139 5,154October 182,920 876 182,044 7,334 56,701 40,283 24,285 47,810 5,631November 176,295 632 175,663 7,278 57,322 38,308 23,463 43,414 5,878December 163,397 804 162,594 6,996 57,119 37,096 20,145 36,103 5,135
(1) Detailed data are presented on a Census basis. The information needed to convert to a BOP basis is not available.(2) Includes petroleum and petroleum products.
NOTE: For information on data sources, nonsampling errors and definitions, see the information section on page 27 of the FT900 release, or atwww.census.gov/ft900 or www.bea.gov/newsreleases/international/trade/tradnewsrelease.htm.
Period
18
Part B: NOT Seasonally Adjusted
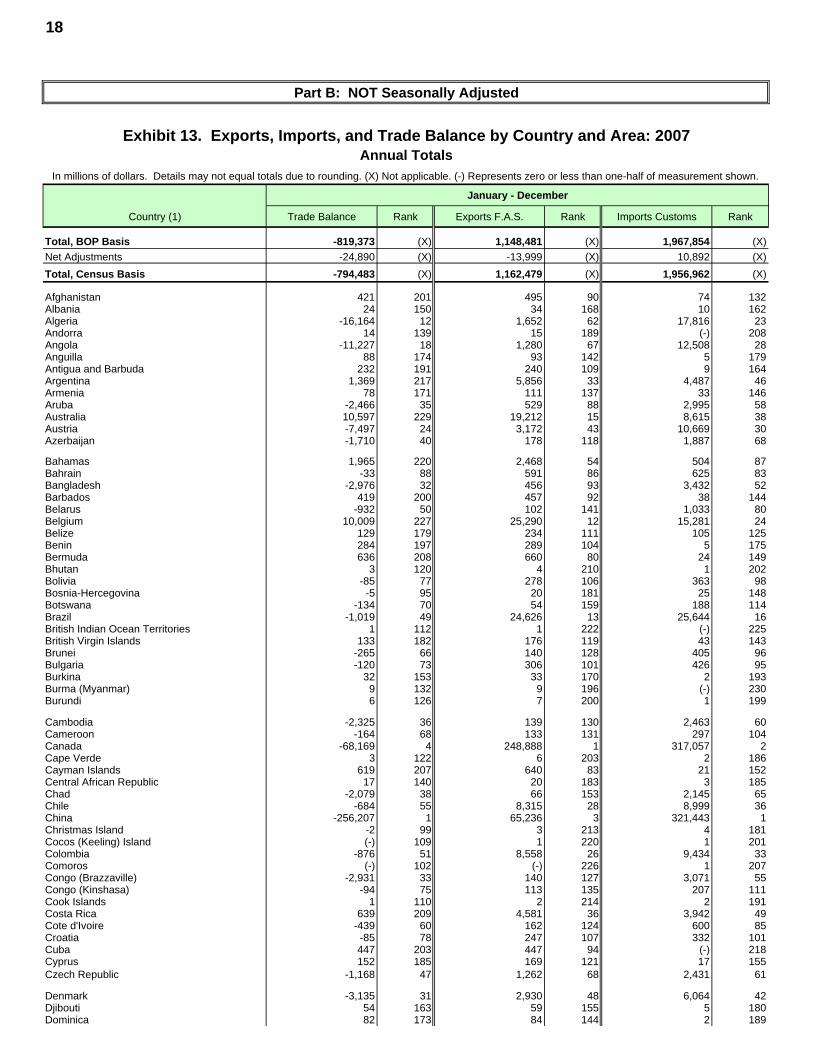
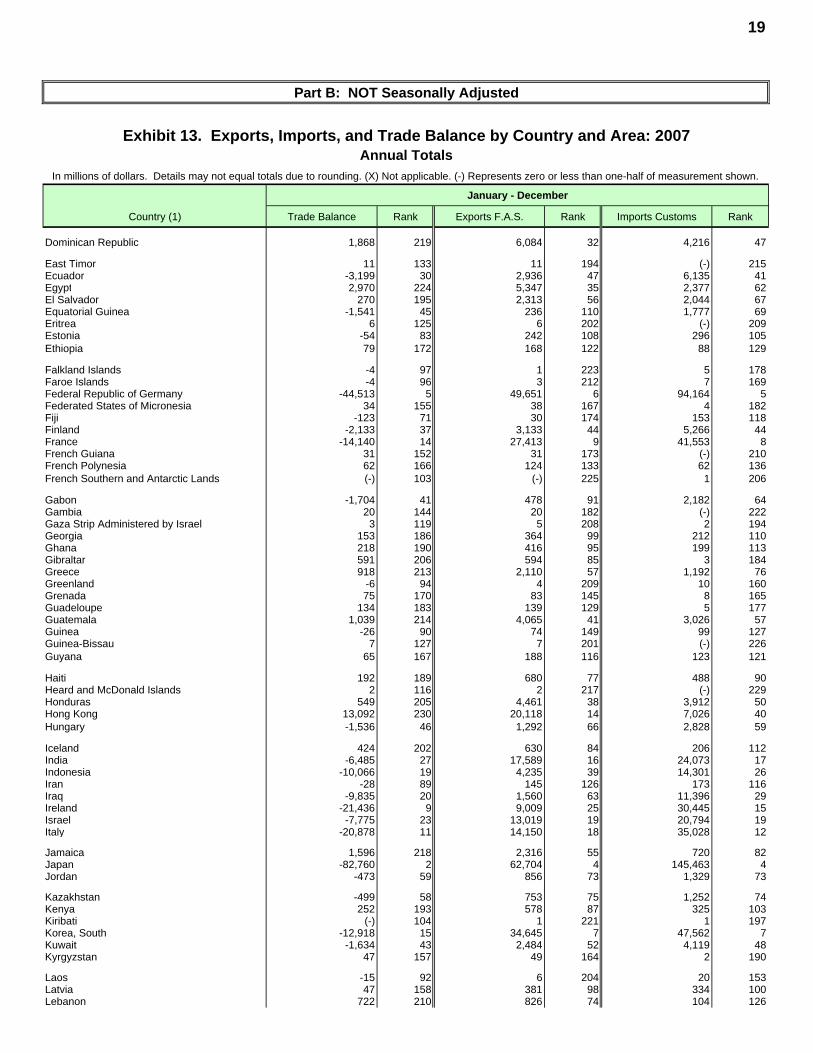
Exhibit 13. Exports, Imports, and Trade Balance by Country and Area: 2007Annual Totals
In millions of dollars. Details may not equal totals due to rounding. (X) Not applicable. (-) Represents zero or less than one-half of measurement shown.
January - December
Country (1) Trade Balance Rank Exports F.A.S. Rank Imports Customs Rank
Total, BOP Basis -819,373 (X) 1,148,481 (X) 1,967,854 (X)Net Adjustments -24,890 (X) -13,999 (X) 10,892 (X)Total, Census Basis -794,483 (X) 1,162,479 (X) 1,956,962 (X)
Afghanistan 421 201 495 90 74 132Albania 24 150 34 168 10 162Algeria -16,164 12 1,652 62 17,816 23Andorra 14 139 15 189 (-) 208Angola -11,227 18 1,280 67 12,508 28Anguilla 88 174 93 142 5 179Antigua and Barbuda 232 191 240 109 9 164Argentina 1,369 217 5,856 33 4,487 46Armenia 78 171 111 137 33 146Aruba -2,466 35 529 88 2,995 58Australia 10,597 229 19,212 15 8,615 38Austria -7,497 24 3,172 43 10,669 30Azerbaijan -1,710 40 178 118 1,887 68
Bahamas 1,965 220 2,468 54 504 87Bahrain -33 88 591 86 625 83Bangladesh -2,976 32 456 93 3,432 52Barbados 419 200 457 92 38 144Belarus -932 50 102 141 1,033 80Belgium 10,009 227 25,290 12 15,281 24Belize 129 179 234 111 105 125Benin 284 197 289 104 5 175Bermuda 636 208 660 80 24 149Bhutan 3 120 4 210 1 202Bolivia -85 77 278 106 363 98Bosnia-Hercegovina -5 95 20 181 25 148Botswana -134 70 54 159 188 114Brazil -1,019 49 24,626 13 25,644 16British Indian Ocean Territories 1 112 1 222 (-) 225British Virgin Islands 133 182 176 119 43 143Brunei -265 66 140 128 405 96Bulgaria -120 73 306 101 426 95Burkina 32 153 33 170 2 193Burma (Myanmar) 9 132 9 196 (-) 230Burundi 6 126 7 200 1 199
Cambodia -2,325 36 139 130 2,463 60Cameroon -164 68 133 131 297 104Canada -68,169 4 248,888 1 317,057 2Cape Verde 3 122 6 203 2 186Cayman Islands 619 207 640 83 21 152Central African Republic 17 140 20 183 3 185Chad -2,079 38 66 153 2,145 65Chile -684 55 8,315 28 8,999 36China -256,207 1 65,236 3 321,443 1Christmas Island -2 99 3 213 4 181Cocos (Keeling) Island (-) 109 1 220 1 201Colombia -876 51 8,558 26 9,434 33Comoros (-) 102 (-) 226 1 207Congo (Brazzaville) -2,931 33 140 127 3,071 55Congo (Kinshasa) -94 75 113 135 207 111Cook Islands 1 110 2 214 2 191Costa Rica 639 209 4,581 36 3,942 49Cote d'Ivoire -439 60 162 124 600 85Croatia -85 78 247 107 332 101Cuba 447 203 447 94 (-) 218Cyprus 152 185 169 121 17 155Czech Republic -1,168 47 1,262 68 2,431 61
Denmark -3,135 31 2,930 48 6,064 42Djibouti 54 163 59 155 5 180Dominica 82 173 84 144 2 189
19
Part B: NOT Seasonally Adjusted
Exhibit 13. Exports, Imports, and Trade Balance by Country and Area: 2007Annual Totals
In millions of dollars. Details may not equal totals due to rounding. (X) Not applicable. (-) Represents zero or less than one-half of measurement shown.
January - December
Country (1) Trade Balance Rank Exports F.A.S. Rank Imports Customs Rank
Dominican Republic 1,868 219 6,084 32 4,216 47
East Timor 11 133 11 194 (-) 215Ecuador -3,199 30 2,936 47 6,135 41Egypt 2,970 224 5,347 35 2,377 62El Salvador 270 195 2,313 56 2,044 67Equatorial Guinea -1,541 45 236 110 1,777 69Eritrea 6 125 6 202 (-) 209Estonia -54 83 242 108 296 105Ethiopia 79 172 168 122 88 129
Falkland Islands -4 97 1 223 5 178Faroe Islands -4 96 3 212 7 169Federal Republic of Germany -44,513 5 49,651 6 94,164 5Federated States of Micronesia 34 155 38 167 4 182Fiji -123 71 30 174 153 118Finland -2,133 37 3,133 44 5,266 44France -14,140 14 27,413 9 41,553 8French Guiana 31 152 31 173 (-) 210French Polynesia 62 166 124 133 62 136French Southern and Antarctic Lands (-) 103 (-) 225 1 206
Gabon -1,704 41 478 91 2,182 64Gambia 20 144 20 182 (-) 222Gaza Strip Administered by Israel 3 119 5 208 2 194Georgia 153 186 364 99 212 110Ghana 218 190 416 95 199 113Gibraltar 591 206 594 85 3 184Greece 918 213 2,110 57 1,192 76Greenland -6 94 4 209 10 160Grenada 75 170 83 145 8 165Guadeloupe 134 183 139 129 5 177Guatemala 1,039 214 4,065 41 3,026 57Guinea -26 90 74 149 99 127Guinea-Bissau 7 127 7 201 (-) 226Guyana 65 167 188 116 123 121
Haiti 192 189 680 77 488 90Heard and McDonald Islands 2 116 2 217 (-) 229Honduras 549 205 4,461 38 3,912 50Hong Kong 13,092 230 20,118 14 7,026 40Hungary -1,536 46 1,292 66 2,828 59
Iceland 424 202 630 84 206 112India -6,485 27 17,589 16 24,073 17Indonesia -10,066 19 4,235 39 14,301 26Iran -28 89 145 126 173 116Iraq -9,835 20 1,560 63 11,396 29Ireland -21,436 9 9,009 25 30,445 15Israel -7,775 23 13,019 19 20,794 19Italy -20,878 11 14,150 18 35,028 12
Jamaica 1,596 218 2,316 55 720 82Japan -82,760 2 62,704 4 145,463 4Jordan -473 59 856 73 1,329 73
Kazakhstan -499 58 753 75 1,252 74Kenya 252 193 578 87 325 103Kiribati (-) 104 1 221 1 197Korea, South -12,918 15 34,645 7 47,562 7Kuwait -1,634 43 2,484 52 4,119 48Kyrgyzstan 47 157 49 164 2 190
Laos -15 92 6 204 20 153Latvia 47 158 381 98 334 100Lebanon 722 210 826 74 104 126
20
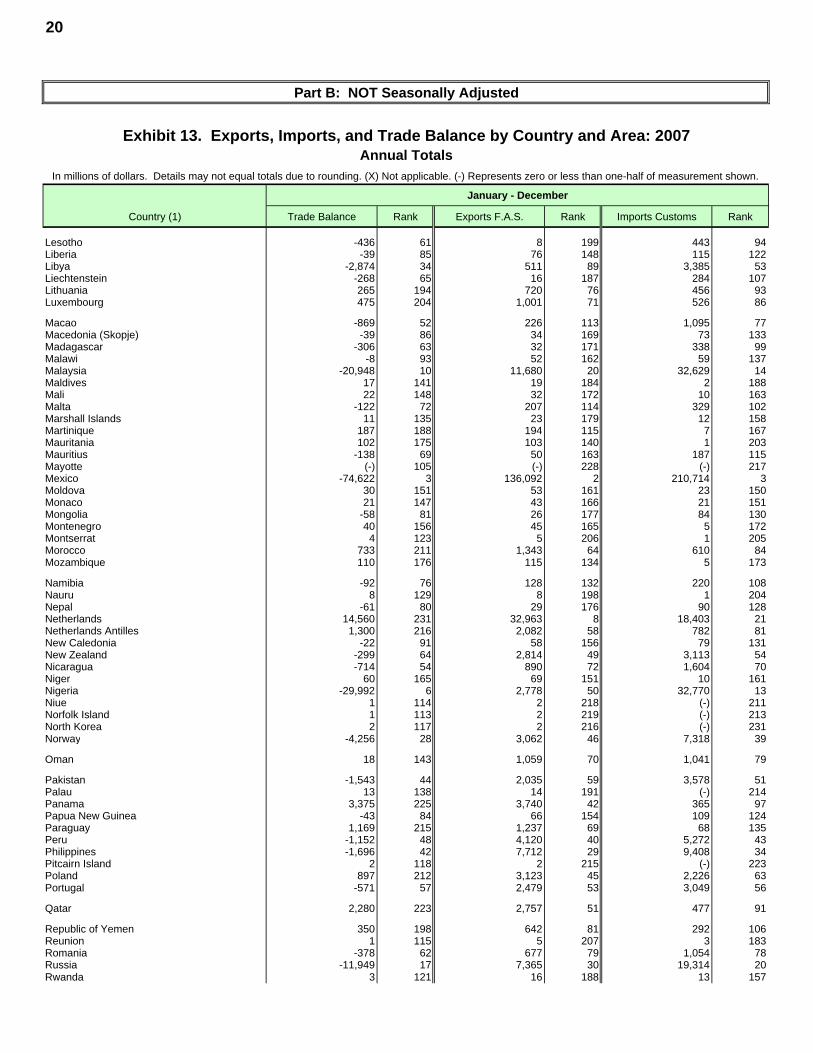
Part B: NOT Seasonally Adjusted
Exhibit 13. Exports, Imports, and Trade Balance by Country and Area: 2007Annual Totals
In millions of dollars. Details may not equal totals due to rounding. (X) Not applicable. (-) Represents zero or less than one-half of measurement shown.
January - December
Country (1) Trade Balance Rank Exports F.A.S. Rank Imports Customs Rank
Lesotho -436 61 8 199 443 94Liberia -39 85 76 148 115 122Libya -2,874 34 511 89 3,385 53Liechtenstein -268 65 16 187 284 107Lithuania 265 194 720 76 456 93Luxembourg 475 204 1,001 71 526 86
Macao -869 52 226 113 1,095 77Macedonia (Skopje) -39 86 34 169 73 133Madagascar -306 63 32 171 338 99Malawi -8 93 52 162 59 137Malaysia -20,948 10 11,680 20 32,629 14Maldives 17 141 19 184 2 188Mali 22 148 32 172 10 163Malta -122 72 207 114 329 102Marshall Islands 11 135 23 179 12 158Martinique 187 188 194 115 7 167Mauritania 102 175 103 140 1 203Mauritius -138 69 50 163 187 115Mayotte (-) 105 (-) 228 (-) 217Mexico -74,622 3 136,092 2 210,714 3Moldova 30 151 53 161 23 150Monaco 21 147 43 166 21 151Mongolia -58 81 26 177 84 130Montenegro 40 156 45 165 5 172Montserrat 4 123 5 206 1 205Morocco 733 211 1,343 64 610 84Mozambique 110 176 115 134 5 173
Namibia -92 76 128 132 220 108Nauru 8 129 8 198 1 204Nepal -61 80 29 176 90 128Netherlands 14,560 231 32,963 8 18,403 21Netherlands Antilles 1,300 216 2,082 58 782 81New Caledonia -22 91 58 156 79 131New Zealand -299 64 2,814 49 3,113 54Nicaragua -714 54 890 72 1,604 70Niger 60 165 69 151 10 161Nigeria -29,992 6 2,778 50 32,770 13Niue 1 114 2 218 (-) 211Norfolk Island 1 113 2 219 (-) 213North Korea 2 117 2 216 (-) 231Norway -4,256 28 3,062 46 7,318 39
Oman 18 143 1,059 70 1,041 79
Pakistan -1,543 44 2,035 59 3,578 51Palau 13 138 14 191 (-) 214Panama 3,375 225 3,740 42 365 97Papua New Guinea -43 84 66 154 109 124Paraguay 1,169 215 1,237 69 68 135Peru -1,152 48 4,120 40 5,272 43Philippines -1,696 42 7,712 29 9,408 34Pitcairn Island 2 118 2 215 (-) 223Poland 897 212 3,123 45 2,226 63Portugal -571 57 2,479 53 3,049 56
Qatar 2,280 223 2,757 51 477 91
Republic of Yemen 350 198 642 81 292 106Reunion 1 115 5 207 3 183Romania -378 62 677 79 1,054 78Russia -11,949 17 7,365 30 19,314 20Rwanda 3 121 16 188 13 157
21
Part B: NOT Seasonally Adjusted
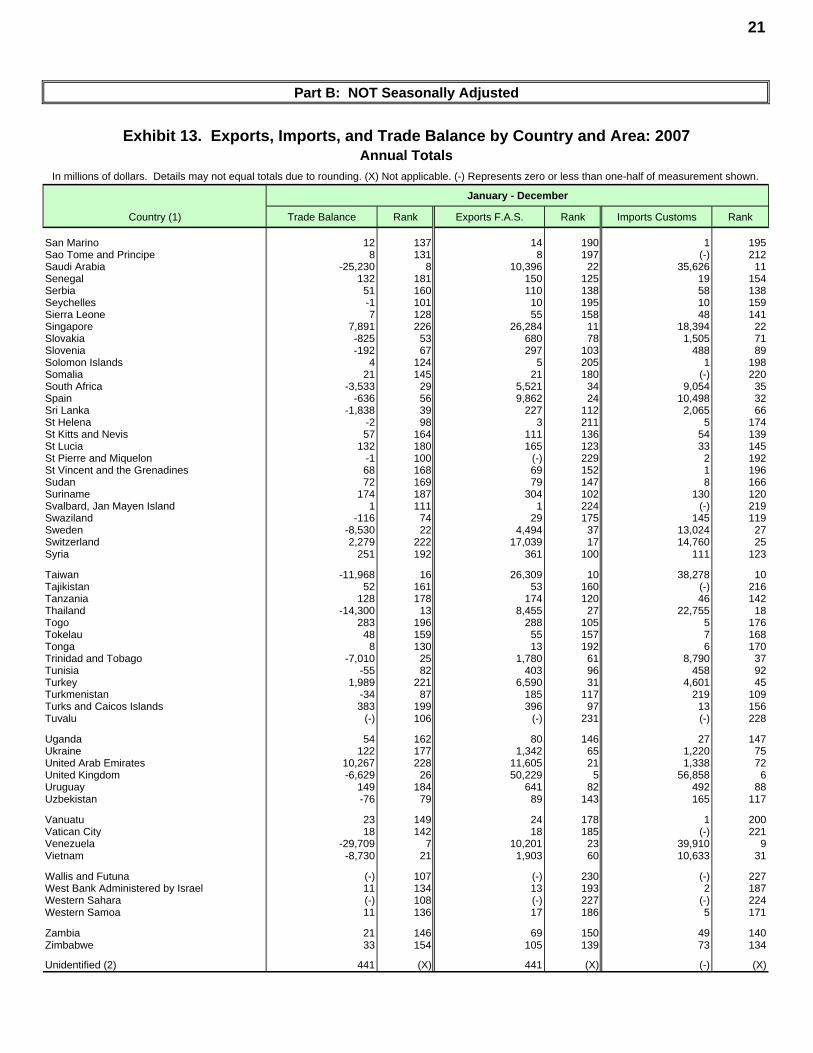
Exhibit 13. Exports, Imports, and Trade Balance by Country and Area: 2007Annual Totals
In millions of dollars. Details may not equal totals due to rounding. (X) Not applicable. (-) Represents zero or less than one-half of measurement shown.
January - December
Country (1) Trade Balance Rank Exports F.A.S. Rank Imports Customs Rank
San Marino 12 137 14 190 1 195Sao Tome and Principe 8 131 8 197 (-) 212Saudi Arabia -25,230 8 10,396 22 35,626 11Senegal 132 181 150 125 19 154Serbia 51 160 110 138 58 138Seychelles -1 101 10 195 10 159Sierra Leone 7 128 55 158 48 141Singapore 7,891 226 26,284 11 18,394 22Slovakia -825 53 680 78 1,505 71Slovenia -192 67 297 103 488 89Solomon Islands 4 124 5 205 1 198Somalia 21 145 21 180 (-) 220South Africa -3,533 29 5,521 34 9,054 35Spain -636 56 9,862 24 10,498 32Sri Lanka -1,838 39 227 112 2,065 66St Helena -2 98 3 211 5 174St Kitts and Nevis 57 164 111 136 54 139St Lucia 132 180 165 123 33 145St Pierre and Miquelon -1 100 (-) 229 2 192St Vincent and the Grenadines 68 168 69 152 1 196Sudan 72 169 79 147 8 166Suriname 174 187 304 102 130 120Svalbard, Jan Mayen Island 1 111 1 224 (-) 219Swaziland -116 74 29 175 145 119Sweden -8,530 22 4,494 37 13,024 27Switzerland 2,279 222 17,039 17 14,760 25Syria 251 192 361 100 111 123
Taiwan -11,968 16 26,309 10 38,278 10Tajikistan 52 161 53 160 (-) 216Tanzania 128 178 174 120 46 142Thailand -14,300 13 8,455 27 22,755 18Togo 283 196 288 105 5 176Tokelau 48 159 55 157 7 168Tonga 8 130 13 192 6 170Trinidad and Tobago -7,010 25 1,780 61 8,790 37Tunisia -55 82 403 96 458 92Turkey 1,989 221 6,590 31 4,601 45Turkmenistan -34 87 185 117 219 109Turks and Caicos Islands 383 199 396 97 13 156Tuvalu (-) 106 (-) 231 (-) 228
Uganda 54 162 80 146 27 147Ukraine 122 177 1,342 65 1,220 75United Arab Emirates 10,267 228 11,605 21 1,338 72United Kingdom -6,629 26 50,229 5 56,858 6Uruguay 149 184 641 82 492 88Uzbekistan -76 79 89 143 165 117
Vanuatu 23 149 24 178 1 200Vatican City 18 142 18 185 (-) 221Venezuela -29,709 7 10,201 23 39,910 9Vietnam -8,730 21 1,903 60 10,633 31
Wallis and Futuna (-) 107 (-) 230 (-) 227West Bank Administered by Israel 11 134 13 193 2 187Western Sahara (-) 108 (-) 227 (-) 224Western Samoa 11 136 17 186 5 171
Zambia 21 146 69 150 49 140Zimbabwe 33 154 105 139 73 134
Unidentified (2) 441 (X) 441 (X) (-) (X)
22
Part B: NOT Seasonally Adjusted
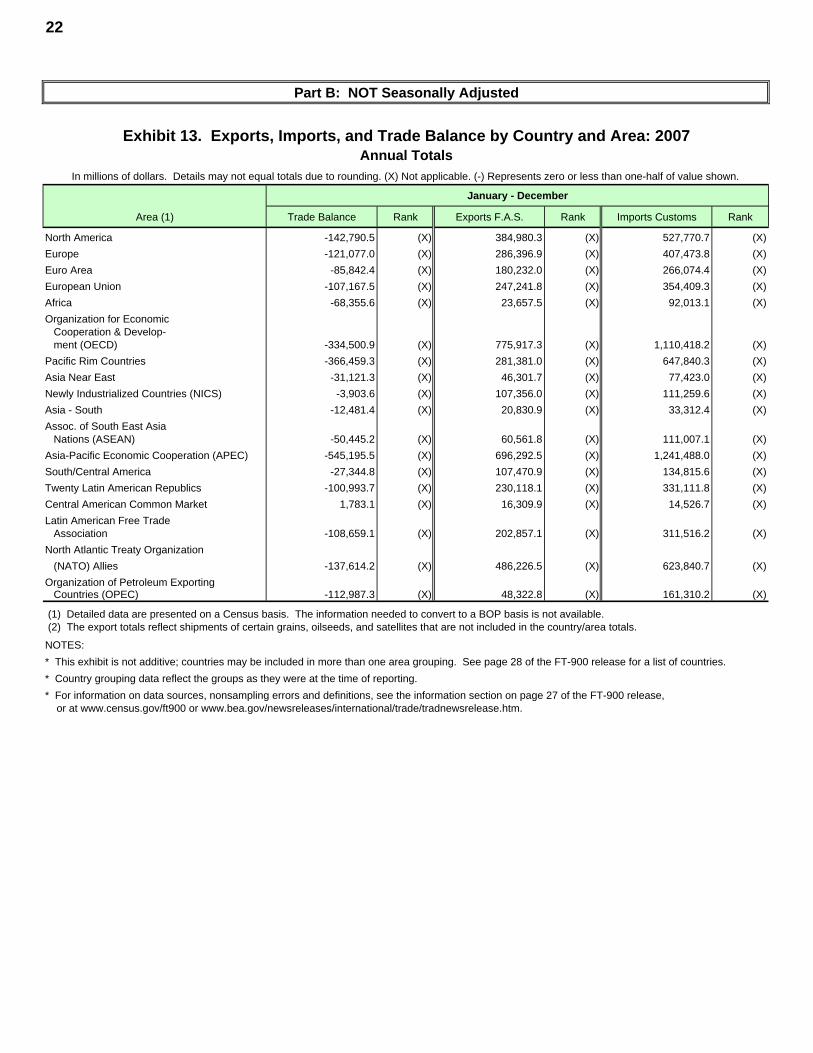
Exhibit 13. Exports, Imports, and Trade Balance by Country and Area: 2007Annual Totals
In millions of dollars. Details may not equal totals due to rounding. (X) Not applicable. (-) Represents zero or less than one-half of value shown.
January - December
Area (1) Trade Balance Rank Exports F.A.S. Rank Imports Customs Rank
North America -142,790.5 (X) 384,980.3 (X) 527,770.7 (X)Europe -121,077.0 (X) 286,396.9 (X) 407,473.8 (X)Euro Area -85,842.4 (X) 180,232.0 (X) 266,074.4 (X)European Union -107,167.5 (X) 247,241.8 (X) 354,409.3 (X)Africa -68,355.6 (X) 23,657.5 (X) 92,013.1 (X)Organization for Economic
Cooperation & Develop-ment (OECD) -334,500.9 (X) 775,917.3 (X) 1,110,418.2 (X)
Pacific Rim Countries -366,459.3 (X) 281,381.0 (X) 647,840.3 (X)Asia Near East -31,121.3 (X) 46,301.7 (X) 77,423.0 (X)Newly Industrialized Countries (NICS) -3,903.6 (X) 107,356.0 (X) 111,259.6 (X)Asia - South -12,481.4 (X) 20,830.9 (X) 33,312.4 (X)Assoc. of South East Asia
Nations (ASEAN) -50,445.2 (X) 60,561.8 (X) 111,007.1 (X)Asia-Pacific Economic Cooperation (APEC) -545,195.5 (X) 696,292.5 (X) 1,241,488.0 (X)South/Central America -27,344.8 (X) 107,470.9 (X) 134,815.6 (X)Twenty Latin American Republics -100,993.7 (X) 230,118.1 (X) 331,111.8 (X)Central American Common Market 1,783.1 (X) 16,309.9 (X) 14,526.7 (X)Latin American Free Trade
Association -108,659.1 (X) 202,857.1 (X) 311,516.2 (X)North Atlantic Treaty Organization
(NATO) Allies -137,614.2 (X) 486,226.5 (X) 623,840.7 (X)Organization of Petroleum Exporting
Countries (OPEC) -112,987.3 (X) 48,322.8 (X) 161,310.2 (X)
(1) Detailed data are presented on a Census basis. The information needed to convert to a BOP basis is not available. (2) The export totals reflect shipments of certain grains, oilseeds, and satellites that are not included in the country/area totals.
NOTES:* This exhibit is not additive; countries may be included in more than one area grouping. See page 28 of the FT-900 release for a list of countries.* Country grouping data reflect the groups as they were at the time of reporting. * For information on data sources, nonsampling errors and definitions, see the information section on page 27 of the FT-900 release,
or at www.census.gov/ft900 or www.bea.gov/newsreleases/international/trade/tradnewsrelease.htm.
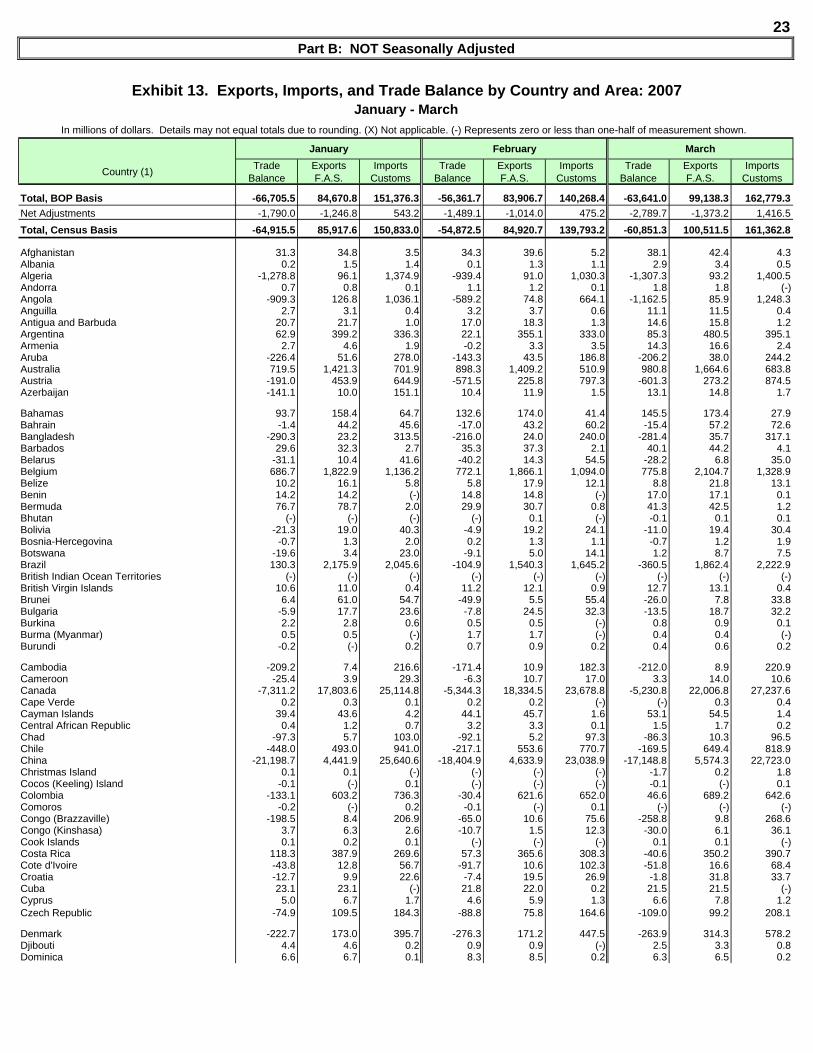
23Part B: NOT Seasonally Adjusted
Exhibit 13. Exports, Imports, and Trade Balance by Country and Area: 2007January - March
In millions of dollars. Details may not equal totals due to rounding. (X) Not applicable. (-) Represents zero or less than one-half of measurement shown.
January February March
Country (1) Trade Balance
Exports F.A.S.
Imports Customs
Trade Balance
Exports F.A.S.
Imports Customs
Trade Balance
Exports F.A.S.
Imports Customs
Total, BOP Basis -66,705.5 84,670.8 151,376.3 -56,361.7 83,906.7 140,268.4 -63,641.0 99,138.3 162,779.3Net Adjustments -1,790.0 -1,246.8 543.2 -1,489.1 -1,014.0 475.2 -2,789.7 -1,373.2 1,416.5Total, Census Basis -64,915.5 85,917.6 150,833.0 -54,872.5 84,920.7 139,793.2 -60,851.3 100,511.5 161,362.8
Afghanistan 31.3 34.8 3.5 34.3 39.6 5.2 38.1 42.4 4.3Albania 0.2 1.5 1.4 0.1 1.3 1.1 2.9 3.4 0.5Algeria -1,278.8 96.1 1,374.9 -939.4 91.0 1,030.3 -1,307.3 93.2 1,400.5Andorra 0.7 0.8 0.1 1.1 1.2 0.1 1.8 1.8 (-)Angola -909.3 126.8 1,036.1 -589.2 74.8 664.1 -1,162.5 85.9 1,248.3Anguilla 2.7 3.1 0.4 3.2 3.7 0.6 11.1 11.5 0.4Antigua and Barbuda 20.7 21.7 1.0 17.0 18.3 1.3 14.6 15.8 1.2Argentina 62.9 399.2 336.3 22.1 355.1 333.0 85.3 480.5 395.1Armenia 2.7 4.6 1.9 -0.2 3.3 3.5 14.3 16.6 2.4Aruba -226.4 51.6 278.0 -143.3 43.5 186.8 -206.2 38.0 244.2Australia 719.5 1,421.3 701.9 898.3 1,409.2 510.9 980.8 1,664.6 683.8Austria -191.0 453.9 644.9 -571.5 225.8 797.3 -601.3 273.2 874.5Azerbaijan -141.1 10.0 151.1 10.4 11.9 1.5 13.1 14.8 1.7
Bahamas 93.7 158.4 64.7 132.6 174.0 41.4 145.5 173.4 27.9Bahrain -1.4 44.2 45.6 -17.0 43.2 60.2 -15.4 57.2 72.6Bangladesh -290.3 23.2 313.5 -216.0 24.0 240.0 -281.4 35.7 317.1Barbados 29.6 32.3 2.7 35.3 37.3 2.1 40.1 44.2 4.1Belarus -31.1 10.4 41.6 -40.2 14.3 54.5 -28.2 6.8 35.0Belgium 686.7 1,822.9 1,136.2 772.1 1,866.1 1,094.0 775.8 2,104.7 1,328.9Belize 10.2 16.1 5.8 5.8 17.9 12.1 8.8 21.8 13.1Benin 14.2 14.2 (-) 14.8 14.8 (-) 17.0 17.1 0.1Bermuda 76.7 78.7 2.0 29.9 30.7 0.8 41.3 42.5 1.2Bhutan (-) (-) (-) (-) 0.1 (-) -0.1 0.1 0.1Bolivia -21.3 19.0 40.3 -4.9 19.2 24.1 -11.0 19.4 30.4Bosnia-Hercegovina -0.7 1.3 2.0 0.2 1.3 1.1 -0.7 1.2 1.9Botswana -19.6 3.4 23.0 -9.1 5.0 14.1 1.2 8.7 7.5Brazil 130.3 2,175.9 2,045.6 -104.9 1,540.3 1,645.2 -360.5 1,862.4 2,222.9British Indian Ocean Territories (-) (-) (-) (-) (-) (-) (-) (-) (-)British Virgin Islands 10.6 11.0 0.4 11.2 12.1 0.9 12.7 13.1 0.4Brunei 6.4 61.0 54.7 -49.9 5.5 55.4 -26.0 7.8 33.8Bulgaria -5.9 17.7 23.6 -7.8 24.5 32.3 -13.5 18.7 32.2Burkina 2.2 2.8 0.6 0.5 0.5 (-) 0.8 0.9 0.1Burma (Myanmar) 0.5 0.5 (-) 1.7 1.7 (-) 0.4 0.4 (-)Burundi -0.2 (-) 0.2 0.7 0.9 0.2 0.4 0.6 0.2
Cambodia -209.2 7.4 216.6 -171.4 10.9 182.3 -212.0 8.9 220.9Cameroon -25.4 3.9 29.3 -6.3 10.7 17.0 3.3 14.0 10.6Canada -7,311.2 17,803.6 25,114.8 -5,344.3 18,334.5 23,678.8 -5,230.8 22,006.8 27,237.6Cape Verde 0.2 0.3 0.1 0.2 0.2 (-) (-) 0.3 0.4Cayman Islands 39.4 43.6 4.2 44.1 45.7 1.6 53.1 54.5 1.4Central African Republic 0.4 1.2 0.7 3.2 3.3 0.1 1.5 1.7 0.2Chad -97.3 5.7 103.0 -92.1 5.2 97.3 -86.3 10.3 96.5Chile -448.0 493.0 941.0 -217.1 553.6 770.7 -169.5 649.4 818.9China -21,198.7 4,441.9 25,640.6 -18,404.9 4,633.9 23,038.9 -17,148.8 5,574.3 22,723.0Christmas Island 0.1 0.1 (-) (-) (-) (-) -1.7 0.2 1.8Cocos (Keeling) Island -0.1 (-) 0.1 (-) (-) (-) -0.1 (-) 0.1Colombia -133.1 603.2 736.3 -30.4 621.6 652.0 46.6 689.2 642.6Comoros -0.2 (-) 0.2 -0.1 (-) 0.1 (-) (-) (-)Congo (Brazzaville) -198.5 8.4 206.9 -65.0 10.6 75.6 -258.8 9.8 268.6Congo (Kinshasa) 3.7 6.3 2.6 -10.7 1.5 12.3 -30.0 6.1 36.1Cook Islands 0.1 0.2 0.1 (-) (-) (-) 0.1 0.1 (-)Costa Rica 118.3 387.9 269.6 57.3 365.6 308.3 -40.6 350.2 390.7Cote d'Ivoire -43.8 12.8 56.7 -91.7 10.6 102.3 -51.8 16.6 68.4Croatia -12.7 9.9 22.6 -7.4 19.5 26.9 -1.8 31.8 33.7Cuba 23.1 23.1 (-) 21.8 22.0 0.2 21.5 21.5 (-)Cyprus 5.0 6.7 1.7 4.6 5.9 1.3 6.6 7.8 1.2Czech Republic -74.9 109.5 184.3 -88.8 75.8 164.6 -109.0 99.2 208.1
Denmark -222.7 173.0 395.7 -276.3 171.2 447.5 -263.9 314.3 578.2Djibouti 4.4 4.6 0.2 0.9 0.9 (-) 2.5 3.3 0.8Dominica 6.6 6.7 0.1 8.3 8.5 0.2 6.3 6.5 0.2
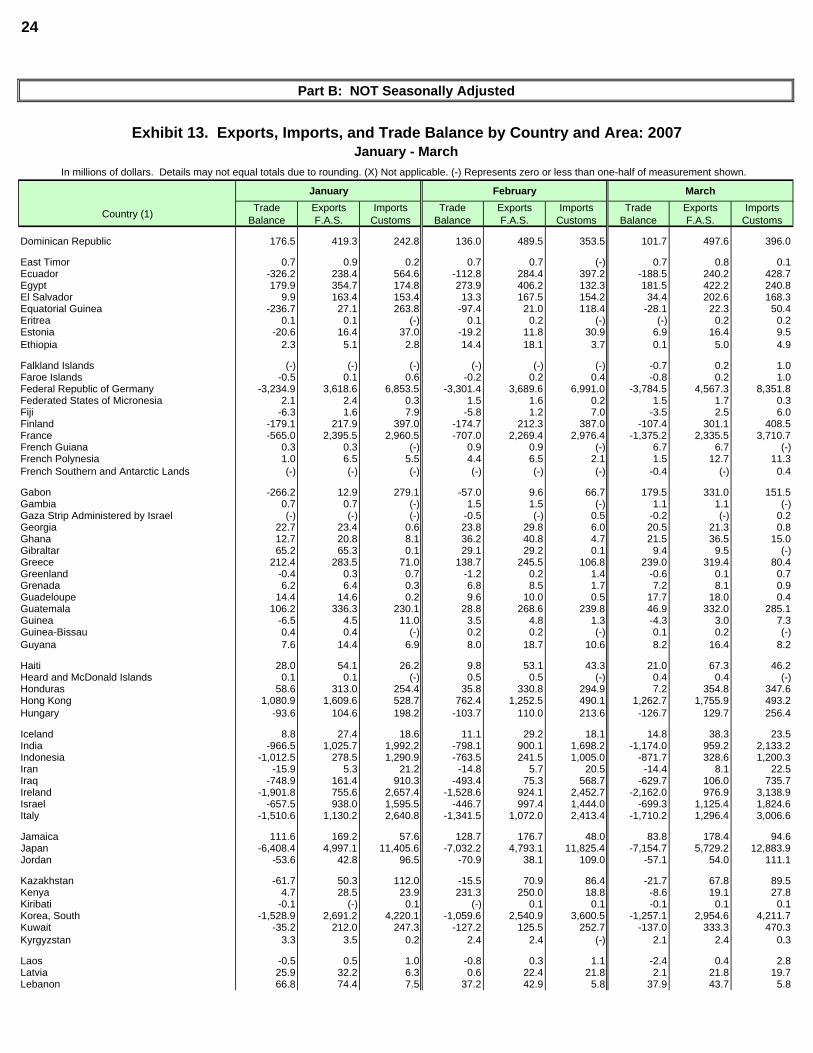
24
Part B: NOT Seasonally Adjusted
Exhibit 13. Exports, Imports, and Trade Balance by Country and Area: 2007January - March
In millions of dollars. Details may not equal totals due to rounding. (X) Not applicable. (-) Represents zero or less than one-half of measurement shown.
January February March
Country (1) Trade Balance
Exports F.A.S.
Imports Customs
Trade Balance
Exports F.A.S.
Imports Customs
Trade Balance
Exports F.A.S.
Imports Customs
Dominican Republic 176.5 419.3 242.8 136.0 489.5 353.5 101.7 497.6 396.0
East Timor 0.7 0.9 0.2 0.7 0.7 (-) 0.7 0.8 0.1Ecuador -326.2 238.4 564.6 -112.8 284.4 397.2 -188.5 240.2 428.7Egypt 179.9 354.7 174.8 273.9 406.2 132.3 181.5 422.2 240.8El Salvador 9.9 163.4 153.4 13.3 167.5 154.2 34.4 202.6 168.3Equatorial Guinea -236.7 27.1 263.8 -97.4 21.0 118.4 -28.1 22.3 50.4Eritrea 0.1 0.1 (-) 0.1 0.2 (-) (-) 0.2 0.2Estonia -20.6 16.4 37.0 -19.2 11.8 30.9 6.9 16.4 9.5Ethiopia 2.3 5.1 2.8 14.4 18.1 3.7 0.1 5.0 4.9
Falkland Islands (-) (-) (-) (-) (-) (-) -0.7 0.2 1.0Faroe Islands -0.5 0.1 0.6 -0.2 0.2 0.4 -0.8 0.2 1.0Federal Republic of Germany -3,234.9 3,618.6 6,853.5 -3,301.4 3,689.6 6,991.0 -3,784.5 4,567.3 8,351.8Federated States of Micronesia 2.1 2.4 0.3 1.5 1.6 0.2 1.5 1.7 0.3Fiji -6.3 1.6 7.9 -5.8 1.2 7.0 -3.5 2.5 6.0Finland -179.1 217.9 397.0 -174.7 212.3 387.0 -107.4 301.1 408.5France -565.0 2,395.5 2,960.5 -707.0 2,269.4 2,976.4 -1,375.2 2,335.5 3,710.7French Guiana 0.3 0.3 (-) 0.9 0.9 (-) 6.7 6.7 (-)French Polynesia 1.0 6.5 5.5 4.4 6.5 2.1 1.5 12.7 11.3French Southern and Antarctic Lands (-) (-) (-) (-) (-) (-) -0.4 (-) 0.4
Gabon -266.2 12.9 279.1 -57.0 9.6 66.7 179.5 331.0 151.5Gambia 0.7 0.7 (-) 1.5 1.5 (-) 1.1 1.1 (-)Gaza Strip Administered by Israel (-) (-) (-) -0.5 (-) 0.5 -0.2 (-) 0.2Georgia 22.7 23.4 0.6 23.8 29.8 6.0 20.5 21.3 0.8Ghana 12.7 20.8 8.1 36.2 40.8 4.7 21.5 36.5 15.0Gibraltar 65.2 65.3 0.1 29.1 29.2 0.1 9.4 9.5 (-)Greece 212.4 283.5 71.0 138.7 245.5 106.8 239.0 319.4 80.4Greenland -0.4 0.3 0.7 -1.2 0.2 1.4 -0.6 0.1 0.7Grenada 6.2 6.4 0.3 6.8 8.5 1.7 7.2 8.1 0.9Guadeloupe 14.4 14.6 0.2 9.6 10.0 0.5 17.7 18.0 0.4Guatemala 106.2 336.3 230.1 28.8 268.6 239.8 46.9 332.0 285.1Guinea -6.5 4.5 11.0 3.5 4.8 1.3 -4.3 3.0 7.3Guinea-Bissau 0.4 0.4 (-) 0.2 0.2 (-) 0.1 0.2 (-)Guyana 7.6 14.4 6.9 8.0 18.7 10.6 8.2 16.4 8.2
Haiti 28.0 54.1 26.2 9.8 53.1 43.3 21.0 67.3 46.2Heard and McDonald Islands 0.1 0.1 (-) 0.5 0.5 (-) 0.4 0.4 (-)Honduras 58.6 313.0 254.4 35.8 330.8 294.9 7.2 354.8 347.6Hong Kong 1,080.9 1,609.6 528.7 762.4 1,252.5 490.1 1,262.7 1,755.9 493.2Hungary -93.6 104.6 198.2 -103.7 110.0 213.6 -126.7 129.7 256.4
Iceland 8.8 27.4 18.6 11.1 29.2 18.1 14.8 38.3 23.5India -966.5 1,025.7 1,992.2 -798.1 900.1 1,698.2 -1,174.0 959.2 2,133.2Indonesia -1,012.5 278.5 1,290.9 -763.5 241.5 1,005.0 -871.7 328.6 1,200.3Iran -15.9 5.3 21.2 -14.8 5.7 20.5 -14.4 8.1 22.5Iraq -748.9 161.4 910.3 -493.4 75.3 568.7 -629.7 106.0 735.7Ireland -1,901.8 755.6 2,657.4 -1,528.6 924.1 2,452.7 -2,162.0 976.9 3,138.9Israel -657.5 938.0 1,595.5 -446.7 997.4 1,444.0 -699.3 1,125.4 1,824.6Italy -1,510.6 1,130.2 2,640.8 -1,341.5 1,072.0 2,413.4 -1,710.2 1,296.4 3,006.6
Jamaica 111.6 169.2 57.6 128.7 176.7 48.0 83.8 178.4 94.6Japan -6,408.4 4,997.1 11,405.6 -7,032.2 4,793.1 11,825.4 -7,154.7 5,729.2 12,883.9Jordan -53.6 42.8 96.5 -70.9 38.1 109.0 -57.1 54.0 111.1
Kazakhstan -61.7 50.3 112.0 -15.5 70.9 86.4 -21.7 67.8 89.5Kenya 4.7 28.5 23.9 231.3 250.0 18.8 -8.6 19.1 27.8Kiribati -0.1 (-) 0.1 (-) 0.1 0.1 -0.1 0.1 0.1Korea, South -1,528.9 2,691.2 4,220.1 -1,059.6 2,540.9 3,600.5 -1,257.1 2,954.6 4,211.7Kuwait -35.2 212.0 247.3 -127.2 125.5 252.7 -137.0 333.3 470.3Kyrgyzstan 3.3 3.5 0.2 2.4 2.4 (-) 2.1 2.4 0.3
Laos -0.5 0.5 1.0 -0.8 0.3 1.1 -2.4 0.4 2.8Latvia 25.9 32.2 6.3 0.6 22.4 21.8 2.1 21.8 19.7Lebanon 66.8 74.4 7.5 37.2 42.9 5.8 37.9 43.7 5.8

25
Part B: NOT Seasonally Adjusted
Exhibit 13. Exports, Imports, and Trade Balance by Country and Area: 2007January - March
In millions of dollars. Details may not equal totals due to rounding. (X) Not applicable. (-) Represents zero or less than one-half of measurement shown.
January February March
Country (1) Trade Balance
Exports F.A.S.
Imports Customs
Trade Balance
Exports F.A.S.
Imports Customs
Trade Balance
Exports F.A.S.
Imports Customs
Lesotho -37.3 (-) 37.3 -25.9 0.8 26.7 -45.2 1.4 46.7Liberia -1.1 6.4 7.6 -4.0 5.9 9.8 -1.8 7.8 9.6Libya -126.6 30.5 157.2 -219.1 36.7 255.8 -165.7 39.9 205.6Liechtenstein -16.6 1.2 17.8 -20.4 1.4 21.8 -24.6 1.5 26.1Lithuania 19.0 55.3 36.3 19.4 53.4 34.0 14.9 57.9 43.0Luxembourg -8.2 41.5 49.7 -1.6 42.8 44.5 14.7 55.4 40.7
Macao -62.1 21.1 83.1 -72.0 16.4 88.4 -56.9 21.5 78.3Macedonia (Skopje) -6.1 1.4 7.6 -1.3 3.3 4.6 -0.5 1.8 2.4Madagascar -26.9 0.8 27.7 -14.6 0.8 15.4 -23.8 2.2 26.0Malawi -4.5 3.2 7.7 -1.5 3.2 4.7 -3.9 1.9 5.8Malaysia -1,849.2 932.3 2,781.5 -1,655.4 939.4 2,594.8 -1,705.2 1,049.4 2,754.6Maldives 0.7 1.1 0.3 0.7 1.2 0.5 2.1 2.3 0.2Mali 2.3 2.6 0.3 1.3 1.6 0.2 2.7 2.7 (-)Malta 4.1 24.7 20.6 -14.2 10.0 24.2 -1.8 23.3 25.0Marshall Islands 0.9 1.7 0.8 1.0 1.5 0.5 0.3 1.0 0.7Martinique 9.1 9.3 0.2 23.4 23.4 (-) 15.9 16.2 0.3Mauritania 39.2 39.2 (-) 3.2 3.2 (-) 5.7 5.8 0.1Mauritius -14.2 2.3 16.4 -12.1 2.3 14.4 -12.4 1.8 14.2Mayotte (-) (-) (-) (-) (-) (-) (-) (-) (-)Mexico -4,671.0 10,702.4 15,373.4 -5,162.8 9,980.0 15,142.8 -6,697.1 11,493.5 18,190.6Moldova 2.0 3.6 1.6 0.9 2.6 1.7 (-) 2.3 2.3Monaco 0.8 2.5 1.7 2.1 3.6 1.5 -0.3 0.9 1.2Mongolia -4.8 0.8 5.6 -2.5 5.9 8.4 -4.2 1.3 5.5Montenegro 1.8 2.1 0.3 3.3 3.4 0.1 0.6 2.1 1.6Montserrat 0.3 0.3 (-) 0.4 0.5 (-) 0.4 0.5 (-)Morocco 17.8 65.7 47.8 112.1 154.9 42.8 92.5 143.3 50.8Mozambique 8.7 9.4 0.6 6.8 7.1 0.3 6.8 7.3 0.5
Namibia 6.2 18.1 11.9 2.3 9.1 6.8 -66.3 6.6 72.9Nauru 0.6 0.6 (-) 0.1 0.1 (-) 0.1 0.1 (-)Nepal -6.3 1.0 7.4 -4.4 1.3 5.7 -5.7 1.6 7.2Netherlands 1,852.1 3,016.2 1,164.1 1,534.1 2,530.9 996.8 1,646.3 3,147.0 1,500.7Netherlands Antilles 35.3 120.9 85.6 68.8 114.2 45.4 39.0 124.2 85.2New Caledonia 2.3 4.8 2.5 0.6 2.9 2.2 -4.5 2.5 6.9New Zealand 117.4 380.9 263.5 -66.6 157.5 224.1 -30.1 218.0 248.1Nicaragua -56.4 61.1 117.4 -59.2 54.4 113.5 -48.7 73.1 121.8Niger 2.9 3.4 0.5 7.8 7.9 0.1 6.0 6.0 0.1Nigeria -1,992.6 167.4 2,160.0 -1,872.3 207.6 2,079.9 -2,412.3 220.0 2,632.3Niue 0.3 0.3 (-) 0.3 0.3 (-) 0.2 0.3 (-)Norfolk Island 0.5 0.5 (-) 0.1 0.1 (-) (-) (-) (-)North Korea (-) (-) (-) (-) (-) (-) (-) (-) (-)Norway -331.3 214.7 546.1 -321.2 203.3 524.5 -337.2 271.5 608.8
Oman 30.4 43.1 12.8 28.0 33.4 5.4 62.8 70.4 7.6
Pakistan -224.0 72.3 296.3 108.8 337.4 228.6 -39.9 238.6 278.6Palau 1.8 1.8 (-) 1.1 1.1 (-) 1.2 1.2 (-)Panama 185.1 208.8 23.7 194.1 221.6 27.4 274.9 303.0 28.2Papua New Guinea -15.4 2.8 18.2 -3.0 2.6 5.6 1.0 7.0 6.0Paraguay 68.4 73.5 5.1 64.3 68.4 4.2 102.0 104.8 2.8Peru -170.8 270.5 441.2 -117.7 281.5 399.2 -98.9 273.3 372.3Philippines -144.9 611.7 756.6 -113.0 589.6 702.6 -122.7 690.1 812.7Pitcairn Island (-) (-) (-) 0.3 0.3 (-) 0.1 0.1 (-)Poland 99.4 262.3 162.8 -1.8 152.8 154.6 4.8 186.2 181.5Portugal -89.6 182.9 272.5 -32.3 174.5 206.8 -63.3 212.6 275.9
Qatar 59.7 104.7 45.0 136.8 146.7 9.9 139.8 162.2 22.4
Republic of Yemen 12.5 13.4 0.9 -4.8 31.7 36.5 -26.4 10.8 37.2Reunion -0.7 0.3 1.0 -0.2 0.3 0.5 0.6 0.6 (-)Romania -48.6 40.8 89.4 -17.5 50.0 67.5 -47.2 50.6 97.8Russia -616.2 383.2 999.5 -689.9 437.4 1,127.3 -1,094.2 558.0 1,652.2Rwanda -0.3 0.3 0.6 0.1 0.7 0.6 0.4 0.7 0.4
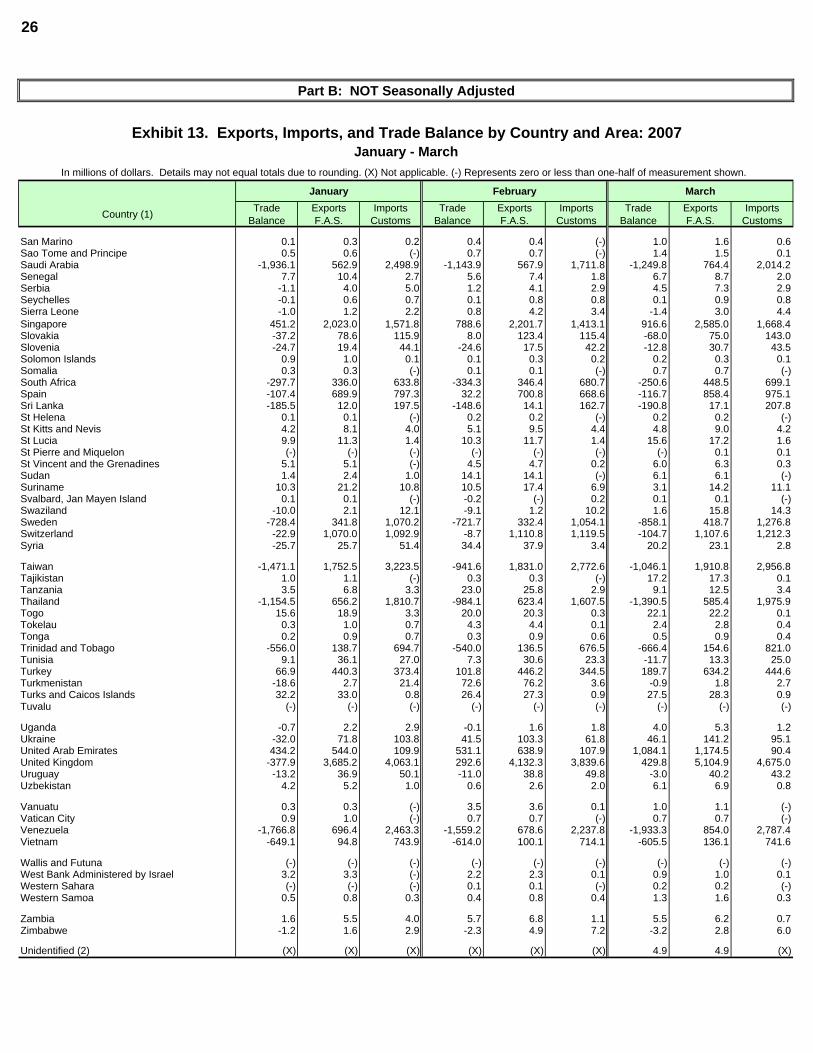
26
Part B: NOT Seasonally Adjusted
Exhibit 13. Exports, Imports, and Trade Balance by Country and Area: 2007January - March
In millions of dollars. Details may not equal totals due to rounding. (X) Not applicable. (-) Represents zero or less than one-half of measurement shown.
January February March
Country (1) Trade Balance
Exports F.A.S.
Imports Customs
Trade Balance
Exports F.A.S.
Imports Customs
Trade Balance
Exports F.A.S.
Imports Customs
San Marino 0.1 0.3 0.2 0.4 0.4 (-) 1.0 1.6 0.6Sao Tome and Principe 0.5 0.6 (-) 0.7 0.7 (-) 1.4 1.5 0.1Saudi Arabia -1,936.1 562.9 2,498.9 -1,143.9 567.9 1,711.8 -1,249.8 764.4 2,014.2Senegal 7.7 10.4 2.7 5.6 7.4 1.8 6.7 8.7 2.0Serbia -1.1 4.0 5.0 1.2 4.1 2.9 4.5 7.3 2.9Seychelles -0.1 0.6 0.7 0.1 0.8 0.8 0.1 0.9 0.8Sierra Leone -1.0 1.2 2.2 0.8 4.2 3.4 -1.4 3.0 4.4Singapore 451.2 2,023.0 1,571.8 788.6 2,201.7 1,413.1 916.6 2,585.0 1,668.4Slovakia -37.2 78.6 115.9 8.0 123.4 115.4 -68.0 75.0 143.0Slovenia -24.7 19.4 44.1 -24.6 17.5 42.2 -12.8 30.7 43.5Solomon Islands 0.9 1.0 0.1 0.1 0.3 0.2 0.2 0.3 0.1Somalia 0.3 0.3 (-) 0.1 0.1 (-) 0.7 0.7 (-)South Africa -297.7 336.0 633.8 -334.3 346.4 680.7 -250.6 448.5 699.1Spain -107.4 689.9 797.3 32.2 700.8 668.6 -116.7 858.4 975.1Sri Lanka -185.5 12.0 197.5 -148.6 14.1 162.7 -190.8 17.1 207.8St Helena 0.1 0.1 (-) 0.2 0.2 (-) 0.2 0.2 (-)St Kitts and Nevis 4.2 8.1 4.0 5.1 9.5 4.4 4.8 9.0 4.2St Lucia 9.9 11.3 1.4 10.3 11.7 1.4 15.6 17.2 1.6St Pierre and Miquelon (-) (-) (-) (-) (-) (-) (-) 0.1 0.1St Vincent and the Grenadines 5.1 5.1 (-) 4.5 4.7 0.2 6.0 6.3 0.3Sudan 1.4 2.4 1.0 14.1 14.1 (-) 6.1 6.1 (-)Suriname 10.3 21.2 10.8 10.5 17.4 6.9 3.1 14.2 11.1Svalbard, Jan Mayen Island 0.1 0.1 (-) -0.2 (-) 0.2 0.1 0.1 (-)Swaziland -10.0 2.1 12.1 -9.1 1.2 10.2 1.6 15.8 14.3Sweden -728.4 341.8 1,070.2 -721.7 332.4 1,054.1 -858.1 418.7 1,276.8Switzerland -22.9 1,070.0 1,092.9 -8.7 1,110.8 1,119.5 -104.7 1,107.6 1,212.3Syria -25.7 25.7 51.4 34.4 37.9 3.4 20.2 23.1 2.8
Taiwan -1,471.1 1,752.5 3,223.5 -941.6 1,831.0 2,772.6 -1,046.1 1,910.8 2,956.8Tajikistan 1.0 1.1 (-) 0.3 0.3 (-) 17.2 17.3 0.1Tanzania 3.5 6.8 3.3 23.0 25.8 2.9 9.1 12.5 3.4Thailand -1,154.5 656.2 1,810.7 -984.1 623.4 1,607.5 -1,390.5 585.4 1,975.9Togo 15.6 18.9 3.3 20.0 20.3 0.3 22.1 22.2 0.1Tokelau 0.3 1.0 0.7 4.3 4.4 0.1 2.4 2.8 0.4Tonga 0.2 0.9 0.7 0.3 0.9 0.6 0.5 0.9 0.4Trinidad and Tobago -556.0 138.7 694.7 -540.0 136.5 676.5 -666.4 154.6 821.0Tunisia 9.1 36.1 27.0 7.3 30.6 23.3 -11.7 13.3 25.0Turkey 66.9 440.3 373.4 101.8 446.2 344.5 189.7 634.2 444.6Turkmenistan -18.6 2.7 21.4 72.6 76.2 3.6 -0.9 1.8 2.7Turks and Caicos Islands 32.2 33.0 0.8 26.4 27.3 0.9 27.5 28.3 0.9Tuvalu (-) (-) (-) (-) (-) (-) (-) (-) (-)
Uganda -0.7 2.2 2.9 -0.1 1.6 1.8 4.0 5.3 1.2Ukraine -32.0 71.8 103.8 41.5 103.3 61.8 46.1 141.2 95.1United Arab Emirates 434.2 544.0 109.9 531.1 638.9 107.9 1,084.1 1,174.5 90.4United Kingdom -377.9 3,685.2 4,063.1 292.6 4,132.3 3,839.6 429.8 5,104.9 4,675.0Uruguay -13.2 36.9 50.1 -11.0 38.8 49.8 -3.0 40.2 43.2Uzbekistan 4.2 5.2 1.0 0.6 2.6 2.0 6.1 6.9 0.8
Vanuatu 0.3 0.3 (-) 3.5 3.6 0.1 1.0 1.1 (-)Vatican City 0.9 1.0 (-) 0.7 0.7 (-) 0.7 0.7 (-)Venezuela -1,766.8 696.4 2,463.3 -1,559.2 678.6 2,237.8 -1,933.3 854.0 2,787.4Vietnam -649.1 94.8 743.9 -614.0 100.1 714.1 -605.5 136.1 741.6
Wallis and Futuna (-) (-) (-) (-) (-) (-) (-) (-) (-)West Bank Administered by Israel 3.2 3.3 (-) 2.2 2.3 0.1 0.9 1.0 0.1Western Sahara (-) (-) (-) 0.1 0.1 (-) 0.2 0.2 (-)Western Samoa 0.5 0.8 0.3 0.4 0.8 0.4 1.3 1.6 0.3
Zambia 1.6 5.5 4.0 5.7 6.8 1.1 5.5 6.2 0.7Zimbabwe -1.2 1.6 2.9 -2.3 4.9 7.2 -3.2 2.8 6.0
Unidentified (2) (X) (X) (X) (X) (X) (X) 4.9 4.9 (X)
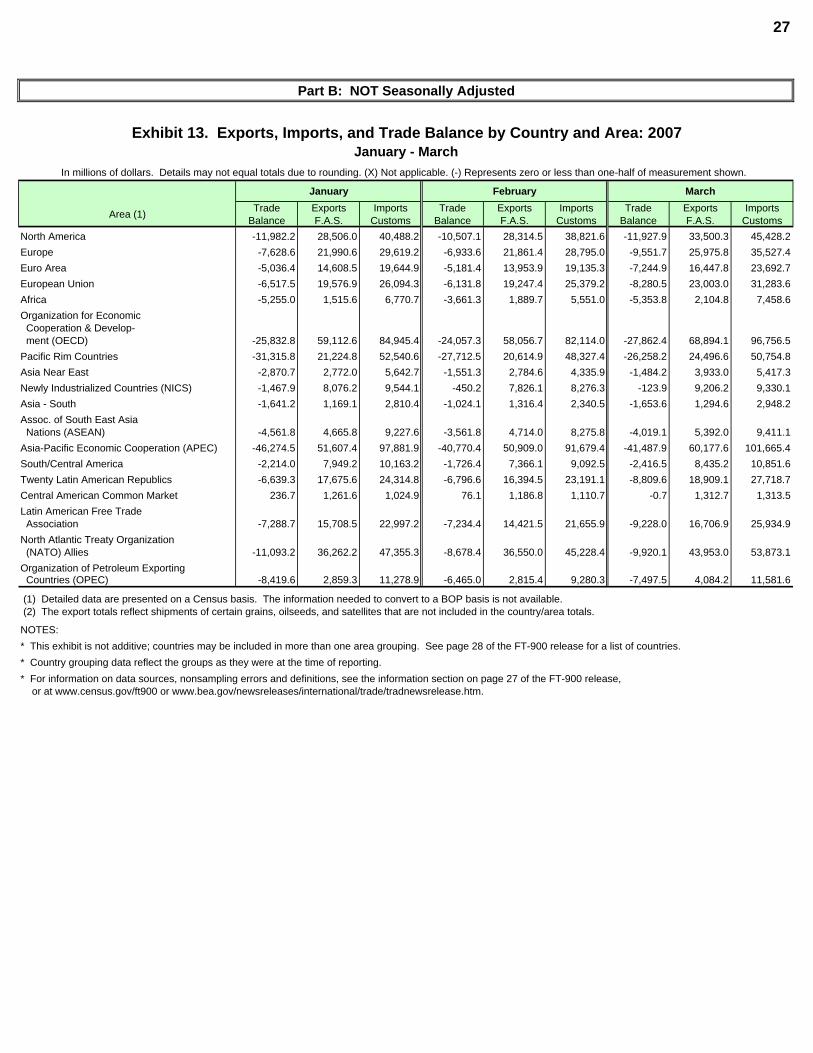
27
Part B: NOT Seasonally Adjusted
Exhibit 13. Exports, Imports, and Trade Balance by Country and Area: 2007January - March
In millions of dollars. Details may not equal totals due to rounding. (X) Not applicable. (-) Represents zero or less than one-half of measurement shown.
January February March
Area (1) Trade Balance
Exports F.A.S.
Imports Customs
Trade Balance
Exports F.A.S.
Imports Customs
Trade Balance
Exports F.A.S.
Imports Customs
North America -11,982.2 28,506.0 40,488.2 -10,507.1 28,314.5 38,821.6 -11,927.9 33,500.3 45,428.2Europe -7,628.6 21,990.6 29,619.2 -6,933.6 21,861.4 28,795.0 -9,551.7 25,975.8 35,527.4Euro Area -5,036.4 14,608.5 19,644.9 -5,181.4 13,953.9 19,135.3 -7,244.9 16,447.8 23,692.7European Union -6,517.5 19,576.9 26,094.3 -6,131.8 19,247.4 25,379.2 -8,280.5 23,003.0 31,283.6Africa -5,255.0 1,515.6 6,770.7 -3,661.3 1,889.7 5,551.0 -5,353.8 2,104.8 7,458.6Organization for Economic Cooperation & Develop- ment (OECD) -25,832.8 59,112.6 84,945.4 -24,057.3 58,056.7 82,114.0 -27,862.4 68,894.1 96,756.5Pacific Rim Countries -31,315.8 21,224.8 52,540.6 -27,712.5 20,614.9 48,327.4 -26,258.2 24,496.6 50,754.8Asia Near East -2,870.7 2,772.0 5,642.7 -1,551.3 2,784.6 4,335.9 -1,484.2 3,933.0 5,417.3Newly Industrialized Countries (NICS) -1,467.9 8,076.2 9,544.1 -450.2 7,826.1 8,276.3 -123.9 9,206.2 9,330.1Asia - South -1,641.2 1,169.1 2,810.4 -1,024.1 1,316.4 2,340.5 -1,653.6 1,294.6 2,948.2Assoc. of South East Asia Nations (ASEAN) -4,561.8 4,665.8 9,227.6 -3,561.8 4,714.0 8,275.8 -4,019.1 5,392.0 9,411.1Asia-Pacific Economic Cooperation (APEC) -46,274.5 51,607.4 97,881.9 -40,770.4 50,909.0 91,679.4 -41,487.9 60,177.6 101,665.4South/Central America -2,214.0 7,949.2 10,163.2 -1,726.4 7,366.1 9,092.5 -2,416.5 8,435.2 10,851.6Twenty Latin American Republics -6,639.3 17,675.6 24,314.8 -6,796.6 16,394.5 23,191.1 -8,809.6 18,909.1 27,718.7Central American Common Market 236.7 1,261.6 1,024.9 76.1 1,186.8 1,110.7 -0.7 1,312.7 1,313.5Latin American Free Trade Association -7,288.7 15,708.5 22,997.2 -7,234.4 14,421.5 21,655.9 -9,228.0 16,706.9 25,934.9North Atlantic Treaty Organization (NATO) Allies -11,093.2 36,262.2 47,355.3 -8,678.4 36,550.0 45,228.4 -9,920.1 43,953.0 53,873.1Organization of Petroleum Exporting Countries (OPEC) -8,419.6 2,859.3 11,278.9 -6,465.0 2,815.4 9,280.3 -7,497.5 4,084.2 11,581.6
(1) Detailed data are presented on a Census basis. The information needed to convert to a BOP basis is not available. (2) The export totals reflect shipments of certain grains, oilseeds, and satellites that are not included in the country/area totals.
NOTES:* This exhibit is not additive; countries may be included in more than one area grouping. See page 28 of the FT-900 release for a list of countries.* Country grouping data reflect the groups as they were at the time of reporting. * For information on data sources, nonsampling errors and definitions, see the information section on page 27 of the FT-900 release,
or at www.census.gov/ft900 or www.bea.gov/newsreleases/international/trade/tradnewsrelease.htm.
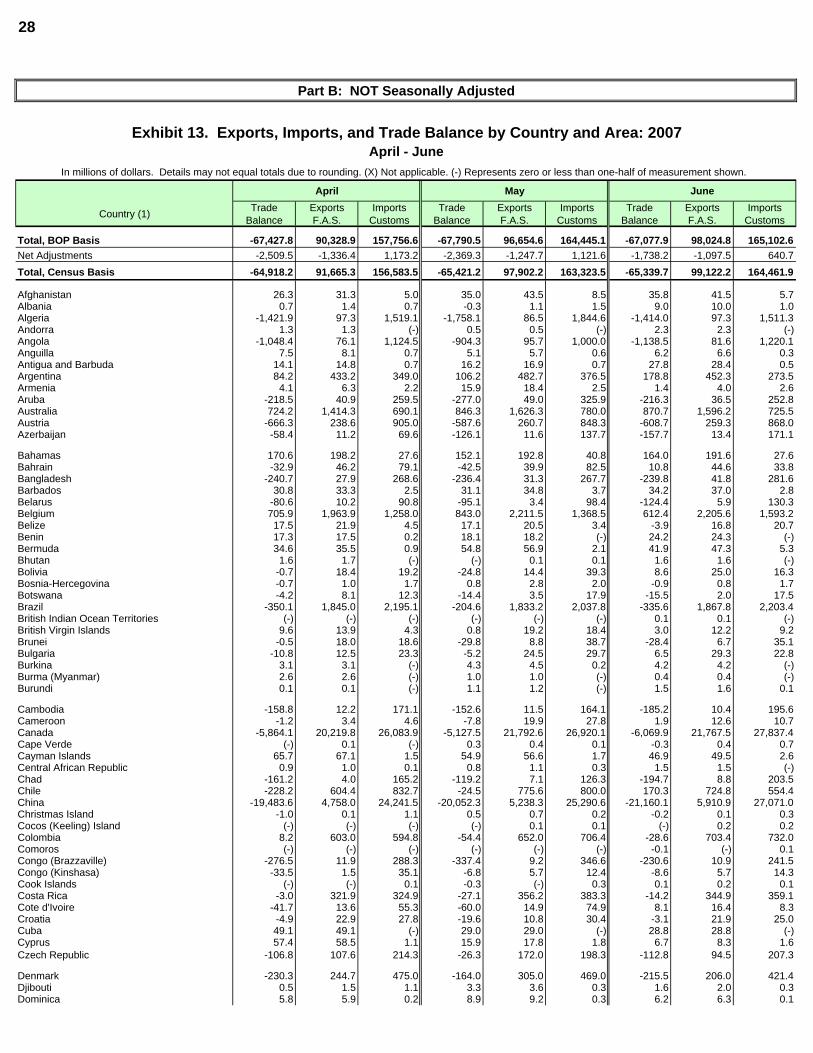
28
Part B: NOT Seasonally Adjusted
Exhibit 13. Exports, Imports, and Trade Balance by Country and Area: 2007April - June
In millions of dollars. Details may not equal totals due to rounding. (X) Not applicable. (-) Represents zero or less than one-half of measurement shown.
April May June
Country (1) Trade Balance
Exports F.A.S.
Imports Customs
Trade Balance
Exports F.A.S.
Imports Customs
Trade Balance
Exports F.A.S.
Imports Customs
Total, BOP Basis -67,427.8 90,328.9 157,756.6 -67,790.5 96,654.6 164,445.1 -67,077.9 98,024.8 165,102.6Net Adjustments -2,509.5 -1,336.4 1,173.2 -2,369.3 -1,247.7 1,121.6 -1,738.2 -1,097.5 640.7Total, Census Basis -64,918.2 91,665.3 156,583.5 -65,421.2 97,902.2 163,323.5 -65,339.7 99,122.2 164,461.9
Afghanistan 26.3 31.3 5.0 35.0 43.5 8.5 35.8 41.5 5.7Albania 0.7 1.4 0.7 -0.3 1.1 1.5 9.0 10.0 1.0Algeria -1,421.9 97.3 1,519.1 -1,758.1 86.5 1,844.6 -1,414.0 97.3 1,511.3Andorra 1.3 1.3 (-) 0.5 0.5 (-) 2.3 2.3 (-)Angola -1,048.4 76.1 1,124.5 -904.3 95.7 1,000.0 -1,138.5 81.6 1,220.1Anguilla 7.5 8.1 0.7 5.1 5.7 0.6 6.2 6.6 0.3Antigua and Barbuda 14.1 14.8 0.7 16.2 16.9 0.7 27.8 28.4 0.5Argentina 84.2 433.2 349.0 106.2 482.7 376.5 178.8 452.3 273.5Armenia 4.1 6.3 2.2 15.9 18.4 2.5 1.4 4.0 2.6Aruba -218.5 40.9 259.5 -277.0 49.0 325.9 -216.3 36.5 252.8Australia 724.2 1,414.3 690.1 846.3 1,626.3 780.0 870.7 1,596.2 725.5Austria -666.3 238.6 905.0 -587.6 260.7 848.3 -608.7 259.3 868.0Azerbaijan -58.4 11.2 69.6 -126.1 11.6 137.7 -157.7 13.4 171.1
Bahamas 170.6 198.2 27.6 152.1 192.8 40.8 164.0 191.6 27.6Bahrain -32.9 46.2 79.1 -42.5 39.9 82.5 10.8 44.6 33.8Bangladesh -240.7 27.9 268.6 -236.4 31.3 267.7 -239.8 41.8 281.6Barbados 30.8 33.3 2.5 31.1 34.8 3.7 34.2 37.0 2.8Belarus -80.6 10.2 90.8 -95.1 3.4 98.4 -124.4 5.9 130.3Belgium 705.9 1,963.9 1,258.0 843.0 2,211.5 1,368.5 612.4 2,205.6 1,593.2Belize 17.5 21.9 4.5 17.1 20.5 3.4 -3.9 16.8 20.7Benin 17.3 17.5 0.2 18.1 18.2 (-) 24.2 24.3 (-)Bermuda 34.6 35.5 0.9 54.8 56.9 2.1 41.9 47.3 5.3Bhutan 1.6 1.7 (-) (-) 0.1 0.1 1.6 1.6 (-)Bolivia -0.7 18.4 19.2 -24.8 14.4 39.3 8.6 25.0 16.3Bosnia-Hercegovina -0.7 1.0 1.7 0.8 2.8 2.0 -0.9 0.8 1.7Botswana -4.2 8.1 12.3 -14.4 3.5 17.9 -15.5 2.0 17.5Brazil -350.1 1,845.0 2,195.1 -204.6 1,833.2 2,037.8 -335.6 1,867.8 2,203.4British Indian Ocean Territories (-) (-) (-) (-) (-) (-) 0.1 0.1 (-)British Virgin Islands 9.6 13.9 4.3 0.8 19.2 18.4 3.0 12.2 9.2Brunei -0.5 18.0 18.6 -29.8 8.8 38.7 -28.4 6.7 35.1Bulgaria -10.8 12.5 23.3 -5.2 24.5 29.7 6.5 29.3 22.8Burkina 3.1 3.1 (-) 4.3 4.5 0.2 4.2 4.2 (-)Burma (Myanmar) 2.6 2.6 (-) 1.0 1.0 (-) 0.4 0.4 (-)Burundi 0.1 0.1 (-) 1.1 1.2 (-) 1.5 1.6 0.1
Cambodia -158.8 12.2 171.1 -152.6 11.5 164.1 -185.2 10.4 195.6Cameroon -1.2 3.4 4.6 -7.8 19.9 27.8 1.9 12.6 10.7Canada -5,864.1 20,219.8 26,083.9 -5,127.5 21,792.6 26,920.1 -6,069.9 21,767.5 27,837.4Cape Verde (-) 0.1 (-) 0.3 0.4 0.1 -0.3 0.4 0.7Cayman Islands 65.7 67.1 1.5 54.9 56.6 1.7 46.9 49.5 2.6Central African Republic 0.9 1.0 0.1 0.8 1.1 0.3 1.5 1.5 (-)Chad -161.2 4.0 165.2 -119.2 7.1 126.3 -194.7 8.8 203.5Chile -228.2 604.4 832.7 -24.5 775.6 800.0 170.3 724.8 554.4China -19,483.6 4,758.0 24,241.5 -20,052.3 5,238.3 25,290.6 -21,160.1 5,910.9 27,071.0Christmas Island -1.0 0.1 1.1 0.5 0.7 0.2 -0.2 0.1 0.3Cocos (Keeling) Island (-) (-) (-) (-) 0.1 0.1 (-) 0.2 0.2Colombia 8.2 603.0 594.8 -54.4 652.0 706.4 -28.6 703.4 732.0Comoros (-) (-) (-) (-) (-) (-) -0.1 (-) 0.1Congo (Brazzaville) -276.5 11.9 288.3 -337.4 9.2 346.6 -230.6 10.9 241.5Congo (Kinshasa) -33.5 1.5 35.1 -6.8 5.7 12.4 -8.6 5.7 14.3Cook Islands (-) (-) 0.1 -0.3 (-) 0.3 0.1 0.2 0.1Costa Rica -3.0 321.9 324.9 -27.1 356.2 383.3 -14.2 344.9 359.1Cote d'Ivoire -41.7 13.6 55.3 -60.0 14.9 74.9 8.1 16.4 8.3Croatia -4.9 22.9 27.8 -19.6 10.8 30.4 -3.1 21.9 25.0Cuba 49.1 49.1 (-) 29.0 29.0 (-) 28.8 28.8 (-)Cyprus 57.4 58.5 1.1 15.9 17.8 1.8 6.7 8.3 1.6Czech Republic -106.8 107.6 214.3 -26.3 172.0 198.3 -112.8 94.5 207.3
Denmark -230.3 244.7 475.0 -164.0 305.0 469.0 -215.5 206.0 421.4Djibouti 0.5 1.5 1.1 3.3 3.6 0.3 1.6 2.0 0.3Dominica 5.8 5.9 0.2 8.9 9.2 0.3 6.2 6.3 0.1
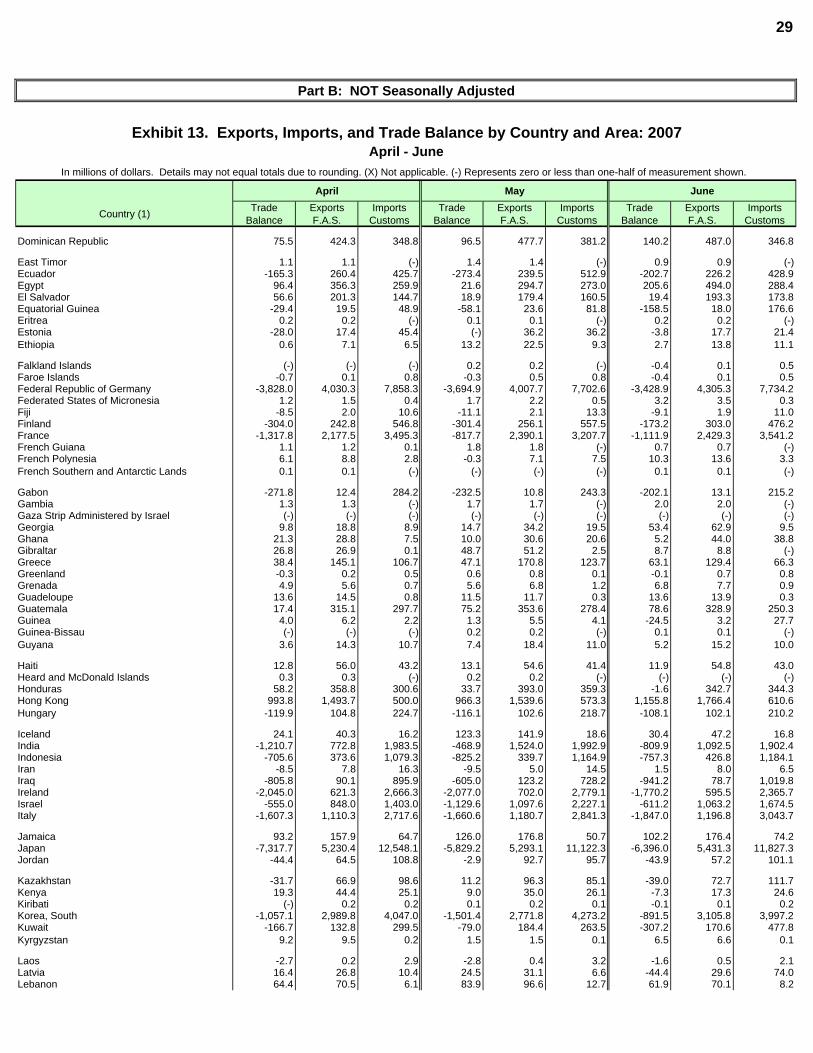
29
Part B: NOT Seasonally Adjusted
Exhibit 13. Exports, Imports, and Trade Balance by Country and Area: 2007April - June
In millions of dollars. Details may not equal totals due to rounding. (X) Not applicable. (-) Represents zero or less than one-half of measurement shown.
April May June
Country (1) Trade Balance
Exports F.A.S.
Imports Customs
Trade Balance
Exports F.A.S.
Imports Customs
Trade Balance
Exports F.A.S.
Imports Customs
Dominican Republic 75.5 424.3 348.8 96.5 477.7 381.2 140.2 487.0 346.8
East Timor 1.1 1.1 (-) 1.4 1.4 (-) 0.9 0.9 (-)Ecuador -165.3 260.4 425.7 -273.4 239.5 512.9 -202.7 226.2 428.9Egypt 96.4 356.3 259.9 21.6 294.7 273.0 205.6 494.0 288.4El Salvador 56.6 201.3 144.7 18.9 179.4 160.5 19.4 193.3 173.8Equatorial Guinea -29.4 19.5 48.9 -58.1 23.6 81.8 -158.5 18.0 176.6Eritrea 0.2 0.2 (-) 0.1 0.1 (-) 0.2 0.2 (-)Estonia -28.0 17.4 45.4 (-) 36.2 36.2 -3.8 17.7 21.4Ethiopia 0.6 7.1 6.5 13.2 22.5 9.3 2.7 13.8 11.1
Falkland Islands (-) (-) (-) 0.2 0.2 (-) -0.4 0.1 0.5Faroe Islands -0.7 0.1 0.8 -0.3 0.5 0.8 -0.4 0.1 0.5Federal Republic of Germany -3,828.0 4,030.3 7,858.3 -3,694.9 4,007.7 7,702.6 -3,428.9 4,305.3 7,734.2Federated States of Micronesia 1.2 1.5 0.4 1.7 2.2 0.5 3.2 3.5 0.3Fiji -8.5 2.0 10.6 -11.1 2.1 13.3 -9.1 1.9 11.0Finland -304.0 242.8 546.8 -301.4 256.1 557.5 -173.2 303.0 476.2France -1,317.8 2,177.5 3,495.3 -817.7 2,390.1 3,207.7 -1,111.9 2,429.3 3,541.2French Guiana 1.1 1.2 0.1 1.8 1.8 (-) 0.7 0.7 (-)French Polynesia 6.1 8.8 2.8 -0.3 7.1 7.5 10.3 13.6 3.3French Southern and Antarctic Lands 0.1 0.1 (-) (-) (-) (-) 0.1 0.1 (-)
Gabon -271.8 12.4 284.2 -232.5 10.8 243.3 -202.1 13.1 215.2Gambia 1.3 1.3 (-) 1.7 1.7 (-) 2.0 2.0 (-)Gaza Strip Administered by Israel (-) (-) (-) (-) (-) (-) (-) (-) (-)Georgia 9.8 18.8 8.9 14.7 34.2 19.5 53.4 62.9 9.5Ghana 21.3 28.8 7.5 10.0 30.6 20.6 5.2 44.0 38.8Gibraltar 26.8 26.9 0.1 48.7 51.2 2.5 8.7 8.8 (-)Greece 38.4 145.1 106.7 47.1 170.8 123.7 63.1 129.4 66.3Greenland -0.3 0.2 0.5 0.6 0.8 0.1 -0.1 0.7 0.8Grenada 4.9 5.6 0.7 5.6 6.8 1.2 6.8 7.7 0.9Guadeloupe 13.6 14.5 0.8 11.5 11.7 0.3 13.6 13.9 0.3Guatemala 17.4 315.1 297.7 75.2 353.6 278.4 78.6 328.9 250.3Guinea 4.0 6.2 2.2 1.3 5.5 4.1 -24.5 3.2 27.7Guinea-Bissau (-) (-) (-) 0.2 0.2 (-) 0.1 0.1 (-)Guyana 3.6 14.3 10.7 7.4 18.4 11.0 5.2 15.2 10.0
Haiti 12.8 56.0 43.2 13.1 54.6 41.4 11.9 54.8 43.0Heard and McDonald Islands 0.3 0.3 (-) 0.2 0.2 (-) (-) (-) (-)Honduras 58.2 358.8 300.6 33.7 393.0 359.3 -1.6 342.7 344.3Hong Kong 993.8 1,493.7 500.0 966.3 1,539.6 573.3 1,155.8 1,766.4 610.6Hungary -119.9 104.8 224.7 -116.1 102.6 218.7 -108.1 102.1 210.2
Iceland 24.1 40.3 16.2 123.3 141.9 18.6 30.4 47.2 16.8India -1,210.7 772.8 1,983.5 -468.9 1,524.0 1,992.9 -809.9 1,092.5 1,902.4Indonesia -705.6 373.6 1,079.3 -825.2 339.7 1,164.9 -757.3 426.8 1,184.1Iran -8.5 7.8 16.3 -9.5 5.0 14.5 1.5 8.0 6.5Iraq -805.8 90.1 895.9 -605.0 123.2 728.2 -941.2 78.7 1,019.8Ireland -2,045.0 621.3 2,666.3 -2,077.0 702.0 2,779.1 -1,770.2 595.5 2,365.7Israel -555.0 848.0 1,403.0 -1,129.6 1,097.6 2,227.1 -611.2 1,063.2 1,674.5Italy -1,607.3 1,110.3 2,717.6 -1,660.6 1,180.7 2,841.3 -1,847.0 1,196.8 3,043.7
Jamaica 93.2 157.9 64.7 126.0 176.8 50.7 102.2 176.4 74.2Japan -7,317.7 5,230.4 12,548.1 -5,829.2 5,293.1 11,122.3 -6,396.0 5,431.3 11,827.3Jordan -44.4 64.5 108.8 -2.9 92.7 95.7 -43.9 57.2 101.1
Kazakhstan -31.7 66.9 98.6 11.2 96.3 85.1 -39.0 72.7 111.7Kenya 19.3 44.4 25.1 9.0 35.0 26.1 -7.3 17.3 24.6Kiribati (-) 0.2 0.2 0.1 0.2 0.1 -0.1 0.1 0.2Korea, South -1,057.1 2,989.8 4,047.0 -1,501.4 2,771.8 4,273.2 -891.5 3,105.8 3,997.2Kuwait -166.7 132.8 299.5 -79.0 184.4 263.5 -307.2 170.6 477.8Kyrgyzstan 9.2 9.5 0.2 1.5 1.5 0.1 6.5 6.6 0.1
Laos -2.7 0.2 2.9 -2.8 0.4 3.2 -1.6 0.5 2.1Latvia 16.4 26.8 10.4 24.5 31.1 6.6 -44.4 29.6 74.0Lebanon 64.4 70.5 6.1 83.9 96.6 12.7 61.9 70.1 8.2
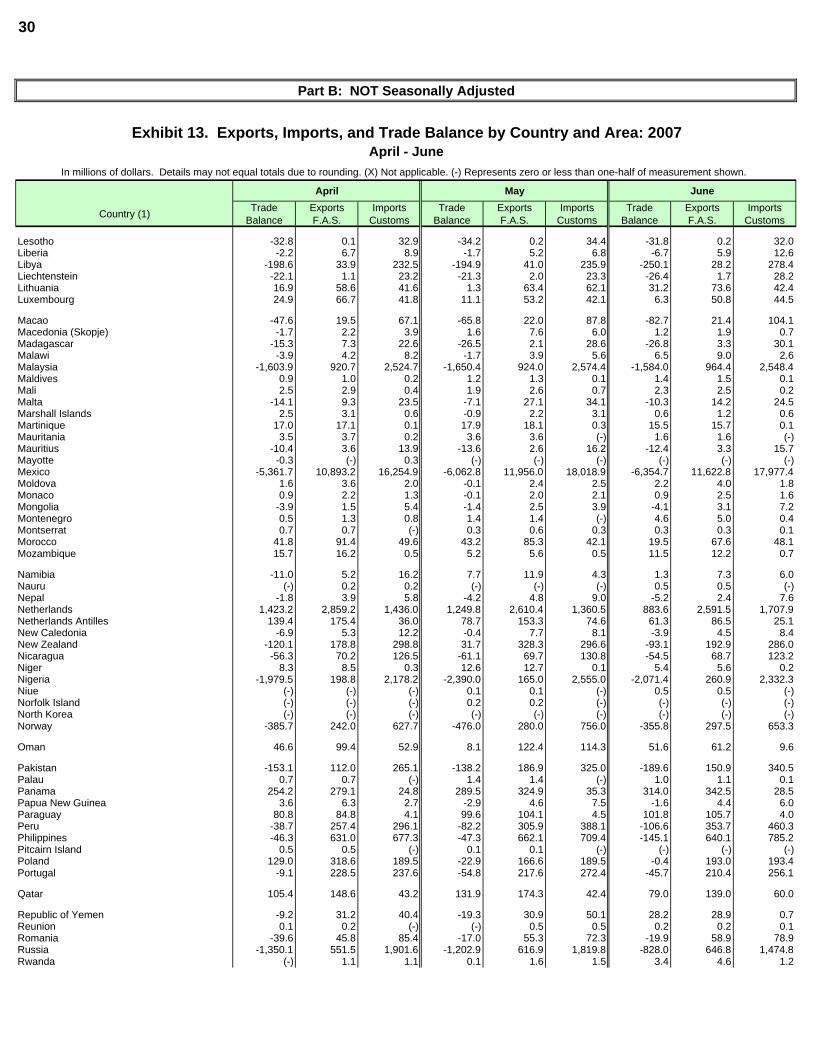
30
Part B: NOT Seasonally Adjusted
Exhibit 13. Exports, Imports, and Trade Balance by Country and Area: 2007April - June
In millions of dollars. Details may not equal totals due to rounding. (X) Not applicable. (-) Represents zero or less than one-half of measurement shown.
April May June
Country (1) Trade Balance
Exports F.A.S.
Imports Customs
Trade Balance
Exports F.A.S.
Imports Customs
Trade Balance
Exports F.A.S.
Imports Customs
Lesotho -32.8 0.1 32.9 -34.2 0.2 34.4 -31.8 0.2 32.0Liberia -2.2 6.7 8.9 -1.7 5.2 6.8 -6.7 5.9 12.6Libya -198.6 33.9 232.5 -194.9 41.0 235.9 -250.1 28.2 278.4Liechtenstein -22.1 1.1 23.2 -21.3 2.0 23.3 -26.4 1.7 28.2Lithuania 16.9 58.6 41.6 1.3 63.4 62.1 31.2 73.6 42.4Luxembourg 24.9 66.7 41.8 11.1 53.2 42.1 6.3 50.8 44.5
Macao -47.6 19.5 67.1 -65.8 22.0 87.8 -82.7 21.4 104.1Macedonia (Skopje) -1.7 2.2 3.9 1.6 7.6 6.0 1.2 1.9 0.7Madagascar -15.3 7.3 22.6 -26.5 2.1 28.6 -26.8 3.3 30.1Malawi -3.9 4.2 8.2 -1.7 3.9 5.6 6.5 9.0 2.6Malaysia -1,603.9 920.7 2,524.7 -1,650.4 924.0 2,574.4 -1,584.0 964.4 2,548.4Maldives 0.9 1.0 0.2 1.2 1.3 0.1 1.4 1.5 0.1Mali 2.5 2.9 0.4 1.9 2.6 0.7 2.3 2.5 0.2Malta -14.1 9.3 23.5 -7.1 27.1 34.1 -10.3 14.2 24.5Marshall Islands 2.5 3.1 0.6 -0.9 2.2 3.1 0.6 1.2 0.6Martinique 17.0 17.1 0.1 17.9 18.1 0.3 15.5 15.7 0.1Mauritania 3.5 3.7 0.2 3.6 3.6 (-) 1.6 1.6 (-)Mauritius -10.4 3.6 13.9 -13.6 2.6 16.2 -12.4 3.3 15.7Mayotte -0.3 (-) 0.3 (-) (-) (-) (-) (-) (-)Mexico -5,361.7 10,893.2 16,254.9 -6,062.8 11,956.0 18,018.9 -6,354.7 11,622.8 17,977.4Moldova 1.6 3.6 2.0 -0.1 2.4 2.5 2.2 4.0 1.8Monaco 0.9 2.2 1.3 -0.1 2.0 2.1 0.9 2.5 1.6Mongolia -3.9 1.5 5.4 -1.4 2.5 3.9 -4.1 3.1 7.2Montenegro 0.5 1.3 0.8 1.4 1.4 (-) 4.6 5.0 0.4Montserrat 0.7 0.7 (-) 0.3 0.6 0.3 0.3 0.3 0.1Morocco 41.8 91.4 49.6 43.2 85.3 42.1 19.5 67.6 48.1Mozambique 15.7 16.2 0.5 5.2 5.6 0.5 11.5 12.2 0.7
Namibia -11.0 5.2 16.2 7.7 11.9 4.3 1.3 7.3 6.0Nauru (-) 0.2 0.2 (-) (-) (-) 0.5 0.5 (-)Nepal -1.8 3.9 5.8 -4.2 4.8 9.0 -5.2 2.4 7.6Netherlands 1,423.2 2,859.2 1,436.0 1,249.8 2,610.4 1,360.5 883.6 2,591.5 1,707.9Netherlands Antilles 139.4 175.4 36.0 78.7 153.3 74.6 61.3 86.5 25.1New Caledonia -6.9 5.3 12.2 -0.4 7.7 8.1 -3.9 4.5 8.4New Zealand -120.1 178.8 298.8 31.7 328.3 296.6 -93.1 192.9 286.0Nicaragua -56.3 70.2 126.5 -61.1 69.7 130.8 -54.5 68.7 123.2Niger 8.3 8.5 0.3 12.6 12.7 0.1 5.4 5.6 0.2Nigeria -1,979.5 198.8 2,178.2 -2,390.0 165.0 2,555.0 -2,071.4 260.9 2,332.3Niue (-) (-) (-) 0.1 0.1 (-) 0.5 0.5 (-)Norfolk Island (-) (-) (-) 0.2 0.2 (-) (-) (-) (-)North Korea (-) (-) (-) (-) (-) (-) (-) (-) (-)Norway -385.7 242.0 627.7 -476.0 280.0 756.0 -355.8 297.5 653.3
Oman 46.6 99.4 52.9 8.1 122.4 114.3 51.6 61.2 9.6
Pakistan -153.1 112.0 265.1 -138.2 186.9 325.0 -189.6 150.9 340.5Palau 0.7 0.7 (-) 1.4 1.4 (-) 1.0 1.1 0.1Panama 254.2 279.1 24.8 289.5 324.9 35.3 314.0 342.5 28.5Papua New Guinea 3.6 6.3 2.7 -2.9 4.6 7.5 -1.6 4.4 6.0Paraguay 80.8 84.8 4.1 99.6 104.1 4.5 101.8 105.7 4.0Peru -38.7 257.4 296.1 -82.2 305.9 388.1 -106.6 353.7 460.3Philippines -46.3 631.0 677.3 -47.3 662.1 709.4 -145.1 640.1 785.2Pitcairn Island 0.5 0.5 (-) 0.1 0.1 (-) (-) (-) (-)Poland 129.0 318.6 189.5 -22.9 166.6 189.5 -0.4 193.0 193.4Portugal -9.1 228.5 237.6 -54.8 217.6 272.4 -45.7 210.4 256.1
Qatar 105.4 148.6 43.2 131.9 174.3 42.4 79.0 139.0 60.0
Republic of Yemen -9.2 31.2 40.4 -19.3 30.9 50.1 28.2 28.9 0.7Reunion 0.1 0.2 (-) (-) 0.5 0.5 0.2 0.2 0.1Romania -39.6 45.8 85.4 -17.0 55.3 72.3 -19.9 58.9 78.9Russia -1,350.1 551.5 1,901.6 -1,202.9 616.9 1,819.8 -828.0 646.8 1,474.8Rwanda (-) 1.1 1.1 0.1 1.6 1.5 3.4 4.6 1.2
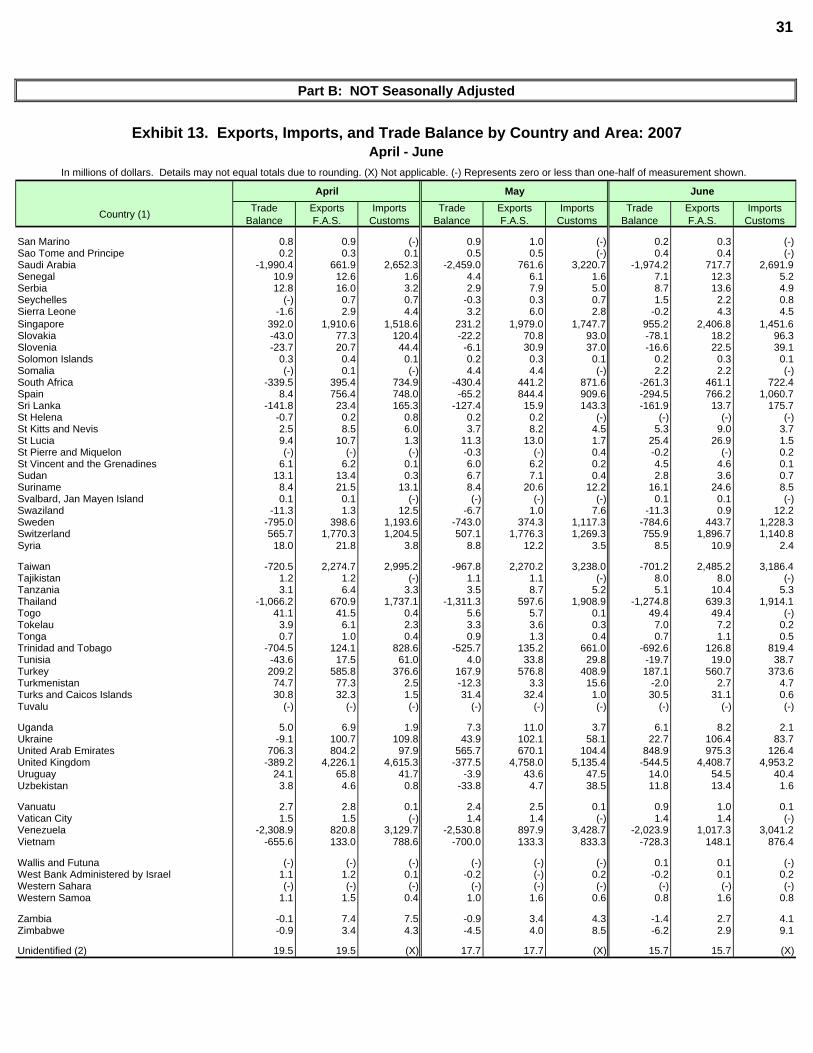
31
Part B: NOT Seasonally Adjusted
Exhibit 13. Exports, Imports, and Trade Balance by Country and Area: 2007April - June
In millions of dollars. Details may not equal totals due to rounding. (X) Not applicable. (-) Represents zero or less than one-half of measurement shown.
April May June
Country (1) Trade Balance
Exports F.A.S.
Imports Customs
Trade Balance
Exports F.A.S.
Imports Customs
Trade Balance
Exports F.A.S.
Imports Customs
San Marino 0.8 0.9 (-) 0.9 1.0 (-) 0.2 0.3 (-)Sao Tome and Principe 0.2 0.3 0.1 0.5 0.5 (-) 0.4 0.4 (-)Saudi Arabia -1,990.4 661.9 2,652.3 -2,459.0 761.6 3,220.7 -1,974.2 717.7 2,691.9Senegal 10.9 12.6 1.6 4.4 6.1 1.6 7.1 12.3 5.2Serbia 12.8 16.0 3.2 2.9 7.9 5.0 8.7 13.6 4.9Seychelles (-) 0.7 0.7 -0.3 0.3 0.7 1.5 2.2 0.8Sierra Leone -1.6 2.9 4.4 3.2 6.0 2.8 -0.2 4.3 4.5Singapore 392.0 1,910.6 1,518.6 231.2 1,979.0 1,747.7 955.2 2,406.8 1,451.6Slovakia -43.0 77.3 120.4 -22.2 70.8 93.0 -78.1 18.2 96.3Slovenia -23.7 20.7 44.4 -6.1 30.9 37.0 -16.6 22.5 39.1Solomon Islands 0.3 0.4 0.1 0.2 0.3 0.1 0.2 0.3 0.1Somalia (-) 0.1 (-) 4.4 4.4 (-) 2.2 2.2 (-)South Africa -339.5 395.4 734.9 -430.4 441.2 871.6 -261.3 461.1 722.4Spain 8.4 756.4 748.0 -65.2 844.4 909.6 -294.5 766.2 1,060.7Sri Lanka -141.8 23.4 165.3 -127.4 15.9 143.3 -161.9 13.7 175.7St Helena -0.7 0.2 0.8 0.2 0.2 (-) (-) (-) (-)St Kitts and Nevis 2.5 8.5 6.0 3.7 8.2 4.5 5.3 9.0 3.7St Lucia 9.4 10.7 1.3 11.3 13.0 1.7 25.4 26.9 1.5St Pierre and Miquelon (-) (-) (-) -0.3 (-) 0.4 -0.2 (-) 0.2St Vincent and the Grenadines 6.1 6.2 0.1 6.0 6.2 0.2 4.5 4.6 0.1Sudan 13.1 13.4 0.3 6.7 7.1 0.4 2.8 3.6 0.7Suriname 8.4 21.5 13.1 8.4 20.6 12.2 16.1 24.6 8.5Svalbard, Jan Mayen Island 0.1 0.1 (-) (-) (-) (-) 0.1 0.1 (-)Swaziland -11.3 1.3 12.5 -6.7 1.0 7.6 -11.3 0.9 12.2Sweden -795.0 398.6 1,193.6 -743.0 374.3 1,117.3 -784.6 443.7 1,228.3Switzerland 565.7 1,770.3 1,204.5 507.1 1,776.3 1,269.3 755.9 1,896.7 1,140.8Syria 18.0 21.8 3.8 8.8 12.2 3.5 8.5 10.9 2.4
Taiwan -720.5 2,274.7 2,995.2 -967.8 2,270.2 3,238.0 -701.2 2,485.2 3,186.4Tajikistan 1.2 1.2 (-) 1.1 1.1 (-) 8.0 8.0 (-)Tanzania 3.1 6.4 3.3 3.5 8.7 5.2 5.1 10.4 5.3Thailand -1,066.2 670.9 1,737.1 -1,311.3 597.6 1,908.9 -1,274.8 639.3 1,914.1Togo 41.1 41.5 0.4 5.6 5.7 0.1 49.4 49.4 (-)Tokelau 3.9 6.1 2.3 3.3 3.6 0.3 7.0 7.2 0.2Tonga 0.7 1.0 0.4 0.9 1.3 0.4 0.7 1.1 0.5Trinidad and Tobago -704.5 124.1 828.6 -525.7 135.2 661.0 -692.6 126.8 819.4Tunisia -43.6 17.5 61.0 4.0 33.8 29.8 -19.7 19.0 38.7Turkey 209.2 585.8 376.6 167.9 576.8 408.9 187.1 560.7 373.6Turkmenistan 74.7 77.3 2.5 -12.3 3.3 15.6 -2.0 2.7 4.7Turks and Caicos Islands 30.8 32.3 1.5 31.4 32.4 1.0 30.5 31.1 0.6Tuvalu (-) (-) (-) (-) (-) (-) (-) (-) (-)
Uganda 5.0 6.9 1.9 7.3 11.0 3.7 6.1 8.2 2.1Ukraine -9.1 100.7 109.8 43.9 102.1 58.1 22.7 106.4 83.7United Arab Emirates 706.3 804.2 97.9 565.7 670.1 104.4 848.9 975.3 126.4United Kingdom -389.2 4,226.1 4,615.3 -377.5 4,758.0 5,135.4 -544.5 4,408.7 4,953.2Uruguay 24.1 65.8 41.7 -3.9 43.6 47.5 14.0 54.5 40.4Uzbekistan 3.8 4.6 0.8 -33.8 4.7 38.5 11.8 13.4 1.6
Vanuatu 2.7 2.8 0.1 2.4 2.5 0.1 0.9 1.0 0.1Vatican City 1.5 1.5 (-) 1.4 1.4 (-) 1.4 1.4 (-)Venezuela -2,308.9 820.8 3,129.7 -2,530.8 897.9 3,428.7 -2,023.9 1,017.3 3,041.2Vietnam -655.6 133.0 788.6 -700.0 133.3 833.3 -728.3 148.1 876.4
Wallis and Futuna (-) (-) (-) (-) (-) (-) 0.1 0.1 (-)West Bank Administered by Israel 1.1 1.2 0.1 -0.2 (-) 0.2 -0.2 0.1 0.2Western Sahara (-) (-) (-) (-) (-) (-) (-) (-) (-)Western Samoa 1.1 1.5 0.4 1.0 1.6 0.6 0.8 1.6 0.8
Zambia -0.1 7.4 7.5 -0.9 3.4 4.3 -1.4 2.7 4.1Zimbabwe -0.9 3.4 4.3 -4.5 4.0 8.5 -6.2 2.9 9.1
Unidentified (2) 19.5 19.5 (X) 17.7 17.7 (X) 15.7 15.7 (X)
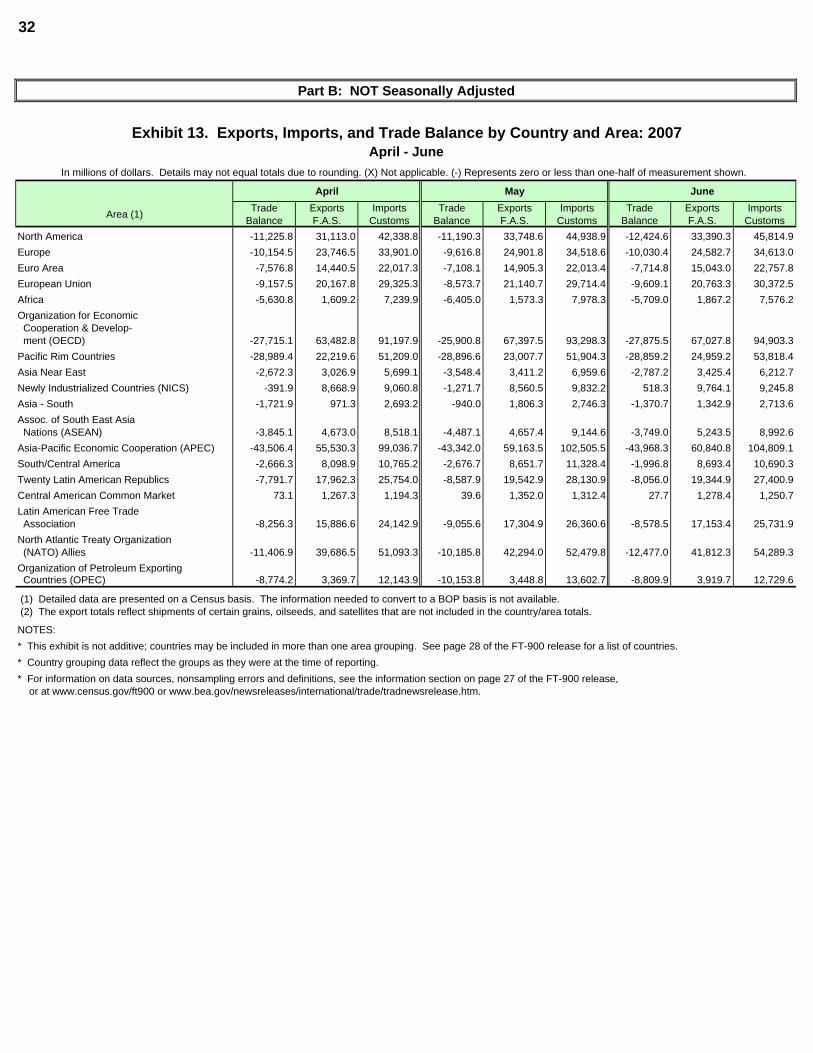
32
Part B: NOT Seasonally Adjusted
Exhibit 13. Exports, Imports, and Trade Balance by Country and Area: 2007April - June
In millions of dollars. Details may not equal totals due to rounding. (X) Not applicable. (-) Represents zero or less than one-half of measurement shown.
April May June
Area (1) Trade Balance
Exports F.A.S.
Imports Customs
Trade Balance
Exports F.A.S.
Imports Customs
Trade Balance
Exports F.A.S.
Imports Customs
North America -11,225.8 31,113.0 42,338.8 -11,190.3 33,748.6 44,938.9 -12,424.6 33,390.3 45,814.9Europe -10,154.5 23,746.5 33,901.0 -9,616.8 24,901.8 34,518.6 -10,030.4 24,582.7 34,613.0Euro Area -7,576.8 14,440.5 22,017.3 -7,108.1 14,905.3 22,013.4 -7,714.8 15,043.0 22,757.8European Union -9,157.5 20,167.8 29,325.3 -8,573.7 21,140.7 29,714.4 -9,609.1 20,763.3 30,372.5Africa -5,630.8 1,609.2 7,239.9 -6,405.0 1,573.3 7,978.3 -5,709.0 1,867.2 7,576.2Organization for Economic Cooperation & Develop- ment (OECD) -27,715.1 63,482.8 91,197.9 -25,900.8 67,397.5 93,298.3 -27,875.5 67,027.8 94,903.3Pacific Rim Countries -28,989.4 22,219.6 51,209.0 -28,896.6 23,007.7 51,904.3 -28,859.2 24,959.2 53,818.4Asia Near East -2,672.3 3,026.9 5,699.1 -3,548.4 3,411.2 6,959.6 -2,787.2 3,425.4 6,212.7Newly Industrialized Countries (NICS) -391.9 8,668.9 9,060.8 -1,271.7 8,560.5 9,832.2 518.3 9,764.1 9,245.8Asia - South -1,721.9 971.3 2,693.2 -940.0 1,806.3 2,746.3 -1,370.7 1,342.9 2,713.6Assoc. of South East Asia Nations (ASEAN) -3,845.1 4,673.0 8,518.1 -4,487.1 4,657.4 9,144.6 -3,749.0 5,243.5 8,992.6Asia-Pacific Economic Cooperation (APEC) -43,506.4 55,530.3 99,036.7 -43,342.0 59,163.5 102,505.5 -43,968.3 60,840.8 104,809.1South/Central America -2,666.3 8,098.9 10,765.2 -2,676.7 8,651.7 11,328.4 -1,996.8 8,693.4 10,690.3Twenty Latin American Republics -7,791.7 17,962.3 25,754.0 -8,587.9 19,542.9 28,130.9 -8,056.0 19,344.9 27,400.9Central American Common Market 73.1 1,267.3 1,194.3 39.6 1,352.0 1,312.4 27.7 1,278.4 1,250.7Latin American Free Trade Association -8,256.3 15,886.6 24,142.9 -9,055.6 17,304.9 26,360.6 -8,578.5 17,153.4 25,731.9North Atlantic Treaty Organization (NATO) Allies -11,406.9 39,686.5 51,093.3 -10,185.8 42,294.0 52,479.8 -12,477.0 41,812.3 54,289.3Organization of Petroleum Exporting Countries (OPEC) -8,774.2 3,369.7 12,143.9 -10,153.8 3,448.8 13,602.7 -8,809.9 3,919.7 12,729.6
(1) Detailed data are presented on a Census basis. The information needed to convert to a BOP basis is not available. (2) The export totals reflect shipments of certain grains, oilseeds, and satellites that are not included in the country/area totals.
NOTES:* This exhibit is not additive; countries may be included in more than one area grouping. See page 28 of the FT-900 release for a list of countries.* Country grouping data reflect the groups as they were at the time of reporting. * For information on data sources, nonsampling errors and definitions, see the information section on page 27 of the FT-900 release,
or at www.census.gov/ft900 or www.bea.gov/newsreleases/international/trade/tradnewsrelease.htm.
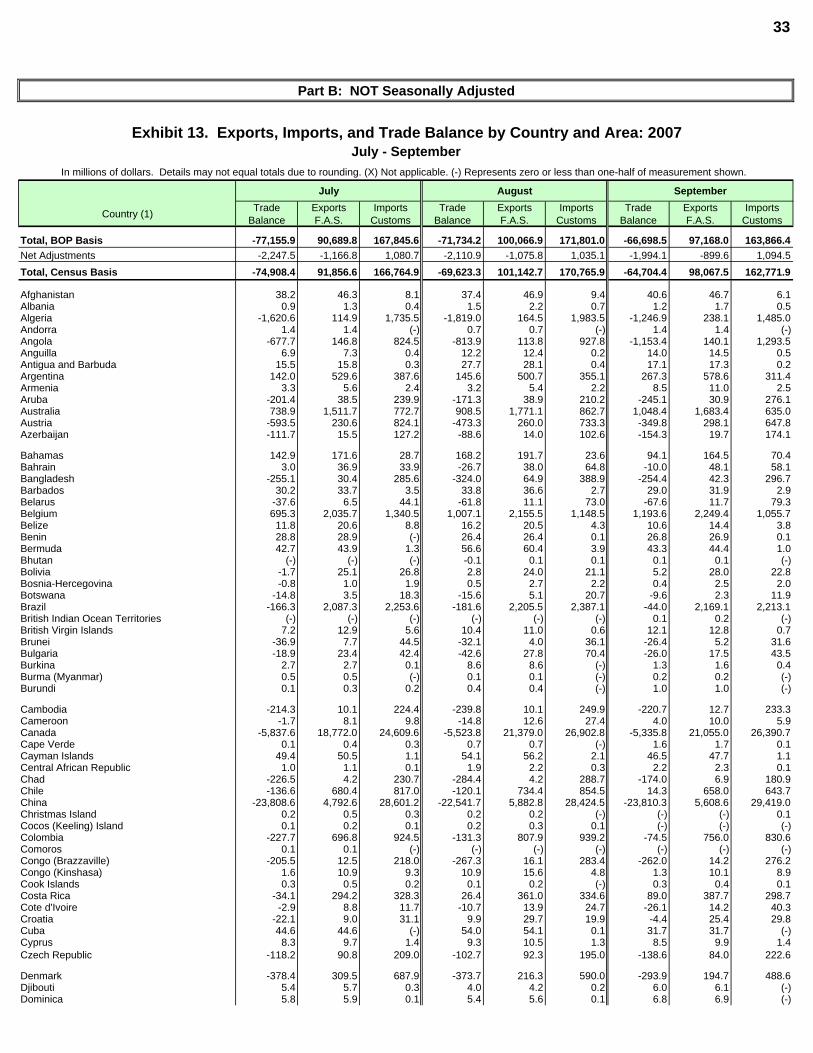
33
Part B: NOT Seasonally Adjusted
Exhibit 13. Exports, Imports, and Trade Balance by Country and Area: 2007July - September
In millions of dollars. Details may not equal totals due to rounding. (X) Not applicable. (-) Represents zero or less than one-half of measurement shown.
July August September
Country (1) Trade Balance
Exports F.A.S.
Imports Customs
Trade Balance
Exports F.A.S.
Imports Customs
Trade Balance
Exports F.A.S.
Imports Customs
Total, BOP Basis -77,155.9 90,689.8 167,845.6 -71,734.2 100,066.9 171,801.0 -66,698.5 97,168.0 163,866.4Net Adjustments -2,247.5 -1,166.8 1,080.7 -2,110.9 -1,075.8 1,035.1 -1,994.1 -899.6 1,094.5Total, Census Basis -74,908.4 91,856.6 166,764.9 -69,623.3 101,142.7 170,765.9 -64,704.4 98,067.5 162,771.9
Afghanistan 38.2 46.3 8.1 37.4 46.9 9.4 40.6 46.7 6.1Albania 0.9 1.3 0.4 1.5 2.2 0.7 1.2 1.7 0.5Algeria -1,620.6 114.9 1,735.5 -1,819.0 164.5 1,983.5 -1,246.9 238.1 1,485.0Andorra 1.4 1.4 (-) 0.7 0.7 (-) 1.4 1.4 (-)Angola -677.7 146.8 824.5 -813.9 113.8 927.8 -1,153.4 140.1 1,293.5Anguilla 6.9 7.3 0.4 12.2 12.4 0.2 14.0 14.5 0.5Antigua and Barbuda 15.5 15.8 0.3 27.7 28.1 0.4 17.1 17.3 0.2Argentina 142.0 529.6 387.6 145.6 500.7 355.1 267.3 578.6 311.4Armenia 3.3 5.6 2.4 3.2 5.4 2.2 8.5 11.0 2.5Aruba -201.4 38.5 239.9 -171.3 38.9 210.2 -245.1 30.9 276.1Australia 738.9 1,511.7 772.7 908.5 1,771.1 862.7 1,048.4 1,683.4 635.0Austria -593.5 230.6 824.1 -473.3 260.0 733.3 -349.8 298.1 647.8Azerbaijan -111.7 15.5 127.2 -88.6 14.0 102.6 -154.3 19.7 174.1
Bahamas 142.9 171.6 28.7 168.2 191.7 23.6 94.1 164.5 70.4Bahrain 3.0 36.9 33.9 -26.7 38.0 64.8 -10.0 48.1 58.1Bangladesh -255.1 30.4 285.6 -324.0 64.9 388.9 -254.4 42.3 296.7Barbados 30.2 33.7 3.5 33.8 36.6 2.7 29.0 31.9 2.9Belarus -37.6 6.5 44.1 -61.8 11.1 73.0 -67.6 11.7 79.3Belgium 695.3 2,035.7 1,340.5 1,007.1 2,155.5 1,148.5 1,193.6 2,249.4 1,055.7Belize 11.8 20.6 8.8 16.2 20.5 4.3 10.6 14.4 3.8Benin 28.8 28.9 (-) 26.4 26.4 0.1 26.8 26.9 0.1Bermuda 42.7 43.9 1.3 56.6 60.4 3.9 43.3 44.4 1.0Bhutan (-) (-) (-) -0.1 0.1 0.1 0.1 0.1 (-)Bolivia -1.7 25.1 26.8 2.8 24.0 21.1 5.2 28.0 22.8Bosnia-Hercegovina -0.8 1.0 1.9 0.5 2.7 2.2 0.4 2.5 2.0Botswana -14.8 3.5 18.3 -15.6 5.1 20.7 -9.6 2.3 11.9Brazil -166.3 2,087.3 2,253.6 -181.6 2,205.5 2,387.1 -44.0 2,169.1 2,213.1British Indian Ocean Territories (-) (-) (-) (-) (-) (-) 0.1 0.2 (-)British Virgin Islands 7.2 12.9 5.6 10.4 11.0 0.6 12.1 12.8 0.7Brunei -36.9 7.7 44.5 -32.1 4.0 36.1 -26.4 5.2 31.6Bulgaria -18.9 23.4 42.4 -42.6 27.8 70.4 -26.0 17.5 43.5Burkina 2.7 2.7 0.1 8.6 8.6 (-) 1.3 1.6 0.4Burma (Myanmar) 0.5 0.5 (-) 0.1 0.1 (-) 0.2 0.2 (-)Burundi 0.1 0.3 0.2 0.4 0.4 (-) 1.0 1.0 (-)
Cambodia -214.3 10.1 224.4 -239.8 10.1 249.9 -220.7 12.7 233.3Cameroon -1.7 8.1 9.8 -14.8 12.6 27.4 4.0 10.0 5.9Canada -5,837.6 18,772.0 24,609.6 -5,523.8 21,379.0 26,902.8 -5,335.8 21,055.0 26,390.7Cape Verde 0.1 0.4 0.3 0.7 0.7 (-) 1.6 1.7 0.1Cayman Islands 49.4 50.5 1.1 54.1 56.2 2.1 46.5 47.7 1.1Central African Republic 1.0 1.1 0.1 1.9 2.2 0.3 2.2 2.3 0.1Chad -226.5 4.2 230.7 -284.4 4.2 288.7 -174.0 6.9 180.9Chile -136.6 680.4 817.0 -120.1 734.4 854.5 14.3 658.0 643.7China -23,808.6 4,792.6 28,601.2 -22,541.7 5,882.8 28,424.5 -23,810.3 5,608.6 29,419.0Christmas Island 0.2 0.5 0.3 0.2 0.2 (-) (-) (-) 0.1Cocos (Keeling) Island 0.1 0.2 0.1 0.2 0.3 0.1 (-) (-) (-)Colombia -227.7 696.8 924.5 -131.3 807.9 939.2 -74.5 756.0 830.6Comoros 0.1 0.1 (-) (-) (-) (-) (-) (-) (-)Congo (Brazzaville) -205.5 12.5 218.0 -267.3 16.1 283.4 -262.0 14.2 276.2Congo (Kinshasa) 1.6 10.9 9.3 10.9 15.6 4.8 1.3 10.1 8.9Cook Islands 0.3 0.5 0.2 0.1 0.2 (-) 0.3 0.4 0.1Costa Rica -34.1 294.2 328.3 26.4 361.0 334.6 89.0 387.7 298.7Cote d'Ivoire -2.9 8.8 11.7 -10.7 13.9 24.7 -26.1 14.2 40.3Croatia -22.1 9.0 31.1 9.9 29.7 19.9 -4.4 25.4 29.8Cuba 44.6 44.6 (-) 54.0 54.1 0.1 31.7 31.7 (-)Cyprus 8.3 9.7 1.4 9.3 10.5 1.3 8.5 9.9 1.4Czech Republic -118.2 90.8 209.0 -102.7 92.3 195.0 -138.6 84.0 222.6
Denmark -378.4 309.5 687.9 -373.7 216.3 590.0 -293.9 194.7 488.6Djibouti 5.4 5.7 0.3 4.0 4.2 0.2 6.0 6.1 (-)Dominica 5.8 5.9 0.1 5.4 5.6 0.1 6.8 6.9 (-)

34
Part B: NOT Seasonally Adjusted
Exhibit 13. Exports, Imports, and Trade Balance by Country and Area: 2007July - September
In millions of dollars. Details may not equal totals due to rounding. (X) Not applicable. (-) Represents zero or less than one-half of measurement shown.
July August September
Country (1) Trade Balance
Exports F.A.S.
Imports Customs
Trade Balance
Exports F.A.S.
Imports Customs
Trade Balance
Exports F.A.S.
Imports Customs
Dominican Republic 137.0 499.9 362.8 173.4 564.3 390.9 85.8 436.5 350.8
East Timor 1.5 1.5 (-) 1.6 1.7 (-) 0.9 0.9 (-)Ecuador -300.9 190.5 491.4 -337.0 231.5 568.5 -467.5 205.4 673.0Egypt 124.3 364.3 240.0 403.3 564.8 161.5 382.6 555.8 173.2El Salvador 25.2 217.8 192.7 0.8 206.4 205.6 -17.0 175.3 192.3Equatorial Guinea -296.5 15.1 311.6 -68.3 14.7 83.1 -62.3 18.8 81.1Eritrea 1.6 1.6 (-) 2.4 2.4 (-) 0.2 0.2 (-)Estonia 8.4 19.2 10.8 -1.0 28.5 29.5 -16.2 19.8 36.0Ethiopia -2.0 6.8 8.8 3.1 18.7 15.6 -4.1 5.3 9.4
Falkland Islands 0.1 0.1 (-) -2.2 0.1 2.3 -0.1 0.1 0.1Faroe Islands 0.2 0.2 (-) 0.4 0.4 (-) -1.1 0.2 1.3Federal Republic of Germany -4,548.8 3,835.8 8,384.6 -4,155.1 4,325.0 8,480.1 -2,828.4 4,377.0 7,205.4Federated States of Micronesia 7.7 8.3 0.6 3.6 3.9 0.3 2.2 2.5 0.3Fiji -13.9 1.9 15.8 -14.2 2.3 16.4 -15.8 1.7 17.5Finland -142.9 247.3 390.2 -86.9 306.7 393.6 -175.4 237.2 412.7France -1,761.4 2,204.9 3,966.2 -1,387.9 2,049.1 3,436.9 -1,157.6 2,242.6 3,400.2French Guiana 8.0 8.1 (-) 5.2 5.2 (-) 0.7 0.8 (-)French Polynesia 4.2 9.2 5.1 5.9 9.7 3.8 7.2 10.0 2.8French Southern and Antarctic Lands (-) (-) (-) (-) (-) (-) (-) (-) (-)
Gabon -142.1 16.5 158.7 -213.7 13.0 226.6 -52.3 16.7 69.0Gambia 2.1 2.1 0.1 2.1 2.1 (-) 1.5 1.5 (-)Gaza Strip Administered by Israel 0.2 0.2 (-) 2.9 3.0 0.1 0.7 0.8 0.1Georgia 0.9 20.8 19.9 -13.7 19.8 33.4 -8.0 22.1 30.1Ghana 23.0 32.3 9.3 25.1 34.1 9.0 24.1 45.3 21.2Gibraltar 49.4 49.4 (-) 104.7 105.0 0.3 66.4 66.4 (-)Greece -8.9 122.3 131.2 20.7 145.5 124.8 52.5 121.0 68.6Greenland -1.4 0.3 1.7 -0.7 0.2 0.9 -0.7 0.5 1.2Grenada 8.5 9.3 0.8 5.8 6.3 0.5 3.9 4.2 0.3Guadeloupe 9.9 10.0 0.1 10.9 11.4 0.4 14.2 14.6 0.4Guatemala 49.1 321.7 272.6 80.4 345.6 265.2 48.3 283.7 235.3Guinea -4.4 6.0 10.4 -1.3 5.9 7.2 3.9 10.4 6.4Guinea-Bissau 0.3 0.3 (-) 0.6 0.6 (-) (-) (-) (-)Guyana 4.5 14.6 10.1 7.5 18.9 11.4 1.7 11.2 9.4
Haiti 15.3 53.6 38.3 7.7 50.6 42.8 14.3 55.0 40.7Heard and McDonald Islands (-) (-) (-) (-) (-) (-) (-) (-) (-)Honduras 102.0 445.8 343.8 -2.3 367.5 369.8 49.3 361.6 312.3Hong Kong 923.5 1,558.7 635.1 1,056.7 1,657.5 600.8 1,389.4 2,021.8 632.4Hungary -122.0 107.4 229.4 -132.5 106.5 239.0 -102.8 103.3 206.2
Iceland 42.3 56.4 14.2 38.0 51.4 13.4 40.6 56.2 15.6India 574.5 2,354.4 1,779.9 -362.2 1,818.1 2,180.3 -300.7 1,627.4 1,928.1Indonesia -825.8 371.4 1,197.2 -948.0 414.0 1,362.0 -1,028.1 272.6 1,300.7Iran -3.5 7.3 10.9 -2.4 6.6 9.0 8.4 20.9 12.5Iraq -838.1 94.9 933.0 -933.4 135.6 1,069.0 -1,227.8 97.0 1,324.8Ireland -1,795.5 503.5 2,299.0 -1,973.0 556.6 2,529.6 -1,032.2 975.3 2,007.5Israel -472.8 1,347.7 1,820.5 -413.3 1,219.0 1,632.3 -605.3 907.6 1,512.9Italy -2,270.3 1,139.2 3,409.5 -2,113.6 1,034.6 3,148.2 -1,405.3 1,139.6 2,545.0
Jamaica 152.1 218.3 66.2 119.8 182.3 62.5 150.2 176.8 26.6Japan -7,909.6 4,859.0 12,768.6 -6,899.1 5,076.5 11,975.6 -6,141.8 5,262.0 11,403.8Jordan -27.9 86.0 114.0 -8.5 128.1 136.6 -81.1 65.2 146.2
Kazakhstan 1.6 48.0 46.4 18.4 49.9 31.5 -187.3 49.3 236.6Kenya -7.2 25.5 32.7 -9.6 23.0 32.6 5.6 32.8 27.2Kiribati 0.1 0.2 0.1 0.1 0.1 (-) (-) 0.1 0.1Korea, South -1,470.8 2,788.8 4,259.6 -807.8 2,984.2 3,792.0 -935.6 2,581.7 3,517.3Kuwait -105.9 172.0 277.9 -107.6 196.4 304.0 -146.2 221.6 367.8Kyrgyzstan 1.1 1.4 0.2 2.6 2.7 0.1 1.4 1.7 0.2
Laos -1.1 1.0 2.1 -1.3 0.2 1.5 -0.3 0.3 0.6Latvia -25.0 37.1 62.1 -18.7 28.2 46.9 0.7 31.3 30.6Lebanon 50.0 58.0 8.1 37.8 53.6 15.8 81.0 89.4 8.5
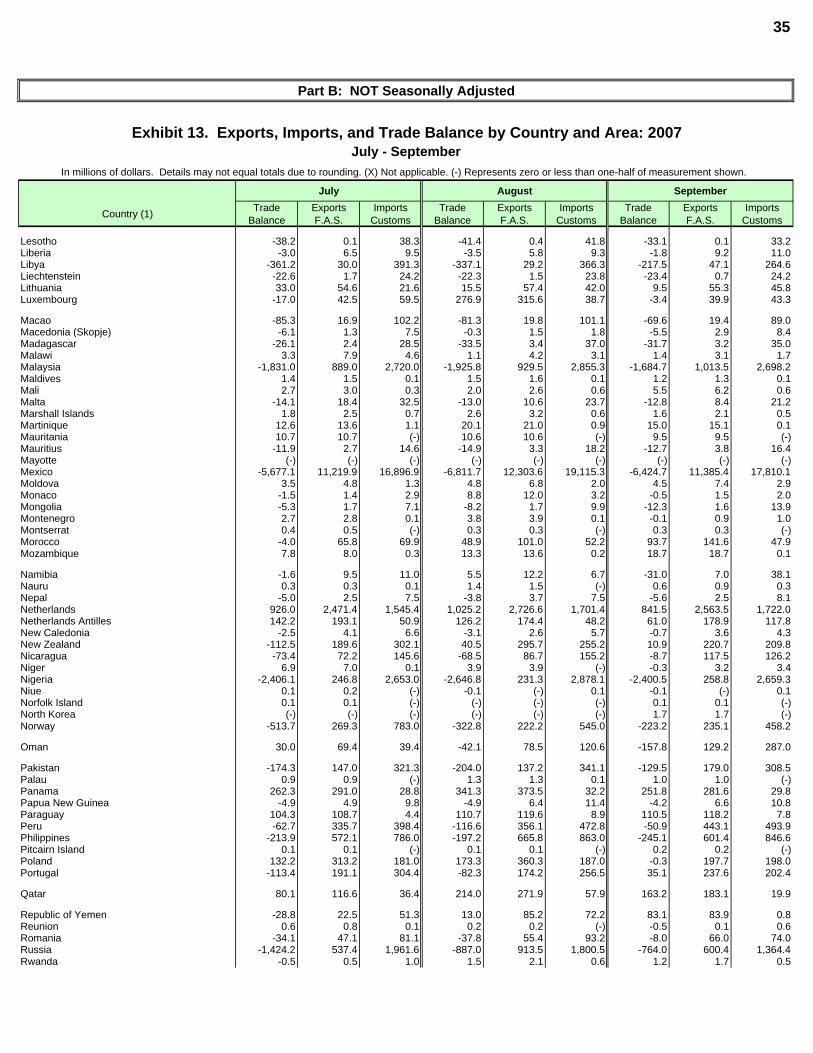
35
Part B: NOT Seasonally Adjusted
Exhibit 13. Exports, Imports, and Trade Balance by Country and Area: 2007July - September
In millions of dollars. Details may not equal totals due to rounding. (X) Not applicable. (-) Represents zero or less than one-half of measurement shown.
July August September
Country (1) Trade Balance
Exports F.A.S.
Imports Customs
Trade Balance
Exports F.A.S.
Imports Customs
Trade Balance
Exports F.A.S.
Imports Customs
Lesotho -38.2 0.1 38.3 -41.4 0.4 41.8 -33.1 0.1 33.2Liberia -3.0 6.5 9.5 -3.5 5.8 9.3 -1.8 9.2 11.0Libya -361.2 30.0 391.3 -337.1 29.2 366.3 -217.5 47.1 264.6Liechtenstein -22.6 1.7 24.2 -22.3 1.5 23.8 -23.4 0.7 24.2Lithuania 33.0 54.6 21.6 15.5 57.4 42.0 9.5 55.3 45.8Luxembourg -17.0 42.5 59.5 276.9 315.6 38.7 -3.4 39.9 43.3
Macao -85.3 16.9 102.2 -81.3 19.8 101.1 -69.6 19.4 89.0Macedonia (Skopje) -6.1 1.3 7.5 -0.3 1.5 1.8 -5.5 2.9 8.4Madagascar -26.1 2.4 28.5 -33.5 3.4 37.0 -31.7 3.2 35.0Malawi 3.3 7.9 4.6 1.1 4.2 3.1 1.4 3.1 1.7Malaysia -1,831.0 889.0 2,720.0 -1,925.8 929.5 2,855.3 -1,684.7 1,013.5 2,698.2Maldives 1.4 1.5 0.1 1.5 1.6 0.1 1.2 1.3 0.1Mali 2.7 3.0 0.3 2.0 2.6 0.6 5.5 6.2 0.6Malta -14.1 18.4 32.5 -13.0 10.6 23.7 -12.8 8.4 21.2Marshall Islands 1.8 2.5 0.7 2.6 3.2 0.6 1.6 2.1 0.5Martinique 12.6 13.6 1.1 20.1 21.0 0.9 15.0 15.1 0.1Mauritania 10.7 10.7 (-) 10.6 10.6 (-) 9.5 9.5 (-)Mauritius -11.9 2.7 14.6 -14.9 3.3 18.2 -12.7 3.8 16.4Mayotte (-) (-) (-) (-) (-) (-) (-) (-) (-)Mexico -5,677.1 11,219.9 16,896.9 -6,811.7 12,303.6 19,115.3 -6,424.7 11,385.4 17,810.1Moldova 3.5 4.8 1.3 4.8 6.8 2.0 4.5 7.4 2.9Monaco -1.5 1.4 2.9 8.8 12.0 3.2 -0.5 1.5 2.0Mongolia -5.3 1.7 7.1 -8.2 1.7 9.9 -12.3 1.6 13.9Montenegro 2.7 2.8 0.1 3.8 3.9 0.1 -0.1 0.9 1.0Montserrat 0.4 0.5 (-) 0.3 0.3 (-) 0.3 0.3 (-)Morocco -4.0 65.8 69.9 48.9 101.0 52.2 93.7 141.6 47.9Mozambique 7.8 8.0 0.3 13.3 13.6 0.2 18.7 18.7 0.1
Namibia -1.6 9.5 11.0 5.5 12.2 6.7 -31.0 7.0 38.1Nauru 0.3 0.3 0.1 1.4 1.5 (-) 0.6 0.9 0.3Nepal -5.0 2.5 7.5 -3.8 3.7 7.5 -5.6 2.5 8.1Netherlands 926.0 2,471.4 1,545.4 1,025.2 2,726.6 1,701.4 841.5 2,563.5 1,722.0Netherlands Antilles 142.2 193.1 50.9 126.2 174.4 48.2 61.0 178.9 117.8New Caledonia -2.5 4.1 6.6 -3.1 2.6 5.7 -0.7 3.6 4.3New Zealand -112.5 189.6 302.1 40.5 295.7 255.2 10.9 220.7 209.8Nicaragua -73.4 72.2 145.6 -68.5 86.7 155.2 -8.7 117.5 126.2Niger 6.9 7.0 0.1 3.9 3.9 (-) -0.3 3.2 3.4Nigeria -2,406.1 246.8 2,653.0 -2,646.8 231.3 2,878.1 -2,400.5 258.8 2,659.3Niue 0.1 0.2 (-) -0.1 (-) 0.1 -0.1 (-) 0.1Norfolk Island 0.1 0.1 (-) (-) (-) (-) 0.1 0.1 (-)North Korea (-) (-) (-) (-) (-) (-) 1.7 1.7 (-)Norway -513.7 269.3 783.0 -322.8 222.2 545.0 -223.2 235.1 458.2
Oman 30.0 69.4 39.4 -42.1 78.5 120.6 -157.8 129.2 287.0
Pakistan -174.3 147.0 321.3 -204.0 137.2 341.1 -129.5 179.0 308.5Palau 0.9 0.9 (-) 1.3 1.3 0.1 1.0 1.0 (-)Panama 262.3 291.0 28.8 341.3 373.5 32.2 251.8 281.6 29.8Papua New Guinea -4.9 4.9 9.8 -4.9 6.4 11.4 -4.2 6.6 10.8Paraguay 104.3 108.7 4.4 110.7 119.6 8.9 110.5 118.2 7.8Peru -62.7 335.7 398.4 -116.6 356.1 472.8 -50.9 443.1 493.9Philippines -213.9 572.1 786.0 -197.2 665.8 863.0 -245.1 601.4 846.6Pitcairn Island 0.1 0.1 (-) 0.1 0.1 (-) 0.2 0.2 (-)Poland 132.2 313.2 181.0 173.3 360.3 187.0 -0.3 197.7 198.0Portugal -113.4 191.1 304.4 -82.3 174.2 256.5 35.1 237.6 202.4
Qatar 80.1 116.6 36.4 214.0 271.9 57.9 163.2 183.1 19.9
Republic of Yemen -28.8 22.5 51.3 13.0 85.2 72.2 83.1 83.9 0.8Reunion 0.6 0.8 0.1 0.2 0.2 (-) -0.5 0.1 0.6Romania -34.1 47.1 81.1 -37.8 55.4 93.2 -8.0 66.0 74.0Russia -1,424.2 537.4 1,961.6 -887.0 913.5 1,800.5 -764.0 600.4 1,364.4Rwanda -0.5 0.5 1.0 1.5 2.1 0.6 1.2 1.7 0.5
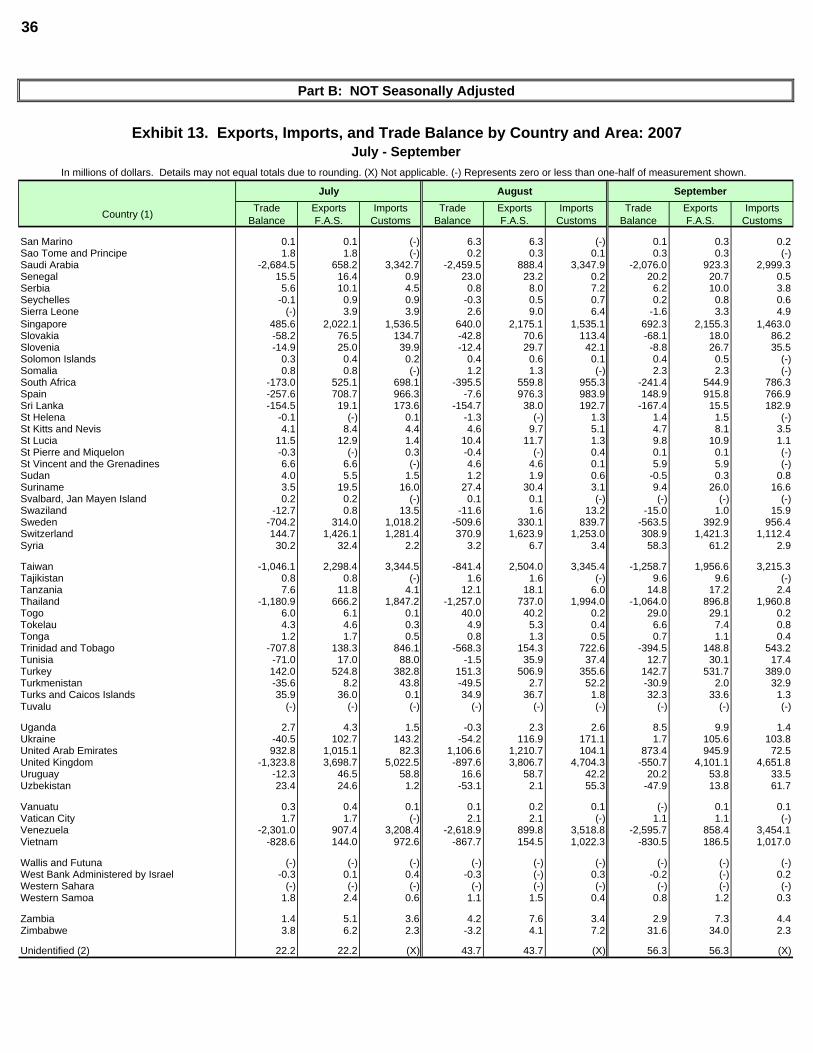
36
Part B: NOT Seasonally Adjusted
Exhibit 13. Exports, Imports, and Trade Balance by Country and Area: 2007July - September
In millions of dollars. Details may not equal totals due to rounding. (X) Not applicable. (-) Represents zero or less than one-half of measurement shown.
July August September
Country (1) Trade Balance
Exports F.A.S.
Imports Customs
Trade Balance
Exports F.A.S.
Imports Customs
Trade Balance
Exports F.A.S.
Imports Customs
San Marino 0.1 0.1 (-) 6.3 6.3 (-) 0.1 0.3 0.2Sao Tome and Principe 1.8 1.8 (-) 0.2 0.3 0.1 0.3 0.3 (-)Saudi Arabia -2,684.5 658.2 3,342.7 -2,459.5 888.4 3,347.9 -2,076.0 923.3 2,999.3Senegal 15.5 16.4 0.9 23.0 23.2 0.2 20.2 20.7 0.5Serbia 5.6 10.1 4.5 0.8 8.0 7.2 6.2 10.0 3.8Seychelles -0.1 0.9 0.9 -0.3 0.5 0.7 0.2 0.8 0.6Sierra Leone (-) 3.9 3.9 2.6 9.0 6.4 -1.6 3.3 4.9Singapore 485.6 2,022.1 1,536.5 640.0 2,175.1 1,535.1 692.3 2,155.3 1,463.0Slovakia -58.2 76.5 134.7 -42.8 70.6 113.4 -68.1 18.0 86.2Slovenia -14.9 25.0 39.9 -12.4 29.7 42.1 -8.8 26.7 35.5Solomon Islands 0.3 0.4 0.2 0.4 0.6 0.1 0.4 0.5 (-)Somalia 0.8 0.8 (-) 1.2 1.3 (-) 2.3 2.3 (-)South Africa -173.0 525.1 698.1 -395.5 559.8 955.3 -241.4 544.9 786.3Spain -257.6 708.7 966.3 -7.6 976.3 983.9 148.9 915.8 766.9Sri Lanka -154.5 19.1 173.6 -154.7 38.0 192.7 -167.4 15.5 182.9St Helena -0.1 (-) 0.1 -1.3 (-) 1.3 1.4 1.5 (-)St Kitts and Nevis 4.1 8.4 4.4 4.6 9.7 5.1 4.7 8.1 3.5St Lucia 11.5 12.9 1.4 10.4 11.7 1.3 9.8 10.9 1.1St Pierre and Miquelon -0.3 (-) 0.3 -0.4 (-) 0.4 0.1 0.1 (-)St Vincent and the Grenadines 6.6 6.6 (-) 4.6 4.6 0.1 5.9 5.9 (-)Sudan 4.0 5.5 1.5 1.2 1.9 0.6 -0.5 0.3 0.8Suriname 3.5 19.5 16.0 27.4 30.4 3.1 9.4 26.0 16.6Svalbard, Jan Mayen Island 0.2 0.2 (-) 0.1 0.1 (-) (-) (-) (-)Swaziland -12.7 0.8 13.5 -11.6 1.6 13.2 -15.0 1.0 15.9Sweden -704.2 314.0 1,018.2 -509.6 330.1 839.7 -563.5 392.9 956.4Switzerland 144.7 1,426.1 1,281.4 370.9 1,623.9 1,253.0 308.9 1,421.3 1,112.4Syria 30.2 32.4 2.2 3.2 6.7 3.4 58.3 61.2 2.9
Taiwan -1,046.1 2,298.4 3,344.5 -841.4 2,504.0 3,345.4 -1,258.7 1,956.6 3,215.3Tajikistan 0.8 0.8 (-) 1.6 1.6 (-) 9.6 9.6 (-)Tanzania 7.6 11.8 4.1 12.1 18.1 6.0 14.8 17.2 2.4Thailand -1,180.9 666.2 1,847.2 -1,257.0 737.0 1,994.0 -1,064.0 896.8 1,960.8Togo 6.0 6.1 0.1 40.0 40.2 0.2 29.0 29.1 0.2Tokelau 4.3 4.6 0.3 4.9 5.3 0.4 6.6 7.4 0.8Tonga 1.2 1.7 0.5 0.8 1.3 0.5 0.7 1.1 0.4Trinidad and Tobago -707.8 138.3 846.1 -568.3 154.3 722.6 -394.5 148.8 543.2Tunisia -71.0 17.0 88.0 -1.5 35.9 37.4 12.7 30.1 17.4Turkey 142.0 524.8 382.8 151.3 506.9 355.6 142.7 531.7 389.0Turkmenistan -35.6 8.2 43.8 -49.5 2.7 52.2 -30.9 2.0 32.9Turks and Caicos Islands 35.9 36.0 0.1 34.9 36.7 1.8 32.3 33.6 1.3Tuvalu (-) (-) (-) (-) (-) (-) (-) (-) (-)
Uganda 2.7 4.3 1.5 -0.3 2.3 2.6 8.5 9.9 1.4Ukraine -40.5 102.7 143.2 -54.2 116.9 171.1 1.7 105.6 103.8United Arab Emirates 932.8 1,015.1 82.3 1,106.6 1,210.7 104.1 873.4 945.9 72.5United Kingdom -1,323.8 3,698.7 5,022.5 -897.6 3,806.7 4,704.3 -550.7 4,101.1 4,651.8Uruguay -12.3 46.5 58.8 16.6 58.7 42.2 20.2 53.8 33.5Uzbekistan 23.4 24.6 1.2 -53.1 2.1 55.3 -47.9 13.8 61.7
Vanuatu 0.3 0.4 0.1 0.1 0.2 0.1 (-) 0.1 0.1Vatican City 1.7 1.7 (-) 2.1 2.1 (-) 1.1 1.1 (-)Venezuela -2,301.0 907.4 3,208.4 -2,618.9 899.8 3,518.8 -2,595.7 858.4 3,454.1Vietnam -828.6 144.0 972.6 -867.7 154.5 1,022.3 -830.5 186.5 1,017.0
Wallis and Futuna (-) (-) (-) (-) (-) (-) (-) (-) (-)West Bank Administered by Israel -0.3 0.1 0.4 -0.3 (-) 0.3 -0.2 (-) 0.2Western Sahara (-) (-) (-) (-) (-) (-) (-) (-) (-)Western Samoa 1.8 2.4 0.6 1.1 1.5 0.4 0.8 1.2 0.3
Zambia 1.4 5.1 3.6 4.2 7.6 3.4 2.9 7.3 4.4Zimbabwe 3.8 6.2 2.3 -3.2 4.1 7.2 31.6 34.0 2.3
Unidentified (2) 22.2 22.2 (X) 43.7 43.7 (X) 56.3 56.3 (X)
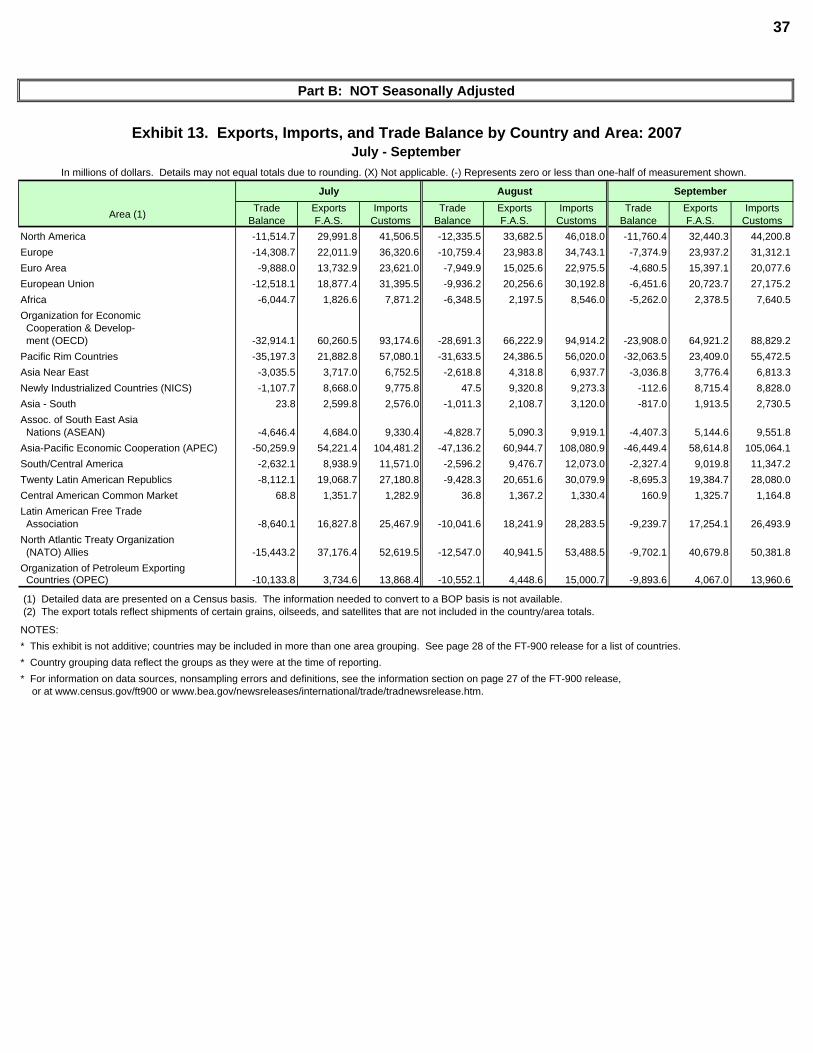
37
Part B: NOT Seasonally Adjusted
Exhibit 13. Exports, Imports, and Trade Balance by Country and Area: 2007July - September
In millions of dollars. Details may not equal totals due to rounding. (X) Not applicable. (-) Represents zero or less than one-half of measurement shown.
July August September
Area (1) Trade Balance
Exports F.A.S.
Imports Customs
Trade Balance
Exports F.A.S.
Imports Customs
Trade Balance
Exports F.A.S.
Imports Customs
North America -11,514.7 29,991.8 41,506.5 -12,335.5 33,682.5 46,018.0 -11,760.4 32,440.3 44,200.8Europe -14,308.7 22,011.9 36,320.6 -10,759.4 23,983.8 34,743.1 -7,374.9 23,937.2 31,312.1Euro Area -9,888.0 13,732.9 23,621.0 -7,949.9 15,025.6 22,975.5 -4,680.5 15,397.1 20,077.6European Union -12,518.1 18,877.4 31,395.5 -9,936.2 20,256.6 30,192.8 -6,451.6 20,723.7 27,175.2Africa -6,044.7 1,826.6 7,871.2 -6,348.5 2,197.5 8,546.0 -5,262.0 2,378.5 7,640.5Organization for Economic Cooperation & Develop- ment (OECD) -32,914.1 60,260.5 93,174.6 -28,691.3 66,222.9 94,914.2 -23,908.0 64,921.2 88,829.2Pacific Rim Countries -35,197.3 21,882.8 57,080.1 -31,633.5 24,386.5 56,020.0 -32,063.5 23,409.0 55,472.5Asia Near East -3,035.5 3,717.0 6,752.5 -2,618.8 4,318.8 6,937.7 -3,036.8 3,776.4 6,813.3Newly Industrialized Countries (NICS) -1,107.7 8,668.0 9,775.8 47.5 9,320.8 9,273.3 -112.6 8,715.4 8,828.0Asia - South 23.8 2,599.8 2,576.0 -1,011.3 2,108.7 3,120.0 -817.0 1,913.5 2,730.5Assoc. of South East Asia Nations (ASEAN) -4,646.4 4,684.0 9,330.4 -4,828.7 5,090.3 9,919.1 -4,407.3 5,144.6 9,551.8Asia-Pacific Economic Cooperation (APEC) -50,259.9 54,221.4 104,481.2 -47,136.2 60,944.7 108,080.9 -46,449.4 58,614.8 105,064.1South/Central America -2,632.1 8,938.9 11,571.0 -2,596.2 9,476.7 12,073.0 -2,327.4 9,019.8 11,347.2Twenty Latin American Republics -8,112.1 19,068.7 27,180.8 -9,428.3 20,651.6 30,079.9 -8,695.3 19,384.7 28,080.0Central American Common Market 68.8 1,351.7 1,282.9 36.8 1,367.2 1,330.4 160.9 1,325.7 1,164.8Latin American Free Trade Association -8,640.1 16,827.8 25,467.9 -10,041.6 18,241.9 28,283.5 -9,239.7 17,254.1 26,493.9North Atlantic Treaty Organization (NATO) Allies -15,443.2 37,176.4 52,619.5 -12,547.0 40,941.5 53,488.5 -9,702.1 40,679.8 50,381.8Organization of Petroleum Exporting Countries (OPEC) -10,133.8 3,734.6 13,868.4 -10,552.1 4,448.6 15,000.7 -9,893.6 4,067.0 13,960.6
(1) Detailed data are presented on a Census basis. The information needed to convert to a BOP basis is not available. (2) The export totals reflect shipments of certain grains, oilseeds, and satellites that are not included in the country/area totals.
NOTES:* This exhibit is not additive; countries may be included in more than one area grouping. See page 28 of the FT-900 release for a list of countries.* Country grouping data reflect the groups as they were at the time of reporting. * For information on data sources, nonsampling errors and definitions, see the information section on page 27 of the FT-900 release,
or at www.census.gov/ft900 or www.bea.gov/newsreleases/international/trade/tradnewsrelease.htm.
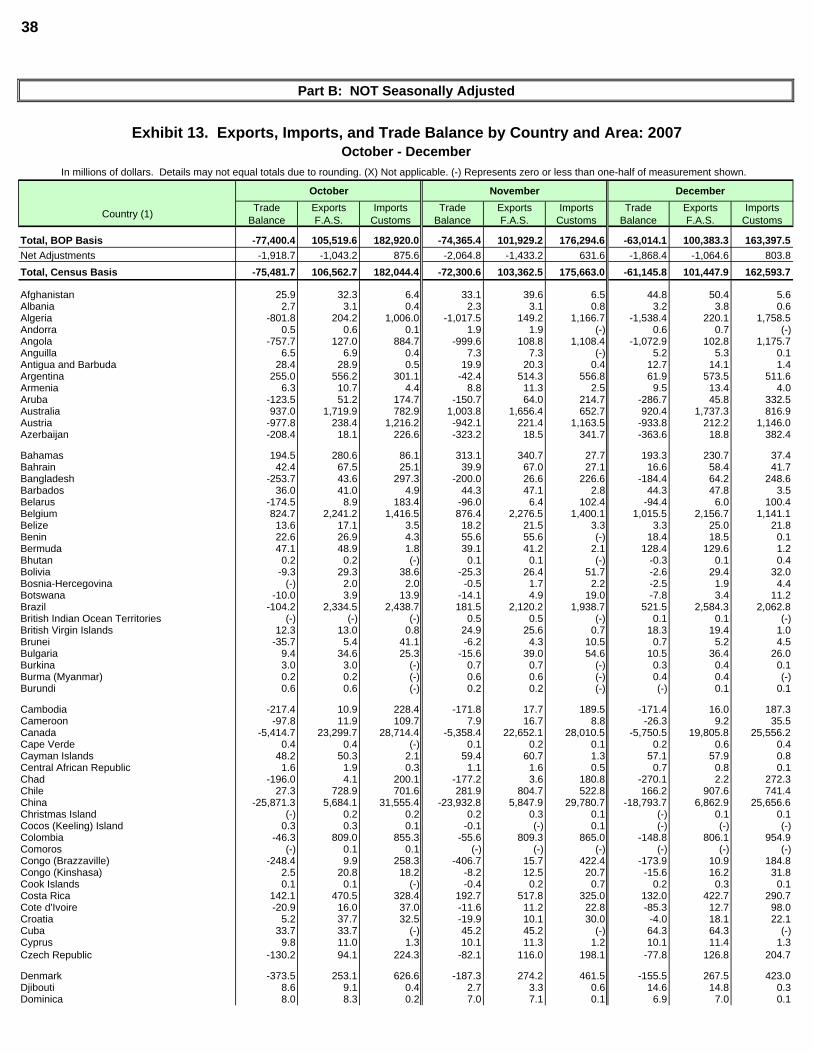
38
Part B: NOT Seasonally Adjusted
Exhibit 13. Exports, Imports, and Trade Balance by Country and Area: 2007October - December
In millions of dollars. Details may not equal totals due to rounding. (X) Not applicable. (-) Represents zero or less than one-half of measurement shown.
October November December
Country (1) Trade Balance
Exports F.A.S.
Imports Customs
Trade Balance
Exports F.A.S.
Imports Customs
Trade Balance
Exports F.A.S.
Imports Customs
Total, BOP Basis -77,400.4 105,519.6 182,920.0 -74,365.4 101,929.2 176,294.6 -63,014.1 100,383.3 163,397.5Net Adjustments -1,918.7 -1,043.2 875.6 -2,064.8 -1,433.2 631.6 -1,868.4 -1,064.6 803.8Total, Census Basis -75,481.7 106,562.7 182,044.4 -72,300.6 103,362.5 175,663.0 -61,145.8 101,447.9 162,593.7
Afghanistan 25.9 32.3 6.4 33.1 39.6 6.5 44.8 50.4 5.6Albania 2.7 3.1 0.4 2.3 3.1 0.8 3.2 3.8 0.6Algeria -801.8 204.2 1,006.0 -1,017.5 149.2 1,166.7 -1,538.4 220.1 1,758.5Andorra 0.5 0.6 0.1 1.9 1.9 (-) 0.6 0.7 (-)Angola -757.7 127.0 884.7 -999.6 108.8 1,108.4 -1,072.9 102.8 1,175.7Anguilla 6.5 6.9 0.4 7.3 7.3 (-) 5.2 5.3 0.1Antigua and Barbuda 28.4 28.9 0.5 19.9 20.3 0.4 12.7 14.1 1.4Argentina 255.0 556.2 301.1 -42.4 514.3 556.8 61.9 573.5 511.6Armenia 6.3 10.7 4.4 8.8 11.3 2.5 9.5 13.4 4.0Aruba -123.5 51.2 174.7 -150.7 64.0 214.7 -286.7 45.8 332.5Australia 937.0 1,719.9 782.9 1,003.8 1,656.4 652.7 920.4 1,737.3 816.9Austria -977.8 238.4 1,216.2 -942.1 221.4 1,163.5 -933.8 212.2 1,146.0Azerbaijan -208.4 18.1 226.6 -323.2 18.5 341.7 -363.6 18.8 382.4
Bahamas 194.5 280.6 86.1 313.1 340.7 27.7 193.3 230.7 37.4Bahrain 42.4 67.5 25.1 39.9 67.0 27.1 16.6 58.4 41.7Bangladesh -253.7 43.6 297.3 -200.0 26.6 226.6 -184.4 64.2 248.6Barbados 36.0 41.0 4.9 44.3 47.1 2.8 44.3 47.8 3.5Belarus -174.5 8.9 183.4 -96.0 6.4 102.4 -94.4 6.0 100.4Belgium 824.7 2,241.2 1,416.5 876.4 2,276.5 1,400.1 1,015.5 2,156.7 1,141.1Belize 13.6 17.1 3.5 18.2 21.5 3.3 3.3 25.0 21.8Benin 22.6 26.9 4.3 55.6 55.6 (-) 18.4 18.5 0.1Bermuda 47.1 48.9 1.8 39.1 41.2 2.1 128.4 129.6 1.2Bhutan 0.2 0.2 (-) 0.1 0.1 (-) -0.3 0.1 0.4Bolivia -9.3 29.3 38.6 -25.3 26.4 51.7 -2.6 29.4 32.0Bosnia-Hercegovina (-) 2.0 2.0 -0.5 1.7 2.2 -2.5 1.9 4.4Botswana -10.0 3.9 13.9 -14.1 4.9 19.0 -7.8 3.4 11.2Brazil -104.2 2,334.5 2,438.7 181.5 2,120.2 1,938.7 521.5 2,584.3 2,062.8British Indian Ocean Territories (-) (-) (-) 0.5 0.5 (-) 0.1 0.1 (-)British Virgin Islands 12.3 13.0 0.8 24.9 25.6 0.7 18.3 19.4 1.0Brunei -35.7 5.4 41.1 -6.2 4.3 10.5 0.7 5.2 4.5Bulgaria 9.4 34.6 25.3 -15.6 39.0 54.6 10.5 36.4 26.0Burkina 3.0 3.0 (-) 0.7 0.7 (-) 0.3 0.4 0.1Burma (Myanmar) 0.2 0.2 (-) 0.6 0.6 (-) 0.4 0.4 (-)Burundi 0.6 0.6 (-) 0.2 0.2 (-) (-) 0.1 0.1
Cambodia -217.4 10.9 228.4 -171.8 17.7 189.5 -171.4 16.0 187.3Cameroon -97.8 11.9 109.7 7.9 16.7 8.8 -26.3 9.2 35.5Canada -5,414.7 23,299.7 28,714.4 -5,358.4 22,652.1 28,010.5 -5,750.5 19,805.8 25,556.2Cape Verde 0.4 0.4 (-) 0.1 0.2 0.1 0.2 0.6 0.4Cayman Islands 48.2 50.3 2.1 59.4 60.7 1.3 57.1 57.9 0.8Central African Republic 1.6 1.9 0.3 1.1 1.6 0.5 0.7 0.8 0.1Chad -196.0 4.1 200.1 -177.2 3.6 180.8 -270.1 2.2 272.3Chile 27.3 728.9 701.6 281.9 804.7 522.8 166.2 907.6 741.4China -25,871.3 5,684.1 31,555.4 -23,932.8 5,847.9 29,780.7 -18,793.7 6,862.9 25,656.6Christmas Island (-) 0.2 0.2 0.2 0.3 0.1 (-) 0.1 0.1Cocos (Keeling) Island 0.3 0.3 0.1 -0.1 (-) 0.1 (-) (-) (-)Colombia -46.3 809.0 855.3 -55.6 809.3 865.0 -148.8 806.1 954.9Comoros (-) 0.1 0.1 (-) (-) (-) (-) (-) (-)Congo (Brazzaville) -248.4 9.9 258.3 -406.7 15.7 422.4 -173.9 10.9 184.8Congo (Kinshasa) 2.5 20.8 18.2 -8.2 12.5 20.7 -15.6 16.2 31.8Cook Islands 0.1 0.1 (-) -0.4 0.2 0.7 0.2 0.3 0.1Costa Rica 142.1 470.5 328.4 192.7 517.8 325.0 132.0 422.7 290.7Cote d'Ivoire -20.9 16.0 37.0 -11.6 11.2 22.8 -85.3 12.7 98.0Croatia 5.2 37.7 32.5 -19.9 10.1 30.0 -4.0 18.1 22.1Cuba 33.7 33.7 (-) 45.2 45.2 (-) 64.3 64.3 (-)Cyprus 9.8 11.0 1.3 10.1 11.3 1.2 10.1 11.4 1.3Czech Republic -130.2 94.1 224.3 -82.1 116.0 198.1 -77.8 126.8 204.7
Denmark -373.5 253.1 626.6 -187.3 274.2 461.5 -155.5 267.5 423.0Djibouti 8.6 9.1 0.4 2.7 3.3 0.6 14.6 14.8 0.3Dominica 8.0 8.3 0.2 7.0 7.1 0.1 6.9 7.0 0.1
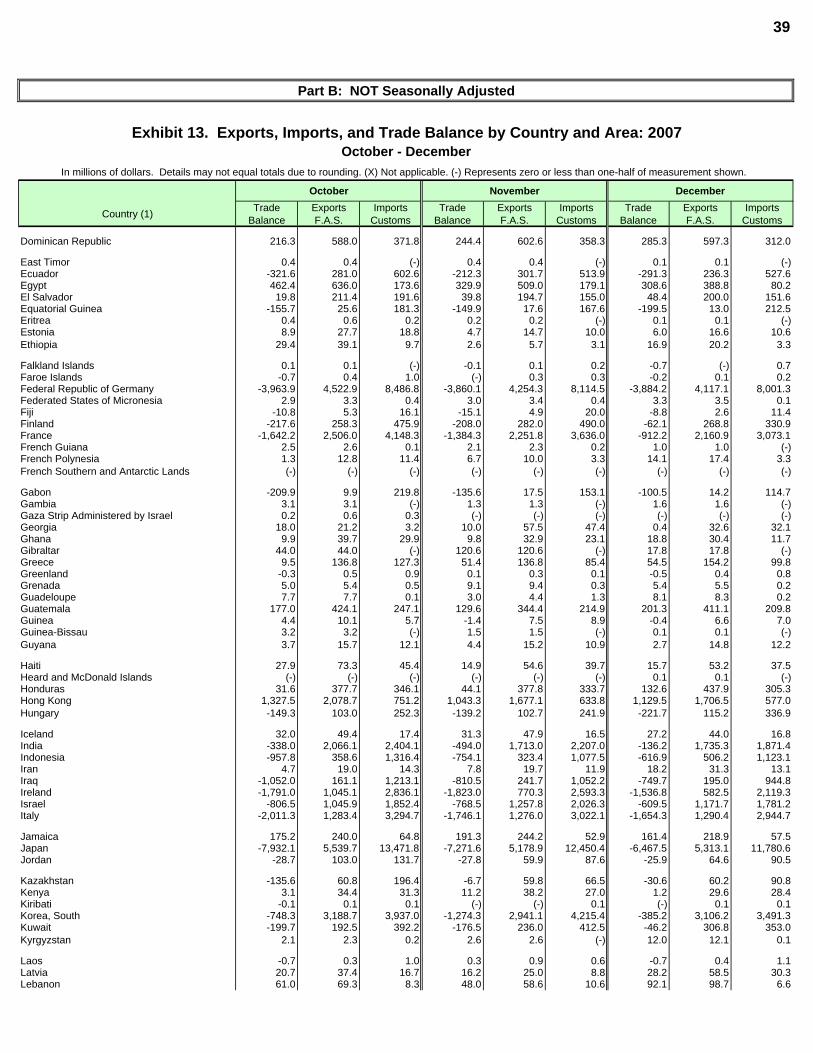
39
Part B: NOT Seasonally Adjusted
Exhibit 13. Exports, Imports, and Trade Balance by Country and Area: 2007October - December
In millions of dollars. Details may not equal totals due to rounding. (X) Not applicable. (-) Represents zero or less than one-half of measurement shown.
October November December
Country (1) Trade Balance
Exports F.A.S.
Imports Customs
Trade Balance
Exports F.A.S.
Imports Customs
Trade Balance
Exports F.A.S.
Imports Customs
Dominican Republic 216.3 588.0 371.8 244.4 602.6 358.3 285.3 597.3 312.0
East Timor 0.4 0.4 (-) 0.4 0.4 (-) 0.1 0.1 (-)Ecuador -321.6 281.0 602.6 -212.3 301.7 513.9 -291.3 236.3 527.6Egypt 462.4 636.0 173.6 329.9 509.0 179.1 308.6 388.8 80.2El Salvador 19.8 211.4 191.6 39.8 194.7 155.0 48.4 200.0 151.6Equatorial Guinea -155.7 25.6 181.3 -149.9 17.6 167.6 -199.5 13.0 212.5Eritrea 0.4 0.6 0.2 0.2 0.2 (-) 0.1 0.1 (-)Estonia 8.9 27.7 18.8 4.7 14.7 10.0 6.0 16.6 10.6Ethiopia 29.4 39.1 9.7 2.6 5.7 3.1 16.9 20.2 3.3
Falkland Islands 0.1 0.1 (-) -0.1 0.1 0.2 -0.7 (-) 0.7Faroe Islands -0.7 0.4 1.0 (-) 0.3 0.3 -0.2 0.1 0.2Federal Republic of Germany -3,963.9 4,522.9 8,486.8 -3,860.1 4,254.3 8,114.5 -3,884.2 4,117.1 8,001.3Federated States of Micronesia 2.9 3.3 0.4 3.0 3.4 0.4 3.3 3.5 0.1Fiji -10.8 5.3 16.1 -15.1 4.9 20.0 -8.8 2.6 11.4Finland -217.6 258.3 475.9 -208.0 282.0 490.0 -62.1 268.8 330.9France -1,642.2 2,506.0 4,148.3 -1,384.3 2,251.8 3,636.0 -912.2 2,160.9 3,073.1French Guiana 2.5 2.6 0.1 2.1 2.3 0.2 1.0 1.0 (-)French Polynesia 1.3 12.8 11.4 6.7 10.0 3.3 14.1 17.4 3.3French Southern and Antarctic Lands (-) (-) (-) (-) (-) (-) (-) (-) (-)
Gabon -209.9 9.9 219.8 -135.6 17.5 153.1 -100.5 14.2 114.7Gambia 3.1 3.1 (-) 1.3 1.3 (-) 1.6 1.6 (-)Gaza Strip Administered by Israel 0.2 0.6 0.3 (-) (-) (-) (-) (-) (-)Georgia 18.0 21.2 3.2 10.0 57.5 47.4 0.4 32.6 32.1Ghana 9.9 39.7 29.9 9.8 32.9 23.1 18.8 30.4 11.7Gibraltar 44.0 44.0 (-) 120.6 120.6 (-) 17.8 17.8 (-)Greece 9.5 136.8 127.3 51.4 136.8 85.4 54.5 154.2 99.8Greenland -0.3 0.5 0.9 0.1 0.3 0.1 -0.5 0.4 0.8Grenada 5.0 5.4 0.5 9.1 9.4 0.3 5.4 5.5 0.2Guadeloupe 7.7 7.7 0.1 3.0 4.4 1.3 8.1 8.3 0.2Guatemala 177.0 424.1 247.1 129.6 344.4 214.9 201.3 411.1 209.8Guinea 4.4 10.1 5.7 -1.4 7.5 8.9 -0.4 6.6 7.0Guinea-Bissau 3.2 3.2 (-) 1.5 1.5 (-) 0.1 0.1 (-)Guyana 3.7 15.7 12.1 4.4 15.2 10.9 2.7 14.8 12.2
Haiti 27.9 73.3 45.4 14.9 54.6 39.7 15.7 53.2 37.5Heard and McDonald Islands (-) (-) (-) (-) (-) (-) 0.1 0.1 (-)Honduras 31.6 377.7 346.1 44.1 377.8 333.7 132.6 437.9 305.3Hong Kong 1,327.5 2,078.7 751.2 1,043.3 1,677.1 633.8 1,129.5 1,706.5 577.0Hungary -149.3 103.0 252.3 -139.2 102.7 241.9 -221.7 115.2 336.9
Iceland 32.0 49.4 17.4 31.3 47.9 16.5 27.2 44.0 16.8India -338.0 2,066.1 2,404.1 -494.0 1,713.0 2,207.0 -136.2 1,735.3 1,871.4Indonesia -957.8 358.6 1,316.4 -754.1 323.4 1,077.5 -616.9 506.2 1,123.1Iran 4.7 19.0 14.3 7.8 19.7 11.9 18.2 31.3 13.1Iraq -1,052.0 161.1 1,213.1 -810.5 241.7 1,052.2 -749.7 195.0 944.8Ireland -1,791.0 1,045.1 2,836.1 -1,823.0 770.3 2,593.3 -1,536.8 582.5 2,119.3Israel -806.5 1,045.9 1,852.4 -768.5 1,257.8 2,026.3 -609.5 1,171.7 1,781.2Italy -2,011.3 1,283.4 3,294.7 -1,746.1 1,276.0 3,022.1 -1,654.3 1,290.4 2,944.7
Jamaica 175.2 240.0 64.8 191.3 244.2 52.9 161.4 218.9 57.5Japan -7,932.1 5,539.7 13,471.8 -7,271.6 5,178.9 12,450.4 -6,467.5 5,313.1 11,780.6Jordan -28.7 103.0 131.7 -27.8 59.9 87.6 -25.9 64.6 90.5
Kazakhstan -135.6 60.8 196.4 -6.7 59.8 66.5 -30.6 60.2 90.8Kenya 3.1 34.4 31.3 11.2 38.2 27.0 1.2 29.6 28.4Kiribati -0.1 0.1 0.1 (-) (-) 0.1 (-) 0.1 0.1Korea, South -748.3 3,188.7 3,937.0 -1,274.3 2,941.1 4,215.4 -385.2 3,106.2 3,491.3Kuwait -199.7 192.5 392.2 -176.5 236.0 412.5 -46.2 306.8 353.0Kyrgyzstan 2.1 2.3 0.2 2.6 2.6 (-) 12.0 12.1 0.1
Laos -0.7 0.3 1.0 0.3 0.9 0.6 -0.7 0.4 1.1Latvia 20.7 37.4 16.7 16.2 25.0 8.8 28.2 58.5 30.3Lebanon 61.0 69.3 8.3 48.0 58.6 10.6 92.1 98.7 6.6

40
Part B: NOT Seasonally Adjusted
Exhibit 13. Exports, Imports, and Trade Balance by Country and Area: 2007October - December
In millions of dollars. Details may not equal totals due to rounding. (X) Not applicable. (-) Represents zero or less than one-half of measurement shown.
October November December
Country (1) Trade Balance
Exports F.A.S.
Imports Customs
Trade Balance
Exports F.A.S.
Imports Customs
Trade Balance
Exports F.A.S.
Imports Customs
Lesotho -61.6 0.5 62.2 -27.7 1.1 28.8 -26.3 2.5 28.8Liberia -4.0 5.7 9.7 -3.1 5.5 8.6 -6.5 5.2 11.8Libya -196.0 44.8 240.7 -272.5 62.3 334.9 -334.9 87.1 422.0Liechtenstein -27.0 1.2 28.2 -19.9 1.2 21.1 -21.3 1.0 22.3Lithuania 36.4 55.6 19.2 52.9 78.8 25.8 14.5 56.4 41.8Luxembourg 155.3 209.6 54.3 4.9 38.0 33.1 11.2 45.2 34.0
Macao -80.9 18.9 99.9 -80.5 15.6 96.1 -84.0 13.9 97.9Macedonia (Skopje) -8.2 4.5 12.7 1.1 2.5 1.4 -13.3 2.6 15.9Madagascar -35.0 2.8 37.8 -23.6 2.0 25.6 -21.9 1.8 23.7Malawi 0.4 2.4 1.9 -1.6 5.3 6.9 -3.1 3.3 6.3Malaysia -1,664.8 1,048.1 2,712.9 -1,817.5 1,004.7 2,822.1 -1,976.4 1,065.3 3,041.7Maldives 1.2 1.4 0.1 2.1 2.2 0.1 2.7 2.9 0.2Mali -0.8 2.4 3.3 -0.6 1.0 1.6 0.7 1.8 1.1Malta 1.2 32.6 31.4 -17.1 21.4 38.4 -22.3 7.2 29.5Marshall Islands 1.0 1.6 0.6 -0.9 1.7 2.6 0.7 1.2 0.5Martinique 12.9 15.1 2.1 6.1 8.0 1.9 21.0 21.4 0.3Mauritania 3.4 3.5 (-) 8.2 8.3 0.1 2.7 2.8 0.1Mauritius -8.2 12.9 21.1 -9.3 3.1 12.3 -5.6 8.2 13.8Mayotte (-) (-) (-) (-) (-) (-) 0.2 0.2 (-)Mexico -7,525.6 12,330.2 19,855.8 -7,228.9 12,127.2 19,356.1 -6,643.8 10,077.9 16,721.8Moldova 4.5 6.7 2.1 2.7 4.4 1.7 2.8 4.1 1.4Monaco 10.4 12.0 1.6 0.1 1.2 1.1 -0.4 0.9 1.3Mongolia -4.5 1.8 6.3 -4.5 1.8 6.2 -1.8 2.3 4.1Montenegro 4.4 4.4 (-) 2.5 2.5 (-) 14.5 15.5 1.0Montserrat 0.3 0.3 (-) 0.2 0.2 (-) 0.3 0.4 0.1Morocco 82.4 162.4 80.0 113.8 151.2 37.4 71.2 112.5 41.3Mozambique 3.7 4.0 0.3 3.3 4.4 1.1 8.0 8.3 0.3
Namibia 3.4 9.3 6.0 5.6 9.6 4.0 -13.8 22.1 35.9Nauru 1.2 1.2 (-) 1.5 1.5 (-) 1.2 1.2 (-)Nepal -6.9 2.2 9.1 -6.7 1.6 8.3 -5.3 1.5 6.8Netherlands 474.8 2,568.8 2,094.0 1,175.9 2,701.7 1,525.8 1,527.5 3,176.1 1,648.6Netherlands Antilles 202.5 267.0 64.4 171.1 285.8 114.8 174.5 208.3 33.7New Caledonia -0.7 4.9 5.6 -4.7 6.4 11.1 2.9 8.5 5.7New Zealand -21.1 209.1 230.2 -36.4 210.4 246.7 -19.7 232.3 252.1Nicaragua -93.5 62.0 155.5 -68.3 76.7 145.0 -65.0 77.7 142.7Niger -0.2 3.4 3.6 2.7 3.3 0.6 3.9 4.4 0.5Nigeria -3,014.5 235.0 3,249.5 -3,414.4 295.5 3,709.9 -3,392.0 290.9 3,682.8Niue -0.1 (-) 0.1 (-) (-) (-) (-) (-) (-)Norfolk Island (-) (-) (-) (-) 0.3 0.3 0.2 0.2 (-)North Korea (-) (-) (-) (-) (-) (-) (-) (-) (-)Norway -310.3 266.1 576.4 -257.2 299.2 556.4 -421.4 260.8 682.3
Oman -67.7 76.9 144.6 -35.1 132.3 167.3 63.3 142.8 79.4
Pakistan -202.0 125.8 327.8 -122.7 159.9 282.6 -74.1 188.0 262.1Palau 1.1 1.2 0.1 0.9 1.0 0.1 1.2 1.2 (-)Panama 348.1 380.4 32.3 390.2 414.7 24.5 269.0 318.7 49.7Papua New Guinea 4.2 11.7 7.5 -7.1 5.4 12.6 -7.3 3.1 10.4Paraguay 115.0 125.1 10.1 114.9 121.6 6.7 96.7 102.2 5.6Peru -5.9 501.2 507.1 -228.7 335.9 564.6 -72.0 405.6 477.6Philippines -143.8 703.6 847.4 -164.5 684.7 849.1 -112.1 660.2 772.3Pitcairn Island (-) (-) (-) (-) (-) (-) 0.3 0.3 (-)Poland -36.9 178.8 215.6 385.0 570.9 185.9 36.0 223.1 187.1Portugal -83.7 189.9 273.6 -77.3 171.6 248.9 45.7 287.7 242.1
Qatar 112.4 159.6 47.2 405.7 440.7 35.1 651.6 709.4 57.8
Republic of Yemen 149.4 150.1 0.7 48.6 49.2 0.6 103.8 104.4 0.5Reunion 0.5 0.7 0.2 0.3 0.3 (-) 0.2 0.6 0.4Romania -44.1 53.5 97.6 -53.7 75.4 129.1 -10.2 77.8 88.0Russia -1,114.4 628.1 1,742.5 -1,062.6 920.5 1,983.1 -915.3 571.7 1,487.0Rwanda 0.3 1.2 0.9 -0.3 1.0 1.4 -2.3 0.6 2.9
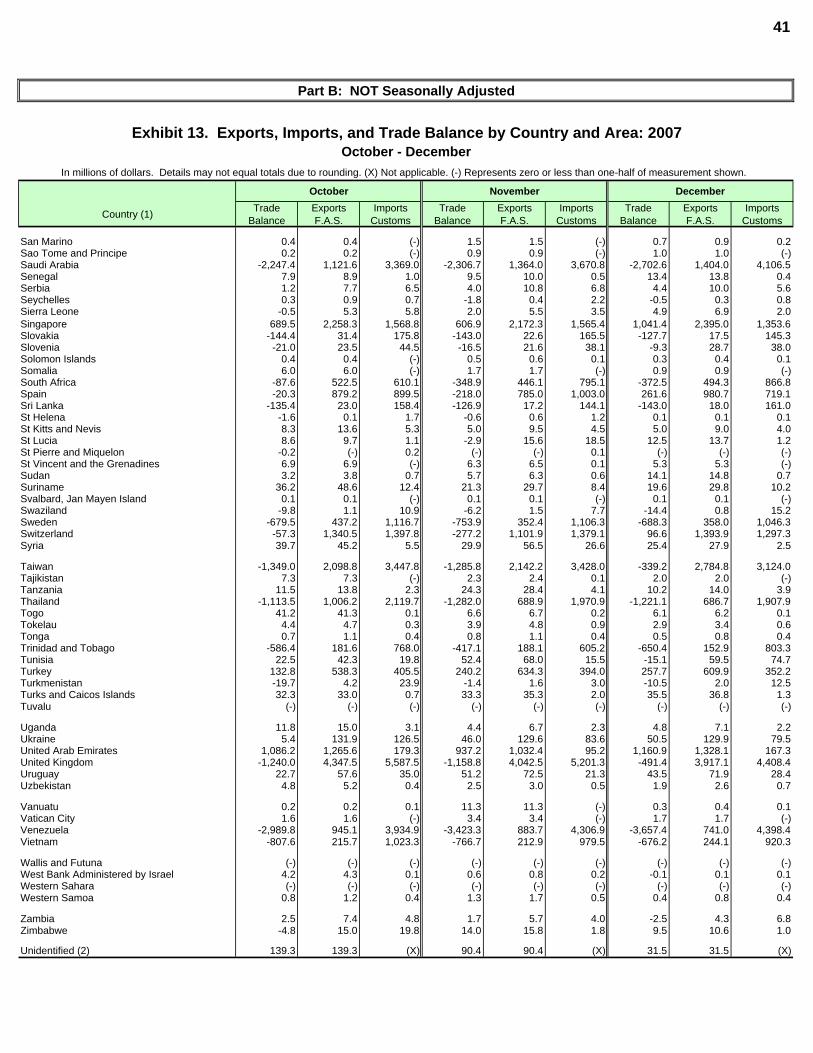
41
Part B: NOT Seasonally Adjusted
Exhibit 13. Exports, Imports, and Trade Balance by Country and Area: 2007October - December
In millions of dollars. Details may not equal totals due to rounding. (X) Not applicable. (-) Represents zero or less than one-half of measurement shown.
October November December
Country (1) Trade Balance
Exports F.A.S.
Imports Customs
Trade Balance
Exports F.A.S.
Imports Customs
Trade Balance
Exports F.A.S.
Imports Customs
San Marino 0.4 0.4 (-) 1.5 1.5 (-) 0.7 0.9 0.2Sao Tome and Principe 0.2 0.2 (-) 0.9 0.9 (-) 1.0 1.0 (-)Saudi Arabia -2,247.4 1,121.6 3,369.0 -2,306.7 1,364.0 3,670.8 -2,702.6 1,404.0 4,106.5Senegal 7.9 8.9 1.0 9.5 10.0 0.5 13.4 13.8 0.4Serbia 1.2 7.7 6.5 4.0 10.8 6.8 4.4 10.0 5.6Seychelles 0.3 0.9 0.7 -1.8 0.4 2.2 -0.5 0.3 0.8Sierra Leone -0.5 5.3 5.8 2.0 5.5 3.5 4.9 6.9 2.0Singapore 689.5 2,258.3 1,568.8 606.9 2,172.3 1,565.4 1,041.4 2,395.0 1,353.6Slovakia -144.4 31.4 175.8 -143.0 22.6 165.5 -127.7 17.5 145.3Slovenia -21.0 23.5 44.5 -16.5 21.6 38.1 -9.3 28.7 38.0Solomon Islands 0.4 0.4 (-) 0.5 0.6 0.1 0.3 0.4 0.1Somalia 6.0 6.0 (-) 1.7 1.7 (-) 0.9 0.9 (-)South Africa -87.6 522.5 610.1 -348.9 446.1 795.1 -372.5 494.3 866.8Spain -20.3 879.2 899.5 -218.0 785.0 1,003.0 261.6 980.7 719.1Sri Lanka -135.4 23.0 158.4 -126.9 17.2 144.1 -143.0 18.0 161.0St Helena -1.6 0.1 1.7 -0.6 0.6 1.2 0.1 0.1 0.1St Kitts and Nevis 8.3 13.6 5.3 5.0 9.5 4.5 5.0 9.0 4.0St Lucia 8.6 9.7 1.1 -2.9 15.6 18.5 12.5 13.7 1.2St Pierre and Miquelon -0.2 (-) 0.2 (-) (-) 0.1 (-) (-) (-)St Vincent and the Grenadines 6.9 6.9 (-) 6.3 6.5 0.1 5.3 5.3 (-)Sudan 3.2 3.8 0.7 5.7 6.3 0.6 14.1 14.8 0.7Suriname 36.2 48.6 12.4 21.3 29.7 8.4 19.6 29.8 10.2Svalbard, Jan Mayen Island 0.1 0.1 (-) 0.1 0.1 (-) 0.1 0.1 (-)Swaziland -9.8 1.1 10.9 -6.2 1.5 7.7 -14.4 0.8 15.2Sweden -679.5 437.2 1,116.7 -753.9 352.4 1,106.3 -688.3 358.0 1,046.3Switzerland -57.3 1,340.5 1,397.8 -277.2 1,101.9 1,379.1 96.6 1,393.9 1,297.3Syria 39.7 45.2 5.5 29.9 56.5 26.6 25.4 27.9 2.5
Taiwan -1,349.0 2,098.8 3,447.8 -1,285.8 2,142.2 3,428.0 -339.2 2,784.8 3,124.0Tajikistan 7.3 7.3 (-) 2.3 2.4 0.1 2.0 2.0 (-)Tanzania 11.5 13.8 2.3 24.3 28.4 4.1 10.2 14.0 3.9Thailand -1,113.5 1,006.2 2,119.7 -1,282.0 688.9 1,970.9 -1,221.1 686.7 1,907.9Togo 41.2 41.3 0.1 6.6 6.7 0.2 6.1 6.2 0.1Tokelau 4.4 4.7 0.3 3.9 4.8 0.9 2.9 3.4 0.6Tonga 0.7 1.1 0.4 0.8 1.1 0.4 0.5 0.8 0.4Trinidad and Tobago -586.4 181.6 768.0 -417.1 188.1 605.2 -650.4 152.9 803.3Tunisia 22.5 42.3 19.8 52.4 68.0 15.5 -15.1 59.5 74.7Turkey 132.8 538.3 405.5 240.2 634.3 394.0 257.7 609.9 352.2Turkmenistan -19.7 4.2 23.9 -1.4 1.6 3.0 -10.5 2.0 12.5Turks and Caicos Islands 32.3 33.0 0.7 33.3 35.3 2.0 35.5 36.8 1.3Tuvalu (-) (-) (-) (-) (-) (-) (-) (-) (-)
Uganda 11.8 15.0 3.1 4.4 6.7 2.3 4.8 7.1 2.2Ukraine 5.4 131.9 126.5 46.0 129.6 83.6 50.5 129.9 79.5United Arab Emirates 1,086.2 1,265.6 179.3 937.2 1,032.4 95.2 1,160.9 1,328.1 167.3United Kingdom -1,240.0 4,347.5 5,587.5 -1,158.8 4,042.5 5,201.3 -491.4 3,917.1 4,408.4Uruguay 22.7 57.6 35.0 51.2 72.5 21.3 43.5 71.9 28.4Uzbekistan 4.8 5.2 0.4 2.5 3.0 0.5 1.9 2.6 0.7
Vanuatu 0.2 0.2 0.1 11.3 11.3 (-) 0.3 0.4 0.1Vatican City 1.6 1.6 (-) 3.4 3.4 (-) 1.7 1.7 (-)Venezuela -2,989.8 945.1 3,934.9 -3,423.3 883.7 4,306.9 -3,657.4 741.0 4,398.4Vietnam -807.6 215.7 1,023.3 -766.7 212.9 979.5 -676.2 244.1 920.3
Wallis and Futuna (-) (-) (-) (-) (-) (-) (-) (-) (-)West Bank Administered by Israel 4.2 4.3 0.1 0.6 0.8 0.2 -0.1 0.1 0.1Western Sahara (-) (-) (-) (-) (-) (-) (-) (-) (-)Western Samoa 0.8 1.2 0.4 1.3 1.7 0.5 0.4 0.8 0.4
Zambia 2.5 7.4 4.8 1.7 5.7 4.0 -2.5 4.3 6.8Zimbabwe -4.8 15.0 19.8 14.0 15.8 1.8 9.5 10.6 1.0
Unidentified (2) 139.3 139.3 (X) 90.4 90.4 (X) 31.5 31.5 (X)
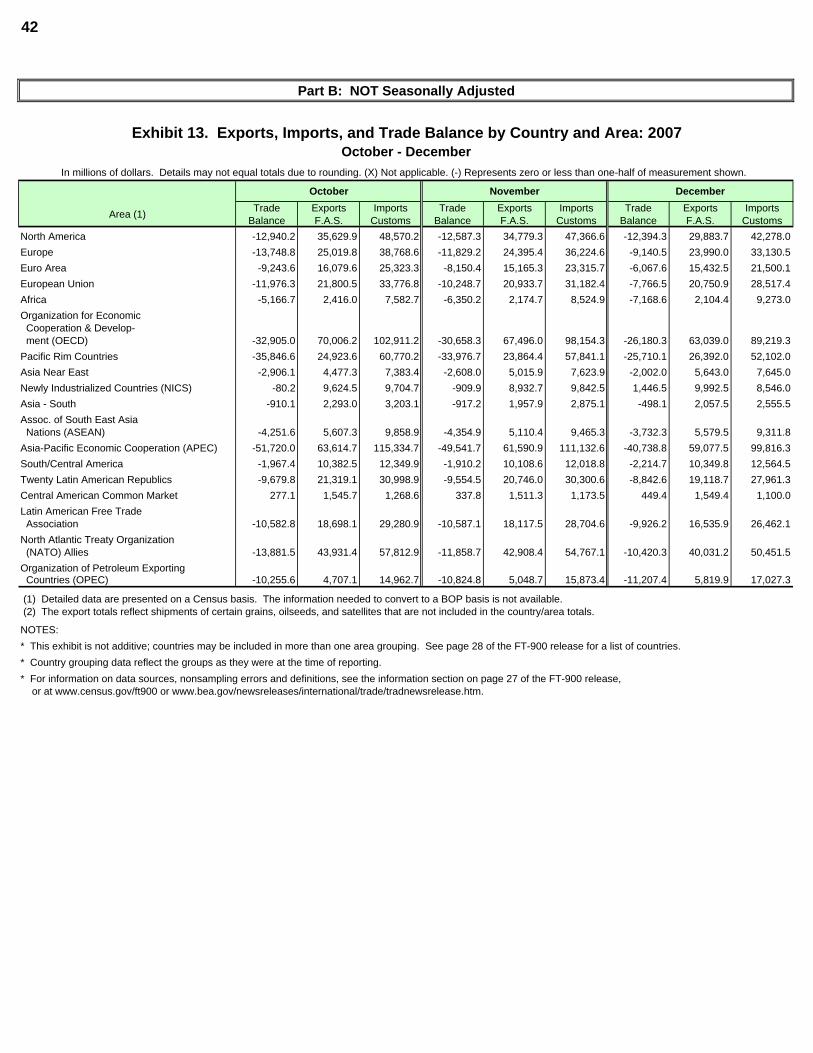
42
Part B: NOT Seasonally Adjusted
Exhibit 13. Exports, Imports, and Trade Balance by Country and Area: 2007October - December
In millions of dollars. Details may not equal totals due to rounding. (X) Not applicable. (-) Represents zero or less than one-half of measurement shown.
October November December
Area (1) Trade Balance
Exports F.A.S.
Imports Customs
Trade Balance
Exports F.A.S.
Imports Customs
Trade Balance
Exports F.A.S.
Imports Customs
North America -12,940.2 35,629.9 48,570.2 -12,587.3 34,779.3 47,366.6 -12,394.3 29,883.7 42,278.0Europe -13,748.8 25,019.8 38,768.6 -11,829.2 24,395.4 36,224.6 -9,140.5 23,990.0 33,130.5Euro Area -9,243.6 16,079.6 25,323.3 -8,150.4 15,165.3 23,315.7 -6,067.6 15,432.5 21,500.1European Union -11,976.3 21,800.5 33,776.8 -10,248.7 20,933.7 31,182.4 -7,766.5 20,750.9 28,517.4Africa -5,166.7 2,416.0 7,582.7 -6,350.2 2,174.7 8,524.9 -7,168.6 2,104.4 9,273.0Organization for Economic Cooperation & Develop- ment (OECD) -32,905.0 70,006.2 102,911.2 -30,658.3 67,496.0 98,154.3 -26,180.3 63,039.0 89,219.3Pacific Rim Countries -35,846.6 24,923.6 60,770.2 -33,976.7 23,864.4 57,841.1 -25,710.1 26,392.0 52,102.0Asia Near East -2,906.1 4,477.3 7,383.4 -2,608.0 5,015.9 7,623.9 -2,002.0 5,643.0 7,645.0Newly Industrialized Countries (NICS) -80.2 9,624.5 9,704.7 -909.9 8,932.7 9,842.5 1,446.5 9,992.5 8,546.0Asia - South -910.1 2,293.0 3,203.1 -917.2 1,957.9 2,875.1 -498.1 2,057.5 2,555.5Assoc. of South East Asia Nations (ASEAN) -4,251.6 5,607.3 9,858.9 -4,354.9 5,110.4 9,465.3 -3,732.3 5,579.5 9,311.8Asia-Pacific Economic Cooperation (APEC) -51,720.0 63,614.7 115,334.7 -49,541.7 61,590.9 111,132.6 -40,738.8 59,077.5 99,816.3South/Central America -1,967.4 10,382.5 12,349.9 -1,910.2 10,108.6 12,018.8 -2,214.7 10,349.8 12,564.5Twenty Latin American Republics -9,679.8 21,319.1 30,998.9 -9,554.5 20,746.0 30,300.6 -8,842.6 19,118.7 27,961.3Central American Common Market 277.1 1,545.7 1,268.6 337.8 1,511.3 1,173.5 449.4 1,549.4 1,100.0Latin American Free Trade Association -10,582.8 18,698.1 29,280.9 -10,587.1 18,117.5 28,704.6 -9,926.2 16,535.9 26,462.1North Atlantic Treaty Organization (NATO) Allies -13,881.5 43,931.4 57,812.9 -11,858.7 42,908.4 54,767.1 -10,420.3 40,031.2 50,451.5Organization of Petroleum Exporting Countries (OPEC) -10,255.6 4,707.1 14,962.7 -10,824.8 5,048.7 15,873.4 -11,207.4 5,819.9 17,027.3
(1) Detailed data are presented on a Census basis. The information needed to convert to a BOP basis is not available. (2) The export totals reflect shipments of certain grains, oilseeds, and satellites that are not included in the country/area totals.
NOTES:* This exhibit is not additive; countries may be included in more than one area grouping. See page 28 of the FT-900 release for a list of countries.* Country grouping data reflect the groups as they were at the time of reporting. * For information on data sources, nonsampling errors and definitions, see the information section on page 27 of the FT-900 release,
or at www.census.gov/ft900 or www.bea.gov/newsreleases/international/trade/tradnewsrelease.htm.
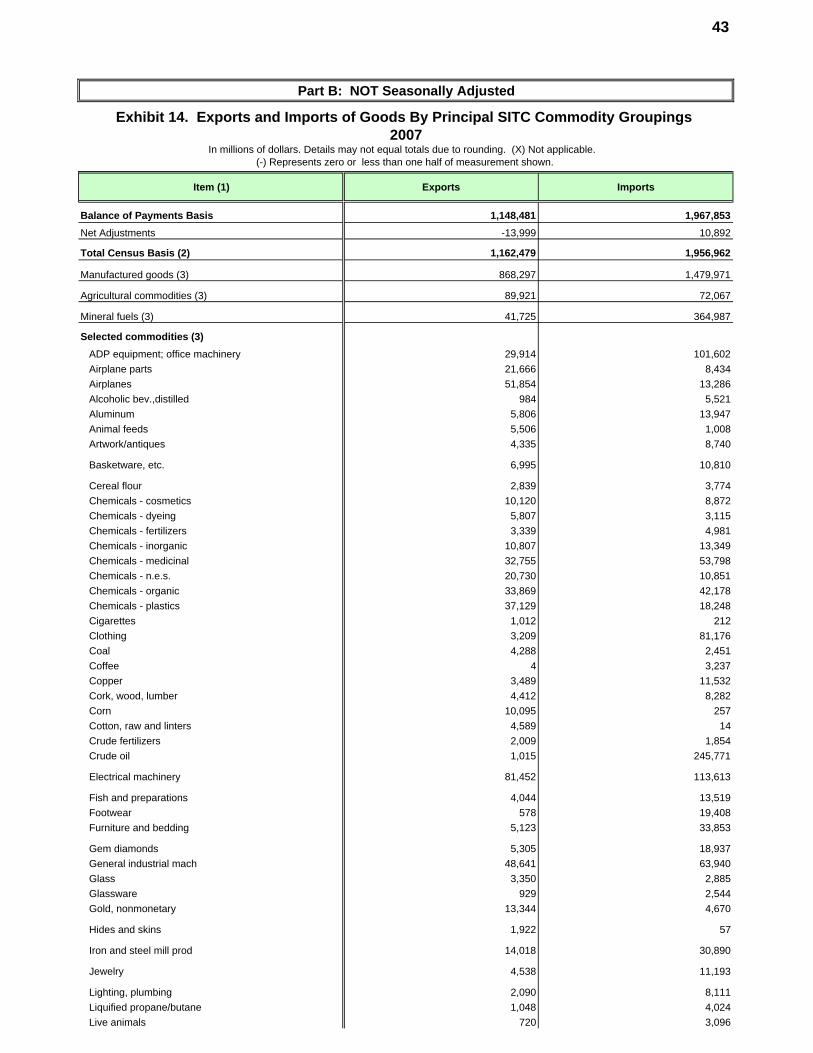
43
Part B: NOT Seasonally Adjusted
Exhibit 14. Exports and Imports of Goods By Principal SITC Commodity Groupings 2007
In millions of dollars. Details may not equal totals due to rounding. (X) Not applicable. (-) Represents zero or less than one half of measurement shown.
Item (1) Exports Imports
Balance of Payments Basis 1,148,481 1,967,853Net Adjustments -13,999 10,892
Total Census Basis (2) 1,162,479 1,956,962
Manufactured goods (3) 868,297 1,479,971
Agricultural commodities (3) 89,921 72,067
Mineral fuels (3) 41,725 364,987
Selected commodities (3)ADP equipment; office machinery 29,914 101,602Airplane parts 21,666 8,434Airplanes 51,854 13,286Alcoholic bev.,distilled 984 5,521Aluminum 5,806 13,947Animal feeds 5,506 1,008Artwork/antiques 4,335 8,740
Basketware, etc. 6,995 10,810
Cereal flour 2,839 3,774Chemicals - cosmetics 10,120 8,872Chemicals - dyeing 5,807 3,115Chemicals - fertilizers 3,339 4,981Chemicals - inorganic 10,807 13,349Chemicals - medicinal 32,755 53,798Chemicals - n.e.s. 20,730 10,851Chemicals - organic 33,869 42,178Chemicals - plastics 37,129 18,248Cigarettes 1,012 212Clothing 3,209 81,176Coal 4,288 2,451Coffee 4 3,237Copper 3,489 11,532Cork, wood, lumber 4,412 8,282Corn 10,095 257Cotton, raw and linters 4,589 14Crude fertilizers 2,009 1,854Crude oil 1,015 245,771
Electrical machinery 81,452 113,613
Fish and preparations 4,044 13,519Footwear 578 19,408Furniture and bedding 5,123 33,853
Gem diamonds 5,305 18,937General industrial mach 48,641 63,940Glass 3,350 2,885Glassware 929 2,544Gold, nonmonetary 13,344 4,670
Hides and skins 1,922 57
Iron and steel mill prod 14,018 30,890
Jewelry 4,538 11,193
Lighting, plumbing 2,090 8,111Liquified propane/butane 1,048 4,024Live animals 720 3,096
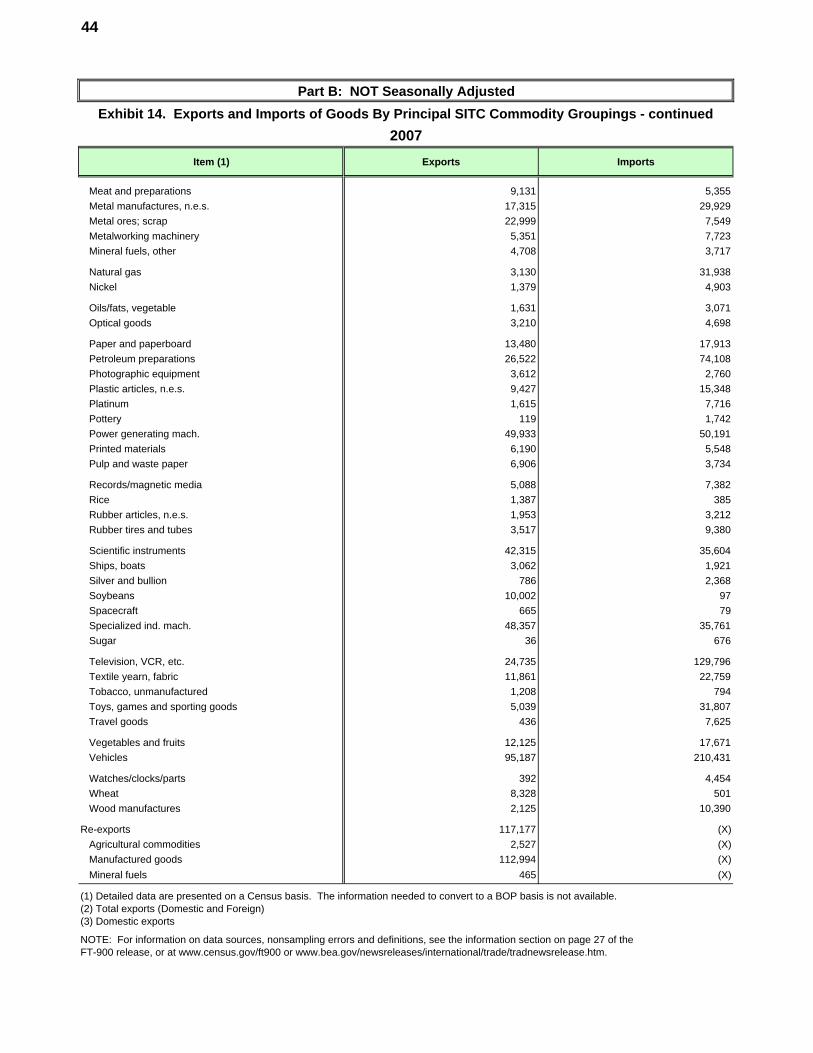
44
Part B: NOT Seasonally AdjustedExhibit 14. Exports and Imports of Goods By Principal SITC Commodity Groupings - continued
2007Item (1) Exports Imports
Meat and preparations 9,131 5,355Metal manufactures, n.e.s. 17,315 29,929Metal ores; scrap 22,999 7,549Metalworking machinery 5,351 7,723Mineral fuels, other 4,708 3,717
Natural gas 3,130 31,938Nickel 1,379 4,903
Oils/fats, vegetable 1,631 3,071Optical goods 3,210 4,698
Paper and paperboard 13,480 17,913Petroleum preparations 26,522 74,108Photographic equipment 3,612 2,760Plastic articles, n.e.s. 9,427 15,348Platinum 1,615 7,716Pottery 119 1,742Power generating mach. 49,933 50,191Printed materials 6,190 5,548Pulp and waste paper 6,906 3,734
Records/magnetic media 5,088 7,382Rice 1,387 385Rubber articles, n.e.s. 1,953 3,212Rubber tires and tubes 3,517 9,380
Scientific instruments 42,315 35,604Ships, boats 3,062 1,921Silver and bullion 786 2,368Soybeans 10,002 97Spacecraft 665 79Specialized ind. mach. 48,357 35,761Sugar 36 676
Television, VCR, etc. 24,735 129,796Textile yearn, fabric 11,861 22,759Tobacco, unmanufactured 1,208 794Toys, games and sporting goods 5,039 31,807Travel goods 436 7,625
Vegetables and fruits 12,125 17,671Vehicles 95,187 210,431
Watches/clocks/parts 392 4,454Wheat 8,328 501Wood manufactures 2,125 10,390
Re-exports 117,177 (X)Agricultural commodities 2,527 (X)Manufactured goods 112,994 (X)Mineral fuels 465 (X)
(1) Detailed data are presented on a Census basis. The information needed to convert to a BOP basis is not available.(2) Total exports (Domestic and Foreign)(3) Domestic exports
NOTE: For information on data sources, nonsampling errors and definitions, see the information section on page 27 of theFT-900 release, or at www.census.gov/ft900 or www.bea.gov/newsreleases/international/trade/tradnewsrelease.htm.
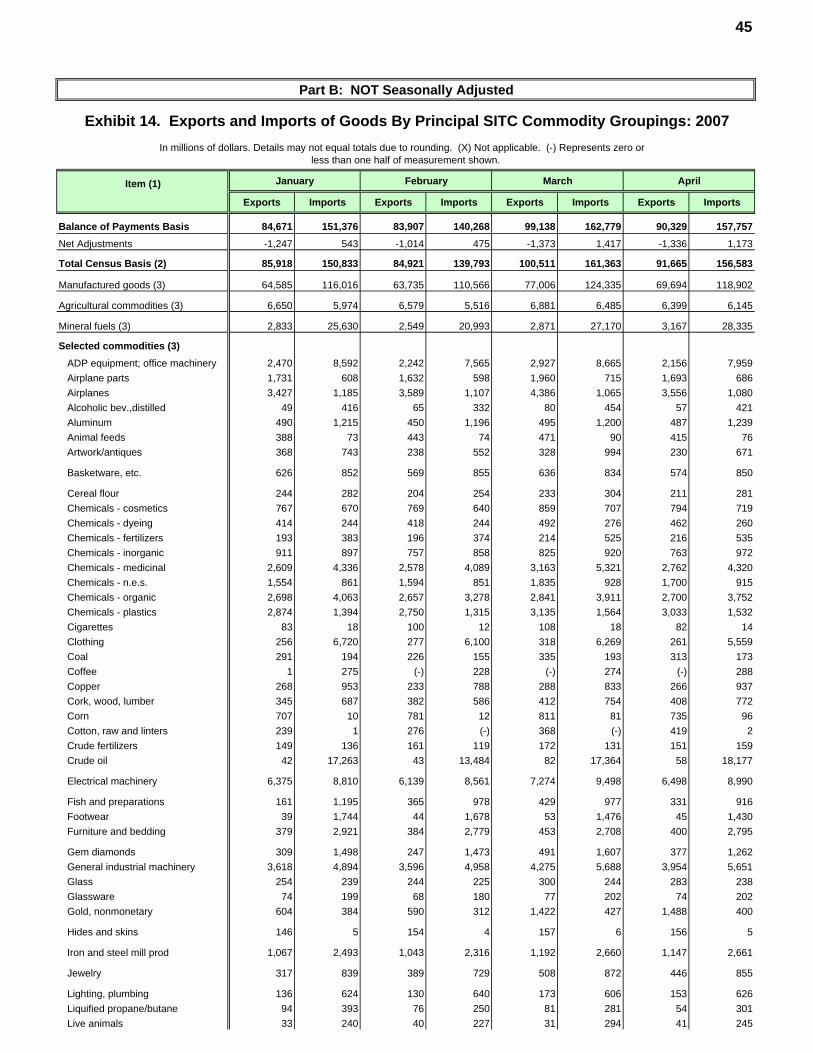
45
Part B: NOT Seasonally Adjusted
Exhibit 14. Exports and Imports of Goods By Principal SITC Commodity Groupings: 2007In millions of dollars. Details may not equal totals due to rounding. (X) Not applicable. (-) Represents zero or
less than one half of measurement shown.
Item (1) January February March April
Exports Imports Exports Imports Exports Imports Exports Imports
Balance of Payments Basis 84,671 151,376 83,907 140,268 99,138 162,779 90,329 157,757Net Adjustments -1,247 543 -1,014 475 -1,373 1,417 -1,336 1,173
Total Census Basis (2) 85,918 150,833 84,921 139,793 100,511 161,363 91,665 156,583
Manufactured goods (3) 64,585 116,016 63,735 110,566 77,006 124,335 69,694 118,902
Agricultural commodities (3) 6,650 5,974 6,579 5,516 6,881 6,485 6,399 6,145
Mineral fuels (3) 2,833 25,630 2,549 20,993 2,871 27,170 3,167 28,335
Selected commodities (3)ADP equipment; office machinery 2,470 8,592 2,242 7,565 2,927 8,665 2,156 7,959Airplane parts 1,731 608 1,632 598 1,960 715 1,693 686Airplanes 3,427 1,185 3,589 1,107 4,386 1,065 3,556 1,080Alcoholic bev.,distilled 49 416 65 332 80 454 57 421Aluminum 490 1,215 450 1,196 495 1,200 487 1,239Animal feeds 388 73 443 74 471 90 415 76Artwork/antiques 368 743 238 552 328 994 230 671
Basketware, etc. 626 852 569 855 636 834 574 850
Cereal flour 244 282 204 254 233 304 211 281Chemicals - cosmetics 767 670 769 640 859 707 794 719Chemicals - dyeing 414 244 418 244 492 276 462 260Chemicals - fertilizers 193 383 196 374 214 525 216 535Chemicals - inorganic 911 897 757 858 825 920 763 972Chemicals - medicinal 2,609 4,336 2,578 4,089 3,163 5,321 2,762 4,320Chemicals - n.e.s. 1,554 861 1,594 851 1,835 928 1,700 915Chemicals - organic 2,698 4,063 2,657 3,278 2,841 3,911 2,700 3,752Chemicals - plastics 2,874 1,394 2,750 1,315 3,135 1,564 3,033 1,532Cigarettes 83 18 100 12 108 18 82 14Clothing 256 6,720 277 6,100 318 6,269 261 5,559Coal 291 194 226 155 335 193 313 173Coffee 1 275 (-) 228 (-) 274 (-) 288Copper 268 953 233 788 288 833 266 937Cork, wood, lumber 345 687 382 586 412 754 408 772Corn 707 10 781 12 811 81 735 96Cotton, raw and linters 239 1 276 (-) 368 (-) 419 2Crude fertilizers 149 136 161 119 172 131 151 159Crude oil 42 17,263 43 13,484 82 17,364 58 18,177
Electrical machinery 6,375 8,810 6,139 8,561 7,274 9,498 6,498 8,990
Fish and preparations 161 1,195 365 978 429 977 331 916Footwear 39 1,744 44 1,678 53 1,476 45 1,430Furniture and bedding 379 2,921 384 2,779 453 2,708 400 2,795
Gem diamonds 309 1,498 247 1,473 491 1,607 377 1,262General industrial machinery 3,618 4,894 3,596 4,958 4,275 5,688 3,954 5,651Glass 254 239 244 225 300 244 283 238Glassware 74 199 68 180 77 202 74 202Gold, nonmonetary 604 384 590 312 1,422 427 1,488 400
Hides and skins 146 5 154 4 157 6 156 5
Iron and steel mill prod 1,067 2,493 1,043 2,316 1,192 2,660 1,147 2,661
Jewelry 317 839 389 729 508 872 446 855
Lighting, plumbing 136 624 130 640 173 606 153 626Liquified propane/butane 94 393 76 250 81 281 54 301Live animals 33 240 40 227 31 294 41 245
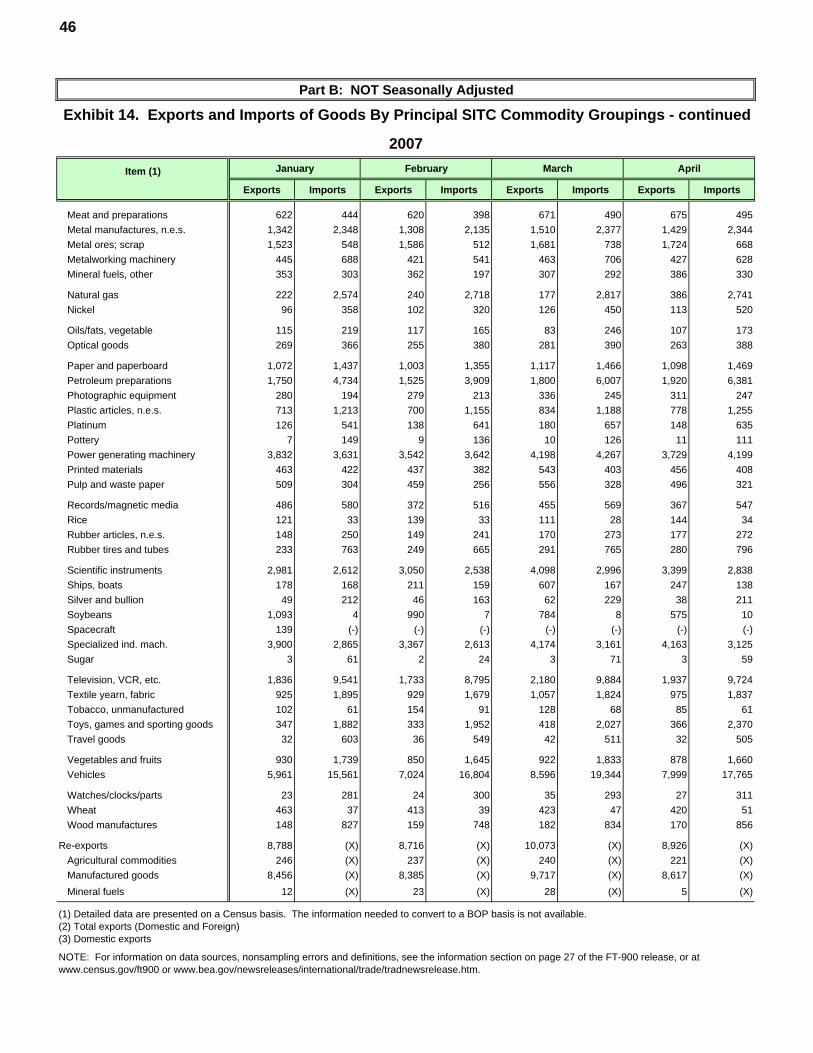
46
Part B: NOT Seasonally Adjusted
Exhibit 14. Exports and Imports of Goods By Principal SITC Commodity Groupings - continued
2007Item (1) January February March April
Exports Imports Exports Imports Exports Imports Exports Imports
Meat and preparations 622 444 620 398 671 490 675 495Metal manufactures, n.e.s. 1,342 2,348 1,308 2,135 1,510 2,377 1,429 2,344Metal ores; scrap 1,523 548 1,586 512 1,681 738 1,724 668Metalworking machinery 445 688 421 541 463 706 427 628Mineral fuels, other 353 303 362 197 307 292 386 330
Natural gas 222 2,574 240 2,718 177 2,817 386 2,741Nickel 96 358 102 320 126 450 113 520
Oils/fats, vegetable 115 219 117 165 83 246 107 173Optical goods 269 366 255 380 281 390 263 388
Paper and paperboard 1,072 1,437 1,003 1,355 1,117 1,466 1,098 1,469Petroleum preparations 1,750 4,734 1,525 3,909 1,800 6,007 1,920 6,381Photographic equipment 280 194 279 213 336 245 311 247Plastic articles, n.e.s. 713 1,213 700 1,155 834 1,188 778 1,255Platinum 126 541 138 641 180 657 148 635Pottery 7 149 9 136 10 126 11 111Power generating machinery 3,832 3,631 3,542 3,642 4,198 4,267 3,729 4,199Printed materials 463 422 437 382 543 403 456 408Pulp and waste paper 509 304 459 256 556 328 496 321
Records/magnetic media 486 580 372 516 455 569 367 547Rice 121 33 139 33 111 28 144 34Rubber articles, n.e.s. 148 250 149 241 170 273 177 272Rubber tires and tubes 233 763 249 665 291 765 280 796
Scientific instruments 2,981 2,612 3,050 2,538 4,098 2,996 3,399 2,838Ships, boats 178 168 211 159 607 167 247 138Silver and bullion 49 212 46 163 62 229 38 211Soybeans 1,093 4 990 7 784 8 575 10Spacecraft 139 (-) (-) (-) (-) (-) (-) (-)Specialized ind. mach. 3,900 2,865 3,367 2,613 4,174 3,161 4,163 3,125Sugar 3 61 2 24 3 71 3 59
Television, VCR, etc. 1,836 9,541 1,733 8,795 2,180 9,884 1,937 9,724Textile yearn, fabric 925 1,895 929 1,679 1,057 1,824 975 1,837Tobacco, unmanufactured 102 61 154 91 128 68 85 61Toys, games and sporting goods 347 1,882 333 1,952 418 2,027 366 2,370Travel goods 32 603 36 549 42 511 32 505
Vegetables and fruits 930 1,739 850 1,645 922 1,833 878 1,660Vehicles 5,961 15,561 7,024 16,804 8,596 19,344 7,999 17,765
Watches/clocks/parts 23 281 24 300 35 293 27 311Wheat 463 37 413 39 423 47 420 51Wood manufactures 148 827 159 748 182 834 170 856
Re-exports 8,788 (X) 8,716 (X) 10,073 (X) 8,926 (X)Agricultural commodities 246 (X) 237 (X) 240 (X) 221 (X)Manufactured goods 8,456 (X) 8,385 (X) 9,717 (X) 8,617 (X)Mineral fuels 12 (X) 23 (X) 28 (X) 5 (X)
(1) Detailed data are presented on a Census basis. The information needed to convert to a BOP basis is not available.(2) Total exports (Domestic and Foreign)(3) Domestic exports
NOTE: For information on data sources, nonsampling errors and definitions, see the information section on page 27 of the FT-900 release, or atwww.census.gov/ft900 or www.bea.gov/newsreleases/international/trade/tradnewsrelease.htm.
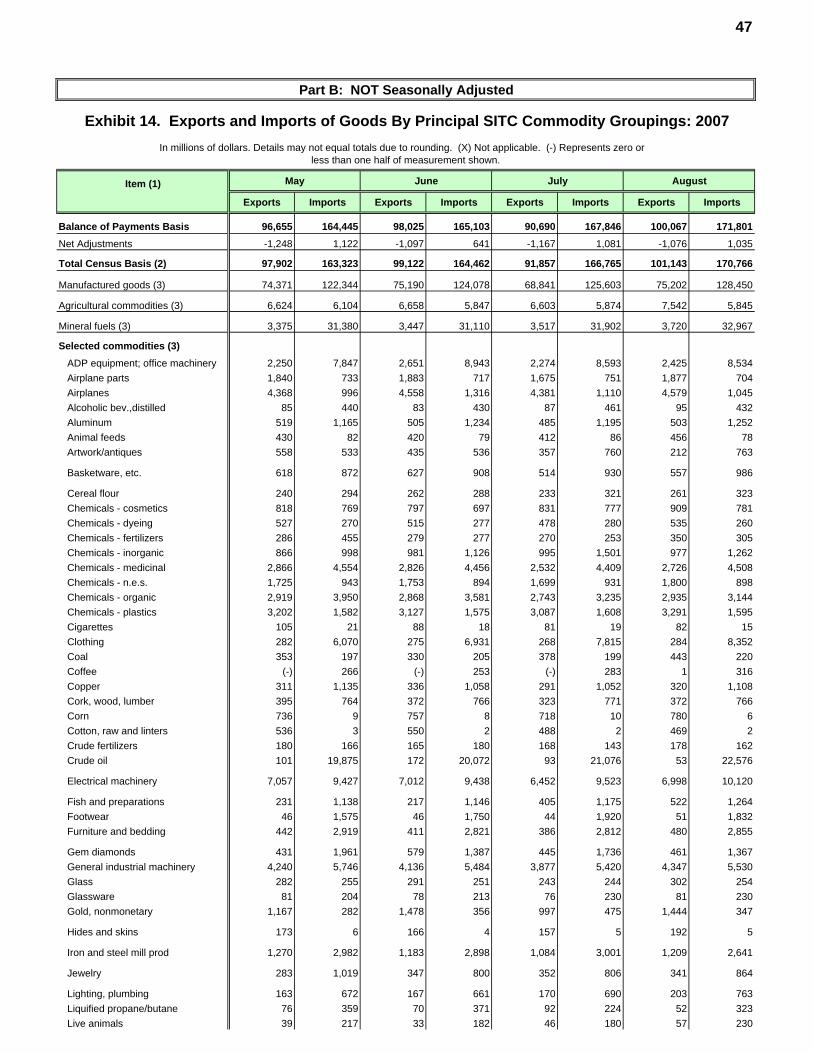
47
Part B: NOT Seasonally Adjusted
Exhibit 14. Exports and Imports of Goods By Principal SITC Commodity Groupings: 2007In millions of dollars. Details may not equal totals due to rounding. (X) Not applicable. (-) Represents zero or
less than one half of measurement shown.
Item (1) May June July August
Exports Imports Exports Imports Exports Imports Exports Imports
Balance of Payments Basis 96,655 164,445 98,025 165,103 90,690 167,846 100,067 171,801Net Adjustments -1,248 1,122 -1,097 641 -1,167 1,081 -1,076 1,035
Total Census Basis (2) 97,902 163,323 99,122 164,462 91,857 166,765 101,143 170,766
Manufactured goods (3) 74,371 122,344 75,190 124,078 68,841 125,603 75,202 128,450
Agricultural commodities (3) 6,624 6,104 6,658 5,847 6,603 5,874 7,542 5,845
Mineral fuels (3) 3,375 31,380 3,447 31,110 3,517 31,902 3,720 32,967
Selected commodities (3)ADP equipment; office machinery 2,250 7,847 2,651 8,943 2,274 8,593 2,425 8,534Airplane parts 1,840 733 1,883 717 1,675 751 1,877 704Airplanes 4,368 996 4,558 1,316 4,381 1,110 4,579 1,045Alcoholic bev.,distilled 85 440 83 430 87 461 95 432Aluminum 519 1,165 505 1,234 485 1,195 503 1,252Animal feeds 430 82 420 79 412 86 456 78Artwork/antiques 558 533 435 536 357 760 212 763
Basketware, etc. 618 872 627 908 514 930 557 986
Cereal flour 240 294 262 288 233 321 261 323Chemicals - cosmetics 818 769 797 697 831 777 909 781Chemicals - dyeing 527 270 515 277 478 280 535 260Chemicals - fertilizers 286 455 279 277 270 253 350 305Chemicals - inorganic 866 998 981 1,126 995 1,501 977 1,262Chemicals - medicinal 2,866 4,554 2,826 4,456 2,532 4,409 2,726 4,508Chemicals - n.e.s. 1,725 943 1,753 894 1,699 931 1,800 898Chemicals - organic 2,919 3,950 2,868 3,581 2,743 3,235 2,935 3,144Chemicals - plastics 3,202 1,582 3,127 1,575 3,087 1,608 3,291 1,595Cigarettes 105 21 88 18 81 19 82 15Clothing 282 6,070 275 6,931 268 7,815 284 8,352Coal 353 197 330 205 378 199 443 220Coffee (-) 266 (-) 253 (-) 283 1 316Copper 311 1,135 336 1,058 291 1,052 320 1,108Cork, wood, lumber 395 764 372 766 323 771 372 766Corn 736 9 757 8 718 10 780 6Cotton, raw and linters 536 3 550 2 488 2 469 2Crude fertilizers 180 166 165 180 168 143 178 162Crude oil 101 19,875 172 20,072 93 21,076 53 22,576
Electrical machinery 7,057 9,427 7,012 9,438 6,452 9,523 6,998 10,120
Fish and preparations 231 1,138 217 1,146 405 1,175 522 1,264Footwear 46 1,575 46 1,750 44 1,920 51 1,832Furniture and bedding 442 2,919 411 2,821 386 2,812 480 2,855
Gem diamonds 431 1,961 579 1,387 445 1,736 461 1,367General industrial machinery 4,240 5,746 4,136 5,484 3,877 5,420 4,347 5,530Glass 282 255 291 251 243 244 302 254Glassware 81 204 78 213 76 230 81 230Gold, nonmonetary 1,167 282 1,478 356 997 475 1,444 347
Hides and skins 173 6 166 4 157 5 192 5
Iron and steel mill prod 1,270 2,982 1,183 2,898 1,084 3,001 1,209 2,641
Jewelry 283 1,019 347 800 352 806 341 864
Lighting, plumbing 163 672 167 661 170 690 203 763Liquified propane/butane 76 359 70 371 92 224 52 323Live animals 39 217 33 182 46 180 57 230
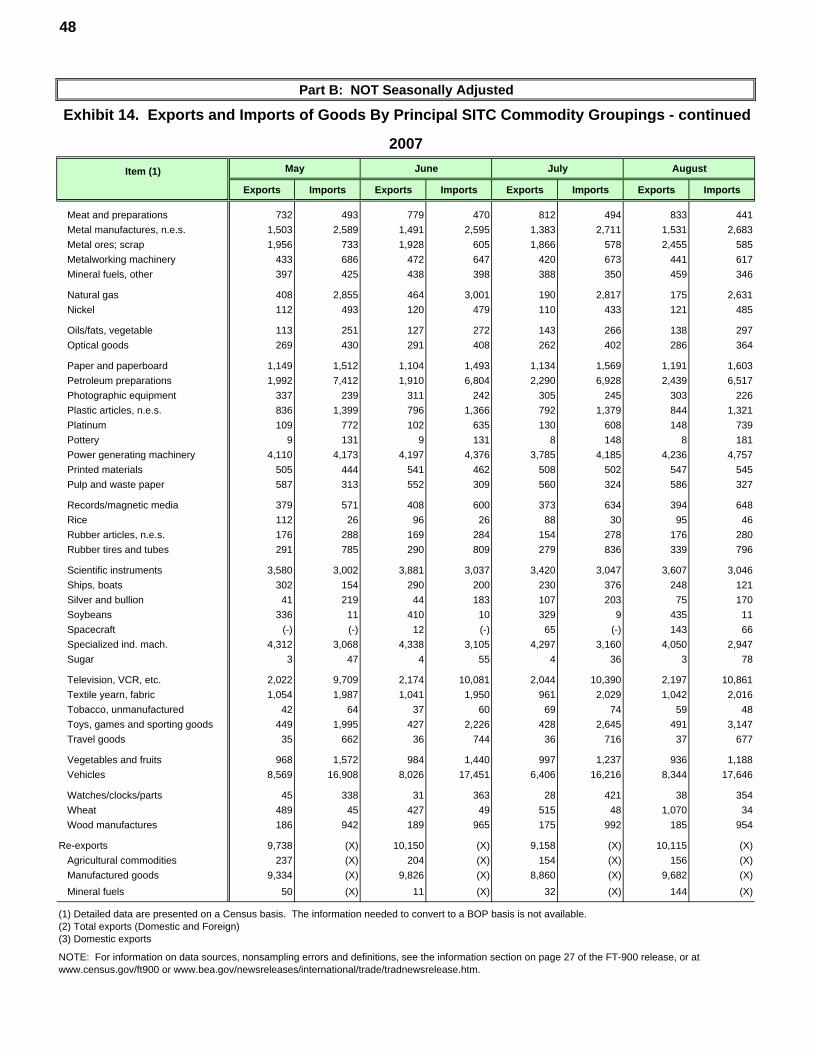
48
Part B: NOT Seasonally Adjusted
Exhibit 14. Exports and Imports of Goods By Principal SITC Commodity Groupings - continued
2007Item (1) May June July August
Exports Imports Exports Imports Exports Imports Exports Imports
Meat and preparations 732 493 779 470 812 494 833 441Metal manufactures, n.e.s. 1,503 2,589 1,491 2,595 1,383 2,711 1,531 2,683Metal ores; scrap 1,956 733 1,928 605 1,866 578 2,455 585Metalworking machinery 433 686 472 647 420 673 441 617Mineral fuels, other 397 425 438 398 388 350 459 346
Natural gas 408 2,855 464 3,001 190 2,817 175 2,631Nickel 112 493 120 479 110 433 121 485
Oils/fats, vegetable 113 251 127 272 143 266 138 297Optical goods 269 430 291 408 262 402 286 364
Paper and paperboard 1,149 1,512 1,104 1,493 1,134 1,569 1,191 1,603Petroleum preparations 1,992 7,412 1,910 6,804 2,290 6,928 2,439 6,517Photographic equipment 337 239 311 242 305 245 303 226Plastic articles, n.e.s. 836 1,399 796 1,366 792 1,379 844 1,321Platinum 109 772 102 635 130 608 148 739Pottery 9 131 9 131 8 148 8 181Power generating machinery 4,110 4,173 4,197 4,376 3,785 4,185 4,236 4,757Printed materials 505 444 541 462 508 502 547 545Pulp and waste paper 587 313 552 309 560 324 586 327
Records/magnetic media 379 571 408 600 373 634 394 648Rice 112 26 96 26 88 30 95 46Rubber articles, n.e.s. 176 288 169 284 154 278 176 280Rubber tires and tubes 291 785 290 809 279 836 339 796
Scientific instruments 3,580 3,002 3,881 3,037 3,420 3,047 3,607 3,046Ships, boats 302 154 290 200 230 376 248 121Silver and bullion 41 219 44 183 107 203 75 170Soybeans 336 11 410 10 329 9 435 11Spacecraft (-) (-) 12 (-) 65 (-) 143 66Specialized ind. mach. 4,312 3,068 4,338 3,105 4,297 3,160 4,050 2,947Sugar 3 47 4 55 4 36 3 78
Television, VCR, etc. 2,022 9,709 2,174 10,081 2,044 10,390 2,197 10,861Textile yearn, fabric 1,054 1,987 1,041 1,950 961 2,029 1,042 2,016Tobacco, unmanufactured 42 64 37 60 69 74 59 48Toys, games and sporting goods 449 1,995 427 2,226 428 2,645 491 3,147Travel goods 35 662 36 744 36 716 37 677
Vegetables and fruits 968 1,572 984 1,440 997 1,237 936 1,188Vehicles 8,569 16,908 8,026 17,451 6,406 16,216 8,344 17,646
Watches/clocks/parts 45 338 31 363 28 421 38 354Wheat 489 45 427 49 515 48 1,070 34Wood manufactures 186 942 189 965 175 992 185 954
Re-exports 9,738 (X) 10,150 (X) 9,158 (X) 10,115 (X)Agricultural commodities 237 (X) 204 (X) 154 (X) 156 (X)Manufactured goods 9,334 (X) 9,826 (X) 8,860 (X) 9,682 (X)Mineral fuels 50 (X) 11 (X) 32 (X) 144 (X)
(1) Detailed data are presented on a Census basis. The information needed to convert to a BOP basis is not available.(2) Total exports (Domestic and Foreign)(3) Domestic exports
NOTE: For information on data sources, nonsampling errors and definitions, see the information section on page 27 of the FT-900 release, or atwww.census.gov/ft900 or www.bea.gov/newsreleases/international/trade/tradnewsrelease.htm.
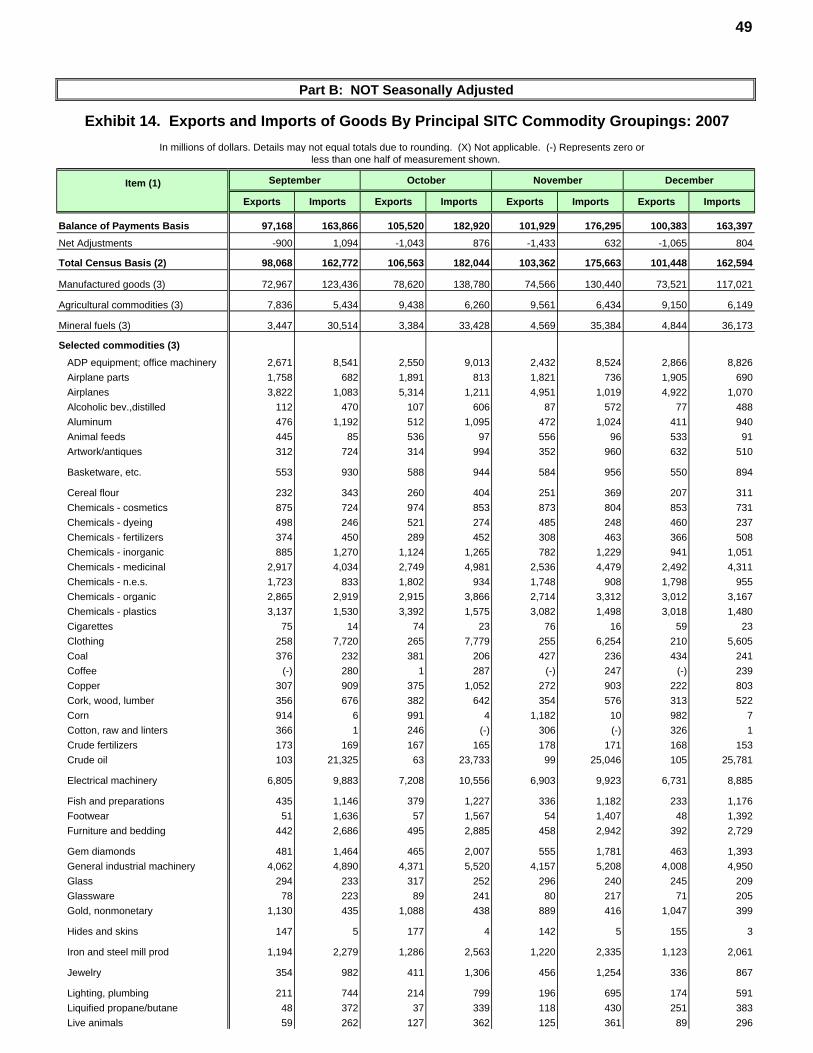
49
Part B: NOT Seasonally Adjusted
Exhibit 14. Exports and Imports of Goods By Principal SITC Commodity Groupings: 2007In millions of dollars. Details may not equal totals due to rounding. (X) Not applicable. (-) Represents zero or
less than one half of measurement shown.
Item (1) September October November December
Exports Imports Exports Imports Exports Imports Exports Imports
Balance of Payments Basis 97,168 163,866 105,520 182,920 101,929 176,295 100,383 163,397Net Adjustments -900 1,094 -1,043 876 -1,433 632 -1,065 804
Total Census Basis (2) 98,068 162,772 106,563 182,044 103,362 175,663 101,448 162,594
Manufactured goods (3) 72,967 123,436 78,620 138,780 74,566 130,440 73,521 117,021
Agricultural commodities (3) 7,836 5,434 9,438 6,260 9,561 6,434 9,150 6,149
Mineral fuels (3) 3,447 30,514 3,384 33,428 4,569 35,384 4,844 36,173
Selected commodities (3)ADP equipment; office machinery 2,671 8,541 2,550 9,013 2,432 8,524 2,866 8,826Airplane parts 1,758 682 1,891 813 1,821 736 1,905 690Airplanes 3,822 1,083 5,314 1,211 4,951 1,019 4,922 1,070Alcoholic bev.,distilled 112 470 107 606 87 572 77 488Aluminum 476 1,192 512 1,095 472 1,024 411 940Animal feeds 445 85 536 97 556 96 533 91Artwork/antiques 312 724 314 994 352 960 632 510
Basketware, etc. 553 930 588 944 584 956 550 894
Cereal flour 232 343 260 404 251 369 207 311Chemicals - cosmetics 875 724 974 853 873 804 853 731Chemicals - dyeing 498 246 521 274 485 248 460 237Chemicals - fertilizers 374 450 289 452 308 463 366 508Chemicals - inorganic 885 1,270 1,124 1,265 782 1,229 941 1,051Chemicals - medicinal 2,917 4,034 2,749 4,981 2,536 4,479 2,492 4,311Chemicals - n.e.s. 1,723 833 1,802 934 1,748 908 1,798 955Chemicals - organic 2,865 2,919 2,915 3,866 2,714 3,312 3,012 3,167Chemicals - plastics 3,137 1,530 3,392 1,575 3,082 1,498 3,018 1,480Cigarettes 75 14 74 23 76 16 59 23Clothing 258 7,720 265 7,779 255 6,254 210 5,605Coal 376 232 381 206 427 236 434 241Coffee (-) 280 1 287 (-) 247 (-) 239Copper 307 909 375 1,052 272 903 222 803Cork, wood, lumber 356 676 382 642 354 576 313 522Corn 914 6 991 4 1,182 10 982 7Cotton, raw and linters 366 1 246 (-) 306 (-) 326 1Crude fertilizers 173 169 167 165 178 171 168 153Crude oil 103 21,325 63 23,733 99 25,046 105 25,781
Electrical machinery 6,805 9,883 7,208 10,556 6,903 9,923 6,731 8,885
Fish and preparations 435 1,146 379 1,227 336 1,182 233 1,176Footwear 51 1,636 57 1,567 54 1,407 48 1,392Furniture and bedding 442 2,686 495 2,885 458 2,942 392 2,729
Gem diamonds 481 1,464 465 2,007 555 1,781 463 1,393General industrial machinery 4,062 4,890 4,371 5,520 4,157 5,208 4,008 4,950Glass 294 233 317 252 296 240 245 209Glassware 78 223 89 241 80 217 71 205Gold, nonmonetary 1,130 435 1,088 438 889 416 1,047 399
Hides and skins 147 5 177 4 142 5 155 3
Iron and steel mill prod 1,194 2,279 1,286 2,563 1,220 2,335 1,123 2,061
Jewelry 354 982 411 1,306 456 1,254 336 867
Lighting, plumbing 211 744 214 799 196 695 174 591Liquified propane/butane 48 372 37 339 118 430 251 383Live animals 59 262 127 362 125 361 89 296

50
Part B: NOT Seasonally Adjusted
Exhibit 14. Exports and Imports of Goods By Principal SITC Commodity Groupings - continued
2007Item (1) September October November December
Exports Imports Exports Imports Exports Imports Exports Imports
Meat and preparations 806 388 913 442 899 386 768 414Metal manufactures, n.e.s. 1,429 2,477 1,585 2,766 1,470 2,547 1,332 2,359Metal ores; scrap 1,890 587 2,321 640 2,139 630 1,930 726Metalworking machinery 461 575 459 658 453 630 456 674Mineral fuels, other 399 282 432 294 420 270 368 231
Natural gas 242 2,017 128 2,295 168 2,470 328 3,002Nickel 115 341 130 338 108 371 125 315
Oils/fats, vegetable 138 250 128 258 151 388 270 286Optical goods 263 360 267 420 249 413 257 376
Paper and paperboard 1,140 1,511 1,260 1,624 1,161 1,498 1,053 1,376Petroleum preparations 2,165 6,086 2,258 6,362 3,245 6,694 3,228 6,274Photographic equipment 273 225 315 244 289 229 273 210Plastic articles, n.e.s. 799 1,257 854 1,341 781 1,295 699 1,179Platinum 138 683 120 591 138 603 138 612Pottery 10 168 13 176 14 152 10 135Power generating machinery 4,214 4,226 4,871 4,672 4,799 4,346 4,418 3,716Printed materials 538 507 588 549 547 489 516 434Pulp and waste paper 604 323 640 313 635 347 723 268
Records/magnetic media 458 665 475 764 457 689 463 601Rice 83 28 121 25 145 43 131 33Rubber articles, n.e.s. 166 253 172 285 157 267 139 241Rubber tires and tubes 310 743 371 800 318 818 267 805
Scientific instruments 3,567 2,991 3,589 3,337 3,399 3,166 3,744 2,995Ships, boats 147 97 175 154 204 111 224 76Silver and bullion 103 185 64 220 81 223 77 150Soybeans 572 5 1,381 6 1,378 6 1,720 11Spacecraft 1 6 118 (-) (-) (-) 186 6Specialized ind. mach. 3,880 2,662 4,118 3,082 3,717 2,878 4,041 3,095Sugar 2 65 4 69 3 52 2 59
Television, VCR, etc. 2,168 11,762 2,183 13,826 2,079 14,151 2,180 11,072Textile yearn, fabric 992 1,869 1,070 2,042 969 1,863 847 1,767Tobacco, unmanufactured 66 37 105 39 189 118 171 75Toys, games and sporting goods 479 3,421 466 4,195 441 3,390 395 2,556Travel goods 37 646 45 752 34 662 34 598
Vegetables and fruits 976 1,091 1,280 1,276 1,283 1,422 1,119 1,569Vehicles 8,352 16,708 9,164 20,001 9,047 19,298 7,698 16,730
Watches/clocks/parts 29 426 36 500 38 474 39 391Wheat 1,217 34 1,158 36 929 42 805 41Wood manufactures 174 878 197 885 195 814 164 695
Re-exports 9,925 (X) 10,789 (X) 10,607 (X) 10,191 (X)Agricultural commodities 162 (X) 209 (X) 226 (X) 235 (X)Manufactured goods 9,647 (X) 10,417 (X) 10,235 (X) 9,817 (X)Mineral fuels 15 (X) 58 (X) 44 (X) 44 (X)
(1) Detailed data are presented on a Census basis. The information needed to convert to a BOP basis is not available.(2) Total exports (Domestic and Foreign)(3) Domestic exports
NOTE: For information on data sources, nonsampling errors and definitions, see the information section on page 27 of the FT-900 release, or atwww.census.gov/ft900 or www.bea.gov/newsreleases/international/trade/tradnewsrelease.htm.
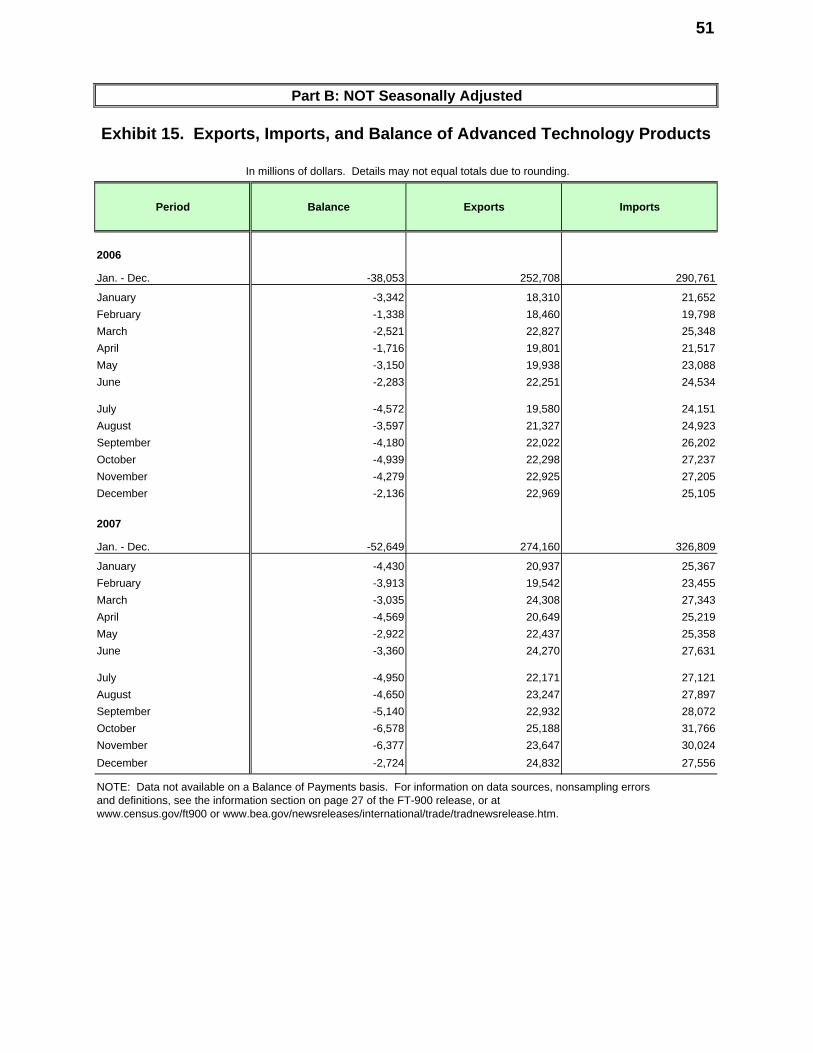
51
Part B: NOT Seasonally Adjusted
Exhibit 15. Exports, Imports, and Balance of Advanced Technology Products
In millions of dollars. Details may not equal totals due to rounding.
Period Balance Exports Imports
2006
Jan. - Dec. -38,053 252,708 290,761
January -3,342 18,310 21,652February -1,338 18,460 19,798March -2,521 22,827 25,348April -1,716 19,801 21,517May -3,150 19,938 23,088June -2,283 22,251 24,534
July -4,572 19,580 24,151August -3,597 21,327 24,923September -4,180 22,022 26,202October -4,939 22,298 27,237November -4,279 22,925 27,205December -2,136 22,969 25,105
2007
Jan. - Dec. -52,649 274,160 326,809
January -4,430 20,937 25,367February -3,913 19,542 23,455March -3,035 24,308 27,343April -4,569 20,649 25,219May -2,922 22,437 25,358June -3,360 24,270 27,631
July -4,950 22,171 27,121August -4,650 23,247 27,897September -5,140 22,932 28,072October -6,578 25,188 31,766November -6,377 23,647 30,024December -2,724 24,832 27,556
NOTE: Data not available on a Balance of Payments basis. For information on data sources, nonsampling errorsand definitions, see the information section on page 27 of the FT-900 release, or atwww.census.gov/ft900 or www.bea.gov/newsreleases/international/trade/tradnewsrelease.htm.
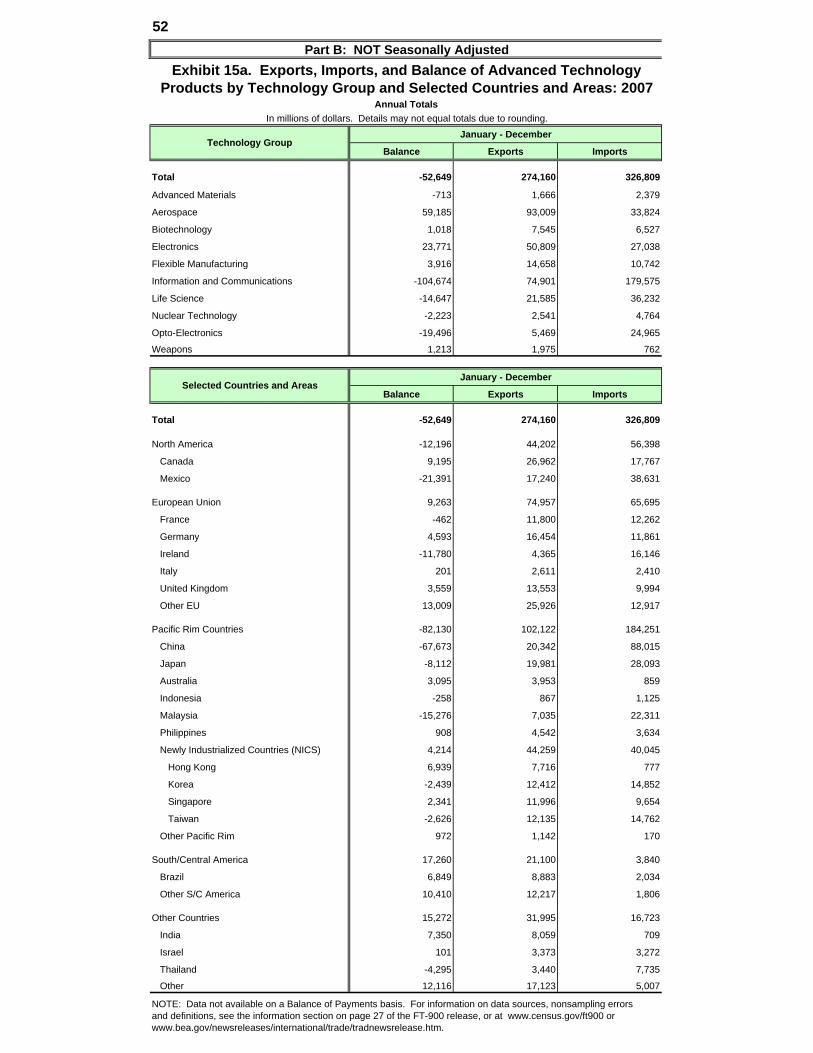
52Part B: NOT Seasonally Adjusted
Exhibit 15a. Exports, Imports, and Balance of Advanced Technology Products by Technology Group and Selected Countries and Areas: 2007
Annual TotalsIn millions of dollars. Details may not equal totals due to rounding.
January - December
Balance Exports Imports
Total -52,649 274,160 326,809
Advanced Materials -713 1,666 2,379
Aerospace 59,185 93,009 33,824
Biotechnology 1,018 7,545 6,527
Electronics 23,771 50,809 27,038
Flexible Manufacturing 3,916 14,658 10,742
Information and Communications -104,674 74,901 179,575
Life Science -14,647 21,585 36,232
Nuclear Technology -2,223 2,541 4,764
Opto-Electronics -19,496 5,469 24,965
Weapons 1,213 1,975 762
January - December
Balance Exports Imports
Total -52,649 274,160 326,809
North America -12,196 44,202 56,398
Canada 9,195 26,962 17,767
Mexico -21,391 17,240 38,631
European Union 9,263 74,957 65,695
France -462 11,800 12,262
Germany 4,593 16,454 11,861
Ireland -11,780 4,365 16,146
Italy 201 2,611 2,410
United Kingdom 3,559 13,553 9,994
Other EU 13,009 25,926 12,917
Pacific Rim Countries -82,130 102,122 184,251
China -67,673 20,342 88,015
Japan -8,112 19,981 28,093
Australia 3,095 3,953 859
Indonesia -258 867 1,125
Malaysia -15,276 7,035 22,311
Philippines 908 4,542 3,634
Newly Industrialized Countries (NICS) 4,214 44,259 40,045
Hong Kong 6,939 7,716 777
Korea -2,439 12,412 14,852
Singapore 2,341 11,996 9,654
Taiwan -2,626 12,135 14,762
Other Pacific Rim 972 1,142 170
South/Central America 17,260 21,100 3,840
Brazil 6,849 8,883 2,034
Other S/C America 10,410 12,217 1,806
Other Countries 15,272 31,995 16,723
India 7,350 8,059 709
Israel 101 3,373 3,272
Thailand -4,295 3,440 7,735
Other 12,116 17,123 5,007
NOTE: Data not available on a Balance of Payments basis. For information on data sources, nonsampling errors and definitions, see the information section on page 27 of the FT-900 release, or at www.census.gov/ft900 orwww.bea.gov/newsreleases/international/trade/tradnewsrelease.htm.
Technology Group
Selected Countries and Areas
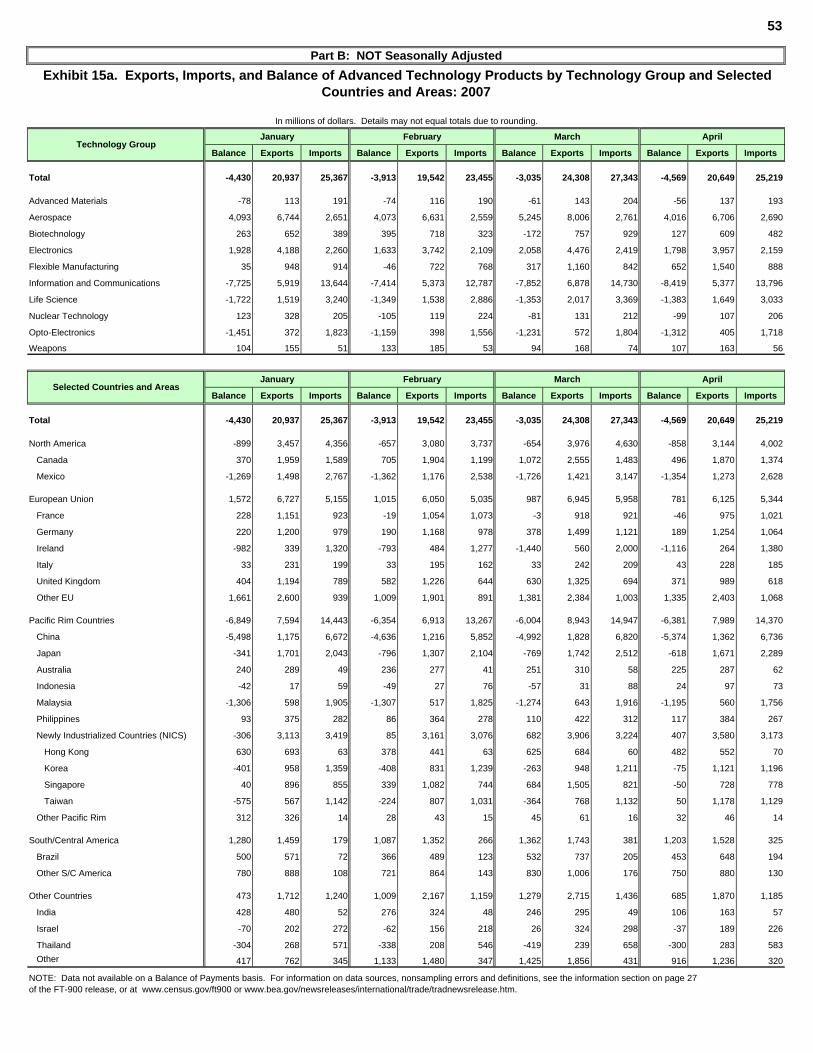
53
Part B: NOT Seasonally AdjustedExhibit 15a. Exports, Imports, and Balance of Advanced Technology Products by Technology Group and Selected
Countries and Areas: 2007
In millions of dollars. Details may not equal totals due to rounding.
January February March April
Balance Exports Imports Balance Exports Imports Balance Exports Imports Balance Exports Imports
Total -4,430 20,937 25,367 -3,913 19,542 23,455 -3,035 24,308 27,343 -4,569 20,649 25,219
Advanced Materials -78 113 191 -74 116 190 -61 143 204 -56 137 193
Aerospace 4,093 6,744 2,651 4,073 6,631 2,559 5,245 8,006 2,761 4,016 6,706 2,690
Biotechnology 263 652 389 395 718 323 -172 757 929 127 609 482
Electronics 1,928 4,188 2,260 1,633 3,742 2,109 2,058 4,476 2,419 1,798 3,957 2,159
Flexible Manufacturing 35 948 914 -46 722 768 317 1,160 842 652 1,540 888
Information and Communications -7,725 5,919 13,644 -7,414 5,373 12,787 -7,852 6,878 14,730 -8,419 5,377 13,796
Life Science -1,722 1,519 3,240 -1,349 1,538 2,886 -1,353 2,017 3,369 -1,383 1,649 3,033
Nuclear Technology 123 328 205 -105 119 224 -81 131 212 -99 107 206
Opto-Electronics -1,451 372 1,823 -1,159 398 1,556 -1,231 572 1,804 -1,312 405 1,718
Weapons 104 155 51 133 185 53 94 168 74 107 163 56
January February March April
Balance Exports Imports Balance Exports Imports Balance Exports Imports Balance Exports Imports
Total -4,430 20,937 25,367 -3,913 19,542 23,455 -3,035 24,308 27,343 -4,569 20,649 25,219
North America -899 3,457 4,356 -657 3,080 3,737 -654 3,976 4,630 -858 3,144 4,002
Canada 370 1,959 1,589 705 1,904 1,199 1,072 2,555 1,483 496 1,870 1,374
Mexico -1,269 1,498 2,767 -1,362 1,176 2,538 -1,726 1,421 3,147 -1,354 1,273 2,628
European Union 1,572 6,727 5,155 1,015 6,050 5,035 987 6,945 5,958 781 6,125 5,344
France 228 1,151 923 -19 1,054 1,073 -3 918 921 -46 975 1,021
Germany 220 1,200 979 190 1,168 978 378 1,499 1,121 189 1,254 1,064
Ireland -982 339 1,320 -793 484 1,277 -1,440 560 2,000 -1,116 264 1,380
Italy 33 231 199 33 195 162 33 242 209 43 228 185
United Kingdom 404 1,194 789 582 1,226 644 630 1,325 694 371 989 618
Other EU 1,661 2,600 939 1,009 1,901 891 1,381 2,384 1,003 1,335 2,403 1,068
Pacific Rim Countries -6,849 7,594 14,443 -6,354 6,913 13,267 -6,004 8,943 14,947 -6,381 7,989 14,370
China -5,498 1,175 6,672 -4,636 1,216 5,852 -4,992 1,828 6,820 -5,374 1,362 6,736
Japan -341 1,701 2,043 -796 1,307 2,104 -769 1,742 2,512 -618 1,671 2,289
Australia 240 289 49 236 277 41 251 310 58 225 287 62
Indonesia -42 17 59 -49 27 76 -57 31 88 24 97 73
Malaysia -1,306 598 1,905 -1,307 517 1,825 -1,274 643 1,916 -1,195 560 1,756
Philippines 93 375 282 86 364 278 110 422 312 117 384 267
Newly Industrialized Countries (NICS) -306 3,113 3,419 85 3,161 3,076 682 3,906 3,224 407 3,580 3,173
Hong Kong 630 693 63 378 441 63 625 684 60 482 552 70
Korea -401 958 1,359 -408 831 1,239 -263 948 1,211 -75 1,121 1,196
Singapore 40 896 855 339 1,082 744 684 1,505 821 -50 728 778
Taiwan -575 567 1,142 -224 807 1,031 -364 768 1,132 50 1,178 1,129
Other Pacific Rim 312 326 14 28 43 15 45 61 16 32 46 14
South/Central America 1,280 1,459 179 1,087 1,352 266 1,362 1,743 381 1,203 1,528 325
Brazil 500 571 72 366 489 123 532 737 205 453 648 194
Other S/C America 780 888 108 721 864 143 830 1,006 176 750 880 130
Other Countries 473 1,712 1,240 1,009 2,167 1,159 1,279 2,715 1,436 685 1,870 1,185
India 428 480 52 276 324 48 246 295 49 106 163 57
Israel -70 202 272 -62 156 218 26 324 298 -37 189 226
Thailand -304 268 571 -338 208 546 -419 239 658 -300 283 583Other 417 762 345 1,133 1,480 347 1,425 1,856 431 916 1,236 320
NOTE: Data not available on a Balance of Payments basis. For information on data sources, nonsampling errors and definitions, see the information section on page 27 of the FT-900 release, or at www.census.gov/ft900 or www.bea.gov/newsreleases/international/trade/tradnewsrelease.htm.
Technology Group
Selected Countries and Areas
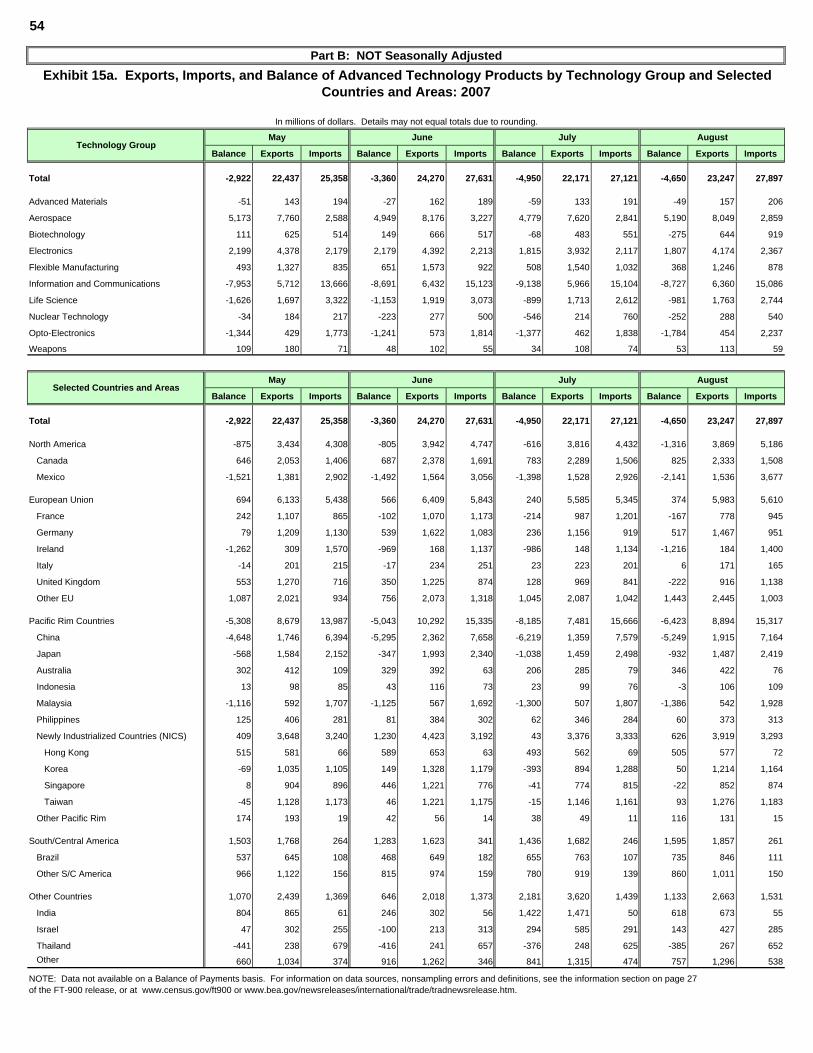
54
Part B: NOT Seasonally AdjustedExhibit 15a. Exports, Imports, and Balance of Advanced Technology Products by Technology Group and Selected
Countries and Areas: 2007
In millions of dollars. Details may not equal totals due to rounding.
May June July August
Balance Exports Imports Balance Exports Imports Balance Exports Imports Balance Exports Imports
Total -2,922 22,437 25,358 -3,360 24,270 27,631 -4,950 22,171 27,121 -4,650 23,247 27,897
Advanced Materials -51 143 194 -27 162 189 -59 133 191 -49 157 206
Aerospace 5,173 7,760 2,588 4,949 8,176 3,227 4,779 7,620 2,841 5,190 8,049 2,859
Biotechnology 111 625 514 149 666 517 -68 483 551 -275 644 919
Electronics 2,199 4,378 2,179 2,179 4,392 2,213 1,815 3,932 2,117 1,807 4,174 2,367
Flexible Manufacturing 493 1,327 835 651 1,573 922 508 1,540 1,032 368 1,246 878
Information and Communications -7,953 5,712 13,666 -8,691 6,432 15,123 -9,138 5,966 15,104 -8,727 6,360 15,086
Life Science -1,626 1,697 3,322 -1,153 1,919 3,073 -899 1,713 2,612 -981 1,763 2,744
Nuclear Technology -34 184 217 -223 277 500 -546 214 760 -252 288 540
Opto-Electronics -1,344 429 1,773 -1,241 573 1,814 -1,377 462 1,838 -1,784 454 2,237
Weapons 109 180 71 48 102 55 34 108 74 53 113 59
May June July August
Balance Exports Imports Balance Exports Imports Balance Exports Imports Balance Exports Imports
Total -2,922 22,437 25,358 -3,360 24,270 27,631 -4,950 22,171 27,121 -4,650 23,247 27,897
North America -875 3,434 4,308 -805 3,942 4,747 -616 3,816 4,432 -1,316 3,869 5,186
Canada 646 2,053 1,406 687 2,378 1,691 783 2,289 1,506 825 2,333 1,508
Mexico -1,521 1,381 2,902 -1,492 1,564 3,056 -1,398 1,528 2,926 -2,141 1,536 3,677
European Union 694 6,133 5,438 566 6,409 5,843 240 5,585 5,345 374 5,983 5,610
France 242 1,107 865 -102 1,070 1,173 -214 987 1,201 -167 778 945
Germany 79 1,209 1,130 539 1,622 1,083 236 1,156 919 517 1,467 951
Ireland -1,262 309 1,570 -969 168 1,137 -986 148 1,134 -1,216 184 1,400
Italy -14 201 215 -17 234 251 23 223 201 6 171 165
United Kingdom 553 1,270 716 350 1,225 874 128 969 841 -222 916 1,138
Other EU 1,087 2,021 934 756 2,073 1,318 1,045 2,087 1,042 1,443 2,445 1,003
Pacific Rim Countries -5,308 8,679 13,987 -5,043 10,292 15,335 -8,185 7,481 15,666 -6,423 8,894 15,317
China -4,648 1,746 6,394 -5,295 2,362 7,658 -6,219 1,359 7,579 -5,249 1,915 7,164
Japan -568 1,584 2,152 -347 1,993 2,340 -1,038 1,459 2,498 -932 1,487 2,419
Australia 302 412 109 329 392 63 206 285 79 346 422 76
Indonesia 13 98 85 43 116 73 23 99 76 -3 106 109
Malaysia -1,116 592 1,707 -1,125 567 1,692 -1,300 507 1,807 -1,386 542 1,928
Philippines 125 406 281 81 384 302 62 346 284 60 373 313
Newly Industrialized Countries (NICS) 409 3,648 3,240 1,230 4,423 3,192 43 3,376 3,333 626 3,919 3,293
Hong Kong 515 581 66 589 653 63 493 562 69 505 577 72
Korea -69 1,035 1,105 149 1,328 1,179 -393 894 1,288 50 1,214 1,164
Singapore 8 904 896 446 1,221 776 -41 774 815 -22 852 874
Taiwan -45 1,128 1,173 46 1,221 1,175 -15 1,146 1,161 93 1,276 1,183
Other Pacific Rim 174 193 19 42 56 14 38 49 11 116 131 15
South/Central America 1,503 1,768 264 1,283 1,623 341 1,436 1,682 246 1,595 1,857 261
Brazil 537 645 108 468 649 182 655 763 107 735 846 111
Other S/C America 966 1,122 156 815 974 159 780 919 139 860 1,011 150
Other Countries 1,070 2,439 1,369 646 2,018 1,373 2,181 3,620 1,439 1,133 2,663 1,531
India 804 865 61 246 302 56 1,422 1,471 50 618 673 55
Israel 47 302 255 -100 213 313 294 585 291 143 427 285
Thailand -441 238 679 -416 241 657 -376 248 625 -385 267 652Other 660 1,034 374 916 1,262 346 841 1,315 474 757 1,296 538
NOTE: Data not available on a Balance of Payments basis. For information on data sources, nonsampling errors and definitions, see the information section on page 27 of the FT-900 release, or at www.census.gov/ft900 or www.bea.gov/newsreleases/international/trade/tradnewsrelease.htm.
Technology Group
Selected Countries and Areas
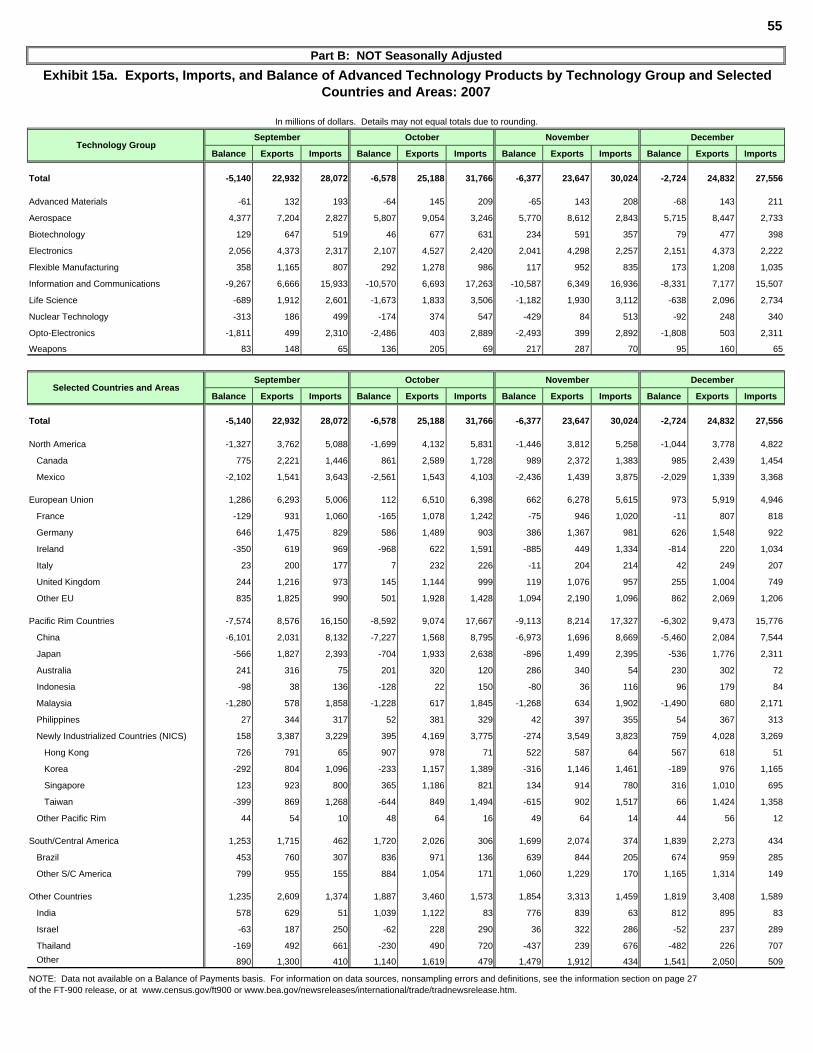
55
Part B: NOT Seasonally AdjustedExhibit 15a. Exports, Imports, and Balance of Advanced Technology Products by Technology Group and Selected
Countries and Areas: 2007
In millions of dollars. Details may not equal totals due to rounding.
September October November December
Balance Exports Imports Balance Exports Imports Balance Exports Imports Balance Exports Imports
Total -5,140 22,932 28,072 -6,578 25,188 31,766 -6,377 23,647 30,024 -2,724 24,832 27,556
Advanced Materials -61 132 193 -64 145 209 -65 143 208 -68 143 211
Aerospace 4,377 7,204 2,827 5,807 9,054 3,246 5,770 8,612 2,843 5,715 8,447 2,733
Biotechnology 129 647 519 46 677 631 234 591 357 79 477 398
Electronics 2,056 4,373 2,317 2,107 4,527 2,420 2,041 4,298 2,257 2,151 4,373 2,222
Flexible Manufacturing 358 1,165 807 292 1,278 986 117 952 835 173 1,208 1,035
Information and Communications -9,267 6,666 15,933 -10,570 6,693 17,263 -10,587 6,349 16,936 -8,331 7,177 15,507
Life Science -689 1,912 2,601 -1,673 1,833 3,506 -1,182 1,930 3,112 -638 2,096 2,734
Nuclear Technology -313 186 499 -174 374 547 -429 84 513 -92 248 340
Opto-Electronics -1,811 499 2,310 -2,486 403 2,889 -2,493 399 2,892 -1,808 503 2,311
Weapons 83 148 65 136 205 69 217 287 70 95 160 65
September October November December
Balance Exports Imports Balance Exports Imports Balance Exports Imports Balance Exports Imports
Total -5,140 22,932 28,072 -6,578 25,188 31,766 -6,377 23,647 30,024 -2,724 24,832 27,556
North America -1,327 3,762 5,088 -1,699 4,132 5,831 -1,446 3,812 5,258 -1,044 3,778 4,822
Canada 775 2,221 1,446 861 2,589 1,728 989 2,372 1,383 985 2,439 1,454
Mexico -2,102 1,541 3,643 -2,561 1,543 4,103 -2,436 1,439 3,875 -2,029 1,339 3,368
European Union 1,286 6,293 5,006 112 6,510 6,398 662 6,278 5,615 973 5,919 4,946
France -129 931 1,060 -165 1,078 1,242 -75 946 1,020 -11 807 818
Germany 646 1,475 829 586 1,489 903 386 1,367 981 626 1,548 922
Ireland -350 619 969 -968 622 1,591 -885 449 1,334 -814 220 1,034
Italy 23 200 177 7 232 226 -11 204 214 42 249 207
United Kingdom 244 1,216 973 145 1,144 999 119 1,076 957 255 1,004 749
Other EU 835 1,825 990 501 1,928 1,428 1,094 2,190 1,096 862 2,069 1,206
Pacific Rim Countries -7,574 8,576 16,150 -8,592 9,074 17,667 -9,113 8,214 17,327 -6,302 9,473 15,776
China -6,101 2,031 8,132 -7,227 1,568 8,795 -6,973 1,696 8,669 -5,460 2,084 7,544
Japan -566 1,827 2,393 -704 1,933 2,638 -896 1,499 2,395 -536 1,776 2,311
Australia 241 316 75 201 320 120 286 340 54 230 302 72
Indonesia -98 38 136 -128 22 150 -80 36 116 96 179 84
Malaysia -1,280 578 1,858 -1,228 617 1,845 -1,268 634 1,902 -1,490 680 2,171
Philippines 27 344 317 52 381 329 42 397 355 54 367 313
Newly Industrialized Countries (NICS) 158 3,387 3,229 395 4,169 3,775 -274 3,549 3,823 759 4,028 3,269
Hong Kong 726 791 65 907 978 71 522 587 64 567 618 51
Korea -292 804 1,096 -233 1,157 1,389 -316 1,146 1,461 -189 976 1,165
Singapore 123 923 800 365 1,186 821 134 914 780 316 1,010 695
Taiwan -399 869 1,268 -644 849 1,494 -615 902 1,517 66 1,424 1,358
Other Pacific Rim 44 54 10 48 64 16 49 64 14 44 56 12
South/Central America 1,253 1,715 462 1,720 2,026 306 1,699 2,074 374 1,839 2,273 434
Brazil 453 760 307 836 971 136 639 844 205 674 959 285
Other S/C America 799 955 155 884 1,054 171 1,060 1,229 170 1,165 1,314 149
Other Countries 1,235 2,609 1,374 1,887 3,460 1,573 1,854 3,313 1,459 1,819 3,408 1,589
India 578 629 51 1,039 1,122 83 776 839 63 812 895 83
Israel -63 187 250 -62 228 290 36 322 286 -52 237 289
Thailand -169 492 661 -230 490 720 -437 239 676 -482 226 707Other 890 1,300 410 1,140 1,619 479 1,479 1,912 434 1,541 2,050 509
NOTE: Data not available on a Balance of Payments basis. For information on data sources, nonsampling errors and definitions, see the information section on page 27 of the FT-900 release, or at www.census.gov/ft900 or www.bea.gov/newsreleases/international/trade/tradnewsrelease.htm.
Technology Group
Selected Countries and Areas
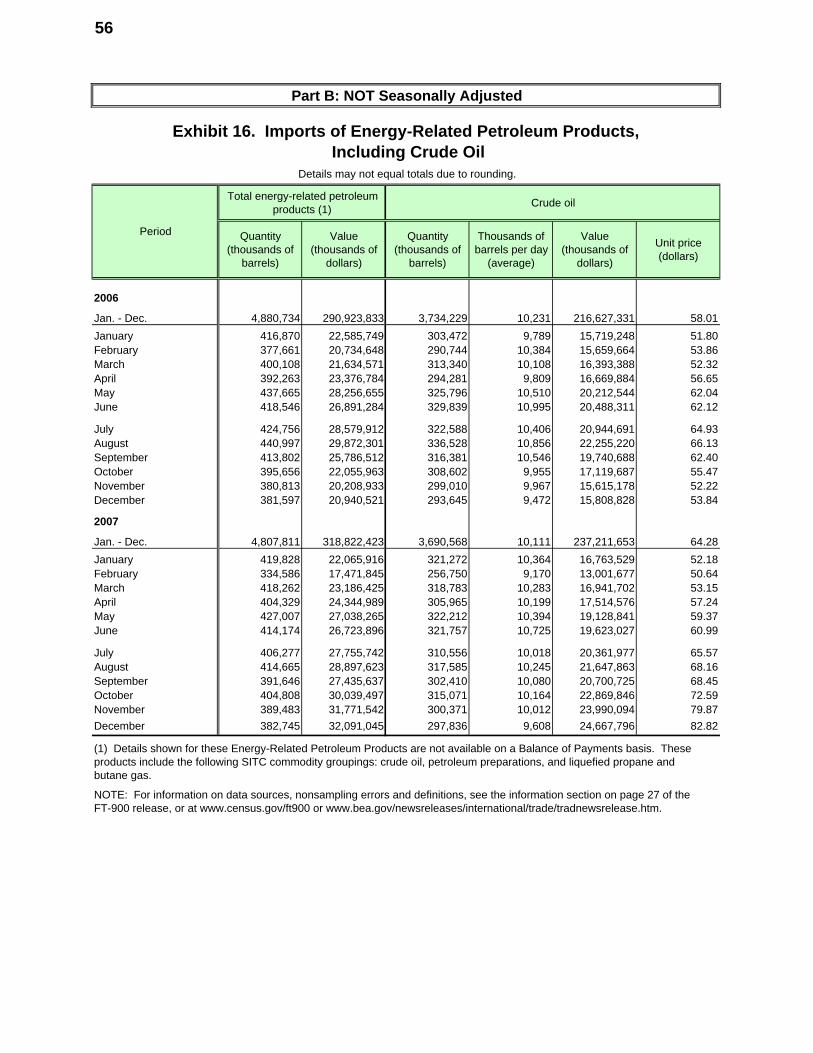
56
Part B: NOT Seasonally Adjusted
Exhibit 16. Imports of Energy-Related Petroleum Products,Including Crude Oil
Details may not equal totals due to rounding.
Total energy-related petroleum products (1) Crude oil
Quantity (thousands of
barrels)
Value (thousands of
dollars)
Quantity (thousands of
barrels)
Thousands of barrels per day
(average)
Value (thousands of
dollars)
Unit price (dollars)
2006
Jan. - Dec. 4,880,734 290,923,833 3,734,229 10,231 216,627,331 58.01January 416,870 22,585,749 303,472 9,789 15,719,248 51.80February 377,661 20,734,648 290,744 10,384 15,659,664 53.86March 400,108 21,634,571 313,340 10,108 16,393,388 52.32April 392,263 23,376,784 294,281 9,809 16,669,884 56.65May 437,665 28,256,655 325,796 10,510 20,212,544 62.04June 418,546 26,891,284 329,839 10,995 20,488,311 62.12
July 424,756 28,579,912 322,588 10,406 20,944,691 64.93August 440,997 29,872,301 336,528 10,856 22,255,220 66.13September 413,802 25,786,512 316,381 10,546 19,740,688 62.40October 395,656 22,055,963 308,602 9,955 17,119,687 55.47November 380,813 20,208,933 299,010 9,967 15,615,178 52.22December 381,597 20,940,521 293,645 9,472 15,808,828 53.84
2007
Jan. - Dec. 4,807,811 318,822,423 3,690,568 10,111 237,211,653 64.28January 419,828 22,065,916 321,272 10,364 16,763,529 52.18February 334,586 17,471,845 256,750 9,170 13,001,677 50.64March 418,262 23,186,425 318,783 10,283 16,941,702 53.15April 404,329 24,344,989 305,965 10,199 17,514,576 57.24May 427,007 27,038,265 322,212 10,394 19,128,841 59.37June 414,174 26,723,896 321,757 10,725 19,623,027 60.99
July 406,277 27,755,742 310,556 10,018 20,361,977 65.57August 414,665 28,897,623 317,585 10,245 21,647,863 68.16September 391,646 27,435,637 302,410 10,080 20,700,725 68.45October 404,808 30,039,497 315,071 10,164 22,869,846 72.59November 389,483 31,771,542 300,371 10,012 23,990,094 79.87December 382,745 32,091,045 297,836 9,608 24,667,796 82.82
(1) Details shown for these Energy-Related Petroleum Products are not available on a Balance of Payments basis. These products include the following SITC commodity groupings: crude oil, petroleum preparations, and liquefied propane and butane gas.
NOTE: For information on data sources, nonsampling errors and definitions, see the information section on page 27 of theFT-900 release, or at www.census.gov/ft900 or www.bea.gov/newsreleases/international/trade/tradnewsrelease.htm.
Period
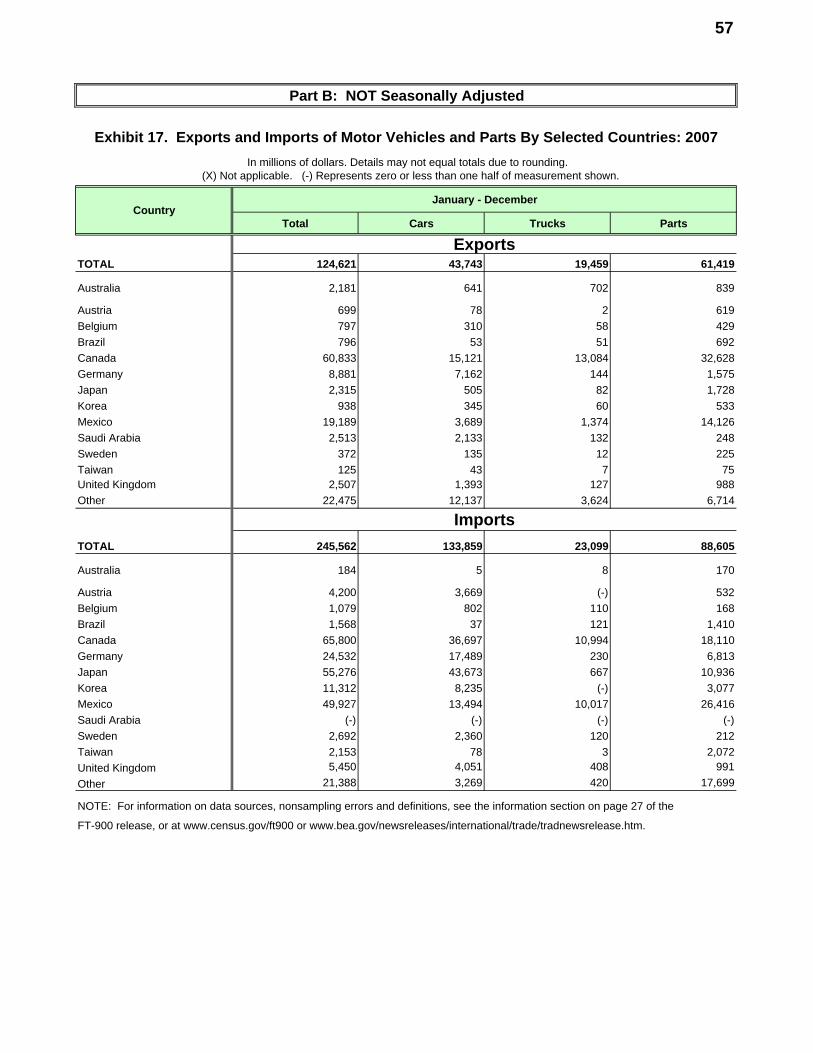
57
Part B: NOT Seasonally Adjusted
Exhibit 17. Exports and Imports of Motor Vehicles and Parts By Selected Countries: 2007In millions of dollars. Details may not equal totals due to rounding.
(X) Not applicable. (-) Represents zero or less than one half of measurement shown.
January - December
Total Cars Trucks Parts
TOTAL 124,621 43,743 19,459 61,419
Australia 2,181 641 702 839
Austria 699 78 2 619Belgium 797 310 58 429Brazil 796 53 51 692Canada 60,833 15,121 13,084 32,628Germany 8,881 7,162 144 1,575Japan 2,315 505 82 1,728Korea 938 345 60 533Mexico 19,189 3,689 1,374 14,126Saudi Arabia 2,513 2,133 132 248Sweden 372 135 12 225Taiwan 125 43 7 75United Kingdom 2,507 1,393 127 988Other 22,475 12,137 3,624 6,714
ImportsTOTAL 245,562 133,859 23,099 88,605
Australia 184 5 8 170
Austria 4,200 3,669 (-) 532Belgium 1,079 802 110 168Brazil 1,568 37 121 1,410Canada 65,800 36,697 10,994 18,110Germany 24,532 17,489 230 6,813Japan 55,276 43,673 667 10,936Korea 11,312 8,235 (-) 3,077Mexico 49,927 13,494 10,017 26,416Saudi Arabia (-) (-) (-) (-)Sweden 2,692 2,360 120 212Taiwan 2,153 78 3 2,072United Kingdom 5,450 4,051 408 991Other 21,388 3,269 420 17,699
NOTE: For information on data sources, nonsampling errors and definitions, see the information section on page 27 of the
FT-900 release, or at www.census.gov/ft900 or www.bea.gov/newsreleases/international/trade/tradnewsrelease.htm.
Country
Exports
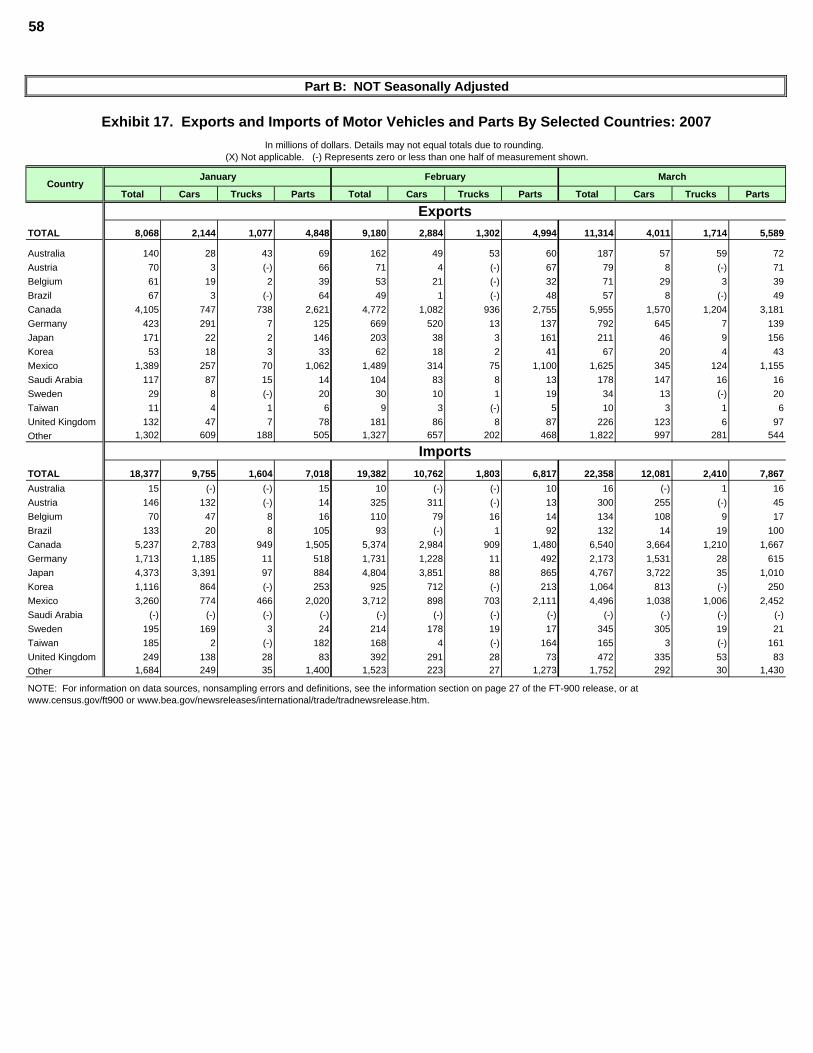
58
Part B: NOT Seasonally Adjusted
Exhibit 17. Exports and Imports of Motor Vehicles and Parts By Selected Countries: 2007In millions of dollars. Details may not equal totals due to rounding.
(X) Not applicable. (-) Represents zero or less than one half of measurement shown.
January February March
Total Cars Trucks Parts Total Cars Trucks Parts Total Cars Trucks Parts
ExportsTOTAL 8,068 2,144 1,077 4,848 9,180 2,884 1,302 4,994 11,314 4,011 1,714 5,589
Australia 140 28 43 69 162 49 53 60 187 57 59 72Austria 70 3 (-) 66 71 4 (-) 67 79 8 (-) 71Belgium 61 19 2 39 53 21 (-) 32 71 29 3 39Brazil 67 3 (-) 64 49 1 (-) 48 57 8 (-) 49Canada 4,105 747 738 2,621 4,772 1,082 936 2,755 5,955 1,570 1,204 3,181Germany 423 291 7 125 669 520 13 137 792 645 7 139Japan 171 22 2 146 203 38 3 161 211 46 9 156Korea 53 18 3 33 62 18 2 41 67 20 4 43Mexico 1,389 257 70 1,062 1,489 314 75 1,100 1,625 345 124 1,155Saudi Arabia 117 87 15 14 104 83 8 13 178 147 16 16Sweden 29 8 (-) 20 30 10 1 19 34 13 (-) 20Taiwan 11 4 1 6 9 3 (-) 5 10 3 1 6United Kingdom 132 47 7 78 181 86 8 87 226 123 6 97Other 1,302 609 188 505 1,327 657 202 468 1,822 997 281 544
ImportsTOTAL 18,377 9,755 1,604 7,018 19,382 10,762 1,803 6,817 22,358 12,081 2,410 7,867Australia 15 (-) (-) 15 10 (-) (-) 10 16 (-) 1 16Austria 146 132 (-) 14 325 311 (-) 13 300 255 (-) 45Belgium 70 47 8 16 110 79 16 14 134 108 9 17Brazil 133 20 8 105 93 (-) 1 92 132 14 19 100Canada 5,237 2,783 949 1,505 5,374 2,984 909 1,480 6,540 3,664 1,210 1,667Germany 1,713 1,185 11 518 1,731 1,228 11 492 2,173 1,531 28 615Japan 4,373 3,391 97 884 4,804 3,851 88 865 4,767 3,722 35 1,010Korea 1,116 864 (-) 253 925 712 (-) 213 1,064 813 (-) 250Mexico 3,260 774 466 2,020 3,712 898 703 2,111 4,496 1,038 1,006 2,452Saudi Arabia (-) (-) (-) (-) (-) (-) (-) (-) (-) (-) (-) (-)Sweden 195 169 3 24 214 178 19 17 345 305 19 21Taiwan 185 2 (-) 182 168 4 (-) 164 165 3 (-) 161United Kingdom 249 138 28 83 392 291 28 73 472 335 53 83Other 1,684 249 35 1,400 1,523 223 27 1,273 1,752 292 30 1,430
NOTE: For information on data sources, nonsampling errors and definitions, see the information section on page 27 of the FT-900 release, or at www.census.gov/ft900 or www.bea.gov/newsreleases/international/trade/tradnewsrelease.htm.
Country
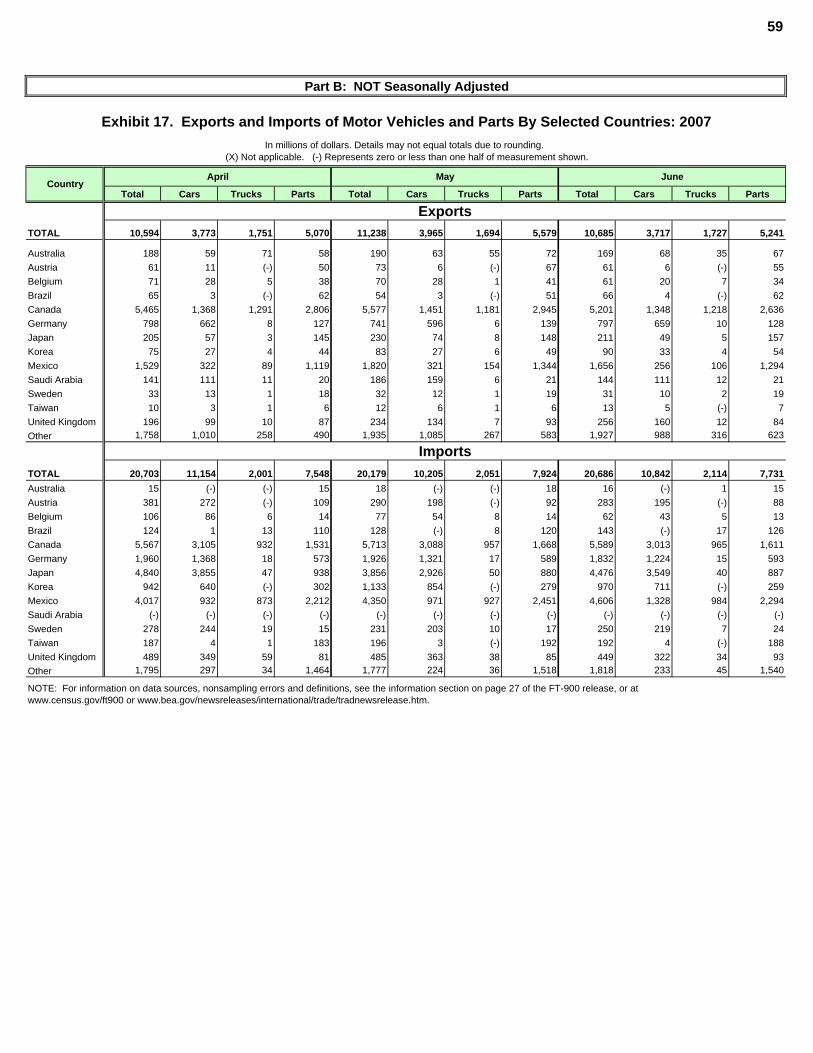
59
Part B: NOT Seasonally Adjusted
Exhibit 17. Exports and Imports of Motor Vehicles and Parts By Selected Countries: 2007In millions of dollars. Details may not equal totals due to rounding.
(X) Not applicable. (-) Represents zero or less than one half of measurement shown.
April May June
Total Cars Trucks Parts Total Cars Trucks Parts Total Cars Trucks Parts
ExportsTOTAL 10,594 3,773 1,751 5,070 11,238 3,965 1,694 5,579 10,685 3,717 1,727 5,241
Australia 188 59 71 58 190 63 55 72 169 68 35 67Austria 61 11 (-) 50 73 6 (-) 67 61 6 (-) 55Belgium 71 28 5 38 70 28 1 41 61 20 7 34Brazil 65 3 (-) 62 54 3 (-) 51 66 4 (-) 62Canada 5,465 1,368 1,291 2,806 5,577 1,451 1,181 2,945 5,201 1,348 1,218 2,636Germany 798 662 8 127 741 596 6 139 797 659 10 128Japan 205 57 3 145 230 74 8 148 211 49 5 157Korea 75 27 4 44 83 27 6 49 90 33 4 54Mexico 1,529 322 89 1,119 1,820 321 154 1,344 1,656 256 106 1,294Saudi Arabia 141 111 11 20 186 159 6 21 144 111 12 21Sweden 33 13 1 18 32 12 1 19 31 10 2 19Taiwan 10 3 1 6 12 6 1 6 13 5 (-) 7United Kingdom 196 99 10 87 234 134 7 93 256 160 12 84Other 1,758 1,010 258 490 1,935 1,085 267 583 1,927 988 316 623
ImportsTOTAL 20,703 11,154 2,001 7,548 20,179 10,205 2,051 7,924 20,686 10,842 2,114 7,731Australia 15 (-) (-) 15 18 (-) (-) 18 16 (-) 1 15Austria 381 272 (-) 109 290 198 (-) 92 283 195 (-) 88Belgium 106 86 6 14 77 54 8 14 62 43 5 13Brazil 124 1 13 110 128 (-) 8 120 143 (-) 17 126Canada 5,567 3,105 932 1,531 5,713 3,088 957 1,668 5,589 3,013 965 1,611Germany 1,960 1,368 18 573 1,926 1,321 17 589 1,832 1,224 15 593Japan 4,840 3,855 47 938 3,856 2,926 50 880 4,476 3,549 40 887Korea 942 640 (-) 302 1,133 854 (-) 279 970 711 (-) 259Mexico 4,017 932 873 2,212 4,350 971 927 2,451 4,606 1,328 984 2,294Saudi Arabia (-) (-) (-) (-) (-) (-) (-) (-) (-) (-) (-) (-)Sweden 278 244 19 15 231 203 10 17 250 219 7 24Taiwan 187 4 1 183 196 3 (-) 192 192 4 (-) 188United Kingdom 489 349 59 81 485 363 38 85 449 322 34 93Other 1,795 297 34 1,464 1,777 224 36 1,518 1,818 233 45 1,540
NOTE: For information on data sources, nonsampling errors and definitions, see the information section on page 27 of the FT-900 release, or at www.census.gov/ft900 or www.bea.gov/newsreleases/international/trade/tradnewsrelease.htm.
Country
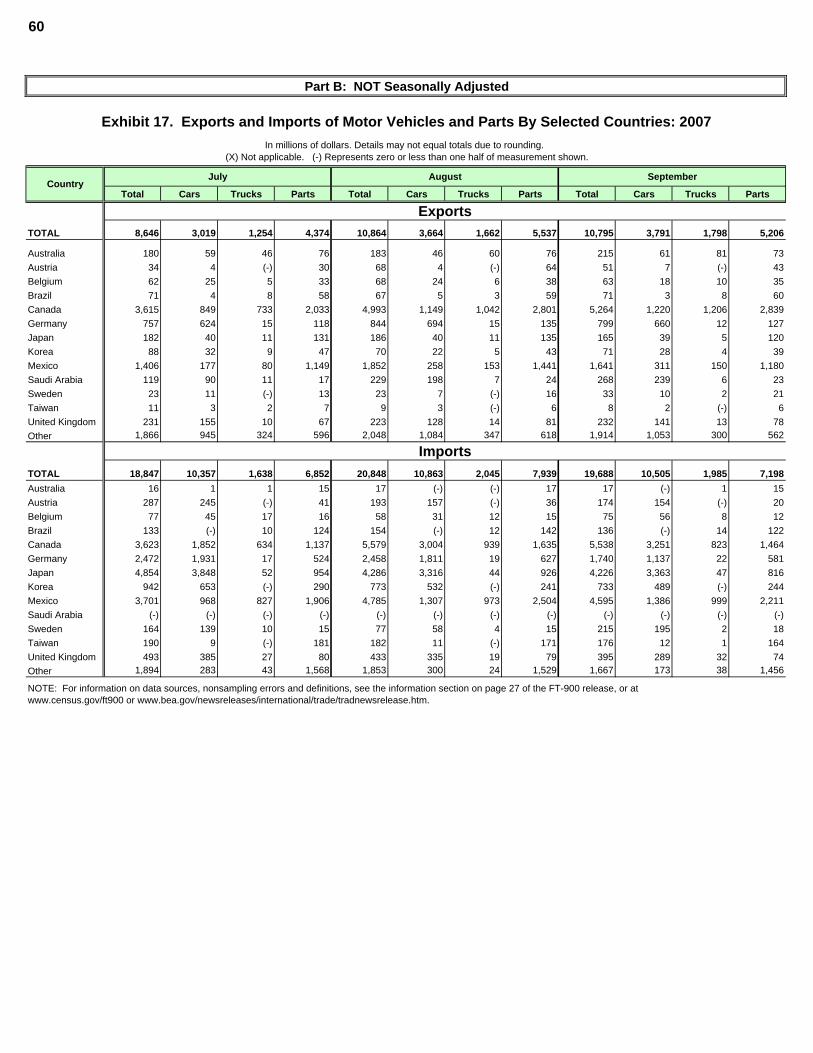
60
Part B: NOT Seasonally Adjusted
Exhibit 17. Exports and Imports of Motor Vehicles and Parts By Selected Countries: 2007In millions of dollars. Details may not equal totals due to rounding.
(X) Not applicable. (-) Represents zero or less than one half of measurement shown.
July August September
Total Cars Trucks Parts Total Cars Trucks Parts Total Cars Trucks Parts
ExportsTOTAL 8,646 3,019 1,254 4,374 10,864 3,664 1,662 5,537 10,795 3,791 1,798 5,206
Australia 180 59 46 76 183 46 60 76 215 61 81 73Austria 34 4 (-) 30 68 4 (-) 64 51 7 (-) 43Belgium 62 25 5 33 68 24 6 38 63 18 10 35Brazil 71 4 8 58 67 5 3 59 71 3 8 60Canada 3,615 849 733 2,033 4,993 1,149 1,042 2,801 5,264 1,220 1,206 2,839Germany 757 624 15 118 844 694 15 135 799 660 12 127Japan 182 40 11 131 186 40 11 135 165 39 5 120Korea 88 32 9 47 70 22 5 43 71 28 4 39Mexico 1,406 177 80 1,149 1,852 258 153 1,441 1,641 311 150 1,180Saudi Arabia 119 90 11 17 229 198 7 24 268 239 6 23Sweden 23 11 (-) 13 23 7 (-) 16 33 10 2 21Taiwan 11 3 2 7 9 3 (-) 6 8 2 (-) 6United Kingdom 231 155 10 67 223 128 14 81 232 141 13 78Other 1,866 945 324 596 2,048 1,084 347 618 1,914 1,053 300 562
ImportsTOTAL 18,847 10,357 1,638 6,852 20,848 10,863 2,045 7,939 19,688 10,505 1,985 7,198Australia 16 1 1 15 17 (-) (-) 17 17 (-) 1 15Austria 287 245 (-) 41 193 157 (-) 36 174 154 (-) 20Belgium 77 45 17 16 58 31 12 15 75 56 8 12Brazil 133 (-) 10 124 154 (-) 12 142 136 (-) 14 122Canada 3,623 1,852 634 1,137 5,579 3,004 939 1,635 5,538 3,251 823 1,464Germany 2,472 1,931 17 524 2,458 1,811 19 627 1,740 1,137 22 581Japan 4,854 3,848 52 954 4,286 3,316 44 926 4,226 3,363 47 816Korea 942 653 (-) 290 773 532 (-) 241 733 489 (-) 244Mexico 3,701 968 827 1,906 4,785 1,307 973 2,504 4,595 1,386 999 2,211Saudi Arabia (-) (-) (-) (-) (-) (-) (-) (-) (-) (-) (-) (-)Sweden 164 139 10 15 77 58 4 15 215 195 2 18Taiwan 190 9 (-) 181 182 11 (-) 171 176 12 1 164United Kingdom 493 385 27 80 433 335 19 79 395 289 32 74Other 1,894 283 43 1,568 1,853 300 24 1,529 1,667 173 38 1,456
NOTE: For information on data sources, nonsampling errors and definitions, see the information section on page 27 of the FT-900 release, or at www.census.gov/ft900 or www.bea.gov/newsreleases/international/trade/tradnewsrelease.htm.
Country
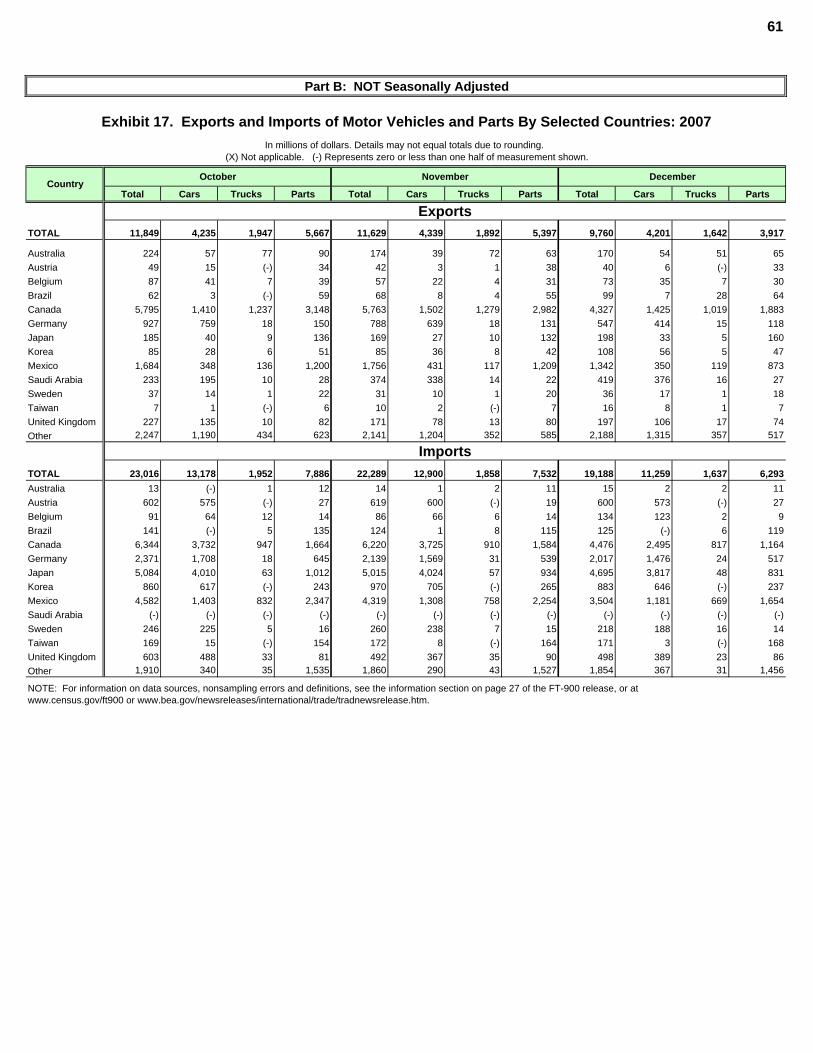
61
Part B: NOT Seasonally Adjusted
Exhibit 17. Exports and Imports of Motor Vehicles and Parts By Selected Countries: 2007In millions of dollars. Details may not equal totals due to rounding.
(X) Not applicable. (-) Represents zero or less than one half of measurement shown.
October November December
Total Cars Trucks Parts Total Cars Trucks Parts Total Cars Trucks Parts
ExportsTOTAL 11,849 4,235 1,947 5,667 11,629 4,339 1,892 5,397 9,760 4,201 1,642 3,917
Australia 224 57 77 90 174 39 72 63 170 54 51 65Austria 49 15 (-) 34 42 3 1 38 40 6 (-) 33Belgium 87 41 7 39 57 22 4 31 73 35 7 30Brazil 62 3 (-) 59 68 8 4 55 99 7 28 64Canada 5,795 1,410 1,237 3,148 5,763 1,502 1,279 2,982 4,327 1,425 1,019 1,883Germany 927 759 18 150 788 639 18 131 547 414 15 118Japan 185 40 9 136 169 27 10 132 198 33 5 160Korea 85 28 6 51 85 36 8 42 108 56 5 47Mexico 1,684 348 136 1,200 1,756 431 117 1,209 1,342 350 119 873Saudi Arabia 233 195 10 28 374 338 14 22 419 376 16 27Sweden 37 14 1 22 31 10 1 20 36 17 1 18Taiwan 7 1 (-) 6 10 2 (-) 7 16 8 1 7United Kingdom 227 135 10 82 171 78 13 80 197 106 17 74Other 2,247 1,190 434 623 2,141 1,204 352 585 2,188 1,315 357 517
ImportsTOTAL 23,016 13,178 1,952 7,886 22,289 12,900 1,858 7,532 19,188 11,259 1,637 6,293Australia 13 (-) 1 12 14 1 2 11 15 2 2 11Austria 602 575 (-) 27 619 600 (-) 19 600 573 (-) 27Belgium 91 64 12 14 86 66 6 14 134 123 2 9Brazil 141 (-) 5 135 124 1 8 115 125 (-) 6 119Canada 6,344 3,732 947 1,664 6,220 3,725 910 1,584 4,476 2,495 817 1,164Germany 2,371 1,708 18 645 2,139 1,569 31 539 2,017 1,476 24 517Japan 5,084 4,010 63 1,012 5,015 4,024 57 934 4,695 3,817 48 831Korea 860 617 (-) 243 970 705 (-) 265 883 646 (-) 237Mexico 4,582 1,403 832 2,347 4,319 1,308 758 2,254 3,504 1,181 669 1,654Saudi Arabia (-) (-) (-) (-) (-) (-) (-) (-) (-) (-) (-) (-)Sweden 246 225 5 16 260 238 7 15 218 188 16 14Taiwan 169 15 (-) 154 172 8 (-) 164 171 3 (-) 168United Kingdom 603 488 33 81 492 367 35 90 498 389 23 86Other 1,910 340 35 1,535 1,860 290 43 1,527 1,854 367 31 1,456
NOTE: For information on data sources, nonsampling errors and definitions, see the information section on page 27 of the FT-900 release, or at www.census.gov/ft900 or www.bea.gov/newsreleases/international/trade/tradnewsrelease.htm.
Country
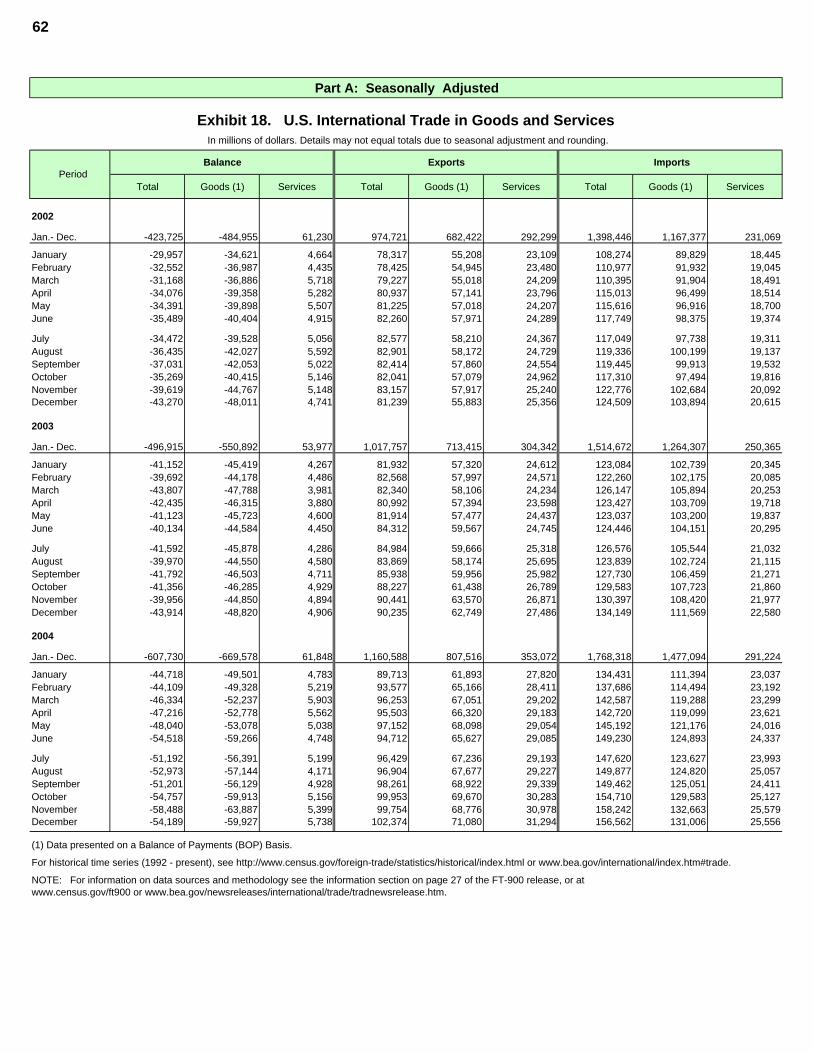
62
Part A: Seasonally Adjusted
Exhibit 18. U.S. International Trade in Goods and ServicesIn millions of dollars. Details may not equal totals due to seasonal adjustment and rounding.
Balance Exports Imports
Total Goods (1) Services Total Goods (1) Services Total Goods (1) Services
2002
Jan.- Dec. -423,725 -484,955 61,230 974,721 682,422 292,299 1,398,446 1,167,377 231,069
January -29,957 -34,621 4,664 78,317 55,208 23,109 108,274 89,829 18,445February -32,552 -36,987 4,435 78,425 54,945 23,480 110,977 91,932 19,045March -31,168 -36,886 5,718 79,227 55,018 24,209 110,395 91,904 18,491April -34,076 -39,358 5,282 80,937 57,141 23,796 115,013 96,499 18,514May -34,391 -39,898 5,507 81,225 57,018 24,207 115,616 96,916 18,700June -35,489 -40,404 4,915 82,260 57,971 24,289 117,749 98,375 19,374
July -34,472 -39,528 5,056 82,577 58,210 24,367 117,049 97,738 19,311August -36,435 -42,027 5,592 82,901 58,172 24,729 119,336 100,199 19,137September -37,031 -42,053 5,022 82,414 57,860 24,554 119,445 99,913 19,532October -35,269 -40,415 5,146 82,041 57,079 24,962 117,310 97,494 19,816November -39,619 -44,767 5,148 83,157 57,917 25,240 122,776 102,684 20,092December -43,270 -48,011 4,741 81,239 55,883 25,356 124,509 103,894 20,615
2003
Jan.- Dec. -496,915 -550,892 53,977 1,017,757 713,415 304,342 1,514,672 1,264,307 250,365
January -41,152 -45,419 4,267 81,932 57,320 24,612 123,084 102,739 20,345February -39,692 -44,178 4,486 82,568 57,997 24,571 122,260 102,175 20,085March -43,807 -47,788 3,981 82,340 58,106 24,234 126,147 105,894 20,253April -42,435 -46,315 3,880 80,992 57,394 23,598 123,427 103,709 19,718May -41,123 -45,723 4,600 81,914 57,477 24,437 123,037 103,200 19,837June -40,134 -44,584 4,450 84,312 59,567 24,745 124,446 104,151 20,295
July -41,592 -45,878 4,286 84,984 59,666 25,318 126,576 105,544 21,032August -39,970 -44,550 4,580 83,869 58,174 25,695 123,839 102,724 21,115September -41,792 -46,503 4,711 85,938 59,956 25,982 127,730 106,459 21,271October -41,356 -46,285 4,929 88,227 61,438 26,789 129,583 107,723 21,860November -39,956 -44,850 4,894 90,441 63,570 26,871 130,397 108,420 21,977December -43,914 -48,820 4,906 90,235 62,749 27,486 134,149 111,569 22,580
2004
Jan.- Dec. -607,730 -669,578 61,848 1,160,588 807,516 353,072 1,768,318 1,477,094 291,224
January -44,718 -49,501 4,783 89,713 61,893 27,820 134,431 111,394 23,037February -44,109 -49,328 5,219 93,577 65,166 28,411 137,686 114,494 23,192March -46,334 -52,237 5,903 96,253 67,051 29,202 142,587 119,288 23,299April -47,216 -52,778 5,562 95,503 66,320 29,183 142,720 119,099 23,621May -48,040 -53,078 5,038 97,152 68,098 29,054 145,192 121,176 24,016June -54,518 -59,266 4,748 94,712 65,627 29,085 149,230 124,893 24,337
July -51,192 -56,391 5,199 96,429 67,236 29,193 147,620 123,627 23,993August -52,973 -57,144 4,171 96,904 67,677 29,227 149,877 124,820 25,057September -51,201 -56,129 4,928 98,261 68,922 29,339 149,462 125,051 24,411October -54,757 -59,913 5,156 99,953 69,670 30,283 154,710 129,583 25,127November -58,488 -63,887 5,399 99,754 68,776 30,978 158,242 132,663 25,579December -54,189 -59,927 5,738 102,374 71,080 31,294 156,562 131,006 25,556
(1) Data presented on a Balance of Payments (BOP) Basis.
For historical time series (1992 - present), see http://www.census.gov/foreign-trade/statistics/historical/index.html or www.bea.gov/international/index.htm#trade.
NOTE: For information on data sources and methodology see the information section on page 27 of the FT-900 release, or atwww.census.gov/ft900 or www.bea.gov/newsreleases/international/trade/tradnewsrelease.htm.
Period
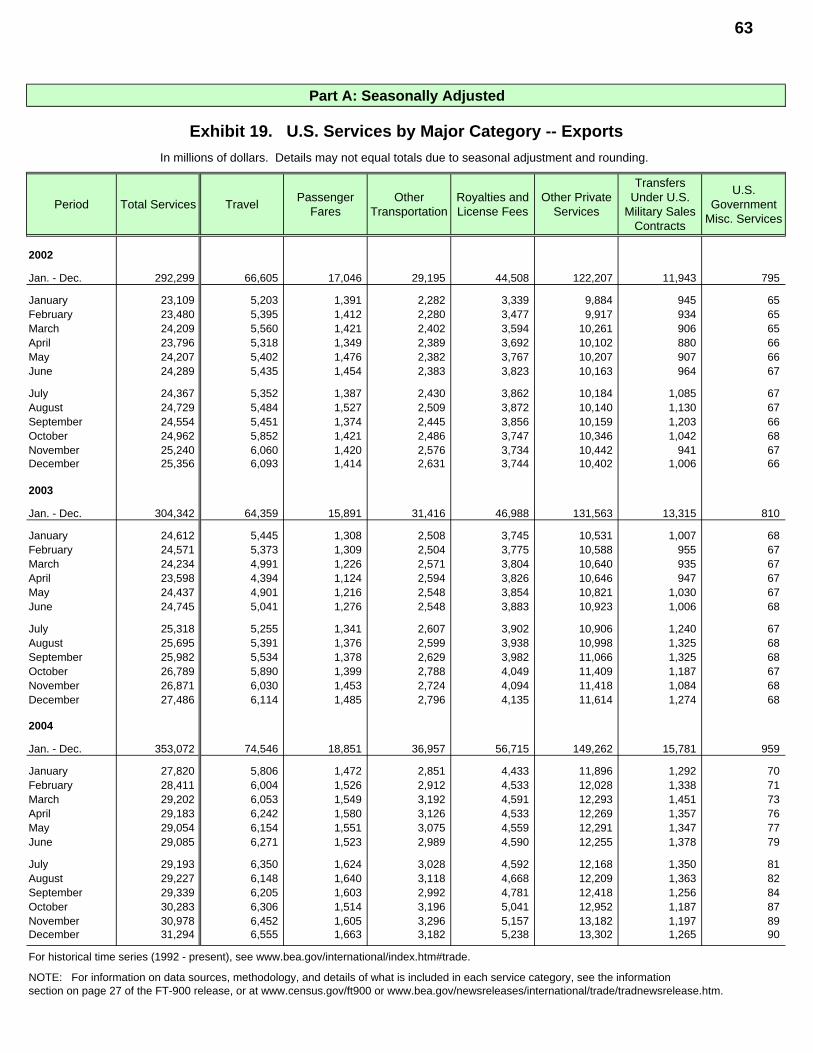
63
Part A: Seasonally Adjusted
Exhibit 19. U.S. Services by Major Category -- ExportsIn millions of dollars. Details may not equal totals due to seasonal adjustment and rounding.
Period Total Services Travel Passenger Fares
Other Transportation
Royalties and License Fees
Other Private Services
Transfers Under U.S.
Military Sales Contracts
U.S. Government
Misc. Services
2002
Jan. - Dec. 292,299 66,605 17,046 29,195 44,508 122,207 11,943 795
January 23,109 5,203 1,391 2,282 3,339 9,884 945 65February 23,480 5,395 1,412 2,280 3,477 9,917 934 65March 24,209 5,560 1,421 2,402 3,594 10,261 906 65April 23,796 5,318 1,349 2,389 3,692 10,102 880 66May 24,207 5,402 1,476 2,382 3,767 10,207 907 66June 24,289 5,435 1,454 2,383 3,823 10,163 964 67
July 24,367 5,352 1,387 2,430 3,862 10,184 1,085 67August 24,729 5,484 1,527 2,509 3,872 10,140 1,130 67September 24,554 5,451 1,374 2,445 3,856 10,159 1,203 66October 24,962 5,852 1,421 2,486 3,747 10,346 1,042 68November 25,240 6,060 1,420 2,576 3,734 10,442 941 67December 25,356 6,093 1,414 2,631 3,744 10,402 1,006 66
2003
Jan. - Dec. 304,342 64,359 15,891 31,416 46,988 131,563 13,315 810
January 24,612 5,445 1,308 2,508 3,745 10,531 1,007 68February 24,571 5,373 1,309 2,504 3,775 10,588 955 67March 24,234 4,991 1,226 2,571 3,804 10,640 935 67April 23,598 4,394 1,124 2,594 3,826 10,646 947 67May 24,437 4,901 1,216 2,548 3,854 10,821 1,030 67June 24,745 5,041 1,276 2,548 3,883 10,923 1,006 68
July 25,318 5,255 1,341 2,607 3,902 10,906 1,240 67August 25,695 5,391 1,376 2,599 3,938 10,998 1,325 68September 25,982 5,534 1,378 2,629 3,982 11,066 1,325 68October 26,789 5,890 1,399 2,788 4,049 11,409 1,187 67November 26,871 6,030 1,453 2,724 4,094 11,418 1,084 68December 27,486 6,114 1,485 2,796 4,135 11,614 1,274 68
2004
Jan. - Dec. 353,072 74,546 18,851 36,957 56,715 149,262 15,781 959
January 27,820 5,806 1,472 2,851 4,433 11,896 1,292 70February 28,411 6,004 1,526 2,912 4,533 12,028 1,338 71March 29,202 6,053 1,549 3,192 4,591 12,293 1,451 73April 29,183 6,242 1,580 3,126 4,533 12,269 1,357 76May 29,054 6,154 1,551 3,075 4,559 12,291 1,347 77June 29,085 6,271 1,523 2,989 4,590 12,255 1,378 79
July 29,193 6,350 1,624 3,028 4,592 12,168 1,350 81August 29,227 6,148 1,640 3,118 4,668 12,209 1,363 82September 29,339 6,205 1,603 2,992 4,781 12,418 1,256 84October 30,283 6,306 1,514 3,196 5,041 12,952 1,187 87November 30,978 6,452 1,605 3,296 5,157 13,182 1,197 89December 31,294 6,555 1,663 3,182 5,238 13,302 1,265 90
For historical time series (1992 - present), see www.bea.gov/international/index.htm#trade.
NOTE: For information on data sources, methodology, and details of what is included in each service category, see the informationsection on page 27 of the FT-900 release, or at www.census.gov/ft900 or www.bea.gov/newsreleases/international/trade/tradnewsrelease.htm.
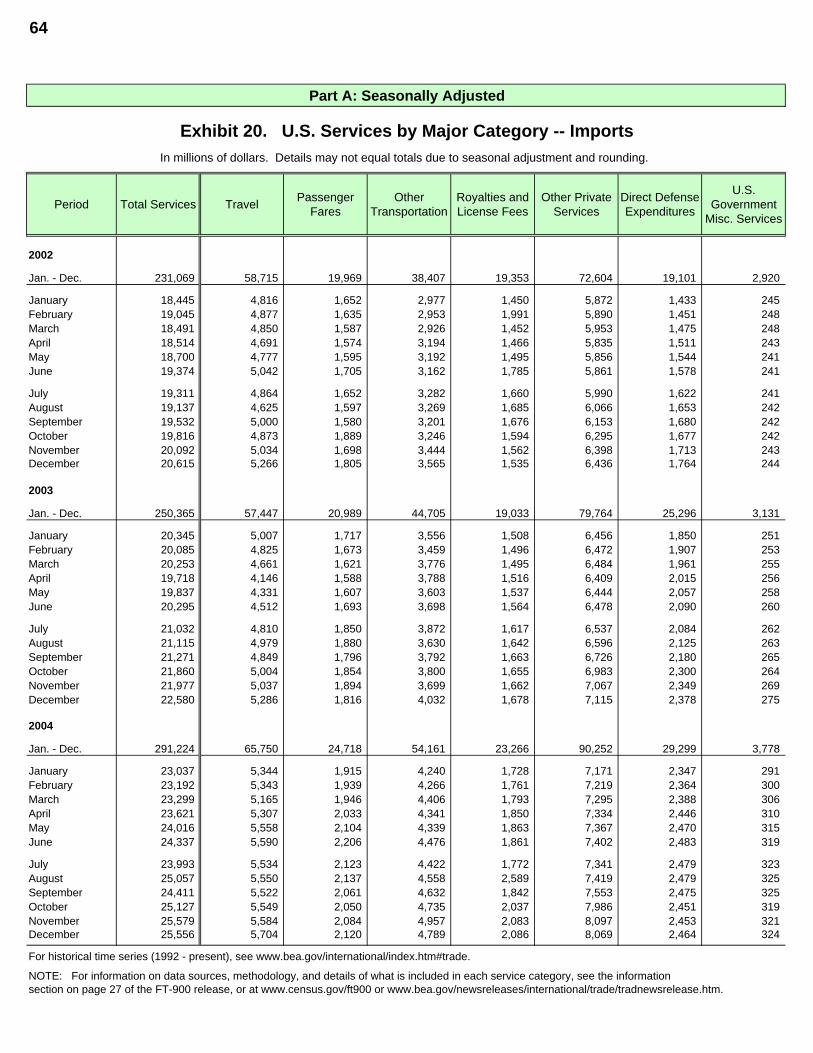
64
Part A: Seasonally Adjusted
Exhibit 20. U.S. Services by Major Category -- ImportsIn millions of dollars. Details may not equal totals due to seasonal adjustment and rounding.
Period Total Services Travel Passenger Fares
Other Transportation
Royalties and License Fees
Other Private Services
Direct Defense Expenditures
U.S. Government
Misc. Services
2002
Jan. - Dec. 231,069 58,715 19,969 38,407 19,353 72,604 19,101 2,920
January 18,445 4,816 1,652 2,977 1,450 5,872 1,433 245February 19,045 4,877 1,635 2,953 1,991 5,890 1,451 248March 18,491 4,850 1,587 2,926 1,452 5,953 1,475 248April 18,514 4,691 1,574 3,194 1,466 5,835 1,511 243May 18,700 4,777 1,595 3,192 1,495 5,856 1,544 241June 19,374 5,042 1,705 3,162 1,785 5,861 1,578 241
July 19,311 4,864 1,652 3,282 1,660 5,990 1,622 241August 19,137 4,625 1,597 3,269 1,685 6,066 1,653 242September 19,532 5,000 1,580 3,201 1,676 6,153 1,680 242October 19,816 4,873 1,889 3,246 1,594 6,295 1,677 242November 20,092 5,034 1,698 3,444 1,562 6,398 1,713 243December 20,615 5,266 1,805 3,565 1,535 6,436 1,764 244
2003
Jan. - Dec. 250,365 57,447 20,989 44,705 19,033 79,764 25,296 3,131
January 20,345 5,007 1,717 3,556 1,508 6,456 1,850 251February 20,085 4,825 1,673 3,459 1,496 6,472 1,907 253March 20,253 4,661 1,621 3,776 1,495 6,484 1,961 255April 19,718 4,146 1,588 3,788 1,516 6,409 2,015 256May 19,837 4,331 1,607 3,603 1,537 6,444 2,057 258June 20,295 4,512 1,693 3,698 1,564 6,478 2,090 260
July 21,032 4,810 1,850 3,872 1,617 6,537 2,084 262August 21,115 4,979 1,880 3,630 1,642 6,596 2,125 263September 21,271 4,849 1,796 3,792 1,663 6,726 2,180 265October 21,860 5,004 1,854 3,800 1,655 6,983 2,300 264November 21,977 5,037 1,894 3,699 1,662 7,067 2,349 269December 22,580 5,286 1,816 4,032 1,678 7,115 2,378 275
2004
Jan. - Dec. 291,224 65,750 24,718 54,161 23,266 90,252 29,299 3,778
January 23,037 5,344 1,915 4,240 1,728 7,171 2,347 291February 23,192 5,343 1,939 4,266 1,761 7,219 2,364 300March 23,299 5,165 1,946 4,406 1,793 7,295 2,388 306April 23,621 5,307 2,033 4,341 1,850 7,334 2,446 310May 24,016 5,558 2,104 4,339 1,863 7,367 2,470 315June 24,337 5,590 2,206 4,476 1,861 7,402 2,483 319
July 23,993 5,534 2,123 4,422 1,772 7,341 2,479 323August 25,057 5,550 2,137 4,558 2,589 7,419 2,479 325September 24,411 5,522 2,061 4,632 1,842 7,553 2,475 325October 25,127 5,549 2,050 4,735 2,037 7,986 2,451 319November 25,579 5,584 2,084 4,957 2,083 8,097 2,453 321December 25,556 5,704 2,120 4,789 2,086 8,069 2,464 324
For historical time series (1992 - present), see www.bea.gov/international/index.htm#trade.
NOTE: For information on data sources, methodology, and details of what is included in each service category, see the informationsection on page 27 of the FT-900 release, or at www.census.gov/ft900 or www.bea.gov/newsreleases/international/trade/tradnewsrelease.htm.